Embed Size (px)
Citation preview

Research & Market Intell igence
DEALER SENTIMENT INDEXSECOND QUARTER 2021
Research & Market Intell igence
Dealer Sentiment IndexS E C O N D Q U A R T E R 2 0 2 1A U n i q u e M a r k e t D r i v e s O p t i m i s m
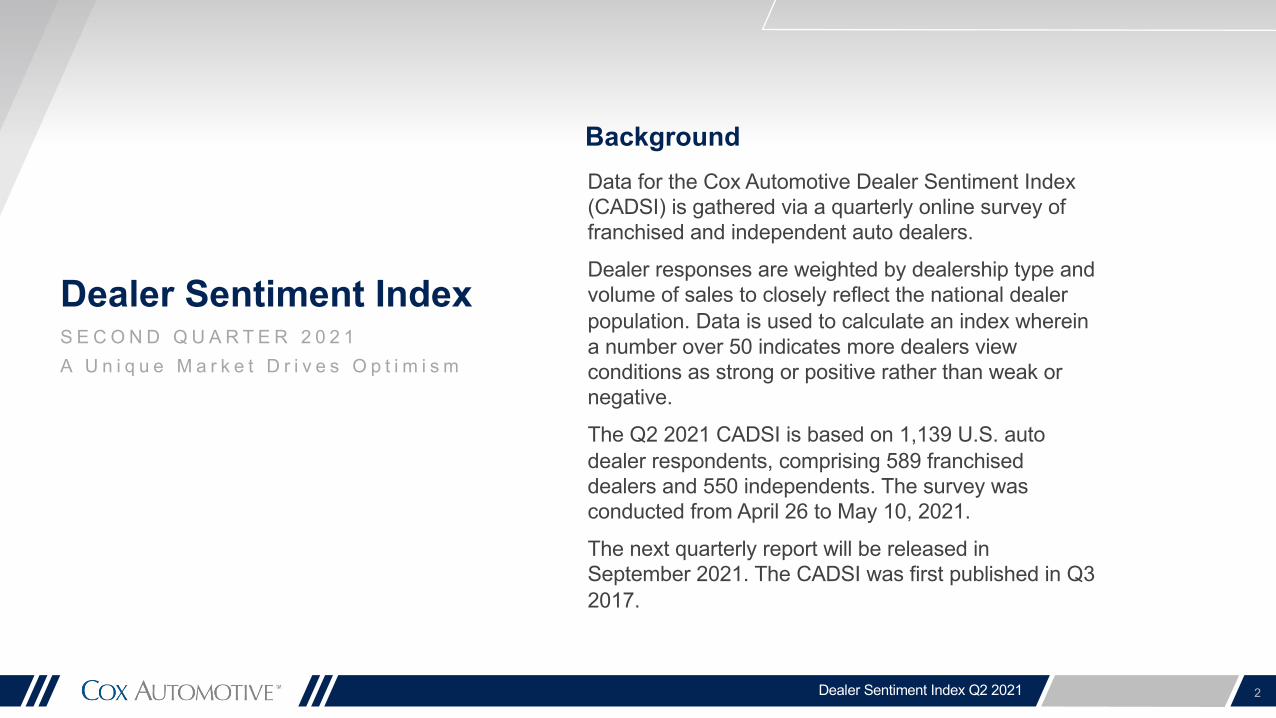
BackgroundData for the Cox Automotive Dealer Sentiment Index (CADSI) is gathered via a quarterly online survey of franchised and independent auto dealers.
Dealer responses are weighted by dealership type and volume of sales to closely reflect the national dealer population. Data is used to calculate an index wherein a number over 50 indicates more dealers view conditions as strong or positive rather than weak or negative.
The Q2 2021 CADSI is based on 1,139 U.S. auto dealer respondents, comprising 589 franchised dealers and 550 independents. The survey was conducted from April 26 to May 10, 2021.
The next quarterly report will be released in September 2021. The CADSI was first published in Q3 2017.
2Dealer Sentiment Index Q2 2021

Key Takeaways
3Dealer Sentiment Index Q2 2021
Dealer sentiment in the second quarter of 2021 saw substantial growth year over year and compared to Q2 2019 with the overall current market index increasing to 67, well above the positive threshold of 50 in the Cox Automotive Dealer Sentiment Index (CADSI). More dealers in the U.S. now feel that the current market is strong compared to those who feel it is weak, another indication of the overall market recovery from the depths of Q2 2020.
Dealers are also optimistic about the market ahead. The 3-month market outlook index reading of 63 is an increase from last quarter and, importantly, equal to Q1 2020, the final pre-COVID-19 reading. Profits in Q2 are strong, dealers are reporting. The profit index in Q2 hit a record 59, while the price pressure index dropped to a record low 33, meaning a majority of dealers are feeling little pressure to lower prices.
“Driven by the unique circumstances of strong demand and low inventory, dealer sentiment
climbed to a record high in the spring,” said Cox Automotive Chief Economist Jonathan Smoke. “The first two quarters of 2021 are showing a strongly recovering market, balancing on a perfect mix of pent-up demand, rising prices, and low inventory.”
Consistent with current market trends, the new-vehicle inventory index decreased significantly to 13 in Q2, a substantial 31-point drop from last quarter and a record low. The used-vehicle inventory index saw similar movement from Q1 to Q2, falling to 21, also a record low, although equal to Q3 2020. Tight inventory was ranked as the top factor holding back business in Q2, and, when asked, 53% of dealers noted that Finding/Buying Inventory was their top priority in the quarter.
Unlike inventory, customer traffic showed a significant improvement in Q2, with the index increasing 28 points from the prior quarter and reaching a record-high 57. This reading indicates more dealers feel their customer
traffic is strong than feel it is weak, likely due to pent-up demand.
Despite tight inventory, vehicle sales have been healthy in 2021. The Q2 new-vehicle sales index of 65 was a record for Q2 and near the all-time high of 66. The used-vehicle sales index in Q2 reached 62, an all-time record high and the first time the overall used-vehicle sales index moved above 60.
The top 5 factors holding back business shifted notably in Q2 from Q1, with Limited Inventory jumping to the top spot with 64% of dealers citing it. Market Conditions rose to No. 2 at 34%. Business Impacts from COVID-19, meanwhile, fell to the No. 3 spot from No. 1. The Economy moved down to No. 4 while Expenses rose from No. 7 to No. 5, with 19% of dealers citing it as a factor holding back business. Notably, Political Climate fell to No. 6 from No. 5 in top factors list, a level equal to Q2 2020. Political Climate as a factor holding back business peaked at No. 3 in Q4 2020.

Dealer Sentiment IndexS E C O N D Q U A R T E R 2 0 2 1
Dealer Sentiment Index Q2 2021
Strong
Weak
4845 46
49 51 51
4448 49 48 47 49
20
56
49 49
67
54 55 54 55 5659
51 5054 56
5155
30
68
61 61
77
4642 43
4750 48
4247 48 46 46 47
17
53
46 45
63
Q2 2017 Q3 2017 Q4 2017 Q1 2018 Q2 2018 Q3 2018 Q4 2018 Q1 2019 Q2 2019 Q3 2019 Q4 2019 Q1 2020 Q2 2020 Q3 2020 Q4 2020 Q1 2021 Q2 2021
Overall Franchise Independent
Q1: How would you describe the current market for vehicles in the areas where you operate?
4
Note: Scale 1 - 100

Dealer Sentiment IndexS E C O N D Q U A R T E R 2 0 2 1
Dealer Sentiment Index Q2 2021
Strong
Weak
Q2: What do you expect the market for vehicles in your area to look like 3 months from now?
5
5552 53
70
56 57
49
63
5551 51
63
4550 48
596364
57 57
7369
61
54
62 6257
54
66
5760 58
6874
52 51 52
70
5255
47
63
5249 51
61
4046 44
5659
Q2 2017 Q3 2017 Q4 2017 Q1 2018 Q2 2018 Q3 2018 Q4 2018 Q1 2019 Q2 2019 Q3 2019 Q4 2019 Q1 2020 Q2 2020 Q3 2020 Q4 2020 Q1 2021 Q2 2021
Overall Franchise IndependentNote: Scale 1 - 100

Dealer Sentiment IndexS E C O N D Q U A R T E R 2 0 2 1
Dealer Sentiment Index Q2 2021
Strong
Weak
38 3734 35
40 41
33 35
4240 37 36
13
4441
29
57
43 4245 43 44 46
4138
45 4743 45
20
5552
46
72
36 3631 33
39 39
30 33
4137 35
32
11
4037
24
52
Q2 2017 Q3 2017 Q4 2017 Q1 2018 Q2 2018 Q3 2018 Q4 2018 Q1 2019 Q2 2019 Q3 2019 Q4 2019 Q1 2020 Q2 2020 Q3 2020 Q4 2020 Q1 2021 Q2 2021
Overall Franchise IndependentNote: Scale 1 - 100
Q3: How do you rate the customer traffic to your dealership over the past 3 months?
6

Dealer Sentiment IndexS E C O N D Q U A R T E R 2 0 2 1
Dealer Sentiment Index Q2 2021
Strong
Weak
Q4: How would you describe your profits over the past 3 months?
7
4441 41 41 43 42
38 3844 42 44
40
17
46 48
39
59
48 50 49 49 51 49 4943
51 52 51 51
25
6670
63
82
4338 38 38
41 4035 36
4238
4236
14
40 41
31
51
Q2 2017 Q3 2017 Q4 2017 Q1 2018 Q2 2018 Q3 2018 Q4 2018 Q1 2019 Q2 2019 Q3 2019 Q4 2019 Q1 2020 Q2 2020 Q3 2020 Q4 2020 Q1 2021 Q2 2021
Overall Franchise IndependentNote: Scale 1 - 100

Dealer Sentiment IndexS E C O N D Q U A R T E R 2 0 2 1
Dealer Sentiment Index Q2 2021
Easy
Difficult
Q5: How would you describe your ability to get credit to operate your business over the past 3 months?
8
5955 57
61 59 59 60 60 61 60 60 58
4651
54 5458
67 66 68 7065 67 69 68 67 66 65 65
5761 63 64 66
5652 54
58 57 57 57 58 59 59 58 57
4348
51 5155
Q2 2017 Q3 2017 Q4 2017 Q1 2018 Q2 2018 Q3 2018 Q4 2018 Q1 2019 Q2 2019 Q3 2019 Q4 2019 Q1 2020 Q2 2020 Q3 2020 Q4 2020 Q1 2021 Q2 2021
Overall Franchise IndependentNote: Scale 1 - 100
Dealer Sentiment IndexS E C O N D Q U A R T E R 2 0 2 1
Dealer Sentiment Index Q2 2021
Growing
Declining
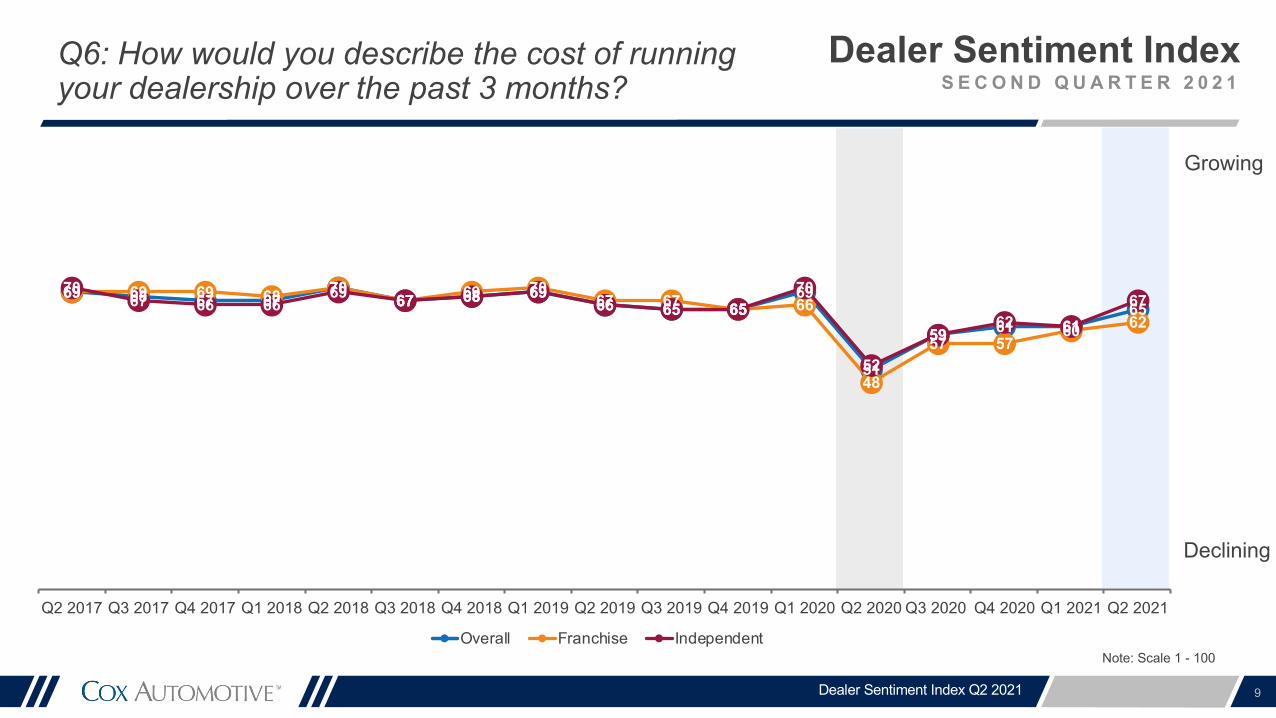
Q6: How would you describe the cost of running your dealership over the past 3 months?
9
69 68 67 6770
67 68 6966 65 65
69
51
59 61 6165
69 69 69 68 7067 69 70
67 67 65 66
48
57 5760 62
7067 66 66
69 67 68 6966 65 65
70
52
5962 61
67
Q2 2017 Q3 2017 Q4 2017 Q1 2018 Q2 2018 Q3 2018 Q4 2018 Q1 2019 Q2 2019 Q3 2019 Q4 2019 Q1 2020 Q2 2020 Q3 2020 Q4 2020 Q1 2021 Q2 2021
Overall Franchise IndependentNote: Scale 1 - 100
Dealer Sentiment IndexS E C O N D Q U A R T E R 2 0 2 1
Dealer Sentiment Index Q2 2021
Good
Poor
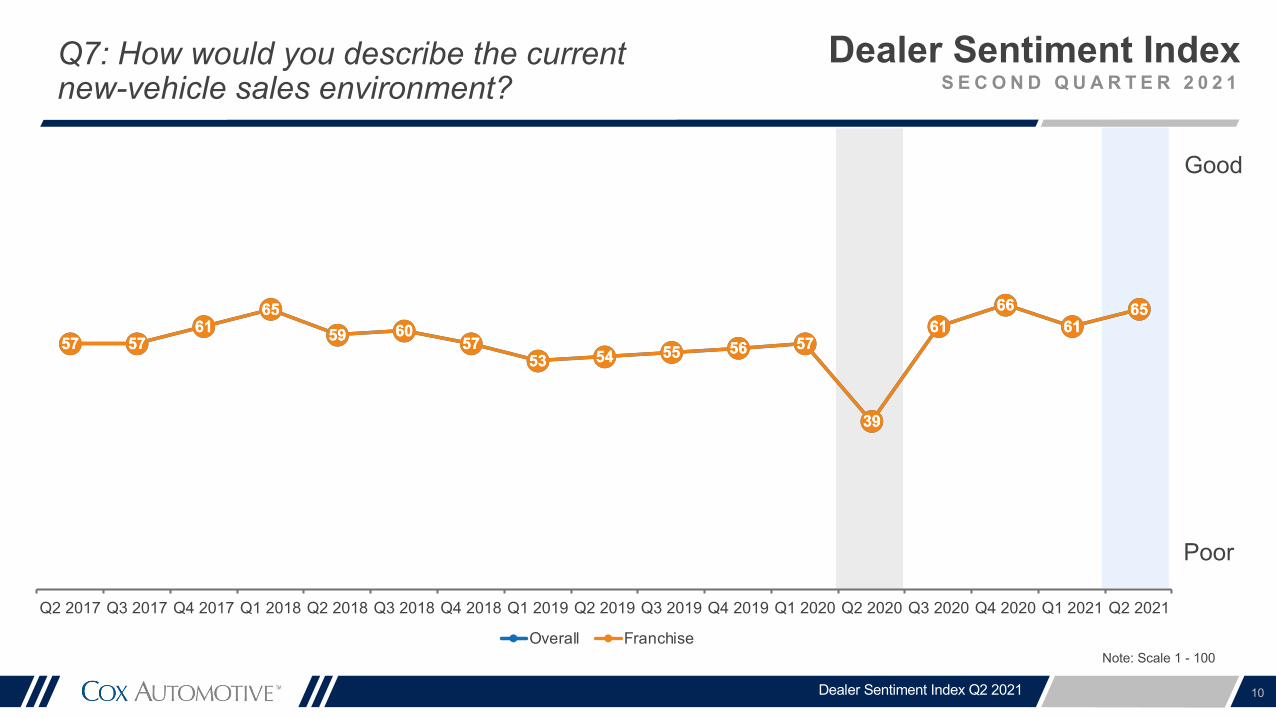
Q7: How would you describe the current new-vehicle sales environment?
10
57 5761
6559 60
5753 54 55 56 57
39
6166
6165
57 5761
6559 60
5753 54 55 56 57
39
6166
6165
Q2 2017 Q3 2017 Q4 2017 Q1 2018 Q2 2018 Q3 2018 Q4 2018 Q1 2019 Q2 2019 Q3 2019 Q4 2019 Q1 2020 Q2 2020 Q3 2020 Q4 2020 Q1 2021 Q2 2021
Overall FranchiseNote: Scale 1 - 100

Dealer Sentiment IndexS E C O N D Q U A R T E R 2 0 2 1
Dealer Sentiment Index Q2 2021
Q8: How would you describe the current new-vehicle inventory levels?
11
6762
68
6157 59 60
6461 59
56
41
29
4844
13
6762
68
6157 59 60
6461 59
56
41
29
4844
13
Q2 2017 Q3 2017 Q4 2017 Q1 2018 Q2 2018 Q3 2018 Q4 2018 Q1 2019 Q2 2019 Q3 2019 Q4 2019 Q1 2020 Q2 2020 Q3 2020 Q4 2020 Q1 2021 Q2 2021
Overall FranchiseNote: Scale 1 - 100
Growing
Declining

Dealer Sentiment IndexS E C O N D Q U A R T E R 2 0 2 1
Dealer Sentiment Index Q2 2021
Growing Strong
Declining Weak
Inventory/ProfitsQ4: How would you describe your profits over the past 3 months? Q8: How would you describe the current new-vehicle inventory levels?
12
Note: Scale 1 - 100
6762
68
6157 59 60
6461 59
56
41
29
4844
13
48 50 49 49 51 49 4943
51 52 51 51
25
6670
63
82
Q2 2017 Q3 2017 Q4 2017 Q1 2018 Q2 2018 Q3 2018 Q4 2018 Q1 2019 Q2 2019 Q3 2019 Q4 2019 Q1 2020 Q2 2020 Q3 2020 Q4 2020 Q1 2021 Q2 2021
New Vehicle Inventory Franchise Profits

Dealer Sentiment IndexS E C O N D Q U A R T E R 2 0 2 1
Dealer Sentiment Index Q2 2021
Q9: How would you describe the current new-vehicle inventory mix?
13
Note: Scale 1 - 100
Good
Poor
Note: New question introduced in Q2 2019
7572 73 73
64
42
53 54
33
7572 73 73
64
42
53 54
33
Q2 2017 Q3 2017 Q4 2017 Q1 2018 Q2 2018 Q3 2018 Q4 2018 Q1 2019 Q2 2019 Q3 2019 Q4 2019 Q1 2020 Q2 2020 Q3 2020 Q4 2020 Q1 2021 Q2 2021
Overall Franchise
Dealer Sentiment IndexS E C O N D Q U A R T E R 2 0 2 1
Dealer Sentiment Index Q2 2021
Large
Small
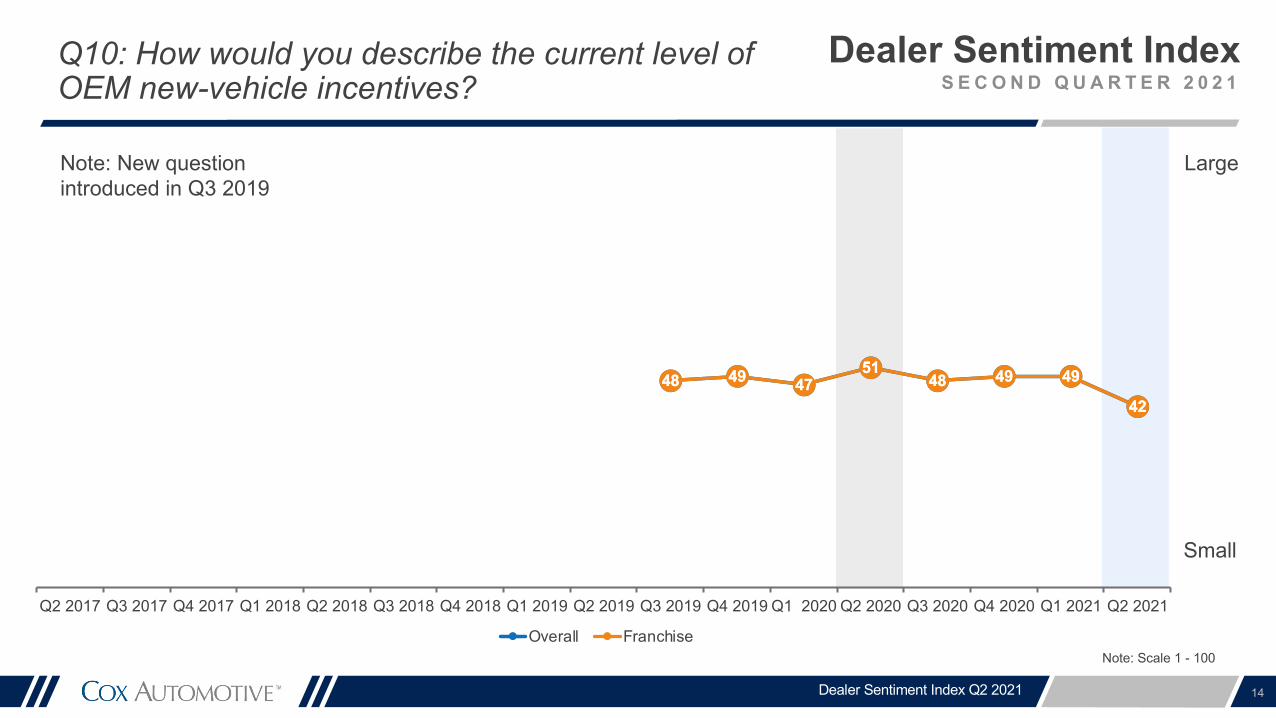
Q10: How would you describe the current level of OEM new-vehicle incentives?
14
48 49 4751
48 49 49
4248 49 47
5148 49 49
42
Q2 2017 Q3 2017 Q4 2017 Q1 2018 Q2 2018 Q3 2018 Q4 2018 Q1 2019 Q2 2019 Q3 2019 Q4 2019 Q1 2020 Q2 2020 Q3 2020 Q4 2020 Q1 2021 Q2 2021
Overall FranchiseNote: Scale 1 - 100
Note: New question introduced in Q3 2019

Dealer Sentiment IndexS E C O N D Q U A R T E R 2 0 2 1
Dealer Sentiment Index Q2 2021
Q11: How would you describe the current used-vehicle sales environment?
15
55 57 55 56 55 5751 53
56 55 53 53
26
5552
47
62
70 68 67 6972 72
68 6672 73
6672
43
77
68 66
77
5053 51 52 50 52
46 4851 49 49 47
20
47 47
40
56
Q2 2017 Q3 2017 Q4 2017 Q1 2018 Q2 2018 Q3 2018 Q4 2018 Q1 2019 Q2 2019 Q3 2019 Q4 2019 Q1 2020 Q2 2020 Q3 2020 Q4 2020 Q1 2021 Q2 2021
Overall Franchise IndependentNote: Scale 1 - 100
Good
Poor

Dealer Sentiment IndexS E C O N D Q U A R T E R 2 0 2 1
Dealer Sentiment Index Q2 2021
Growing
Declining
Q12: How would you describe the current used-vehicle inventory levels?
16
51 5359
49 48 4854
46 4753 53
31
21
41 41
21
55 55
6258
52 54
62
53 5458 59
43
28
4853
25
5053
58
45 46 4652
44 44
51 51
27
19
39 37
19
Q2 2017 Q3 2017 Q4 2017 Q1 2018 Q2 2018 Q3 2018 Q4 2018 Q1 2019 Q2 2019 Q3 2019 Q4 2019 Q1 2020 Q2 2020 Q3 2020 Q4 2020 Q1 2021 Q2 2021
Overall Franchise IndependentNote: Scale 1 - 100
Dealer Sentiment IndexS E C O N D Q U A R T E R 2 0 2 1
Dealer Sentiment Index Q2 2021
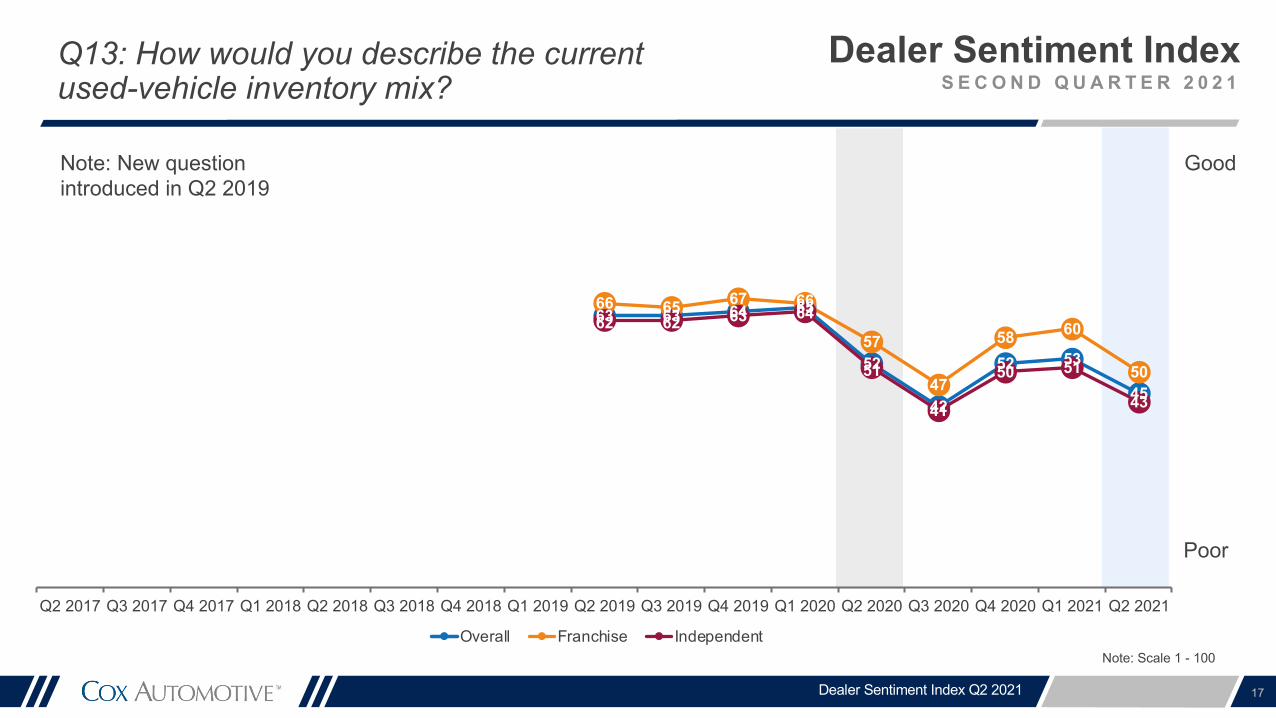
Q13: How would you describe the current used-vehicle inventory mix?
17
63 63 64 65
52
42
52 53
45
66 65 67 66
57
47
58 60
50
62 62 63 64
51
41
50 51
43
Q2 2017 Q3 2017 Q4 2017 Q1 2018 Q2 2018 Q3 2018 Q4 2018 Q1 2019 Q2 2019 Q3 2019 Q4 2019 Q1 2020 Q2 2020 Q3 2020 Q4 2020 Q1 2021 Q2 2021
Overall Franchise IndependentNote: Scale 1 - 100
Good
Poor
Note: New question introduced in Q2 2019

Dealer Sentiment IndexS E C O N D Q U A R T E R 2 0 2 1
Dealer Sentiment Index Q2 2021
More
Less
Q14: How much pressure do you feel to lower your prices?
18
Note: Scale 1 - 100
64 6367
62 64 6367
63 64 63 63 63
70
4551
57
33
65 67 6762
66 65 67 67 66 65 64 6669
37
4851
23
63 6267
62 63 6366
62 63 62 62 63
70
4852
58
37
Q2 2017 Q3 2017 Q4 2017 Q1 2018 Q2 2018 Q3 2018 Q4 2018 Q1 2019 Q2 2019 Q3 2019 Q4 2019 Q1 2020 Q2 2020 Q3 2020 Q4 2020 Q1 2021 Q2 2021
Overall Franchise Independent

Dealer Sentiment IndexS E C O N D Q U A R T E R 2 0 2 1
Dealer Sentiment Index Q2 2021
Growing
Declining
Q15: How would you describe your dealership's current staffing levels?
19
52 52 52 54 52 50 50 48 50 49 50 52
35
4347 46 47
56 55 5560
55 53 52 53 54 53 5459
35
5053 54
5050 51 51 52 51 49 49 47 49 48 49 50
3540
45 4346
Q2 2017 Q3 2017 Q4 2017 Q1 2018 Q2 2018 Q3 2018 Q4 2018 Q1 2019 Q2 2019 Q3 2019 Q4 2019 Q1 2020 Q2 2020 Q3 2020 Q4 2020 Q1 2021 Q2 2021
Overall Franchise IndependentNote: Scale 1 - 100

Dealer Sentiment IndexS E C O N D Q U A R T E R 2 0 2 1
Dealer Sentiment Index Q2 2021
Better
Worse
20
51
74
51
74
Q2 2017 Q3 2017 Q4 2017 Q1 2018 Q2 2018 Q3 2018 Q4 2018 Q1 2019 Q2 2019 Q3 2019 Q4 2019 Q1 2020 Q2 2020 Q3 2020 Q4 2020 Q1 2021 Q2 2021
Overall FranchiseNote: Scale 1 - 100
Note: New question introduced Q1 2021
Q16: How would you describe the current level of business in your fixed operation?
Dealer Sentiment IndexS E C O N D Q U A R T E R 2 0 2 1
Dealer Sentiment Index Q2 2021
Growing
Declining
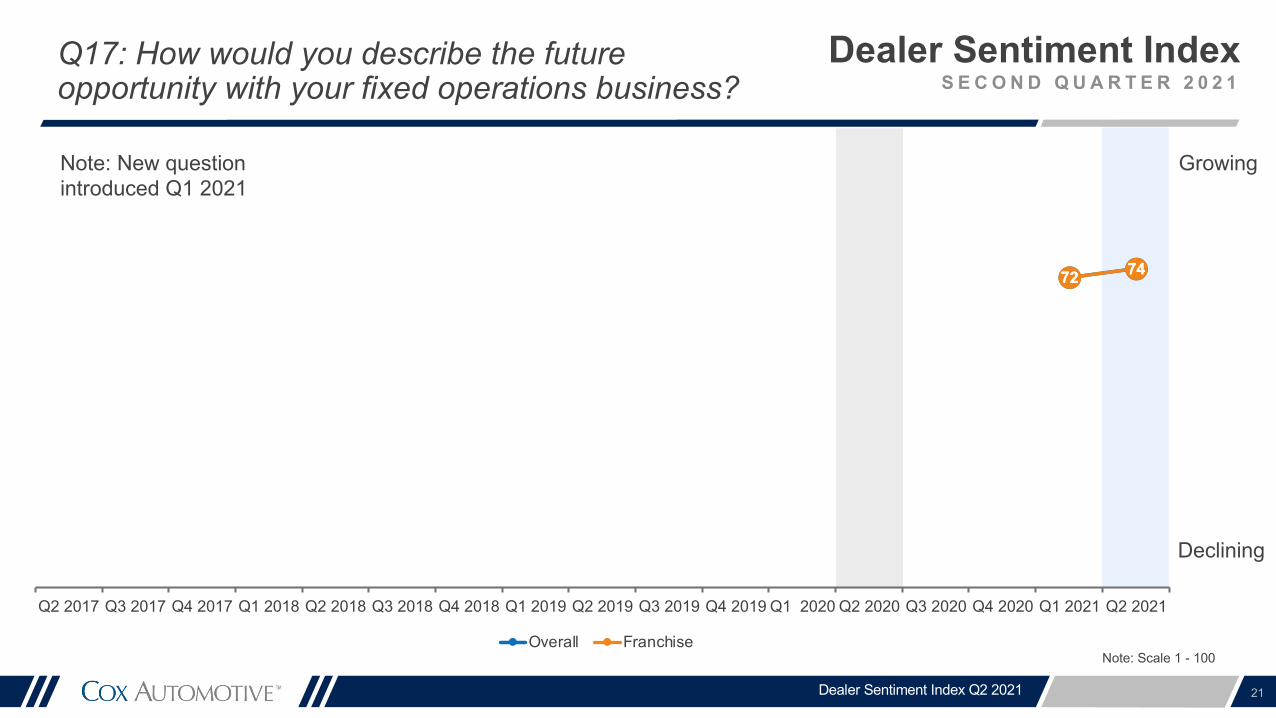
21
72 7472 74
Q2 2017 Q3 2017 Q4 2017 Q1 2018 Q2 2018 Q3 2018 Q4 2018 Q1 2019 Q2 2019 Q3 2019 Q4 2019 Q1 2020 Q2 2020 Q3 2020 Q4 2020 Q1 2021 Q2 2021
Overall FranchiseNote: Scale 1 - 100
Note: New question introduced Q1 2021
Q17: How would you describe the future opportunity with your fixed operations business?

Dealer Sentiment IndexS E C O N D Q U A R T E R 2 0 2 1
Dealer Sentiment Index Q2 2021
Strong
Weak
Q18: How would you describe the current U.S. economy?
22
55 55 57
23
4043 44
5455 5457
29
4853 51
6055 55 57
21
3740 42
52
Q2 2017 Q3 2017 Q4 2017 Q1 2018 Q2 2018 Q3 2018 Q4 2018 Q1 2019 Q2 2019 Q3 2019 Q4 2019 Q1 2020 Q2 2020 Q3 2020 Q4 2020 Q1 2021 Q2 2021
Overall Franchise IndependentNote: Scale 1 - 100
Note: New question introduced in Q3 2019

Dealer Sentiment IndexS E C O N D Q U A R T E R 2 0 2 1
Dealer Sentiment Index Q2 2021
Better
Worse
Q19: Compared to last year, how would you describe your EV sales?
23
515549
Q2 2017 Q3 2017 Q4 2017 Q1 2018 Q2 2018 Q3 2018 Q4 2018 Q1 2019 Q2 2019 Q3 2019 Q4 2019 Q1 2020 Q2 2020 Q3 2020 Q4 2020 Q1 2021 Q2 2021
Overall Franchise IndependentNote: Scale 1 - 100
(EV) Electric Vehicle
Note: New question introduced Q2 2021

Dealer Sentiment IndexS E C O N D Q U A R T E R 2 0 2 1
Dealer Sentiment Index Q2 2021
Growing
Declining
Q20: What do you expect the EV market in your area to look like 3 months from now?
24
555953
Q2 2017 Q3 2017 Q4 2017 Q1 2018 Q2 2018 Q3 2018 Q4 2018 Q1 2019 Q2 2019 Q3 2019 Q4 2019 Q1 2020 Q2 2020 Q3 2020 Q4 2020 Q1 2021 Q2 2021
Overall Franchise IndependentNote: Scale 1 - 100
Note: New question introduced Q2 2021

25
Factors Holding Back Your Business?
Significant decrease vs previous quarter
Significant increase vs previous quarter
Dealer Sentiment IndexS E C O N D Q U A R T E R 2 0 2 1
OVE
RA
LL R
AN
K
Q2 '21 Q1 ’21 Q2 '201 Limited Inventory 64% 43% 26%
2 Market Conditions 34% 38% 49%
3 Business Impacts From COVID-19/Coronavirus 28% 46% 75%
4 Economy 24% 42% 60%
5 Expenses 19% 21% 18%
6 Political Climate 18% 36% 22%
7 Competition 15% 20% 12%
8 Credit Availability for Consumers 14% 18% 22%
9 Consumer Confidence 8% 25% 42%
10 Staff Turnover 8% 7% 5%
11 Regulations 6% 9% 12%
12 Consumer Transparency in Pricing 4% 5% 5%
13 Tariffs on Imported Vehicles and Parts 4% 2% 2%
14 Credit Availability for Business 4% 6% 9%
15 Weather 3% 17% 5%
16 Interest Rates 3% 3% 2%
17 OEM Mandates/Restrictions 3% 2% 2%
Dealer Sentiment Index Q2 2021
Q2 ‘1933%40%
N/A
N/A
29%N/A
35%
31%
13%
12%
7%
12%
4%
6%N/A
16%
4%

26
Factors Holding Back Your Business?
Significant decrease vs previous quarter
Significant increase vs previous quarter
OVE
RA
LL R
AN
K
Q2 '21 Q1 ’21 Q2 '2018 Dealership Systems/Tools 3% 2% 2%
19 Lack of Consumer Incentives From My OEM 2% 3% 3%
20 Technology to Support Sales 2% 2% 3%
21 Technology to Support Operations 2% 2% 1%
22 OEM Priorities 2% 2% 2%
23 Too Much Retail Inventory 1% 2% 6%
Dealer Sentiment Index Q2 2021
Dealer Sentiment IndexS E C O N D Q U A R T E R 2 0 2 1
Q2 ‘195%N/A
N/A
N/A
N/A
7%

27
Factors Holding Back Your Business?
Significant decrease vs previous quarter
Significant increase vs previous quarter
Q2 '21 Q1 ’21 Q2 '201 Limited Inventory 67% 41% 15%
2 Business Impacts From COVID-19/Coronavirus 25% 42% 72%
3 Market Conditions 24% 31% 45%
4 Political Climate 19% 38% 23%
5 Economy 19% 36% 53%
6 Staff Turnover 14% 10% 9%
7 Expenses 11% 10% 13%
8 OEM Mandates/Restrictions 10% 7% 8%
9 Lack of Consumer Incentives From My OEM 10% 13% 12%
10 Competition 8% 18% 10%
11 OEM Priorities 8% 7% 7%
12 Consumer Confidence 8% 25% 38%
13 Credit Availability for Consumers 6% 9% 8%
14 Regulations 6% 7% 14%
15 Weather 4% 20% 6%
16 Tariffs on Imported Vehicles and Parts 4% 3% 2%
17 Dealership Systems/Tools 3% 2% 1%
FRA
NC
HIS
ED D
EALE
RS
Dealer Sentiment Index Q2 2021
Dealer Sentiment IndexS E C O N D Q U A R T E R 2 0 2 1
Q2 ‘1919%
N/A
39%
N/A
N/A
25%
21%
17%N/A
37%N/A
22%
23%
4%N/A
6%
7%

28
Factors Holding Back Your Business?
Significant decrease vs previous quarter
Significant increase vs previous quarter
Q2 '21 Q1 ’21 Q2 '2018 Interest Rates 3% 2% 2%
19 Consumer Transparency in Pricing 2% 4% 3%
20 Technology to Support Operations 2% 1% 1%
21 Credit Availability for Business 2% 1% 2%
22 Technology to Support Sales 1% 2% 2%
23 Too Much Retail Inventory 1% 0% 4%
FRA
NC
HIS
ED D
EALE
RS
Dealer Sentiment Index Q2 2021
Dealer Sentiment IndexS E C O N D Q U A R T E R 2 0 2 1
Q2 ‘1926%
12%N/A
1%N/A
6%

29
Factors Holding Back Your Business?
Significant decrease vs previous quarter
Significant increase vs previous quarter
Q2 '21 Q1 ’21 Q2 '201 Limited Inventory 63% 43% 29%
2 Market Conditions 38% 40% 50%
3 Business Impacts From COVID-19/Coronavirus 29% 48% 76%
4 Economy 25% 44% 62%
5 Expenses 21% 25% 20%
6 Political Climate 17% 36% 22%
7 Competition 17% 21% 13%
8 Credit Availability for Consumers 16% 21% 27%
9 Consumer Confidence 9% 26% 43%
10 Staff Turnover 7% 6% 4%
11 Regulations 6% 10% 11%
12 Credit Availability for Business 5% 7% 11%
13 Consumer Transparency in Pricing 5% 6% 6%
14 Tariffs on Imported Vehicles and Parts 4% 1% 3%IND
EPEN
DEN
T D
EALE
RS
Dealer Sentiment Index Q2 2021
Dealer Sentiment IndexS E C O N D Q U A R T E R 2 0 2 1
Q2 ‘1938%
40%
N/A
N/A
31%
N/A
34%
33%
11%
7%
8%
7%
13%
4%
30
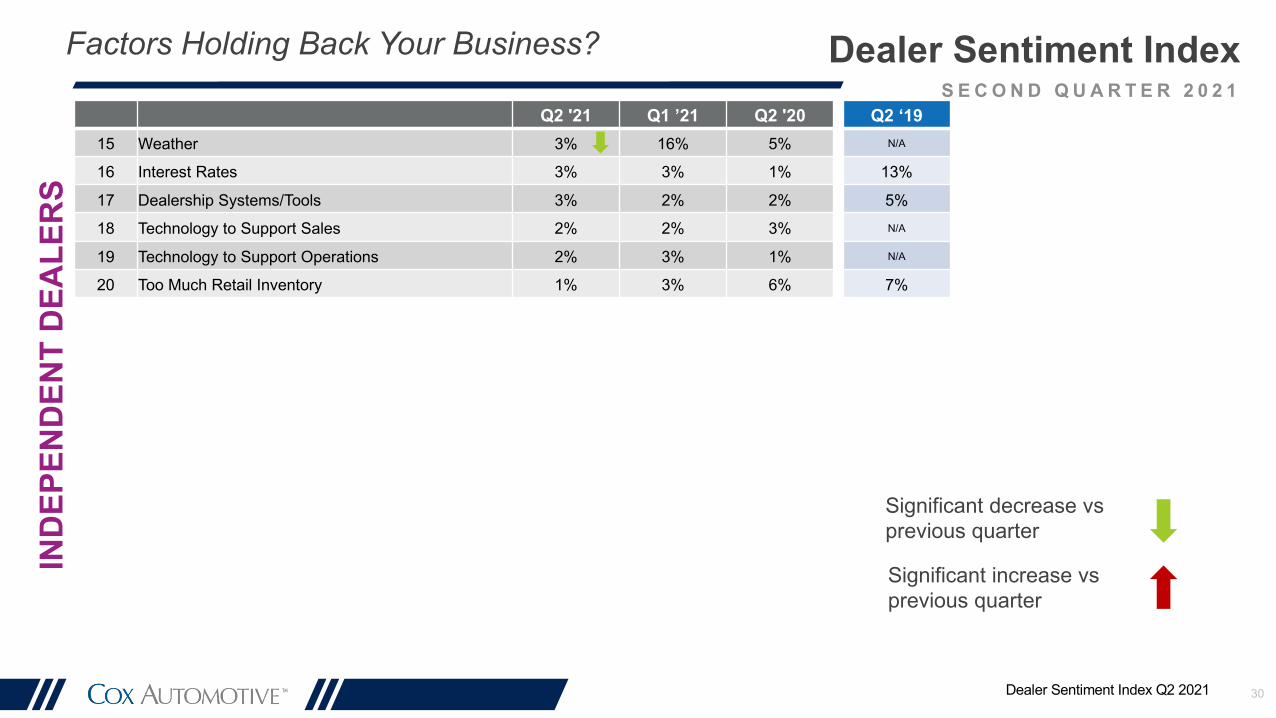
Factors Holding Back Your Business?
Significant decrease vs previous quarter
Significant increase vs previous quarter
Q2 '21 Q1 ’21 Q2 '2015 Weather 3% 16% 5%
16 Interest Rates 3% 3% 1%
17 Dealership Systems/Tools 3% 2% 2%
18 Technology to Support Sales 2% 2% 3%
19 Technology to Support Operations 2% 3% 1%
20 Too Much Retail Inventory 1% 3% 6%
IND
EPEN
DEN
T D
EALE
RS
Dealer Sentiment Index Q2 2021
Dealer Sentiment IndexS E C O N D Q U A R T E R 2 0 2 1
Q2 ‘19N/A
13%
5%N/A
N/A
7%

The Business Impact of COVID-19
31Dealer Sentiment Index Q2 2021

Dealer Sentiment IndexS E C O N D Q U A R T E R 2 0 2 1
Dealer Sentiment Index Q2 2021
Strong
Weak
4845 46
49 51 51
4448 49 48 47 49
20
56
49 49
67
54 55 54 55 5659
51 5054 56
5155
30
68
61 61
77
4642 43
4750 48
4247 48 46 46 47
17
53
46 45
63
Q2 2017 Q3 2017 Q4 2017 Q1 2018 Q2 2018 Q3 2018 Q4 2018 Q1 2019 Q2 2019 Q3 2019 Q4 2019 Q1 2020 Q2 2020 Q3 2020 Q4 2020 Q1 2021 Q2 2021
Overall Franchise Independent
Q1: How would you describe the current market for vehicles in the areas where you operate?
32
Note: Scale 1 - 100

Dealer Sentiment IndexS E C O N D Q U A R T E R 2 0 2 1
Dealer Sentiment Index Q2 2021
Strong
Weak
Q2: What do you expect the market for vehicles in your area to look like 3 months from now?
33
5552 53
70
56 57
49
63
5551 51
63
4550 48
596364
57 57
7369
61
54
62 6257
54
66
5760 58
6874
52 51 52
70
5255
47
63
5249 51
61
4046 44
5659
Q2 2017 Q3 2017 Q4 2017 Q1 2018 Q2 2018 Q3 2018 Q4 2018 Q1 2019 Q2 2019 Q3 2019 Q4 2019 Q1 2020 Q2 2020 Q3 2020 Q4 2020 Q1 2021 Q2 2021
Overall Franchise IndependentNote: Scale 1 - 100

Dealer Sentiment IndexS E C O N D Q U A R T E R 2 0 2 1
Dealer Sentiment Index Q2 2021 34
Top Priorities at This Time
Overall Franchised (A) Independent (B) High Tax States (A)
All Other States (B)
Q2 2021 Q1 2021 Q2 2021 Q1 2021 Q2 2021 Q1 2021 Q2 2021 Q1 2021 Q2 2021 Q1 2021
Finding/Buying inventory 53% 34% 44% 20% 55% A 38% A 46% 27% 54% 35% A
Staying in business in general 14% 23% 5% 9% 17% A 28% A 16% 29% B 13% 22%
Retaining customers 7% 8% 13% B 16% B 5% 5% 3% 7% 8% A 8%
Improving efficiency in general 6% 10% 10% B 18% B 5% 7% 6% 8% 6% 10%
Improving Sales and Service solutions 5% 9% 8% B 10% 4% 8% 12% B 10% 4% 8%
Reducing expenses by cutting unnecessary costs 4% 6% 3% 5% 5% 6% 4% 10% B 4% 5%
Gaining market share 4% 7% 9% B 16% B 2% 4% 2% 5% 4% 8%
Retaining employees 3% 3% 5% B 5% B 2% 2% 3% 3% 3% 3%
Selling the dealership* 1% N/A 0% N/A 2% N/A 1% N/A 1% N/A
Acquiring other storefronts* 1% N/A 0% N/A 1% N/A 1% N/A 1% N/A
Other 2% 1% 3% 1% 2% 1% 6% B 1% 2% 1%
A/B indicates significant difference between groups at the 95% confidence level
GREEN: Significant increase from prior quarterRED: Significant decrease from prior quarter*option added in Q2 2021

Dealer Sentiment IndexS E C O N D Q U A R T E R 2 0 2 1
Dealer Sentiment Index Q2 2021 35
Regional View – Index Scores (Franchised Dealers)
Question Answer North-east
Mid-west South West
Current Market Strong/Weak 76 78 78 74
Market Next 3 Months Strong/Weak 71 72 77 77
Customer Traffic Strong/Weak 69 77 73 67
Profits Strong/Weak 79 86 84 76
Dealer Credit Easy/Difficult 62 65 68 67
Costs Growing/Declining 61 62 59 66
New Vehicle Sales Good/Poor 67 61 69 64
New Vehicle Inventory Growing/Declining 14 10 14 16
New Vehicle Inventory Mix Good/Poor 38 28 34 35Note: Scale 1 – 100GREEN: Significant increase from prior quarterRED: Significant decrease from prior quarter

Dealer Sentiment IndexS E C O N D Q U A R T E R 2 0 2 1
Dealer Sentiment Index Q2 2021 36
Regional View – Index Scores (Franchised Dealers)
Question Answer North-east
Mid-west South West
Used Vehicle Sales Good/Poor 78 77 77 75
Used Vehicle Inventory Growing/Declining 29 21 27 24
Used Vehicle Inventory Mix Good/Poor 55 48 48 46
Price Pressure More/Less 24 20 23 26
Staffing Growing/Declining 53 51 49 51
OEM incentives Large/Small 42 43 43 41
Economy Strong/Weak 60 61 59 62
Current Fixed Operations Better/Worse 71 75 74 75
Future Fixed Operations Growing/Declining 74 70 79 73
Current BEV Sales Better/Worse 58 56 49 59
Future BEV Sales Growing/Declining 64 59 53 63
Note: Scale 1 – 100GREEN: Significant increase from prior quarterRED: Significant decrease from prior quarter

37
Contact Information:
Dara HailesManager, Public RelationsCox [email protected]
Mark SchirmerDirector, Public RelationsCox [email protected]
Dealer Sentiment IndexS E C O N D Q U A R T E R 2 0 2 1
37Dealer Sentiment Index Q2 2021