Embed Size (px)
Citation preview
Deal Trends in Latin America
October 2018 | Issue Number 8
Table of Contents
Deal Trends in Latin America
Deal Activity in Latin America……………..…………..………………………… 4
Year-Over-Year Trends by Country………………......................... 5
2018 Top M&A Deals………….………………................................ 6
Sector Trends Year-Over-Year……..……………………………. 7
Year-Over-Year by Largest Subsector…………........................... 8
Cross-Border Intraregional Deals………………............................ 9
Cross-Border Deal Count…………………………............................ 10
Key Metrics On Select Countries…………………….…………..….……….….. 12
Currency Spotlight…………………………………………………………………… 13
Data Dispatch: Latin America…………………………………………………….. 14
Behind the Data…………………………………………………………………….. 15
2
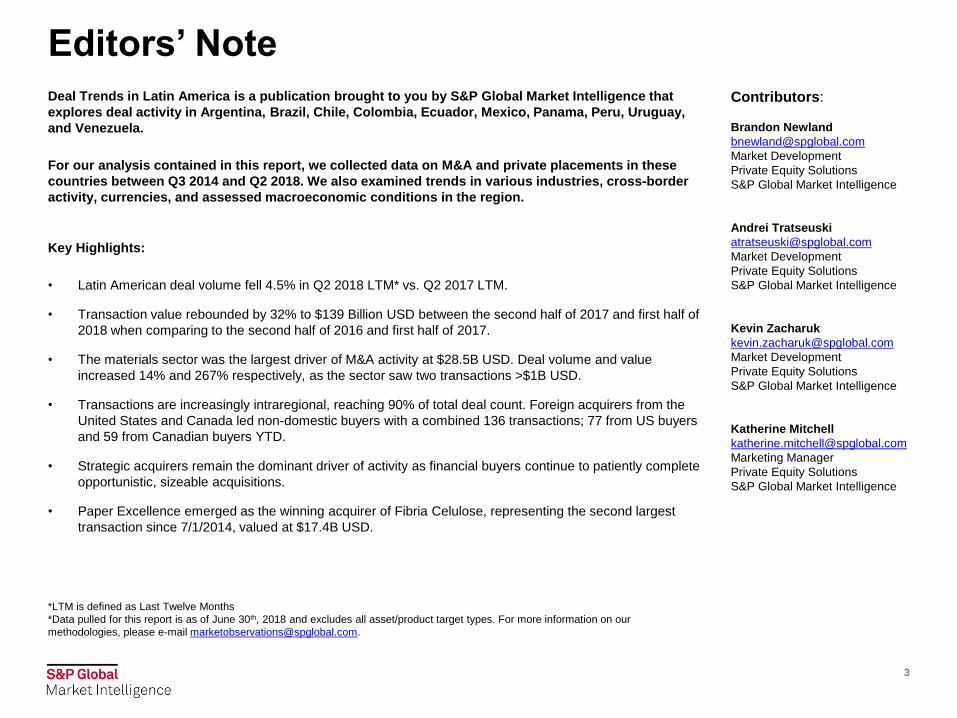
Editors’ Note
Deal Trends in Latin America is a publication brought to you by S&P Global Market Intelligence that
explores deal activity in Argentina, Brazil, Chile, Colombia, Ecuador, Mexico, Panama, Peru, Uruguay,
and Venezuela.
For our analysis contained in this report, we collected data on M&A and private placements in these
countries between Q3 2014 and Q2 2018. We also examined trends in various industries, cross-border
activity, currencies, and assessed macroeconomic conditions in the region.
Key Highlights:
• Latin American deal volume fell 4.5% in Q2 2018 LTM* vs. Q2 2017 LTM.
• Transaction value rebounded by 32% to $139 Billion USD between the second half of 2017 and first half of
2018 when comparing to the second half of 2016 and first half of 2017.
• The materials sector was the largest driver of M&A activity at $28.5B USD. Deal volume and value
increased 14% and 267% respectively, as the sector saw two transactions >$1B USD.
• Transactions are increasingly intraregional, reaching 90% of total deal count. Foreign acquirers from the
United States and Canada led non-domestic buyers with a combined 136 transactions; 77 from US buyers
and 59 from Canadian buyers YTD.
• Strategic acquirers remain the dominant driver of activity as financial buyers continue to patiently complete
opportunistic, sizeable acquisitions.
• Paper Excellence emerged as the winning acquirer of Fibria Celulose, representing the second largest
transaction since 7/1/2014, valued at $17.4B USD.
*LTM is defined as Last Twelve Months
*Data pulled for this report is as of June 30th, 2018 and excludes all asset/product target types. For more information on our
methodologies, please e-mail [email protected].
Contributors:
Brandon Newland
Market Development
Private Equity Solutions
S&P Global Market Intelligence
Andrei Tratseuski
Market Development
Private Equity Solutions
S&P Global Market Intelligence
Kevin Zacharuk
Market Development
Private Equity Solutions
S&P Global Market Intelligence
Katherine Mitchell
Marketing Manager
Private Equity Solutions
S&P Global Market Intelligence
3

Deal Activity in Latin America
Despite Lower Deal Volume,
Value Rebounds
The macroeconomic tailwinds felt across global
markets continued to impact Latin America as well,
driving economic growth, consumption, and M&A
activity. 801 deals were made in the region between
Q2 2017 and Q2 2018, representing a 4.8% drop
from the 841 deals made between Q2 2016 and Q2
2017.
Despite the lower deal volume, transaction values
continued to grow, accelerating more than 30% to
$139B USD between Q2 2017 and Q2 2018
compared to the same period one year prior (Q2
2016 to Q2 2017). High transaction multiples across
developed markets continue to bring attention to
Latin America as a cheaper alternative for investors
pursuing increasingly challenging benchmark
returns.
4*Source: S&P Capital IQ platform as of June 30th, 2018
293
271
246
274
235
317
178
205
230 230
186195
187
246
182 186
0
50
100
150
200
250
300
350
400
450
$0
$5,000
$10,000
$15,000
$20,000
$25,000
$30,000
$35,000
$40,000
$45,000
DEAL VALUE AND VOLUME BY QUARTER (Q3, 2014 – Q2, 2018)
Total Deal Value Total Deal Volume
Deal Activity in Latin America:LTM YoY Trends by Country
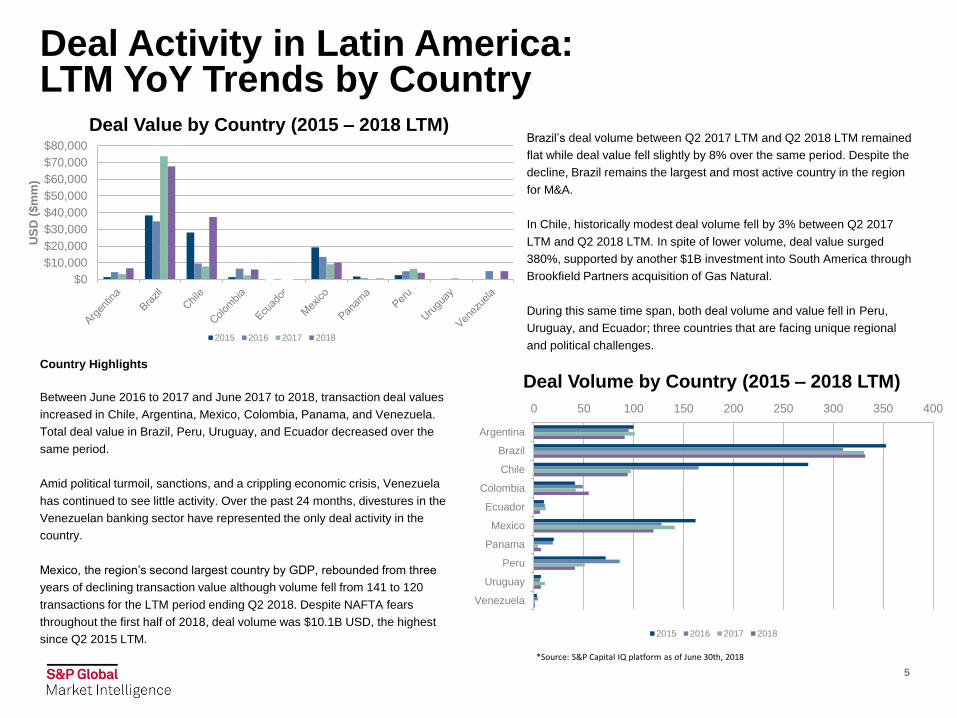
Country Highlights
Between June 2016 to 2017 and June 2017 to 2018, transaction deal values
increased in Chile, Argentina, Mexico, Colombia, Panama, and Venezuela.
Total deal value in Brazil, Peru, Uruguay, and Ecuador decreased over the
same period.
Amid political turmoil, sanctions, and a crippling economic crisis, Venezuela
has continued to see little activity. Over the past 24 months, divestures in the
Venezuelan banking sector have represented the only deal activity in the
country.
Mexico, the region’s second largest country by GDP, rebounded from three
years of declining transaction value although volume fell from 141 to 120
transactions for the LTM period ending Q2 2018. Despite NAFTA fears
throughout the first half of 2018, deal volume was $10.1B USD, the highest
since Q2 2015 LTM.
5
Brazil’s deal volume between Q2 2017 LTM and Q2 2018 LTM remained
flat while deal value fell slightly by 8% over the same period. Despite the
decline, Brazil remains the largest and most active country in the region
for M&A.
In Chile, historically modest deal volume fell by 3% between Q2 2017
LTM and Q2 2018 LTM. In spite of lower volume, deal value surged
380%, supported by another $1B investment into South America through
Brookfield Partners acquisition of Gas Natural.
During this same time span, both deal volume and value fell in Peru,
Uruguay, and Ecuador; three countries that are facing unique regional
and political challenges.
$0
$10,000
$20,000
$30,000
$40,000
$50,000
$60,000
$70,000
$80,000
US
D (
$m
m)
Deal Value by Country (2015 – 2018 LTM)
2015 2016 2017 2018
0 50 100 150 200 250 300 350 400
Argentina
Brazil
Chile
Colombia
Ecuador
Mexico
Panama
Peru
Uruguay
Venezuela
Deal Volume by Country (2015 – 2018 LTM)
2015 2016 2017 2018
*Source: S&P Capital IQ platform as of June 30th, 2018

M&A Activity in Latin America:Top Deals (Announced or Closed) June 1, 2017 – June 30, 2018
This chart includes the top 10 deals in Latin America by Total Transaction Value in USD between the second half of 2017 and the first half of 2018. Brazil continues to host the majority of large deals in the
region across multiple sectors. All deals except for Brookfield’s acquisition of Gas Natural and Chile’s nationalization of Corporación Nacional del Cobre de Chile represent strategic acquisitions.
M&A Activity in Latin America is sorted by largest transaction values in USD. Data was derived from the S&P Capital IQ platform as of July 31st, 2018.
Announced
DateClosed Date Target/Issuer Headquarters Primary Industry (Target) Buyers/Investors
Total
Transaction
Value
($USDmm)
Implied
Enterprise
Value/EBITDA
(x)
Implied
Enterprise
Value/Revenue
(x)
Implied
Enterprise
Value/EBIT
Implied Equity
Value/LTM Net
Income (x)
3/13/2018 -Fibria Celulose S.A.
(BOVESPA:FIBR3)Brazil Paper Products Paper Excellence B.V. 17,377.1 10.6 4.3 19.5 34.1
5/17/2018 -
Sociedad Química y
Minera de Chile S.A.
(NYSE:SQM)Chile
Fertilizers and Agricultural
Chemicals
Tianqi Lithium
Corporation
(SZSE:002466)4,066.18 19.5 8.0 26.4 39.0
4/17/2018 -
Eletropaulo Metropolitana
Eletricidade de São Paulo
S.A. (BOVESPA:ELPL3)
Brazil Electric Utilities
Enel Brasil
Investimentos
Sudeste, S.A.
3,084.1 9.6 0.80 18.4 -
4/23/2018 -Somos Educação S.A.
(BOVESPA:SEDU3)Brazil Education Services
Kroton Educacional
S.A.
(BOVESPA:KROT3)
2,064.0 18.4 3.8 19.7 141.9
6/21/2018 -Telecom Argentina S.A.
(BASE:TECO2)Argentina
Integrated
Telecommunication
Services
Fintech Telecom, LLC;
Cablevisión Holding
S.A. (BASE:CVH)
1,812.7 11.8 4.4 17.6 32.4
4/2/2018 3/28/2018Vega Solar 6, S.A.P.I. de
C.V.Mexico Renewable Electricity
Atlas Renewable
Energy1,300.0 - - - -
4/13/2018 -Gas Natural S.A. ESP.
(BVC:GASNATURAL)Colombia Gas Utilities
Brookfield
Infrastructure Partners
L.P. (NYSE:BIP)
1,035.0 6.7 1.1 7.6 12.0
6/29/2018 -Corporación Nacional del
Cobre de ChileChile Copper Chile 1,000.0 - - - -
4/24/2018 -
Shell Compania Argentina
De Petroleo S.A. and
Energina Compañía
Argentina de Petróleo S.A
ArgentinaOil and Gas Refining and
Marketing
Raízen Combustíveis
S.A.950.0 - 0.38 - -
1/26/2018 - Quicorp S.A. Peru Drug RetailInRetail Perú Corp.
(BVL:INRETC1) 583.0 12.0 0.47 - -
6
$0
$5,000
$10,000
$15,000
$20,000
$25,000
$30,000
$35,000
US
D (
$m
m)
Deal Value by Sector (2015 – 2018 LTM)
2015 2016 2017 2018
Deal Activity in Latin America:Sector Trends LTM Y-o-Y
7
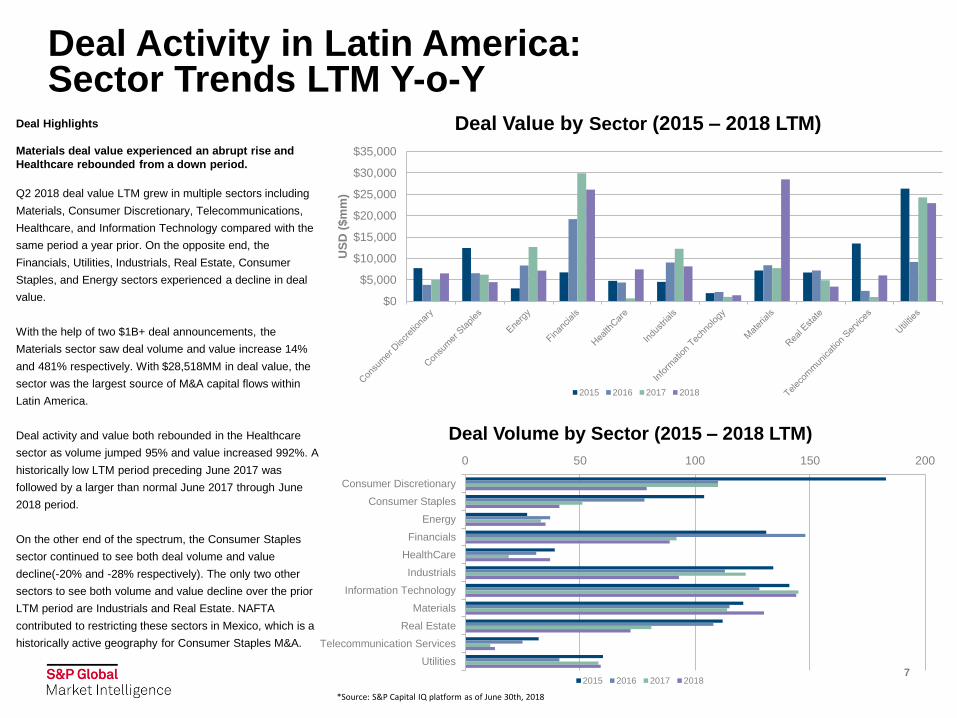
Deal Highlights
Materials deal value experienced an abrupt rise and
Healthcare rebounded from a down period.
Q2 2018 deal value LTM grew in multiple sectors including
Materials, Consumer Discretionary, Telecommunications,
Healthcare, and Information Technology compared with the
same period a year prior. On the opposite end, the
Financials, Utilities, Industrials, Real Estate, Consumer
Staples, and Energy sectors experienced a decline in deal
value.
With the help of two $1B+ deal announcements, the
Materials sector saw deal volume and value increase 14%
and 481% respectively. With $28,518MM in deal value, the
sector was the largest source of M&A capital flows within
Latin America.
Deal activity and value both rebounded in the Healthcare
sector as volume jumped 95% and value increased 992%. A
historically low LTM period preceding June 2017 was
followed by a larger than normal June 2017 through June
2018 period.
On the other end of the spectrum, the Consumer Staples
sector continued to see both deal volume and value
decline(-20% and -28% respectively). The only two other
sectors to see both volume and value decline over the prior
LTM period are Industrials and Real Estate. NAFTA
contributed to restricting these sectors in Mexico, which is a
historically active geography for Consumer Staples M&A.
0 50 100 150 200
Consumer Discretionary
Consumer Staples
Energy
Financials
HealthCare
Industrials
Information Technology
Materials
Real Estate
Telecommunication Services
Utilities
Deal Volume by Sector (2015 – 2018 LTM)
2015 2016 2017 2018
*Source: S&P Capital IQ platform as of June 30th, 2018
Deal Activity in Latin America:LTM Y-o-Y by Largest Subsector
8
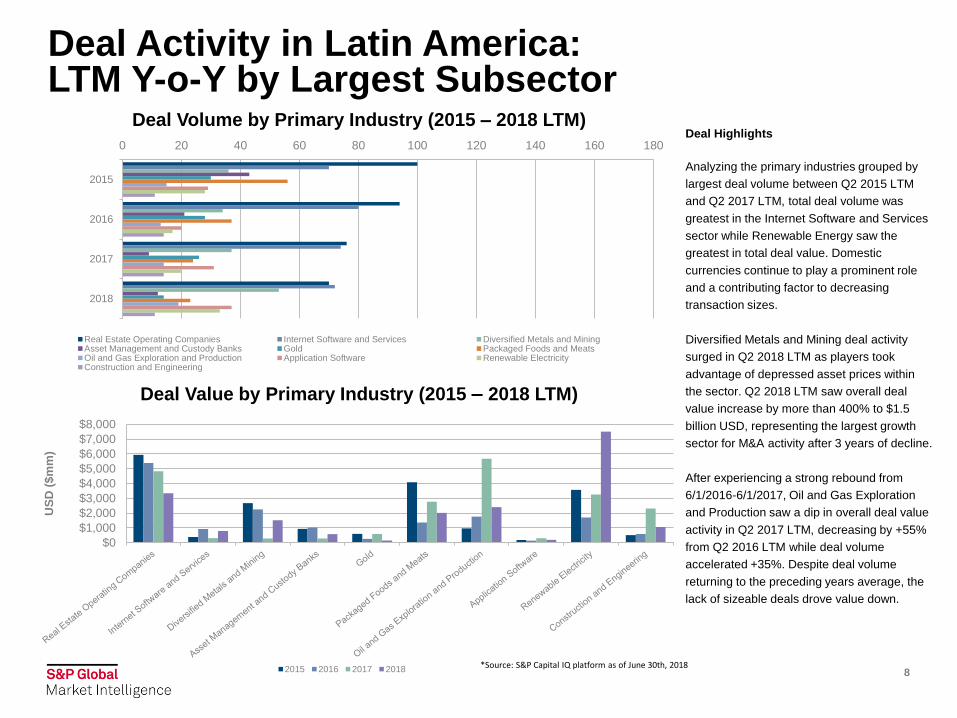
Deal Highlights
Analyzing the primary industries grouped by
largest deal volume between Q2 2015 LTM
and Q2 2017 LTM, total deal volume was
greatest in the Internet Software and Services
sector while Renewable Energy saw the
greatest in total deal value. Domestic
currencies continue to play a prominent role
and a contributing factor to decreasing
transaction sizes.
Diversified Metals and Mining deal activity
surged in Q2 2018 LTM as players took
advantage of depressed asset prices within
the sector. Q2 2018 LTM saw overall deal
value increase by more than 400% to $1.5
billion USD, representing the largest growth
sector for M&A activity after 3 years of decline.
After experiencing a strong rebound from
6/1/2016-6/1/2017, Oil and Gas Exploration
and Production saw a dip in overall deal value
activity in Q2 2017 LTM, decreasing by +55%
from Q2 2016 LTM while deal volume
accelerated +35%. Despite deal volume
returning to the preceding years average, the
lack of sizeable deals drove value down.
0 20 40 60 80 100 120 140 160 180
2015
2016
2017
2018
Deal Volume by Primary Industry (2015 – 2018 LTM)
Real Estate Operating Companies Internet Software and Services Diversified Metals and MiningAsset Management and Custody Banks Gold Packaged Foods and MeatsOil and Gas Exploration and Production Application Software Renewable ElectricityConstruction and Engineering
$0
$1,000
$2,000
$3,000
$4,000
$5,000
$6,000
$7,000
$8,000
US
D (
$m
m)
Deal Value by Primary Industry (2015 – 2018 LTM)
2015 2016 2017 2018*Source: S&P Capital IQ platform as of June 30th, 2018
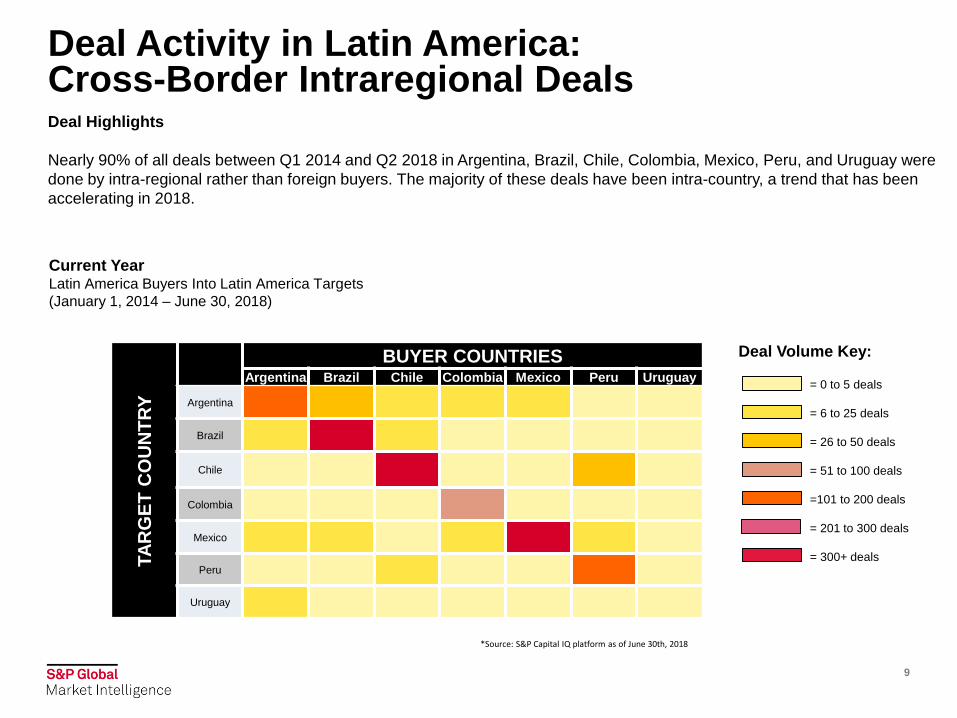
Deal Activity in Latin America:Cross-Border Intraregional DealsDeal Highlights
Nearly 90% of all deals between Q1 2014 and Q2 2018 in Argentina, Brazil, Chile, Colombia, Mexico, Peru, and Uruguay were
done by intra-regional rather than foreign buyers. The majority of these deals have been intra-country, a trend that has been
accelerating in 2018.
9
Deal Volume Key:
= 0 to 5 deals
= 6 to 25 deals
= 26 to 50 deals
= 51 to 100 deals
=101 to 200 deals
= 201 to 300 deals
= 300+ deals
Current YearLatin America Buyers Into Latin America Targets
(January 1, 2014 – June 30, 2018)
TA
RG
ET
CO
UN
TR
Y
BUYER COUNTRIESArgentina Brazil Chile Colombia Mexico Peru Uruguay
Argentina
Brazil
Chile
Colombia
Mexico
Peru
Uruguay
*Source: S&P Capital IQ platform as of June 30th, 2018

Deal Activity in Latin America:Cross-Border Deal Count
10
WHO’S BUYING INTO LATIN AMERICA
AND IN WHICH SECTORS?
Taking advantage of strong currencies and seeking
returns in excess of developed benchmarks,
investors from the United States and Canada made
those two countries the leading foreign investors in
the Latin America. Canadian companies
predominantly pursued opportunities in the Material
industry resulting in 46 deals.
U.S. companies demonstrated a strong interest in
Latin American Information Technology companies.
As this sector is not typically considered a strength
within Latin America, U.S. interest in the industry
indicates some promise of diversification away from
natural resources.
Materials – 15
Information Technology – 8
Materials – 11
Information Technology – 8
Materials – 5
Materials – 4
Information Technology – 1
Mexico
Colombia
Peru
Brazil
Chile
Argentina
TOP TWO FOREIGN INVESTORS (DEAL
VOLUME INTO LATIN AMERICA TARGETS
(January 1, 2018 – June 30, 2018)
Canada
United States
Materials – 5
Information Technology – 2
Source: S&P Capital IQ platform, data as of June 30th, 2018. Numbers represent deal volume in that sector.
Materials – 6
Financials – 2
Utilities – 5

Latin America Key Metrics & Financials Sector Analysis
11
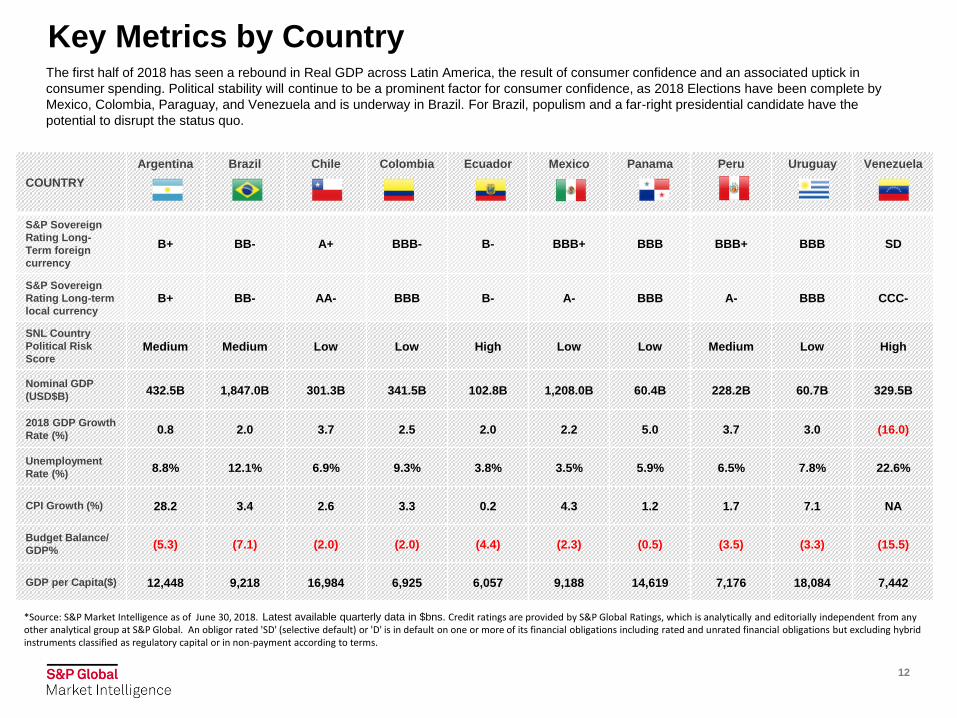
Key Metrics by CountryThe first half of 2018 has seen a rebound in Real GDP across Latin America, the result of consumer confidence and an associated uptick in
consumer spending. Political stability will continue to be a prominent factor for consumer confidence, as 2018 Elections have been complete by
Mexico, Colombia, Paraguay, and Venezuela and is underway in Brazil. For Brazil, populism and a far-right presidential candidate have the
potential to disrupt the status quo.
12
*Source: S&P Market Intelligence as of June 30, 2018. Latest available quarterly data in $bns. Credit ratings are provided by S&P Global Ratings, which is analytically and editorially independent from any other analytical group at S&P Global. An obligor rated 'SD' (selective default) or 'D' is in default on one or more of its financial obligations including rated and unrated financial obligations but excluding hybrid instruments classified as regulatory capital or in non-payment according to terms.
COUNTRY
Argentina Brazil Chile Colombia Ecuador Mexico Panama Peru Uruguay Venezuela
S&P Sovereign
Rating Long-
Term foreign
currency
B+ BB- A+ BBB- B- BBB+ BBB BBB+ BBB SD
S&P Sovereign
Rating Long-term
local currencyB+ BB- AA- BBB B- A- BBB A- BBB CCC-
SNL Country
Political Risk
ScoreMedium Medium Low Low High Low Low Medium Low High
Nominal GDP
(USD$B)432.5B 1,847.0B 301.3B 341.5B 102.8B 1,208.0B 60.4B 228.2B 60.7B 329.5B
2018 GDP Growth
Rate (%)0.8 2.0 3.7 2.5 2.0 2.2 5.0 3.7 3.0 (16.0)
Unemployment
Rate (%)8.8% 12.1% 6.9% 9.3% 3.8% 3.5% 5.9% 6.5% 7.8% 22.6%
CPI Growth (%) 28.2 3.4 2.6 3.3 0.2 4.3 1.2 1.7 7.1 NA
Budget Balance/
GDP%(5.3) (7.1) (2.0) (2.0) (4.4) (2.3) (0.5) (3.5) (3.3) (15.5)
GDP per Capita($) 12,448 9,218 16,984 6,925 6,057 9,188 14,619 7,176 18,084 7,442
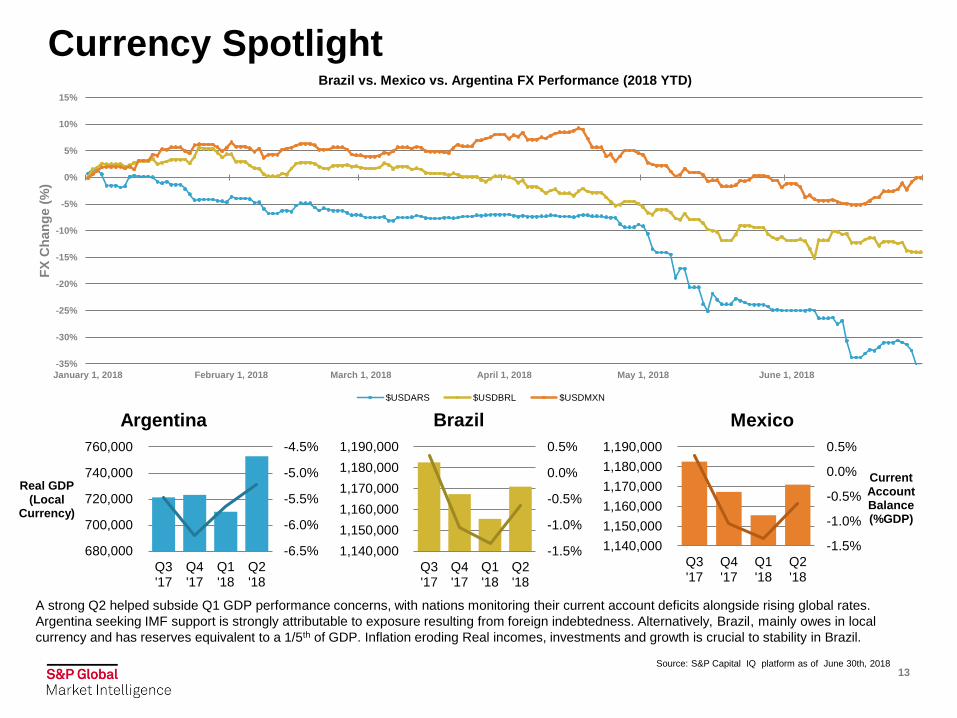
Currency Spotlight
13
-6.5%
-6.0%
-5.5%
-5.0%
-4.5%
680,000
700,000
720,000
740,000
760,000
Q3'17
Q4'17
Q1'18
Q2'18
Real GDP (Local
Currency)
Argentina
-1.5%
-1.0%
-0.5%
0.0%
0.5%
1,140,000
1,150,000
1,160,000
1,170,000
1,180,000
1,190,000
Q3'17
Q4'17
Q1'18
Q2'18
Brazil
-1.5%
-1.0%
-0.5%
0.0%
0.5%
1,140,000
1,150,000
1,160,000
1,170,000
1,180,000
1,190,000
Q3'17
Q4'17
Q1'18
Q2'18
Current Account Balance (%GDP)
Mexico
A strong Q2 helped subside Q1 GDP performance concerns, with nations monitoring their current account deficits alongside rising global rates.
Argentina seeking IMF support is strongly attributable to exposure resulting from foreign indebtedness. Alternatively, Brazil, mainly owes in local
currency and has reserves equivalent to a 1/5th of GDP. Inflation eroding Real incomes, investments and growth is crucial to stability in Brazil.
-35%
-30%
-25%
-20%
-15%
-10%
-5%
0%
5%
10%
15%
January 1, 2018 February 1, 2018 March 1, 2018 April 1, 2018 May 1, 2018 June 1, 2018
FX
Ch
an
ge (
%)
Brazil vs. Mexico vs. Argentina FX Performance (2018 YTD)
$USDARS $USDBRL $USDMXN
Source: S&P Capital IQ platform as of June 30th, 2018
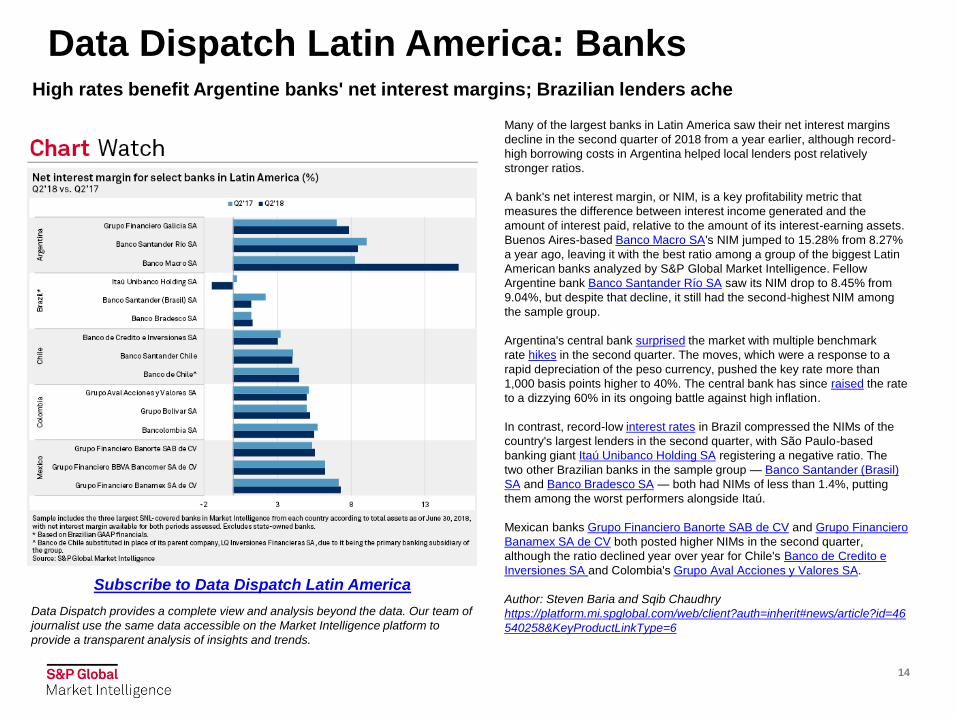
Data Dispatch Latin America: Banks
14
Many of the largest banks in Latin America saw their net interest margins
decline in the second quarter of 2018 from a year earlier, although record-
high borrowing costs in Argentina helped local lenders post relatively
stronger ratios.
A bank's net interest margin, or NIM, is a key profitability metric that
measures the difference between interest income generated and the
amount of interest paid, relative to the amount of its interest-earning assets.
Buenos Aires-based Banco Macro SA's NIM jumped to 15.28% from 8.27%
a year ago, leaving it with the best ratio among a group of the biggest Latin
American banks analyzed by S&P Global Market Intelligence. Fellow
Argentine bank Banco Santander Río SA saw its NIM drop to 8.45% from
9.04%, but despite that decline, it still had the second-highest NIM among
the sample group.
Argentina's central bank surprised the market with multiple benchmark
rate hikes in the second quarter. The moves, which were a response to a
rapid depreciation of the peso currency, pushed the key rate more than
1,000 basis points higher to 40%. The central bank has since raised the rate
to a dizzying 60% in its ongoing battle against high inflation.
In contrast, record-low interest rates in Brazil compressed the NIMs of the
country's largest lenders in the second quarter, with São Paulo-based
banking giant Itaú Unibanco Holding SA registering a negative ratio. The
two other Brazilian banks in the sample group — Banco Santander (Brasil)
SA and Banco Bradesco SA — both had NIMs of less than 1.4%, putting
them among the worst performers alongside Itaú.
Mexican banks Grupo Financiero Banorte SAB de CV and Grupo Financiero
Banamex SA de CV both posted higher NIMs in the second quarter,
although the ratio declined year over year for Chile's Banco de Credito e
Inversiones SA and Colombia's Grupo Aval Acciones y Valores SA.
Author: Steven Baria and Sqib Chaudhry
https://platform.mi.spglobal.com/web/client?auth=inherit#news/article?id=46
540258&KeyProductLinkType=6
Subscribe to Data Dispatch Latin America
High rates benefit Argentine banks' net interest margins; Brazilian lenders ache
Data Dispatch provides a complete view and analysis beyond the data. Our team of
journalist use the same data accessible on the Market Intelligence platform to
provide a transparent analysis of insights and trends.
Behind The DataThe information in this publication was aggregated using data from S&P Global Market Intelligence. Request a trial and
find out how our platform solutions – S&P Capital IQ and Market Intelligence – can provide you with vast market data,
deep sector content, and an array of tools for analysis, ideation, and efficiency.
S&P Global Market Intelligence offers private company financials for Brazil as part of our comprehensive database of
standardized and comparable financial data for public and private companies. With the addition of timely, transparent, and
comparable financial data for over 10,000 Brazilian private companies, combined with our powerful analytics, S&P Global
Market Intelligence gives you the power to assess risk and uncover opportunities that others may not even see – in Brazil
and across the globe.
15
* For Illustrative Purposes Only

Contact Us
Brazil
Pedro Arlant
Director
+55 11 3818 4109
Mexico
Juan Carlos Perez Macias
Director
+52 55 1037 5260
All Regions
16
Disclosures
Copyright © 2018 by S&P Global Market Intelligence, a division of S&P Global Inc. All rights reserved.
These materials have been prepared solely for information purposes based upon information generally available to the public and from sources believed to be reliable. No
content (including index data, ratings, credit-related analyses and data, research, model, software or other application or output therefrom) or any part thereof (Content)
may be modified, reverse engineered, reproduced or distributed in any form by any means, or stored in a database or retrieval system, without the prior written permission
of S&P Global Market Intelligence or its affiliates (collectively, S&P Global). The Content shall not be used for any unlawful or unauthorized purposes. S&P Global and any
third-party providers, (collectively S&P Global Parties) do not guarantee the accuracy, completeness, timeliness or availability of the Content. S&P Global Parties are not
responsible for any errors or omissions, regardless of the cause, for the results obtained from the use of the Content. THE CONTENT IS PROVIDED ON “AS IS” BASIS.
S&P GLOBAL PARTIES DISCLAIM ANY AND ALL EXPRESS OR IMPLIED WARRANTIES, INCLUDING, BUT NOT LIMITED TO, ANY WARRANTIES OF
MERCHANTABILITY OR FITNESS FOR A PARTICULAR PURPOSE OR USE, FREEDOM FROM BUGS, SOFTWARE ERRORS OR DEFECTS, THAT THE CONTENT’S
FUNCTIONING WILL BE UNINTERRUPTED OR THAT THE CONTENT WILL OPERATE WITH ANY SOFTWARE OR HARDWARE CONFIGURATION. In no event shall
S&P Global Parties be liable to any party for any direct, indirect, incidental, exemplary, compensatory, punitive, special or consequential damages, costs, expenses, legal
fees, or losses (including, without limitation, lost income or lost profits and opportunity costs or losses caused by negligence) in connection with any use of the Content even
if advised of the possibility of such damages.
S&P Global Market Intelligence’s opinions, quotes and credit-related and other analyses are statements of opinion as of the date they are expressed and not statements of
fact or recommendations to purchase, hold, or sell any securities or to make any investment decisions, and do not address the suitability of any security. S&P Global
Market Intelligence may provide index data. Direct investment in an index is not possible. Exposure to an asset class represented by an index is available through
investable instruments based on that index. S&P Global Market Intelligence assumes no obligation to update the Content following publication in any form or format. The
Content should not be relied on and is not a substitute for the skill, judgment and experience of the user, its management, employees, advisors and/or clients when making
investment and other business decisions. S&P Global Market Intelligence does not act as a fiduciary or an investment advisor except where registered as such. S&P
Global keeps certain activities of its divisions separate from each other in order to preserve the independence and objectivity of their respective activities. As a result,
certain divisions of S&P Global may have information that is not available to other S&P Global divisions. S&P Global has established policies and procedures to maintain
the confidentiality of certain non-public information received in connection with each analytical process.
S&P Global may receive compensation for its ratings and certain analyses, normally from issuers or underwriters of securities or from obligors. S&P Global reserves the
right to disseminate its opinions and analyses. S&P Global's public ratings and analyses are made available on its Web sites, www.standardandpoors.com (free of charge),
and www.ratingsdirect.com and www.globalcreditportal.com (subscription), and may be distributed through other means, including via S&P Global publications and third-
party redistributors. Additional information about our ratings fees is available at www.standardandpoors.com/usratingsfees.
17