Embed Size (px)
Citation preview

AD
REPORT WJNMBER 1
THE PERMEABILITY OF THE SKIN TO GASES
ANNUAL REPORT
BY
Robert J. Scheuplein
Department of DermatologyHarvard University Medical SchoolFMssachusetts General Hospital
Boston, Massachusetts 02114
Grant No. DAHC 19-69-G-0018
June 1970
Life Sciences DivisionArmy Research Office
3045 Columbia PikeArlington, Virginia 22204
This document has been approved for public release and sale;its distribution is unlimited.
DDC
27 1970
Project Title: Permeability of the Skin to Gases
Summary
This summary covers the work done on the project during the first
year period 1 June 1969 - 1 June 1970. (Army project number 2N061102B71D;
grant number DAHC 19-69-G-00l8]. -----
I. Introduction
The pu.:pose of this work is to determine the permeability of the
intact human epidermis to gases and vapors. The transport properties
of the unhydrated stratum corneum are virtually unknown. By measuring
the sorption and diffusion rates of homologous series of selected gases
and vapors we hope to be able to establish the mechanism of gas or
vapor phase diffusion through the skin. A specific aim of this work
is to measure the effect of hydration on the permeability of gases.
The effect of hydration is important because the interior surface of
the skin's barrier layer is normally hydrated and even small amounts
of moisture can significantly alter the physical structure of this
tissue.
II. Research Rationale
As emphasized in the original grant application, diffusion data
on stratum corneum could be obtained from two independent kinds of
experiments, i.e. permeation measurements and sorption measurements.

The former requires an intact sheet of tissue or membrane which is
used as a diaphragm between two chambers, one containing the vapor
whose rate of diffusion through the membrane is to be measured.
Analyses of the rate of permeation lead to a value for the diffusion
constant D and for the solubility S. Sorption measurements do not
require an intact membrane, these experiments require only pieces of
tissue which are suspended from the arm of a sensitive microbalance
into a concentrdtion of vapor. Sorption measurements also yield
values for D and S. But it is in the comparison between these two
sets of values that significant information is obtained.
During the first year sorption measurements were made on the
series of linear alkanes and alcohols. Permeation measurements of
a limited nature were made on many of these same substances using
their infrared absorption as an analytical technique. Final and
more precise measuremerts of permeation will be made using a vacuum
manifold and a quartz crystal microbalance technique; progress in
the construction and use of this apparatus is described.
III. R~sults
A. Gas Permeation by Infrared Absorption
The IR absorption bonds near 2970-2930 cm" of the alkanes and
those near 1032-1052 for the alcohols were made the basis of their
concentration measurement.
I ii

Steady state penetration rates of the linear alkanes (from
C4 - C10 ) and of H20, methanol, and ethanol were measured through
epidermal membranes. From these data diffusion constants and per-
meability constants were computed.
Discussion
The permeability of alkanes increases with the number of methy-
lene groups in the molecule from 0.01 cm hr-l for butane to 0.2 cm hr"1
for decane. Permeation rates of alkenes with three of few methylene
groups were too small to be measured with this technique. The corres-
ponding alcohols (C1 - C3 ) had higher permeabilities. Water vapor
penetrated faster than any of the alcohols or alkanes.
The infrared (IR) technique was useful to get an approximate
idea of the permeability of the gases. But it was not sensitive
enough to measure the penetration rates of all the alkanes and al-
cohols, and this comparison is crucial.
B. Gas Sorption
(1) Sorption rates of alkane vapors (C3 C16) and alcohol
vapors (C1 - C10 ) were measured. Diffusion constants corresponding
to the initial rate of sorption were computed. These were greater
for the alkanes than for the corresponding alcohol from (C1 - C)
but were very similar beyond CII. The alkane diffusion constants
were inversely proportional to the square root of the molecular
weight.
iii

/
(2) The solubility of each gas or vapor in dry stratum
corneum was measured from the amount of gas sorbed at equilib-
rium. Alcohols were many times more soluble than the corres-
ponding alkanes between (Cl - C10 ); the higher members of both
series tended to converge toward similar solubilities. The
a solubility of the alkanes increased expotentially with an
increasing number of methylene groups; alkanes with less then
three methylene groups were not measurably sorbed by the tis-
sue.
(3) The sorption isotherm of pentane (300C) a represent-
ative alkane, was obtained. It was approximately linear up
to a pentane mole fraction of 0.5 but then increased more rap-
idly at higher mole fractions. Henry's law is a poor approxi-
mation to vapor solubilities at saturation for stratum corneum.
(4) Sorption and desorption curves were measured for re-
presentative members of each homologous series. These curves
were not superimposable thus showing that the diffusion constants
for the vapors actually are functions of concentration.
(5) There is evidence that continued contact with alkane
or alcohol vapors increases the effective surface area of the
stratum corneum. Solubilities obtained after long contact with
these vapors were three times higher than those measured initially.
Discussion
From the present data there is no evidence that vapor diffusion
involves transport through holes in the tissue. The evidence ob-
iv

tained suggests that substances applied as vapors must dissolve
into the tissue per se. in order to penetrate. Their diffusionIconstants are from one to two orders of magnitude lower than for
the same substances applied as liquids. Whether the same conclu-
sion applies to gases (i. e. non-condensable at room temperature)
remains to be seen. The gases and the insoluble alkanes penetrate
too slowly to be measured by the IR technique; their rates will
be obtained with the aid of our new quartz crystal oscillator
technique. (See below).
C. Gas Permeation Measured by the Quartz Sorption Detector
For precise measurements of diffusion rates of gases through
epidermis a high vacuum manifold was needed. This system consists
essentially of a diaphragm - diffusion cell suitable for epidermal
membranes, a vacuum apparatus for evacuating this cell and for sup-
plying test gasea and a quartz crystal sorption detector for meas-
uring their rat,! of accumulation in the receptor portion of the di'f-
fusion cell. This apparatus has now been constructed and has been
sucessfully tested using the known diffusion behavior of water.
. . . . . . . . . . .. . . .. . .. . . . ... .. . . .. . . . . . . . . . . .. . . . . .. .. . .. . . . .u . . . . . . . . .. . . . .. . .. . . . . . .. .. . .. . .. .

Foreword
This report covers the first year's work on theproject.. I
No copyrighted material has been quoted.
vi

FErRMEABIUaTY OF TJHE SKIN TO GASES
Table of Contents
Summary.............................................
Foreword...................i
List of Tables ...................................... vii
List of Figures ................... 0................. viii
MeLasurement of Vapor Transport by I. R. Absorption... 1
Theory and Analysis of Data ....o..............Experimental Results........................ 5Discussion ................. ......... #......7
Meesurement of Vapor Sorption ............ #............. 8Theory and Mathematical Formulae .......o..... 10Experimental Results ........................12Discussion..............0........ 0.... 21
Measurement of Gas and Vapor Transport with Quartz
Crystal Oscillator............... o... .............o.29
List of References.................................

LIST OF TABLES
Table Title l's ge
I. Data on Vapor Penetration by I. R .................
II. Sorption Data on Alkanes..........................14
III. Sorption Data on Alcohols ......................... 17
IV. Diffusion Data for the Alkanes from Sorption
- Experiments .................................. 22
V. Diffusion Date for the Alcohols from SorptionExpei-ments .......... ..................... 23
Vi. Pentane Sorption Dete at 300C........... ....... 27
vii

LIST OF FIGURES
Figure Title Page
1. I. R. Trarlsrittancy (lag Ts) vs. time .... 5F
2. Vapor Sorption Apparatus ................ l1OF
3. Pentane Sorption'Curves ................ a.......15F
.4. Pentane Isotherm at 30 0C ..... o.o........ l16F
5. Solubility of the Alcohols and Alkanes vs.carbon --umber "n"....................18F
6. Log of S vs. "ni"............ ...................... 19F
7. Sorption curve for butanol ..................... 21'
8. Diffusion constants for the Alcohols andAlkanes ...........o............. o...... o 22?
0. Alkane diffusion constants vs ... 24
10. Sorption and Desorption of Pentane.............26F
viii

Measurement of vapor transport by iR absorption
Epidermal membranes, carrying the intact stratum corneum
were fitted as diaphragms separating two halves of a diffusion
chamber. The donor half contained an isolated reservoir with
s 'few ml of the test liquid part of which vaporized and thus
served as constant vapor supply to the membrane. The receptor
half of the system was a one meter, folded path IR absorption
cell. This cell was fitted with a fan which assured thorough
and rapid mising of the vapor which diffused through the mem-
brane.
Theory and Mathematical Formulae
The permeability of the membrane to the particular vapor
was obtained from the rate at which the absorbancy of the gasi in the IR gas cell increased. The increase in absorbancy was
related to the corresponding increase in concentration by pre-
vious calibration of the individual gases using their published ..... ....
vapor pressures. (See Table I, Columns 1 - 4). The equations
-l ri2d below show the relationship between these units and the
standard permeability parameters.

Basic assumptions
We consider the system to be a case of diffusion through
a plane sheet or membrane of thickness & and diffusion coeffi-
cient D, whose surfaces, x = o and x = are maintained at
constant concentrations C1 and C2 respectively. At steady
state, integration of the one dimensional diffusion equation
leads to s constant rate of transfer across all sections of
the membrane given by:
In our case the surface concentrations C and C2 are not known
but only the vapor pressure P1 and P2 on the two sides of the
membrane. The rate of transfer in the steady state becomes:
I7 -
and P is referred to as the permeability constant. If the
diffusion constant D is constant, i.e. not dependent on con-
centration as it might be if the tisaue gradually degraded
on contact with the vapor, and if the vapor sorption iso-
therm is linear, than equations (1) and (2) are equivalent.
IThe linear isotherm may be written
C = (3)R7-
where C is the surface concentration of the vapor on the
2

membrane in quilibrium with an external vapor presaure p,
and S is the solubility. Using all three equations we may
write
Instead of using vapor pressures one may use external vapor
concentrations and remove the RT factor since Po Co RT, where
.C O refers to external vapor concentration on the x = o side
of the membrane. We have
2S(.-C) =k 6c ()J7.
where our new permeability constant S -
Analysis of the data
Vapor flux through the membrane of area A will increase
the concentration of the gas in the receptor (initially zero)
in accord with equation (5). The flux by definition is the
number of moles of substance,-n. crossing a square cm of
membrane per unit time or
Relating -to concentration, Cs =__ where V is the receptorIV
volume, and relating Cs to the corresponding absorbancy
3

As = kcl we may rewrite equation (6) in the form
A -L 0'0F 4CS(7
The right hand side of equation (7) can be simplified further
since A C = C - C6 - Co since the experiment can be termin-
ated before C6 is significant compared with Co. Also sinceAoCo -k where k = absorbency index and 1= light path
length of gas cell, we have:
A #~ 1 ;tt hr k a. (7b)
or
V -As4 ~ 84, AA d t 9-
The permeability constant k apart from the factor f can bep
obtained directly from the slope of the linear portion of the
vs. t curve. Values of f for specific vapors are listed
in Tcble I, column 5. c
Other numerical constants are:
__.__A -- area of exposed membrane = 3.43 cm
V - volume of receptor chamber = 1,020 cm3
1 - path length of gas cell 100 cm
14

Experimental Results
Data obtained for vapor penetration by the infrared ab-
sorption technique is listed in Table I, columns 6, 7, and 8.
Not all the simple alcohols and alkanes could be run owing to
the insensitivity of the method in these cases. The sensi-
tivity of the technique is determined by the absorbance of the
gas at its normal Saturated vapor pressure and the rate at
which it penetrates. The product of ab~orbance, vapor pres-
sure and rate of penetration is reflected in the magnitude
of As eg. (8). The average values of dA$5 obtained
for the various vapors are given in column (6) i.e. by the
slope of the As vs t plot = m . (See the example in Figur
1). When this number was greater than o.O1 units of absorb-
ancy per hour, measurements could satisfactorily be made in
a reasonable amount of time. When m (O.O1 measurements were
correspondingly more lengthy, and less precise. From column
(6) it can be seen that several of the determinations, fall
into the marginal class. For the alcohols only methanol and
ethanol could be measured and for the alkanes only those be-
tween butane and decane.
5
5I

111..---*.WvY wwq inrw 77y.".
IR TRANSMITTANCY (log T5)
D20 DECANE0.97
0.96- 0.98kP6.7 cm hr-i
0.95 -0.97
00
0.92- 0.94
0.91 0.93
0.90 '0.92 -0 4 8 12 0 4 8 12 16 20 24 28
t (hours)
Figure 1. Rate of decrease of the I. R. Transmission of the
folded path 1 meter gas cell. Two experiments
are plotted corresponding to D20 (c' =l1434 cm-1)
and decane (-=2930 cm- 1) permeation.

0
OCu
.wz Lr. N cu r- .I -H00 cmle000 000000 0 c
U) MOO0 000000 0
0- 0O Oj HH r-OO 0t
P4 N 000 000000 C
0 pq
00 riU-NCO m NU,\
it0 -'** .l\. .l-tIiL\-t 0 c' U-\
QJi ItrH\ -l-tC l L\GNMc
0 .O)0U rjr
OS rl H: 0- n~~\ :I
.- 0H~ OH TC\OOO~ UaDo :,li0
0-O V COuV
CU~,C cr-i-t oLr -m r .
05 a I . . H C COj 000 CN 00000 0
Cuj
to 000 H
p N + L6
pa OoC.)oDuoI

Discussion of Results
Magnitude of Permeability Constant
The measured permeability constants for the alcohol and
alkane vapors are given in Table I column (7).. This is the
parameter kp = which is defined by equation (5). The
first thing one notices about these numbers is their generally
large values compared to corresponding solution phase permea-
bility constants for the same molecules dissolved in water.
For example, in the following table it can be seen that for
methanol and ethanol the gas phase k 'a are respectively 500p
and 25 times larger than the corresponding values obtained
in aqueous solution.
Molecule Gas Phase H20 Solution Phase
kp (cm hr-l) S k p (cm hr 1) Km
H20 3.8 2560 0.5 10-3 0 .6
MEOH 0.27 260 0.5 x 10 - 3 0.6
ETOH 0.02 140 o.8 x l0-3 0.9
The k for water is 8000 times greater in the gas phase than
it is for the liquid. From the definition of kp it is clear
that gas phase permeabilities are characterized by a much
larger diffusion constant D or a much larger solubility S
or both. (As shown below, after gas sorption data is presented,
the factor responsible is the solubility S which is much greater
7

//
than its corresponding equivalent,,p,. t , .-.n analyzing
soluti on permeability).
B. Changes in kp with the chemical nature of the gas/, 7
The main purpose of measuring the gas permeabilities
by the IR method was to get some estimate of their permeabil-
ities which would help in the design and planning of a more
suitable experimental method. From Table I it is clear
that one cannot assess the role of functional groups on the
permeability of these vapors using this method. The main
reason is that corresponding acids and alcohols cannot be )compared - the method is too insensitive for the alcohols
with carbon number greater than C3 and for the alkanes less
than C4. The discussion of this question must be postponed
until data is obtained with the much more sensitive Quartz
crystal oscillator technique.
Progress in this area is discussed below. !
Yiessurement of Vapor Sorption
It is clear from the foregoing di3cussion that indepen-
dent measurements of D and S are necessary in order to inter-
pret the observed permeability constant which depends upon both
parameters. e.g. eq (5). This was foreseen in the original
8

experimental protoco] which emphasized that independent de-
terminations of the solubility of the gas in the tissuA could
be made gravimetrically by gas sorption techniques.
The method is simply to suspend a known amount of tissue
from the beam of a microbalance into a known vapor pressure
of the gas and measure the amount absorbed at equilibrium.
In addition, the value of the diffusion constant can be ob.-
tained by analyzing the rate of gas sorption. Thus D and S
can both be obtained in a single experiment. It should be
emphasized that the diffusion constant obtained in this way
is an average value if D depends on concentration. Alac
this D represents true diffusion through the tissue whereas
the one computed from permeability measurements by the re-
lation k= - may not be. The reason is that if holes
exist in the membrane, the flux of gas through it will be
greater than If they do not. If the flux is greater for this
reason, then the measured permeability constant and the value
of D computed from it will be higher. The presence of holes
in the tissue does not affect sorption or desorption measure-
ments since they depend on the rate at which gas molecules
actually chemically bonded in the tissue move. It is there-
fore very useful to measure the diffusion constant both ways
and see if they are comparable. If they agree one can be cer-
tain that if holes do exist they are too small or too few to
appreciably enhance permeability.

The Cahn balance shown in Figure 2 was used fo the sorption
experiments. The glass jacketed vessel on the left is the water
controlled constant temperature "air bath" into wh ch the sample
is suspended. A small quantity of liquid in the bo tom furnishes
a constant source of vapor.
Theory and Mathematical Formula
,For the case of rption and desorption by a m mbrane of
thickness , where Mt denotes the total amount of diffusing
sul- :nce which has entered the sheet at time t, a M the
corresponding quantity after infinite time, it can e shown:
(crank p 45)
The corresponding solution useful for small times is
2 (gI( ) )l
The application of either equation is based on tha assumption'
that the uptake is a diffusion process controlled by a constant
diffusion coefficient D and that immediately the co centration
at each surface of the membrane attains a constant equilibrium
value. The membrane is considered tc be initially ree of
vapor. From eq (9) the value of t/ts for which Mt =
10

Figure 2 - Vapor sorption apparatus.

is given by
[•, - t~ .(1_/)i./? z
approximately, the error being about-0.001 percent.
Thus we have:
-. (12)
and so, if the half time of a sorption process is observed
experimentally, the value of the diffusion constant (assumed
to be constant) can be simply determined from eq (12).
It is also possible to deduce an average diffusion coefficient
(or the true one if D is constant) from the initial gradient
of the sorption curve when plotted against the square root of
time. From eq (10) at early times when the error function term
can be neglected we have
A ~ -o -/3)
If the initial gradient C/- 4/ is observed the dif-
fusion constant is
.p = 7r-' ' ',
The average thickness of the stratum corneum membrane is
approximately 8 P so (14)becomes
1 11

Experimental Results on Vapor Sorption
Rationale for experiments
One of the main purposes of measuring diffusion coefficients
by both permeability and sorption techniques is to learn
whether there is appreciable transport through "holes" or
micropores in stratum corneum. If such gas phase diffusion
does exist then a comparison of the diffusion coefficients
obtained by the two different techniques should reveal it.
The reason is, as mentioned-above; v. a. p 9, thatrapid
transport through "holes" increases the permeability con-
stant but has no affect on a sorption experiment. There-
fore the diffusion constant D computed frcm the permeabil-
ity constant by the expression:
A 45)
will be correspondingly higher than that computed by the
sorption expressions: eqs (12) or (14).. In order to com-
pute D from (5) Solubility S must be measured and of course
must be known. However, both methods of analysis involve
so that for a relative comparison only the value of S is
required. S, the so-called solubility of the gas in the tis-
sue, is the ratio of the density of the gas within the surface
regions of the tissue in equilibrium with the external vapor to
12

the density of that external vapor, thus S = C, = TCM4
Cm is that effective surface concentration which is presumed
to arise very rapidly just within the surface of the tissue
once the vapor is brought into contact with it. After a
long time the tissue will reach equilibrium or close enough
to it so that Cm will represent the concentration for the
entire tissue and not just the surface regions.
Nature of the Sorption Isotherm
As indicated in the discussion on page 2 one of the basic
assumptions underlying the general validity of eqs. (4) or (5)
is the presumed linearity of the vapor-tissue isotherm. This
assumption turns out to be quite untrue for stratum corneum
regardless of whether an alkane or an alcohol or H20 is the speci-
fic vapor. It is therefore imperative to know how this non-ideal
situation limits the usefulness of our equations and modifies
the interpretation of the data.
First it is clear that the purpose of utilizing the iso-
therm in the diffusion eqs (2) - (5) is simply to relate ex-
ternal vapor concentration, C0 to internal concentration.
COm. The assumed linearity of the isotherm simply makes eq (5)
simpler than it otherwise might be. For example if the isotherm.
were quadratic in p instead of linear in p, i.e. CRT S(p + ap2 ),
13

00 X
2 . .0
0 rn 0~~) 2) - -*t U1% to 0 ~0 0 0
-01 t~- A, A ~ C H u
DO I H H C U LC\ k
UCiU (n \0 !'C L- 0 co'.0 I,to 14C U H H H Hl\ Lr L-
4-,a UC U r
U- a'\ a't C\a u* w CO LI- u'0o 0 0 00 : Mmmn
CC) rn U\ 0\ --. t- t-- 0 (ON Cnc2 a, '0 CUi LC\ t- In~ L-\ U- - (
00 0 H- H- rH H- H 0 0 0
-% .0 '. --. CY) 0P. ir) cn o H- 0 (VI) m~ 0 0
02Sr mn Cr) H o c CU t- cr) CC) CVI) H 0 0 0D.0 CUO N o MV 0 '0 CU 0 0 0 0 CUj
0 H H CU CU 0 0 00 0
0 0 0 0tn-- 03 0 00UC 0 0 0 0 0 Lr\ _:t t -Z! H 0t
0, E-4 \10 \.0 '.0 \.0 CU _zt _ H00
r-4 ~ - ini '. : L\ \0 \,OaC)~~~C 0 0 0 0
I14
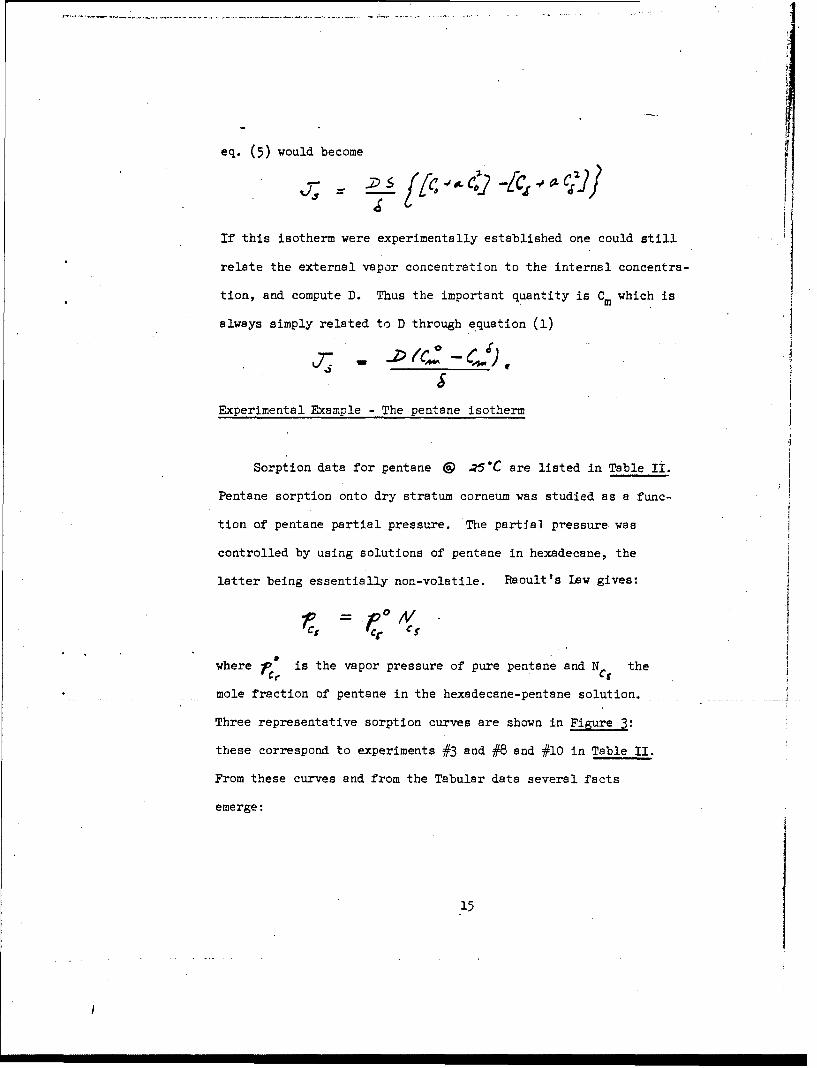
eq. (5) would become
If this isotherm were experimentally established one could still
relate the external vapor concentration to the internal concentra-
tion, and compute D. Thus the important quantity is Cm which is
always simply related to D through equation (1)
Experimental Example - The pentane isotherm
Sorption data for pentane ? ..'C are listed in Table Ii.
Pentane sorption onto dry stratum corneum was studied as a func-
tion of pentane partial pressure. The partlal pressure. was
controlled by using solutions of pentane in hexadecane, the
latter being essentially non-volatile. Raoult's Law gives:
r' = POA/V
h is the vapor pressure of pure pentane and NC the
mole fraction of pentane in the hexadecane-pentane solution.
Three representative sorption curves are shown in Figure 3:
these correspond to experiments f3 and #8 and #10 in Table II.
From these curves and from the Tabular data several facts
emerge:
15

PENTANE SORPTION AT 30 0 C"
0.7 *10
0.6
0.5 -
Moo(mg) 0.4
0.3
0.2
0.1 -f3
00 20 40 60 80 100 120 140 160 200
t (rIn.)Figure 3 - Typical pentane sorption curves corresponding to
experiments #3, #8 and #10 in Table VI. Note the
increasing uncertainty in the determination of
M as the concentration increases.

1) Pentane sorption deviates from an ideal angmuir type
isotherm as highe" concentrations are used. (Shown by
the increasing slope of the "horizontal" part of the
sorption curve.)
2) Equilibrium is achieved faster for low pentane concentra-
tions.
3) The sorption isotherm is not linear M., does not increase
in proportion to pentane mole fraction (For example pentane
sorption increases on the ratio from 1/9/16.5 while the
mole fraction ratios increase from 0.22/0.86/1.0 for the
three cases shown).
The isotherm itself constructed from all the values of M.
in Table II is shown in Figure 4. It is clear that a linear
approximation to the isotherm is very inaccurate beyond a mole
fraction of 0.5. The value of the solubility computed from
the slope of this line would seriously underestimate the ac-
tual concentration of pentane, Cm, corresponding to any
external vapor pressure greater than that produced by a
0.5 mole fraction pentane solution. For example the Cm
corresponding to pure pentane is approximately 30.8 mg/cc
and not 8.6 mg/cc which is the Henry's Law or linear isotherm
prediction.
16

PENTANE ISOTHERM AT 30*C.
30Cm S P
RT
CM S P0 Nc 5 2.42mfg /cc SNc5
20 Slope 2A42S
Cm 8.60=
(mg/cc) S 3.55 mg /cc
00
0 0.2 0.4 0.6 0.8 1.0A/c5
Figure 4~ Isotherm for pentane a 300C. Constructed from
the data given in Table VI.

Cu 1 U coL\ a) C
)U\ t- cu H 0 0 0 0 0 0 0 s...
00C.)U
aW 0p4 ~ ~ ~ ~ ~ ~ ~ ~ - (D r V * ~ - U. L' C .
0 0 0 0 0 0 0 0 0 0 044r- H- H- H- H- H H- H- H HI42
a2 F: 21 r4
Ri 0 c) -I H M N 0 0o WO-r'.
co Cui H Cuj Cu H- .-H
H \0 t- t U -\ U-' .4 0 %.D 0'H tdH'0 C)~ - U N Cr) L*Cr '\)
0 wCC u \U-:'o l - m -t t
-. 0 0 a - CY2 Cu Cu Cuj Cu H 0 -
o_ r) Cu 0 0 0 0 0 0 0 0 08
03 0 0 0 -- El- Cbo~~~ ~ ~ a\ %-\ 4 1
4-,-'.4
. -:t H- Cuj 0'cr~~ H 0 U- C '0 a) (\
$-.) cvi 'A 0 P) 0N \H C. 0 -0 0 0t--. 01 Cu HN 0Hr 0 0l 0 0 0
ol 9 9 C C! 9 CuU >- 0 0 0 0 0 0 0 0 0 0 0
o A.. co H- U.0 0 \' U-\. -4 . 0 V) (-00. * U' Cu H a-
Cr'. t.0 - Cu H- 0 0 0 C)
0
Ci Q 00C
1.7

Cm Values for alkanes and alcohols
Sorption data for the simple alkanes from C1 - C14 and
for the corresponding alcohols from C1 - C10 are collected
in Tables II and III. The principal experimental quantity
is the amount of substance absorbed at equilibrium M O ,
given in column (4) in both tables, As the sorption curves
in Figure 3 show M.,values for the higher external vapor
densities are more indefinite than those corresponding to
lower vapor densities. True equilibrium is probably not
reached 180 min. or even in 24 hours in some cases, particu-
larly for water and the alcohols. But the error is not large
and the C values obtained from the measured uptakes of vaporm
are reasonably close to the presumably higher actual equil-
ibrium values.
The measured Cm values in column (5) in both Tables
after conversion to moles/cc instead of mg/ce have been
plotted in Figure 5. Low molecular weight alcohols (inclu-
ding H2 0) are sorbed in much greater quantity than the correspon-
ding alkanes. This is not due to a higher vapor pressure
since the first three alkanes are gases at room temperature
and were applied at partial pressures of 760 Torr. It is due
to -the larger affinity of the alcohols for the tissue due to
the presence of the polar OH group. This is made clear below
in the discussion of the gas solubility.
18

500
Cm. FOR ALKANES AND ALCOHOLS
400
300
00
~ 200 ~ ALCOHOLS
1000
CA RBON NUMBER (n
Figue 5 -Sol~ubility of the alcoholS
(o) and 3Jkanes e
V~.thecar~n ~nier.The concentration of
the
vapor in the tissue at equilibriu m
Sivnn
moles/Cc.

The solubility of the alkanes and alcohols
The measured solubilities of the gases are given in Tables
II and III column (6) and are plotted in Figure 6. These are
the ratio of the actual membrane concentration C in equilib-m
rium with the vapor over the pure liquid to the vapor concen-
tration, i.e. C, for N = 1.00.* (In terms of Figure 3 this isKC.
the last point on the isotherm and corresponds to the vapor
concentration used in the permeability studies). Several
interesting findings can be noted:
(1) The solubility of the alkanes is less by a factor of
from 10 - 100 than that of the alcohols between C3 - C9 .
(2) The disparity in solubility is very much greater for
the low molecular weight molecules and is less pronounced
for the high molecular weight members of the series.
(3) The solubility of the alkanes appears to be determined
between C3 - C9 .by the number of CH2 groups. Each
methylene unit confers 600 cals on the free energy of
desorption. The linear relationship between log S and
n intercepts the ordinates for S = o between n = 2 and 3. ..
This suggests that 3 methylene groups are required in or-
der to have appreciable absorption of the alkane by the
tissue.
(4) The solubility of the alcohols is appreciably enhanced
by the presence of the OH group. From the slope of the
19

SOLUBILITY OF THE ALCOHOLS AND ALKANES
log n 4 2 5.92RT /2R
log S
12 345 6 78 9 10 11
Figu Log S vs. carbon number "n"l for the alcohols (0)
and alkanes (0).

/
log plot the OH group may be seen to increase the free
energy of desorption by 5.95 and 1.72 = 7.87 k. cal over
the alkanes. For the lower molecular weight members of
the series the increased stabilization is several times
larger. The diminishing effectiveness of the polar group
as n increases might be due to a lessened capacity of the
molecule to.make effective polar bonds as it is drawn
into a more non-polar membrane environment.
(5) Too much weight probably should not be given to the
apparent turning over of the solubility for the high
alcohols. (More work' needs to be done on these larger
molecules. Their diffusion rates are extremely small
and there is a greater probability that eqilibrium
was not attained).
(6) The % coverage = - is seen to be the order of one
percent for most of the vapors. This number actually
compares the density of the molecules in the tissue to
the density of the molecules in their respective pure
liquid states. It is roughly equal to (but different
from) the weight percent sorption.
20

Discussion of Results
Diffusion Constants from Sorption Experiments
Diffusion data obtained from the sorption experiments
are listed in Tables IV and V. In all cases the tissue was
dried thoroughly with dry air before exposing it to the test
vapor. Temperature was controlled to 0 0.10 C using the
constant temperature air bath shown in Figure 2. Represen-
tative sorption curves are shown in Figure 7. Those for
the alkanes are more nearly of the Fickian or ideal type
than are those for the alcohols. Sorption curves for both
are linear in the initial stages when M(t) is plotted against
ty2 (the time for M, to reach M.) . For the alkanes the
linear region extends over 60% of M while for the alco-
hols a figure of 40% is more typical. Above the linear
portions both absorption and desorption curves for the al-
kanes are concave to the abscissa axis. This was
not always true for the alcohols as shown in Figure 7.
Utilizing the initial portions of the sorption curves
and equation(15)the diffusion constants given in Table IV
and V were obtained. For both alcohols and alkanes there is
a decrease in the diffusion constant as molecular weight
increases. The two series are graphed in Figure 8 , the
curves show that the alkane diffusion constants are substan-
tially higher than the corresponding alcohols over most of
the range. The separation between the two groups becomes
21
IA

0.8 SORPTION CURVE FOR BUTANOL
0.7-
0.6
0.5-(mg)
0.4
0.3
0.2
0.1
0 2 4 6 8 10 12 14 16 18 20 22 24
/ (hours)
Figure 7 - Typical sorption curve for butanol. Many of the
alcohols but none of the alkanes exhibited ths
non-Fickian behavior.
________________________________.

TABLE IV
Diffusion Date For The Alkanes From Sorption Experiments
Molecule Dxl01 S kp - J6=k Ac
02 1.5
C 1.3.3
C4 7.62 13.7 104 2.6 0.0016 0.0039
c 5 8.4j9 9.3 79 10.8 0.0062 0.0126
C6 9.28 8.7 80.7 26.7 o.0=4 0.0070
C 7 10.78 7.0 72.1 71.0 0.022 0.0053
C8 10.68 6.2 66.3 208.0 0.058 0.0047
09 11.32 4.5 51.0 510.0 0.103 .0.0031
Clo 11.93 1.9 22.6 [1450-o]* 0.124 0.0016
C11 12.5 1.6 20 3,530.0 0.254 0.00087
C1 4 18.1 0.27 3.8 7,580.0 0.92 0.00003
Note:
(1) Diffusion constants computed from initial rates according to:
(2) M values were asymtotic values.
(3) k- D =4-5 x10 6 DKm (cm hr-1)
(4) JS = kp CS (mg cm2 hr)
22

DIFFUSION CONSTANTS OF ALIPHATIC VAPORS18
16
* ~ 12 ~ALKANES
~12
100
80
6
.0
0 2 4 Y6 8 10 12 1CA RAON NUMBER (n)
Fiue -Diffusion constaits-for the alcohols (0) and
alkanes (s) corresponding to the data in Tables
II and III.

TABLE V
Diffusion Data For The Alcohols From Sorption Experiments
Molecule Dxl0" S kJBis= kpACS
1120 9.8 -2,560 1.17 0.037
Cl4.0 263 0.048 0.013
C2 3.4 141 0.022 0.042
C3 2.6 121 0.014 0.0012
C1.8 193 0.016 0.0062C4C5 3.0 320 0.043 0.00072
C6 5.0 530 0.12 0.0010
C7 1.6 1,600 0.11 0.00036
C8 0.41 2,210 0.041 0.000074
C9 0.40 2,620 0.047 0.00004
C1 0.59 1,500 0.040 0.000024
Note:
(1) Diffusion constants were computed from initial rates according
to 7~4 W' 'SV' ~iM' ~25 ~ /
(2) M. values were taken at arbitrary times always greater than 180 min
(4) is kpA6C,(mg cm-2 hr-.)
23

less as the moleeular weight increases. This is to be expec-
ted as the relative importance of the hydroxy group must become
less with increasing molecular weight. From the solubility data
e.g. Figure 6. a similar inference can be drawn - the solubility
cf the two groups tends to coincide as the molecular weight
increases. One might speculate that beyond C or C the pre-12
sence of a single hydroxy group does not matter in the diffusion
and solubility behavior of these molecules within the stratum
corneum.
The trend of decreasing diffusivity with increasing molecu-
lar weight shown for the alkanes in Figure 8, suggests an inverse
square root dependence on molecular weight. The alkane data is
replotted in Figure 9 vs. - and there does appear to beVM
a linear correlation. Obviously a plot of D vs. where
V is the molecular volume would also be linear. This empirical
correlation between D and - cannot tell us much about the
mechanism of diffusion since it can be observed both in the free
diffusion of gases (Grahm '5 Law of Diffusion) as well as in bulk
diffusion in solids. But it does support the credibility and
accuracy of the measured data.
24

DEPENDENCE OF ALKANE DIFFUSION CONSTANTSON MOLECULAR WEIGHT
16
14 -BUTANE
S12
io
0
6 - OCTANE-*
4
2 -
0.TETRADECANE
0 0.5 1.0 1.5 2.0
x 10
Figure 9 - Alkane diffusion constants plotted vs.

Concentration Dependence of D
It has been assumed up to now that D is a constant (at a
particular temperature) and as such is independent of the concen-
tration of the external vapor. As it turns out D is not con-
stant but appears to increase with concentration. On the
basis of a rather limited amount of experimental data it appears
that the increase in the value of D with concentration is
greatest for 20 and the alcohols and least for the alkanes.
The formulae which have been used to compute D yield an average
diffusion constant D values of which from a series of experiments
using different vapor concentrations can be used to obtain DO)
the diffusion coefficient at zero concentration. This technique
is fortunately not required for our purpose which is to compare
the diffusion coefficients obtained by sorption with those from
permeation data. All that is required is that the diffusion
constants obtained either way correspond to identical vapor
concentrations. The vapor pressures employed in our permeation
measurements were the saturated vapor pressures, i.e., those in
equilibrium with the pure liquid at a given temperature. Con-
sequently the diffusion constants measured from sorption experi-
ments must correspond to these same saturated vspor pressures.
Since it is always possible in a sorption experiment to measure
D as a function of external vapor concentration this is not a
serious limitation.
25
C.

//
Diffusion constants corresponding to various constant
concentrations of pentane are listed in Table VI. Ignoring
the first experiment which was probably inaccurate owing to the
small weight changes involved, it can be seen that D appears
very nearly constant over the full concentration range. Whet-/
her D is computed from the half time for sorption (eq 12) or
from the initial sorption gradient (eqs. 14 - 15), the initiel
stages of the diffusion process rather than the latter are
weighted more heavily. This means in effect that if D is not
increased except at the very highest concentration it could
deceptively appear to be constant in this series of determinations.
A way of testing this possibility is to compare the diffusion
constants obtained with sorption and desorption curves. Some
typical results for pentane are given in the short table below
and a comparison of a pair of sorption - desorption curves are
given in Figure 10.
26

SORPTION AND DESORPTION CURVES FOR PENTANE
0.7-
0.6 -Desorption
0.5-
K Mg) 0.4
03Sorption Mt~ Desorption
0.2
0.1i
P 00 30 60 90 120 150 180
t (rn/n.)Figure 10 -Sorption and desorption curves for pentane.
These curves are not superimposnble a nd
suggest unusual surface sorption.

I
TABLEIVI
Pentane Sorpti n Data 300 C
pentane M. (mg) Cm t, mn) D xOl0cm2sec lcm2sec-1
1 o.065 0.0099 0.44 6.6 0.79 1.57
12 0.118 0.023 1.02 19.3 0.27 0.92
3 0.221 O.042 1.87 17.5 0.30 1.02.
4 0.351 0.075 3.64 16.6 0.32 0.91
5 0.45 0.099 4.42 16.4 0.32 0.99
6 o.651 . 0.18y 8.31 16.4 0.32 0.91
7 0.719 0.258 11.5 15.0 0.35 1.02
8 o.858 0.378 16.8 14.5 0.36 1.01
9 0.911 0.429 19.1 15.1 0.35 0.97
10 1.000 o.693 30.8 13.5 0.38 1.10
+ M is the weight of pentane sorbed on 29.90 mg of dry stratum corneum
computed from t,/ values using formula (12)
Di computed from initial rate using formula (15)
Pentane artia pressure at 300 630 Torr.
i 27
.4

SORPTION - DESORPTION DATA
FOR PENTANE a 30 ° C
V- , 10 Di / ,.(rain)
SORPTION 0.34 x 10 - 1.05 x 10⁻¹O 15.50.39 x 10-10 0.95 x 10⁻¹⁰ 13.5
DESORPTION 2.62 x 10-103.50 x 10⁻¹O 2.0
1.5
The data show that the pentane diffusion constant may be from
8 - 10 times greater for a fully saturated membrane than for
a moderately unsaturated one. Curve (1) is'the sorption curve
and curve (2) is the desorption curve. The desorption curve is
replotted as curve (2A) in the standard sorption form to allow
more meaningful comparison. The initial desorption process is
clearly a far more rapid phenomenon. In 1.5 min. one half of
the pentene has diffused out of the tissue. This same amount of
pentsne required 13.5 min. to enter the tissue. The most rapid
part of the desorption is over with very early as the curves show.
This behavior at high concentrations could obviously not be ob-
served by the scrption method as the tissue is never fully satur-
ated except at the end of the experiments.
28

Measurement of Gas and Vapor Transport with the Quartz
Crystal Oscillator.
Introduction
For accurate measurements of the permeation of the less
permeable gases and vapors a method more sensitive than our
I. R. technique is needed. The ultimate objective is to be
able to detect very small quantities of the test gas in
relatively large concentrations of water vapor. This require-
ment arises due to the necessity of studying the effect of mem-
brane hydration on the permeation of other gases. The selec-
tivity afforded by the quartz oscillator technique, in prin-
ciple, allows this to be done. The second year's report will
contain the precise description of the final apparatus as well
as the data gained from it. A short description of the progress
being made is given below.
Details of Apparatus
- The permeation apparatus which we have constructed and are
currently testing consists of essentially three components:
(1) a vacuum manifold, (2) a diaphragm diffusion cell and (3) a
detector system.
29

/: /
/o/
()Vacuum manifold
A means of evacuating the diffusion cell and introducing
gases is required. Since the sensitivity of the detector is
highs pump down to a good vacuum is necessary to clean the
system even though it is possible during the measurements to
work at higher pressures. The presernt system consists of a fore
pump, in line-bakeable water trap, liquid nitrogen trap, Mc Leod
gauge and assorted gas inlet and vapor inlet tubes.
(2) Diaphragm-diffusion cell
The cell is built around the membrane supports which con-
sist of porous bronze plates fitted into brass sleeves. These
plates are necessary to support the tissue against rupture caused
by pressure changes. The brass sleeves fit into the main body
of the diffusion cell through vacuum tight O-ring connections.
A vacuum of 10 - 4 Torr has been attained. The diffusion cell it-
self is a heavy brass cylinder in two sections (donor and receptor)
which rests in a saddle which permits the two parts tc be tightened
together thus enclosing the epidermal membrane.
30

(3) Detector System
A pair of quartz crystals fit into the detector portion of the
diffusion cell. These are fitted into a brass insert which can be
easily removed from the cell and yet can be refitted to make a va-
cuum tight seal. Each of these crystals must be delicately coated
with a substrate to absorb the gas. This is done by a special
spraying apparatus built around an artists air brush. As the gas
penetrates the membrane and enters the detector chamber it absorbs
into the substrate coated on the quartz crystal. The natural fre-
quency of the crystal changes and this signal is detected, converted
to an analogue output and recorded.
The entire system has been working and the permeability of
water has been measured with it. Some problems remain to be solved
including leaks in the vacuum system, finding suitable, stable
crystal coatings and keeping the membrane intact during dehydration.
31
4

List of References
Tregear, R. T.: Physical Functions of Skin. Academ, c Press, London(1966).
Petrun, N. M.: Percutaneous respiration in children of various ages.Sechenov Physiol. J., 47: 1025 (Trans.), L961.
Adams, P. D.: The gas exchange of the skin. Am. PArfumer ess. Oil.Rev., pp. 134-137, 1949.
Fitzgerald, L. R.: Cuteneous respiration. Physiol. Rev., 37: 325,1957.
Klocke, R. A., Gurtne, G. H. and Farhi, L. E.: Gas transfer acrossskin in man4 J. Appl. Physiol., 18: 311, 1963.
Crank, J.: The Msthejatics of Diffusion. Oxford University Press,London (1956). lIk
Rothmsn, S. R.: Physiology and Biochemistry of.the in Chapter 3p. 44, The University of Chicago Press (19 4).
Rogers, W. A., Buritz, R. S. and Alpert, D.: J. App. Phys., 25, 868,1954.
Crank, J. and Park, G. S.: Diffusion in Polymers. Academic Press,London (1968). 1

Securit ClassificationDOCUMEN4T CONTROL DATA - R&D
(Saouv elaeeffleaiw of title, body of abstract and Ind..M# annotation must be entered whom th. o~'rall report Is classfied)
4. OERIIIN AOTE (VT'p (o prt e uthor) v Ta. SECRIT repoSSIFICATION197
5.~~~~~ AUARS (not. applicable) nital
Scheuplein, Robert J.
4. REPORT DATE 74. TOTAL NO. OF PAGES 76. No. or REFS
July 30, 1970 33 9111. CONTRACT OR GRMANT NO. DAJIC 19 -69 - 0 So. ORIOINATORIS REPORT NUb4eaptS)
0018 1 ib. PROJECT NO.2N6M I
c. S1b. OTHER IPONT NOMS (Any oter number Mt may be a..iidN/A Al.s 1=1rt
d.N/A N/A10. AV A IL ASILITY/LIMITATriomN OTICES
Qualified reqiaestors may obtain copies of this report frog DDC
11. SPEIYA NOTES 12. SPONSORING MILITARY ACTIVITY
N/A Army Research Office, Office of the Chief,Research and Devalopment, 3045~ Columbia
~ ~ -. Pike, Arlingtoh, Virginia, 22204
IS eSRCA study of the pormeqbility of h'wuan akin (epit,--is and stratum corneum)to vaporls and gases. Physical measurements include the~ dete~rmination of the s01lu-
bility of homologous series of organic vapors, alkanes, alcohols, etc...in stratum corneum; the permeability, of these substancas through epidernis andthe measurement of gas-tissue sorption rates and equilibria.. Primary emphasis is
plac~ed upon the measurement of fundamental physical constants characteriatic' ofthe tissue and relevant d* &ffuntQnlTheae include gas and vapor solubilities,diffusion constants and activation ene-rgies fo~r diffusion. ._The effect of hydra-tion of the permeability of gases and vapore is studied. The mechanism ofdiffusion of gases through dry stratum corneum is discussed and compared withdiffusion through hydrated tissue./~
DD "ANI41473__ _ _ _ _ _ _ _
Security Classtification

Security Classification14. LINK A LINK 8 LINK C
KEY WORDS.... ROLE WT ROLE WT OL -
stratM corneummembrane permeabilitysolubility of gases in skinhydration of stratum corneumdiffusion of non-electrolytes through skinskin permeabilitysor tio fof vapors and gases by skin
INSTldJCTIONS
1. ORIGINATING ACTIVITY: Enter the name and address 10. A%:AILABILITY/LIMTATION NOTICES: Enter any Urn-of the contractor. subcontractor, grantee, Department of De- itations on further dissemination of the report, other than thosefense activity or other organizeUon (corporate torisinferepocttr author) issuing imposed by security clasaification; using standard statementsth, report. such as:
2a. REPORT SECURITY CLASSIFICATION: Enter the over- ( ) 'Qualified requesters may obtain copies of thiall security classification of the report. Indicate whether report from DDC." y"Rstricted Data" i included. Marking is to be in accord- rany. with appropriate security regulations. (2) "Foreign announcement and dissemination of this
report by DDC Is not authorized"2b. GROUII, Automatic downgrading is specified in DoD Di-rective S200. 10 and Armed Forces Industrial MeanuaL Enter (3) "U. S. Government agencies may obtain copies ofthe group number. Also, when applicable, show that optional this report directly from DDC. Other qualified DDCmarkings have been used for Group 3 and Group 4 as author- users shall request through dixed.
3. REPORT "TtE Enter the complete report title in all (4) "U. S. military agencies may obtain copies of thiscapital letters. Titles in all cases should be unclassified. report directly from DDC. Other qualified usersI. a meaningful title cannot be selected without classifica- shall request throughtion. show title classification in all capitals in parenthesisaImmediately following the title. ._."
4. DESCRIPTIVE NOTES: If appropriate, enter the type of (5) "All distribution of this report is controlled. Qual-report. eg., Interim, progess, summary, annual, or final. ified DDC users shall request throughGive the inclusive dates when a specific reporting period i"covef
S. AUIrHi(S Enter the name(s) of author(s) as shown on If the report has been furnished to the Office of Technicalorin.the reort(" Enter lat name, ft authes mle ta .o Services, Department of Commerce, for sale to the public, indi-or in the ropom Enter lost name, first name, middle initial cate this fact'and enter the price, if knowmn
If military, show rank and branch of service. The name ofthe principal author is an absoluti minimum requirement. IL SUPPLEMENTARY NOTES: Use for additional explana-6. REPORT D)ATE Enter the date of the report as day, tory notes.month. year; or month, year. If more than one date appears 12. _SPPN3ORING MILITARY ACTIVITY: Enter the name ofon the report, use date of publication. the departmental project office or laboratory sponsoring (pay-7i. TOTAL NUMBER OF PAGES The total page count i
1 Id for) the research and development. Include address.
should follow normal pagination procedures, Le., enter the 13. ABSTRACT: Enter an abstract giving a brief and factualnumber of pages containing information, summary of the document indicative of the report, even though7. Nit may also appear elsewhere in the body of the technical re-
port. If additional space is required, a continuation sheetreferences cited in the report. shall be attached.Sa. CONTRACT OR GRANT NUMBER: If appropriate, enter It is highly desirable that the abstract of classified re-the applicable mimber of the contract or grant under which ports be unclassified. Each paragraph of the abstract shallthe report was w'itten. end with an indication of the military security classification8b, 8c. a 6d. PROJECT NUMBER: Enter the appropriate of the information in the paragraph, represented as (TS), (S),military department identification, such as project number, (C), or (U).aubproject number, system numbers, task number, etc. There is no limitation on the length of the abstract. How-
9a. ORIGINATOR'S REPORT NUMBER(S): Enter the offi- ever, the suggested length is from 150 to 225 words.cial report number by which the document wll be identified 14. KEY WORDS: Key words are technically meaningful termsand controlled by the originating activity. This number must or short phrases that characterize a report and may be used asbe unique to this report. index entries for cataloging the report. Key words must be
9b. OTHER REPORT NUMBER(S): If the report has been selected so that no security classification is required. Iden-
assigned any other report numbers (either by the originator fie.s such as equipment model designat.on, trade name, 'ii-
or by the aponsor), also enter this number(s). tary project code name, geographic location, may be used askey words but will be followed by an indication of technicalcontext. The assignment of links, rules, and weights is_ecurity_ _ssionoptional.
Secunty Classification