Embed Size (px)
Citation preview

DCA: Dynamic Correlation Analysis
TianweiYu
Department of Biostatistics and Bioinformatics, Emory University, Atlanta, GA 30322,
USA. Email: [email protected].
Abstract
In high-throughput data, dynamic correlation between genes, i.e. changing
correlation patterns under different biological conditions, can reveal important
regulatorymechanisms.Given thecomplexnatureofdynamiccorrelation,and the
underlying conditions for dynamic correlation may not manifest into clinical
observations, it is difficult to recover such signal from the data. Currentmethods
seekunderlyingconditionsfordynamiccorrelationbyusingcertainobservedgenes
as surrogates, which may not faithfully represent true latent conditions. In this
studywe develop a newmethod that directly identifies strong latent signals that
regulate the dynamic correlation of many pairs of genes, named DCA: Dynamic
Correlation Analysis. At the center of the method is a new metric for the
identification of gene pairs that are highly likely to be dynamically correlated,
withoutknowingtheunderlyingconditionsofthedynamiccorrelation.Wevalidate
theperformanceofthemethodwithextensivesimulations.Inrealdataanalysis,the
method reveals novel latent factors with clear biological meaning, bringing new
insightsintothedata.
Keywords:dynamiccorrelation,LiquidAssociation,latentvariables.

Introduction
The cellular system involves tens of thousands of genes/proteins that are tightly
regulated inacomplexnetwork(1-3). Interactionsandregulations inthenetwork
arehighlydynamic.Theychangesubstantiallyindifferentcelltypes,developmental
stages,orinresponsetoenvironmentalconditions(4).Geneexpressionandsimilar
typesofdata,suchasproteomicsandmetabolomicsdata,representoutcomesofthe
dynamic regulatory network. Changes in the underlying regulation patterns are
reflectedinthechangesingeneexpressionlevels,and/orchangesinthecorrelation
between genes. Many methods are available to analyze patterns in the gene
expressionlevels(5-8),while lessattentionhasbeenpaidtothestudyofdynamic
correlations.
Methods have been developed to find differential correlation patterns between
genesorgenesets,conditionedonagivenclinicalvariable(9-11).However,dynamic
correlationcanbemorecomplex.Underlyingcellularstatesmaynotmanifest into
clinicalobservations.Asthebiologicalsystemisregulatedinamodularmanner(12),
there could be multiple dynamic correlation conditions that govern different
functional groups of genes. Hence it is of interest to find unobserved dynamic
correlation conditions, which is a much harder problem. To this end, Li has
developed the Liquid Association (LA) approach, which uses a third gene as the
proxy of the dynamic correlation signal (13, 14). The method scans through all
possible gene triplets to find potential dynamic correlations. Similar approaches
thatutilizegenesaremediators(15,16),integrativeanalysisutilizingLA(17,18),as
wellassomestatisticaltheoryofLA(19)werelaterdeveloped.
Although focusing on gene-level dynamic correlations can reveal some important
localregulatorymechanisms,amoreglobalapproachtodynamiccorrelationcould
discovercriticalregulationmechanismsthatpenetratemultiplebiologicalprocesses,
orhelpidentifyhiddensub-groupsinthesamples.Tothisend,usingtheoriginalLA
orsimilarapproaches isnoteffectivedue to the followingreasons.First, scanning
through all possible triplets is computationally intensive. Second, a genome-scale

scan yields large numbers of LA gene triplets, causing difficulties in the
interpretation.Given theLAscore iscalculated inasymmetricmanneramongthe
threegenesinvolved,discerningwhichgenereflectscellularstatescouldbetricky.
Thirdandthemostimportant,thegenesthatserveassurrogatevariablesmaynot
begoodindicatorsoftrueunderlyingcellularstates.
In this study, our purpose is to find dominant dynamic correlation signals that
regulate the dynamic correlation of a large number of gene pairs. The biggest
difficulty is we do not know a priori which gene pairs have the relationship of
dynamiccorrelation.Wedesignanewmetric,namedLiquidAssociationCoefficient
(LAC), to effectively and efficiently screen all gene pairs for potential dynamic
correlations.Fromgenepairsthataremostlikelytobedynamicallycorrelated,we
provide a simple and straight-forward solution for quickly finding the latent
dynamic correlation signals. The procedure is named DCA: Dynamic Correlation
Analysis.WerefertothelatentsignalsfoundbyDCAasDynamicComponents(DCs).
Wedemonstratetheperformanceofthemethodusingextensivesimulations.Inreal
biologicaldatasets,wedemonstratethemethodcanidentifylatentsignalsthatare
biologicallymeaningful andnot foundby existingmethods. In amerged cell cycle
dataset, the method can find signals pertaining to the original experimental
grouping,aswellasbiologicalprocessesthatdifferentiatebetweentheexperiments.
IntheTCGAbreastcancer(BRCA)dataset,thenewmethodcanfindnewinteresting
subgroupsinthesubjectsthatarerelatedtopatientsurvivaloutcome.
Methods
Theoverallframework
Thedataisintheformofanexpressionmatrix,𝑮!×!,withpgenesintherowsandn
samples in the columns. Our assumption is that a portion of the gene pairs have

dynamiccorrelations,andtherearesomemajorlatentsignalsthatcanexplainmuch
of the variation in correlations among those gene pairs. Our purpose is to detect
suchdynamiccorrelationsignals.
Weassumethatallgenesarenormalizedtohavemean0andstandarddeviation1.
ThusthecovarianceandcorrelationbetweentwogenesXandYareequaltoE(XY).
First we assume we knowwhichm gene pairs have the relationship of dynamic
correlation. We address the selection of such gene pairs in the next sub-section.
Giventhesegenepairs,wecanconstructanewmatrix𝑩!×!,inwhichtheeachrow
is constructed bymultiplying the corresponding elements of a gene pairX andY,
𝑥!𝑦!, 𝑥!𝑦!,… , 𝑥!𝑦! .AgenecancontributetomultiplerowsoftheBmatrixifithas
dynamiccorrelationwithmultiplegenes.
For any z vector that is normally distributed, 𝑩𝒛 = 𝐿𝐴!, 𝐿𝐴!,… , 𝐿𝐴! ′ is
proportionaltotheLAscoreswithzbeingtheLAscoutinggeneoverall thepairs.
Fromaclusteringperspective,ifwefindclustersofrowsinthematrix𝑩,theneach
cluster shares a common LA scouting factor. Alternatively, from a principal
component perspective, 𝑩𝒛 ′ 𝑩𝒛 𝒛′𝒛is proportional to the sum of LA scores
squared over all the gene pairs. Finding a sequence of unit vectors𝒛that are
orthogonaltoeachotherandmaximizesthesumofLAscoressquaredrequiresthe
exactsamesolutionasconductingeigenvaluedecompositiononthematrix𝑩′𝑩.
Conceptually, other methods used to find latent factors, such as Independent
ComponentAnalysis (ICA) (20),SparsePrincipalComponentAnalysis (SPCA) (21),
ModularLatentStructureAnalysis(MLSA)(22),orvariousclusteringmethodscan
also be applied to the B matrix. In this manuscript we focus on the eigenvalue
decomposition approach. We note there is a caveat that this approach doesn’t
guaranteethatelementsof 𝒛willfollowthenormaldistribution.
Selectinginformativegenepairs

For the purpose of selecting informative gene pairs to find underlying dynamic
correlationsignals,wedefineameasurefordynamiccorrelationbetweenapairof
geneswithanunknowncondition factor, theLiquidAssociationCoefficient (LAC),
whichisthecorrelationcoefficientofthesquaredvaluesofthetwogenes,minusthe
correlationcoefficientoftheoriginalvaluessquared.
𝜁!,! = 𝑟 𝑔!!,𝑔!! − 𝑟! 𝑔! ,𝑔! ,
where𝑟()isthePearson’scorrelationcoefficient.Ithasbeenshownthatwhenboth
𝑔! and𝑔! follow the bivariate normal distribution with mean00 , and variance-
covariancematrix 1 𝜌!
𝜌! 1,thepopulationcorrelationcoefficientbetween𝑔!!and
𝑔!! isequalto𝜌!,whichmakestheabovequantityzero.
Alternatively, to reduce the impact of more extreme values, we can use the
correlation coefficient of the absolute values of the two genesminus the absolute
valueofthecorrelationcoefficient:
𝜁!,! = 𝑟 𝑔! , 𝑔! − 𝑟 𝑔! ,𝑔! .
WecomputethematrixofLACvaluesforallpairsofgenes.Noticethecomputational
cost is on the same scale as computing the pairwise correlationmatrix.We then
select the 𝑖, 𝑗 pairs whose LAC values are above a certain percentile of all the
valuesinthematrix.
After selecting the top 𝑖, 𝑗 pairs,weconstruct theBmatrix, inwhicheachrow is
constructedfromaselectedpairofgenes.Forexample,if𝑔! and𝑔! areselectedasa
pair of informative genes, then the corresponding row of the new matrix is
𝑔!!𝑔!!, 𝑔!!𝑔!!,… , 𝑔!"𝑔!" .Inthisstudy,weuseeigenvaluedecompositionofB’Bto
extract latent factors, and varimax rotation (23) to improve the interpretability of
thelatentfactors.

Selectinggenepairsassociatedwithalatentfactor
We first calculate theLAC coefficients for all pairs of genes, and select genepairs
withLAC coefficients belonging to a top percentile (20% in this study). We then
calculate their LA scores with the latent factor. Heuristically, we model the
distributionofLAscoresasamixture,withadominantsplit-normalcomponentin
thecenterrepresentinggenepairswithnorelationtothelatentfactor,i.e.thenull
distribution. We apply the local false discovery (fdr) approach to calculate the
posteriorprobabilitythatagenepairbelongstothenon-nulldistribution(24),and
threshold the fdrvalues toselectgenepairs thataredynamicallycorrelatedgiven
thelatentfactor.
Findingbiologicalprocessesassociatedwithalatentfactor
For functional interpretation,weusegeneontology (GO)biologicalprocesses.We
firstselectasetofrepresentativeGObiologicalprocesstermsthatareofreasonable
size and relatively small overlaps, following an existing procedure that considers
both theontology structure and thenumberof genes assigned to each term (25).
Fortheyeastdata,weselect172biologicalprocesseswith50~1000assignedgenes
each, covering 5334 genes in total. For the human data, we select 423 biological
processeswith100~1000assignedgeneseach,covering14414genesintotal.From
thegenepairsassociatedwitheachlatentfactor,weconducttwotypesofanalyses:
Within-process dynamic correlation. For each biological process, we count the
occurrenceofgenepairsinwhichbothgenesfallintotheprocess.Wealsocalculate
theexpectednumberofsuchgenepairsifallthegenepairswererandomlydrawn.
Wecalculatethefold-changebytakingtheratioofobservedcountv.s.theexpected
count,andp-valueusingthebinomialdistribution.
Between-process dynamic correlation. For each pair of selected biological
processes,wefirstremovetheiroverlappinggenes.Wethencounttheoccurrenceof
gene pairs in which the two genes fall into the two processes respectively, and

calculate the expected number of such gene pairs if all the geneswere randomly
drawn.Afterthresholdingthefoldchangeandp-valuetoselectpairsofprocesses,
wevisualizetheresultingnetworkusingCytoscape(26).
ResultsandDiscussion
IllustrationoftheLiquidAssociationCoefficient(LAC)
Inthisstudyanewmetricisdefinedtorankallpairsofvariablesinthedatamatrix.
ThepurposeoftheLACistohelpidentifygenepairsthataremostlikelytohavethe
relationshipofdynamiccorrelation,withoutknowingtheunderlyingconditionsof
the dynamic correlation. Gene pairs with such relations should receive high LAC
score,whileothergenepairs,eitherindependentorcorrelated,shouldreceivelow
scores.
The LAC requires all variables to have mean zero and standard deviation 1. As
illustrated in Figure 1, if both variables X and Y follow the standard normal
distributionmarginally, and one-third of the (X,Y) pairs are positively correlated,
one-third of the (X,Y) pairs are negatively correlated, and another one-third
uncorrelated, then the absolute values will be positively correlated, and the LAC
tends tobe large (Fig. 1, left column).On theotherhand,whenX andY are truly
independentorsimplycorrelated,theLACtendstobesmall.
Wefurtherconductalargersimulationstudytoexaminetheempiricaldistribution
of LAC under different circumstances. As illustrated in Figure 2, when the two
variablesaredynamicallycorrelated,thedistributionoftheLACscoreiscenteredat
apositivevalue(Fig.2,bluecurves).Thehigherthecorrelationlevel,thehigherthe
mean(Fig.2,lefttorightpanels).Thehigherthesamplesize,thelessthespread(Fig.
2,different linetypes).At thesametime, in the independentandcorrelatedcases,
theLACscoresarecenteredaroundzeroifthefirstdefinitionofLACisused.Using

theseconddefinition,theLACisstillcenteredaroundzerointheindependentcase,
andthecenterisnegativeinthecorrelatedcase(Fig.2,lowerpanels).
Weconductedanextensivesimulationstudytoevaluatethemethod’scapabilityto
recover latent dynamic correlation signals. Please refer to the Supporting
Information,section1fordetails(SupportingFigures1~3).Overall,themethodcan
recover the hidden dynamic correlation signal when the sample size and signal
strengthissufficient.
DCAextractssignalsthatdifferentiateexperimentsfromthemergedcellcycledata
Wefirstanalyzethewell-studiedSpellmancellcyclegeneexpressiondata(27).The
datasethasbeenanalyzedbymanyauthors.Thepurposeoftheanalysishereisto
demonstrate that DCA can extract information that is clearly meaningful, and
providesnovelbiologicalinsights.
Thecellcycledataset includes fourtime-seriesexperimentsof theyeastcellcycle,
eachusingadifferentmethodofsynchronization.Thetotaldimensionis6178genes
by 73 samples. Missing values were imputed by the K-nearest neighbor (KNN)
method(28).Whenallfourtimeseriesdatasetsarecombinedintoasingledataset,
traditionalmethodssuchasPCAandSPCA(21)extractsignals thatareconsistent
across the four time series (Supporting Figures 4 and 5), but not signals that
separatethefourtimeseries,exceptthefirstPCthatcapturesanoscillatingsignal
whichisanartifactintheCDC15timeseriesdata(29).
Applying DCA to the combined cell cycle data yields factors that are distinctly
different.Most of the Dynamic Components (DCs) clearly differentiate one of the
fourtimeseriesfromtherest(SupportingFigure6).Forafulllistoffactorplotsand
biologicalprocessesassociatedwitheach factor,please refer toSupportingFile2.
Herewefocusourdiscussiononthreeofthefactors.
The first DC has high scores for samples from the CDC15 experiment only. It has
been documented that an oscillating signal is present in the CDC15 data across
manygenes (SupportingFigure7), causinganelevated levelofcorrelationoverall
(29). ThefirstDCreflectsthissignal.Atthesametime,genepairsassociatedwith
thisDCarenotclearlyassociatedwithanybiologicalfunction,asreflectedinthefact
that no biological function pairswere found at the threshold of p=0.001 and fold
change=2.Thisisexpectedgiventhefactthattheoscillatingsignalisnotbiologically
meaningful.
ThesecondDConlyhasextremescores forsomeof thesamplesof theelutriation
experiment.AcloserexaminationrevealstheDCshowsasine-wavepatterninthe
elutriationsamples(Figure3).Anexaminationofthedatarevealsastrongdynamic
correlation pattern between genes associatedwith thisDC (Supporting Figure 8).
Selecting biological processes pairs that have excessive dynamic correlation links
between them, we find that the processes are focused on rRNA biogenesis and
ribosomeassembly.Muchmorepositive/negativecorrelationsareshownbetween
genesinthesebiologicalprocesseswhentheDC2scoreislow,whichcorrespondto
halfof the samples in theelutriationexperiment (SupportingFigure8). Whileall
the other three experiments are based on block-and-release cell cycle
synchronization,theelutriationprocessseparatessynchronizedcellsbasedontheir
size,shapeandmass(30).Theresultshereindicatethatproteinbiosynthesistend
to be better synchronized in the elutriation samples compared to the other three
experiments.
For the fifth DC, samples in the CDC28 experiment have lower scores, while the
alphafactorsampleshavehigherscores,withasmallermagnitude(Figure3).This
indicatesthatsomegenepairshaveareversecorrelationpatternbetweenthetwo
experiments,whichisintriguinggivenbothexperimentsusedblock-and-releaseto
synchronize cells. Some more recent studies have shed light on the metabolic
behavioroftheyeastcellsunderthealphafactororCDC28cellcyclearrest.Under
thealphafactortreatment,thecentralmetabolic fluxesareatahighlevel,andthe
cellularmetabolismtendtoberespiratoryevenwhenglucoseisabundant(31).The
cell cycle CDK Cdc28 regulates both the cell division processes and metabolic

processes.UndertheCDC28inhibition,thecellsaccumulateglycogenandtrehalose
toextremelyhighlevels(32).Giventhedifferentcharacteristicsofthetwocellcycle
arrestmechanisms,itisunderstandablethatafterthereleaseofcellcyclearrest,the
cellsproceedfromverydifferentmetabolicsituations,andmetabolismwilladaptto
thosesituations.SupportingFigure9showsgenesassociatedwithDC5,wherewe
canobserveaverystrongpattern in theCDC28samples, andaweakerpattern in
thealpha factorsamples.Functionally,weobserve thehighlyconnectedbiological
processes mostly involve small molecule metabolism and transport (Figure 4b).
TwotypicalpairsofgenesareshowninFigure4c,wherecleardynamiccorrelation
isobserved.
Overall, unlike traditional methods such as PCA and SPCA that identify
commonalities, the DCA approach tend to find signals that differentiate the four
underlying experiments, and reveals some important biological processes that
behavedifferentlybetween the experiments.Given the existing knowledgeon the
dataset, these results validate that DCA extract new andmeaningful information.
However, inmostotherapplications, informationsuchassamplegroupingarenot
available. We next examine the TCGA breast cancer (BRCA) dataset to see if the
methodcanextractanynewinsightsfromthedata.
DCAbringsnewinsightsintotheTCGABreastCancerdata
The data contains the measurement of 20532 genes by deep sequencing in 762
subjectswithbreastcancer.Afterremovinggeneswith>20%zeroreadings,17728
genes remain in the study. Similar to the yeast cell cycle data, the DCA captures
signalsthataredistinctfromtraditionalmethods.Herewefocusourdiscussionon
threeoftheDCs,astheyareclearlylinkedtoestrogenreceptor(ER)status(Figure
5a, Supporting Figure 10). DC1 largely separates ER-positive and ER-negative
samples,whichagreeswiththesecondprincipalcomponentverywell(Figure5b).
Ontheotherhand, inthespacespannedbyDC3andDC7,ER-positivesamplesare
tightly clustered in themiddle,while part of the ER-negative samples are spread

widely(Figure5a,SupportingFigure10).NoPCscaptureasimilarstructureinthe
data(SupportingFigure11).
Further analyses show that among the ER-negative subjects, those with more
extreme scores in eitherDC3orDC7 showadifferent survival characteristic than
thoseinthecenter(Figure5c).Thesubjectswithmoreextremescorestendtohave
a higher chance of dying earlier, while in long follow-ups the remaining subjects
tendtosurvivelonger,albeitsupportedbyrelativelyfewdatapoints.
Functionally, the biological processes that show excessive dynamic correlations
conditionedonDC3arecenteredaroundtwomainthemes(Figure6a).Thefirstis
protein sumoylation and stress response. Sumoylation is a post-translational
modificationthatoftenoccurs inresponse tocellularstress(33).Manyoncogenes
and tumor suppressors are functionally related to sumoylation (34). The second
mainthemeiscelldifferentiationandtissuedevelopmentthatarerelatedtoseveral
typesof tissues, indicatingadysregulation in thecells.GenesassociatedwithDC3
mainlyfallintotwogroupsthatexhibitinversecorrelationwhenDC3scoreislow,
andlowexpressionwhenDC3scoreishigh(SupportingFigure12).
The biological processes associated with DC7 are mostly immune response
processes (Figure 6b). Patterns of immune cell infiltration has been linked to the
prognosis and treatment response of breast cancer (35). An examination of the
genesassociatedwithDC7revealsthatoverhalfofsuchgenesarelowlyexpressed
when DC7 score is more extreme. A smaller portion of the genes are lowly
expressed when DC7 score is low, and highly expressed when DC7 score is high
(SupportingFigure13). In thissituation, themethod in factdetectsa latent factor
thathasconditionalmean-shifteffectsonthe immunegenes,whichwasdiscussed
byHoetal(19).Thechangedexpressionpatternsofmostlyimmune-relatedgenes
in these samples are likely reflective of a certain immune cell infiltration pattern
thathasimplicationsinprognosis.BesidethethreeDCsthatwediscusshere,most
oftheotherDCsshowclearfunctionalimplications,butrequireextrastudybeyond
this manuscript to elucidate their biological meaning. The full results are in
SupportingFile3.

Overall,asanewunsupervisedlearningmethodforhighdimensionaldata,DCAcan
extract new and useful information from the data. It complements existing
dimension reduction methods to reveal more internal structure in the data that
could lead to new biological discovery. The method is straight-forward, and the
computation is efficient. The R package is available at https://cran.r-
project.org/web/packages/DCA/index.html.
Acknowledgments
ThisworkwaspartiallysupportedbyNIHgrantsU19AI090023andU19AI057266.
TheauthorthankMr.YunchuanKong,Dr.JianKang,andDr.PeterSongforhelpful
discussions.
References
1. Barabási A-L (2007) Network medicine--from obesity to the "diseasome".TheNewEnglandjournalofmedicine357:404-407.
2. BarabásiA-L,GulbahceN,&LoscalzoJ(2011)Networkmedicine:anetwork-basedapproachtohumandisease.Naturereviews.Genetics12:56-68.
3. ChanSY&LoscalzoJ(2012)Theemergingparadigmofnetworkmedicineinthestudyofhumandisease.Circulationresearch111:359-374.
4. IdekerT&KroganNJ(2012)Differentialnetworkbiology.Molecularsystemsbiology8:565.
5. Rapaport F, et al. (2013) Comprehensive evaluation of differential geneexpressionanalysismethodsforRNA-seqdata.GenomeBiol14(9):R95.
6. Eren K, Deveci M, Kucuktunc O, & Catalyurek UV (2013) A comparativeanalysisofbiclusteringalgorithmsforgeneexpressiondata.BriefBioinform14(3):279-292.
7. Andreopoulos B, An A, Wang X, & Schroeder M (2009) A roadmap ofclustering algorithms: finding a match for a biomedical application. BriefBioinform10(3):297-314.
8. Meng C, et al. (2016) Dimension reduction techniques for the integrativeanalysisofmulti-omicsdata.BriefBioinform17(4):628-641.
9. Gill R, Datta S, & Datta S (2010) A statistical framework for differentialnetworkanalysisfrommicroarraydata.BMCbioinformatics11:95.

10. YuT&BaiY(2011)Capturingchangesingeneexpressiondynamicsbygenesetdifferentialcoordinationanalysis.Genomics98(6):469-477.
11. ChoSB,KimJ,&KimJH(2009)Identifyingset-wisedifferentialco-expressioningeneexpressionmicroarraydata.BMCBioinformatics10:109.
12. WagnerGP,PavlicevM,&CheverudJM(2007)Theroadtomodularity.NatRevGenet8(12):921-931.
13. LiKC (2002)Genome-widecoexpressiondynamics: theoryandapplication.Proceedings of the National Academy of Sciences of the United States ofAmerica99(26):16875-16880.
14. LiKC,LiuCT,SunW,YuanS,&YuT(2004)Asystemforenhancinggenome-wide coexpression dynamics study.Proceedingsof theNationalAcademyofSciencesoftheUnitedStatesofAmerica101(44):15561-15566.
15. Boscolo R, Liao JC, & Roychowdhury VP (2008) An information theoreticexploratorymethod for learning patterns of conditional gene coexpressionfrommicroarraydata.IEEE/ACMTransComputBiolBioinform5(1):15-24.
16. Chen J, Xie J, & Li H (2011) A penalized likelihood approach for bivariateconditional normal models for dynamic co-expression analysis. Biometrics67(1):299-308.
17. Yan Y, et al. (2017) Detecting subnetwork-level dynamic correlations.Bioinformatics33(2):256-265.
18. Wang L, et al. (2017) Meta-analytic framework for liquid association.Bioinformatics.
19. HoYY,ParmigianiG,LouisTA,&CopeLM(2011)Modelingliquidassociation.Biometrics67(1):133-141.
20. Hyvarinen A & Oja E (2000) Independent component analysis: algorithmsandapplications.NeuralNetw13(4-5):411-430.
21. ZouH,HastieT,&TibshiraniR(2006)Sparseprincipalcomponentanalysis.JournalofComputationalandGraphicalStatistics15(2):265-286.
22. YuT (2010)An exploratorydata analysismethod to revealmodular latentstructuresinhigh-throughputdata.BMCbioinformatics11:440.
23. Bernaards CA & Jennrich RI (2005) Gradient Projection Algorithms and Software forArbitrary Rotation Criteria in Factor Analysis. EducationalandPsychologicalMeasurement65:676-696.
24. EfronB(2004)Large-scalesimultaneoushypothesistesting:Thechoiceofanullhypothesis.JAmStatAssoc99(465):96-104.
25. YuT,SunW,YuanS,&LiKC(2005)Studyofcoordinativegeneexpressionatthebiologicalprocesslevel.Bioinformatics21(18):3651-3657.
26. Shannon P, etal. (2003) Cytoscape: a software environment for integratedmodelsofbiomolecularinteractionnetworks.GenomeRes13(11):2498-2504.
27. Spellman PT, et al. (1998) Comprehensive identification of cell cycle-regulated genes of the yeast Saccharomyces cerevisiae by microarrayhybridization.MolBiolCell9(12):3273-3297.
28. Troyanskaya O, et al. (2001) Missing value estimation methods for DNAmicroarrays.Bioinformatics17(6):520-525.
29. LiKC,YanM,&YuanSS(2002)Asimplestatisticalmodel fordepictingthecdc15-synchronized yeast cell-cycle regulated gene expression data. StatSinica12(1):141-158.
30. Smith J, Manukyan A, Hua H, Dungrawala H, & Schneider BL (2017)SynchronizationofYeast.MethodsMolBiol1524:215-242.
31. Williams T, Peng B, Vickers C, & Nielsen L (2016) The Saccharomycescerevisiaepheromone-responseisametabolicallyactivestationaryphaseforbio-production.MetabolicEngineeringCommunications3:142-152.
32. Zhao G, Chen Y, Carey L, & Futcher B (2016) Cyclin-Dependent Kinase Co-OrdinatesCarbohydrateMetabolismandCellCycle inS. cerevisiae.MolCell62(4):546-557.
33. WilkinsonKA&HenleyJM(2010)Mechanisms,regulationandconsequencesofproteinSUMOylation.BiochemJ428(2):133-145.
34. Eifler K & Vertegaal AC (2015) SUMOylation-Mediated Regulation of CellCycleProgressionandCancer.TrendsBiochemSci40(12):779-793.
35. Ali HR, Chlon L, Pharoah PD,Markowetz F, & Caldas C (2016) Patterns ofImmuneInfiltrationinBreastCancerandTheirClinicalImplications:AGene-Expression-BasedRetrospectiveStudy.PLoSMed13(12):e1002194.

Figures
Figure 1. Illustration of liquid association coefficient (LAC). Left column:dynamiccorrelationwithanunknownconditioningfactor.Whenthefactorislow,xand y are negatively correlated; when the factor is high, x and y are positivelycorrelated. Second left column: independent case. Right two columns: correlatedcase.Inallthecases,themarginaldistributionofXandYarestandardnormal.
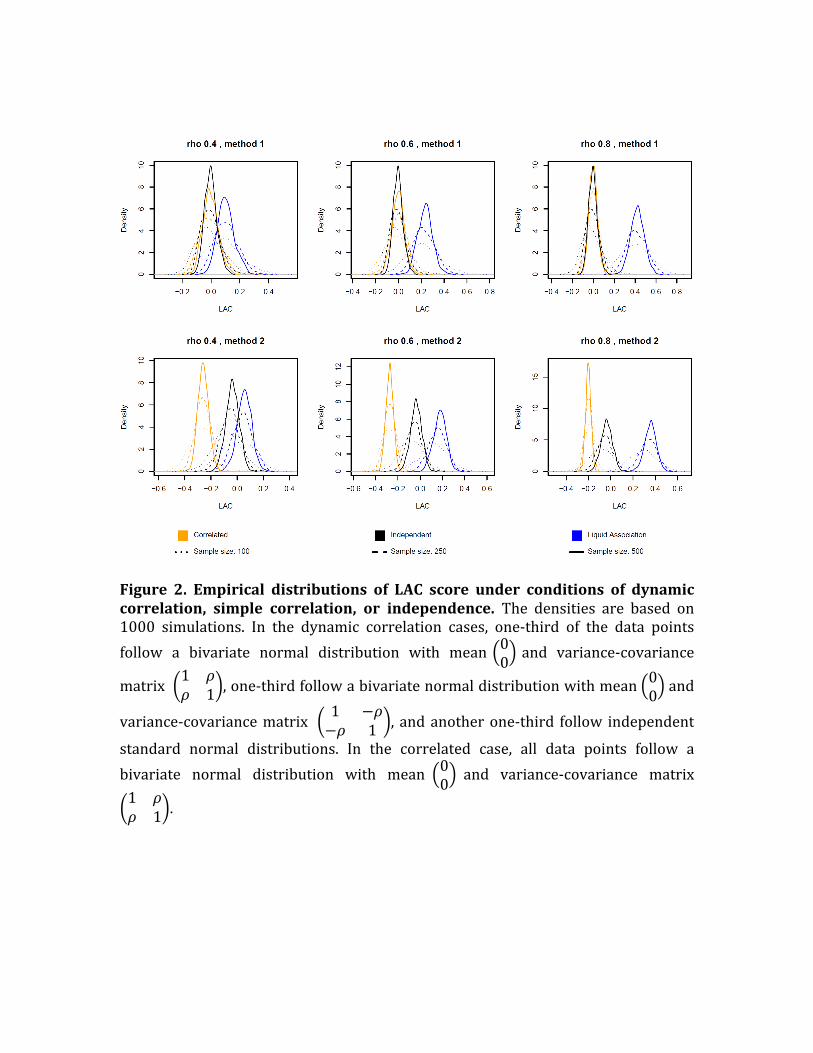
Figure 2. Empirical distributions of LAC score under conditions of dynamiccorrelation, simple correlation, or independence. The densities are based on1000 simulations. In the dynamic correlation cases, one-third of the data pointsfollow a bivariate normal distribution with mean 00 and variance-covariance
matrix 1 𝜌𝜌 1 ,one-thirdfollowabivariatenormaldistributionwithmean 00 and
variance-covariancematrix 1 −𝜌−𝜌 1 , andanotherone-third follow independent
standard normal distributions. In the correlated case, all data points follow abivariate normal distribution with mean 00 and variance-covariance matrix1 𝜌𝜌 1 .
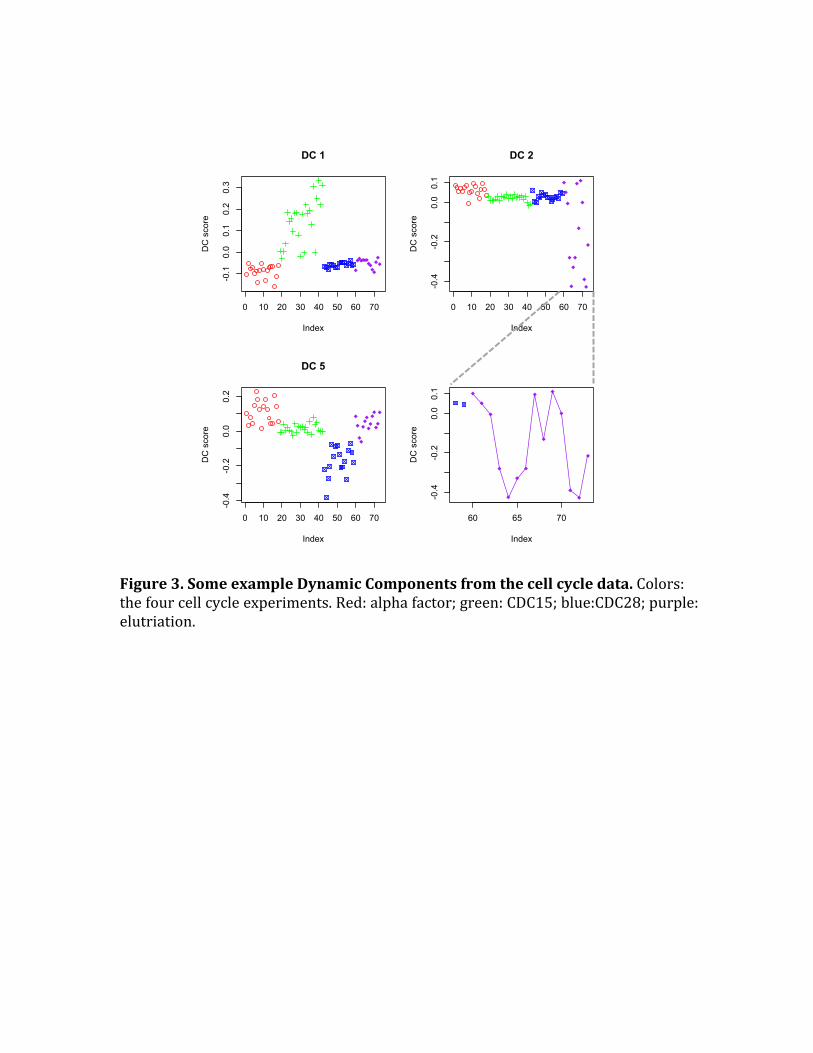
Figure3.SomeexampleDynamicComponentsfromthecellcycledata.Colors:thefourcellcycleexperiments.Red:alphafactor;green:CDC15;blue:CDC28;purple:elutriation.
0 10 20 30 40 50 60 70
-0.1
0.0
0.1
0.2
0.3
DC 1
Index
DC
sco
re
0 10 20 30 40 50 60 70
-0.4
-0.2
0.00.1
DC 2
Index
DC
sco
re
0 10 20 30 40 50 60 70
-0.4
-0.2
0.0
0.2
DC 5
Index
DC
sco
re
60 65 70
-0.4
-0.2
0.00.1
Index
DC
sco
re

Figure4.Biologicalprocesspairswithexcessivedynamiccorrelationsrelatedto DCs 2 and 5. Gene pairswere selected using fdr threshold of 0.01. Biologicalprocesspairswereselectedusingap-valuethresholdof0.001andfold-changeof2.For simplicity, only nodeswith connections above a certain threshold are shown.Node sizes reflect the total number of connections of each node. (a) Biologicalprocesspairsassociatedwiththe2ndDC.(b)Biologicalprocesspairsassociatedwiththe5thDC. (c)ExampleplotsofgenepairswithLArelationwithDC5.Redpoints:samples inthe lower33%ofDC5score;bluepoints:samples intheupper33%ofDC5score.

(a)(b)
(c)
Figure5.ResultsfromtheTCGABRCAdataset.(a)ScatterplotsofDC1,DC3,andDC7 scores. The points are colored based on the ER status of the subjects. DC1separates ER+ and ER-, while DC3 and DC7 have awide spread only for the ER-subjects. (b)DC1capturessimilar informationas thesecondprincipalcomponent.(c)SurvivalcurvesoftheER-negativesubjects,red:absolutefactorscore>0.05.

(a)
(b)
Figure6.Biologicalprocesspairswithexcessivedynamiccorrelationsrelatedto DCs 3 and 7. Gene pairswere selected using fdr threshold of 0.01. Biologicalprocesspairswereselectedusingap-valuethresholdof0.001andfold-changeof3.For simplicity, only nodeswith connections above a certain threshold are shown.Node sizes reflect the total number of connections of each node. (a) Biologicalprocesspairsassociatedwiththe3rdDC.(b)Biologicalprocesspairsassociatedwiththe7thDC.


![On the correlation of static and dynamic sti ness moduli ... · On the correlation of "static" and "dynamic" sti ness moduli of non- ... Alpan [17] introduced the tangent elastic](https://img.dokumen.tips/doc/110x75/5ae612687f8b9a08778c8da0/on-the-correlation-of-static-and-dynamic-sti-ness-moduli-the-correlation-of.jpg)


![Dynamic validation of model per correlation cal []](https://img.dokumen.tips/doc/110x75/616896b6d394e9041f70e32e/dynamic-validation-of-model-per-correlation-cal-.jpg)


