Embed Size (px)
Citation preview

DC-3/DC-3T Diagnostic Ultrasound System
Operator’s Manual [Advanced Volume]


i
Table of Contents
Table of Contents ............................................................................................ i Intellectual Property Statement ............................................................................................. I
Preface ................................................................................................................................. II
Safety Precautions .............................................................................................................. III
1 Measurement Overview ........................................................................ 1-1
1.1 Entering/Exiting Measurement ............................................................................... 1-1
1.2 Measurement Menu ............................................................................................... 1-1
1.3 Soft Menu ............................................................................................................... 1-3
1.4 Keys ........................................................................................................................ 1-3
1.5 Measurement Calipers ........................................................................................... 1-3
1.6 Result Window ....................................................................................................... 1-4
1.6.1 Display of Result Window ..................................................................................... 1-4
1.6.2 Moving Result Window ......................................................................................... 1-4
1.7 Measurement, Calculation and Study .................................................................... 1-4
1.8 Measurement Preset .............................................................................................. 1-5
1.9 Report ..................................................................................................................... 1-5
1.9.1 Viewing Report ..................................................................................................... 1-5
1.9.2 Editing Report ....................................................................................................... 1-6
1.9.3 Viewing History Report ......................................................................................... 1-8
1.9.4 Printing Report ...................................................................................................... 1-9
1.9.5 Exporting Report ................................................................................................... 1-9
1.9.6 Send reports to DICOM storage ......................................................................... 1-11
1.9.7 Fetal Growth Curve ............................................................................................ 1-11
2 Measurement Preset ............................................................................. 2-1
2.1 Preset of Measurement Parameters ...................................................................... 2-1
2.2 Obstetric Preset ...................................................................................................... 2-3
2.2.1 Obstetric Formulae ............................................................................................... 2-3
2.2.2 Obstetric Preset .................................................................................................... 2-6
2.3 Preset of Measurement Packages ....................................................................... 2-11
2.3.1 Entering Measurement Preset ............................................................................ 2-11
2.3.2 Preset of General Measurement Packages ....................................................... 2-11
2.3.3 Preset of Application Measurement Packages ................................................... 2-14

ii
2.3.4 User-defined Measurement ................................................................................ 2-18
2.4 Preset of Report Template .................................................................................... 2-22
2.4.1 Creating Report Template ................................................................................... 2-23
2.4.2 Editing Report Template ..................................................................................... 2-25
2.4.3 Deleting Report Template ................................................................................... 2-25
2.4.4 Exporting/ Importing Report Template ................................................................ 2-25
2.4.5 Setting Template Order ....................................................................................... 2-27
2.4.6 Setting Default Template .................................................................................... 2-28
2.5 Automatic Spectrum Calculation Parameters ....................................................... 2-28
3 General Measurements ......................................................................... 3-1
3.1 2D General Measurements .................................................................................... 3-1
3.1.1 Depth .................................................................................................................... 3-1
3.1.2 Distance ................................................................................................................ 3-2
3.1.3 Angle ..................................................................................................................... 3-2
3.1.4 Area ...................................................................................................................... 3-2
3.1.5 Volume .................................................................................................................. 3-3
3.1.6 Cross Line............................................................................................................. 3-4
3.1.7 Parallel Line .......................................................................................................... 3-5
3.1.8 Trace Length ......................................................................................................... 3-5
3.1.9 Distance Ratio ...................................................................................................... 3-5
3.1.10 Area Ratio ........................................................................................................... 3-6
3.1.11 B Profile .............................................................................................................. 3-6
3.1.12 B Histogram ........................................................................................................ 3-6
3.1.13 Color Velocity ...................................................................................................... 3-7
3.1.14 VF Diam .............................................................................................................. 3-7
3.2 M General Measurements ...................................................................................... 3-7
3.2.1 Distance ................................................................................................................ 3-7
3.2.2 Time ...................................................................................................................... 3-8
3.2.3 Slope ..................................................................................................................... 3-8
3.2.4 Velocity ................................................................................................................. 3-8
3.2.5 Heart Rate ............................................................................................................ 3-9
3.3 Doppler General Measurements ............................................................................ 3-9
3.3.1 Time ...................................................................................................................... 3-9
3.3.2 Heart Rate ............................................................................................................ 3-9
3.3.3 D Velocity ............................................................................................................ 3-10

iii
3.3.4 Acceleration ........................................................................................................ 3-10
3.3.5 D Trace ............................................................................................................... 3-10
3.3.6 PS/ED ................................................................................................................. 3-12
3.3.7 VF Diam .............................................................................................................. 3-12
3.3.8 Vol Flow(Diam) ................................................................................................... 3-13
3.4 References ........................................................................................................... 3-13
4 Abdomen Measurements ..................................................................... 4-1
4.1 Abdomen Measurement Tools ................................................................................ 4-1
4.2 Abdomen Exam Preparations ................................................................................ 4-3
4.3 Entering Abdomen Measurements ......................................................................... 4-3
4.4 Abdomen Measurement Operations ...................................................................... 4-3
4.5 Abdomen Exam Report .......................................................................................... 4-3
5 Obstetric Measurements ...................................................................... 5-1
5.1 Obstetric Measurement Tools ................................................................................. 5-1
5.2 Clinical GA .............................................................................................................. 5-5
5.3 Ultrasound GA ........................................................................................................ 5-5
5.3.1 GA in OB Items ..................................................................................................... 5-6
5.3.2 AUA ....................................................................................................................... 5-6
5.3.3 CUA ...................................................................................................................... 5-6
5.4 Obstetric Exam Preparations ................................................................................. 5-7
5.5 Multi-fetus Exam ..................................................................................................... 5-7
5.6 Entering Obstetric Measurements .......................................................................... 5-8
5.7 Obstetric Measurement Operations ....................................................................... 5-8
5.7.1 Measurement Tool Operations ............................................................................. 5-8
5.7.2 Calculation Tool Operations .................................................................................. 5-8
5.7.3 Study Tool Operation ............................................................................................ 5-8
5.8 Obstetric Exam Report ........................................................................................... 5-8
5.8.1 Fetal Biophysical Profile ....................................................................................... 5-9
5.8.2 Fetal Growth Curve ............................................................................................ 5-10
5.9 References ........................................................................................................... 5-12
6 Cardiac Measurements ......................................................................... 6-1
6.1 Cardiac Measurement Tools ................................................................................... 6-1
6.1.1 2D Cardiac Measurements ................................................................................... 6-1
6.1.2 M Cardiac Measurements .................................................................................... 6-3
6.1.3 Doppler Cardiac Measurements ........................................................................... 6-5

iv
6.2 Cardiac Exam Preparations ................................................................................... 6-8
6.3 Entering Cardiac Measurements ............................................................................ 6-8
6.4 Cardiac Measurement Operations ......................................................................... 6-9
6.4.1 Measurement Tool Operations ............................................................................. 6-9
6.4.2 Calculation Tool Operations .................................................................................. 6-9
6.4.3 Study Tool Operations .......................................................................................... 6-9
6.5 Cardiac Exam Report ........................................................................................... 6-41
6.6 References ........................................................................................................... 6-41
7 Gynecology Measurements ................................................................. 7-1
7.1 Gynecology Measurement Tools ............................................................................ 7-1
7.2 Gynecology Exam Preparations ............................................................................. 7-2
7.3 Entering Gynecology Measurements ..................................................................... 7-2
7.4 Gynecology Measurement Operations ................................................................... 7-2
7.4.1 Measurement Tool Operations ............................................................................. 7-2
7.4.2 Calculation Tool Operations .................................................................................. 7-2
7.4.3 Study Tool Operations .......................................................................................... 7-3
7.5 Gynecology Exam Report ...................................................................................... 7-4
7.6 References ............................................................................................................. 7-4
8 Vascular Measurements ....................................................................... 8-1
8.1 Vascular Measurement Tools ................................................................................. 8-1
8.2 Vascular Exam Preparations .................................................................................. 8-4
8.3 Entering Vascular Measurements .......................................................................... 8-4
8.4 Vascular Measurement Operations ........................................................................ 8-4
8.4.1 Measurement Tool Operations ............................................................................. 8-4
8.4.2 Calculation Tool Operations .................................................................................. 8-5
8.4.3 Study Tool Operations .......................................................................................... 8-5
8.5 Vascular Exam Report ............................................................................................ 8-7
8.6 References ............................................................................................................. 8-7
9 Small Parts Measurements ................................................................... 9-1
9.1 Small Parts Measurement Tools ............................................................................. 9-1
9.2 Small Parts Exam Preparations ............................................................................. 9-2
9.3 Entering Small Parts Measurements ...................................................................... 9-2
9.4 Small Parts Measurement Operations ................................................................... 9-2
9.4.1 Measurement Tool Operations ............................................................................. 9-2
9.4.2 Calculation Tool Operations .................................................................................. 9-2
v
9.4.3 Study Tool Operations .......................................................................................... 9-3
9.5 Small Parts Exam Report ....................................................................................... 9-3
9.6 Reference ............................................................................................................... 9-3
10 Urology Measurements ...................................................................... 10-1
10.1 Urology Measurement Tools ................................................................................. 10-1
10.2 Urology Exam Preparations ................................................................................. 10-2
10.3 Entering Urology Measurements .......................................................................... 10-2
10.4 Urology Measurement Operations ....................................................................... 10-2
10.4.1 Measurement Tool Operations ......................................................................... 10-2
10.4.2 Calculation Tool Operations .............................................................................. 10-3
10.4.3 Study Tool Operations ...................................................................................... 10-4
10.5 Urology Exam Report ........................................................................................... 10-5
10.6 References ........................................................................................................... 10-6
11 Orthopedics Measurements ............................................................... 11-1
11.1 Orthopedics Measurement Tools .......................................................................... 11-1
11.2 Orthopedics Exam Preparations .......................................................................... 11-2
11.3 Entering Orthopedics Measurements ................................................................... 11-2
11.4 HIP Measurement Operations .............................................................................. 11-2
11.5 Orthopedics Exam Report .................................................................................... 11-3
11.6 References ........................................................................................................... 11-3


I
© 2007-2010 Shenzhen Mindray Bio-Medical Electronics Co., Ltd. All rights Reserved.
For this Operator’s Manual, the issue date is 2010-06.
Intellectual Property Statement
SHENZHEN MINDRAY BIO-MEDICAL ELECTRONICS CO., LTD. (hereinafter called
Mindray) owns the intellectual property rights to this Mindray product and this manual. This
manual may refer to information protected by copyright or patents and does not convey any
license under the patent rights or copyright of Mindray, or of others.
Mindray intends to maintain the contents of this manual as confidential information.
Disclosure of the information in this manual in any manner whatsoever without the written
permission of Mindray is strictly forbidden.
IMPORTANT! 1. No part of this manual may be copied or reprinted, in whole or in part, without written
permission.
2. The contents of this manual are subject to change without prior notice and without our
legal obligation.

II
Preface
This manual details the procedures for operating the DC-3/DC-3T Diagnostic Ultrasound
System. Carefully read and understand the manual before using the system to ensure its
safe and correct operation.
NOTE: When you operate the system, you can refer to the following manuals:
(1) Operator’s Manual (Basic Volume)
(2) Acoustic output data
Depending on the software version, the preset settings, and optional configuration, the
actual interfaces may appear different from those shown in this manual.
NOTE: The functions described in this manual are not provided for all systems sold in all
regions. Functions that are available are dependent on the specific system you
purchased.
All the menus and screens in this manual take the system in full configuration as an example.

III
Safety Precautions
1. Meaning of Signal Words
In this manual, the signal words DANGER, WARNING, CAUTION
and NOTE are used regarding safety and other important instructions. The signal words and their meanings are defined as follows. Please understand their meanings clearly before reading this manual.
Signal word Meaning
DANGER Indicates an imminently hazardous situation that, if not avoided, will result in death or serious injury.
WARNING Indicates a potentially hazardous situation that, if not avoided, could result in death or serious injury.
CAUTION Indicates a potentially hazardous situation that, if not avoided, may result in minor or moderate injury.
NOTE Indicates a potentially hazardous situation that, if not avoided, may result in property damage.
2. Meaning of Safety Symbols
Symbol Description
"Attention" indicates the points that you should pay attention to. Be sure to read the Operator’s Manual concerning these points before using the system.

IV
3. Safety Precautions
Please observe the following precautions to ensure patient and operator’s safety when using
this system.
CAUTION: 1 Select the proper patient image and measurement tools. Only the professionals can decide the appropriate measurements and results.
2 Confine measurement calipers to the actual Region of Interest (RoI). Measurements that extend beyond the RoI will be incorrect.
3 Before examining a new patient, it is necessary to press the [End Exam] key to end the current scan and delete the patient information and data. Otherwise, new patient data will be combined with the previous patient.
4 When the system is turned OFF or the [End Exam] key is pressed, all the data that have not been saved are lost.
5 Changing modes during a measurement will delete the General Measurement data.
6 Pressing the [Freeze] key to unfreeze the image during a measurement will clear the General Measurement data.
7 Pressing the [Caliper] key during a measurement will clear the General Measurement data.
8 Pressing the [Clear] key will clear the measurement caliper, all data in the result window, comments and body mark.
9 Ensure that measurement data correctly corresponds to the fetus during the Obstetric Measurement.
10 Fully understand the functionality of this system by referring to the Operator’s manual - Basic Volume.
1-1
1 Measurement Overview
1.1 Entering/Exiting Measurement To enter General Measurements
Press the [Caliper] key to enter General Measurement and the General Measurement menu
is displayed.
To enter Application Measurements
Press the [Measure] key to enter Application Measurements and the Application
Measurement menu is displayed.
To exit measurements
Press the [Caliper] key to exit General Measurements, or press the [Measure] key to exit
Application Measurements.
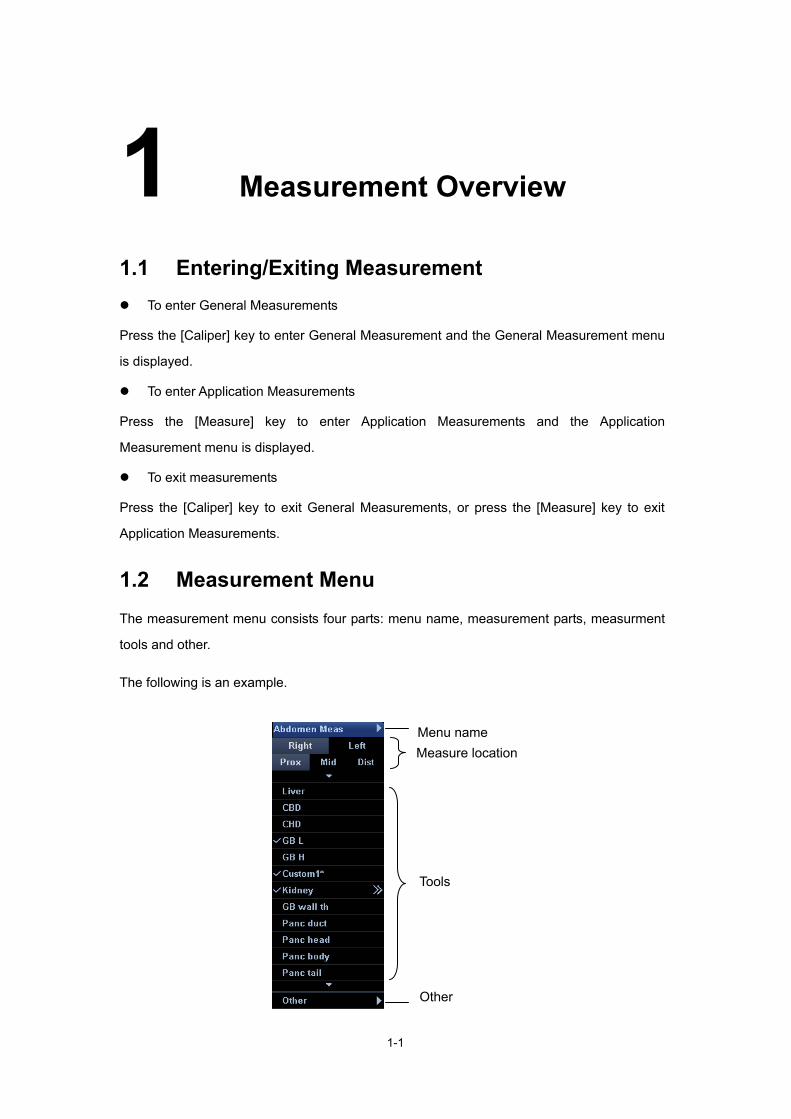
1.2 Measurement Menu The measurement menu consists four parts: menu name, measurement parts, measurment
tools and other.
The following is an example.
Tools
Measure location Menu name
Other

Measurement Overview
1-2
Menu name: displays the name of the measurement menu/package.
If there are more than one measurement menu/package in the current exam mode, a “►” is displayed in the menu name line.
Move the cursor to “►”, the submenu pops up and displays other measurement menus/packages in the current exam mode. Then move the cursor to an item in the submenu and press the [Set] key to enter the corresponding measurement menu/package
Measure Location: select the measure location.
If a tool in the menu is to measure parameters of left side or right side, move the cursor and press the [Set] key to select [Left] or [Right].
If a tool in the menu is to measure parameters in the Proximal, Middle or Distal vessel, move the cursor and press the [Set] key to select [Prox], [Mid] or [Dist].
Tools: activates tools contained in the current measurement package.
Move the cursor to a tool and then press the [Set] key to start the measurement.
When a tool has a submenu, it has >> on its right.
Move the cursor to the tool and press the [Set] key to enter its submenu;
In the submenu, move the cursor to a tool and press the [Set] key to start the
measurement;
After the measurement is completed, move the cursor to [Return] and press the
[Set] key to return to the upper menu.
When there are more than one page of tools, move the cursor to ▼ or ▲ and press the [Set] key to display the next or previous page.
A measurement tool that is not selectable and is grayed out cannot be used in the present image mode. Switch to the corresponding image mode to gain the access to the tool.
In the Application Measurement menu, √ is displayed before the tool that has been measured and the result has been obtained. (If one or some items in a submenu (extended menu) of a study are already performed, this study will be marked as measured.)
User-defined measurement and calculation: A “*” is displayed posterior to the item for identification.
Other: if several image modes (e.g. B+PW) are applied in imaging, you can switch to the
other modes by clicking here.

Measurement Overview
1-3
1.3 Soft Menu When the system is in Measurement status, the following selections appear in the soft menu:
Result (window): used to show or hide the result window.
PW Scope: Select waveform trace elements from Top (above baseline), Bottom (below baseline) or All (above and below baseline) for the Auto D Trace method in the PW Doppler Mode; It only appears in the PW Doppler mode.
Distance: Distance measurement on B or M Mode images.
EllipseArea: Area measurement using Ellipse method on B Mode images.
TraceArea: Area measurement using Trace method on B Mode images.
1.4 Keys The following keys on the Control Panel may be used during a measurement.
[Set]
• Activates a measurement;
• Fixes a point during a measurement;
• Ends the current step and starts the next step during a measurement;
• Ends the current measurement.
[Change]
• Changes the fixed end and active end of a caliper;
• Toggles between the measurements in the current menu or submenu.
[Back]
• Returns to the previous step during a measurement;
• Deletes the calipers with the reverse sequence of measurement operations.
Trackball: Moves the cursor.
[Report]: Opens/closes the exam report.
[Clear]: Clears comments, body mark, measurement calipers and values in the result
window.
1.5 Measurement Calipers A measurement caliper is drawn on the ultrasound image and consists of several points and
straight line or curve.

Measurement Overview
1-4
The display format of measurement calipers can be preset in the [System]->[Meas]
Preset dialog box. See “2.1 Preset of Measurement Parameters” for details.
The ends of calipers can be active or fixed. The active end is called Cursor.
The lines and points of calipers are green when active and white when fixed.
The ends of calipers use one of the following symbols. They use these icons circularly.
1.6 Result Window You can choose whether to display the measurement values on the screen through [Result]
item in the soft menu.
When [On] is selected, the result window will display the latest measurement values. If the
result window is full, new values will replace the old values.
1.6.1 Display of Result Window
You can preset the result window style and contents in the [System] Preset dialog box.
See “2.1 Preset of Measurement Parameters” for details.
The result window uses Number or Symbol to identify different measurements.
The result window displays the measurement data in real-time until the measurement is
completed.
1.6.2 Moving Result Window
To move the result window,
1 Move the cursor to the result window title and press the [Set] key.
2 Move the trackball to position the result window to the desired place.
3 Press the [Set] key to fix the result window.
1.7 Measurement, Calculation and Study Measurement: Results of measurements are directly obtained via the measurement tool,
indicated as “ ”.
Calculation: Results of calculations are automatically derived by the system, using other
measured or calculated values as parameters, indicated as “ ”.
If all measurement tools related to a calculation tool are completed, the system will
Measurement Overview
1-5
automatically complete the calculation result. If some measurement tools are performed
again, the system will automatically update the calculation result using the latest
measurement results.
Study: A group of measurement and / or calculations for a specific clinical application,
indicated as (collapsed) and (expanded).
1.8 Measurement Preset The following can be preset:
Measurement parameters
Obstetric
General Measurement
Application Measurement
Measurement reports
Auto spectrum calculation parameters
See “2 Measurement Preset” for details.
1.9 Report The report records measurement results. The system automatically saves results after each
measurement.
To enter the report dialog box,
Press the [Report] key.
The report dialog box shows the default report in the current exam mode. What the report
contains can be preset. See “2.1 Preset of Measurement Parameters” and “2.4 Preset of
Report Template” for details.
1.9.1 Viewing Report
The report only displays the results of tools that are preset in the report template and
are completed.
Each measurement result contains three latest values at most and a final value. Select
an option from [Method] to determine the final value. The options are [Last], [Avg], [Max]
and [Min].
For values that can calculate GA and SD, you can select another formula from [Author]

Measurement Overview
1-6
to re-calculate GA and SD.
Select [Previous] or [Next] to display the previous or next page if the report is more than
one page.
After viewing, press the [Report], [Freeze] or [Esc] key, or select [Cancel] or [OK] to
close the report dialog box.
1.9.2 Editing Report
CAUTION: Input appropriate data when editing the measurement values, otherwise misdiagnose may occur.
1 To edit a value in the report dialog box, move the cursor to the value and press the [Set] key, and then modify the value.
Only measurement values can be edited. Calculation values cannot be edited.
After a measurement value is modified, the average value of the tool and the corresponding calculation value will be updated automatically.
After deleting/modifying measurement results, all results and the caliper on the screen will be deleted.
2 If [Prompt], [Findings] and [Comments] are selected in the report template, you can input corresponding information in the report dialog box.
3 To clear all data except the patient information in the report dialog box, select [Clear All].

Measurement Overview
1-7
4 Select [Image Select] to pop up the following dialog box. Select the images to be added into the report in the dialog box.
In the dialog box, the left column displays the images saved in the current exam, and the right column displays the images to be added into the report.
(1) Add images to the right column.
Select an image in the left column and select [>] to add it into the right column.
Select [>>] to add all images in the left column to the right column.
Select an image in the right column and select [<] to clear it.
Select [<<] to clear all images in the right column.
(2) Select an image in the right column and then select [Move Up] or [Move Down] to move it. Image sequence in the right column is the one in the report.
(3) Select [OK] to confirm the setting; Or, select [Cancel] to abandon the setting.

Measurement Overview
1-8
5 Select [Analyze] to pop up the following dialog box. The dialog box shows the anatomy options that have been preset in the report template. Select the anatomy options to be added into the report in the dialog box.
(1) Enter or select a value from the right drop-down list of the anatomy options to display in the report.
(2) Click [Auto Fill], and all drop-down list display as “Seen” (if the item has this option).
(3) Select [Previous] or [Next] to display the previous or next page.
(4) If [Prompt], [Findings] and [Comments] are selected in the report template, you can input corresponding information in the dialog box.
(5) Select [OK] to confirm the setting; Or, select [Cancel] to abandon the setting.
6 Select [OK] to confirm the editing; Or, press the [Report] or [Esc] key or select [Cancel] to abandon the editing.
NOTE: Input appropriate data when editing the measurement values, otherwise misdiagnose may occur.
1.9.3 Viewing History Report
History reports can be viewed, but cannot be edited.
1 In the report dialog box, select from the [Exam] drop-down list to display the history report.

Measurement Overview
1-9
Select a report to view it.
2 [Clear All], [Analyze] and [Image Select] buttons are not available in the history report.
1.9.4 Printing Report
Select [Print] in the report dialog box to print a report; Or,
Select [Print View] in the report dialog box to pop up the [Preview] dialog box.
In the [Preview] dialog box,
• Select [Previous] or [Next] to view the previous or next page;
• Select a ratio from the drop-down list to zoom in / out the report preview;
• Select [Print] to print the report;
• Select [Close] to close the [Preview] dialog box.
1.9.5 Exporting Report
The reports can be exported as PDF or RTF documents, which can be viewed and edited on
a PC.

Measurement Overview
1-10
1 Select [Export] to pop up the following dialog box.
2 Select a drive from [Drive:].
3 To add a new directory,
(1) Move the cursor to a directory in the directory list and press the [Set] key twice. The new directory will be located under the directory selected.
To return to the upper directory, move the cursor to [..] and press the [Set] key twice.
(2) Select [New] to pop up the following dialog box.
(3) Input the new directory name.
(4) Select [OK] to complete adding the new directory; Or, select [Cancel] to abandon the new directory.
4 To delete a directory,
(1) Move the cursor to a directory in the directory list and press the [Set] key twice.
To return to the upper directory, move the cursor to [..] and press the [Set] key twice.
(2) Select [Delete] to pop up the following dialog box.

Measurement Overview
1-11
(3) Select [OK] to confirm the deletion; Or, select [Cancel] to abandon the deletion.
5 To rename a directory,
(1) Move the cursor to a directory in the directory list and press the [Set] key twice.
To return to the upper directory, move the cursor to [..] and press the [Set] key twice.
(2) Select [Rename] to pop up the following dialog box.
(3) Input the new name for the directory.
(4) Select [OK] to complete the renaming; Or, select [Cancel] to abandon the renaming.
6 Move the cursor to a directory in the directory list and press the [Set] key twice. The exported report file will be located in the directory selected.
To return to the upper directory, move the cursor to [..] and press the [Set] key twice.
7 Input the file name in [File]. The exported file will use the name.
8 Select the file type from [Type].
9 Select [OK] to export the report; Or, select [Cancel] to abandon the export.
1.9.6 Send reports to DICOM storage
Select [Send] on the report to send the full screen images of the report for storage.
Every page of the report will be as a single file to send.
1.9.7 Fetal Growth Curve
If the current report uses the obstetric template, and LMP is input in the patient information,
[OB] in the [Ultrasound Anatomy] is selected in the report template, the [Growth] button will
appear in the report dialog box after the related items are measured.
Select [Growth] to view fetal growth curve. See “5.8.2 Fetal Growth Curve” for details.

2-1
2 Measurement Preset
Before measuring, preset the following parameters.
Measurement parameters;
Obstetric preset;
General measurement packages;
Application measurement packages;
Report templates.
2.1 Preset of Measurement Parameters
To enter the Measurement Parameters Preset,
1 Press the [Setup] key to enter the [Setup] menu.
2 Select [System] in the menu to enter the [System] dialog box.
3 Select the [Meas] tab sheet to enter the Measurement Parameter Preset page.

Measurement Preset
2-2
4 You can preset the following parameters in the [Meas] tab sheet.
Measure Ruler
• Cursor Type: presets to use a Symbol or Number to mark a cursor.
• Cursor Size: presets the cursor size.
• Heart Beat: presets the number of cardiac cycle in a HR measurement.
• Cursor Line Display: presets whether to display the dotted line between the two ends of a caliper after a measurement is completed.
• Ellipse Cross Line Display: presets whether to display the cross line in the result window.
Measure Result
• Result Background: presets the background color of result window.
• Result Display: Presets whether to display all the measurement or the current measurement.
• SD Display: presets whether to display SD (standard deviation) in the result window.
• Vol Flow Method: presets the method to calculate the volume flow (by TAMEAN or TAMAX).
• EDD Display: presets whether to display EDD (Estimated Delivery Date) in the result window.
• Clear results while deleting caliper: Presets whether to clear measurement results when a capliper is removed.
ICA/CCA : Presets method to calculate the ICA and CCA ratio by clicking the radio button precede the Prox PS/Mid PS/Distal PS.The presetted method applies to both left and right side vessel.
• ICA
Prox PS(proximal)
Mid PS(middle)
Distal PS(distal)
• CCA
Prox PS(proximal)
Mid PS(middle)
Distal PS(distal)
Exam Report
• Trend Format: presets the number of growth graphs displayed in one screen in the [Obstetric Growth Curve] dialog box.
Unit
• Presets the units of Distance, Area, Volume, Time, Velocity, Slope, and Acceleration.

Measurement Preset
2-3
5 You can select [Load Factory] to restore the factory setups.
6 Select [OK] to confirm the preset and close the dialog box.
Or, select [Cancel] to cancel the preset and close the dialog box.
2.2 Obstetric Preset
2.2.1 Obstetric Formulae
The system provides the following GA (Gestational Age) formulae and FG (Fetal Growth)
formulae.
The “/” means no formula to the cressponding tool.
Tool GA formulae FG Formulae
GS (Gestation Sac) Tokyo
Rempen
Hansmann
China
Tokyo
Hellman
Rempen
Hansmann
CRL (Crown-rump Length) Tokyo
Jeanty
Hadlock
Nelson
Robinson
Rempen
Hansmann
China
ASUM
Tokyo
Hadlock
Robinson
Rempen
Hansmann
ASUM
BPD (Biparietal Diameter) Tokyo
Hadlock
Jeanty
Hansmann
Merz
Rempen
ChittyOI
Osaka
China
ASUM
NICOLAIDES
Tokyo
Hadlock
Kurtz
Sabbagha
Hansmann
Merz
Rempen
ChittyOI
Osaka
ASUM
NICOLAIDES

Measurement Preset
2-4
Tool GA formulae FG Formulae
HC (Head Circumference) Hadlock
Jeanty
Hansmann
ChittyPL
ASUM
NICOLAIDES
Hadlock
Merz
Hansmann
ChittyPL
ASUM
NICOLAIDES
AC (Abdominal Circumference) Hadlock
ASUM
NICOLAIDES
Hadlock
Jeanty
Merz
ChittyPL
ASUM
NICOLAIDES
FL (Femur Length) Tokyo
Hadlock
Jeanty
Hohler
Merz
Hansmann
Warda
Chitty
Osaka
China
ASUM
NICOLAIDES
Tokyo
Hadlock
Merz
Hansmann
O'Brien
Warda
Chitty
Osaka
ASUM
NICOLAIDES
OFD (Occipitofrontal Diameter) Hansmann Merz
Hansmann
APAD (Anteroposterior Abdominal Diameter)
/ Merz
TAD (Transverse Abdominal Diameter) / Merz
FTA (Fetal Trunk Cross-sectional Area) Osaka Osaka
THD (Thoracic Diameter) Hansmann Hansmann
APTD (Anteroposterior Trunk Diameter) / /
YS (Yolk Sac) / /
TTD (Transverse Trunk Diameter) / /
HUM (Humerus Length) Jeanty
ASUM
Merz
ASUM
Measurement Preset
2-5
Tool GA formulae FG Formulae
Ulna (Ulna Length) / Merz
Tibia (Tibia Length) / Merz
RAD (Radial Length) / Merz
FIB (Fibula Length) / Merz
CLAV (Clavicle Length) Yarkoni Yarkoni
TCD (Cerebellum Diameter) Hill
NICOLAIDES
Goldstein
Hill
NICOLAIDES
OOD (Outer Orbital Diameter) Jeanty /
Vertebrae / /
NT (Nuchal Translucency) / /
Cist Magna / NICOLAIDES
EFW1 Tokyo
Hadlock1 Hadlock2 Hadlock3 Hadlock4 Shepard Merz1 Merz2 Hansmann Tokyo Osaka Campbell
EFW2 Tokyo
Hadlock1 Hadlock2 Hadlock3 Hadlock4 Shepard Merz1 Merz2 Hansmann Tokyo Osaka Campbell
Mean Sac Diam / /
MCA PI / JSUM
MCA RI / JSUM
Umb A PI / JSUM
Umb A RI / JSUM

Measurement Preset
2-6
The following EFW formulea are available:
Formulae Descriptions Unit of
EFW Measure- ment tools
Hadlock1 EFW=10^(1.304+(0.05281*AC)+(0.1938*FL)-(0.004*AC*FL))
g cm
Hadlock2 EFW=10^(1.335-(0.0034*AC*FL)+(0.0316*BPD)+(0.0457*AC)+(0.1623*FL))
g cm
Hadlock3 EFW=10^(1.326-(0.00326*AC*FL)+(0.0107*HC)+(0.0438*AC)+(0.158*FL))
g cm
Hadlock4 EFW=10^(1.3596-(0.00386*AC*FL)+(0.0064*HC+(0.00061*BPD*AC)+ (0.0424*AC)+(0.174*FL))
g cm
Shepard EFW (Kg) =10^(-1.7492+(0.166*BPD)+(0.046*AC)-(2.646*AC*BPD/1000))
kg cm
Merz1 EFW=-3200.40479+(157.07186*AC)+(15.90391*(BPD^2))
g cm
Merz2 EFW=0.1*(AC^3) g cm
Hansmann EFW=(-1.05775*BPD)+(0.0930707*(BPD^2)+(0.649145*THD)-(0.020562*(THD^2)+0.515263
kg cm
Tokyo EFW=(1.07*(BPD^3))+(3.42*APTD*TTD*FL) g cm
Osaka EFW=(1.25674*(BPD^3))+(3.50665*FTA*FL)+6.3 g cm
Campbell EFW (kg)=EXP (-4.564+(0.282*AC)-(0.00331*(AC^2))) kg cm
EFW
EFW is a calculation tool. It is obtained by measuring multiple fetal parameters.
EFW supports multiple calculation formulae.
If all tools required for EFW formula have been performed, EFW will be obtained
automatically.
If some tools have been performed already, a new EFW will be calculated based on the
latest measurement.
2.2.2 Obstetric Preset
1 Press the [Setup] key to enter the [Setup] menu.
2 Select [System] in the menu to enter the [System] dialog box.
3 Select the [OB] tab sheet.
4 Select an option for EFW unit from the drop-down list on the right of [EFW].
5 To load the factory settings, select [Load Factory].

Measurement Preset
2-7
6 You can set the default formula, add a new formula, browse or edit a formula, and delete a user-defined formula.
See the following contents for details.
7 Select [OK] to confirm the settings; Or, select [Cancel] to abandon the settings.
Setting Default Formula
1 In the [OB] tab sheet, select a measurement tool in the left column.
2 Select the formula to be set as the default in the right column.
3 Select [Default]. The selected formula is set to the default and has a √.
Creating Formula
1 In the [OB] tab sheet, select a measurement tool in the left column.
2 Select [Add] to enter the [Add Obstetric Calculate Formula] dialog box.
3
There are four methods to add a new formula:
NOTE: The range of GA is 0~365 days and the range of SD is 0~70 days. To create an empty OB GA table:
(1) Select [Create Empty Table].
(2) Enter the name of the formula in the box after [Author Name:].

Measurement Preset
2-8
(3) Select [OK] to enter the new formula table.
(4) Set [SD Type] in the table.
(5) Set the Unit: Selects unit in the right drop-down list of [MeasValue], [GA] and [SD].
When setting to Week&Day, the GA or SD value is displayed in XXwXXd; and when setting to Day, the GA or SD value is displayed in XXXd. The unit will be added automatically after the numbers have been entered.
(6) Move the cursor to the position where new data will be added. Press the [Set] key to pop up an editable box. Then enter the corresponding data.
Here, The MeasValue and GA is mandatory, while SD(-) and SD(+) are optional (can be null or 0).
(7) Select [OK] to confirm the setting; Or, select [Cancel] to abandon the setting. To add an OB GA formula:
(1) Select [Add an OB GA Formula] in the [Add New OB GA Table] dialog box.
(2) Enter a name in the text field after the [Author Name:].

Measurement Preset
2-9
(3) Click [OK] to pops up the [OB GA Formula] dialog box.
(4) Set the [SD Type].
(5) Setting the [MeasValue] and the [Deviation Unit] from the right drop-down lists.
(6) Enter a formula and Deviation using [Meas Item], [Calculator] and [Function]. After a GA formula or deviation is entered, verify the accuracy by click the [Verify] key on the right.
Function usage:
Here, number. power, base are numbers or variables (mostly are measurement tools and could be added to the formula by double click the specified measurement tool):
Function Grammar Description
sin sin(number) Returns sine of number.
cos cos(number) Returns cosine of number.
tan tan(number) Returns tangent of number.
atan atan(number) Returns arctangent of number.
exp exp(number) Returns the power of e (exponent of number)
min min(number1, number2,…)
Returns the minimal of number1, number2,...
max max(number1, number2,…)
Returns the maximal of number1, number2,...
pow pow(number, power) Returns the power of number with exponent power.
sqr sqr(number) Returns square root value of number
ln ln(number) Returns natural logarithm of number
log log(number) Returns logarithm of number to the base 10
sqrt sqrt(number) Returns square root of number

Measurement Preset
2-10
abs abs(number) Returns absolute value of number
PI / Returns circumference ratio, with accuracy of 15 digits
To import an OB GA table or formula:
(1) Select [Import an OB GA Table or Formula] in the [Add New OB GA Table] dialog box.
(2) Select [OK] to pops up the [Load Data] dialog box.
(3) Select the drive and file path where the data stored.
(4) Select the data file to load.
(5) Select [OK] to comfirm the loading, or select [Cancel] to abandon. To copy an existing OB GA talbe or formula:
(1) Select [Copy an Existing OB GA Table or Formula].
(2) Select a formula in the list.
(3) Enter the name of the formula in [Author Name:].
(4) Click [OK] to pops up the [OB GA Table] dialog box.
(5) Editing the OB GA table refer to the step (4), step (5) and step (6) in "To create an empty OB GA table"
(6) Select [OK] to comfirm the editing or select [Cancel] to abandon.
Editing Formula
Only user-defined formulae can be edited.
1 In the [OB] tab sheet, select the measurement tool from the left column.
2 Select the formula to be edited in the right column.
3 Select [Edit] to enter the editing dialog box.
4 To change the formula name, enter the new name in [Author Name:].
5 To change the SD, set [SD Type].
Measurement Preset
2-11
6 Move the cursor to the position where data will be modified. Press the [Set] key to pop up an editable box. After modifying data, move the cursor to other places to continue modification.
7 Select [OK] to confirm the setting; Or, select [Cancel] to abandon the setting.
Deleting Formula
Only user-defined formulae can be deleted.
1 In the [OB] tab sheet, select the measurement tool from the left column.
2 Select the formula to be deleted in the right column.
3 Select [OK] to delete the formula; Or, select [Cancel] to cancel the deletion.
Browsing Formula
The formulae the system provides can be browsed, but cannot be edited or deleted.
1 In the [OB] tab sheet, select the measurement tool from the left column.
2 Select the formula to be browsed in the right column.
3 Select [Browse] to enter the formula editing dialog box.
4 After browsing, select [OK] or [Cancel] to exit the formula editing dialog box.
2.3 Preset of Measurement Packages
2.3.1 Entering Measurement Preset
To enter [Measure Preset] dialog box,
1 Press the [Setup] key to enter the [Setup] menu.
2 Select [Measure Preset] in the menu.
2.3.2 Preset of General Measurement Packages
You can respectively preset the General Measurement packages for 2D (B / Color / Power /
DirPower Mode), M Mode, or Doppler (PW / CW) Mode.
1 Open the [Measure Preset] dialog box.
2 Select an exam mode from [Exam Mode]. The package set is to be used in the exam mode selected.
3 Select the [Caliper] tab sheet.
4 Select the [2D], [M] or [Doppler] tab sheet.

Measurement Preset
2-12
The [Available Items] on the left side displays available General Measurement tools.
The [Selected Items] on the right side displays the tools to be added to the menu.
5 Select the tools you need from the [Available Items] and add them to the menu.
(1) To select the desired tool, move the cursor to it and then press the [Set] key to highlight it.
(2) [>]: Adds the tool selected from the [Available Items] into the [Selected Items].
[>>]: Adds all tools in the [Available Items] into the [Selected Items]. You do not need to select any tools before pressing this button.
[<]: Deletes the tool selected from the [Selected Items] to the [Available Items].
[<<]: Deletes all tools in the [Selected Items] to the [Available Items]. You do not need to select any tools before pressing this button.
6 Select a tool from [Selected Items] and then select [Move Up] or [Move Down] to move the tool. The sequence of tools displayed here will be the sequence in the menu.
7 To set the default tool, select a tool from [Selected Items] and then select [Default]. The default tool is marked with √.
As the system enters the General Measurement menu, the default tool will be automatically activated.
To cancel the default tool, select the default tool and then select [Default].

Measurement Preset
2-13
8 To modify the property of a tool, select the tool in [Selected Items] and then select [Property]. The following dialog box pops up.
The measurement item property dialogue box varies with the tools they belong to, How to set the properties of a measurement tool is shown in the following procedure, taken D trace as an example.
In the Property dialog box,
(1) What the table list shows are the results of D-trace measurement, of which, some results such as PS and ED can be obtained from simple measurement (e.g. velocity), while some items like TAMAX are obtained from more complicated method, e.g. Trace, Spline, and Auto. If just to display PS or ED, then only velocity can be selected for the measurement method; but if both PS and ED are selected, only 2.PT can be selected for the measurement; if both PS and TAMAX are selected, then only the more complicated measurement method will take effect.
Move the cursor to the check box at the right side of the item and then press the [Set] key to select or deselect it. The item selected has a “√”. Only the items selected can be displayed in the result window. PV is exclusive to the others, when PV is selected, other items (except the temporary result “velocity”) will disappear in the window.
(2) If the result displayed can be measured through more than one measurement methods, then you can select the default method from the drop-down list of Method.
(3) If there are several measurement methods can be used, “Online Select” will appear at the right side of Method.
If “Online Select” is selected, then the measurement methods can be selected during the measurement, and the methods selected here will be displayed as the default one;
If “Online Select” is not selected, the measurement method only can be selected here.
(4) Move the cursor to an item and then press the [Set] key to select the item. Then select [Move Up] or [Move Down] to move it. The item order in the list is also the item list in the result window.

Measurement Preset
2-14
(5) Results displayed in the window can be added to the measure menu in different ways.
• Select [Extended Sub Menu], the selected results will be displayed in the sub-menu of D trace in the measure menu.
• Select [Composite Menu], the selected results will be displayed in the measure menu independently.
[Online Select] is unavailable when the results listed separately and obtained via specific method.
(6) Select [OK] to conform the setting, Or, select [Cancel] to cancel the setting.
9 Select [Repeat], [Next] or [None] from [Measure Sequence]. [Repeat]: after the current measurement is completed, the system automatically
activates the current tool again.
[Next]: after the current measurement is completed, the system automatically activates the next tool in the menu.
[None]: after the current measurement is completed, the system automatically activate nothing. Select Composite Menu, the selected results will be displayed in the measure menu independently.
10 Select [OK] to confirm the settings and close the dialog box.
Or, select [Cancel] to cancel your settings and close the dialog box.
2.3.3 Preset of Application Measurement Packages
1 Open the [Measure Preset] dialog box.
2 Select an exam mode from [Exam Mode]. The packages set are to be used in the exam mode selected.
3 Select the [Measure] tab sheet.

Measurement Preset
2-15
4 To set different package in different image mode, do not select [Use same menu for all scan modes];
To set the same package in all scan modes, select [Use same menu for all scan modes].
5 If [Use same menu for all scan modes] is not selected, select a tab sheet from [2D], [M] and [Doppler].
6 [Measure Package] shows the package to be set. If it is blank, input the package name directly or refer to the next step to set the
default package.
If it shows the package name to be set, skip this step.
If it has a package name in it but the you want to set a new package, refer to the next step to create a new package and set it as the default.
If it has a package name in it but you want to set another existing package, refer to the next step to set the package as the default.
To change the package name, simply input the new name in it.
7 To create, delete or set a package, select [Advanced] to pop up the following dialog box.
In the dialog box, [Available Items] shows Application packages configured in the system; [Selected Items] shows Application packages configured in the current exam mode.

Measurement Preset
2-16
(1) To create a package, select [New] and the following dialog box pops up. Input the new package name and select [OK] in the dialog box.
(2) To delete a package, select it in [Available Items] and select [Delete].
(3) To move a package from [Available Items] to [Selected Items], Select a package in [Available Items] and select [>] to move it to [Selected
Items].
Select [>>] to move all packages in [Available Items] to [Selected Items].
Select a package in [Selected Items] and select [<] to move it to [Available Items].
Select [<<] to move all packages in [Selected Items] to [Available Items].
(4) Select a package in [Selected Items] and select [Move Up] or [Move Down] to move it.
(5) Select a package in [Selected Items] and select [Default] to set the package as the default of the exam mode (and image mode) selected.
(6) Select [OK] to confirm the setting; Or, select [Cancel] to abandon the setting.
8 Select a category from the drop-down list under [Available Items].
9 Select [Measurement], [Calculate] or [Study] from the drop-down list on the right of category drop-down list.
10 Select tools in the left column to the right column. The tools in the right column can appear in the menu.
(1) To add a sub-study item to the existing study, select the item from the [Available Items].
To add item to the root path of the [Selected Items], select the root directory, or select a certain item under the root directory, or select nothing.
(2) Add tools to the right column: Select a tool in the left column and select [>] to add it to the right column.
Select a tool in the right column and select [<] to delete it from the right column.
Select [>>] to add all tools in the left column to the right column.
Select [<<] to delete all tools in the right column.
(3) To set a tool in a study as the default, which is to be automatically activated as the study is entered, select the tool and select [Default]. The default tool has a “√”.
To deselect the default tool, select it and select [Default].
11 Return to the step 10 or 9 or 8 to add other tools into the right column.
12 To adjust the order of tools, select a tool in the right column and select [Move Up] or [Move Down]. The tool order in the right column is also the tool order in the menu.
Measurement Preset
2-17
13 To set the default tool, which is to be automatically activated as the package is entered, select the tool in the root of right column and select [Default]. The default tool has a “√”.
To deselect the default tool, select it and select [Default].
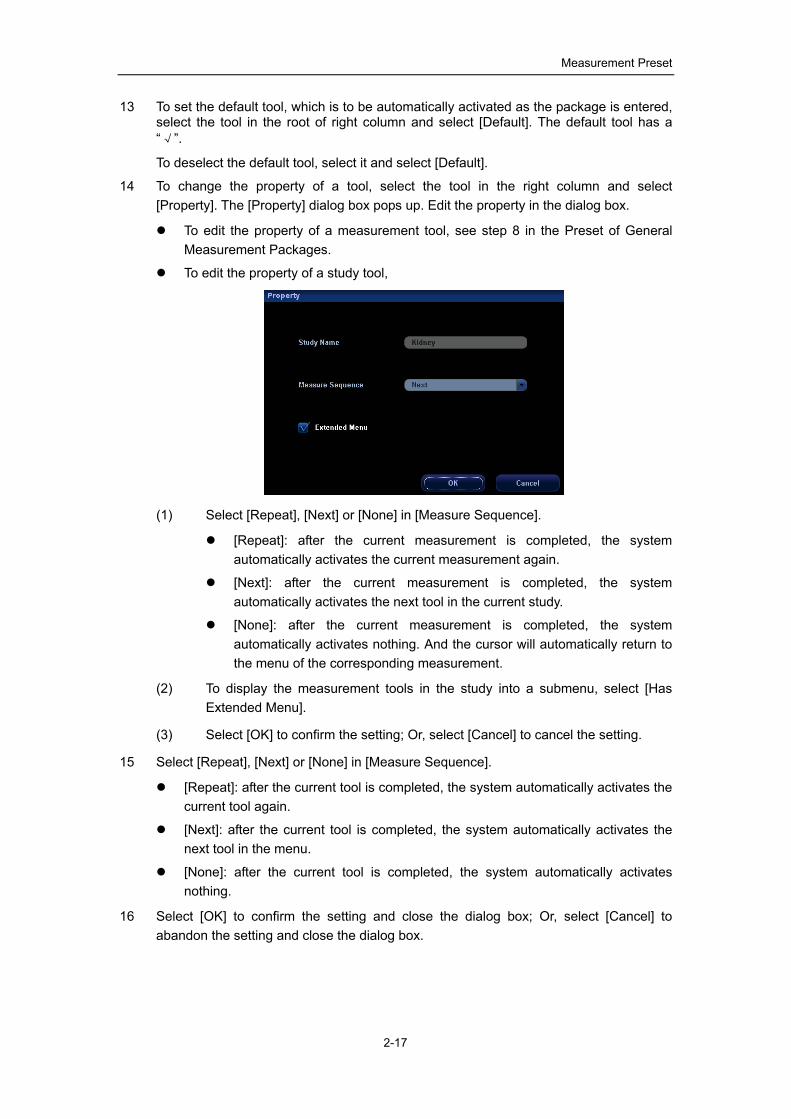
14 To change the property of a tool, select the tool in the right column and select [Property]. The [Property] dialog box pops up. Edit the property in the dialog box.
To edit the property of a measurement tool, see step 8 in the Preset of General Measurement Packages.
To edit the property of a study tool,
(1) Select [Repeat], [Next] or [None] in [Measure Sequence].
[Repeat]: after the current measurement is completed, the system automatically activates the current measurement again.
[Next]: after the current measurement is completed, the system automatically activates the next tool in the current study.
[None]: after the current measurement is completed, the system automatically activates nothing. And the cursor will automatically return to the menu of the corresponding measurement.
(2) To display the measurement tools in the study into a submenu, select [Has Extended Menu].
(3) Select [OK] to confirm the setting; Or, select [Cancel] to cancel the setting.
15 Select [Repeat], [Next] or [None] in [Measure Sequence].
[Repeat]: after the current tool is completed, the system automatically activates the current tool again.
[Next]: after the current tool is completed, the system automatically activates the next tool in the menu.
[None]: after the current tool is completed, the system automatically activates nothing.
16 Select [OK] to confirm the setting and close the dialog box; Or, select [Cancel] to abandon the setting and close the dialog box.

Measurement Preset
2-18
2.3.4 User-defined Measurement I. Enter [Measure Preset] -> [Measure] page, and make sure the [Exam Mode] and
[Measure Package] are correctly selected.
II. Select the position to place the user-defined measurement item on the right column. (Select the study firstly if you want to add user-defined item into a study).
III. Click [New].
The “Measurement Custom Wizard” dialog box pops up, as shown in the following figure.
Available functions:
Add user-defined measurement
Add user-defined calculation
Add user-defined study
2.3.4.1 User-defined Measurement 1. Input Name in the "Measurement Custom Wizard" dialog box, select the
[AppRegion], choose [Add Meas] and click [Next].
2. Select the [Tool Type], [Meas Method] and the Measure Result.

Measurement Preset
2-19
Descriptions of the attributes in the dialog box are shown in the following table.
Attributes Descriptions
Tool Type General measurement tool type of the user-defined item. E.g. select Area if you want to add a new item to measure the area.
Meas Method The measurement methods of the chosen tool. E.g. measurement methods of Area are Ellipse, Trace, Spline and Cross.
Has Multi-Fetus If selected, you can choose different fetus in the measurement menu. (Only available in Obstetric application region.)
Has Left-Right If selected, you can choose left or right side in the measurement menu.
Has Prox-Mid-Dist
If selected, you can choose proximal, middle or distal in the measurement menu.
Measure Result
Choose the result(s) to be displayed in the result window. The result name is changeable.
Move the cursor onto an item and press [Set], then input the name in the text box.
[Add]
Add a calculation item
With the user-defined formula and the parameters derived from the current result item of the measurement.
This new calculation appears as one of the current results.
See "User-defined Calculation" for details.
[Delete] Delete the selected result item.
[Modify] Used to modify the formula or parameters in the user-defined calculation.
[Move Up] / [Move Down] Adjusts the position of the item in the list as well as in the result window.
3. Click [Complete] to finish the setting. The user-defined measurement item lists in the menu. An asterisk appears posterior to the user-defined item for identification.

Measurement Preset
2-20
2.3.4.2 User-defined Calculation The user-defined calculation is derived from arithmetic operations, in which the parameters are measurement or calculation results obtained in measurement items existing in system or user-defined.
1. Input Name in the "Measurement Custom Wizard" dialog box, select the [AppRegion], choose [Add Calc] and click [Next].
2. Edit the formula.
Descriptions of the attributes in the dialog box are shown in the following table.
Attributes Descriptions
Formula Displays the user-defined formula.
Verify Used to verify the input value.
Meas Item All available measurement items of the application region selected in the previous step.
Calculator/ Function Used to input numbers and functions in the formula.
Calculate Result Used to set the Unit and the range of result.
NOTE: 1. Operator of the trigonometric functions is in degree, not radian.
2. The accuracy of PI is 15 digits.
1. Verify the formula and select the unit and range of the result, then click [Complete].
2. Click [Next] to set the measuring order of the items in the calculation if more than one measurement items are set as parameter in the formula.

Measurement Preset
2-21
3. Select the item in the [Operation List], then click [Move Up]/ [Move Down] to adjust the position.
4. Click [Complete] to return to the [Measure Preset] page.
The new added user-defined calculation displays in the [Selected Item] list. An asterisk appears posterior to the user-defined item for identification.
2.3.4.3 User-defined Study The user-defined study is to create an empty study, and add measurement, calculation or study tools (existing in system or user-defined) into it.

Measurement Preset
2-22
1. Input Name in the "Measurement Custom Wizard" dialog box, select the [AppRegion], choose [Add Study] and click [Next].
2. Click [Complete] and the empty study new added displays in the [Selected Item].
3. Select the user-defined study, add items into it. See "2.3.3 Preset of Application Measurement Packages" for details.
2.3.4.4 Removing User-defined Item Removing measurement/ calculation item
1. Select the user-defined measurement/ calculation item from the [Available Item] list.
2. Click [Delete]. The item is removed from Selected Items and Available Items.
Removing study item
1. Select a user-defined study from the [Selected Item] list.
2. Click [<] to delete it.
2.3.4.5 Importing/ Exporting User-defined Data Click [Import Custom]/ [Export Custom] in the [Measure Preset] page to import/ export the user-defined item data.
2.4 Preset of Report Template NOTE: Editing, importing, exporting and deleting are not supported by IMT and IVF and the
EM reports.
1 Enter the [Measure Preset] dialog box as the steps described in “2.3.1 Entering Measurement Preset”.

Measurement Preset
2-23
2 Select the [Report] tab sheet to enter the preset screen of report template.
In the preset screen of report template, you can create, edit and delete report templates, set default template and template order.
2.4.1 Creating Report Template
1 Enter the [Report] tab sheet in [Measure Preset] dialog box.
2 Select [New] to enter the editing dialog box of report template.

Measurement Preset
2-24
3 Input the template name in [Report Name].
4 Select a category in [Patient Info]. Different patient information items will be displayed in the report as different category is selected here. (If “Obstetric” is selected, item OB in the [Ultrasound anatomy] will be selected automatically; same with the vascular anatomy items when “Vascular” is selected in the [Patient Info].)
5 Select an option from [Ultrasound Image]. The option determines how many images are displayed in one row in the report.
6 Select a category from the drop-down list on the right of [Available Items].
7 Select [Measurement], [Calculate] or [Study] from the drop-down list on the right of the category drop-down list.
8 Add tools into the right column. Only the tools appear in the right column and are completed in the ultrasound check can be displayed in the report.
(1) If the tools selected in the following steps are to be located in the root of the right column, either select the root or select nothing in the right column;
If the tools selected in the following steps are to be located under some study, select the study in the right column.
(2) To create a new study,
(a) Select [Add Study] to pop up the following dialog box.
(b) Input the study name in the text box.
(c) Select [OK] to confirm the setting and the new study will appear in the right column of preset dialog box of report template.
Or, select [Cancel] to cancel the setting.
(3) Add tools to the right column.
Select a tool in the left column and select [>] to add it to the left column.
Select a tool in the right column and select [<] to delete it from the right column.
Select [>>] to add all tools in the left column to the right column.
Select [<<] to delete all tools in the right column.
9 Return to the step 6~8, add other tools into the right column.
10 Select a tool in the right column and select [Move Up] or [Move Down] to move it. The tool order in the right column is also the tool order in the report.
11 Select or deselect items in [Ultrasound Anatomy].
If the vascular anatomy item is selected, corresponding options will appear as the [Analyze] button in the report is selected.

Measurement Preset
2-25
12 Select or deselect [Comments], [Findings] and / or [Prompt] in [Ultrasound Remark]. If selected, the corresponding item will appear in the report.
13 Select [OK] to confirm the setting and close the dialog box; Or, select [Cancel] to abandon the setting and close the dialog box.
14 In the [Report] tab sheet, select [OK] and the new report template is adopted; Or, select [Cancel] and the new report template is cancelled.
2.4.2 Editing Report Template
1 Enter the [Report] tab sheet in [Measure Preset] dialog box.
2 Select the template to be modified in the list.
3 Select [Edit] to enter the editing dialog box of report template. See the steps 3-14 in “2.4.1 Creating Report Template” to edit the template.
4 In the [Report] tab sheet, select [OK] and the modified template is adopted; Or, select [Cancel] and the template is not modified.
2.4.3 Deleting Report Template
1 Enter the [Report] tab sheet in [Measure Preset] dialog box.
2 Select the template to be deleted in the list.
3 Select [Delete] and the following dialog box pops up.
4 In the dialog box, select [OK] to delete the template selected; Or, select [Cancel] and the template selected is not deleted.
5 In the [Report] tab sheet, select [OK] and the template deletion takes effect; Or, select [Cancel], the template deletion is cancelled and the template is not deleted.
2.4.4 Exporting/ Importing Report Template
Exporting Report Template
1 Enter the [Report] tab sheet in [Measure Preset] dialog box.
2 Select the template to export in the list.

Measurement Preset
2-26
3 Select [Export] to pop up the following dialog box.
4 Select a drive from the right drop-down list of [Drive:].
5 Move the cursor to a directory in the directory list and press the [Set] key twice.
Select [New], [Delete] and [Rename] to manage the directory. See 1.9.5 Exporting Report.
6 Input the file name in [File].
7 Select [OK] to export the template; Or, select [Cancel] to abandon.
Importing Report Template
1 Enter the [Report] tab sheet in [Measure Preset] dialog box.

Measurement Preset
2-27
2 Enter the [Report] tab sheet in [Measure Preset] dialog box.
3 Select a drive from the right drop-down list of [Drive:].
4 Select the drive where the report template located from the right drop-down list of [Drive:].
Select [New], [Delete] and [Rename] to manage the directory. See 1.9.5 Exporting Report.
5 Select the report template to be imported in the right side file list.
6 Select [OK] to import the report template; Or, select [Cancel] to cancel the importing, and system will prompt “Import failed”.
7 If this report template already existed (the system tells if the template already existed according to the template name, but not by the file name), the following dialog box will pop up.
Select [OK] to replace the existed template; Or, select [Cancel] to abandon.
2.4.5 Setting Template Order
1 Enter the [Report] tab sheet in [Measure Preset] dialog box.
2 Select the template to be moved in the list.
3 Select [Move Up] or [Move Down] to move the template selected.
4 Repeat the steps 2-3 to move other templates if necessary.

Measurement Preset
2-28
5 Select [OK] to confirm the moving; Or, select [Cancel] to abandon the moving.
2.4.6 Setting Default Template
1 Enter the [Report] tab sheet in [Measure Preset] dialog box.
2 Select an exam mode from [Exam Mode].
3 Select a report template in the list.
4 Select [Default] to set the report template selected as the default in the exam mode selected.
5 Select [OK] to confirm the setting; Or, select [Cancel] to abandon the setting.
2.5 Automatic Spectrum Calculation Parameters
The system has parameter automatic calculation function, this means you can obtain a
group of clinical indices by tracing Doppler spectrum. The function can be performed in
real-time, in frozen image and in cine status (including the cine files).It can be preset
whether the automatically calculated value will be displayed in the result window or not.
1 Enter the [Parameter] tab sheet in [Measure Preset] dialog box.
2 Move the cursor to an item and press the [Set] key to select it.
3 Select [OK] to confirm the setting; Or, select [Cancel] to abandon the setting.
3-1
3 General Measurements
There are three types of General Measurement menus available:
2D
M Mode
Doppler (PW / CW) Mode
To perform General Measurements,
1 After the preset, enter corresponding exam mode and image mode.
2 Scan and freeze the image.
3 Press the [Caliper] key to enter the General Measurement.
4 Select a tool in the General Measurement menu to start the measurement.
Also, some measurements can be performed via the soft menu controls.
The following operations are performed on Freeze images by default.
3.1 2D General Measurements
3.1.1 Depth
Function: measures the distance
From the sector center of image to a certain point in the case of phased array
transducers;
Or, from the transducer surface to a certain point in the direction of ultrasonic wave in
the case of convex array or linear array transducers.
1 On a 2D image, select a tool (if it has set the Depth to be displayed in the result window) in the menu.
2 Move the cursor on the image and the depth value is obtained. Once the [Set] key is pressed, the depth value disappears.
Or,
1 Select [Depth] in the menu.
2 Use the trackball to move the cursor to the desired point.
3 Press the [Set] key.

General Measurements
3-2
3.1.2 Distance
Function: measures the distance between two points on the image.
1 Select [Distance] in the menu.
2 Use the trackball to move the cursor to the starting point.
3 Press the [Set] key to fix the starting point.
4 Use the trackball to move the cursor to the end point.
Or, press the [Back] key to cancel the fixed starting point;
Or, press the [Change] key to exchange the locations of the cursor and the fixed starting point.
5 Press the [Set] key to fix the end point.
3.1.3 Angle
Function: measures the angle formed by two crossing planes on the image; range: 0°-180°.
1 Select [Angle] in the menu.
2 Use the method for distance measurement to fix line segments A and B respectively.
3.1.4 Area
Function: measures the area and circumference of a closed region on the image. Four
measurement methods are available: Ellipse, Trace, Cross, and Spline.
Ellipse
1 Select [Ellipse] from the drop-down list on the right of [Area] in the menu.
2 Move the cursor to an area of interest. Press the [Set] key to anchor the starting point of the fixed axis of the ellipse.
3 Move the cursor to position the end point of the fixed axis of the ellipse.
Or, press the [Change] key to switch between the fixed end and active end;
Or, press the [Back] key to activate the fixed end.
4 Press the [Set] key.
5 Move the trackball will increase or decrease the ellipse from the fixed axis.
Move the trackball to trace the area of interest as closely as possible.
Or, press the [Change] or [Back] key to return to the step 3.
6 Press the [Set] key to anchor the ellipse region.
Trace
1 Select [Trace] from the drop-down list on the right of [Area] in the menu.
2 Move the cursor to the measurement starting point. Press the [Set] key to fix the starting point.

General Measurements
3-3
3 Use the trackball to move the cursor along the edge of the desired region and draw out the trace line.
To correct the trace line, rotate the Multifunctional Knob to recede or advance the trace line.
4 The trace line will close as a loop between the starting and end points when [Set] is pressed or when the cursor is very near to the starting point.
Cross
1 Select [Cross] from the drop-down list on the right of [Area] in the menu.
2 Move the cursor to the measurement starting point. Press the [Set] key to fix the starting point.
3 Use the trackball to position the end point of the first axis and then press the [Set] key. Another dashed axis and dashed close region appears. The second axis is perpendicular to the fixed axis.
4 Move the trackball to position the second axis.
5 Press the [Set] key to fix the one end of the second axis.
Or, press the [Change] or [Back] key to cancel the fixed axis.
6 Move the trackball to position the end point of the second axis.
Or, press the [Change] key to switch between the fixed end of the second axis and the cursor.
Or, press the [Back] key to cancel the fixed end of the second axis.
7 Press the [Set] key to anchor the length of the second axis.
Spline
1 Select [Spline] from the drop-down list on the right of [Area] in the menu.
2 Move the cursor to the measurement starting point. Press the [Set] key to fix the starting point.
3 Move the trackball along the area of interest. Press the [Set] key to anchor the second point. A closed region whose shape is to be determined appears on the screen.
4 Move the trackball along the area of interest further to position the third, fourth … points.
To correct a previous point, press the [Back] key.
A maximum of 12 points can be anchored to create the trace area along the area of interest as much as possible.
5 Press the [Set] key to anchor the final point and then press this key again.
3.1.5 Volume
Function: measures the volume of the target object. Three measurement methods are
available:
3Dist: measures the lengths of the three axes of the target object. The formula is V =
(π/6) ×D1×D2×D3.
Ellipse: measures the vertical section of the target object. The formula is V =
(π/6)×A×B2, in which, A is the long axis of the ellipse and B is the short axis.

General Measurements
3-4
EDist: measures both the vertical and horizontal sections of the target object. The
formula is V = (π/6)×A×B×M, in which, A and B are defined the same as in the Ellipse
method and M is the length of the third axis.
3Dist
1 Select [3Dist] from the drop-down list on the right of [Volume] in the menu.
2 Use the method for distance measurement to measure the lengths of three axes.
Ellipse
1 Select [Ellipse] from the drop-down list on the right of [Volume] in the menu.
2 The steps of Ellipse-Volume measurement method are similar to those of Ellipse for area measurement. Refer to Ellipse in section “3.1.4 Area”.
EDist
1 Select [EDist] from the drop-down list on the right of [Volume] in the menu.
2 Use the Ellipse method to measure the area of the vertical section. Refer to Ellipse in section “3.1.4 Area”.
3 Unfreeze the image. Rescan the area of interest perpendicular to the previous image.
4 Freeze the image again.
Use the method for distance measurement to measure the length of the third axis.
3.1.6 Cross Line
Function: measures the lengths of line segments A and B perpendicular to each other.
1 Move the cursor to [Cross] in the menu. Press the [Set] key.
2 Move the cursor to the measurement starting point. Press the [Set] key to fix the starting point.
3 Move the trackball to the end point of the first line segment.
Press the [Set] key to confirm the operation. Another line segment perpendicular to the fixed line segment appears on the screen. This line segment can be repositioned.
Or, press the [Change] key to switch between the fixed end and the active end.
Or, press the [Back] key to cancel the fixed starting point.
4 Move the trackball to the starting point of the second line segment.
Press the [Set] key to confirm the starting point.
Or, press the [Change] or [Back] key to return to the previous step.
5 Move the trackball to the end point of the second line segment.
Or, press the [Change] key to switch between the fixed end and the active end.
Or, press the [Back] key to cancel the previous operation and the end point.
6 Press the [Set] key to confirm the end point of the second line segment.

General Measurements
3-5
3.1.7 Parallel Line
Function: measures the distance between every two line segments of five parallel line
segments, namely, four distances in total.
1 Move the cursor to [Parallel] in the menu. Press the [Set] key.
2 Use the trackball to locate the point of intersection of the cursor at the baseline of the line segment to be measured. Rotate the Multifunctional Knob to change the angle of the baseline and then press the [Set] key to confirm it. A dash line appears starting with a short transverse line, indicating the position of the first parallel line.
3 Use the trackball to position the position of the second parallel line.
Press the [Set] key to confirm the operation. Short parallel lines appear at the original baseline.
Or, press the [Change] key to switch between the fixed end and the active end.
Or, press the [Back] key to cancel the previous operation.
4 Continue moving the trackball to position the third, fourth, and fifth parallel lines.
When the fifth parallel line is anchored, the tail end of the baseline is determined. T
3.1.8 Trace Length
Function: measures the length of a curve on the image. Measurement methods available
include Trace and Spline.
Trace
1 Select [Trace] from the drop-down list on the right of [Trace Len] in the menu.
2 Move the cursor to the measurement starting point. Press the [Set] key to fix the starting point.
3 Use the trackball to move the cursor along the target to draw out the trace line. To correct the trace line, rotate the Multifunctional Knob anticlockwise to cancel some points and clockwise to restore some points.
4 Press the [Set] key to anchor the end point of the trace line.
Spline
1 Select [Spline] from the drop-down list on the right of [Trace Len] in the menu.
2 Move the cursor to the measurement starting point. Press the [Set] key to fix the starting point.
3 Move the trackball along the target and press the [Set] key to anchor the second, third, fourth … points. A maximum of 12 points can be anchored. The points are connected by smooth curves. Press the [Set] key twice to anchor the final point, namely, the end point.
To correct a previous point, press the [Back] key.
3.1.9 Distance Ratio
Function: measures the lengths of two line segments and then calculates their ratio.
1 Move the cursor to [RatioDist] in the menu. Press the [Set] key.

General Measurements
3-6
2 Use the method for distance measurement to measure two line segments A and B.
3.1.10 Area Ratio
Function: measures the area of two closes regions and then calculates their ratio.
1 Select a method from the drop-down list on the right of [RatioArea]. The methods are Ellipse, Trace, Cross, Spline.
2 Use the area method to measure the area of Region 1 and Region 2 respectively. Refer to the section “3.1.4 Area”.
3.1.11 B Profile
Function: measures the gray distribution of ultrasonic echo signals on a line.
Profile must be measured on the frozen image.
1 Select [B-Profile] in the menu.
2 Refer to the method for distance measurement. When the measurement completes, the gray distribution on the measured line appears on the screen, where the horizontal axis stands for the length of the line segment and the vertical axis for the gray of the image, as shown below:
Gmax:144Gmin:0
Gmean:55Gsd:24
No:1
3.1.12 B Histogram
Function: measures the gray distribution of ultrasonic echo signals within a closed region.
Measurement methods available include Rect (Rectangle), Ellipse, Trace, and Spline.
Histogram must be measured on the frozen image.
1 Select [B-Hist] in the menu.
2 When Rectangle method is used, first anchor one end of the rectangle. Then move the cursor to see floating dashed line frame of the rectangle. Anchor another end of the rectangle based on the target position. The rectangle region is anchored. The measurement ends.
When Ellipse, Trace, and Spline methods are used, refer to these methods used for area measurement respectively.

General Measurements
3-7
3 After the measurement completes, the result displays on the screen. The horizontal axis stands for the gray of the image and the vertical axis for the gray distribution percentage.
4676N:34M:34%MAX:24SD:
1No:
3.1.13 Color Velocity
Hint: This tool is only applied for evaluation, not for precise measurement.
Function: measures the velocity of blood flow on the Color Mode image.
Color velocity must be measured on the frozen image.
1 In the Color Mode, select [Color Vel] in the menu.
2 Move the cursor to the point to be measured for blood flow velocity and press the [Set] key to fix the point. A floating line is displayed in the direction parallel to the ultrasonic wave beam at that point. The compensation angle A is 0°.
3 Rotate the Multifunctional Knob to change the compensation angle within the range of 0°-80º to align the floating line in the direction same to that of blood flow at the point to be measured.
4 Press the [Set] key to fix the direction of blood flow.
3.1.14 VF Diam Function: measures the distance between two points on the image to obtain the vessel flow
diameter.
1 Select [VF Diam] in the menu.
2 Use the trackball to move the cursor to the starting point.
3 Press the [Set] key to fix the starting point.
4 Use the trackball to move the cursor to the end point.
Or, press the [Back] key to cancel the fixed starting point;
Or, press the [Change] key to exchange the locations of the cursor and the fixed starting point.
5 Press the [Set] key to fix the end point.
3.2 M General Measurements
3.2.1 Distance
Function: measures the distance between two points on the M Mode image.

General Measurements
3-8
1 Select [Distance] in the M Mode menu.
2 Move the cursor to the measurement starting point and press the [Set] key.
3 Move the cursor to the end point.
Or, press the [Change] key to switch between the fixed end and active end.
Or, press the [Back] key to delete the starting point just anchored.
4 Press the [Set] key.
3.2.2 Time
Function: measures the time interval between two points on the M Mode image.
1 Select [Time] in the M Mode menu.
2 Move the cursor to the measurement starting point and press the [Set] key. The starting point displays the big fixed mark “ ”. ┆
3 Use the trackball to move the cursor. The result window displays the real-time measurement value.
Or, press the [Change] key to switch between the fixed end and active end.
Or, press the [Back] key to delete the starting point just anchored.
4 Use the trackball to move the cursor to the measurement end point and press the [Set] key.
3.2.3 Slope
Function: measures the distance and time between tow points on the M Mode image and
calculates the slope between the two points.
1 Select [Slope] in the M Mode menu.
2 Move the cursor to the measurement starting point and press the [Set] key.
3 Use the trackball to move the cursor. The big “+” cursor and the “ ” marked starting point are always connected by a dash line.
Or, press the [Change] key to switch between the fixed end and active end in the measurement.
Or, press the [Back] key to delete the starting point just anchored.
4 Move the big “+” cursor to the measurement end point and press the [Set] key.
3.2.4 Velocity
Function: measures the distance and time between tow points on the M Mode image and
calculates the average velocity between the two points.
1 Select [Velocity] in the M Mode menu.
2 Move the cursor to the measurement starting point and press the [Set] key. The starting point displays the fixed mark “ ”.

General Measurements
3-9
3 Use the trackball to move the cursor. The big “+” cursor and the “ ” marked starting point are always connected by a dash line. The result window displays the real-time measurement value.
Or, press the [Change] key to switch between the fixed end and active end in the measurement.
Or, press the [Back] key to delete the starting point just anchored.
4 Use the trackball to move the big “+” cursor to the measurement end point. Press the [Set] key.
3.2.5 Heart Rate
Function: measures the time interval between n (n≤8) cardiac cycles on the M Mode image
and calculates the heart rate.
The number of cardiac cycles can be preset in the [System] -> [Meas] preset dialog box.
The HR result in the result window, as shown in the figure below, displays the measured
heart rate value and the preset number of cardiac cycles.
Heart Rate Number of Cardiac Cycles
CAUTION: During the measurement, the number of cardiac cycles between the measurement start and end points must be the same as that preset. Otherwise, misdiagnosis may occur.
1 Select [Heart Rate] in the M Mode menu.
2 Refer to the operation of Time measurement in the M Mode.
3.3 Doppler General Measurements
3.3.1 Time
Function: measures the time interval between two points on PW Doppler image.
The operations are similar to the Time measurement in M Mode. See “3.2.2 Time” for details.
3.3.2 Heart Rate
Function: measures the time interval between n (n≤8) cardiac cycles on the PW Doppler
image and calculates the heart rate.
The operations are similar to the Heart Rate measurement in M Mode. See “3.2.5 Heart
Rate” for details.

General Measurements
3-10
3.3.3 D Velocity
Function: measures the velocity, pressure gradient and correction angle of a certain point on
the PW Doppler spectrum
1 In the PW Doppler Mode, select a tool in the menu (if the tool has set the D Velocity to be displayed in the result window).
2 Move the cursor on the spectrum and the velocity value is obtained in real-time. Once the [Set] key is pressed, the velocity value disappears.
Or,
1 Select [D Vel] in the PW / CW Doppler Mode menu.
2 Move the cursor to the point to be measured for velocity and press the [Set] key.
3.3.4 Acceleration
Function: measures the velocities of two points and their time interval on the PW Doppler
Mode image, and calculates the acceleration, pressure gradient, velocity difference and
correction angle.
1 Select [Acceleration] in the PW / CW Doppler Mode menu.
2 Move the cursor to the first point to be measured for velocity and press the [Set] key to fix the point.
3 Move the cursor to the second point to be measured for velocity and press the [Set] key to fix the point.
3.3.5 D Trace
Function: measures clinical indexes through tracing PW Doppler spectrum. Measurement
methods available are 2 PT (Two Points), Manual, Spline, and Auto.
The following figure shows the Doppler spectrum.
A cardiac cycle
DiastoleSystole
a b
ps
WDED Baseline
The following parameters can be obtained through one D trace:
PS: Peak Systolic Velocity. Measures the fastest velocity of red blood cell that crosses
the sample volume.

General Measurements
3-11
ED: End-Diastolic Velocity. Measures the blood velocity at the end of the cardiac cycle.
TAMAX: Time Averaged Maximum Velocity
TAMEAN: Time Averaged Mean Velocity.
PI: Pulsatile Index. PI (No unit) = |(PS (m/s) – ED (m/s)) / TAMAX (m/s)|
RI: Resistance Index. RI (No unit) = |(PS (m/s) – ED (m/s)) / PS (m/s)|
S/D: PS/ED. S/D (No unit) = PS (m/s) / ED (m/s)
HR: Heart Rate.
Vel: Flow velocity.
PV: Peak Velocity of diastolic and systolic cycle, that is, the speed of the fastest velocity
of red blood cells cross the sample volume, and it can be used in vain vascular
measurement.
MD: Minimum Diastolic Velocity.
PPG: PG time-averaged Peak Systolic Velocity. It is the corresponding pressure
gradient of the peak systolic velocity. PPG (mmHg) = 4 × PS (m/s)2
MPG: Maximum Pressure gradient.
MMPG: Mean velocity Mean Pressure Gradient. (Obtained in auto-spectrum
calculation.)
VTI: Velocity-time Integral. It is the integral of the product of Doppler instantaneous
velocity and the total time interval.
D/S: ED/PS. D/S (No unit) = ED (m/s) / PS (m/s)
AT: Systolic Acceleration Time. It is the time of the blood velocity accelerating from the
end of diastole to the systolic peak.
DT: Deceleration Time
θ: Correction angle, which is the spectrum angle during measurement.
2 PT
1 Select [2 PT] from the drop-down list on the right of [D Trace] in the menu.
2 Move the cursor to the starting point to be measured and press the [Set] key to fix the point.
3 Move the cursor to the end point to be measured and press the [Set] key to fix the point.
Manual
1 Select [Manual] from the drop-down list on the right of [D Trace] in the menu.
2 Move the cursor to the starting point to be measured and press the [Set] key to fix the point.

General Measurements
3-12
3 Move the cursor along the edge of the target region.
Move the cursor right to draw a trace line overlapping the spectrum as much as possible. Move the cursor left or rotate the Multifunctional Knob anticlockwise to correct the trace line already drawn.
4 Trace the end point to be measured and press the [Set] key to fix the point.
Spline
1 Select [Spline] from the drop-down list on the right of [D Trace] in the menu.
2 Move the cursor to the starting point to be measured and press the [Set] key to fix the point.
3 Move the cursor along the edge of the desired region. Continue to fix the second, third …point (50 points at most) of spectrum. The points are connected by smooth curve.
4 When there are 50 points fixed, the measurement ends automatically.
If it is necessary to end the measurement when there are less than 50 points fixed, press the [Set] key twice continuously at the final point.
Auto
Auto D trace must be performed on the Freeze image.
1 Select [Auto] from the drop-down list on the right of [D Trace] in the menu.
2 Move the cursor to the starting point to be measured and press the [Set] key to fix the point.
3 Move the cursor to the end point to be measured and press the [Set] key to fix the point.
3.3.6 PS/ED
Function: measures the velocities of Systolic Peak (PS) and Diastolic End (ED) on the PWr
Doppler spectrum, and calculates their pressure gradient, resistance index (RI), S/D and
correction angle.
1 Select [PS/ED] in the PW Doppler Mode menu.
2 Move the cursor to the Systolic Peak and press the [Set] key to fix the point.
3 Move the cursor to the Diastolic End and press the [Set] key to fix the point.
3.3.7 VF Diam Function: measures the distance between two points on the image to obtain the vessel flow
diameter.
1 Select [VF Diam] in the menu.
2 Use the trackball to move the cursor to the starting point.
3 Press the [Set] key to fix the starting point.

General Measurements
3-13
4 Use the trackball to move the cursor to the end point.
Or, press the [Back] key to cancel the fixed starting point;
Or, press the [Change] key to exchange the locations of the cursor and the fixed starting point.
5 Press the [Set] key to fix the end point.
3.3.8 Vol Flow(Diam) Function: measures the maximum or the mean velocity and the vessel diameter in PW+B or
PW+ B+ Color mode to calculate the volume of the flow. 1 Select [Vol Flow(Diam)] in the Doppler Mode menu. 2 Measure TAMAX or TAMEAN on the spectrum. (Select whether to use the TAMAX
or TAMEAN in “System Preset->Meas->Vol Flow Method”.) 3 Measures the vessel diameter on the 2D image. The system calculates the volume
of flow.
Hints: If the TAMAX or TAMEAN value is obtained via auto spectrum calculation, the Vol
Flow will be calculated after the VF Diam is measured. (The “Vol Flow” should be selected in
“System Preset-> Measure Preset-> Parameter Preset”.)
3.4 References 3Dist Volume:
Emamian, S.A., et al., “Kidney Dimensions at Sonography: Correlation With Age, Sex,
and Habitus in 665 Adult Volunteers,” American Journal of Radiology, January, 1993,
160: 83-86.
HR (M General Measurement):
Dorland’s Illustrated Medical Dictionary, ed. 27, W. B. Sanders Co., Philadelphia,1988, p.
1425.
PG:
Powis, R., Schwartz, R. Practical Doppler Ultrasound for the Clinician. Williams &
Wilkins, Baltimore, Maryland, 1991, p. 162.
Acceleration:
Starvos, A.T.,et.al. “Segmental Stenosis of the Renal Artery Pattern Recognition of
Tardus and Parvus Abnormalities with Duplex Sonography.” Radiology, 184: 487-492,
1992.
Taylor, K.W., Strandness, D.E. Duplex Doppler Ultrasound. Churchill-Livingstone, New

General Measurements
3-14
York, 1990.
PPG:
Yoganathan, Ajit P., et al., "Review of Hydrodynamic Principles for the Cardiologist:
Applications to the Study of Blood Flow and Jets by Imaging Techniques," Journal of the
American College of Cardiology, 1988, Vol. 12, pp. 1344-1353
MPG:
Yoganathan, Ajit P., et al., "Review of Hydrodynamic Principles for the Cardiologist:
Applications to the Study of Blood Flow and Jets by Imaging Techniques," Journal of the
American College of Cardiology, 1988, Vol. 12, pp. 1344-1353
MMPG:
Yoganathan, Ajit P., et al., "Review of Hydrodynamic Principles for the Cardiologist:
Applications to the Study of Blood Flow and Jets by Imaging Techniques," Journal of the
American College of Cardiology, 1988, Vol. 12, pp. 1344-1353
VTI:
Degroff, C. G. Doppler Echocardiography. Third Edition. Lippincott-Raven, Philadelphia,
1999, p. 102-103
RI:
Burns, P.N., "The Physical Principles of Doppler and Spectral Analysis," Journal of
Clinical Ultrasound, November/December 1987, Vol. 15, No. 9, p. 586
PI:
Burns, Peter N., "The Physical Principles of Doppler and Spectral Analysis," Journal of
Clinical Ultrasound, November/December 1987, Vol. 15, No. 9, p. 585
S/D:
Ameriso S, et al., “Pulseless Transcranial Doppler Finding in Takayasu’s Arteritis,” J Clin
Ultrasound, September 1990; 18: 592-6
D/S:
Ameriso S, et al., “Pulseless Transcranial Doppler Finding in Takayasu’s Arteritis,” J Clin
Ultrasound, September 1990; 18: 592-6

4-1
4 Abdomen Measurements
4.1 Abdomen Measurement Tools The system supports the following Abdomen measurement tools.
Mode Type Tool Description Method or formula
2D Measure
-ment
Liver /
Same as Distance measurement in 2D General Measurements
Renal L Renal length
Renal H Renal height
Renal W Renal width
Cortex Renal cortical thickness
Adrenal L Adrenal length
Adrenal H Adrenal height
Adrenal W Adrenal width
CBD Common Bile Duct
CHD Common Hepatic Duct
GB L Gallbladder Length
GB H Gallbladder Height
GB wall th Gallbladder Wall Thickness
Panc duct Pancreatic Duct
Panc head Pancreatic Head
Panc body Pancreatic Body
Panc tail Pancreatic Tail
Spleen /
Aorta Diam Celiac
Aorta Diameter
Aorta Bif /
Iliac Diam Iliac Diameter
Portal V Diam
Portal Vein Diameter
Pre-BL L Previous-bladder length
Pre-BL H Previous-bladder height
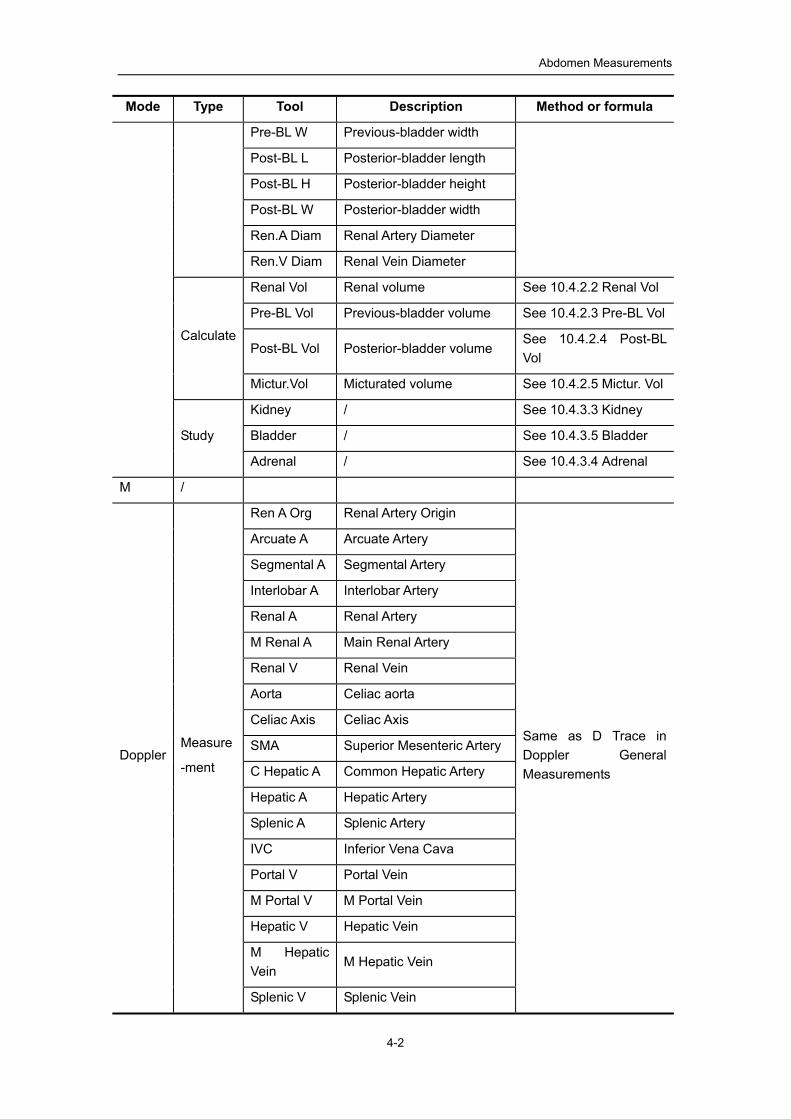
Abdomen Measurements
4-2
Mode Type Tool Description Method or formula
Pre-BL W Previous-bladder width
Post-BL L Posterior-bladder length
Post-BL H Posterior-bladder height
Post-BL W Posterior-bladder width
Ren.A Diam Renal Artery Diameter
Ren.V Diam Renal Vein Diameter
Calculate
Renal Vol Renal volume See 10.4.2.2 Renal Vol
Pre-BL Vol Previous-bladder volume See 10.4.2.3 Pre-BL Vol
Post-BL Vol Posterior-bladder volume See 10.4.2.4 Post-BL Vol
Mictur.Vol Micturated volume See 10.4.2.5 Mictur. Vol
Study
Kidney / See 10.4.3.3 Kidney
Bladder / See 10.4.3.5 Bladder
Adrenal / See 10.4.3.4 Adrenal
M /
Doppler Measure
-ment
Ren A Org Renal Artery Origin
Same as D Trace in Doppler General Measurements
Arcuate A Arcuate Artery
Segmental A Segmental Artery
Interlobar A Interlobar Artery
Renal A Renal Artery
M Renal A Main Renal Artery
Renal V Renal Vein
Aorta Celiac aorta
Celiac Axis Celiac Axis
SMA Superior Mesenteric Artery
C Hepatic A Common Hepatic Artery
Hepatic A Hepatic Artery
Splenic A Splenic Artery
IVC Inferior Vena Cava
Portal V Portal Vein
M Portal V M Portal Vein
Hepatic V Hepatic Vein
M Hepatic Vein
M Hepatic Vein
Splenic V Splenic Vein

Abdomen Measurements
4-3
Mode Type Tool Description Method or formula
SMV Superior Mesenteric Vein
Calculate
Vol Flow (Portal V)
Volume flow of Portal Vein
Same as Vol Flow(Diam) in Doppler General Measurement
Vol Flow (Renal A)
Volume flow of Renal Artery
Vol Flow (Renal V)
Volume flow of Renal Vein
Study /
Measurement menus and reports can be preset. See the section “Measurement Preset” for
details.
4.2 Abdomen Exam Preparations Make the following preparations before performing Abdomen exam:
Confirm that the current transducer is appropriate.
Check that the current date of the system is correct.
Register patient information in the [Patient Info] -> [ABD] dialog box. See the section
“Patient Information Input” in the Basic Volume for details.
Switch to the proper exam mode.
4.3 Entering Abdomen Measurements To enter the Abdomen Measurements,
Press the [Measure] key to enter the Application Measurements. If the current menu is not
the one having Abdomen Measurement tools, move the cursor to the menu title and select
the package having Abdomen Measurement tools.
4.4 Abdomen Measurement Operations 1 Select a tool in the menu.
2 Refer to the methods in 4.1 Abdomen Measurement Tools to complete the measurement.
4.5 Abdomen Exam Report During the measurements or after a measurement, press the [Report] key on the Control
Panel to browse the report. See “1.9 Report” for details on report browsing, printing and etc.

5-1
5 Obstetric Measurements
5.1 Obstetric Measurement Tools
The system supports the following Obstetric measurement tools.
Mode Type Tools Description Method or formula
2D Measure
-ment
GS Gestational Sac Diameter
Same as Distance measurement in 2D General Measurements YS Yolk Sac
CRL Crown Rump Length
“Line” is the same as Distance measurement in 2D General Measurements;
“Trace” and “Spline” are the same as “Trace” in 2D General Measurements
NT Nuchal TranslucencySame as Distance measurement in 2D General Measurements
BPD Biparietal Diameter
OFD Occipital Frontal Diameter
HC Head Circumference Same as Area measurement in 2D General Measurements AC
Abdominal Circumference
FL Femur Length
Same as Distance measurement in 2D General Measurements
Same as Distance measurement in 2D General Measurements
TAD Abdominal Transversal Diameter
APAD Anteroposterior Abdominal Diameter
TCD Cerebellum Diameter
Cist Magna Cist Magna
LVW Lateral Ventricle Width

Obstetric Measurements
5-2
Mode Type Tools Description Method or formula
HW Hemisphere Width
OOD Outer Orbital Diameter
IOD Inner Orbital Diameter
HUM Humerus Length
Ulna Ulna Length
RAD Radius Length
Tibia Tibia Length
FIB Fibula Length
CLAV Clavicle Length
Vertebrae Length of Vertebrae
MP Middle Phalanx Length
Same as Distance measurement in 2D General Measurements
Foot Foot length
Ear Ear Length
APTD Anteroposterior Trunk Diameter
TTD Transverse Trunk Diameter
FTA Fetal Trunk Cross-sectional Area
Same as Area measurement in 2D General Measurements
THD Thoracic Diameter Same as Distance measurement in 2D General Measurements
HrtC Heart Circumference Same as Area measurement in 2D General Measurements TC
Thoracic Circumference
Umb VD Umbilical Vein Diameter
Same as Distance measurement in 2D General Measurements
F-Kidney Fetal Kidney Length
Mat Kidney Matrix Kidney LengthCervix L Cervical Length AF Amniotic Fluid NF Nuchal Fold Orbit PL Thickness Placental Thickness Sac Diam1 Gestational Sac

Obstetric Measurements
5-3
Mode Type Tools Description Method or formula
Diameter 1
Sac Diam2 Gestational Sac Diameter 2
Sac Diam3 Gestational Sac Diameter 3
AF1 Amniotic Fluid 1 AF2 Amniotic Fluid 2 AF3 Amniotic Fluid 3 AF4 Amniotic Fluid 4 LVIDd LVIDs LV Diam LA Diam RVIDd RVIDs RV Diam RA Diam
IVSd
IVSs
IVS
LV Area Same as Area measurement in 2D General Measurements
LA Area
RV Area
RA Area
Ao Diam Same as Distance measurement in 2D General Measurements
MPA Diam
LVOT Diam
RVOT Diam
Calculate
Mean Sac Diam
The average value of three sac diameters
AFI Measure AF1, AF2, AF3, AF4,
AFI=AF1+AF2+AF3+AF4
EFW1 EFW is calculated by the default EFW formula, based on the measured multiple parameters,
The formulae are listed in the “EFW” formulae table as described in 2.2.1 Obstetric
EFW2

Obstetric Measurements
5-4
Mode Type Tools Description Method or formula
Formulae. The formula can be reselected in the OB report.
HC/AC HC/AC=HC/AC
FL/AC FL/AC=FL/AC×100
FL/BPD FL/BPD=FL/BPD×100
AXT AXT=APTD×TTD
CI CI=BPD/OFD×100
FL/HC FL/HC=FL/HC×100
HC(c) HC(c)=2.325×((BPD)2+(OFD)2)1/2
HrtC/TC HrtC/TC=HrtC/TC
TCD/AC TCD/AC=TCD/AC
LVW/HW LVW/HW=LVW/HW×100%
LVD/RVD LV Diam/RV Diam
LAD/RAD LA Diam/RA Diam
AoD/MPAD Ao Diam/MPA Diam
LAD/AoD LA Diam/Ao Diam
Study AFI AF Index Measure AF1, AF2, AF3, AF4,
AFI=AF1+AF2+AF3+AF4
M
Measure
-ment
FHR Same as Heart Rate measurement in M General Measurement
LVIDd
Same as Distance measurement in 2D General Measurements
LVIDs
RVIDd
RVIDs
IVSd
IVSs
Calculate /
Study
/
Doppler Measure
-ment FHR
Same as Heart Rate measurement in Doppler General Measurement

Obstetric Measurements
5-5
Mode Type Tools Description Method or formula
Umb A Umbilical Artery
Same as D Trace measurement in Doppler General Measurements
Duct Veno
Placenta A
MCA Fetal Middle Cerebral Artery
Fetal Ao Fetal Aorta
Desc Aorta Desc. Aorta
Ut A Uterine Artery
Ovarian A Ovarian Artery
Calculate /
Study /
Measurement menus and reports can be preset. See the section “Measurement Preset” for
details.
5.2 Clinical GA Clinical GA and clinical EDD are calculated according to the parameters obtained from
clinical examinations. After you enter the relative information into the window, the system will
automatically calculate the GA and EDD and will display them at the right side of Patient Info
in the title. The calculating methods are listed as follows:
LMP: input the LMP, the system will calculate the GA and EDD.
IVF: input the IVF, the system will calculate the GA and EDD.
PRV: input the date and GA of the last exam, the system will calculate a new GA and
EDD.
BBT: input BBT, the system will calculate the GA and EDD.
EDD: input the EDD, the system will calculate GA and LMP.
5.3 Ultrasound GA Ultrasound GA and ultrasound EDD are calculated according to the parameters obtained in
the measurement.
GA in OB items
AUA (Average Ultrasound Age)
CUA(Composite Ultrasound Age)

Obstetric Measurements
5-6
5.3.1 GA in OB Items
The GA in the OB items is calculated by the related GA tables/ formulae, it is independent
from the clinical GA. The formulae can be preset in [OB] tab sheet of [System] preset.
Please refer to 2.2 Obstetric Preset. You can reselect the GA table/ formulae in the right side
drop-down list of the related OB items in the report. SD is also calculated through GA table/
formulae, it displays in the result window and report only when the system has clinical GA.
5.3.2 AUA
AUA is the average value of effective GA that is calculated according to biparietal diameter,
head circumference, abdomen circumference, humerus length, Gestational Sac, crown rump
length etc. The value of all the above items will be involved to calculate AUA in the system
default method. Also, you can change the measurement items that to be used to calculate
AUA by clicking the check boxes at the right side of the related items.
5.3.3 CUA
CUA is calculated according to formulae based on some measurement items (the involved
items are among biparietal diameter, head circumference, abdomen circumference, and
humerus length). To calculate the CUA, all the GA formulae of the parameters involved must
be Hadlock, the unit of the parameters is cm, and unit of CUA is week. The formulae are
listed as follows:
1. CUA(BPD) = 9.54+1.482*BPD+0.1676*BPD2
2. CUA(HC) = 8.96+0.540*HC+0.0003*HC3
3. CUA(AC) = 8.14+0.753*AC+0.0036*AC2
4. CUA(FL) = 10.35+2.460*FL+0.170*FL2
5. CUA(BPD, HC) = 10.32+0.009*HC2+1.3200*BPD+0.00012*HC3
6. CUA(BPD, AC) = 9.57+0.524*AC+0.1220*BPD2
7. CUA(BPD, FL) = 10.50+0.197*BPD*FL+0.9500*FL+0.7300*BPD
8. CUA(HC, AC) = 10.31+0.012*HC2+0.3850*AC
9. CUA(HC, FL) = 11.19+0.070*HC*FL+0.2630*HC
10. CUA(AC, FL) =10.47+0.442*AC+0.3140*FL2 - 0.0121*FL3
11. CUA(BPD, HC, AC) = 10.58+0.005*HC2 +0.3635*AC+ 0.02864*BPD*AC
12. CUA(BPD, HC, FL) = 11.38+0.070*HC*FL+0.9800*BPD

Obstetric Measurements
5-7
13. CUA(BPD, AC, FL) = 10.61+0.175*BPD*FL+0.2970*AC+0.7100*FL
14. CUA(HC, AC, FL) = 10.33+0.031*HC*FL+0.3610*HC+0.0298*AC*FL
15. CUA(BPD, HC, AC, FL)=10.85+0.060*HC*FL+0.6700*BPD+0.1680*AC
The default method to calculate CUA is to use the formula that involves more measurement
items. Also, you can select the parameters by clicking the check boxes at the right side of
the related items.
5.4 Obstetric Exam Preparations Make the following preparations before performing obstetric exam:
Confirm that the current transducer is appropriate.
Check that the current date of the system is correct.
Register patient information in the [Patient Info] -> [OB] dialog box. See the section
“Patient Information Input” in the Basic Volume for details.
Switch to the proper exam mode.
CAUTION: Ensure the date of the system is correct, otherwise GA and EDD calculated will be wrong.
5.5 Multi-fetus Exam This system supports examination of more than one fetus.
In the case of multi-fetus exam,
Set the number of fetuses in [Gestations] of the [Patient Info] -> [OB] dialog box.
After [Gestations] in the [Patient Info] -> [OB] dialog box is selected to 2 or 3, [Fetus]
item will display in the menu having Obstetric measurements. Switch to [Fetus A],
[Fetus B], or [Fetus C] via the menu item.
The fetuses are measured respectively.
The values in the result window are displayed bymarked with fetus label A, B or C
[Fetus A], [Fetus B], or [Fetus C] to differentiate the fetuses.
In the Obstetric Report dialog box, select [Fetus A], [Fetus B], or [Fetus C] from [Select
Fetus] to display the report of different fetuses.
In the Anatomy dialog box, select [Fetus A], [Fetus B], or [Fetus C] from [Select Fetus]
to displayselect anatomy options for different fetuses.
Obstetric Measurements
5-8
In the [Obstetric Growth Curve] dialog box, select from the check-box [A], [B], or [C] on
the lower part to display the growth curves of different fetuses.
5.6 Entering Obstetric Measurements To enter the Obstetric Measurements,
Press the [Measure] key to enter the Application Measurements. If the current menu is not
the one having Obstetric Measurement tools, move the cursor to the menu title and select
the package having Obstetric Measurement tools.
5.7 Obstetric Measurement Operations Table in 5.1 Obstetric Measurement Tools describes the method of measurement tools.
5.7.1 Measurement Tool Operations
1 Select a measurement tool in the menu.
2 Refer to the methods listed in the table above to complete the measurement.
GA calculated from fetal parameters and the GA or FG table is called “Diagnostic GA”.
After measurements, the result window displays measurement values and GA. Whether
the result window displays EDD and SD (standard deviation) depends on the preset
(Preset in [System] Preset -> [Meas] dialog box).
If the Diagnostic GA exceeds the threshold, it will display as OOR (out of range) in the
result window and will not display in the report.
5.7.2 Calculation Tool Operations
1 Select a calculation tool in the menu.
2 Perform all measurement tools related to the calculation. The system automatically provide the calculation result.
5.7.3 Study Tool Operation
AFI Study
1 Select [AFI] in the menu.
2 Measure AFs of the four amniotic fluid pockets of pregnant woman. The system calculates AFI automatically.
5.8 Obstetric Exam Report During the measurements or after a measurement, press the [Report] key on the Control

Obstetric Measurements
5-9
Panel to browse the report.
For multi-fetus exam report, see 5.5 Multi-fetus Exam for details.
See “1.9 Report” for details on report browsing, printing and etc.
5.8.1 Fetal Biophysical Profile
The fetal biophysical profile is a tool that communicates the fetal well being based on the
assessment of the clinician over the course of ultrasound examination and using the
following scoring criteria.
The scoring criteria the system provides are based on Vintzileos formula, as shown in the
following table.
Fetal scoring criteria (Vintzileos formula)
Fetal growth index
0 score 2 scores Observation
time Notes
FHR <2, or
FHR acceleration ≤15bpm
FHR acceleration≥15bpm; duration≥15s; ≥2 times
30 minutes The score(s) can be manually input into the system.
FM ≤2 Fetal movements ≥3 (continuous movement regarded as once)
30 minutes
FBM No FBM, or duration≤30s
FBM≥1 times; duration≥30s 30 minutes
FT Limbs stretched, no bend, and fingers loose
Movements ≥1;
Limbs and spine stretch-and-bend
/
AF No AF, or AF<2×2cm
No less than 1 AF>2×2cm /
After the depth of amniotic fluid is measured, the scores are entered, and the placenta level
is entered, the system will automatically generate an FBP Report based on the specified
formula.
Fetal scoring results criteria
Total scores Growth condition 8-10 scores Normal fetus; low risk of chronic asphyxia 4-6 scores Suspicious risk of fetal chronic asphyxia 0-2 scores Highly suspicious risk of fetal chronic asphyxia
If [OB] of [Ultrasound Anatomy] in the Report Template Edit dialog box is selected, the FBP

Obstetric Measurements
5-10
scoring will be available. They will appear in the Anatomy dialog box after the [Analyze]
button in the report dialog box is selected. See “1.9.2 Editing Report” for details on
operations of FBP score input and Anatomy dialog box.
5.8.2 Fetal Growth Curve
Fetus growth curve means to compare the measured data of the fetus with the normal
growth curve to judge whether the fetus is in normal growth state.
Data of growth curve are all sourced from FG table.
1 Enter patient’s basic information and obstetric information in the [Patient Info] -> [OB] dialog box.
2 Perform one or more tools of fetal growth parameters.
3 If [Obstetric] of [Patient Info] in the Report Template Edit dialog box is selected, the [Growth] button will appear in the report dialog box. Select the [Growth] button in the report dialog box to enter the [Obstetric Growth Curve] dialog box.

Obstetric Measurements
5-11
The dialog box displays the growth curve and the position of measurement value.
The left drop-down list is used to select a tool, and the right one is used to select a formula.
In the growth curve, current and history data of one fetus are displayed in the same symbol with the history data appeared in smaller size.
Click the [Print] check box to determine whether to include the growth curve in the printed report or not.
4 In the case of multi-fetus measurement, select [A], [B], or [C] to view the growth curve of fetus A, fetus B, or fetus C. Three symbols are used on the growth curves to indentify measurement data of different fetuses.
5 Select the number and layout of the curves from [Display Mode].
1*1: one curve displays in the screen.
2*1: two curves (up/ down) display in the screen.
2*2: four curves display in the screen.
Click [Prev]/ [Next] to turn the growth curve pages.
6 Click [OK] to confirm the setting and exit the dialog box.
Hint:
If the patient ID is blank, clinical GA is not calculated, or the measurement value is not valid,
measurement values will not be displayed on the curve.

Obstetric Measurements
5-12
5.9 References GS Rempen A., 1991
Arztliche Fragen. Biometrie in der Fruhgraviditat (i.Trimenon): 425-430.
Hansmann M, Hackelöer BJ, Staudach A
Ultraschalldiagnostik in Geburtshilfe und Gynäkologie 1985
Hellman LM, Kobayashi M, Fillisti L, et al. Growth and development of the human fetus prior to the 20th week of gestation. Am J Obstet Gynecol 1969; 103:784-800.
Studies on Fetal Growth and Functional Developments, Takashi Okai, Department of Obstetrics and Gynecology, Faculty of Medicine, University of Tokyo
China
Written by Zhou Yiongchang & Guo Wanxue
in Chapter 38 of "Ultrasound Medicine" (3rd edition)
Science & Technology Literature Press, 1997
CRL Rempen A., 1991 Arztliche Fragen. Biometrie in der Fruhgraviditat (i.Trimenon): 425-430.
Hansmann M, Hackelöer BJ, Staudach A Ultraschalldiagnostik in Geburtshilfe und Gynäkologie 1985
Hadlock FP, et al. Fetal Crown-Rump Length: Reevaluation of Relation to Menstrual Age (5-18 weeks) with High-Resolution Real-time US. Radiology 182:501-505.
Jeanty P, Romero R. "Obstetrical Sonography", p. 56. New York, McGraw-Hill, 1984.
Nelson L. Comparison of methods for determining crown-rump measurement by realtime ultrasound. J Clin Ultrasound February 1981; 9:67-70.
Robinson HP, Fleming JE. A critical evaluation of sonar crown rump length measurements. Br J Obstetric and Gynaecologic September 1975; 82:702-710.

Obstetric Measurements
5-13
Fetal Growth Chart Using the Ultrasonotomographic Technique Keiichi Kurachi, Mineo Aoki Department of Obstetrics and Gynecology, Osaka University Medical School Revision 3 (September 1983)
Studies on Fetal Growth and Functional Developments Takashi Okai Department of Obstetrics and Gynecology, Faculty of Medicine, University of Tokyo
China
Written by Zhou Yiongchang & Guo Wanxue
in Chapter 38 of "Ultrasound Medicine" (3rd edition)
Science & Technology Literature Press, 1997
BPD Merz E., Werner G. & Ilan E. T., 1991 Ultrasound in Gynaecology and Obstetrics Textbook and Atlas 312, 326-336. Rempen A., 1991 Arztliche Fragen. Biometrie in der Fruhgraviditat (i.Trimenon): 425-430.
Hansmann M, Hackelöer BJ, Staudach A Ultraschalldiagnostik in Geburtshilfe und Gynäkologie 1985
Hadlock FP, et al. Estimating Fetal Age: Computer-Assisted Analysis of Multiple Fetal Growth Parameters. Radiology 1984; 152 (No. 2):499.
Jeanty P, Romero R. "Obstetrical Ultrasound." McGraw-Hill Book Company, 1984, pp. 57-61.
Sabbagha RE, Hughey M. Standardization of sonar cephalometry and gestational age. Obstetrics and Gynecology October 1978; 52:402-406.
Kurtz AB, Wapner RJ, Kurtz RJ, et al. Analysis of bipariental diameter as an accurate indicator of gestational age. J Clin Ultrasound 1980;8:319-326.
Fetal Growth Chart Using the Ultrasonotomographic Technique, Keiichi Kurachi, Mineo Aoki, Department of Obstetrics and Gynecology, Osaka University Medical School Revision 3 (September 1983)
Studies on Fetal Growth and Functional Developments, Takashi Okai, Department of Obstetrics and Gynecology, Faculty of Medicine, University of Tokyo

Obstetric Measurements
5-14
Chitty LS, Altman DG
British Journal of Obstetrics and Gynaecology January 1994, Vol.101
P29-135.
China
Written by Zhou Yiongchang & Guo Wanxue
in Chapter 38 of "Ultrasound Medicine" (3rd edition)
Science & Technology Literature Press, 1997
OFD Merz E., Werner G. & Ilan E. T., 1991 Ultrasound in Gynecology and Obstetrics Textbook and Atlas 312, 326-336.
Hansmann M, Hackelöer BJ, Staudach A Ultraschalldiagnostik in Geburtshilfe und Gynäkologie 1985
HC Merz E., Werner G. & Ilan E. T., 1991 Ultrasound in Gynecology and Obstetrics Textbook and Atlas 312, 326-336.
Hadlock FP, et al. Estimating Fetal Age: Computer-Assisted Analysis of Multiple Fetal Growth Parameters. Radiology 1984; 152 (No. 2):499.
Jeanty P, Romero R. "Obstetrical Ultrasound." McGraw-Hill Book Company, 1984.
Hansmann M, Hackelöer BJ, Staudach A Ultraschalldiagnostik in Geburtshilfe und Gynäkologie 1985
Chitty LS, Altman DG
British Journal of Obstetrics and Gynaecology January 1994, Vol.101
P29-135.
AC Merz E., Werner G. & Ilan E. T., 1991 Ultrasound in Gynaecology and Obstetrics Textbook and Atlas 312, 326-336.
Hadlock FP, et al. Estimating Fetal Age: Computer-Assisted Analysis of Multiple Fetal Growth Parameters. Radiology 1984; 152 (No. 2):499.
Jeanty P, Romero R. A longitudinal study of fetal abdominal growth, "Obstetrical Ultrasound." MacGraw-Hill Book Company, 1984.
Chitty LS, Altman DG

Obstetric Measurements
5-15
British Journal of Obstetrics and Gynaecology January 1994, Vol.101
P29-135.
FL Merz E., Werner G. & Ilan E. T., 1991 Ultrasound in Gynaecology and Obstetrics Textbook and Atlas 312, 326-336.
Hansmann M, Hackelöer BJ, Staudach A Ultraschalldiagnostik in Geburtshilfe und Gynäkologie 1995
Hadlock FP, et al. Estimating Fetal Age: Computer-Assisted Analysis of Multiple Fetal Growth Parameters. Radiology 1984; 152 (No. 2):499.
Warda A. H., Deter R. L. & Rossavik, I. K., 1985. Fetal femur length: a critical re-evaluation of the relationship to menstrual age. Obstetrics and Gynaecology, 66, 69-75.
O”Brien GD, Queenan JT (1981) Growth of the ultrasound femur length during normal pregnancy, American Journal of Obstetrics and Gynecology 141:833-837.
Jeanty P, Rodesch F, Delbeke D, Dumont J. Estimation of gestational age from measurements of fetal long bones. Journal of Ultrasound Medicine February 1984; 3:75-79.
Hohler C., Quetel T. Fetal femur length: equations for computer calculation of gestational age from ultrasound measurements. American Journal of Obstetrics and Gynecology June 15, 1982; 143 (No. 4):479-481.
Keiichi Kurachi, Mineo Aoki Department of Obstetrics and Gynecology, Osaka University Medical School Revision 3 (September 1983)
Studies on Fetal Growth and Functional Developments Takashi Okai Department of Obstetrics and Gynecology, Faculty of Medicine, University of Tokyo
Chitty LS, Altman DG
British Journal of Obstetrics and Gynaecology January 1994, Vol.101
P29-135.
China

Obstetric Measurements
5-16
Written by Zhou Yiongchang & Guo Wanxue
in Chapter 38 of "Ultrasound Medicine" (3rd edition)
Science & Technology Literature Press, 1997
TAD Merz E., Werner G. & Ilan E. T., 1991 Ultrasound in Gynaecology and Obstetrics Textbook and Atlas 312, 326-336.
APAD Merz E., Werner G. & Ilan E. T., 1991 Ultrasound in Gynecology and Obstetrics Textbook and Atlas 312, 326-336.
THD Hansmann M, Hackelöer BJ, Staudach A Ultraschalldiagnostik in Geburtshilfe und Gynäkologie 1985
FTA Fetal Growth Chart Using the Ultrasonotomographic Technique Keiichi Kurachi, Mineo Aoki Department of Obstetrics and Gynecology, Osaka University Medical School Revision 3 (September 1983)
HUM Merz E., Werner G. & Ilan E. T., 1991 Ultrasound in Gynaecology and Obstetrics Textbook and Atlas 312, 326-336.
Jeanty P, Rodesch F, Delbeke D, Dumont J. Estimation of gestational age from measurements of fetal long bones. Journal of Ultrasound Medicine February 1984; 3:75-79.
CLAV “Clavicular Measurement: A New Biometric Parameter for
Fetal Evaluation.” Journal of Ultrasound in Medicine 4:467-470, September 1985.
TCD Goldstein I, et al. Cerebellar measurements with ultrasonography in the evaluation of fetal growth and development. Am J Obstet Gynecol 1987; 156:1065-1069.
Hill LM, et al. Transverse cerebellar diameter in estimating gestational age in the large for gestational age fetus, Obstet Gynecol 1990; 75:981-985.
Ulna Merz E., Werner G. & Ilan E. T., 1991 Ultrasound in Gynaecology and Obstetrics Textbook and Atlas 312, 326-336.

Obstetric Measurements
5-17
Tibia Merz E., Werner G. & Ilan E. T., 1991 Ultrasound in Gynaecology and Obstetrics Textbook and Atlas 312, 326-336.
RAD Merz E., Werner G. & Ilan E. T., 1991 Ultrasound in Gynaecology and Obstetrics Textbook and Atlas 312, 326-336.
FIB Merz E., Werner G. & Ilan E. T., 1991 Ultrasound in Gynaecology and Obstetrics Textbook and Atlas 312, 326-336.
OOD Jeanty P, Cantraine R, Cousaert E, et al.
J Ultrasound Med 1984; 3: 241-243.
GAdays=1.5260298+0.595018*BOmm-6.205*10-6*BO2mm
BO=binocular distance
Estimated Fetal Weight (EFW)
Merz E., Werner G. & Ilan E. T., 1991
Ultrasound in Gynaecology and Obstetrics Textbook and Atlas 312, 326-336.
Hansmann M, Hackelöer BJ, Staudach A
Ultraschalldiagnostik in Geburtshilfe und Gynäkologie 1995
Campbell S, Wilkin D. "Ultrasonic Measurement of Fetal Abdomen Circumference in
the Estimation of Fetal Weight." Br J Obstetrics and Gynaecology September 1975; 82
(No. 9):689-697.
Hadlock F, Harrist R, et al. Estimation of fetal weight with the use of head, body, and
femur measurements - a prospective study. American Journal of Obstetrics and
Gynecology February 1, 1985; 151 (No. 3):333-337.
Shepard M, Richards V, Berkowitz R, Warsof S, Hobbins J. An Evaluation of Two
Equations for Predicting Fetal Weight by Ultrasound. American Journal of Obstetrics
and Gynecology January 1982; 142 (No. 1): 47-54.
Fetal Growth Chart Using the Ultrasonotomographic Technique
Keiichi Kurachi, Mineo Aoki
Department of Obstetrics and Gynecology, Osaka University Medical School

Obstetric Measurements
5-18
Revision 3 (September 1983)
Studies on Fetal Growth and Functional Developments
Takashi Okai
Department of Obstetrics and Gynecology, Faculty of Medicine, University of Tokyo
Fetal Biophysical Profile
Antory M. intzileos, MD, Winston A. Campbell, Chareles J. Ingardia, MD, and David J.
Nochimson, MD, Fetal Biophysical Parameters Distribution and Their Predicted Values ,
Obstetric and Gynecology Journal 62:271, 1983

6-1
6 Cardiac Measurements
6.1 Cardiac Measurement Tools The system supports the following Cardiac measurement tools:
6.1.1 2D Cardiac Measurements Types Tools Descriptions Methods or formulae
Measurement
LA Diam Left Atrium Diameter
Distance in 2D General Measurements
LA Major Left Atrium major Diameter
LA Minor Left Atrium minor Diameter
RA Major Right Atrium major Diameter
RA Minor Right Atrium minor Diameter
LV Major Left Ventricular major Diameter
LV Minor Left Ventricular minor Diameter
RV Major Right Ventricular major Diameter Distance in 2D General Measurements RV Minor Right Ventricular minor Diameter
LA Area Left Atrium area
Area in 2D General Measurements
RA Area Right Atrium area
LV Area(d) Left Ventricular area at end-diastole
LV Area(s) Left Ventricular area at end-systole
RV Area(d) Right Ventricular area at end-diastole
RV Area(s) Right Ventricular area at end-systole
Vas Area Vascular Area Area in 2D General Measurements
LVIDd Left Ventricular Internal Diameter at end-diastole
Distance in 2D General Measurements
LVIDs Left Ventricular Internal Diameter at end-systole
LVLd apical
Left Ventricular Long-axis Length at End-diastole in apical view
LVLs apical
Left Ventricular Long-axis Length at End-systole in apical view

Cardiac Measurements
6-2
Types Tools Descriptions Methods or formulae
RVDd Right Ventricular Diameter at end-diastole
RVDs Right Ventricular Diameter at end-systole
LVPWd Left Ventricular Posterior wall thickness at end-diastole
LVPWs Left Ventricular Posterior wall thickness at end-systole
RVAWd Right Ventricular Anterior wall thickness at end-diastole
RVAWs Right Ventricular Anterior wall thickness at end-systole
IVSd Interventricular Septal thickness at end-diastole
IVSs Interventricular Septal thickness at end-systole
Measurement
Ao Diam Aorta Diameter
Ao Asc Diam Ascending Aorta Diameter
Ao Desc Diam Descending Aorta Diameter
Ao Isthmus Aorta Isthmus Diameter
Ao st junct Aorta ST junct Diameter
Ao Sinus Diam Aorta Sinus Diameter
Duct Art Diam Ductus Arteriosus Diameter
Pre Ductal Previous ductal Diameter
Post Ductal Posterior ductal Diameter
ACS Aortic Valve Cusp Separation
Distance in 2D General Measurements
LVOT Diam
Left Ventricular Outflow Tract Diameter
AV Diam Aorta Valve Diameter
AVA Aortic Valve Area Area in 2D General Measurements
PV Diam Pulmonary valve Diameter
Distance in 2D General Measurements
LPA Diam Left pulmonary Artery Diameter
RPA Diam Right pulmonary Artery Diameter
MPA Diam Main pulmonary Artery Diameter
RVOT Diam
Right Ventricular Outflow Tract Diameter
MV Diam Mitral Valve diameter

Cardiac Measurements
6-3
Types Tools Descriptions Methods or formulae
MVA Mitral Valve area Area in 2D General Measurements TVA Tricuspid Valve Area
MCS Mitral Valve Cusp Separation
Distance in 2D General Measurements EPSS
Distance between point E and Interventricular Septum when mitral valve is fully open
TV Diam Tricuspid valve Diameter
VSD Diam Ventricular Septal defect Diameter
Distance in 2D General Measurements
ASD Diam Atrial Septal defect Diameter
PDA Diam Patent ductus Arteriosus Diameter
PFO Diam Patent Oval Foramen Diameter
PEd Pericardial Effusion at diastole
PEs Pericardial Effusion at systole
Calculation LA/Ao Left Atrium Diameter/Aorta
Diameter LA Diam (cm) / Ao Diam (cm)
Ao/LA Aorta Diameter/Left Atrium Diameter
Ao Diam (cm) / LA Diam (cm)
Study See below
6.1.2 M Cardiac Measurements Types Tools Descriptions Methods or formulae
Measurement
LA Diam Left Atrium Diameter
Distance in 2D General Measurements
LVIDd Left Ventricular Internal Diameter at end-diastole
LVIDs Left Ventricular Internal Diameter at end-systole
RVDd Right Ventricular Diameter at end-diastole
RVDs Right Ventricular Diameter at end-systole
LVPWd Left Ventricular Posterior wall thickness at end-diastole
LVPWs Left Ventricular Posterior wall thickness at end-systole
RVAWd Right Ventricular Anterior wall thickness at end-diastole
RVAWs Right Ventricular Anterior wall thickness at end-systole
IVSd Interventricular Septal thickness at end-diastole

Cardiac Measurements
6-4
Types Tools Descriptions Methods or formulae
IVSs Interventricular Septal thickness at end-systole
Ao Diam Aorta Diameter
Ao Asc Diam Ascending Aorta Diameter
Ao Desc Diam Descending Aorta Diameter
Ao Isthmus Aorta Isthmus Diameter
Ao st junct Aorta ST junct Diameter
Ao Sinus Diam Aorta Sinus Diameter
LVOT Diam Left Ventricular outflow tract Diameter
ACS Aortic valve Cusp Separation
LPA Diam Left pulmonary Artery Diameter
RPA Diam Right pulmonary Artery Diameter
MPA Diam Main pulmonary Artery Diameter
PV Diam Pulmonary artery diameter
MV Diam Mitral valve diameter
RVOT Diam Right Ventricular outflow tract Diameter
MV E Amp Amplitude of the Mitral Valve E wave
MV A Amp Amplitude of the Mitral Valve A wave
MV E-F Slope Mitral Valve E-F slope
Slope in M General Measurements MV D-E
Slope Mitral Valve D-E slope
MV ACV Mitral valve AC velocity
MV DE Amplitude of the Mitral Valve DE wave
Distance in 2D General Measurements
MCS Mitral Valve Cusp Separation
EPSS Distance between point E and the interventricular septum
PEd Pericardial effusion at diastole
PEs Pericardial effusion at systole
LVPEP Left Ventricular pre-ejection period
Time in M General Measurements
LVET Left Ventricular ejection time
RVPEP Right Ventricular pre-ejection period
RVET Right Ventricular ejection time

Cardiac Measurements
6-5
Types Tools Descriptions Methods or formulae
RV Acct Right ventricular acceleration time
MV C-O dur Mitral Valve close-open Duration
HR Heart Rate Heart Rate in M General Measurements
Calculation LA/Ao Left Atrium diameter/Aorta
diameter LA Diam (cm) / Ao Diam (cm)
Ao/LA Aorta Diameter/Left Atrium Diameter
Ao Diam (cm) / LA Diam (cm)
Study See below
6.1.3 Doppler Cardiac Measurements Types Tools Descriptions Methods or formulae
Measurement
MV Vmax Mitral Valve Maximum Velocity D Vel in Doppler General Measurements MV E Vel Mitral Valve E-wave Velocity
MV A Vel Mitral Valve A-wave Velocity
MV E VTI Mitral Valve E-wave Velocity-Time Integral
D Trace in Doppler General Measurements MV A VTI Mitral Valve A-wave Velocity-Time
Integral
MV VTI Mitral Valve Velocity-Time Integral
MV AccT Mitral Valve Acceleration Time Acceleration in Doppler General Measurements MV DecT Mitral Valve Deceleration Time
IVRT Isovelocity Relaxation Time
Time in Doppler General Measurements
IVCT Isovelocity Compression Time
MV E Dur Mitral Valve E-wave Duration
MV A Dur Mitral Valve A-wave Duration
MV C-O dur Mitral Valve close-open Duration
MV PHT Mitral valve pressure half time
LVOT Vmax Left Ventricular Outflow Tract Velocity
D Vel in Doppler General Measurements
LVOT VTI Left Ventricular Outflow Tract Velocity-Time Integral
D trace in Doppler General measurements
Measurement
LVOT AccT Left Ventricular Outflow Tract Acceleration Time
Time in Doppler General Measurements
AAo Vmax Ascending Aorta Maximum Velocity
D Vel in Doppler General Measurements DAo Vmax Descending Aorta Maximum
Velocity
AV Vmax Aorta Valve Maximum Velocity

Cardiac Measurements
6-6
Types Tools Descriptions Methods or formulae
AV VTI Aorta Valve Velocity-Time Integral D trace in Doppler General measurements
LVPEP Left Ventricular Pre-ejection Period
Time in Doppler General Measurements
LVET Left Ventricular Ejection Time
AV AccT Aorta Valve Acceleration Time
AV DecT Aorta Valve Deceleration Time
RVET Right Ventricular Ejection Time
Time in Doppler General Measurements RVPEP Right Ventricular Pre-ejection
Period
RV AccT Right ventricular acceleration time
TV Vmax Tricuspid Valve Maximum Velocity
D Vel in Doppler General Measurements
TV E Vel Tricuspid Valve E-wave Flow Velocity
TV A Vel Tricuspid Valve A-wave Flow Velocity
TV VTI Tricuspid Valve Velocity-Time Integral
D trace in Doppler General measurements
TV AccT Tricuspid Valve Acceleration Time Acceleration in Doppler General Measurements TV DecT Tricuspid Valve Deceleration Time
TV A Dur Tricuspid Valve A-wave Duration
Time in Doppler General Measurements TV C-O dur Tricuspid Valve close-open
Duration
TV PHT Tricuspid Valve pressure half time
RVOT Vmax
Right Ventricular Outflow Tract Maximum Velocity
D Vel in Doppler General Measurements
RVOT VTI Right Ventricular Outflow Tract Velocity-Time Integral
D trace in Doppler General measurements
PV Vmax Pulmonary Valve Maximum Velocity
D Vel in Doppler General Measurements
PV VTI Pulmonary Valve Velocity-Time Integral
D trace in Doppler General measurements
PV AccT Pulmonary Valve Acceleration Time
Acceleration in Doppler General Measurements
MPA Vmax Main Pulmonary Artery Maximum Velocity
D Vel in Doppler General Measurements RPA Vmax Right Pulmonary Artery Maximum
Velocity
LPA Vmax Left Pulmonary Artery Maximum Velocity
PVein S Vel Pulmonary Vein S-wave Flow Velocity
D Vel in Doppler General Measurements
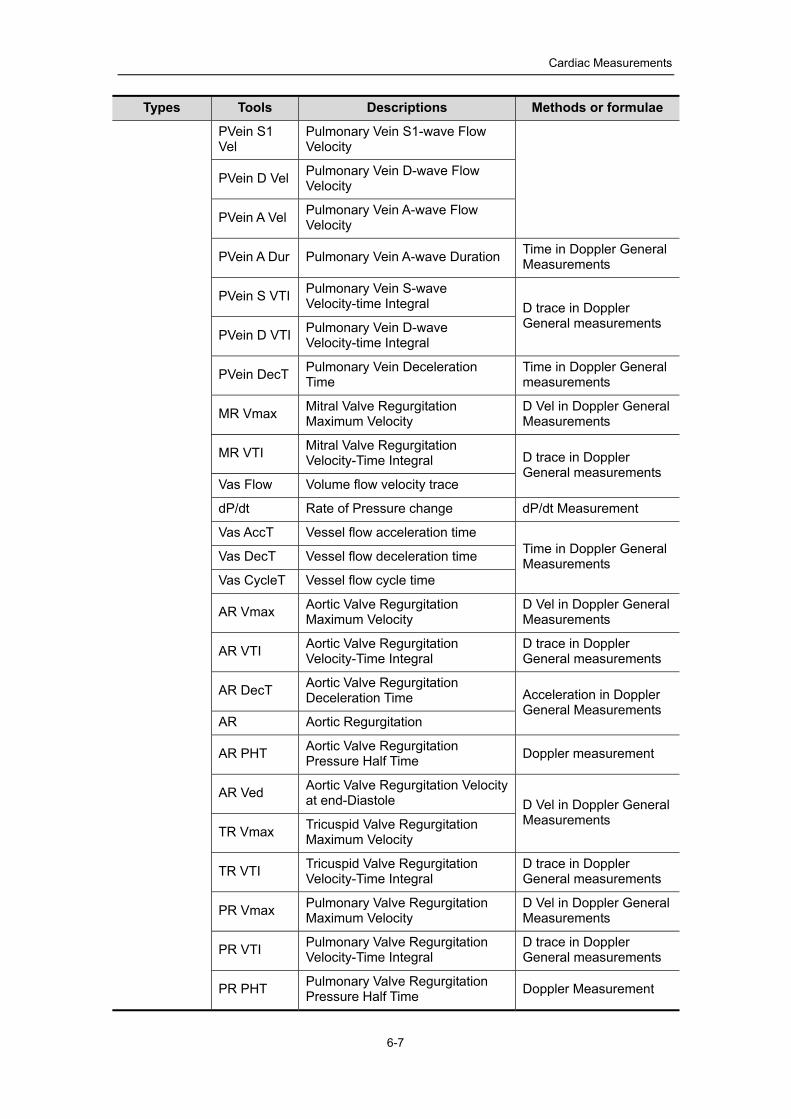
Cardiac Measurements
6-7
Types Tools Descriptions Methods or formulae
PVein S1 Vel
Pulmonary Vein S1-wave Flow Velocity
PVein D Vel Pulmonary Vein D-wave Flow Velocity
PVein A Vel Pulmonary Vein A-wave Flow Velocity
PVein A Dur Pulmonary Vein A-wave Duration Time in Doppler General Measurements
PVein S VTI Pulmonary Vein S-wave Velocity-time Integral D trace in Doppler
General measurements PVein D VTI Pulmonary Vein D-wave
Velocity-time Integral
PVein DecT Pulmonary Vein Deceleration Time
Time in Doppler General measurements
MR Vmax Mitral Valve Regurgitation Maximum Velocity
D Vel in Doppler General Measurements
MR VTI Mitral Valve Regurgitation Velocity-Time Integral D trace in Doppler
General measurements Vas Flow Volume flow velocity trace
dP/dt Rate of Pressure change dP/dt Measurement
Vas AccT Vessel flow acceleration time Time in Doppler General Measurements Vas DecT Vessel flow deceleration time
Vas CycleT Vessel flow cycle time
AR Vmax Aortic Valve Regurgitation Maximum Velocity
D Vel in Doppler General Measurements
AR VTI Aortic Valve Regurgitation Velocity-Time Integral
D trace in Doppler General measurements
AR DecT Aortic Valve Regurgitation Deceleration Time Acceleration in Doppler
General Measurements AR Aortic Regurgitation
AR PHT Aortic Valve Regurgitation Pressure Half Time Doppler measurement
AR Ved Aortic Valve Regurgitation Velocity at end-Diastole D Vel in Doppler General
Measurements TR Vmax Tricuspid Valve Regurgitation
Maximum Velocity
TR VTI Tricuspid Valve Regurgitation Velocity-Time Integral
D trace in Doppler General measurements
PR Vmax Pulmonary Valve Regurgitation Maximum Velocity
D Vel in Doppler General Measurements
PR VTI Pulmonary Valve Regurgitation Velocity-Time Integral
D trace in Doppler General measurements
PR PHT Pulmonary Valve Regurgitation Pressure Half Time Doppler Measurement

Cardiac Measurements
6-8
Types Tools Descriptions Methods or formulae
PR Ved Pulmonary Valve Regurgitation Velocity at end-Diastole
D Vel in Doppler General Measurements
VSD Vmax Ventricular Septal Defect Maximum Velocity
ASD Vmax Atrial Septal Defect Maximum Velocity
PDA Vel(d) Patent Ductus Arteriosus Velocity at End-diastole
PDA Vel(s) Patent Ductus Arteriosus Velocity at End-systole
Coarc Pre-Duct Coarctation of Pre-Ductus
Coarc Post-Duct Coarctation of Post-Ductus
HR Heart Rate
Calculation
MV E/A Mitral Valve E-Vel/A-Vel MV E Vel (cm/s) / MV A Vel (cm/s)
MV A/E Mitral Valve A-Vel/E-Vel MV A Vel (cm/s) / MV E Vel (cm/s)
MVA(PHT) Mitral Valve Orifice Area (PHT) MVA(PHT) (cm2) = 220 / MV PHT (ms)
TV E/A Tricuspid Valve E-Vel/A-Vel
TVA(PHT) Tricuspid Valve Orifice Area (PHT)
Study See below
Measurement menus and reports can be preset. See the section “Measurement Preset” for
details.
6.2 Cardiac Exam Preparations
Make the following preparations before performing a cardiac exam:
Confirm that the current transducer is appropriate.
Check that the current date of the system is correct.
Register patient information in the [Patient Info] -> [CARD] dialog box. See the section
“Patient Information Input” in the Basic Volume for details.
Switch to the proper exam mode.
6.3 Entering Cardiac Measurements To enter the Cardiac Measurements,
Press the [Measure] key to enter the Application Measurements. If the current menu is not

Cardiac Measurements
6-9
the one having Cardiac Measurement tools, move the cursor to the menu title and select the
package having Cardiac Measurement tools.
6.4 Cardiac Measurement Operations All measurements of some tools, described in this Chapter, will be performed in several
image modes, so you shall select appropriate image modes to measure.
Table in 6.1 Cardiac Measurement Tools describes the methods of tools.
6.4.1 Measurement Tool Operations
1 Select a measurement tool in the menu.
2 Refer to the methods listed in the table above to complete the measurement.
6.4.2 Calculation Tool Operations
1 Select a calculation tool in the menu.
2 Perform all measurement tools related to the calculation. The system automatically provide the calculation result.
6.4.3 Study Tool Operations
6.4.3.1 S-P Ellipse S-P Ellipse is one of the studies that measure Left Ventricle (LV) function, which measures
clinical indices to analyze the LV diastolic and systolic capabilities on the B or M image.
I. .Study items
Abbr. Description Operation
LVLd apical
Left Ventricular Long-axis Length at End-diastole in apical view
Distance in 2D General Measurements
LVAd apical
Left Ventricular Long-axis Area at End-diastole in apical view
Area in 2D General Measurements
LVLs apical
Left Ventricular Long-axis Length at End-systole in apical view
Distance in 2D General Measurements
LVAs apical
Left Ventricular Long-axis Area at end-systole in apical view
Area in 2D General Measurements
II. Study results
Abbr. Description Formula
EDV(SP Ellipse)
End-diastolic left ventricular volume )(apical LVLd
)(apical LVAd38
=)(Ellipse) EDV(SP22
cmcmml ×
π
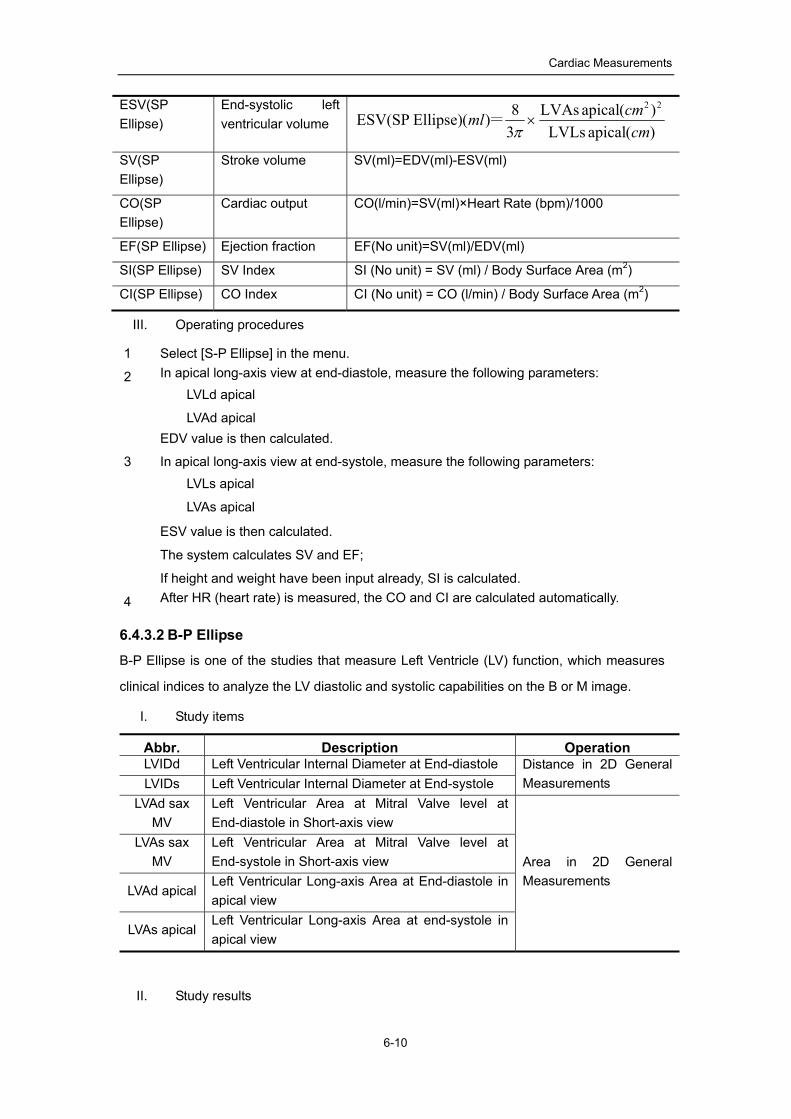
Cardiac Measurements
6-10
ESV(SP Ellipse)
End-systolic left ventricular volume
SV(SP Ellipse)
Stroke volume SV(ml)=EDV(ml)-ESV(ml)
CO(SP Ellipse)
Cardiac output CO(l/min)=SV(ml)×Heart Rate (bpm)/1000
EF(SP Ellipse) Ejection fraction EF(No unit)=SV(ml)/EDV(ml)
SI(SP Ellipse) SV Index SI (No unit) = SV (ml) / Body Surface Area (m2)
CI(SP Ellipse) CO Index CI (No unit) = CO (l/min) / Body Surface Area (m2)
III. Operating procedures
1 Select [S-P Ellipse] in the menu.
2 In apical long-axis view at end-diastole, measure the following parameters: LVLd apical
LVAd apical EDV value is then calculated.
3 In apical long-axis view at end-systole, measure the following parameters: LVLs apical
LVAs apical
ESV value is then calculated.
The system calculates SV and EF;
If height and weight have been input already, SI is calculated.
4 After HR (heart rate) is measured, the CO and CI are calculated automatically.
6.4.3.2 B-P Ellipse B-P Ellipse is one of the studies that measure Left Ventricle (LV) function, which measures
clinical indices to analyze the LV diastolic and systolic capabilities on the B or M image.
I. Study items
Abbr. Description Operation LVIDd Left Ventricular Internal Diameter at End-diastole Distance in 2D General
Measurements LVIDs Left Ventricular Internal Diameter at End-systole LVAd sax
MV Left Ventricular Area at Mitral Valve level at End-diastole in Short-axis view
Area in 2D General Measurements
LVAs sax MV
Left Ventricular Area at Mitral Valve level at End-systole in Short-axis view
LVAd apical Left Ventricular Long-axis Area at End-diastole in apical view
LVAs apical Left Ventricular Long-axis Area at end-systole in apical view
II. Study results
)(apical LVLs)(apical LVAs
38
=)(Ellipse) ESV(SP22
cmcmml ×
π

Cardiac Measurements
6-11
Abbr. Description Formula
EDV(BP Ellipse) End-diastolic left ventricular volume
1*
ESV(BP Ellipse) End-systolic left ventricular volume
2*
SV(BP Ellipse) Stroke volume SV(ml)=EDV(ml)-ESV(ml)
CO(BP Ellipse) Cardiac output CO (l/min) = SV (ml) × Heart Rate (bpm) / 1000
EF(BP Ellipse) Ejection fraction EF(No unit)=SV(ml)/EDV(ml)
SI(BP Ellipse) SV Index SI (No unit) = SV (ml) / Body Surface Area (m2)
CI(BP Ellipse) CO Index CI (No unit) = CO (l/min) / Body Surface Area (m2)
*1 means:
*2 means:
III. Operating procedures
1 Select [B-P Ellipse] in the menu.
2 In left ventricular short-axis view, measure the following parameters: At end diastole: LVIDd
At end systole: LVIDs
3 In short-axis view at mitral valve level, measure the following parameters: At end diastole: LVAd sax MV
At end systole: LVAs sax MV
4 In apical long-axis view, measure the following parameters: LVAd apical, the EDV is calculated
LVAs apical, the ESV is calculated
The system calculates SV and EF after LVAs apical has been measured;
If height and weight have been input already, SI is calculated. 5 After HR (heart rate) is measured, the CO and CI are calculated automatically.
6.4.3.3 Bullet Bullet is one of the studies that measure Left Ventricle (LV) function, which measures clinical
indices to analyze the LV diastolic and systolic capabilities on the B or M image.
I. Study items
)()(sax MV LVAs)(apical LVAs38)( Ellipse)ESV(BP 22 cmLVIDscmcmml ××π=
)()(sax MV LVAd)(apical LVAd38)( Ellipse)EDV(BP 22 cmLVIDdcmcmml ××π=

Cardiac Measurements
6-12
Abbr. Description Operation
LVLd apical Left Ventricular Long-axis Length at End-diastole in apical view Distance in 2D General
Measurements LVLs apical
Left Ventricular Long-axis Length at End-systole in apical view
LVAd sax MV Left Ventricular Area at Mitral Valve level at End-diastole in Short-axis view Area in 2D General
Measurements LVAs sax MV
Left Ventricular Area at Mitral Valve level at End-systole in Short-axis view
II. Study results
Abbr. Description Formula EDV(Bullet) End-diastolic left
ventricular volume EDV(ml)= 5/6 × LVLd apical(cm) × LVAd sax MV(cm2)
ESV(Bullet) End-systolic left ventricular volume
ESV(ml)= 5/6 × LVLs apical(cm) × LVAs sax MV(cm2)
SV(Bullet) Stroke volume SV(ml)=EDV(ml)-ESV(ml)
CO(Bullet) Cardiac output CO(l/min)=SV(ml)×Heart Rate (bpm)/1000
EF(Bullet) Ejection fraction EF(No unit)=SV(ml)/EDV(ml)
SI(Bullet) SV Index SI (No unit) = SV (ml) / Body Surface Area (m2)
CI(Bullet) CO Index CI (No unit) = CO (l/min) / Body Surface Area (m2)
III. Operating procedures
1 Select [Bullet] in the menu.
2 In apical long-axis view, measure the following parameters: At end diastole: LVLd apical
At end systole: LVLs apical.
3 In short-axis view at mitral valve level, ,measure the following parameters:
At end diastole: LVAd sax MV, the EDV is calculated
At end systole: LVAs sax MV, the ESV is calculated The system calculates SV and EF; If height and weight have been input already, SI is calculated.
4 After HR (heart rate) is measured, the CO and CI are calculated automatically.
6.4.3.4 Simpson Simpson is one of the studies that measure Left Ventricle (LV) function, which measures
clinical indices to analyze the LV diastolic and systolic capabilities on the B or M image.
I. Study items
Abbr. Description Operation
LVLd apical Left Ventricular Long-axis Length at End-diastole in apical view
Distance in 2D General Measurements

Cardiac Measurements
6-13
Abbr. Description Operation
LVLs apical Left Ventricular Long-axis Length at End-systole in apical view
LVAd sax MV Left Ventricular Area at Mitral Valve level at End-diastole in Short-axis view
Area in 2D General Measurements
LVAs sax MV Left Ventricular Area at Mitral Valve level at End-systole in Short-axis view
LVAd sax PM Left Ventricular Area at Papillary Muscle level at end-diastole in short axis view
LVAs sax PM Left Ventricular Area at Papillary Muscle level at end-systole in short axis view
II. Study results
Abbr. Description Formula
EDV(Simpson) End-diastolic left ventricular volume
*1
ESV(Simpson) End-systolic left ventricular volume
*2
SV(Simpson) Stroke volume SV(ml)=EDV(ml)-ESV(ml)
CO(Simpson) Cardiac output CO (l/min) = SV (ml) × Heart Rate (bpm) / 1000
EF(Simpson) Ejection fraction EF(No unit)=SV(ml)/EDV(ml)
SI(Simpson) SV Index SI (No unit) = SV (ml) / Body Surface Area (m2)
CI(Simpson) CO Index CI (No unit) = CO (l/min) / Body Surface Area (m2)
*1 means:
*2 means:
III. Operating procedures
1 Select [Simpson] in the menu. 2 In apical long-axis view, measure the following parameters:
At end diastole: LVLd apical
At end systole: LVLs apical
1000)PM(cmsax LVAs)MV(cmsax LVAs
)PM(cmsax LVAs2)MV(cmsax LVAs4
9apical(cm) LVLs
=)(ESV22
22
⎟⎟
⎠
⎞
⎜⎜
⎝
⎛
×
+×+×
×ml
1000)PM(cmsax LVAd)MV(cmsax LVAd
)PM(cmsax LVAd2)MV(cmsax LVAd4
9apical(cm) LVLd
=)(EDV22
22
⎟⎟
⎠
⎞
⎜⎜
⎝
⎛
×
+×+×
×ml

Cardiac Measurements
6-14
3 In short-axis view at mitral valve level, measure the following parameters: At end diastole: LVAd sax MV
At end systole: LVAs sax MV 4 In short-axis view at papillary muscle level, measure the following parameters:
At end diastole: LVAd sax PM, the EDV is calculated
At end systole: LVAs sax PM, the ESV is calculated The system calculates SV and EF; If height and weight have been input already, SI is calculated.
5 After HR (heart rate) is measured, the CO and CI are calculated automatically.
6.4.3.5 Simpson SP Simpson SP is one of the studies that measure Left Ventricle (LV) function, which measures
clinical indices to analyze the LV diastolic and systolic capabilities on the B or M image.
A vertical plane and a long axis are used to calculate left ventricular volume at apical
two-chamber or apical four-chamber view.
I. Study items
Abbr. Description Operation
EDV(A2C/A4C) End-diastolic Left Ventricular Volume (apical 2-chamber/ 4-chamber) Simpson measurement (Trace/
Spline) ESV(A2C/A4C)
End-systolic Left Ventricular Volume (apical 2-chamber/ 4-chamber)
II. Study results
Abbr. Description Formula
EDV(Simpson SP)
End-diastolic left
ventricular volume LVLd apical: Left Ventricular Long-axis Length at End-diastole in apical view, i.e. the long-axis length obtained in measurement.
ir : Radiuses obtained from diastolic measurement
)(20
)(apical LVLd=)(EDV
20
1
2 cmrcmmli
i∑=
××π

Cardiac Measurements
6-15
ESV(Simpson SP)
End-systolic left ventricular volume
LVLs apical: Left Ventricular Long-axis Length at End-systole in apical view, i.e. the long-axis length obtained in measurement.
ir : Radiuses obtained from systolic measurement
SV(Simpson SP) Stroke Volume SV(ml)=EDV(ml)-ESV(ml)
CO(Simpson SP) Cardiac Output CO (l/min) = SV (ml) × Heart Rate (bpm) / 1000
EF(Simpson SP) Ejection Fraction EF(No unit)=SV(ml)/ EDV(ml)
SI(Simpson SP) SV INDEX SI (No unit) = SV (ml) / Body Surface Area (m2)
CI(Simpson SP) CO INDEX CI (No unit) = CO (l/min) / Body Surface Area (m2)
III. Operating procedures
1 Select [Simpson SP] in the menu.
2 Measure the endocardium. Measure the left ventricular endocardium at end-diastolic, and set the long axis, the EDV is obtained;
Measure the left ventricular endocardium at end-systolic, and set the long axis, the ESV is obtained;
The system calculates SV and EF;
If height and weight have been input already, SI is calculated.
3 After HR (heart rate) is measured, the CO and CI are calculated automatically.
IV. Measurement Methods
The endocardium can be measured using trace or spline method.
Trace Trace the endocardium along the edge of the target area using the method similar to the “Trace” method in 2D Area measurements; and then set the long axis.
Spline Set reference points (up to 12) along the edge of the endocardium using the method similar to the “Spline” method in 2D Area measurements; and then set the long axis.
6.4.3.6 Simpson BP Simpson BP is one of the studies that measure Left Ventricle (LV) function, which measures
clinical indices to analyze the LV diastolic and systolic capabilities on the B or M image.
Two vertical planes (apical two-chamber view and apical four-chamber view) and a long axis
are used to calculate left ventricular volume.
I. Study items
)(20
)(apical LVLs=)(ESV
20
1
2 cmrcmmli
i∑=
××π

Cardiac Measurements
6-16
Abbr. Description Operation
EDV(A2C) End-diastolic Left Ventricular Volume (apical 2-chamber)
Simpson measurement (Trace/ Spline) See “6.4.3.5 Simpson SP” for endocardium measurement
ESV(A2C) End-systolic Left Ventricular Volume (apical 2-chamber)
EDV(A4C) End-diastolic Left Ventricular Volume (apical 4-chamber)
ESV(A4C) End-systolic Left Ventricular Volume (apical 4-chamber)
II. Study results
Abbr. Description Formula
EDV(Simpson BP) End-diastolic left ventricular volume
*1
ESV(Simpson BP) End-systolic left ventricular volume *2
SV(Simpson BP) Stroke Volume SV(ml)=EDV(ml)-ESV(ml)
CO(Simpson BP) Cardiac Output CO (l/min) = SV (ml) × Heart Rate (bpm) / 1000
EF(Simpson BP) Ejection Fraction EF(No unit)=SV(ml)/ EDV(ml)
SI(Simpson BP) SV INDEX SI (No unit) = SV (ml) / Body Surface Area (m2)
CI(Simpson BP) CO INDEX CI (No unit) = CO (l/min) / Body Surface Area (m2)
*1 means:
*2 means:
To calculate LV volume at apical two-chamber view:
To calculate LV volume at apical four-chamber view:
{ } ))()((20)(),()(ESV
20
142
42 ∑=
×××i
iiii cmrcmrcmLVLscmLVLsMAXml π=
{ } ))()((20)(),()(EDV
20
142
42 ∑=
×××i
iiii cmrcmrcmLVLdcmLVLdMAXml π=
∑=
××20
1
24
4 )(20)()(4EDV
ii
i cmrcmLVLdml π=
∑=
××20
1
22
2 )(20)()(2EDV
ii
i cmrcmLVLdml π=
∑=
××20
1
22
2 )(20)()(2ESV
ii
i cmrcmLVLsml π=

Cardiac Measurements
6-17
In the formulae above,
– Left ventricular long-axis length at end diastole at apical two-chamber view, which is the long-axis length obtained by EDV(A2C) measurement
– Left ventricular long-axis length at end diastole at apical four-chamber view, which is the long-axis length obtained by EDV(A4C) measurement
iLVLs2 – Left ventricular long-axis length at end systole at apical two-chamber view, which is the long-axis length obtained by ESV(A2C) measurement
iLVLs4 – Left ventricular long-axis length at end systole at apical four-chamber view, which is the long-axis length obtained by ESV(A4C) measurement
ir2 – Radiuses obtained by EDV(A2C) or ESV(A2C) at apical two-chamber view
ir4 – Radiuses obtained by EDV(A4C) or ESV(A4C) at apical two-chamber view
III. Operating procedures
1 Select [Simpson BP] in the menu.
2 In apical two-chamber view, measure the following parameters: Left ventricular endocardium at end-diastolic, and set the long axis, the EDV(A2C) is obtained;
Left ventricular endocardium at end-systolic, and set the long axis, the ESV(A2C) is obtained;
3 In apical four-chamber view, measure the following parameters: Left ventricular endocardium at end-diastolic, and set the long axis, the EDV(A4C) is obtained;
Left ventricular endocardium at end-systolic, and set the long axis, the ESV(A4C) is obtained;
If height and weight have been input already, SV, EF and SI are calculated.
4 After HR (heart rate) is measured, the CO and CI are calculated automatically.
CAUTION: When using Simpson BP to measure LV function, be sure to keep the apical four-chamber view and apical two-chamber view perpendicular. Otherwise the measure result will be incorrect.
6.4.3.7 Cube Cube is one of the studies that measure Left Ventricle (LV) function, which measures clinical
indices to analyze the LV diastolic and systolic capabilities on the B or M image.
I. Study items
iLVLd4
iLVLd 2
∑=
××20
1
24
4 )(20)()(4ESV
ii
i cmrcmLVLsml π=

Cardiac Measurements
6-18
Abbr. Description Operation
Diastole Measures left ventricle at end diastole
FoldLine in 2D mode Parallel Method in M mode
IVSd Interventricular septal thickness at end diastole
Same as Distance measurement of 2D/M General Measurements
LVIDd Left ventricular short-axis diameter at end diastole
LVPWd Left ventricular posterior wall thickness at end diastole
Systole Measures left ventricle at end systole
FoldLine in 2D mode Parallel Method in M mode
IVSs Interventricular septal thickness at end systole
Same as Distance measurement of 2D/M General Measurements
LVIDs Left ventricular short-axis diameter at end systole
LVPWs Left ventricular posterior wall thickness at end systole
II. Study results
Abbr. Description Formula
EDV(Cube) End-diastolic left ventricular volume
EDV (ml) = LVIDd (cm)3
ESV(Cube) End-systolic left ventricular volume
ESV (ml) = LVIDs (cm)3
SV(Cube) Stroke volume SV(ml)=EDV(ml)-ESV(ml)
CO(Cube) Cardiac output CO (l/min) = SV (ml) × Heart Rate (bpm) / 1000
EF(Cube) Ejection fraction EF(No unit)=SV(ml)/ EDV(ml)
FS(Cube) Fractional shortening FS[No unit]
=(LVIDd [cm]–LVIDs[cm])/LVIDd [cm]
MVCF(Cube) Mean velocity of circumferential fiber shortening
MVCF= (LVIDd [cm] – LVIDs [cm]) / (LVIDd [cm] × LVET [s] / 1000)
SI(Cube) SV Index SI(No unit)=SV(ml)/ Body Surface Area(m2)
CI(Cube) CO Index CI(No unit)=CO(l/min)/ Body Surface Area(m2)
III. Operating procedures
1 Select [Cube] in the menu.
2 Measure Diastole in 2D or M mode.
The IVSd, LVIDd. LVPWd and EDV are obtained.

Cardiac Measurements
6-19
3 Measure Systole in 2D or M mode.
IVSs, LVSs, LVIDs, LVPWs and ESV are obtained.
The system calculates SV, EF and FS;
4 If height and weight have been input already and the HR (heart rate) is measured, SI, CO and CI are calculated.
If LVET is measured, MVCF will be calculated.
Or,
1 Select [Cube] in the menu.
2 At end diastole of left ventricle, measure the following parameters respectively: IVSd: Same as Distance measurement of 2D/M General Measurements
LVIDd: Same as Distance measurement of 2D/M General Measurements. EDV is calculated.
LVPWd: Same as Distance measurement of 2D/M General Measurements
EDV value is then calculated.
3 At end systole of left ventricle, measure the following parameters respectively: IVSTsIVSs: Same as Distance measurement of 2D/M General Measurements
LVIDs: Same as Distance measurement of 2D/M General Measurements. ESV is calculated.
LVPWs: Same as Distance measurement of 2D/M General Measurements
ESV value is then calculated.
4 After LVPWs is measured, SV, EF and FS are calculated. If patient height and weight are entered, and heart rate is already measured, SI, CO and CI can be calculated.
If LVET is measured, MVCF will be calculated.
6.4.3.8 Teichholz Teichholz is one of the studies that measure Left Ventricle (LV) function, which measures
clinical indices to analyze the LV diastolic and systolic capabilities on the B or M image.
I. Study items
Abbr. Description Operation
Diastole Measures left ventricle at end diastole
FoldLine in 2D mode Parallel Method in M mode
IVSd Interventricular septal thickness at end diastole
Same as Distance measurement of 2D/M General Measurements
LVIDd Left ventricular short-axis diameter at end diastole
LVPWd Left ventricular posterior wall thickness at end diastole
Systole Measures left ventricle at end systole
FoldLine in 2D mode Parallel Method in M mode
IVSs Interventricular septal thickness at end systole
Same as Distance measurement of 2D/M General Measurements

Cardiac Measurements
6-20
Abbr. Description Operation
LVIDs Left ventricular short-axis diameter at end systole
LVPWs Left ventricular posterior wall thickness at end systole
II. Study results
Abbr. Description Formula
EDV(Teichholz) End-diastolic left ventricular volume
EDV(ml)=(7×(LVIDd(cm))3)/(2.4 + LVIDd(cm))
ESV(Teichholz) End-systolic left ventricular volume
ESV (ml)=(7×(LVIDs (cm))3)/(2.4 + LVIDs(cm))
SV(Teichholz) Stroke volume SV(ml)=EDV(ml)-ESV(ml)
CO(Teichholz) Cardiac output CO(l/min)=SV(ml)×Heart Rate (bpm)/ 1000
EF(Teichholz) Ejection fraction EF(No unit)=SV(ml)/ EDV(ml)
FS(Teichholz) Fractional shortening FS[No unit]
=(LVIDd [cm]–LVIDs[cm])/LVIDd [cm]
MVCF(Teichholz) Mean velocity of circumferential fiber shortening
MVCF= (LVIDd [cm] – LVIDs [cm]) / (LVIDd [cm] × LVET [s] / 1000)
SI(Teichholz) SV Index SI(No unit)=SV(ml)/ Body Surface Area (m2)
CI(Teichholz) CO Index CI(No unit)=CO(l/min)/Body Surface Area (m2)
III. Operating procedures
See table above for methods and formulae of the measurement items.
See section "6.4.3.7 Cube" for measurement procedures.
6.4.3.9 Gibson Gibson is one of the studies that measure Left Ventricle (LV) function, which measures
clinical indices to analyze the LV diastolic and systolic capabilities on the B or M image.
I. Study items
Abbr. Description Operation
Diastole Measures left ventricle at end diastole
FoldLine in 2D mode Parallel Method in M mode
IVSd Interventricular septal thickness at end diastole
Same as Distance measurement of 2D/M General Measurements

Cardiac Measurements
6-21
Abbr. Description Operation
LVIDd Left ventricular internal diameter at end diastole
LVPWd Left ventricular posterior wall thickness at end diastole
Systole Measures left ventricle at end systole
FoldLine in 2D mode Parallel Method in M mode
IVSs Interventricular septal thickness at end systole
Same as Distance measurement of 2D/M General Measurements
LVIDs Left ventricular internal diameter at end systole
LVPWs Left ventricular posterior wall thickness at end systole
II. Study results
Abbr. Description Formula
EDV(Gibson) End-diastolic left ventricular volume
2)()90.5)(98.0(6)(EDV cmLVIDdcmLVIDdml ×+××π=
ESV(Gibson) End-systolic left ventricular volume
2)()18.4)(14.1(6)(ESV cmLVIDscmLVIDsml ×+××π=
SV(Gibson) Stroke Volume SV(ml)=EDV(ml)-ESV(ml)
CO(Gibson) Cardiac Output CO(l/min)=SV(ml)× HR(bpm)/ 1000
EF(Gibson) Ejection Fraction EF(No unit)=SV(ml)/ EDV(ml) SI(Gibson) SV INDEX SI(No unit)=SV(ml)/ BSA(m2) CI(Gibson) CO INDEX CI(No unit)=CO(l/min)/ BSA(m2) MVCF(Gibson) Mean velocity of circumferential
fiber shortening MVCF= (LVIDd [cm] – LVIDs [cm]) / (LVIDd [cm] × LVET [s] / 1000)
FS(Gibson) Fractional shortening FS[No unit] = (LVIDd [cm] – LVIDs[cm]) / LVIDd [cm]
III. Operating procedures
See table above for methods and formulae of the measurement items.
See section "6.4.3.7 Cube" for measurement procedures.
6.4.3.10 Left Ventricular Mass (LV Mass) Estimates the Index of Left Ventricular Mass (LV Mass-I) by calculating the LV Mass.
LV MASS-I (No unit) = LV Mass (g) / Body Surface Area (m2)

Cardiac Measurements
6-22
LV Mass (Cube) I. Study Items
Tools Descriptions Operations
IVSd Interventricular Septal Thickness at End-diastole Distance in 2D/M General Measurements
LVIDd Left Ventricular Internal Diameter at End-diastole
LVPWd Left Ventricular Posterior Wall Thickness at End-diastole
II. Study Results
Tools Descriptions Formulae
LV Mass (Cube) Left Ventricular Mass
LV Mass (g) = 1.04 × ((LVPWd(cm) + IVSd(cm) + LVIDd(cm))3 - LVIDd(cm)3) - 13.6
LV MASS-I (Cube)
Index of Left Ventricular Mass
See LV Mass-I formula in “Left Ventricular Mass (LV Mass)”
III. Operating Procedures
1. Select [LV Mass (Cube)] in the measurement menu.
2. At end diastole, measure the following parameters:
IVSd
LVIDd
LVPWd
The LV Mass (Cube) is calculated.
If height and weight have been input already, LV Mass-I(Cube) is calculated.
LV Mass (A-L) I. Study Items
Tools Descriptions Operations
LVAd sax Epi Left Ventricular Epicardial Area at Papillary Muscle level at end-diastole in Short-axis view Area in 2D General
Measurements LVAd sax Endo Left Ventricular Endocardial Area at Papillary
Muscle level at end-diastole in Short-axis view
LVLd apical Left Ventricular Long-axis Length at End-diastole in apical view
Distance in 2D General Measurements
II. Study Results
Tools Descriptions Formulae
LV Mass (A-L) Left Ventricular Mass *1
LV MASS-I (A-L) Index of Left Ventricular Mass
See LV Mass-I formula in “Left Ventricular Mass (LV Mass)”
*1 means:
LVL(cm)))(cm Endosax LVAd- t(cm))apical(cm) (LVLd )Epi(cmsax LVAd ( 5/61.05 Mass(g) LV
2
2
×
+×××=

Cardiac Measurements
6-23
Where,
III. Operating Procedures
1. Select [LV Mass (A-L)] in the measurement menu.
2. In long-axis view at end diastole, measure LVLd apical;
3. In short-axis view at papillary muscle level at end diastole, measure the following parameters:
Endocardium area: LVAd sax Endo;
Epicardium area: LVAd sax Epi
The LV Mass (A-L) is calculated.
If height and weight have been input already, LV Mass-I(A-L) is calculated.
LV Mass (T-E) I. Study Items
Tools Descriptions Operations
LVAd sax Epi Left Ventricular Epicardial Area at Papillary Muscle level at end-diastole in Short-axis view Area in 2D General
Measurements LVAd sax Endo Left Ventricular Endocardial Area at Papillary
Muscle level at end-diastole in Short-axis view
a Semi-major axis from widest minor axis radius to apex Distance in 2D General
Measurements d Truncated semi-major axis from widest minor
axis radius to mitral annulus plane
II. Study Results
Except for values in upper table, the following results can be obtained in this study:
Tools Descriptions Formulae
LV Mass (T-E) Left Ventricular Mass *1
LV MASS-I (T-E) Index of Left Ventricular Mass
See LV Mass-I formula in “Left Ventricular Mass (LV Mass)”
*1 means:
Where, units of a, b, d, t are cm.
a: Semi-major axis from widest minor axis radius to apex d: Truncated semi-major axis from widest minor axis radius to mitral annulus plane t: Thickness of the myocardium
b: Short axis radius, usually measured where the radius is largest.
))/Endo(cmSax (LVAd - ) /)Epi(cmsax (LVAd (cm)t 22 ππ=
)}3ad-d+
32a(b-]
t)+3(ad-d+
3t)2(a[t)+(b{1.05 Mass(g) LV 2
32
2
32 ×
+××= π
))/Endo(cmSax (LVAd - ) /)Epi(cmsax (LVAd (cm)t 22 ππ=

Cardiac Measurements
6-24
III. Operating Procedures
1. Select [LV Mass(T-E)] in the measurement menu.
2. In short-axis view at papillary muscle level at end diastole, measure the following parameters:
Endocardium area: LVAd sax Endo;
Epicardium area LVAd sax Epi
3. Measure a and d.
The LV Mass(T-E) is calculated.
If height and weight have been input already, LV Mass-I(T-E) is calculated.
6.4.3.11 LA/Ao Function: measures LA Diam (left atrium diameter) and Ao Diam (aorta diameter), calculates
LA/Ao and Ao/LA. The formulae are:
LA/Ao (No unit) = LA Diam (cm) / Ao Diam (cm)
Ao/LA (No unit) = Ao Diam (cm) / LA Diam (cm)
1 Select [LA/Ao] in the menu.
2 Use the method of Distance measurement of 2D General Measurements to measure LA Diam and Ao Diam.
3 The values of LA/Ao and Ao/LA are obtained.
6.4.3.12 LVIMP LVIMP (Left Ventricular Index of Myocardial Performance) is used to analyze the integrative
ventricular diastolic and systolic capabilities.
I. Study Items
Tools Descriptions Operations
MV C-O dur Mitral Valve close-open Duration
Time in M/Doppler General Measurements
LVET Left Ventricular Ejection Time
II. Study Results
Except for values in upper table, the following results can be obtained in this study:
Tools Descriptions Formulae
LVIMP Left Ventricular Index of Myocardial Performance
III. Operating Procedures
See table above for methods and formulae of the measurement items.
LVET(s)LVET(s)-dur(s) O-C MVit)LVIMP(Noun =
))/Endo(cmSax (LVAd b(cm) 2 π=

Cardiac Measurements
6-25
6.4.3.13 RVIMP Measurement of RVIMP (Right Ventricular Index of Myocardial Performance) is similar to
that of LVIMP.
I. Study Items
Tools Descriptions Operations TV C-O dur TV A Dur close-open Duration Time in Doppler General
Measurements RVET Right Ventricular Ejection Time
II. Study Results
Except for values in upper table, the following results can be obtained in this study:
Tools Descriptions Formulae
RVIMP Right Ventricular Index of Myocardial Performance
III. Operating Procedures
See table above for methods and formulae of the measurement items.
6.4.3.14 Mitral Valve I. Study items
Mode Abbr. Description Operation or formula
2D/M
/ Doppler
MV Diam Mitral valve diameter Same as Distance measurement of 2D General Measurements
MVA Mitral valve area planimetry
Same as Area measurement of 2D General Measurements
M/ Doppler EPSS Distance between point E and the interventricular septum
Same as Distance measurement of M General Measurements
MV D-E Slope
Mitral valve D-E slope Same as Slope measurement of M General Measurements
MV E-F Slope
Mitral valve E-F slope
MV A Amp Amplitude of the Mitral Valve A wave
Same as Distance measurement of M General Measurements
MV E Amp Amplitude of the Mitral Valve E wave
MV DE Amplitude of the mitral valve DE wave
RVET(s)RVET(s)-dur(s) O-C TVit)RVIMP(Noun =

Cardiac Measurements
6-26
Mode Abbr. Description Operation or formula
MV ACV Mitral valve AC velocity Same as Slope measurement of M General Measurements
MV E Vel Mitral valve E-wave flow velocity Same as D Velocity measurement
of Doppler General Measurements MV A Vel Mitral valve A-wave flow velocity
MV E/A / MV E/A (No unit) = MV E Vel (cm/s) / MV A Vel (cm/s)
MV A/E / MV A/E (No unit) = MV A Vel (cm/s) / MV E Vel (cm/s)
MV PHT Mitral valve pressure half time
Doppler measurement
MVA(PHT) Mitral Valve Orifice Area (PHT)
MVA(PHT) (cm2) = 220 / MV PHT (ms)
MV Acct Mitral Valve Acceleration Time Doppler measurementAcceleration
in Doppler General Measurements MV DecT Mitral valve deceleration time
MV VTI Mitral valve velocity-time integral
Same as D Trace of Doppler General Measurements
IVRT Isovelocity relaxation time
Same as Time measurement of Doppler General Measurements
IVCT Isovelocity Compression Time
MV E Dur Mitral valve E-wave duration
MV A Dur Mitral valve A-wave duration
MV C-O dur Mitral Valve close-open Duration
MR VTI Mitral regurgitation velocity-time integral
Same as D Trace of Doppler General Measurements
MR dP/dt Rate of Pressure change MR dP/dt (mmHg/s) = 32 / MR dt dP/dt measurement
II. Study results
Abbr. Description Formula
MV CA/CE / MV CA/CE (No unit) = MV CA (cm) / MV CE (cm)
MV E PG Mitral valve E-wave pressure gradient
Obtained from MV E Vel measurement

Cardiac Measurements
6-27
MV A PG Mitral valve a-wave pressure gradient
Obtained from MV A Vel measurement
MV Acc Slope Mitral valve acceleration slope Obtained from MV AccT measurement
MV Dec Slope Mitral valve deceleration slope Obtained from MV DecT measurement
LVIMP Left Ventricular Index of Myocardial Performance
Obtained from MV C-O dur measurement
The tools in the below table can be measured by MV VTI.
Abbr. Description Operation or formula
MV Vmax Mitral valve velocity Obtained from MV VTI measurement
MV Vmean Mitral valve mean velocity
MV PGmax Mitral valve pressure gradient MV PGmax (mmHg) = 4 × MV Vmax (m/s)2
MV PGmean Mitral valve mean pressure gradient
Obtained from MV VTI measurement MV VTI Mitral valve velocity-time integral
MV θ Mitral valve spectrum correction angle
MV HR Mitral valve heart rate
MV SV Mitral valve stroke volume MV SV (ml) = 0.785 × MV Diam (cm)2 × |MR VTI (cm)|
MV SI Mitral valve SV index MV SI (No unit) = MV SV (ml) / Body Surface Area(m2)
MV CO Mitral valve cardiac output MV CO (l/min) = MV SV (ml) × MV HR (bpm) / 1000
MV CI Mitral valve CO index MV CI (No unit) = MV CO (l/min) / Body Surface Area (m2)
The tools in the below table can be measured by MR VTI.
Abbr. Description Operation or formula
MR Vmax Mitral regurgitation velocity
Obtained from MR VTI measurement MR Vmean Mitral regurgitation mean
velocity
MR PGmax Mitral regurgitation pressure gradient
MR PGmax (mmHg) = 4 × MR Vmax (m/s)2
MR PGmean Mitral regurgitation mean pressure gradient
Obtained from MR VTI measurement

Cardiac Measurements
6-28
MR VTI Mitral regurgitation velocity-time integral
MR θ Mitral regurgitation spectrum correction angle
III. Operating procedures
For the operation methods, please refer to the above tables.
6.4.3.15 Tricuspid Valve I. Study items
Abbr. Description Operation
TV VTI Tricuspid valve velocity trace
Same as D Trace of Doppler General Measurements
TV Vmax Tricuspid valve velocity Same as D Velocity of Doppler General Measurements, or obtained from TV VTI measurement
TR VTI Tricuspid regurgitation velocity trace
Same as D Trace of Doppler General Measurements
II. Study results
The tools in the below table can be measured by TV VTI.
Abbr. Description Operation
TV Vmax Tricuspid valve velocity
Obtained from TV VTI measurement TV Vmean Tricuspid valve mean
velocity
TV PGmax Tricuspid valve pressure gradient
TV PGmax (mmHg) = 4 × TV Vmax (m/s)2, also can be measured by TV Vmax
TV PGmean
Tricuspid valve mean pressure gradient
Obtained from TV VTI measurement TV VTI Tricuspid valve
velocity-time integral
TV θ Tricuspid valve spectrum correction angle
TV HR Tricuspid heart rate
TV SV Tricuspid valve stroke volume
TV SV (ml) = 0.785 × TV Diam (cm)2 × |TR VTI (cm)|

Cardiac Measurements
6-29
TV SI Tricuspid valve SV index TV SI (No unit) = TV SV (ml) /Body Surface Area (m2)
TV CO Tricuspid valve cardiac output
TV CO (l/min) = TV SV (ml) × MV HR (bpm)/1000
TV CI Tricuspid valve CO index TV CI (No unit) = TV CO (l/min) / Body Surface Area (m2)
The tools in the below table can be measured by TR VTI.
Tool Description Operation
TR Vmax Tricuspid regurgitation velocity
Obtained from TR VTI measurement TR Vmean Tricuspid regurgitation
mean velocity
TR PGmax Tricuspid regurgitation pressure gradient
TR PGmax (mmHg) = 4 × TR Vmax (m/s)2
TR PGmean
Tricuspid regurgitation mean pressure gradient
Obtained from TR VTI measurement TR VTI Tricuspid regurgitation
velocity-time integral
TR θ Tricuspid regurgitation spectrum correction angle
RVSP Right ventricle systolic pressure
RVSP (mmHg) = RA Press (mmHg) + TR PGmax (mmHg)
RA Press – Right atrium pressure
III. Operating procedures
For the operation methods, please refer to the above tables. In TR VTI, if enter RA Press in
the [Patient Info] → [CARD] dialog box, the RVSP can be obtained.
6.4.3.16 Aortic Valve I. Study items
Abbr. Description Operation
LVOT Diam Left ventricular outflow tract diameter
Same as Distance measurement of 2D General Measurements
LVOT Trace Left ventricular outflow tract velocity trace
Same as D Trace of Doppler General Measurements

Cardiac Measurements
6-30
Abbr. Description Operation
LVOT Vmax Left ventricular outflow tract velocity
Same as D Velocity measurement of Doppler General Measurements, or obtained from LVOT VTI measurement
AV Diam Aortic valve diameter Same as Distance measurement of 2D General Measurements
AVA Aortic valve area Same as Area measurement of 2D General Measurements
AV VTI Aortic valve velocity trace
Same as D Trace of Doppler General Measurements
AV Vmax Aortic valve velocity Same as D Velocity measurement of Doppler General Measurements, or obtained from AV VTI measurement
AR Aortic regurgitation Same as Acceleration measurement of Doppler General Measurements
II. Study results
The tools in the below table can be measured by LVOT VTI.
Abbr. Description Operation or formula
LVOT Vmax
Left ventricular outflow tract velocity
Same as D Velocity measurement of Doppler General Measurements, or obtained from LVOT VTI measurement
LVOT Vmean
Left ventricular outflow tract mean velocity
Obtained from LVOT VTI measurement
LVOT PGmax
Left ventricular outflow tract pressure gradient
LVOT PGmax (mmHg) = 4 × LVOT Vmax (m/s)2
LVOT PGmean
Left ventricular outflow tract mean pressure gradient
Obtained from LVOT VTI measurement
LVOT VTI Left ventricular outflow tract velocity-time integral
LVOT θ Left ventricular outflow tract spectrum correction angle
LVOT HR Left ventricular outflow tract heart rate
LVOT SV Left ventricular outflow tract stroke volume
LVOT SV (ml) = 0.785 × LVOT Diam (cm)2 × |LVOT VTI|

Cardiac Measurements
6-31
Abbr. Description Operation or formula
LVOT SI Left ventricular outflow tract SV index
LVOT SI (No unit) = LVOT SV (ml) / Body Surface Area (m2)
LVOT CO Left ventricular outflow tract cardiac output
LVOT CO (l/min) = LVOT SV (ml) × LVOT HR (bpm) /1000
LVOT CI Left ventricular output tract CO index
LVOT CI (No unit) = LVOT CO (l/min) / Body Surface Area (m2)
MVA(VTI) Mitral Valve Area
AVA(VTI) Aortic valve area
The tools in the below table can be measured by AV VTI.
Abbr. Description Operation or formula
AV Vmax Aortic valve velocity Same as D Velocity measurement of Doppler General Measurements, or obtained from AV VTI measurement
AV Vmean Aortic valve mean velocity
Obtained from AV VTI measurement
AV PGmax Aortic valve pressure gradient
AV PGmax (mmHg) = 4 × AV Vmax (m/s)2
AV PGmean Aortic valve mean pressure gradient
Obtained from AV VTI measurement
AV VTI Aortic valve velocity-time integral
AV θ Aortic valve spectrum correction angle
AV HR Aortic valve heart rate
AV SV Aortic Valve Stroke Volume
AV SV (ml) = 0.785 × AV Diam (cm)2 × |AV VTI|
AV SI Aortic valve SV Index
AV SI (No unit) = AV SV (ml) / Body Surface Area (m2)
AV CO Aortic Valve Cardiac Output
AV CO (l/min) = AV SV (ml) × AV HR (bpm) /1000
AV CI Aortic Valve Cardiac output
AV CI (No unit) = AV CO (l/min) / Body Surface Area (m2)
VTI(cm) AV4)Diam(cm LVOTVTI(cm) LVOT
)mAVA(VTI)(c22
2
×××
=π
VTI(cm) MV4)Diam(cm LVOTVTI(cm) LVOT
)mMVA(VTI)(c22
2
×××
=π

Cardiac Measurements
6-32
Qp/Qs Flow ration of Pulmonary circulation and Systemic circulation
Qp/Qs(No unit) = PV CO(l/min)/AV CO(l/min)
Qp-Qs Flow difference of Pulmonary circulation and Systemic circulation
Qp-Qs(No unit) = PV CO(l/min) - AV CO(l/min)
AVA(VTI) Aortic valve area VTI(cm) AV4
)Diam(cm LVOTVTI(cm) LVOT)mAVA(VTI)(c
222
×××
=π
The tools in the below table can be measured by AR.
Abbr. Description Operation or formula
AR Vmax Aortic regurgitation velocity
Obtained from AR measurement AR Ved Aortic regurgitation
velocity at end diastole
AR DcR Aortic regurgitation deceleration rate
AR DcR (cm/s2) = (AR Vmax (cm/s) – AR Ved (cm/s)) / AR Time (s)
AR Time – Aortic regurgitation time
AR DcT Aortic regurgitation deceleration time
AR DcT (s) = AR Vmax (cm/s) / AR DcR (cm/s)
AR Time
III. Operating procedures
For the operation methods, please refer to the above tables.
6.4.3.17 Pulmonary Valve I. Measurement tools
Abbr. Description Operation
PV Diam Pulmonary valve diameter Same as Distance measurement of 2D General Measurements
PV VTI Pulmonary valve velocity trace
Same as D Trace of Doppler General Measurements
PV Vmax Pulmonary valve velocity Same as D Velocity measurement of Doppler General Measurements, or obtained from PV VTI measurement

Cardiac Measurements
6-33
II. Study results
The tools in the below table can be measured by PV VTI.
Abbr. Description Formula
PV Vmax Pulmonary valve velocity Same as D Velocity measurement of Doppler General Measurements, or obtained from PV VTI measurement
PV Vmean
Pulmonary valve mean velocity Obtained from PV VTI measurement
PV PGmax
Pulmonary valve pressure gradient PV PGmax (mmHg) = 4 × PV Vmax (m/s)2
PV PGmean
Pulmonary valve mean pressure gradient
Obtained from PV VTI measurement PV VTI Pulmonary valve velocity-time
integral
PV θ Pulmonary valve spectrum correction angle
PV HR Pulmonary valve heart rate
PV SV Pulmonary valve stroke volume PV SV (ml) = 0.785 × PV Diam (cm)2 × |PV VTI|
PV SI Pulmonary valve SV index PV SI (No unit) = PV SV (ml) / Body Surface Area (m2)
PV CO Pulmonary valve cardiac output PV CO (l/min) = PV SV (ml) × PV HR (bpm) /1000
PV CI Pulmonary valve CO index PV CI (No unit) = PV CO (l/min) / Body Surface Area (m2)
Qp/Qs Flow ration of Pulmonary circulation and Systemic circulation
Qp/Qs(No unit) = PV CO(l/min)/AV CO(l/min)
Qp-Qs Flow difference of Pulmonary circulation and Systemic circulation
Qp-Qs(No unit) = PV CO(l/min) - AV CO(l/min)
III. Operating procedures
For the operation methods, please refer to the above tables.
6.4.3.18 RV Study RV (Right Ventricle) study measures clinical indices of right ventricle.
I. Study items
Abbr. Description Operation
RVDd Right ventricular end diastole diameter
Same as Distance measurement of 2D General Measurements
Cardiac Measurements
6-34
Abbr. Description Operation
RVDs Right ventricular end systole diameter
RVET Right ventricular ejection time
Same as Time measurement of Doppler General Measurements
RV AccT Right ventricular acceleration time
RVPEP Right ventricular pre-ejection period
II. Study results
Abbr. Description Formula
RV AccT/ET
Ratio of Right ventricular acceleration time to ejection time
RV AccT/ET(No unit)=RVAccT(s) / RVET (s)
RVPEP/ET Right ventricular systolic time interval
RVPEP/ET (No unit)=RVPEP(s) / RVET (s)
III. Operation procedures
For the operation methods, please refer to the above tables.
6.4.3.19 Pulmonary Vein Pulmonary Vein measures clinical indices of pulmonary vein flow.
I. Study items
Abbr. Description Operation
PVein S1 Vel Pulmonary vein S1-wave flow velocity Same as D Velocity measurement of Doppler General Measurements
PVein S Vel Pulmonary vein S-wave flow velocity
PVein D Vel Pulmonary vein D-wave flow velocity
PVein A Vel Pulmonary vein A-wave flow velocity
PVein A Dur Pulmonary vein atrial inversion duration
Same as Time measurement of Doppler General Measurements
PVein S VTI Pulmonary vein S-wave velocity-time integral Same as D Trace of Doppler
General Measurements PVein D VTI Pulmonary vein D-wave velocity-time integral
PVein DecT Pulmonary vein deceleration time Same as Time measurement of Doppler General Measurements
II. Study results
Abbr. Description Formula
PVein S/D Ratio of pulmonary vein S-wave flow velocity to D-wave flow velocity
PVein S/D (No unit) = PVein S Vel (cm/s) / PVein D Vel (cm/s)

Cardiac Measurements
6-35
Abbr. Description Formula
PVein SF Pulmonary vein systolic fraction PVein SF (No unit) = PVein S VTI (cm) / (PVein S VTI (cm) + PVein D VTI (cm))
III. Operation procedures
For the operation methods, please refer to the above tables.
6.4.3.20 Volume Flow Volume Flow measures clinical indices of blood flow.
I. Study tools
Abbr. Description Operation
Vas Area Vessel cross sectional area Same as Area measurement of 2D General Measurements
Vas Flow Volume flow velocity trace Same as D Trace of Doppler General Measurements
Vas AccT Vessel flow acceleration time Same as Time measurement of Doppler General Measurements
Vas DecT Vessel flow deceleration time
Vas CycleT Vessel flow cycle time
II. Study results
The tools in the table below can be measured by Vas Flow.
Abbr. Description Operation or formula
Vas Flow Vmax Vas flow velocity Obtained from Vas Flow measurement
Vas Flow Vmean Vas flow mean velocity
Vas Flow PGmax Vas flow pressure gradient Vas Flow PGmax (mmHg) = 4 × Vas Flow Vmax (m/s)2
Vas Flow PGmean
Vas flow mean pressure gradient
Obtained from Vas Flow measurement Vas Flow VTI Vas flow velocity-time integral
Vas Flow θ Vas flow spectrum correction angle
Vas Flow HR Vas flow heart rate
Vas Flow SV Vas flow stroke volume Vas Flow SV (ml) = Vas Flow Vmean (cm/s) × Vas Area (cm)2 × 60 (s)
Vas Flow SI Vas flow SV index Vas Flow SI (No unit) = Vas Flow SV (ml) / Body Surface Area (m2)

Cardiac Measurements
6-36
Abbr. Description Operation or formula
Vas Flow CO Vas flow cardiac output Vas Flow CO (l/min) = Vas Flow SV (ml) × Vas Flow HR (bpm) /1000
Vas Flow CI Vas flow CO index Vas Flow CI (No unit) = Vas Flow CO (l/min) / Body Surface Area(m2)
III. Operating procedures
For the operation methods, please refer to the above tables.
6.4.3.21 LA Vol LA Vol (Left Atrium Volume) used to estimate the size of left atrium.
LA Vol(A-L) Estimates Left Atrium Volume using area and length.
I. Study Items
Tools Descriptions Operations
LA Diam Left Atrium Diameter Distance in 2D General Measurements
LAA(A2C) Left Atrium Area at apical 2-chamber view
Area in 2D General Measurements LAA(A4C) Left Atrium Area at apical
4-chamber view
II. Study Results
Except for values in upper table, the following results can be obtained in this study:
Tools Descriptions Formulae
LA Vol(A-L)
Left Atrium Area
III. Operating Procedures
See table above for methods and formulae of the measurement items.
LA Vol(Simp) Estimates the left atrium volume using Simpson method. Performed at apical two-chamber
view and apical four-chamber view.
I. Study Items and Results
Tools Descriptions Operations
LA Vol(A2C) Left Atrium Volume at apical 2-chamber view Same as Simpson SP measurement LA Vol(A2C) Left Atrium Volume at apical 4-chamber view
Diam(cm)LA )mLAA(A2C)(c)mLAA(A4C)(c3
8L)(ml)-Vol(ALA 22 ×=π

Cardiac Measurements
6-37
II. Operating Procedures
See “Simpson SP” for measurement procedures.
RA Vol(Simp) Estimates right atrium volume using Simpson methods, performed at apical four-chamber
view.
I. Study Items and Results
Tools Descriptions Operations
RA Vol(A4C) Right Atrium Volume at apical 4-chamber view Same as Simpson SP measurement
II. Operating Procedures
See “Simpson SP” for measurement procedures.
6.4.3.22 MVA(VTI) Calculate the Mitral Valve Area (MVA) by the velocity-time integral (VTI).
I. Study Items
Tools Descriptions Operations
LVOT Diam Left Ventricular Outflow Tract Diameter Distance in 2D General Measurements
LVOT VTI Left Ventricular Outflow Tract Velocity-Time Integral D trace in General D
measurements MV VTI Mitral Valve Velocity-Time Integral
II. Study Results
Except for values in upper table, the following results can be obtained in this study:
Tools Descriptions Formulae
MVA(VTI) Mitral Valve Area
III. Operating Procedures
See table above for methods and formulae of the measurement items.
6.4.3.23 AVA
AVA(VTI) Calculate the Aortic Valve Area (AVA) by velocity-time integral (VTI). Measurements should
be performed on 2D and Doppler image.
VTI(cm) MV4)Diam(cm LVOTVTI(cm) LVOT
)mMVA(VTI)(c22
2
×××
=π

Cardiac Measurements
6-38
I. Study Items
Tools Descriptions Operations
LVOT Diam Left Ventricular Outflow Tract Diameter Distance in 2D General Measurements
LVOT VTI Left Ventricular Outflow Tract Velocity-Time Integral D trace in General D measurements
AV VTI Aortic Valve Velocity-Time Integral
II. Study Results
Except for values in upper table, the following results can be obtained in this study:
Tools Descriptions Formulae
AVA(VTI) Aortic Valve Area
III. Operating Procedures
See table above for methods and formulae of the measurement items.
AVA(Vmax) Calculate the Aortic Valve Area (AVA) by Aorta Valve Maximum Velocity (AV Vmax).
Measurements should be performed on 2D and Doppler image.
I. Study Items
Tools Descriptions Operations
LVOT Diam Left Ventricular Outflow Tract Diameter Distance in 2D General Measurements
LVOT Vmax Left Ventricular Outflow Tract Velocity D trace in General D measurements
AV Vmax Aorta Valve Maximum Velocity
II. Study Results
Except for values in upper table, the following results can be obtained in this study:
Tools Descriptions Formulae
AVA(Vmax) Aortic Valve Area
III. Operating Procedures
See table above for methods and formulae of the measurement items.
Vmax(m/s) AV4)Diam(cm LVOTVmax(m/s) LVOT
)cmAVA(Vmax)(22
2
×××
=π
VTI(cm) AV4)Diam(cm LVOTVTI(cm) LVOT
)mAVA(VTI)(c22
2
×××
=π

Cardiac Measurements
6-39
6.4.3.24 Qp/Qs Flow ration of pulmonary circulation and systemic circulation.
I. Study Items
Tools Descriptions Operations
AV Diam Aorta Valve Diameter Distance in 2D General Measurements PV Diam Pulmonary Valve Diameter
AV VTI Aortic Valve Velocity-Time Integral D Trace in Doppler General Measurements PV VTI Pulmonary Valve Velocity-Time Integral
II. Study Results
Except for values in upper table, the following results can be obtained in this study:
Tools Descriptions Operations
AV HR Aortic Valve Heart Rate
Obtained from AV VTI measurement
AV SV Aortic Valve Stroke Volume
AV SI Aortic Valve SV index
AV CO Aortic Valve Cardiac Output
AV CI Aortic Valve CO index
PV HR Pulmonary Valve Heart Rate
Obtained from PV VTI measurement
PV SV Pulmonary Valve Stroke Volume
PV CO Pulmonary Valve Cardiac Output
PV SI Pulmonary Valve SV index
PV CI Pulmonary Valve CO index
Qp/Qs Flow ration of Pulmonary circulation and Systemic circulation
Qp/Qs(No unit) = PV CO(l/min)/AV CO(l/min)
Qp-Qs Flow difference of Pulmonary circulation and Systemic circulation
Qp-Qs(No unit) = PV CO(l/min) - AV CO(l/min)
III. Operating Procedures
See table above for methods and formulae of the measurement items.
6.4.3.25 PISA PISA (Proximal Isovelocity Surface Area) is used in quantitative analysis of the mitral valve
regurgitation (PISA MR), aortic valve regurgitation (PISA AR), tricuspid valve regurgitation
(PISA TR), and pulmonary valve regurgitation (PISA PR) in color mode.
The PISA measurement procedures are as follows:

Cardiac Measurements
6-40
1. Start PISA, move the semicircular caliper by rotating the trackball.
2. Fix the center of the semicircular by pressing [Set].
3. Adjust the radius length orientation of the semicircular by rotating the trackball.
4. Press [Set] to fix the caliper.
PISA MR Mitral valve regurgitation (PISA MR) needs to be measured in Color and Doppler mode.
I. Study Items
Tools Descriptions Operations
MR Rad Mitral Valve Stenosis Radius PISA measurement
MR VTI Mitral Valve Regurgitation Velocity-Time Integral
D Trace in Doppler General Measurements
II. Study Results
Tools Descriptions Formulae
MR Vmax Mitral Regurgitation Maximum Velocity Obtained from MR VTI measurement
MR Als.Vel
Mitral Valve Regurgitation Aliasing Maximum Velocity
MR Als.Vel(m/s)=(|max positive vel on color bar(m/s)|+|max negative vel on color bar(m/s|)/2
MR Flow Mitral Regurgitation Flow
MR Flow Rate
Mitral Regurgitation Flow Rate
MR Fraction
Mitral Valve Regurgitation Fraction
III. Operating Procedures
1. Enter color mode, adjust the color map until the aliasing appears.
2. Select [PISA MR] in the measurement menu.
3. Measure MR Rad using PISA caliper.
The MR Als.Vel is calculated.
4. Measure the MR spectrum by D trace to obtain:
MR Vmax
MR VTI
MR Flow and MR Flow Rate are calculated automatically.
If MV SV is measured, MR Fraction will be calculated automatically.
%100SV(ml) MV
Flow(ml) MR)MRF(Nounit ×=
/s)Als.Vel(cm MRRad(cm) MR2Rate(ml/s) Flow MR 2 ×= π
VTI(cm) MRmax(cm/s) MRV
/s)Als.Vel(cm MRRad(cm) MR2Flow(ml) MR2
××
=π

Cardiac Measurements
6-41
PISA AR Estimates aortic valve regurgitation using PISA.
See “PISA MR” for study items, results and measurement procedures.
PISA TR Estimates tricuspid valve regurgitation using PISA.
See “PISA MR” for study items, results and measurement procedures.
PISA PR Estimates pulmonary valve regurgitation using PISA.
See “PISA MR” for study items, results and measurement procedures.
6.5 Cardiac Exam Report During the measurements or after a measurement, press the [Report] key on the Control
Panel to browse the report. See “1.9 Report” for details on report browsing, printing and etc.
6.6 References Body Surface Area:
DuBois, D., DuBois, E.F., "A Formula to Estimate the Approximate Surface Area if
Height and Weight Be Known," Nutrition, Sept-Oct 1989, Vol. 5, No. 5, pp. 303-313.
EDV (S-P Ellipse):
Folland, E.D., et al., "Assessment of Left Ventricular Ejection Fraction and Volumes by
Real-Time, Two-Dimensional Echocardiography," Circulation, October 1979, Vol. 60,
No.4, pp. 760-766
ESV (S-P Ellipse):
Folland, E.D., et al., "Assessment of Left Ventricular Ejection Fraction and Volumes by
Real-Time, Two-Dimensional Echocardiography," Circulation, October 1979, Vol. 60,
No.4, pp. 760-766.
SV:
Gorge, G., et al., "High Resolution Two-dimensional Echocardiography Improves the
Quantification of Left Ventricular Function", Journal of the American Society of
Echocardiography, 1992, 5: 125-34.
Roelandt, Joseph, Practical Echocardiology, vol. 1 of Ultrasound in Medicine Series, ed.
Denis White, Research Studies Press, 1977, p. 124.

Cardiac Measurements
6-42
EF:
Pombo, J.F., "Left Ventricular Volumes and Ejection by Echocardiography," Circulation,
1971, Vol. 43, pp. 480-490.
SI:
Gorge, G., et al., "High Resolution Two-dimensional Echocardiography Improves the
Quantification of Left Ventricular Function", Journal of the American Society of
Echocardiography, 1992, 5: 125-34.
Roelandt, Joseph, Practical Echocardiology, vol. 1 of Ultrasound in Medicine Series, ed.
Denis White, Research Studies Press, 1977, p. 124.
CO:
Belenkie, Israel, et al., "Assessment of Left Ventricular Dimensions and Function by
Echocardiography," American Journal of Cardiology, June 1973, Vol. 31
CI:
The Merck Manual of Diagnosis and Therapy, ed. 15, Robert Berkon, ed., Merck and
Co., Rahway, NJ, 1987, p. 378.
Schiller, N.B., et al., “Recommendations for Quantification of the LV by Two-Dimensional
Echocardiography,” J Am Soc Echo, Sept.-Oct., 1989, Vol. 2, No. 5, p. 364.
EDV (B-P Ellipse):
Folland, E.D., et al., "Assessment of Left Ventricular Ejection Fraction and Volumes by
Real-Time, Two-Dimensional Echocardiography," Circulation, October 1979, Vol. 60,
No.4, pp. 760-766
ESV (B-P Ellipse):
Folland, E.D., et al., "Assessment of Left Ventricular Ejection Fraction and Volumes by
Real-Time, Two-Dimensional Echocardiography," Circulation, October 1979, Vol. 60,
No.4, pp. 760-766
EDV (Bullet):
Folland, E.D., et al., "Assessment of Left Ventricular Ejection Fraction and Volumes by
Real-Time, Two-Dimensional Echocardiography," Circulation, October 1979, Vol. 60,
No.4, pp. 760-766
ESV (Bullet):
Folland, E.D., et al., "Assessment of Left Ventricular Ejection Fraction and Volumes by
Real-Time, Two-Dimensional Echocardiography," Circulation, October 1979, Vol. 60,
No.4, pp. 760-766

Cardiac Measurements
6-43
EDV (Simpson):
Weyman, Arthur E., Cross-Sectional Echocardiography, Lea & Febiger, 1985, p.
295.Folland, E.D., et al., "Assessment of Left Ventricular Ejection Fraction and Volumes
by Real-Time, Two-Dimensional Echocardiography," Circulation, October 1979, Vol. 60,
No.4, pp. 760-766
ESV (Simpson):
Weyman, Arthur E., Cross-Sectional Echocardiography, Lea & Febiger, 1985, p.
295.Folland, E.D., et al., "Assessment of Left Ventricular Ejection Fraction and Volumes
by Real-Time, Two-Dimensional Echocardiography," Circulation, October 1979, Vol. 60,
No.4, pp. 760-766
EDV (Simpson SP):
Schiller, N.B., et al., "Recommendations for Quantification of the LV by Two-Dimensional
Echocardiography," Journal of the American Society of Echocardiography, Sept-Oct
1989, Vol.2, No. 5, p. 364
ESV (Simpson SP):
Schiller, N.B., et al., "Recommendations for Quantification of the LV by Two-Dimensional
Echocardiography," Journal of the American Society of Echocardiography, Sept-Oct
1989, Vol.2, No. 5, p. 364
EDV (Simpson BP):
Schiller, N.B., et al., "Recommendations for Quantification of the LV by Two-Dimensional
Echocardiography," Journal of the American Society of Echocardiography, Sept-Oct
1989, Vol. 2, No. 5, p. 364
ESV (Simpson BP):
Schiller, N.B., et al., "Recommendations for Quantification of the LV by Two-Dimensional
Echocardiography," Journal of the American Society of Echocardiography, Sept-Oct
1989, Vol. 2, No. 5, p. 364
EDV (Cube):
Dodge, H.T., Sandler, D.W., et al., "The Use of Biplane Angiography for the
Measurement of Left Ventricular Volume in Man," American Heart Journal, 1960, Vol. 60,
pp. 762-776.
Belenkie, Israel, et al., "Assessment of Left Ventricular Dimensions and Function by
Echocardiography," American Journal of Cardiology, June 1973, pg. 31.
ESV (Cube):

Cardiac Measurements
6-44
Dodge, H.T., Sandler, D.W., et al., "The Use of Biplane Angiography for the
Measurement of Left Ventricular Volume in Man," American Heart Journal, 1960, Vol. 60,
pp. 762-776.
Belenkie, Israel, et al., "Assessment of Left Ventricular Dimensions and Function by
Echocardiography," American Journal of Cardiology, June 1973, pg. 31.
FS:
Belenkie, Israel, et al., "Assessment of Left Ventricular Dimensions and Function by
Echocardiography," American Journal of Cardiology, June 1973, Vol. 31.
MVCF:
Colan, S.D., Borow, K.M., Neumann, A., “Left Ventricular End-Systolic Wall
Stress-Velocity of Fiber Shortening Relation: A Load-Independent Index of Myocardial
Contractility,” J Amer Coll Cardiol, October, 1984, Vol. 4, No. 4, pp. 715-724.
Snider, A.R., Serwer, G.A., Echocardiography in Pediatric Heart Disease, Year Book
Medical Publishers, Inc., Littleton, MA, 1990, p. 83.
Teichholz:
Teichholz, L.E., et al., "Problems in Echocardiographic Volume Determinations:
Echocardiographic-Angiographic Correlations in the Presence or Absence of Asynergy,"
American Journal of Cardiology, January 1976, Vol. 37, pp. 7-11
LVMW:
John H. Phillips, “Practical Quantitative Doppler Echocardiography”, CRC Press, 1991,
Page 96.
LV MASS-I:
John H. Phillips, “Practical Quantitative Doppler Echocardiography”, CRC Press, 1991,
Page 96.
LA/Ao:
Roelandt, Joseph, Practical Echocardiology, Ultrasound in Medicine Series, Vol. 1,
Denis White, ed., Research Studies Press, 1977, p. 270.
Schiller, N.B., et al., “Recommendations for Quantification of the LV by Two-Dimensional
Echocardiography,” J Am Soc Echo, Sept-Oct, 1989, Vol. 2, No. 5, p. 364.
MV CA/CE:
Maron, Barry J., et al., “Noninvasive Assessment of Left Ventricular Diastolic Function
by Pulsed Doppler Echocardiography in Patients with Hypertrophic Cardiomyopathy”, J
Am Coll Cardio, 1987, Vol. 10, pp. 733-742.

Cardiac Measurements
6-45
MV E/A:
Maron, Barry J., et al., "Noninvasive Assessment of Left Ventricular Diastolic Function
by Pulsed Doppler Echocardiography in Patients with Hypertrophic Cardiomyopathy,"
Journal of the American College of Cardiology, 1987, Vol. 10, pp. 733-742.
PHT:
Oh, J.K., Seward, J.B., Tajik, A.J. The Echo Manual. Boston: Little, Brown and Company,
1994, p.59-60
MVA:
Goldberg, Barry B., Kurtz, Alfred B., Atlas of Ultrasound Measurements, Year Book
Medical Publishers, Inc., 1990, p. 65.
Stamm, R. Brad, et al., “Quantification of Pressure Gradients Across Stenotic Valves by
Doppler Ultrasound,” J Am Coll Cardiol, 1983, Vol. 2, No. 4,pp. 707-718.
RVSP:
Stevenson, J.G., "Comparison of Several Noninvasive Methods for Estimation of
Pulmonary Artery Pressure," Journal of the American Society of Echocardiography,
June 1989, Vol. 2, pp. 157-171.
Yock, Paul G. and Popp, Richard L., "Noninvasive Estimation of Right Ventricular
Systolic Pressure by Doppler Ultrasound in Patients with Tricuspid Regurgitation,"
Circulation, 1984, Vol. 70, No. 4, pp. 657-662.

7-1
7 Gynecology Measurements
7.1 Gynecology Measurement Tools The system supports the following Gynecology measurement tools.
Mode Type Tool Description Method or formula
2D
Measure -ment
UT L Uterine Length
Same as Distance measurement of 2D General Measurements
UT H Uterine Height
UT W Uterine Width
Cervix W Uterine cervix width
Cervix L Uterine cervix length
Cervix H Uterine cervix height
Endo Endometrium Thickness
Ovary L Ovary length
Ovary H Ovary height
Ovary W Ovary width
Follicle1~16 L Follicle1~16 length
Follicle1~16 W Follicle1~16 width
Follicle1~16 H Follicle1~16 height
Calculate
Ovary Vol Ovary Volume
See below UT Vol UT Volume
Uterus Body /
UT-L/CX-L Ratio of UT-L to Cervix L
Study
Uterus Length, height and width
of uterus, endometrium thickness
Uterine Cervix Length, height and width of uterine cervix
Ovary Length, height and width of ovary
Follicle 1~16 Length, width, height and volume of follicle 1~16
M /
Doppler /
Measurement menus and reports can be preset. See the section “Measurement Preset” for

Gynecology Measurements
7-2
details.
7.2 Gynecology Exam Preparations Make the following preparations before performing gynecology exam:
Confirm that the current transducer is appropriate.
Check that the current date of the system is correct.
Register patient information in the [Patient Info] -> [GYN] dialog box. See the section
“Patient Information Input” in the Basic Volume for details.
Switch to the proper exam mode.
7.3 Entering Gynecology Measurements To enter the Genecology Measurements,
Press the [Measure] key to enter the Application Measurements. If the current menu is not
the one having Gynecology Measurement tools, move the cursor to the menu title and select
the package having Gynecology Measurement tools.
7.4 Gynecology Measurement Operations
7.4.1 Measurement Tool Operations
All Genecology measurement tools are operated same as Distance measurement of 2D
General Measurements.
The following takes UT L as an example. Operations of other measurement tools are similar.
1 Select [UT L] in the menu.
2 Use the method of Distance measurement of 2D General Measurements to measure uterine length.
7.4.2 Calculation Tool Operations
7.4.2.1 Ovary Vol
Function: measures Ovary L, Ovary H and Ovary W, calculates Ovary Vol.
1 Select [Ovary Vol] in the menu.
2 Use the method of Distance measurement of 2D General Measurements to measure Ovary L, Ovary H and Ovary W. The system calculates Ovary Vol.
7.4.2.2 UT Vol
Function: measures UT L, UT H and UT W, calculates UT Vol and Uterus Body.

Gynecology Measurements
7-3
1 Select [UT Vol] in the menu.
2 Use the method of Distance measurement of 2D General Measurements to measure UT L, UT H and UT W. The system calculates UT Vol and Uterus Body.
7.4.2.3 Uterus Body
Function: measures UT L, UT H and UT W, calculates UT Vol and Uterus Body.
Uterus Body (cm) = UT L (cm) + UT H (cm) + UT W (cm)
1 Select [Uterus Body] in the menu.
2 Use the method of Distance measurement of 2D General Measurements to measure UT L, UT H and UT W. The system calculates UT Vol and Uterus Body.
7.4.2.4 UT-L/CX-L
Function: measures UT L and Cervix L, calculates their ratio UT-L/CX-L.
UT-L/CX-L (No unit) = UT L (cm) / Cervix L (cm)
1 Select [UT-L/CX-L] in the menu.
2 Use the method of Distance measurement of 2D General Measurements to measure UT L and Cervix L. The system calculates UT-L/CX-L.
7.4.3 Study Tool Operations
7.4.3.1 Uterus
Function: measures UT L, UT H, UT W and Endo, calculates UT Vol, Uterine Body and
UT-L/CX-L.
1 Select [Uterus] in the menu.
2 Use the method of Distance measurement of 2D General Measurements to measure UT L, UT H, UT W and Endo. The system calculates UT Vol and Uterine Body. If Cervix L has been measured, the system also calculates UT-L/CX-L.
7.4.3.2 Uterine Cervix
Function: measures Cervix L, Cervix H and Cervix W, calculates UT-L/CX-L.
1 Select [Uterus Cervix] in the menu.
2 Use the method of Distance measurement of 2D General Measurements to measure Cervix L, Cervix H and Cervix W. If UT L has been measured, the system calculates UT-L/CX-L.
7.4.3.3 Ovary
Function: measures Ovary L, Ovary H and Ovary W, calculates Ovary Vol.
1 Select [Ovary] in the menu.
2 Use the method of Distance measurement of 2D General Measurements to measure Ovary L, Ovary H and Ovary W. The system calculates Ovary Vol.

Gynecology Measurements
7-4
7.4.3.4 Follicle
Function: Measures the length, width and height of follicle using method Distance and
calculates the follicle volume.
Up to 16 follicles can be measured. Specify the serial numbers of the follicles before
measuring a follicle.
Hint: needs to measure Left or Right side respectively.
The following takes Follicle1 as an example. Operations of other follicles are similar.
1 Select [Follicle1] in the menu.
2 Use the method of Distance measurement of 2D General Measurements to measure Follicle1 L, Follicle1 W and Follicle1 H
The system automatically calculates volume of Follicle1.
Follicle X Diam (Average)=(Follicle X L+Follicle X W + Follicle X H)/3
Follicle X Vol(cm3) = 0.523 x Follicle X L(cm) x Follicle X W(cm) x Follicle X H(cm)
Where, X=1, 2, 3, …16.
7.5 Gynecology Exam Report During the measurements or after a measurement, press the [Report] key on the Control
Panel to browse the report. See “1.9 Report” for details on report browsing, printing and etc.
7.6 References Uterus Body:
Feng Kui, Sun Yanling, Li Hezhou. Ultrasonic diagnosis of adenomyosis. Journal of
Henan Medical University, 1995; 30 (2).
UT-L/CX-L:
Ji Jindi, et al. Ultrasonographic study of the intersex problems and the internal genitalia
abnormalities. Journal of China medical ultrasound. 1996, Volume 12, No8 P40.

8-1
8 Vascular Measurements
8.1 Vascular Measurement Tools Vascular Measurements measures vascular of carotid, upper and lower extremities, and
cerebral vascular.
The system supports the following Vascular Measurement tools.
Mode Type Tool Description Method or formula
2D
Measure
-ment
Vas Diam Vascular diameter Same as Distance measurement of 2D general Measurements
Vas Area Vascular area Same as Area measurement of 2D general Measurements
Normal(D) Vessel diameter Same as Distance measurement of 2D general Measurements
Resid(D) Residual diameter
Normal(A) Vessel area Same as Area measurement of 2D general Measurements Resid(A) Residual area
CCA IMT Common Carotid Artery IMT
ROI measurement in IMT Bulb IMT Bulbillate IMT
ICA IMT Internal Carotid Artery IMT
ECA IMT External Carotid Artery IMT
Calculate
Stenosis D Stenosis diameter Stenosis D (No unit) = (Normo Diam(cm) – Resid Diam (cm)) / Normo Diam (cm) × 100%
Stenosis A Stenosis area Stenosis A (No unit) = (Normo Area(cm2) – Resid Area (cm2)) / Normo Area (cm2) × 100%
Vol Flow(Diam)-TAMAX
Volume flow diameter
Vol Flow(Diam) (ml/min) = |Vas TAMAX (cm/s)| × (π × Vas Diam (cm)2 / 4) × 60 (s)
Vas TAMAX - Time Averaged Maximum Velocity, obtained
Vascular Measurements
8-2
Mode Type Tool Description Method or formula
from Vas Trace measurement.
Vol Flow(Area)-TAMAX
Volume flow area Vol Flow(Area) (ml/min) = |Vas TAMAX (cm/s)| × Vas Area (cm2) × 60 (s)
Vas TAMAX: Time Averaged Maximum Velocity, obtained from Vas Trace measurement.
Study
Volume Flow / See below
Stenosis /
IMT /
M /
Doppler Measure
-ment
Soleal V
Same as D Trace of Doppler General Measurements
Sural V
Ulnar A Ulnar artery
Ulnar V Ulnar vein
ACA Anterior cerebral artery
PCA Posterior cerebral artery
MCA Middle cerebral artery
Saph V Great saphenous vein
Bulb /
Peroneal A Peroneal artery
Peroneal V Peroneal vein
Brachial A Brachial artery
Brachial V Brachial vein
Femoral V Femoral vein
SFA Superficial femoral artery
SFV Superficial femoral vein
PFA Deep femoral artery
PFV Deep femoral vein
CFA Common femoral artery
CFV Common femoral

Vascular Measurements
8-3
Mode Type Tool Description Method or formula
vein
Basilic V Basilic vein
Pop A Popliteal artery
Pop V Popliteal vein
AComA Ant. Communicating br.
Same as D Trace of Doppler General Measurements
BA Basilar artery
Ba V Basilar vein
CCA Common carotid artery
ICA Internal carotid artery
ECA External carotid artery
TP Trunk A Tibial peroneal trunk artery
TP Trunk V Tibial peroneal trunk vein
P.Tib A Posterior tibial artery
P.Tib V Posterior tibial vein
A.Tib A Anterior tibial artery
A.Tib V Anterior tibial vein
IIA Internal iliac artery
IIV Internal iliac vein
Ex.Iliac A External iliac artery
Ex.Iliac V External iliac vein
C.Iliac A Common iliac artery
C.Iliac V Common iliac vein
PComA Post. Communicating br.
Radial A Radial artery
Radial V Radial vein
Subclav A Subclavian artery
Subclav V Subclavian vein
Cephalic V Cephalic vein
Innom A Innominate artery
SSV Small saphenous vein
Vas Trace Volume flow velocity

Vascular Measurements
8-4
Mode Type Tool Description Method or formula
trace
Axill A Axillary artery
Axill V Axillary vein
Vert A Vertebral artery
Dors.Ped A Dorsalis pedis artery
Calculate /
Study Volume Flow See below
Measurement menus and reports can be preset. See the section “Measurement Preset” for
details.
8.2 Vascular Exam Preparations Make the following preparations before performing Vascular exam:
Confirm that the current transducer is appropriate.
Check that the current date of the system is correct.
Register patient information in the [Patient Info] -> [VAS] dialog box. See the section
“Patient Information Input” in the Basic Volume for details.
Switch to the proper exam mode.
8.3 Entering Vascular Measurements To enter the Vascular Measurements,
Press the [Measure] key to enter the Application Measurements. If the current menu is not
the one having Vascular Measurement tools, move the cursor to the menu title and select
the package having Vascular Measurement tools.
8.4 Vascular Measurement Operations Table in 8.1 Vascular Measurement Tools describes operations of Vascular Measurement
tools.
8.4.1 Measurement Tool Operations
1 Select a measurement tool in the menu.
2 Refer to the methods listed in the table above to complete the measurement.

Vascular Measurements
8-5
8.4.2 Calculation Tool Operations
8.4.2.1 Stenosis D
Function: measures Normo Diam and Resid Diam, calculates Stenosis D.
1 Select [Stenosis D] in the menu.
2 Use the method of Distance measurement of 2D General Measurements to measure Normo Diam and Resid Diam. The system calculates Stenosis D.
8.4.2.2 Stenosis A
Function: measures Normo Area and Resid Area, calculates Stenosis A.
1 Select [Stenosis A] in the menu.
2 Use the method of Area measurement of 2D General Measurements to measure Normo Area and Resid Area. The system calculates Stenosis A.
8.4.2.3 Vol Flow (Diam)-TAMAX
Function: measures Vas Trace and Vas Diam, calculates Vol Flow(Diam)-TAMAX.
1 Select [Vol Flow(Diam)-TAMAX] in the menu.
2 Use the method of D Trace of Doppler General Measurements to measure Vas Trace.
3 Use the method of Distance measurement of 2D General Measurements to measure Vas Diam. The system calculates Vol Flow(Diam)-TAMAX.
8.4.2.4 Vol Flow (Area)-TAMAX
Function: measures Vas Trace and Vas Area, calculates Vol Flow(Area)-TAMAX.
1 Select [Vol Flow(Area)-TAMAX] in the menu.
2 Use the method of D Trace of Doppler General Measurements to measure Vas Trace.
3 Use the method of Area measurement of 2D General Measurements to measure Vas Area. The system calculates Vol Flow(Area)-TAMAX.
8.4.3 Study Tool Operations
8.4.3.1 Volume Flow
Function: measures blood flow through some vascular cross section per unit time.
1 Select [Volume Flow] in the menu.
2 Use the method of D Trace of Doppler General Measurements to measure Vas Trace.
3 Use the method of Distance measurement of 2D General Measurements to measure Vas Diam. The system calculates Vol Flow(Diam)-TAMAX.
4 Use the method of Area measurement of 2D General Measurements to measure Vas Area. The system calculates Vol Flow(Area)-TAMAX.
8.4.3.2 Stenosis
Function: measures and calculates stenosis diameter and stenosis area.

Vascular Measurements
8-6
1 Select [Stenosis] in the menu.
2 Use the method of Distance measurement of 2D General Measurements to measure Normo Diam and Resid Diam. The system calculates Stenosis D.
3 Use the method of Area measurement of 2D General Measurements to measure Normo Area and Resid Area. The system calculates Stenosis A.
8.4.3.3 IMT NOTE: 1. The IMT function is not available in the product sold in U.S.A and Canada or
the product not configured with IMT. 2. IMT measurement is available on frozen (or history) linear array image only.
Function: IMT (Intima-Media Thickness) measures the distance between LI (Lumen-Intima) and MA (Media-Adventia).
The IMT values at 4 positions: CCA (common Carotid Artery), ICA (Internal Carotid Artery), ECA (External Carotid Artery) and Bulb (Bulbillate) need to be measured here.
1. Enter IMT exam mode, scan and freeze the image (or review a history image).
2. Select [IMT] in the measurement menu and enters the IMT measurement.
3. Select the side (Left/ Right), angle and vessel wall (Near/ Far).
4. Select an item such as [ICC IMT], the ROI box displays on screen.
It appears as when Near is selected;
It appears as when Far is selected;
Tips: Make sure that you select the right vessel wall (Near/ Far) before IMT measurement; otherwise the intima may be recognized incorrectly due to different algorithm that applied in near/ far wall recognition.
5. Move ROI box to the desired position, press [Set]. Two auto trace lines appear in
the box.
The ROI box is green while you can:
Adjust the size of the ROI box. Erase the trace lines inside the box by pressing [Clear]. (Long press [Clear]: to clear
all measurement calipers on the screen.) Trace manually
a) Move the cursor to a trace line. The trace line turns yellow. Press [Set].
b) Move the cursor along the interface of vessel. Press [Set] to confirm the trace after re-adjusting.
6. Press [Set] outside the box to confirm the adjustment result after the manual-trace
is completed. The results are recorded in IMT report.
The system calculates:
IMT Max IMT Min IMT Mean

Vascular Measurements
8-7
IMT SD IMT ROI Length IMT Measure Length IMT Quality Index
Quality Index indicates the reliability of one measurement, the manual trace or re-scan an image with clear endocardium edges are recommended if the Quality Index value is small.
Tips: To achieve a good tracing result, try to place the ROI box parallel with vessel and adjust the box size to reduce unwanted interferences.
For multiple measurements in the same side, vessel and angle, the system calculates the following parameters in report:
Average Mean IMT Average Max IMT Standard deviation
Also it provides Composite Mean IMT, which is an overall mean value of all IMT mean values derived from the measured items.
8.5 Vascular Exam Report During the measurements or after a measurement, press the [Report] key on the Control
Panel to browse the report. See “1.9 Report” for details on report browsing, printing and etc.
An IMT report is applied to record results in IMT measurements, where selecting the patient
conditions (smoker or not, diabetic or not etc.) and modifying the result data are available.
8.6 References Vol Flow(Diam)-TAMAX:
Burns, P.N., "The Physical Principles of Doppler and Spectral Analysis," Journal of
Clinical Ultrasound, November/December 1987, 15(9): 587.
Vol Flow(Area)-TAMAX:
Burns, P.N., "The Physical Principles of Doppler and Spectral Analysis," Journal of
Clinical Ultrasound, November/December 1987, 15(9): 587.
Stenosis D:
Honda, Nobuo, et al., "Echo-Doppler Velocimeter in the Diagnosis of Hypertensive
Patients: The Renal Artery Doppler Technique," Ultrasound in Medicine and Biology,
1986, Vol. 12(12), pp. 945-952.
Stenosis A:
Jacobs, Norman M.,et al., "Duplex Carotid Sonography: Criteria for Stenosis, Accuracy,
and Pitfalls," Radiology, 1985, 154: 385-391.

9-1
9 Small Parts Measurements
9.1 Small Parts Measurement Tools The system supports the following Small Parts Measurement tools.
Mode Type Tool Description Method
2D
Measure
-ment
Thyroid L Thyroid length
Same as Distance Measurement of 2D General Measurements
Thyroid H Thyroid height
Thyroid W Thyroid width
Isthmus H Isthmus height
Testis L Testicular length
Testis H Testicular height
Testis W Testicular width
Mass1 D1 Mass1 Distance1
Mass 1 D2 Mass 1 Distance 2
Mass 1 D3 Mass 1 Distance 3
Mass 2 D1 Mass 2 Distance 1
Mass 2 D2 Mass 2 Distance 2
Mass 2 D3 Mass 2 Distance 3
Mass 3 D1 Mass 3 Distance 1
Mass 3 D2 Mass 3 Distance 2
Mass 3 D3 Mass 3 Distance 3
Calculate Thyroid Vol Thyroid volume See below
Study
Thyroid Thyroid
See below
Testis Testis
Mass1 Mass1
Mass2 Mass2
Mass3 Mass3
M /
Doppler Measure
-ment
STA Superior thyroid artery Same as D Trace of Doppler General Measurements ITA Inferior thyroid artery

Small Parts Measurements
9-2
Calculate /
Study /
Measurement menus and reports can be preset. See the section “Measurement Preset” for
details.
9.2 Small Parts Exam Preparations Make the following preparations before performing small parts exam:
Confirm that the current transducer is appropriate.
Check that the current date of the system is correct.
Register patient information in the [Patient Info] -> [SMP] dialog box. See the section
“Patient Information Input” in the Basic Volume for details.
Switch to the proper exam mode.
9.3 Entering Small Parts Measurements To enter the Small Parts Measurement menu,
Press the [Measure] key to enter the Application Measurements. If the current menu is not
the one having Small Parts Measurement tools, move the cursor to the menu title and select
the package having Small Parts Measurement tools.
9.4 Small Parts Measurement Operations
9.4.1 Measurement Tool Operations
The operations of Thyroid L, Thyroid H, Thyroid W and APAD are the same as Distance
measurement of 2D General Measurements.
The STA and ITA are the same as D Trace of Doppler General Measurements.
The following takes Thyroid L as an example. Operations of other tools are similar.
1 Select [Thyroid L] in the menu.
2 Use the method of Distance measurement of 2D General Measurements to measure Thyroid L.
9.4.2 Calculation Tool Operations
Thyroid Vol
Function: measures Thyroid L, Thyroid H and Thyroid W, calculates Thyroid Vol.
Thyroid Vol (cm3) = k × Thyroid L (cm) × Thyroid H (cm) × Thyroid W (cm)
Small Parts Measurements
9-3
Wherein, k= 0.479 or 0.523
1 Select [Thyroid Vol] in the menu.
2 Use the method of Distance measurement of 2D General Measurements to measure Thyroid L, Thyroid H and Thyroid W. The system calculates Thyroid Vol.
9.4.3 Study Tool Operations
9.4.3.1 Thyroid
Function: measures Thyroid L, Thyroid H and Thyroid W, calculates Thyroid Vol.
1 Select [Thyroid] in the menu.
2 Use the method of Distance measurement of 2D General Measurements to measure Thyroid L, Thyroid H and Thyroid W. The system calculates Thyroid Vol.
9.4.3.2 Mass
Function: measures 3 distances of a mass, and calculates the mass volume.
Note: the system supports measuring 3 masses.
Use mass1 for an example:
1 Select [Mass1] in the menu.
2 Use the method of Distance measurement of 2D General Measurements to measure Mass1 D1, Mass1 D2, Mass1 D3. The system calculates mass1 volume.
9.4.3.3 Testis
See “10.4.3.6 Testis”.
9.5 Small Parts Exam Report During the measurements or after a measurement, press the [Report] key on the Control
Panel to browse the report. See “1.9 Report” for details on report browsing, printing and etc.
9.6 Reference Thyroid Vol: (k= 0.479)
Volumetrie der Schilddruesenlappn mittels Realtime-Sonographie; J Brunn, U. Block, G. Ruf, et al.; Dtsch.med. Wschr.106 (1981), 1338-1340.)
Thyroid Vol: (k=0.523)
Gomez JM, Gomea N, et al. Determinants of thyroid volume as measured by ultrasonography in healthy adults randomly selected. Clin Endocrinol(Oxf), 2000;53:629-634)
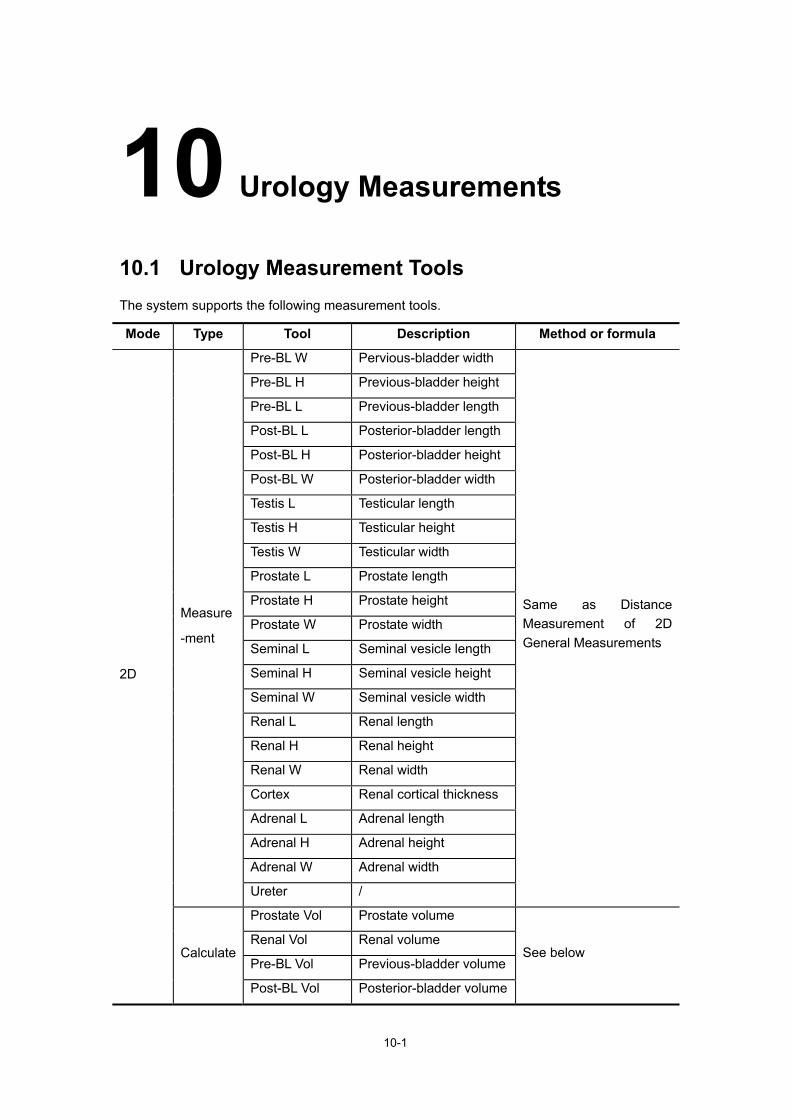
10-1
10 Urology Measurements
10.1 Urology Measurement Tools The system supports the following measurement tools.
Mode Type Tool Description Method or formula
2D
Measure
-ment
Pre-BL W Pervious-bladder width
Same as Distance Measurement of 2D General Measurements
Pre-BL H Previous-bladder height
Pre-BL L Previous-bladder length
Post-BL L Posterior-bladder length
Post-BL H Posterior-bladder height
Post-BL W Posterior-bladder width
Testis L Testicular length
Testis H Testicular height
Testis W Testicular width
Prostate L Prostate length
Prostate H Prostate height
Prostate W Prostate width
Seminal L Seminal vesicle length
Seminal H Seminal vesicle height
Seminal W Seminal vesicle width
Renal L Renal length
Renal H Renal height
Renal W Renal width
Cortex Renal cortical thickness
Adrenal L Adrenal length
Adrenal H Adrenal height
Adrenal W Adrenal width
Ureter /
Calculate
Prostate Vol Prostate volume
See below Renal Vol Renal volume
Pre-BL Vol Previous-bladder volume
Post-BL Vol Posterior-bladder volume
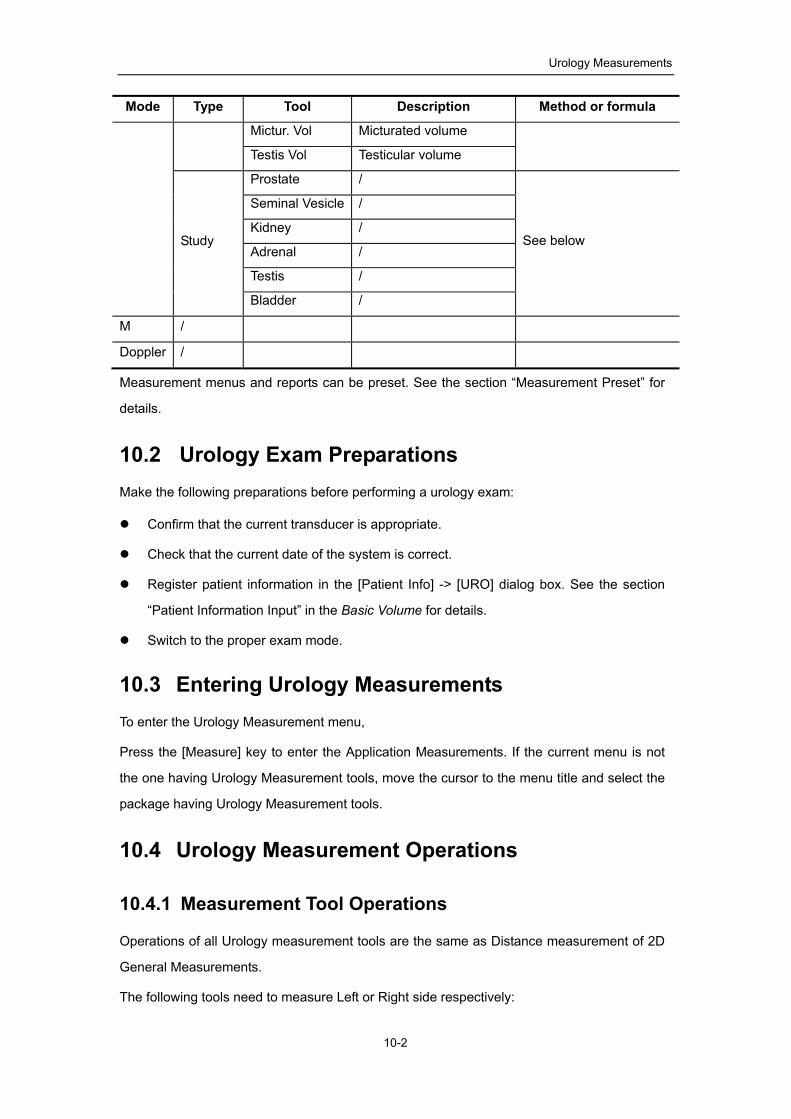
Urology Measurements
10-2
Mode Type Tool Description Method or formula
Mictur. Vol Micturated volume
Testis Vol Testicular volume
Study
Prostate /
See below
Seminal Vesicle /
Kidney /
Adrenal /
Testis /
Bladder /
M /
Doppler /
Measurement menus and reports can be preset. See the section “Measurement Preset” for
details.
10.2 Urology Exam Preparations Make the following preparations before performing a urology exam:
Confirm that the current transducer is appropriate.
Check that the current date of the system is correct.
Register patient information in the [Patient Info] -> [URO] dialog box. See the section
“Patient Information Input” in the Basic Volume for details.
Switch to the proper exam mode.
10.3 Entering Urology Measurements To enter the Urology Measurement menu,
Press the [Measure] key to enter the Application Measurements. If the current menu is not
the one having Urology Measurement tools, move the cursor to the menu title and select the
package having Urology Measurement tools.
10.4 Urology Measurement Operations
10.4.1 Measurement Tool Operations
Operations of all Urology measurement tools are the same as Distance measurement of 2D
General Measurements.
The following tools need to measure Left or Right side respectively:

Urology Measurements
10-3
Seminal L
Seminal H
Seminal W
Renal L
Renal H
Renal W
Cortex
Adrenal L
Adrenal H
Adrenal W
Testis L
Testis H
Testis W
Ureter
The following takes Prostate L as an example. Operations of other tools are similar.
1 Select [Prostate L] in the menu.
2 Use the method of Distance measurement of 2D General Measurements to measure Prostate L.
10.4.2 Calculation Tool Operations
10.4.2.1 Prostate Vol
Function: measures Prostate L, Prostate H and Prostate W, calculates Prostate Vol and
PPSA. If [Serum PSA] in [Patient Info] -> [URO] has been input, PSAD (Prostate
Special Antigen Density) will also be calculated.
PPSA (ng/ml) = PPSA Coefficient (ng/ml2) × Prostate Vol (ml)
PSAD (ng/ml2) = Serum PSA (ng/ml) / Prostate Vol (ml)
Where, PPSA Coefficient and Serum PSA are input in [Patient Info] -> [URO]
dialog box. The default value of PPSA Coefficient is 0.12.
1 Select [Prostate Vol] in the menu.
2 Use the method of Distance measurement of 2D General Measurements to measure Prostate L, Prostate H and Prostate W. The system calculates Prostate Vol and PPSA. If Serum PSA value has input, the system also calculates PSAD.
10.4.2.2 Renal Vol
Function: measures Renal L, Renal H and Renal W, calculates Renal Vol.
1 Select [Renal Vol] in the menu.

Urology Measurements
10-4
2 Use the method of Distance measurement of 2D General Measurements to measure Renal L, Renal H and Renal W. The system calculates Renal Vol.
10.4.2.3 Pre-BL Vol
Function: measures Pre-BL L, Pre-BL H and Pre-BL W, calculates Pre-BL Vol.
1 Select [Pre-BL Vol] in the menu.
2 Use the method of Distance measurement of 2D General Measurements to measure Pre-BL L, Pre-BL H and Pre-BL W. The system calculates Pre-BL Vol. If Post-BL Vol has been obtained, the system also calculates Mictur. Vol.
10.4.2.4 Post-BL Vol
Function: measures Post-BL L, Post-BL H and Post-BL W, calculates Post-BL Vol.
1 Select [Post-BL Vol] in the menu.
2 Use the method of Distance measurement of 2D General Measurements to measure Post-BL L, Post-BL H and Post-BL W. The system calculates Post-BL Vol. If Pre-BL Vol has been obtained, the system also calculates Mictur. Vol.
10.4.2.5 Mictur. Vol
Function: measures Pre-BL Vol and Post-BL Vol, calculates Mictur. Vol.
1 Select [Mictur. Vol] in the menu.
2 Use the method of Distance measurement of 2D General Measurements to measure Pre-BL L, Pre-BL H and Pre-BL W. The system calculates Pre-BL Vol.
3 Use the method of Distance measurement of 2D General Measurements to measure Post-BL L, Post-BL H and Post-BL W. The system calculates Post-BL Vol and Mictur. Vol.
10.4.2.6 Testis Vol
Function: measures Testis L, Testis H and Testis W, calculates Testis Vol..
1 Select [Testis Vol] in the menu.
2 Use the method of Distance measurement of 2D General Measurements to measure Testis L, Testis H and Testis W. The system calculates Testis Vol.
10.4.3 Study Tool Operations
10.4.3.1 Prostate
Function: measures Prostate L, Prostate H and Prostate W, calculates Prostate Vol and
PPSA. If [Serum PSA] in [Patient Info] -> [URO] has been input, PSAD (Prostate
Special Antigen Density) will also be calculated.
PPSA (ng/ml) = PPSA Coefficient (ng/ml2) × Prostate Vol (ml)
PSAD (ng/ml2) = Serum PSA (ng/ml) / Prostate Vol (ml)
Where, PPSA Coefficient and Serum PSA are input in [Patient Info] -> [URO]
dialog box. The default value of PPSA Coefficient is 0.12.

Urology Measurements
10-5
1 Select [Prostate] in the menu.
2 Use the method of Distance measurement of 2D General Measurements to measure Prostate L, Prostate H and Prostate W. The system calculates Prostate Vol and PPSA. If Serum PSA value has input, the system also calculates PSAD.
10.4.3.2 Seminal Vesicle
Function: measures Seminal L, Seminal H and Seminal W.
1 Select [Seminal Vesicle] in the menu.
2 Use the method of Distance measurement of 2D General Measurements to measure Seminal L, Seminal H and Seminal W.
10.4.3.3 Kidney
Function: measures Renal L, Renal H, Renal W and Cortex, calculates Renal Vol.
1 Select [Kidney] in the menu.
2 Use the method of Distance measurement of 2D General Measurements to measure Renal L, Renal H and Renal W. The system calculates Renal Vol.
3 Use the method of Distance measurement of 2D General Measurements to measure Cortex.
10.4.3.4 Adrenal
Function: measures Adrenal L, Adrenal H and Adrenal W.
1 Select [Adrenal] in the menu.
2 Use the method of Distance measurement of 2D General Measurements to measure Adrenal L, Adrenal H and Adrenal W.
10.4.3.5 Bladder
Function: measures Pre-BL L, Pre-BL H, Pre-BL W, Post-BL L, Post-BL H and Post-BL W,
calculates Pre-BL Vol, Post-BL Vol and Mictur. Vol.
1 Select [Bladder] in the menu.
2 Use the method of Distance measurement of 2D General Measurements to measure Pre-BL L, Pre-BL H and Pre-BL W. The system calculates Pre-BL Vol.
3 Use the method of Distance measurement of 2D General Measurements to measure Post-BL L, Post-BL H and Post-BL W. The system calculates Post-BL Vol and Mictur. Vol.
10.4.3.6 Testis
Function: measures Testis L, Testis H and Testis W, calculates Testis Vol.
1 Select [Testis] in the menu.
2 Use the method of Distance measurement of 2D General Measurements to measure Testis L, Testis H and Testis W. The system calculates Testis Vol.
10.5 Urology Exam Report During the measurements or after a measurement, press the [Report] key on the Control

Urology Measurements
10-6
Panel to browse the report. See “1.9 Report” for details on report browsing, printing and etc.
10.6 References PPSA:
Peter J. Littrup MD, Fed LeE. MD, Curtis Mettin. PD. Prostate Cancer Screening:
Current Trends and Future Implications. CA-A CANCER JOURNAL FOR CLINICIANS,
Jul/Aug 1992, Vol.42, No.4.
PSAD:
MITCHELL C. BENSON, IHN SEONG, CARL A. OLSSON, J, McMahon, WILLIAM
H.COONER. The Use of Prostate Specific Antigen Density to Enhance the Predictive
Value of the Intermediate Levels of Serum Prostate Specific Antigen. THE JOURNAL
OF UROLOGY, 1992, Vol.147, p817-821

11-1
11 Orthopedics Measurements
HIP (Hip Joint Angle) measurement is used in pediatric orthopedics. Such measurement provides early diagnosis for infant hip joint dislocation. In clinical applications, dislocation type can be estimated based on the age and joint angle of the infant.
DC-3T has no Orthopedics measurements.
11.1 Orthopedics Measurement Tools Measurement menus and reports can be preset. See the section “Measurement Preset” for
details.
HIP
The HIP calculation assists in assessing the development of the infant hip. In this calculation,
three straight lines are superimposed on the image and aligned with the anatomical features.
The two angles are computed and displayed.
The three lines are:
The baseline (BL), connecting the osseous acetabular convexity to the point where the
joint capsule and the perichondrium unite with the ilium.
The roof line (RL), connecting the lower edge of the ilium to the osseous acetabular
convexity.
The inclination line (IL), connecting the osseous acetabular convexity to the labrum
acetabulare.
The two angles are:
α: the angle between BL and RL
β: the angle between BL and IL
α
β
BL
RL
IL

Orthopedics Measurements
11-2
Dislocation type can be determined through Graf method, as described in the following table.
DISLOCATION TYPE
CRITERIA RESULT
α β Patient
I α≥60° β<77° All ages I
II 50°≤α≤59° Younger than three months of age
IIa
50°≤α≤59° β<55° Three months of age or older than three months
IIb
43°≤α≤49° β≤77° All ages IIc
43°≤α≤49° β>77° All ages IId
III α<43° β>77° All ages III
IV Quantitative angle measurement cannot be performed.
All ages ?????
Others Others All ages ?????
11.2 Orthopedics Exam Preparations Make the following preparations before performing an Orthopedics exam:
Confirm that the current transducer is appropriate.
Check that the current date of the system is correct.
Register patient information in the [Patient Info] -> [PED] dialog box. See the section
“Patient Information Input” in the Basic Volume for details.
Switch to the proper exam mode.
11.3 Entering Orthopedics Measurements To enter the Orthopedics Measurement menu,
Press the [Measure] key to enter the Application Measurements. If the current menu is not
the one having Orthopedics Measurement tools, move the cursor to the menu title and select
the package having Orthopedics Measurement tools.
11.4 HIP Measurement Operations NOTE: Need to be measured in left and right side respectively.

Orthopedics Measurements
11-3
1 Select [HIP] in the [Orthopedics] menu and then press the [Set] key to enter measurement.
2 A line appears. Use the trackball to move the line to the position of the hip joint. Then rotate the Multifunctional Knob to fix the baseline and press the [Set] key.
3 A second line appears immediately. Use the method for adjusting the first line to anchor the RL. Press the [Set] key to fix the RL.
4 Use the same method to fix the third line IL. The angles of α and β also come out. If patient age is entered, dislocation type is also displayed.
11.5 Orthopedics Exam Report During the measurements or after a measurement, press the [Report] key on the Control
Panel to browse the report. See “1.9 Report” for details on report browsing, printing and etc.
11.6 References Graf R., “Sonographic diagnosis of hip dysplasia. Principles, sources of error and
consequences” Ultraschall Med. 1987 Feb;8(1):2-8.
Schuler P., “Principles of sonographic examination of the hip” Ultraschall Med. 1987
Feb;8(1):9-13.
Graf, R. “Fundamentals of Sonographic Diagnosis of Infant Hop Dysplasia.” Journal
Pediatric Orthopedics, Vol. 4, No. 6:735-740,1984.
Graf, R. Guide to Sonography of the Infant Hip. Georg Thieme Verlag, Stuttgart and New
York, 1987.
Morin, C., Harcke, H., MacEwen, G. “The Infant Hip: Real-Time US Assessment of
Acetabular Development.” Radiology, 177:673-677, December 1985.

P/N: 046-000625-01 (V2.0)