Embed Size (px)
Citation preview

DBS Group Holdings Ltd Annual Report 2016
ReimagineBankingWorld’s Best Digital Bank
Living, Breathing Asia

About us
DBS is a leading financial services group in Asia, with over 280 branches across 18 markets. Headquartered and listed in Singapore, we have a growing presence in the three key Asian axes of growth: Greater China, Southeast Asia and South Asia. Our “AA-” and “Aa1” credit ratings are among the highest in the world. We have also been recognised for our leadership in the region, having been named “Asia’s Best Bank” by several publications including The Banker, Global Finance, IFR Asia and Euromoney since 2012.
In addition, we have been named “Safest Bank in Asia” by Global Finance for eight consecutive years from 2009 to 2016.
Reimagine BankingWorld’s BestDigital Bank
What makes DBS the World’s Best Digital Bank?
It starts with reimagining banking.
From Singapore’s favourite mobile wallet to India’s first paperless, branchless, signatureless mobile-only bank. A first-in-its-class social network for SMEs to hackathons across Asia and fintech internships in DBS.
These are just some of the reasons we have been recognised as the World’s Best Digital Bank.
Our digital transformation pervades every part of the bank. We are driven by one relentless purpose, which is to live and breathe innovation to Make Banking Joyful.
View our report onlineOur Annual Report, accounts and other information about DBS can be found at www.dbs.com
About this report
The Board is responsible for the preparation of this Annual Report. It is prepared in accordance with the following regulations, frameworks and guidelines: • The Banking (Corporate Governance)
Regulations 2005, and all material aspects of the Guidelines on Corporate Governance for Financial Holding Companies, Banks, Direct Insurers, Reinsurers and Captive Insurers issued on 3 April 2013 by the Monetary Authority of Singapore.
• The International Integrated Reporting <IR> Framework issued in December 2014.
• The Global Reporting Initiative (GRI) G4 Sustainability Reporting Guidelines issued in May 2013. This positions us well to meet the Singapore Exchange sustainability reporting requirements as well as The Association of Banks in Singapore Guidelines on Responsible Financing that will take effect in 2017.
• The Enhanced Disclosure Task Force
recommendations to enhance banks’ risk disclosures issued in October 2012. We have implemented most of the recommendations, including those pertaining to expected credit loss approaches issued in November 2015.

| 1
2 Who we are 4 Board of Directors6 Group Management Committee8 Letter from the Chairman and CEO12 World’s Best Digital Bank20 CEO reflections
Overview
This section provides information on who we are and our leadership team. It also contains messages from the Chairman and CEO.
22 How we create value – our business model24 How we use our resources27 How we distribute value created28 Material matters30 What our stakeholders are telling us
32 CFO statement38 Our 2016 priorities42 Institutional Banking44 Consumer Banking/Wealth Management
Business Model
This section discusses our business model and provides details on how we use our resources and distribute value to our stakeholders.
Performance
This section provides information on our financials, 2016 priorities and performance by customer segments.
48 Corporate governance 64 Remuneration report 70 Summary of disclosures74 CRO statement77 Risk management103 Capital management and planning108 Sustainability
Governance and Risk Management
This section details our commitment to sound and effective governance, risk management and sustainability.
Financial Reports120 Financial statements183 Directors’ statement187 Independent auditor’s report193 Five-year summary
Annexure194 Further information on Board of Directors199 Further information on Group Management Committee201 Main subsidiaries and associated companies202 International banking offices204 Awards and accolades won
Shareholder Information206 Share price207 Financial calendar208 Shareholding statistics210 Notice of Annual General Meeting Proxy form

2 | DBS Annual Report 2016
Who we are
DBS is a commercial bank headquartered and listed in Singapore. As one of Asia’s leading banks, we understand the intricacies of the region’s markets, and provide a full range of services in consumer banking, wealth management and institutional banking. To continue staying at the forefront of the industry, we are reimagining banking, using digital technology and innovation to extend our reach, enhance our efficiencies and create tomorrow’s solutions. We are proud to be recognised not only as Asia’s Safest and Best Bank, but also World’s Best Digital Bank.
482 bn 200,000
7 mil*
22,000
11.5 bn
4.24 bn
Total Assets (SGD) Over
Over
Over
Institutional Banking Customers
Consumer Banking/Wealth Management Customers
* As at February 2017 Employees
Income (SGD)
Net Profit (SGD)
66%
25%
9%
Singapore
Greater China
South, Southeast Asia and Rest of the World
of group income
of group income
of group income
Present in 18 markets globally, including six priority markets in Asia
Singapore
Indonesia
India
Taiwan
China
Hong Kong

| 3
“ Leaders in digital banking talk about the difference between digitising aspects of a bank and creating a truly digital financial institution. DBS is doing this better than any other bank. It is demonstrably the case that digital innovation pervades every part of DBS, from consumer to corporate, SMEs to transaction banking and even the DBS Foundation.”
Clive Horwood Editor of Euromoney Magazine
World’s Best Digital BankEuromoney Awards for Excellence 2016
Who we are
Safest Bank in Asia by Global Finance 2016
Asia’s Safest, Asia’s Best
Asia’s Best Bank by Euromoney 2016
Most Valuable Banking Brand in ASEAN and Singapore by Brand Finance 2016

Peter Seah
Euleen Goh
Piyush Gupta
Bart Broadman
The Board is committed to helping the bank achieve long-term success. The Board provides direction to management by setting the Group’s strategy and overseeing its implementation. It ensures risks and rewards are appropriately balanced.
Gender diversity
Two of nine directors are female.
Board independence
A majority of our directors including the Chairman are non-executive and independent directors.
Deep banking knowledge and experience
Two-thirds of the Board are seasoned bankers, while the rest have extensive industry experience ranging from consumer goods to accounting.
Boardof Directors
4 | DBS Annual Report 2016
Ow Foong Pheng
Ho Tian Yee
Andre Sekulic
Nihal Kaviratne
Danny Teoh
| 5Board of Directors

Those marked by * are also in the Group Executive Committee.
For more information on the Group Management Committee, please refer to pages 199 to 200.
Piyush Gupta*Chief Executive Offi cer
Jimmy NgAudit
Lam Chee KinLegal, Compliance
& Secretariat
Karen NguiStrategic Marketing & Communications
Jerry ChenTaiwan
Surojit ShomeIndia Paulus Sutisna
Indonesia
David Gledhill*Technology & Operations
The Group Management Committee executes the strategy and long-term goals of the Group. It drives business performance and organisational synergies. It is also responsible for protecting and enhancing our brand and reputation.
GroupManagementCommittee
About one-third of our Group Management Committee members are women.
Average years of experience of the Group Management Committee.
6 | DBS Annual Report 2016
Lee Yan HongHuman Resources
Sim S Lim*Singapore
Elbert Pattijn*Risk Management
Andrew Ng*Treasury & Markets
Neil GeChina
Shee Tse KoonStrategy & Planning
Jeanette Wong*Institutional Banking
Sebastian Paredes*Hong Kong
Tan Su Shan*Consumer Banking/
Wealth Management
Chng Sok Hui*Finance Eng-Kwok Seat Moey
Capital Markets
| 7Group Management Committee

8 | DBS Annual Report 2016
Letter from the Chairman and CEO
“ We made good progress on our strategy, delivering strong operating performance and cost effi ciencies, as well as solid returns.”
Chairman Peter Seah
An eventful year
In 2016, the global economy registered tepid growth for the sixth year. Markets were volatile, exacerbated by political shocks such as Brexit and the results of the US presidential elections. Across the globe, a rising tide of populism and discontent reared its head, adding to the uncertainty. Technology disruption also continued to force rapid change upon businesses and whole industries.
Against this backdrop, we made good progress on our strategy, delivering strong operating performance and cost effi ciencies, as well as solid returns. These results are commendable given China headwinds which reduced customer activity, as well as the collapse of oil prices which caused stress in the offshore oil support services sector. We increased our credit allowances substantially, and our provision coverage ratios remain strong.
A strong, resilient franchise
We delivered record total income of SGD 11.5 billion, while profi t before allowances increased 10% to a new high of SGD 6.52 billion. Despite the higher allowances, net profi t fell only marginally, down 2% to SGD 4.24 billion.
DBS’ earnings resilience is the payoff from investments made in recent years to build multiple business engines and to digitalise the bank.
With China slowing, trade fi nance came under pressure. However, weakness in trade was offset by broad-based growth in consumer banking, investment banking, cash management and non-trade corporate loans.
Digitalisation also improved the effi ciency of the bank, with our cost-income ratio falling two percentage points to 43%.
During the year, we completed two milestone transactions, which will further strengthen our franchise and cement our ambitions in the wealth and digital space:
• Acquired ANZ’s wealth and consumer banking business in fi ve markets – Singapore, Hong Kong, China, Taiwan and Indonesia. The transaction adds SGD 17 billion in deposits, SGD 11 billion in loans and 1.3 million customers, of which over 100,000 are in the affl uent/private wealth segment, to our franchise. Not only does this solidify our position as Asia’s fi fth-largest private bank, it also enables rapid scale-up of our digital strategy in Indonesia and Taiwan. We expect the deal to be ROE and earnings accretive one year after completion.
• Offi cially launched a 15-year regional distribution agreement with Manulife covering Singapore, Hong Kong, China and Indonesia. The partnership combines DBS’ Asian banking franchise with the insurance and wealth management expertise of Manulife.
World’s Best Digital Bank
Since 2009, DBS has executed well against strategy, doubling both top-line and bottom-line. Many of our regional priorities including becoming a leading regional wealth and transaction banking player, as well as growing outside Singapore, remain relevant and continue to have a lot of headroom. At the same time, we have also been making progress in driving a digital agenda.
Our vision in the next phase of growth is to “Make Banking Joyful”. We seek to act like a 22,000-person start-up, able to respond and innovate quickly to deliver simple, fast and contextual banking in the digital age.
Our three-pronged approach involves:
Embracing digital To be truly digital involves a complete transformation of the bank. This goes beyond customer interfaces, such as digital apps or mobile/ Internet banking on the front end.
| 9Letter from the Chairman and CEO
Much of the heavy lifting is at the back end, where the bank has spent the past few years re-architecting our technology infrastructure. Today, we have a common platform of services and APIs which enables us to integrate best-in-breed technologies, allowing us to move faster on the front end. As we move forward, we aim to adopt the practices of global technology companies known for their ability to constantly experiment, automatically scale and rapidly bring new features to market. Like them, the bank is embracing microservices and cloud technology, which will enable us to be nimbler and more fintech-like.
Embedding ourselves in the customer’s journeyTo become more customer-centric, we have made it a priority to embed ourselves in the customer’s journey. This means thinking about banking not as a separate activity, but as one that should be seamlessly interwoven into a customer’s everyday life. To do so, we need to have a relentless focus on customers’ true “jobs-to-be-done”.
As an example, in the past, a home-buyer might have interacted with us only when he or she had identified a dream home, and was in need of a mortgage. Today, we seek to understand customers’ needs from the start, beginning with the house-hunting process, identifying pain-points and addressing these long before any banking is done.
To be effective, journey thinking involves research and interviews, business case development, conducting experiments and prototyping, before a new product or process is rolled out.
Many of our employees have been trained in journey thinking and human-centred design. Today, over 300 journeys are being run across the bank. These journeys involve collaborations across business and support units, as well as across geographies, engaging a large part of the organisation.
Creating a start-up mindsetFinally, we are re-wiring the organisation to have a “start-up” culture and mindset. In addition to being familiar with technology, every employee needs to embrace experimentation, entrepreneurship and innovation.
We encourage this by creating immersion programmes which involve experiential learning and experimentation, such as hackathons, where employees from across the bank work with start-ups to develop solutions to business challenges. Since 2015, we have also run over 1,000 experiments in the bank.
We also conduct our own incubator/accelerator programmes, where digital start-ups turn their concepts into prototypes. Over 400 start-ups were engaged in 2016 as part of these programmes.
We have invested in creating the supporting infrastructure for a start-up culture. Many of our offices regionally have been designed to help foster innovation. This is done through an open office concept and dedicated spaces such as social hubs for networking as well as innovation and journey “laboratories”. In 2015, we established DBS Academy learning centres in Singapore, Indonesia and Taiwan to conduct immersive programmes. In 2016, we launched DBS Asia X – a 16,000 sq ft space at Fusionopolis in Singapore, dedicated to designing iconic customer experiences and fostering greater collaboration with the fintech ecosystem.
All these allow employees to be immersed in new technologies, a start-up culture, agile methodology and other digital working concepts.
Producing resultsHaving invested time and resources in digitalising the bank, we have seen visible results in a number of areas:
• Expanded customer reach and acquisition. In 2016, 25% of wealth customers and more than 60% of Singapore SME customers were acquired via digital channels. In India, DBS launched digibank, the country’s first mobile-only bank, a groundbreaking proposition, to penetrate the retail banking segment. The bank has acquired more than 840,000 digibank customers in just 10 months.
• Efficiency of the bank. Our cost-income
ratio improved two percentage points to 43%, due in part to improved productivity arising from digitalisation initiatives. In particular, fewer manual processes have enabled the bank to support higher
SGD11.5 bn
43%
60 cents
Cost-income ratio Our cost-income ratio fell from 45% to 43% as past investments to digitalise the bank together with cost management initiatives yielded faster productivity gains.
Total incomeOur total income rose to a record on higher loan volumes, improved net interest margin and broad-based non-interest income growth.
DividendsWe proposed full-year dividends of 60 cents per share, unchanged from 2015.

10 | DBS Annual Report 2016
business volumes with the same level of resources. For example, digibank India uses one-fifth of the resources required in a traditional bank set-up.
• Harnessing the power of analytics. We have leveraged analytics for various purposes; for example, providing contextual offers and advice to customers, reducing ATM downtime, predicting and preventing trade fraud, and lowering employee attrition.
DBS’ digital transformation has won us external validation not just in Asia but globally – DBS was named World’s Best Digital Bank by Euromoney and recognised as being best in the world for digital distribution at the Efma Accenture Innovation Awards.
Sustainability
Sustainability has always been at the core of our purpose-driven DNA. We recognise that not all returns can be found in financial statements and that our responsibility to shareholders is complemented by responsibility to society at large.
In serving our customers, we are committed to a culture that is sensitive to regulations and suitability of transactions, and we hold ourselves accountable at every level, starting at the very top.
Both DBS and POSB were established with strong social mandates – DBS was formed to finance Singapore’s industrialisation, while POSB as the “People’s Bank” had a mission
“ We will further our digital agenda in the coming year by continuing to roll out digibank, pressing ahead with customer journeys and becoming more data-driven. These initiatives will enable us to forge ahead in our quest to reimagine banking. ”
CEO Piyush Gupta
of promoting the nation’s savings habit and facilitating home ownership. Today, DBS and POSB continue to uphold our responsibility to the communities we operate in across Asia, whether through providing inclusive and subsidised banking, supporting SMEs or championing social entrepreneurship.
We also recognise that our lending practices play an influential role in shaping the behaviours of our customers towards sustainable development, and are committed to supporting and implementing responsible banking in line with The Association of Banks in Singapore Guidelines on Responsible Financing. To this end, we have expanded our Core Credit Risk Policy to incorporate the principles and approach to managing environmental, social and governance (ESG) issues in our lending practices and capital market activities. We have also launched a new Responsible Financing Standard which sets out our overarching approach to responsible financing.
We are on a journey, and in the coming years, will continue to work on integrating ESG, including climate change considerations, into our business processes to more fully live our ethos of “Making Banking Joyful”.
Dividends
The Board has proposed a final dividend of 30 cents per share for approval at the forthcoming annual general meeting. This will bring the full-year dividend to 60 cents per share, unchanged from the previous year.
| 11Letter from the Chairman and CEO
Going forward
We expect 2017 to continue to be challenging. Our base case is that the global economy will be somewhat better, backed by stronger growth in the US economy. However, there is tremendous geopolitical uncertainty, both in the US and Europe. There could also be continuing sectoral weaknesses, which will pose problems for our clients.
Nevertheless, our core business should be stable, helped by additional revenues from the ANZ deal, as well as a potential pickup in interest rates.
In awarding DBS the World’s Best Digital Bank accolade, Euromoney had said this of the bank:
From left to right:
1. DBS Asia X, the bank’s new innovation facility, is a space where employees come together to design iconic customer experiences as well as collaborate with fintechs.
2. DBS acquires ANZ’s wealth and consumer banking business in five Asian markets.
3. Launch of digibank, India’s first mobile-only bank.
Peter Seah Lim HuatChairmanDBS Group Holdings
Piyush GuptaCEODBS Group Holdings
“ Leaders in digital banking talk about the difference between digitising aspects of a bank and creating a truly digital financial institution. DBS is doing this better than any other bank. It is demonstrably the case that digital innovation pervades every part of DBS, from consumer to corporate, SMEs to transaction banking and even the DBS Foundation.”
We will further our digital agenda in the coming year by continuing to roll out digibank, pressing ahead with customer journeys and becoming more data-driven. These initiatives will enable us to forge ahead in our quest to reimagine banking.

12 | DBS Annual Report 2016
Digital to the core From re-architecting our technology infrastructure to transforming our front end, DBS is seeking to become digital to the core. Whether it is credit cards, wealth or SME, we make it simple and easy for customers to engage with us digitally. Coupled with a focus on agile methodology and journey thinking, we have been able to improve speed to market and the customer experience. This translates to more digitally-engaged customers, as well as higher returns per customer. In particular, consumer banking and SME customers who engage with us digitally account for 2x more revenue, on average, than other customers.
Re-architecting the back endWe have invested more than SGD 5 billion in the past few years to develop a platform which enables us to be faster to market. We can now “plug and play” technologies from partners using Application Programming Interfaces (APIs) and have started to leverage cloud technology and microservices to be even more agile, scalable and fintech-like.
| 13World’s Best Digital Bank
Transforming the front endToday, customers – individuals and corporates alike – are increasingly starting relationships, transacting or engaging with us online or via mobile. A growing number of customers are online and mobile banking users – over 3 million and 2.2 million respectively.
Online wealthDBS iWealth clients can conduct their banking transactions, manage their wealth and trade on a single platform – a first in Singapore. More than 70% of DBS wealth clients are online and mobile banking users.
Online cardsAbout 140,000 customers use DBS Omni, a first-of-its-kind credit card app in Hong Kong, to instantly verify card transactions, track personal finances and redeem cash rebates. DBS Omni users spent 2.8x more than other card-holders.
Online paymentsPOSB Smart Buddy, a global first, allows school children to pay for their food using wearable tech.
With DBS Remit, customers can remit funds online to nine countries including China, India and USA, without incurring any charges in most cases.
DBS PayLah! has become the fastest-growing personal mobile wallet in Singapore, with more than 450,000 users.
Online SMEMore than 60% of SME customers in Singapore start their relationships with us digitally, opening their accounts online.

14 | DBS Annual Report 2016 | 15World’s Best Digital Bank
A bank that signs you up in just 90 seconds
To open a digibank e-wallet and become a customer takes only 90 seconds.
A bank that understands your interests
Digibank leverages customer data, including spending patterns and savings habits, to better understand clients, so as to provide recommendations aligned to their preferences.
A bank whose call agent is an AI bot
Bye bye humans. Customers chat not with call agents, but with an AI-driven Virtual Assistant, which today successfully answers around 80% of queries.
A bank that learns as it goes along
As time goes by, digibank’s AI function gets to know customers better and better.
A bank with tremendous security
Security is enhanced through dynamic inbuilt security, which is safer than a one-time password.
A bank with no paper, no forms, no signature
Bye bye form-filling and paperwork. Customers open an account with just their thumbprint and Aadhaar ID card. Aadhaar is the world’s largest biometric identification programme.
A bank created for mobile that travels with you
Bye bye branches. Instead of having to go to a bank branch, customers open a savings account at any designated outlet. Thereafter, digibank is a whole bank in a mobile phone.
Reimagining banking Launched in April, digibank by DBS is all about reimagining banking. As India’s first mobile-only bank, it turns banking on its head by doing away with branches, forms, signatures and call agents. Instead, front and centre are biometrics, artificial intelligence (AI), analytics and dynamic security. With digibank, DBS has penetrated India’s retail banking market, acquiring more than 840,000 customers in 10 months. Plans are underway to introduce it in other markets.

16 | DBS Annual Report 2016
ECOSYSTEMS AND SPACES
Industry partnershipsWe have over 50 industry partnerships, including with universities, government agencies and knowledge partners, to leverage best-in-class research and thinking.
DBS HotSpotWe are actively engaging the start-up community with initiatives such as DBS HotSpot, a pre-accelerator programme created and wholly run by an Asian bank.
Dedicated spacesAn open offi ce concept, social hubs for networking and dedicated spaces for immersive learning encourage collaboration and ideation. DBS Asia X is our newest space where employees create iconic customer experiences and foster partnerships with the fi ntech ecosystem.
Building a start-up culture To reimagine banking, we are re-wiring the organisation to have a start-up culture and mindset. We have established experiential learning platforms, introduced new ways of working, re-designed offi ce spaces and fostered ecosystem partnerships to encourage our people to embrace a spirit of experimentation and innovation. This is part of our larger vision of creating a 22,000-person start-up.
| 17World’s Best Digital Bank
FUTURE-READY WORKFORCE
Immersion through experiential learningOur people, through a broad-based digital curriculum, hackathons, incubators/accelerators and fi ntech partnerships, have embraced experimentation and innovation. We also deploy digital champions to build digital quotient among our staff.
Adding digital skillsetsWe augmented our digital capabilities by hiring user experience designers, coders, software engineers and data analysts.
PLATFORMS AND TOOLS
1,000 experimentsSince 2015, we have run over 1,000 experiments, signifying a culture of innovation that goes broader and runs deeper than at many organisations. Employees are encouraged to be intrapreneurs, and with mentorship and funding from the bank, a number have established start-ups while pursuing their day jobs.
Using cloud in a major wayDBS was the fi rst Singapore bank to adopt Offi ce 365, a cloud-based productivity technology, in the workplace. This is part of our efforts to build a fi ntech-like workforce, enabling employees to work collaboratively from anywhere, conduct meetings remotely, and form closer communities online.

18 | DBS Annual Report 2016
Shanghai Better Education Development Centre – ChinaProvides education to latchkey children of migrant workers and low-income families in large cities of China.
LongGood – TaiwanUses Kinect technology for patients to conduct their rehabilitation programmes at home, saving time and costs.
Supportingsocial innovators Social enterprises (SEs) offer innovative and sustainable solutions to address social challenges in a rapidly growing Asia. The DBS Foundation supports social entrepreneurs across Asia by:
• Building awareness and advocacy for SEs. • Catalysing growth of promising SEs through incubation
programmes, skilled mentorship and funding.• Growing high potential SEs through customised support,
advisory and fi nancing.
To date, DBS has reached out to more than 5,000 SEs, and supported over 100 SEs in the region with more than SGD 4 million in grant funding through various initiatives.
Homage – SingaporeMatches healthcare workers with seniors through an online marketplace, giving these elders appropriate and cost-effective care at home.
| 19World’s Best Digital Bank
WateROAM – SingaporeDesigns water fi ltration systems that provide clean water instantly in rural regions and disaster relief zones.
Greensole Footwear – IndiaManufactures low-cost footwear made from discarded shoes, saving on carbon emissions by recycling while providing employment opportunities to marginalised communities in India.
Siam Organic – ThailandHelps to alleviate farmers’ poverty in Thailand by paying them fair prices for innovative organic products. Its Jasberry™ rice is a variety of GMO-free, antioxidant-rich, organic purple rice grown by farmers in Northeast Thailand.
20 | DBS Annual Report 2016
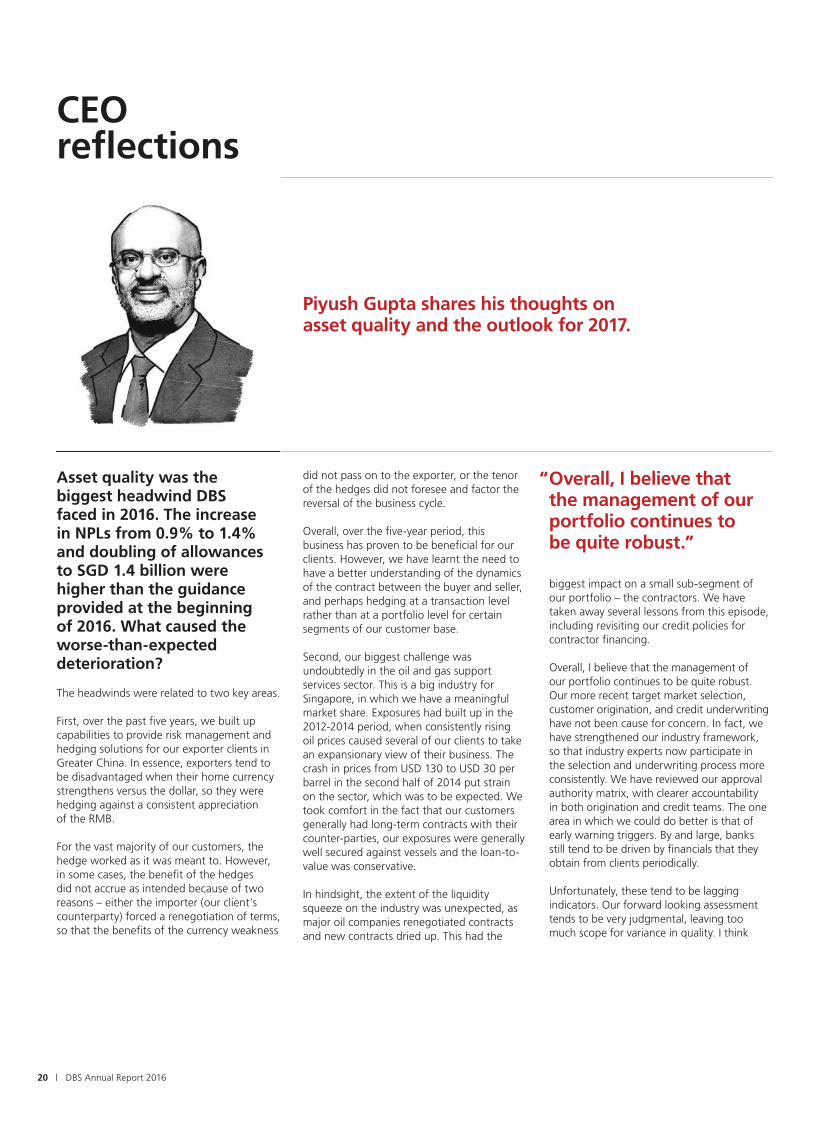
CEO refl ections
Piyush Gupta shares his thoughts on asset quality and the outlook for 2017.
Asset quality was the biggest headwind DBS faced in 2016. The increase in NPLs from 0.9% to 1.4% and doubling of allowances to SGD 1.4 billion were higher than the guidance provided at the beginning of 2016. What caused the worse-than-expected deterioration?
The headwinds were related to two key areas.
First, over the past fi ve years, we built up capabilities to provide risk management and hedging solutions for our exporter clients in Greater China. In essence, exporters tend to be disadvantaged when their home currency strengthens versus the dollar, so they were hedging against a consistent appreciation of the RMB.
For the vast majority of our customers, the hedge worked as it was meant to. However, in some cases, the benefi t of the hedges did not accrue as intended because of two reasons – either the importer (our client’s counterparty) forced a renegotiation of terms, so that the benefi ts of the currency weakness
did not pass on to the exporter, or the tenor of the hedges did not foresee and factor the reversal of the business cycle.
Overall, over the fi ve-year period, this business has proven to be benefi cial for our clients. However, we have learnt the need to have a better understanding of the dynamics of the contract between the buyer and seller, and perhaps hedging at a transaction level rather than at a portfolio level for certain segments of our customer base.
Second, our biggest challenge was undoubtedly in the oil and gas support services sector. This is a big industry for Singapore, in which we have a meaningful market share. Exposures had built up in the 2012-2014 period, when consistently rising oil prices caused several of our clients to take an expansionary view of their business. The crash in prices from USD 130 to USD 30 per barrel in the second half of 2014 put strain on the sector, which was to be expected. We took comfort in the fact that our customers generally had long-term contracts with their counter-parties, our exposures were generally well secured against vessels and the loan-to-value was conservative.
In hindsight, the extent of the liquidity squeeze on the industry was unexpected, as major oil companies renegotiated contracts and new contracts dried up. This had the
biggest impact on a small sub-segment of our portfolio – the contractors. We have taken away several lessons from this episode, including revisiting our credit policies for contractor fi nancing.
Overall, I believe that the management of our portfolio continues to be quite robust. Our more recent target market selection, customer origination, and credit underwriting have not been cause for concern. In fact, we have strengthened our industry framework, so that industry experts now participate in the selection and underwriting process more consistently. We have reviewed our approval authority matrix, with clearer accountability in both origination and credit teams. The one area in which we could do better is that of early warning triggers. By and large, banks still tend to be driven by fi nancials that they obtain from clients periodically.
Unfortunately, these tend to be lagging indicators. Our forward looking assessment tends to be very judgmental, leaving too much scope for variance in quality. I think
“ Overall, I believe that the management of our portfolio continues to be quite robust.”

| 21
that we could do much better using a big data driven approach to this. This is something DBS has started experimenting with.
What do you think will be the outlook for Asia in 2017 given the uncertainties related to a Trump administration in the US, a more complex geopolitical situation globally and a slowing China?
While 2017 will continue to be challenging, my base case is that the global economy may well surprise on the upside, backed by stronger growth in the US economy. This positive momentum should spill over to Asia, benefitting the region.
I base my views on two broad considerations.
First, the US economy has a lot more momentum and strength than is currently being forecasted, and contrary to popular belief, growth is not a zero sum game. A strong US economy lifts a lot of boats around the world. This is further coupled with short-term resilience in Europe (Germany in particular is quite strong), and a degree of stability in China, where there is every incentive to cushion the economy going into the year-end Standing Committee elections.
US President Donald Trump has inherited an economy that is looking pretty good. In recent quarters, consumption has improved notably. Consumer confidence is at a high. Retail sales continue to move upwards, and housing prices in many large
cities have rebounded to pre-financial crisis levels. This has a wealth effect, so despite the deleveraging in some areas, consumers feel wealthier and this should support consumption.
The labour market is near full employment. This is showing up in rising wages, which is a catalyst for continued robustness in consumer demand.
So far, the only fly in the ointment is business investment. This is likely to get positive impetus if President Trump does end up pushing through tax reforms, which will spur domestic investments. Fiscal stimulus, albeit small, should also create investment in the economy. Taking all this into account, the US economy may finally break through the shackles of the 2% GDP growth we’ve seen for the past four to five years. We’re likely to see a GDP growth rate this year of 2.5% to 3%. Historically, a strengthening US economy also eventually results in significant outbound investments, which will benefit Asia. The correlation between a higher USD and Asian equity is very positive, for example.
Second, while President Trump has been difficult to predict, and markets will likely see-saw through the year in reaction to his tweets, many of the officials that he has appointed so far are pragmatic and business friendly. His team’s early engagement with Europe and Asia has been encouraging. It is more balanced and constructive than was expected.
Uncertainty will be a main driver in 2017
What could go wrong?
• Trade protectionism. A general border tax, if implemented, will have significant implications on Asia. But trade protectionism hurts the US more than many people think, and my own bias is that a pragmatic view will eventually prevail, and any controls implemented will likely be on selected industries.
• A much faster interest rate hike cycle in the US than people are taking into account right now. This could create liquidity and credit challenges in Asia.
• Geopolitics. Europe faces growing uncertainties in 2017, with upcoming elections in France, Germany and the Netherlands. In the face of China’s increased regional interests in Asia, there could also be rising tensions with the US.
On balance, however, I believe we will see the US economy continue to gain momentum, and if so, this year will offer opportunities for us in Asia. The risks, however, are real. We will need to be very careful and thoughtful.
CEO reflections
“ While 2017 will continue to be challenging, my base case is that the global economy may well surprise on the upside, backed by stronger growth in the US economy.”
“ The risks, however, are real. We will need to be very careful and thoughtful.”

22 | DBS Annual Report 2016
Our resources
How we create value – our business model
Brand
Customer relationships
Innovation and digital banking
Capital
Funding
Employees
Society and other relationships
Technology and physical infrastructure
Natural resources
How we create value
Asian-focused strategyOur strategy is predicated on Asia’s megatrends, including the rising middle class, growing intra-regional trade, urbanisation, and the rapid adoption of technology that is fuelling new innovations.
We seek to intermediate trade and capital flows as well as support wealth creation in Asia. Our established and growing presence in Greater China, South Asia and Southeast Asia makes us a compelling Asian bank of choice.
In Singapore, we serve all customer segments. Outside Singapore, we traditionally focus on affluent individuals, corporates and institutional investors.
Making Banking Joyful Going forward, we hope to leverage digital technologies to extend our reach to individuals and SMEs outside Singapore.
Our vision in the next phase of growth is to “Make Banking Joyful”. We seek to transform ourselves into a 22,000-person start-up, able to respond and innovate quickly to deliver simple, fast and contextual banking in the digital age.
Read about our digital transformation journey from pages 8 to 10.
Banking the Asian WayWe marry the professionalism of a best-in-class bank with an understanding of Asia’s cultural nuances.
Asian relationshipsWe recognise that relationships have swings and roundabouts, and stay by our clients through down cycles.
Asian serviceOur service ethos is to be Respectful, Easy to deal with and Dependable.
Asian insightsWe know Asia better; we provide unique Asian insights and create bespoke Asian products.
Asian innovationWe constantly innovate new ways of banking as we strive to make banking faster and simpler, while delivering contextualised and relevant Asian products and services.
Asian connectivityWe work in a collaborative manner across geographies and businesses, supporting our customers as they expand across Asia.
Competent leadershipA strong, well-informed and fully engaged board provides strategic direction to management. Management executes on strategy and drives performance and organisational synergies. A matrix reporting structure drives joint ownership between regional function heads and local country heads.
Read about our leaders from pages 4 to 7.
Effective internal controlsThree lines of defence guard our operational excellence: identification and management of risks by units, corporate oversight exercised by control functions and independent assurance by Group Audit.
Read about our internal controls from pages 59 to 60.
Our strategy
Differentiating ourselves
Governing ourselves
| 23How we create value – our business model
Our business model seeks to create value for stakeholders in a sustainable way.
Our strategy is clear and simple. It defines the businesses that we will do and will not do. We use our resources to build competitive advantages. We have put in place a governance framework to ensure effective execution and risk management.
Further, we have a balanced scorecard to measure our performance and align compensation to desired behaviours.
Read more about “How we use our resources” on page 24.
Shareholders
Customers
Employees
Regulators
Society
Our stakeholders
We periodically review our strategy, taking into account emerging megatrends, the operating environment and what our stakeholders are telling us. These are material matters that can impact our ability to create value.
Read about our stakeholders and material matters on pages 28 and 30.
We have 3 core business segments:• Institutional Banking• Consumer Banking/
Wealth Management• Treasury
Read about our businesses from pages 42 to 47 and 174 to 175.
Technology and infrastructureOver the years, we have built a solid technological backbone that is standardised, resilient and scalable. Today, we have a common platform of services and APIs that enables us to integrate best-in-breed technologies, including open source systems. We have embraced the practices of global technology companies in design and technology – adopting agile methodology, user interface and human-centred designs to develop front-end applications.
The bank is leveraging microservices, cloud technology and automation of technology development, which will enable us to be nimbler, more fintech-like and faster to market in delivering cutting-edge solutions.
Nimbleness and agilityWe are of a “goldilocks” size – big enough to have meaningful scale yet nimble enough to quickly identify and act on opportunities. We are also creating a start-up culture to embed customer centricity and drive internal collaboration by embracing experimentation, entrepreneurship and innovation.
Values-led cultureOur PRIDE! values shape the way we do business and work with each other: Purpose-driven, Relationship-led, Innovative, Decisive, Everything Fun!
Rooted in our DNA is a role beyond short-term profit maximisation: doing real things for real people to create social value in the long run, while ensuring that DBS is a joy to deal with.
Read about our sustainability efforts on page 108.
We use a balanced scorecard approach to assess our performance, track the progress we have made in executing our strategy and determine remuneration.
Read about our balanced scorecard on page 38.
Our businesses
Measuring ourselves

24 | DBS Annual Report 2016
How we use our resources
We use our resources(1) to differentiate ourselves and maximise value creation for our stakeholders in the long run.
Resources Indicators 2015 2016 How we manage our resources
Brand Our well-recognised name
Brand value(2) USD 4.40 bn
USD 5.31 bn
Our brand value in 2016 reached another record of USD 5.31 billion, and DBS continues to be recognised as the most valuable brand in ASEAN and Singapore.
The increase in brand value is a testament to our efforts over the past few years to create multiple engines of growth and to reimagine banking. It also reflects our belief in a higher purpose that goes beyond banking, recognising the role we play in benefitting society at large and the communities we are present in.
Customer relationships Our loyal customer base
Customers– IBG– CBG/Wealth
Management
Customer engagement measures(3)
(1=worst, 5=best)– SME– CBG– Wealth
Management
– Large corporates market penetration ranking
> 200,000> 6.2 m
4.133.974.10
5th
> 200,000> 6.9 m
4.104.094.17
4th
Our customer relationships provide us with an understanding of Asia’s cultural nuances, helping us to Bank the Asian Way.
We continue to embed ourselves in the customer’s journey, with a relentless focus on their true “jobs to be done”. We leverage technology to deliver simple, fast and contextual banking to our customers.
Our insights in the region have helped us foster deeper conversations and relationships with IBG clients, deepening our wallet share. In 2016, we continued to make investments in product capabilities, such as in cash management, and developed our industry knowledge, networks and cross-border expertise to drive initiatives that add value to our customers.
In the CBG segment, we continued to focus on delivering seamless solutions for customers’ investment and protection needs.
Our satisfactory customers scores are a testament to their ongoing loyalty and trust in DBS.
Read more about our customer initiatives on page 42 “Institutional Banking”, page 44 “Consumer Banking/Wealth Management” and page 46 “POSB”.
Innovation and digital banking Our intellectual capital
Customer journeys since 2015
CBG/Wealth Management customers using – Internet
platform– mobile
platform
> 100
> 2.9 m
> 1.3m
> 300
> 3.0 m
> 2.2 m
A thriving innovation culture enables us to deliver simple, fast and contextual banking solutions to our customers more quickly than competitors.
Since 2015, we have run over 1,000 experiments across the bank, signifying a culture of innovation that goes broad and runs deep. We embrace agile methodology and have embarked on over 300 customer journeys to explore ways to make banking more joyful for our customers.
In April, we launched digibank, India’s first mobile-only bank that is completely paperless, signatureless and branchless. We continued to enhance our existing digital offerings, including adding advisory services to our state-of-the-art digital platform IDEALTM. For our mobile wallet PayLah!, new features such as bill payments and unique payment links or QR codes for online sellers to request payments were added during the year.
We seek to strike a balance between using our resources in the current period and enhancing and retaining them for future periods. While the monetary value of many of our resources is difficult to quantify, we provide quantitative indicators as proxies and explain how we have utilised or enhanced our resources during the year.

| 25
Resources Indicators 2015 2016 How we manage our resources
(continued)Innovation and digital banking
CBG customers using DBS PayLah!
Transactions on DBS IDEALTM(4)
Enquiries on DBS IDEALTM(4)
> 300,000
> 89.7m
> 9.2m
> 450,000
> 102.2m
> 10.6m
Today, customers – individuals and corporates alike – are increasingly starting relationships, transacting or engaging with us online or via mobile. The increases in CBG customers using Internet and mobile platforms and in corporate transactions and enquiries on IDEALTM are a testament to the strength of our innovative offerings.
We received worldwide recognition for our innovation efforts, becoming the first bank to be named World’s Best Digital Bank at the Euromoney Awards for Excellence in 2016.
Read more about our digital transformation from pages 12 to 17.
Capital Our strong capital base
Shareholders’ funds
Basel III fully phased-in Common Equity Tier 1 Capital Adequacy Ratio (CET1 CAR)
SGD 40 bn
12.4%
SGD 45 bn
13.3%
Our capital base allows us to support our customers through good and difficult times.
We created distributable financial value of SGD 5.80 billion in 2016 and retained SGD 2.80 billion for reinvestment in our resources and future business growth. Our CET1 CAR strengthened to 13.3%, well above the final regulatory requirement of 9%. Our first Basel III-compliant USD Additional Tier 1 perpetual capital securities issued by DBSH during the year was the lowest coupon paid by any issuer globally for similar instruments(5). Our strong capital base and attractive funding position continue to allow us to support our customers’ funding needs through economic cycles. This enables us to build long-term relationships with our customers. Refer to page 103 for more information on our capital management and planning.
Funding Our diversified funding base
Customer deposits
Wholesale funding
SGD 320 bn
SGD 38 bn
SGD 347 bn
SGD 28 bn
Our diversified funding base enables us to provide banking solutions to our customers competitively.
Our funding strategy remains anchored on strengthening our core deposit franchise. We grew our customer deposits by SGD 27 billion in 2016 due to, among other initiatives, a focused effort to grow current and savings deposits, which are favourable for the liquidity coverage ratio.
Refer to page 91 for more information on our liquidity management and funding strategy.
Employees Our people
Employees Employee engagement score
Voluntary attrition rate Training Days per employee
22,017
79%
13.2%
6.4
22,194
81%
11.8%
5.2
A 22,000-person start-up workforce will help us to be nimble and agile and quickly act on opportunities.
We continue to develop our people to their full potential through structured talent development, future-proofing their skills and providing more options for career growth at their own pace.
Our talent development initiatives are built upon the “triple-E” framework – experience, exposure and education. In place of formal classroom training, we are increasingly placing our employees in immersion programmes to expose them to journey thinking, human-centred design and agile project management.
Our strong employer value proposition is validated through the improvement in our employee engagement score and the reduction in the voluntary attrition rate.
In 2016, we were awarded Asia’s Best Employer by Aon Hewitt. We also received country Best Employer awards for Singapore, Hong Kong, Taiwan and Indonesia.
Read more about our employee initiatives on page 113 “Employer of Choice”.
How we use our resources

26 | DBS Annual Report 2016
(1) Resources are referred to as “Capitals” in the International Integrated Reporting <IR> Framework. We have classified our resources differently from the Framework to better reflect how we manage our resources
(2) Source: Brand Finance Global 500 - League Table Report 2016(3) Customer engagement scores based on Nielsen SME Survey, Scorpio Partnership Customer Satisfaction Survey (CSS) for CBG and Ipsos CSS
for Wealth Management. Large corporate penetration ranking based on Greenwich survey of large corporate banking relationships (4) DBS IDEALTM is our corporate Internet platform(5) Source: Dealogic (6) The amount represents the rolling 5-year cumulative amount of capitalised and expensed cost relating to outsourcing and professional fees,
software, hardware and relevant related staff cost for IT. It excludes depreciation(7) The amount represents the rolling 5-year cumulative amount of capitalised and expensed cost relating to specific IT initiatives such as digital
channels and mobile banking and is a subset of our cumulative expenditure in IT. It includes an estimated apportionment of relevant related staff costs
(8) Comparative figures have been restated to include recycled confidential waste in Singapore
Through the enhancements of our resources, value is created. We distribute this value to our stakeholders in several ways.
Read more on page 27.
Resources Indicators 2015 2016 How we manage our resources
Society and other relationships Our relationship with stakeholders
Customers under Social Enterprise (SE) Package
SEs awarded grants via DBS Foundation
Volunteer hours
398
16
27,000
459
12
37,000
As a leading regional bank, we recognise the impact our lending practices have on society and the environment. In 2016, we significantly enhanced our responsible financing policies. We also proactively engaged with regulators in Singapore and standard setters globally on developments relating to sustainability and climate change reporting. With a representative on the GRI Stakeholder Council, we have further shown our commitment to enhancing these agendas.
Through DBS Foundation, we awarded SGD 1 million in grants in 2016 to support the growth of 12 social enterprises in six markets to encourage social innovation in areas such as healthcare, education and environmental sustainability.
Our subsidised banking packages for social enterprises remain popular, with an increase of 61 customers in 2016.
Our staff contributed 37,000 man-hours of volunteer work regionally during the year.
Read more about our sustainability initiatives on page 108.
Technology and physical infrastructure Our IT infrastructure and customer touch points
Cumulative expenditure in IT – rolling 5 years(6)
Of which relating to specific IT initiatives(7)
Branches
SGD 4.6 bn
SGD 1.7 bn
>280
SGD 5.0 bn
SGD 1.9 bn
>280
Our continual investments in best-in-class technology and physical infrastructure allow us to be nimble and resilient.
We have spent the past few years re-architecting our technology infrastructure. Today, we have a common platform of services and APIs which enables us to integrate best-in-breed technologies, allowing us to move faster on the front end. We are now leveraging microservices, cloud technology and automation of technology development, which will enable us to be nimbler, more fintech-like and faster to market in delivering cutting-edge solutions. Read more on page 12 “Digital to the Core”.
Natural resources The natural resources used for our operations
Carbon emissions from purchased electricity (tCO2)
Energy consumption (mWh)
Paper recycled (tonnes)(8)
47,205
79,202
462
45,307
77,612
456
Recognising that everyone has a role to play in combating climate change, we continue to undertake initiatives to reduce our environmental footprint.
In Singapore, DBS was the first bank to achieve the Building and Construction Authority Green Mark certification for over 20 branches. Endorsed by the National Environment Agency, the award recognises efforts to achieve a sustainable built environment by incorporating best practices in environmental design and construction, as well as by the adoption of green building technologies, with some branches reducing as much as 50% of their carbon emissions.
Read more about our initiatives to manage our environmental footprint on page 110.

| 27How we distribute value created
How we distribute value created
We define distributable financial value as net profit before discretionary bonus, taxes (direct and indirect) and community investments. In 2016, the distributable financial value amounted to SGD 5.80 billion (2015: SGD 6.03 billion).
We distribute value to our stakeholders in several ways. Some manifest themselves in financial value while others bring about intangible benefits.
Distributable financial
value
SGD 5.80 bn Retained earnings Retained for reinvestment in our resources and businesses for growth, which over time benefits all our stakeholders
48%
11%
14%
27%
Employees Discretionary bonus paid to employees through variable cash bonus and long-term incentives
Society Contributions to society through direct and indirect taxes, and community investments including donations, in-kind contributions and associated management costs
Distributable financial value
Shareholders Dividends paid to ordinary and preference shareholders and perpetual capital securities holders
We also distribute non-financial value to our stakeholders in the following ways.
CustomersDelivering suitable products in an innovative, easily accessible and responsible way.
For more information, see pages 42 to 47.
Employees Training, enhanced learning experiences as well as health and other benefits for our employees.
For more information, see pages 113 to 114.
Society Supporting social enterprises, promoting financial inclusion, investing in and implementing environmentally-friendly practices.
For more information, see pages 109 to 112.
Regulators Active engagement with local and global regulators and policy makers on reforms and new initiatives that help to build a prudent banking industry.
For more information, see page 30.

28 | DBS Annual Report 2016
Material matters
Material matters have the most impact on our ability to create long-term value. These matters influence how the Board and senior management steer the bank.
The matters that are material to us are similar to last year, with environmental matters becoming more prominent on our agenda. This is reflected in the inclusion of climate change as a material matter.
IdentifyWe identify matters that may impact the execution of our strategy. This is a group-wide effort involving inputs from all business and support units, and takes into account feedback from stakeholders.
Read more about our stakeholder engagement on page 30.
PrioritiseFrom the list of identified matters, we prioritise those that most significantly impact our ability to successfully execute our strategy and deliver long-term value to our stakeholders.
IntegrateThose matters most material to value creation are integrated into our balanced scorecard.
Read more about our balanced scorecard on page 38.
Balancedscorecardindicator
Material matters
What are the risks? Where do we see the opportunities?
What are we doingabout it?
Challenging macroeconomictrends
The macroeconomic environment, characterised by a global and regional slowdown, oil price weakness and market volatility exacerbated by political shocks such as Brexit and the outcome of the US presidential elections, gives rise to business and credit risks.
Our multiple business lines, nimble execution and strong balance sheet enable us to capture opportunities in a challenging environment.
Refer to “CEO reflections” on page 20, “CFO statement” on page 32 and “CRO statement” on page 74.
Talent managementand retention
Failure to attract and retain talent impedes succession planning and expansion into new areas such as digital. Employees risk obsolescence if they are not well-equipped with changing skillsets required in this new digital age.
We see the opportunity to transform our workforce into an innovative and tech-savvy 22,000-person start-up. This will enable us to be nimble and agile in responding to changes in our operating environment.
Refer to “Employer of Choice” on page 113.
Digital disruption and changing consumer behaviour
Technology and mobility are increasingly shaping consumer behaviour. Traditional banks risk losing relevance to platform companies and fintechs.
A successful digital transformation will allow us to respond and innovate quickly to deliver simple, fast and contextual banking to our customers.
This will help us protect our position in core markets as well as extend our reach into larger geographies.
Refer to “World’s Best Digital Bank” on page 12.
Shar
eho
lder
sEm
plo
yees
Dig
ital
tr
ansf
orm
atio
n

| 29Material matters
Balancedscorecardindicator
Material matters
What are the risks? Where do we see the opportunities?
What are we doingabout it?
Cyber security The prevalent threat of cyber attacks on financial institutions remains one of our top concerns.
A well-defined cyber security strategy that is well executed gives confidence to customers and can differentiate us.
Refer to “CRO statement” on page 74 and “Customer privacy and cyber security” on page 109.
Combating financialcrime
Financial crime, including money laundering and corruption, has corrosive effects on society and gives rise to compliance and reputational risks.
A reputation for being clean and trustworthy can help us attract and retain customers and investors.
Refer to “CRO statement” on page 74 and “Combating financial crime” on page 109.
Fair dealing Failure to observe fair dealing guidelines gives rise to compliance and reputational risks.
Customers are more likely to do business with us if they believe that we are fair and transparent.
Refer to “Fair dealing” on page 74.
Evolving regulatory and reporting landscape
The evolving regulatory and reporting landscape, including Basel reforms, overhaul of accounting standards such as FRS 109 and tax measures to counter base erosion and profit shifting, may affect banks’ existing business models and gives rise to compliance risks.
With capital well above regulatory requirements, we are in a strong position to serve existing and new customers. We also have greater flexibility for capital and liquidity planning.
Refer to “CRO statement” on page 74, “Capital management and planning” on page 103 and “New impairment methodology” on page 102.
Responsible financing
The public demands that banks lend only for appropriate corporate activities. Failure to do so gives rise to reputational and credit risks.
We have an opportunity to make a positive impact on society and the environment through our lending practices. Investors are increasingly looking to invest in sustainable companies.
Refer to “Responsible financing” on page 109.
Climate change Climate change poses serious threats to the global economy and can give rise to reputational, credit and operational risks.
Banks can play an influential role in shaping the transition to a low carbon economy, which in turn brings new areas of opportunity and business growth.
Climate change is a wide topic addressed in various parts of our business, including “Responsiblefinancing”, “Managing our environmental footprint” and “Sustainable sourcing”.
Refer to pages 109 to 111 for more information.
Financial inclusion
While Asia’s rapid economic growth and development have led to an improvement in living standards across the region, certain marginalised segments remain underserved in financial services. Developing niche products for such segments may come at relatively high operating and credit costs for banks and erode shareholder value.
With technological advancements, we see opportunities to drive costs down and develop a more inclusive financial system. This resonates with our digital agenda.
Refer to “Financial inclusion” on page 110.
Reg
ula
tors
Soci
ety
Enab
lers

30 | DBS Annual Report 2016
What our stakeholders are telling us
Dialogue and collaboration with our key stakeholders provide insights into the matters of relevance to them.
Our key stakeholders are those who most materially impact our strategy, or are directly impacted by it. They comprise our shareholders, customers, employees, regulators and society at large.
Engagement with stakeholders provides us with an understanding of the matters they are most concerned with. These matters help us define our strategic priorities and guide our initiatives.
Shareholders
We provide investors with relevant information to make informed investment decisions about DBS as well as seek their perspectives on our financial performance and strategy.
The key concerns raised by shareholders in 2016 related to credit risks of our oil and gas sector exposures and asset quality in general. They were also concerned about business growth prospects.
A greater number of shareholders showed interest in how we are embedding sustainability considerations into our business practices.
We provided detailed disclosures on the asset quality and stress test results of portfolios that were of concern to shareholders.
Additionally, we undertook various initiatives to embed sustainability considerations into our business model. In 2016, we responded to the CDP (formerly the Carbon Disclosure Project) Climate Change Information Request for the first time, demonstrating our commitment to measuring and managing our environmental impact.
For more information, see “CEO reflections” on page 20, “CRO statement” on page 74 and “Sustainability” on page 108.
We engage shareholders through detailed quarterly briefings of our financial performance as well as regular one-on-one or group meetings with top management and senior business heads. We also conduct roadshows and participate in investor conferences.
Customers
We interact with customers to better understand their requirements so that we can propose the right financial solutions for them.
We continued to see improved customer satisfaction scores across markets and segments.
Positive feedback was received for our customer service across all channels, particularly for call centres, which benefitted from our initiative to empower customer service officers to resolve customer issues with minimal escalation.
Through customer journeys, customers provided insights on how we could make banking simpler, more intuitive and faster.
We incorporated customer feedback sought as part of our customer journeys in the design of our products and services.
We refined our customer communications to be contextual and relevant, equipped our relationship managers with improved tools to better engage customers on their retirement and financial planning needs, and revamped our iWealth online platform.
For more information, see “Institutional Banking” on page 42, “Consumer Banking/Wealth Management” on page 44 and “POSB” on page 46.
We interact with our customers in multiple ways – through digital banking, call centres, branches, relationship managers and senior management.
We continually push the envelope in designing the best digital experience for our customers with social media as a key focus. We are active on Twitter, Facebook and LinkedIn, and respond to almost 100% of all queries/ feedback through these platforms within one hour.
We conduct annual surveys to identify areas for improving our value proposition to customers.
Customer engagement is integral to the more than 300 customer journeys we have undertaken to date to redesign our processes.
Ho
w d
id w
e en
gag
e?W
hat
wer
e th
e ke
y to
pic
s an
d c
on
cern
s ra
ised
?H
ow
did
we
resp
on
d?
Title: DBS Annual Report 2016 SIZE: 220mm X 300mm D:17-004 GS1701040 175# GP10B-OLH
DBS RedDBS AR17_FrontSec_FA_070317-ok.indd 30 13/03/2017 15:18
| 31What our stakeholders are telling us
Employees
We communicate with our employees using multiple channels to ensure they are aligned with our strategic priorities. This also allows us to be up to date with their concerns.
In 2016, 192 questions and comments covering topics such as strategy and business, DBS culture, customer service, human resource, technology and operations and workplace management were raised by employees through “Tell Piyush”.
In our engagement survey, we scored well for our customer focus and branding. Areas we need to continue working on include performance management and our enterprise enabling infrastructure.
Piyush personally responded to all the questions and comments raised on “Tell Piyush” to address employees’ concerns. Where applicable, issues or suggestions were directed to the relevant departments for follow-up. Examples of initiatives implemented include the roll-out of contactless payment vending machines in our premises, improvements to the staff loans application process and an annual refresh of staff uniforms.
Results from the employee survey were analysed and taskforces set up to address specific areas of concern. Each department is accountable for devising and implementing a plan for improving their engagement results.
For more information, see “Employer of choice” on page 113.
We communicate with our people using multiple channels throughout the year. CEO Piyush Gupta chairs quarterly group-wide townhalls. In 2016, these became fully digital with real-time webcasts across the region.
Piyush also engages and interacts with employees through Yammer – our digital community platform – and receives employee queries and suggestions through his online blog “Tell Piyush”.
In addition, senior management hold regular department townhalls and events to engage their teams on business plans, performance goals and other areas of interest.
The results of engagement can be seen in the improvement in engagement scores through an employee survey conducted by Aon Hewitt, which named us Asia’s Best Employer in 2016.
Society
We engage the community to better understand the role we can play to address the needs of society.
Sustainability and climate change are matters of increasing importance to our societal constituents. The public is demanding that banks exert greater influence on their customers and employees to act responsibly in environmental, social and governance matters.
Through our engagement with SEs, we identified the challenges they face, including a lack of funding and commercial expertise, as well as an inability to attract talent. SEs also suffer from inadequate public awareness about the work they do.
During the year, we significantly enhanced our responsible financing policies in line with the Guidelines on Responsible Financing issued by The Association of Banks in Singapore to support sustainable development across our key markets.
We have applied the GRI G4 Sustainability Reporting Guidelines in the preparation of our Sustainability Report, which provides further clarity around our impact on society and the environment.
We strive to generate awareness and advocacy for SEs in our key markets through digital outreach and signature events.
For more information, see “Sustainability” on page 108.
We work with social enterprises (SEs) across our key markets to understand their needs and help them become commercially viable while pursuing their social objectives.
In Singapore, we partner the Community Development Council and People’s Association to further our outreach to the community.
In 2016, more than 5,000 staff contributed to the community through 37,000 hours of volunteering activities.
Regulators and policy makers
We strive to be a good corporate citizen and a long-term participant in our markets by providing input to and implementing public policies. More broadly, we seek to be a strong representative voice for Asia in industry and global forums.
During the year, key regulatory and reporting issues surrounding the banking industry included:
• Financial crime• Cyber security• Data governance and data privacy • Customer suitability• Credit risk management• Suite of regulatory reforms that the
industry has termed “Basel IV”• Implementation of new major accounting
standard IFRS 9• Tax reforms including base erosion and
profit shifting (BEPS)
We elaborate on some of these issues in “Sustainability” on page 108.
We participated in the following regulatory initiatives in 2016:
• Improving capabilities to counter financial crime, including the mutualisation of “Know Your Client” processes among banks
• Improving information-sharing on criminal typologies within the financial sector
• Analysing risks and opportunities related to fintech, particularly the issue of data privacy laws in an increasingly ubiquitous digital world
• Contributing to the development of best practices in foreign exchange markets
• Contributing responses to Basel IV consultations, some of which are in partnership with peer banks
Led by our country chief executives and supported by their respective heads of legal and compliance, we develop and maintain strong relationships with governments, regulators and other public policy agencies.
In addition to frequent meetings and consultations, we provide data and thought leadership in support of their efforts for ensuring financial stability.
In 2016, we actively participated in various industry forums, such as the Bank for International Settlements annual roundtable and the inaugural EU-Asia Forum on Financial Regulation.
Title: DBS Annual Report 2016 SIZE: 220mm X 300mm D:17-004 GS1701040 175# GP10B-OLH
DBS RedDBS AR17_FrontSec_FA_070317-ok.indd 31 07/03/2017 17:40

32 | DBS Annual Report 2016
A resilient franchise in a challenging year
We achieved another year of strong operating performance. Total income rose 6% to a record SGD 11.5 billion from sustained growth in a wide range of businesses. Our concerted efforts to digitalise the bank as well as our strategic cost management efforts yielded faster productivity gains, containing expense growth to 1% and improving the cost-income ratio by two percentage points. As a result, profi t before allowances increased 10% to a new high of SGD 6.52 billion.
The performance was particularly satisfying because the operating environment was challenging. Unlike the previous year, we did not benefi t materially from interest rate and currency movements in 2016. China continued to affect our performance, causing a drag of four percentage points to total income. Our performance was the result of double-digit growth from other businesses as we nimbly captured opportunities in an environment of slower economic growth. The strong operating results enabled us to absorb a doubling of total allowances as the non-performing loan rate rose from 0.9% to 1.4%, due largely to stresses in the oil and gas support services sector. The higher allowances offset the improved operating performance, resulting in a 2% decline in net profi t to SGD 4.24 billion.
Past investments and nimble execution pay off
The factors contributing to our strong operating performance had one common theme: they were payoffs from investments we had the foresight to make in earlier years and from executing our plans well.
At home, our share of housing loans rose another two percentage points – the same as the previous year – as we offered more stable and attractive pricing packages than competitors could. What enabled us to do so was our stable-cost current and savings deposit base; lacking such a strength, competitors seeking to match our packages would have had to take undue interest rate risks. Despite stiff competition, we maintained our leading share of savings deposits because of the investments we made to enhance the convenience of cash withdrawals and electronic payments for our fi ve million retail customers in Singapore. We captured the increasing prevalence of digital payments as debit and credit card fees rose 11% to SGD 483 million.
Bancassurance income growth accelerated to 60% as we embarked on our regional partnership with Manulife. The 15-year agreement included a payment by Manulife to DBS of SGD 1.6 billion accrued over the period in addition to sales commissions, performance-related commissions and marketing expenses. The attractive terms refl ected the potential of the regional bancassurance distribution franchise we built up with investments in technology and headcount. Our share of bancassurance sales in Singapore rose two percentage points
from the previous year to 32%, making us the market leader for the fi rst time as we overtook the longstanding incumbent. The strong performance more than offset a decline in unit trust fees from a high year-ago base, enabling wealth management fee income to grow 19% to SGD 714 million.
Total cash management income grew 25% to SGD 835 million. The number of new customer mandates accelerated as we progressively added products, including advisory services, to our state-of-the-art digital platform, IDEALTM, and invested in headcount to provide service excellence. Cash management was a major contributor to the growth of our institutional investor and western MNC customer base, which are target segments.
Investment banking was another growth area as fees rose 15% to SGD 189 million. We maintained our leadership in the Singapore equity and fi xed income markets as well as the regional REITs market. We also won several strategic advisory mandates from customers around the region.
Non-trade corporate loans grew 8% to SGD 168 billion. The growth was broad-based across sectors. It included loans to Singapore as well as China companies that were making acquisitions or purchasing assets in developed markets as part of their overseas expansion. These sources of growth more than offset weakness related to China. Trade loans contracted 5% to SGD 39 billion due to the absence of onshore-offshore RMB arbitrage opportunities. (Trade loans excluding China were stable.) Uncertainty over the direction
We reported another set of strong operating results, which enabled us to absorb an increase in allowance charges. CFO Chng Sok Hui highlights the year’s fi nancial performance and the factors behind it.
CFOstatement

| 33CFO statement
of the RMB depressed demand for currency hedging products from China and Hong Kong exporters. (We were largely able to make up for the shortfall in other areas, which limited the decline in overall treasury customer income to 3%.)
Interest rate and currency movements provided less benefit than the previous year. Domestic benchmark interest rates used for pricing SGD loans peaked in the first quarter, putting pressure on net interest margin in the second half. As a result, full-year net interest margin rose three basis points to 1.80%, compared to a nine basis point increase in 2015. The USD-SGD exchange rate was stable compared to the positive impact that a 7% depreciation of the SGD had in the previous year.
Our past investments did not only boost the top line: they were instrumental in enabling us to contain expense growth to 1%. Our progress in digitalising the bank and managing costs yielded faster productivity gains during the year. Underlying headcount (excluding staff in certain technology functions that were previously outsourced) fell by 300 staff or 1% as process improvements enabled us to support higher business volumes with fewer resources. The cost-income ratio improved from 45% to 43%.
Our operating performance was better than peer banks. The 6% total income growth we achieved was significantly higher. At the same time, the cost-income ratio was the lowest and the only one to show an improvement.
Headroom to absorb higher allowances
The resulting 10% rise in profit before allowances provided us with a buffer to absorb a doubling of total allowances. The increase in allowances was due largely to a handful of exposures in the oil and gas support services sector, which was experiencing stresses. In addition, we set aside allowances for several SME customers in Hong Kong and China that had taken hedging positions on the expectation of RMB appreciation.
We continued to maintain a healthy allowance coverage of non-performing assets. On 10 February 2017, we announced that we had sold our stake in DBS China Square Ltd, a subsidiary whose main asset is PWC Building in Singapore. The divestment gains of SGD 350 million, which will be recorded in the first quarter 2017 results,
will be set aside as general allowances, raising general allowance reserves to SGD 3.52 billion and allowance coverage to 104%. If collateral was considered, allowance coverage would be at 226%.
Liquidity and capital remain strong
We had adequate liquidity to support growth and, during parts of the year, built up additional buffers to meet possible contingencies arising from external circumstances. The loan-deposit ratio was comfortable at 87%. Deposits rose 9% to SGD 347 billion and were supplemented by wholesale funding across a range of tenors. The liquidity coverage ratio in the fourth quarter of the year was 133%, well above the final regulatory requirement of 100% effective 2019. We also met the net stable funding ratio requirement of 100% effective 2018.
Our Basel III fully-phased in Common Equity Tier 1 capital adequacy ratio was 13.3%, well above the final regulatory requirement of 9%, which is more stringent than Basel requirements. Our leverage ratio of 7.7% was more than twice the requirement of 3.0% envisaged by the Basel Committee.
There are changes to the regulatory capital adequacy framework that will be adopted in the near future. They include changes in the standardised approach for measuring counterparty credit risk exposures and the revised market risk framework, which are not expected to increase our risk-weighted assets significantly. The Basel Committee is considering further rule changes but they have yet to be finalised. We will continue to assess the impact of the outstanding regulatory reforms and, if necessary, will manage exposures within our strategy, to help mitigate that impact.
We intend to maintain our existing dividend policy, which is to pay sustainable dividends over time, consistent with our capital management objective, long term growth prospects and the need to maintain prudent capital levels in view of the uncertain impact of regulatory change.
Net book value per share increased 7% to SGD 16.87. The increase was in line with total shareholder returns for the year, comprising a 4% appreciation in the share price and a dividend payout of 60 cents per share. DBS had a market capitalisation of SGD 44.0 billion at 31 December 2016.
New methodology for allowances
Last year, I outlined the preparations we were making for implementing Financial Reporting Standard (FRS) 109, which will take effect in 2018. Among other things, the new accounting standard governs how Singapore reporting entities take allowance charges. At present, Singapore banks comply with MAS Notice 612, under which they maintain, in addition to specific allowances, a prudent level of general allowances of at least 1% of uncollateralised credit exposures. This is an intended departure from the incurred loss approach prescribed under FRS 39.
We will be able to quantify the impact of FRS 109, including its effect on capital requirements, when there is clarity on changes to current regulatory specifications. We expect to be able to do so by next year’s annual report. At this juncture, our view remains that any such changes are unlikely to result in additional allowance charges for DBS at the point of adoption.
Read more about FRS 109 in the Risk Management report on page 102.
Outlook
The coming year is likely to continue to be challenging. Geopolitical uncertainty and policy direction of the US and China will have a bearing on Asia’s economic growth. At the same time, although we are not seeing signs of stress in our portfolio outside of oil and gas support services, we remain vigilant on asset quality.
We have strong foundations to meet the challenges. The financial discipline we exercised over the years in building up buffers for capital, liquidity and allowance reserves has ensured that our balance sheet remains resilient. We have continued momentum in a broad range of businesses from cash management to wealth management. Higher interest rates will be a net positive for us. While stresses in the oil and gas support services sector could persist, new NPL formation and specific allowances for the sector are expected to be lower than in 2016. Finally, the speedy integration of the retail and wealth management businesses of ANZ announced in October 2016 will provide additional support to income and earnings in 2017.

34 | DBS Annual Report 2016
7,100
1.771.80
7,305
1,690
1.69
1.751.78
1.84 1.85 1.87
1.77
1.71
1,7431,813 1,854 1,833 1,833 1,815 1,824
Net interest income Net interest income increased 3% to a record SGD 7.31 billion.
Net interest margin was three basis points higher at 1.80%. Higher domestic interbank and swap offer rates in the first quarter boosted Singapore-dollar loan yields. These benefits were largely offset by a decline in benchmark Singapore-dollar interest rates from the second quarter. As a result, a rising net interest margin in the first half gave way to a decline in the second half.
Gross loans grew 6% to SGD 305 billion. Non-trade corporate loans expanded 8% as customers from across the region borrowed for a wide range of activities. Market share gains resulted in an 11% growth in Singapore housing loans. These increases more than offset a 5% decline in trade loans due to China. Trade loans excluding China were stable.
Deposits rose 9% to SGD 347 billion. Savings and current accounts accounted for the majority of the increase in line with efforts to grow transactional accounts.
(SGD m) Net interest margin (%)
2015
2015 2016
1Q 1Q3Q 3Q2Q 2Q4Q 4Q2016
(SGD bn)
CBG
Other IBG
Trade
Fixed deposits
Current account
Gross loans Deposits
39
141
Reported Underlying
Change
-2
+13
+6
+18
-2
+12
+6
+17
Reported Underlying
Change
+18
+10
+27
+16
+8
+25
168
74
95130
305
347
Savings account

| 35CFO statement
Non-interest income
Net fee income increased 9% to a new high of SGD 2.33 billion. The growth was broad-based. Wealth management fees rose 19% as a 60% increase in bancassurance fees more than offset a decline in fees from unit trusts due to a high year-ago base. Card fees grew 11% from increased credit and debit card transactions in Singapore. Investment banking fees were 15% higher from stronger advisory and equity underwriting activities. A 12% increase in cash management fees more than offset a decline in trade finance fees, resulting in a 5% increase in transaction banking fees.
Fee income
(SGD m) 2016 2015 % chg
Brokerage 155 180 (14)Investment banking 189 165 15 Transaction services(1) 585 556 5 Loan-related 434 442 (2)Cards(2) 483 434 11 Wealth management 714 599 19 Others 86 76 13
Fee and commission income 2,646 2,452 8 Less: Fee and commission expense 315 308 2
Total 2,331 2,144 9
Other non-interest income grew 19% to SGD 1.85 billion. Trading income rose 13% as an increase in trading gains and wealth management customer treasury income was partially offset by lower corporate customer treasury income. An increase in net gain on investment securities was partially offset by lower gains on fixed assets.
Other non-interest income (SGD m) 2016 2015 % chg
Net trading income 1,357 1,204 13Net income from investment securities 330 203 63Net gain on fixed assets 54 90 (40)Others(1) 112 60 87
Total 1,853 1,557 19
Business unit and geography performance
By business unit, total income from Consumer Banking / Wealth Management rose 21% to SGD 4.28 billion. The growth was broad-based across loans, deposits, bancassurance and cards. Income from the Wealth Management customer segment increased 19% to SGD 1.68 billion as assets under management grew 14% to SGD 166 billion, putting DBS among the top five banks in the Asia Pacific. Institutional Banking income was little changed at SGD 5.22 billion. Growth in income from cash management, loan activities and capital markets was offset by declines in trade finance and treasury customer income due to uncertainty related to China and the RMB. Treasury segment income was also stable at SGD 1.13 billion.
By geography, Singapore total income increased 13% to SGD 7.54 billion from higher net interest income and from a wide range of non-interest income activities. Hong Kong income declined 8% to SGD 2.10 billion as uncertainty related to China affected trade and treasury customer income. Rest of Greater China income fell 19% to SGD 834 million from a lower net interest margin and lower treasury customer income. South and Southeast Asia income increased 28% to SGD 717 million. Net interest income rose from loan growth, while fee and trading income were also higher.
Total income
(SGD m) 2016 2015 % chg
By business unit Consumer Banking/ Wealth Management (CBG) 4,279 3,547 21
Retail 2,598 2,131 22 Wealth Management 1,681 1,416 19
Institutional Banking (IBG) 5,216 5,290 (1)
Corporate 3,670 3,759 (2) SME 1,546 1,531 1
Treasury 1,129 1,140 (1)Others 865 824 5
Total 11,489 10,801 6
By country Singapore 7,540 6,673 13 Hong Kong 2,102 2,289 (8)Rest of Greater China 834 1,032 (19)South and Southeast Asia 717 561 28 Rest of the World 296 246 20
Total 11,489 10,801 6
(1) Includes trade and remittances, guarantees and deposit-related fees(2) Net of interchange fees paid
(1) Includes share of profits or losses of associates

36 | DBS Annual Report 2016
Expenses Expenses increased 1% to SGD 4.97 billion. The cost-income ratio improved from 45% to 43% as we yielded faster productivity gains from digitalisation and strategic cost management.
There was strong growth in the digital acquisition of customers at lower unit costs. We also drove more transactions and execution towards digital channels, which had lower cost to serve compared to traditional channels. We had higher straight-through processing, which reduced or eliminated the amount of manual inputs and paperwork for an increasing number of mid- and back-office functions. This enabled us to process higher business volumes with fewer resources, improving operating leverage as additional income earned flowed to the bottom line.
At the same time, a strategic cost management programme initiated in 2012 continued to deliver savings by identifying new ways to streamline more processes, leverage new technology and manage sourcing costs.
One outcome of the productivity gains was a decline in underlying headcount of 300 over the past year even as business volumes expanded.
Cumulative general and specific allowances as % of:
SP/loans (bp) 10 18 18 19 38
NPA 142 135 163 148 104*
Unsecured NPA 183 204 296 303 226*
Asset quality and allowances
Non-performing assets increased 74% to SGD 4.86 billion. The increase was due largely to stresses in the oil and gas support services sector. It also included exposures to Hong Kong and China exporters that had taken RMB hedging positions. Total allowances doubled to SGD 1.43 billion.
Allowance coverage remained healthy. The gains of SGD 350 million from an investment property divestment announced in February 2017 will be set aside as general allowances. To be recorded in the first quarter 2017 results, they will raise general allowance reserves to SGD 3.52 billion and allowance coverage to 104%. If collateral was considered, allowance coverage would be at 226%.
Cost/income (%)
NPL ratio (%)
NPA (SGD m)
Not overdue
>90 days overdue
YoY growth (%)
Expenses
2015201420132012 2016
4,972
4,856
15%
14%
71%
2,7922,996
2,5132,72619%43% 24%46% 18%
9% 11%11%
63%48% 65%43%
4,900
4,330
3,9183,614
(SGD m)
1
1311
89
4345454445
1.21.1
0.9 0.9
1.4
<90 days overdue
* Includes SGD 350 million of general allowances set aside from divestment of an investment property announced in February 2017
2015201420132012 2016

| 37CFO statement
Key performance indicators
1. Grow income
Target: Deliver consistent income growth
Outcome: 6% income growth to SGD 11.5 billion
Income (SGD m)
Cost/income (%)
Specific allowances/ average loans (bp)
Return on equity (%)
11,489
43
10.1
38
9,618
45
10.9
18
8,927
44
10.8
18
8,064
45
11.2
10
10,801
45
11.2
19
2015201420132012 2016
2. Manage expenses
Target: Be cost efficient while investing for growth, with cost-income ratio improving over time
Outcome: Cost-income ratio improved two percentage points to 43%, the result of productivity gains from digitalisation efforts and strategic cost management initiatives
3. Manage portfolio risks
Target: Grow exposures prudently, aligned to risk appetite, with specific allowances expected to average 25 basis points of loans through the economic cycle
Outcome: Specific allowances rose to 38 basis points, with the increase due to stresses in the oil and gas support services sector. Specific allowances in other sectors were stable
4. Improve returns
Target: Return on equity of 12% or better in a normalised interest rate environment
Outcome: Return on equity fell to 10.1% as total allowances doubled due to stresses in the oil and gas support services sector
2015201420132012 2016
2015201420132012 2016
2015201420132012 2016

38 | DBS Annual Report 2016
Our 2016 priorities
Shareholders
Achieve sustainable growthShareholder metrics measure both financial outcomes achieved for the year as well as risk-related KPIs to ensure that growth is balanced against the level of risk taken, including compliance and control
For more information, see page 37.
Digital transformation
AcquireMeasure the progress made in leveraging digital channels to acquire new customers
TransactMeasure the reduction in manual efforts by driving straight-through processing and instant fulfilment
EngageMeasure the progress made in growing customers’ digital engagements with the bank
For more information, see pages 40 to 41.
Creating a start-up culture
Measure the progress in re-wiring mindsets to be a 22,000-person start-up anchored on our PRIDE! values
For more information, see page 16.
Reimagining customer and employee experiences
Measure the progress in embedding ourselves in the customer journey and employee journey to challenge the status quo
For more information, see page 41.
Customers
Position DBS as bank of choiceCustomer metrics measure the Group’s achievement in increasing customer satisfaction and depth of customer relationships
For more information, see page 39.
Employees
Position DBS as employer of choiceEmployee metrics measure the progress made in being an employer of choice, including employee engagement and people development
For more information, see pages 39 to 40 and 113 to 115.
Traditional KPIs (40%)
“Making Banking Joyful” KPIs (15%)
We use a balanced scorecard approach to measure how successfully we are serving multiple stakeholders and driving the execution of our long-term strategy. Our scorecard is based on our strategy and is used to set objectives, drive behaviours, measure performance and determine the remuneration of our people, making this a living tool.
The scorecard is divided into three parts and is balanced in the following ways:
• Between financial and non-financial performance indicators. Almost one-third
of the total weighting is focused on control and compliance metrics. On top of that, in line with our digital agenda, we have introduced KPIs around our vision to “Make Banking Joyful”
• Across multiple stakeholders• Between current year targets and
long-term strategic outcomes
The scorecard is updated yearly and approved by the Board before being cascaded throughout the organisation, ensuring that the goals of every business, country and support function are aligned to those of the Group.
Performance is assessed against the scorecard to determine remuneration, providing a clear line of sight between employee goals and organisational imperatives. We have achieved a well-established rhythm towards performance monitoring and our rewards are closely linked to scorecard outcomes.
Read more about our remuneration policy on page 64.
Read more about our “Making Banking Joyful” agenda from pages 8 to 10.
| 39Our 2016 priorities
Increase customer satisfactionTarget: Broad-based increase in customer satisfaction across markets and segments
Outcome: Based on customer surveys, we improved customer satisfaction in Consumer Banking (CBG) and maintained customer satisfaction in SME Banking. We increased our penetration of large corporate relationships and are the only Asian bank ranked in the top 5 on this measure.
Customer Satisfaction Measures
2015 2016
Wealth Management Customer Engagement Score
4.10 4.17
Consumer Bank Customer Engagement Score
3.97 4.09
SME Bank Customer Engagement Score
4.13 4.10
Large corporates market penetration ranking
5th 4th
* Customer engagement scores (1 = worst; 5 = best) based on Ipsos Customer Satisfaction Survey (CSS) for Wealth Management, Scorpio Partnership CSS for CBG and Nielsen SME Survey. Large corporate penetration ranking based on Greenwich survey of large corporate banking relationships
Customer KPIs
Increase wallet shareTarget: Deepen wallet share of individual and corporate customers
Outcome: Institutional Banking (IBG) non-loan income ratio was marginally lower as a decline in RMB-related trade and treasury fl ows was mitigated by strong growth in cash management and investment banking income. CBG non-interest income ratio declined on the back of higher net interest income driven by improved margins and volume growth across both loans and deposits.
IBG Non-Loan Income Ratio (%)
CBG Non-interest Income Ratio (%)
47505050
39384141
46
37
2015201420132012 2016
2015201420132012 2016
Regional businesses
Grow our regional businesses in Consumer/Wealth Management and Institutional Banking
For more information, see pages 42 to 47.
Geographic mix
Scale our growth in India, China and Indonesia
For more information on countries’ fi nancial performance, see page 35.
Enablers
Strengthening management processes, technology and infrastructure platform
For more information on fair dealing and cyber security, see page 109.
For more information on our technology, see pages 23 and 26.
Regulators
Contribute to the stability of the fi nancial system
For more information, see page 31.
Society
Enhance the communities we serve, driving sustainable outcomes
For more information, see page 108.
Areas of focus (45%)
The following section provides the balanced scorecard metrics that we measure ourselves on. (Shareholder metrics are found on page 37) We gave ourselves a lower overall balanced scorecard rating in 2016 because of a mixed performance.
Employee KPIs
Maintain high employee engagementTarget: Improve employee engagement levels; top quartile of My Voice engagement peer group
Outcome: Ranked among top quartile in Aon Hewitt My Voice survey; score increased by two percentage points. We were named by Aon as one of the Regional Best Employers in Asia Pacifi c in 2016.
My Voice Employee Engagement Score (%)
79 81
Regional Best Employers in Asia Pacifi c, 2016
2015 2016

40 | DBS Annual Report 2016
2015201420132012 2016
People development
Target: Provide our people with opportunities for internal mobility to enhance professional and personal growth
Outcome: Enabled our people to broaden their exposure across businesses, functions and markets; 30% of positions were filled by internal candidates in 2016.
Turnover
Target: Maintain or reduce voluntary attrition; top quartile in all core markets
Outcome: Improved our voluntary attrition; in 2016, DBS was best-in-class in Singapore and Indonesia and our voluntary attrition rates were much lower than market average in key markets like China, Taiwan and India.
Mobility: positions filled internally (%)
Turnover (%)
12.414.1 13.6 13.2
11.8
2015201420132012 2016
2627 30
23
30
Acquire KPIs
Growth in customers acquired digitally
Target: Grow digital acquisition of customers and increase digital channel share
Outcome: Surpassed target growth in customers acquired digitally. Increased the proportion of retail products sold digitally to 43%
Growth in customers acquired digitally* (%)
Target
*Wealth + SME customers
Actual
25
41
Digital Transformation KPIs
Reduction in manual efforts through improved productivity
Target: Reduce manual efforts by 10% in targeted operations by driving straight- through processing
Outcome: Achieved reduction in efforts, above target. Digibank India’s operating model leverages technology, requiring fewer resources than a traditional bank.
Reduction in manual efforts in targeted operations (%)
10
12
Transact KPIs
Target Actual
Growth in channel share of retail products sold digitally
2015 2016
37% 43%
Digibank India uses one-fifth of the resources required in a traditional bank set-up. Its AI-driven virtual assistant responds to more than 80% of queries.
Employee KPIs (continued)
> 840,000 customers acquired in 10 months since launch
Growth in digibank India
Title: DBS Annual Report 2016 SIZE: 220mm X 300mm D:17-004 GS1701040 175# GP10B-OLH
DBS RedDBS AR17_FrontSec_FA_070317-ok.indd 40 08/03/2017 21:12
| 41
Over 300 Journeys
Target Actual
150
302
Reimagining customer and employee experiences KPIs
Target: Embed journey thinking and drive 150 customer and employee journeys
Outcome: Embarked on over 300 journeys to explore ways to make banking more joyful for both customers and employees; 250 of our most senior leaders each sponsored a journey.
As part of our journeys, we have harnessed the predictive power of analytics to improve productivity, drive efficiency and improve controls across our support functions. Our contact centre uses data analytics to identify, prioritise and proactively reach out to customers who face issues before the customer calls in, resulting in faster resolution and greater customer satisfaction. Predictive analytics are used to optimise our ATM network efficiency, minimising out-of-cash occurrences while reducing the number of trips needed to reload the network.
Reimagining customer and employee experiences KPIs
Start-up Culture KPIs
Target: Drive a start-up culture and mindset shift for employees to be more fintech-like
Outcome: Made good progress, with many of our people embracing a spirit of experimentation and innovation through immersion programmes, experiential learning platforms and ecosystem partnerships
Immersion programmes Employees were involved in immersion programmes such as hackathons, incubators, accelerators and partnerships with the fintech community. We invite start-up founders and entrepreneurs to share their experiences and
inspire our employees. We also mentor and support our staff who have similar aspirations.
Spaces and platformsWe have invested in spaces across the region to foster collaboration and drive an agile way of working. These include an open office concept, journey laboratories and innovation facilities such as DBS Asia X (our latest innovation centre which we launched in 2016).
We deployed a regional crowdsourcing platform for all employees. They are now able to contribute, share and vote for innovative ideas effectively within the DBS community. This will encourage and empower employees to make real changes.
Creating a start-up culture KPIs
Increase customers’ digital engagements with the bank
Target: Drive engagement of customers through digital channels
Outcome: Made progress in driving customers’ digital engagement across retail and SME segments. Digitally engaged customers generate 2x more revenue on average versus traditional customers.
Enhanced suite of front-end apps to drive customer engagementWe continued to enhance our suite of front-end apps to drive customer engagement across the group. The DBS Omni Credit Card Companion mobile app in Hong Kong enables customers to be in control of their spending – all with a simple touch on their smartphones. There are now about 140,000 users of the app who demonstrate higher spend versus non-users.
DBS BusinessClass creates a regional community of like-minded entrepreneurs,
giving them access to industry experts, investors, research and knowledge, as well as instant advice from the bank. Today, there are over 32,000 members discussing over 650 topics on the platform.
In Singapore, the total financial value of financial transactions on our mobile banking platforms increased by 51%, while total transactions increased 47% over the same period.
Through our Asian Insights platform, we continue to see good increase in traffic and engagement with customers who value our advice and insights into local markets and industries, allowing them to make better business and investment decisions.
Data analytics driving contextual offeringsIn our wealth, retail and SME businesses, the use of data analytics to provide contextual offerings to our customers has resulted in higher acquisition and sales of products that are relevant to customers when they need them.
Engage KPIs
Our 2016 priorities
>400 start-ups engaged
>1,000 experiments,>100 prototypes
>1,000 ideas generated from >6,000 staff
Title: DBS Annual Report 2016 SIZE: 220mm X 300mm D:17-004 GS1701040 175# GP10B-OLH
DBS RedDBS AR17_FrontSec_FA_070317-ok.indd 41 08/03/2017 21:12

42 | DBS Annual Report 2016
Institutional Banking
Financial performance
For Institutional Banking Group (IBG), dislocations in commodity prices as well as challenging operating conditions in Greater China affected trade and treasury flows. The stability of IBG’s income despite these headwinds reflects the resilience of the franchise.
IBG’s total income declined marginally by 1% to SGD 5.22 billion. The shortfall from Greater China markets was moderated by higher earnings from Singapore and the other international markets. By product, an increase in contributions from cash management and investment banking offset a decline in trade and treasury activities. Expense growth was contained at 1% to SGD 1.74 billion.
Total allowances increased SGD 941 million to SGD 1.50 billion, due largely to stresses in the oil and gas support services sector. Profit before tax therefore fell 34% to SGD 1.98 billion.
Key highlights
We place the customer at the centre of all we do, and are committed to helping our large corporate and SME clients with their financial needs. Our relationship teams, organised by industry segments, are able to understand our customers’ business and risks better. Our
insights in the region have also helped us foster deeper conversations and relationships with clients, deepening our wallet share.
In 2016, we continued to make investments in product capabilities, such as in cash management, and developed our industry knowledge, networks and cross-border expertise to drive initiatives that add value to our customers. Here are some key highlights.
A leading cash management franchiseOur cash management income grew 25% as investments in cash management capabilities yielded strong returns. Revenue growth was broad-based across all key markets.
We continued to invest in our global suite of cash solutions with significant progress in the next generation of payments, receivables and liquidity management solutions.
The number of new working capital advisory mandates doubled, helping clients better manage their working capital and minimise funding costs.
Our efforts were recognised as we garnered several marquee awards including Best Overall Bank for Cash Management in Asia Pacific from Global Finance, Best Transaction Bank in Asia Pacific from The Banker and Best in Cash Management from CFO Innovation.
Strong growth in open account trade Our open account trade business delivered growth of 7% with 80 new client mandates. Corporate treasurers seeking to improve the liquidity of their balance sheets worked with us to tap into our supply chain financing and account receivable purchasing solutions, including some of the largest structured deals seen in the market in 2016.
Our trade business received industry recognition including Best Trade Finance Provider and Best Supply Chain Finance Bank in Asia Pacific from Global Finance.
Banner year in investment bankingWe had a banner year in investment banking and DBS was named Best Asian Investment Bank for the second year by FinanceAsia.
In difficult market conditions marked by stressed credits and volatile rates, our fixed income franchise continued to grow. We not only maintained our leadership position in the SGD bond market, but grew our market share to 43.2%. We were also ranked among the top eight bookrunners in Asia ex-Japan in the US dollar corporate space.
We continued to bring debut issuers to the market such as India’s Jubilant Pharma (5-year USD 300 million high yield bond), and also worked with repeat issuers such as China’s Huawei (10-year USD 2 billion jumbo issue, the largest unrated single tranche US dollar transaction for a corporate globally since 2003).
We remained the top equity house in Singapore, participating in over 89% of equity funds raised, including 91.5% of initial public offerings (IPOs). As the leading REIT house in Southeast Asia, we were involved in more than one-third of offerings and lead-managed the three largest REIT IPOs in Southeast Asia. We were also involved as the joint global coordinator in Hong Kong’s largest IPO since 2014, Postal Savings Bank of China’s USD 7.4 billion initial offering.
(SGD m) 2016 2015 %
Total income • Corporate • SME
5,2163,6701,546
5,2903,7591,531
(1) (2) 1
Expenses 1,737 1,722 1
Profit before allowances 3,479 3,568 (2)
Allowances 1,499 558 >100
Profit before tax 1,980 3,010 (34)
| 43Institutional Banking
2017 focus areas
• Continue to drive digital innovation to transform the customer experience
• Accelerate our cash management business and be the preferred bank for corporates and SMEs for their cash management and working capital needs
• Focus on growth markets including growing our SME franchise in these markets
• Deepen wallet share with large corporates across Asia
Project financeProject Finance International magazine named DBS the Asia Pacific Bank of the Year 2016, acknowledging the traction we have had in supporting companies looking for advice, and in arranging funding, in Asia Pacific’s project and infrastructure finance market. We acted as financial adviser for deals such as the Adaro Power - Sembcorp consortium bid for a power plant in Indonesia and as mandated lead arranger on major projects such as the Tangguh LNG expansion project in Indonesia, the new Victoria International Container Terminal in Australia, a portfolio of hydro projects in China, and Singapore’s largest waste- to-energy incineration plant, TuasOne.
Expanding our Institutional Investor and Western MNC customer baseOur strategy to grow our institutional investor and Western multinational (WMNC) businesses has reaped rewards as these customers valued our credentials as a strong regional bank and our insights in the Asian markets.
We saw significant uplift in revenue for the institutional investor segment. The client base doubled from 2013 and we saw double-digit growth in deposits, treasury products and cash management.
2016 also saw significant growth in cash, trade and treasury and markets business with WMNCs, as our international centres were able to work seamlessly with our core Asian markets to add value to these clients.
Capturing China outbound businessChinese companies were on a buying spree in 2016. We were able to capture some of these opportunities by leveraging our strong pan-Asian presence, comprehensive suite of products and healthy balance sheet to support Chinese corporates as a total solutions partner.
We provided financing for and acted as financial adviser in deals such as motor vehicle distributor Dah Chong Hong’s acquisition of global exporter Li & Fung’s Asian distribution business and China Merchants Group’s
SGD 1.8 billion privatisation of its SGX-listed China Merchants Holdings Pacific, which operates toll roads.
In addition, DBS played a leading role in helping Chongqing enterprises access offshore capital markets via the third China-Singapore government project launched in Chongqing last year. We completed the first offshore RMB bond under this project for Chongqing Grain Group, which was also the largest corporate offshore RMB bond offering in 2016.
Customer-centric digital initiativesOver the course of the year, we embarked on several customer-centred innovation programmes, where we experimented with new technology and developed new product initiatives and process improvements. We piloted a trade analytics programme to screen for red flags on trade finance transactions and detect anomalies in transaction behaviour. We were also the first Asian bank to eliminate physical tokens for corporate Internet banking transactions, making banking simpler for corporate treasurers and small business owners.
We continued to leverage technology to acquire new customers, simplify the way they transact and enhance the customer experience. In Singapore, more than six out of 10 SME accounts with us were opened online versus five in the previous year. SMEs can obtain bank guarantees online within three days, compared to a week previously. Via a pilot with Tally Solutions, one of India’s largest enterprise resource planning companies, SMEs in India can access DBS’ payments solution directly from their enterprise resource planning software.
DBS is playing a leading role in industry initiatives to create new standards across corporate banking, so that we can cater to clients’ future needs. These include SWIFT’s Global Payments Initiative, which aims to create the next era of correspondent banking and international payments. DBS is also actively engaged in industry initiatives including the National Trade Platform being developed in Singapore, the Unified Payments Interface in India, and the Faster Payments Systems in Hong Kong.

44 | DBS Annual Report 2016
Consumer Banking/ Wealth Management
(SGD m) 2016 2015 %
Total income • Retail • Wealth Management
4,2792,5981,681
3,5472,1311,416
21 22 19
Expenses 2,384 2,261 5
Profit before allowances 1,895 1,286 47
Allowances 129 116 11
Profit before tax 1,766 1,170 51
Financial performance
Consumer Banking Group/Wealth Management (CBG) delivered another year of solid performance, with total income rising 21% to SGD 4.28 billion, despite a challenging business environment across a number of markets. Profit before tax reached a new high of SGD 1.77 billion, up 51%. Expenses were tightly managed and grew 5%, a significantly slower pace than income growth, resulting in an improved cost-income ratio of 56% compared to 64% a year ago.
CBG’s performance was broad-based. Strong growth in customer deposits, mortgage loans and cards resulted in a 26% increase in net interest income. Non-interest income from investment and bancassurance products grew 17% as we continued to focus on delivering seamless solutions for customers’ investment and protection needs. 2016 was a milestone year for DBS in bancassurance as we successfully commenced our 15-year strategic partnership with Manulife in four key markets. Through this collaboration, more than 30 new products were launched to address the insurance needs of our customers.
Our wealth business also delivered solid growth, with income and assets under management (AUM) increasing 19% and 14% respectively. Our total wealth AUM stands at SGD 166 billion, putting us among the top five wealth managers in Asia.
Strong growth in Singapore
In Singapore, we maintained our market leading position in customer deposits, housing loans, bancassurance and cards. We have 51% market share for retail savings accounts and over 28% of market share for housing loans. We lead the market in bancassurance with a market share of 32% and we continue to be the largest credit and debit cards issuer in the market, with close to five million cards in circulation.
For the first time in Singapore, an innovative solution, Manulife IncomeGuard+, allowed eligible customers to purchase a life insurance product via digital banking, without the need to fill in any physical forms.
Notwithstanding our leading position, we continued to invest in digital capabilities and improved our product suite and processes to create better customer journeys. Everything that we design and build ultimately begins and ends with our customers in mind. In 2016, we upped the ante in the innovation space with the launch of our mobile app, “DBS digibank” in Singapore.
More customers are engaging with us online and via mobile. The number of customers using our Internet and mobile banking platforms has increased, reaching more than 2.6 million and 1.4 million respectively. Credit card and loan applications can now be executed through our revamped
mobile banking platform. Total remittance volumes grew 33% to over SGD 7 billion as we extended our remittance corridors to Australia, China and the US. A strong area of performance was mortgage loans. Leveraging our strong SGD balance sheet, we led the market in offering customer-centric propositions which gave home buyers greater transparency and less volatility in their mortgage loan repayment, which resulted in portfolio growth four times faster than the market. The solutions offered include a unique interest rate cap Managed Mortgage Programme which blends fixed and floating rates and the Fixed Deposit Home Loan Rate Programme pegged to our SGD fixed deposit rate.
Our credit cards business also delivered a strong performance, with a record high market share in billings and receivables. We also maintained our market position for the highest share of net receivables. These results were driven by our continued focus on data analytics and contextual marketing that guided our marketing activities and helped to maximise the effectiveness of our campaigns.
Healthy growth in other markets
Outside of Singapore, 2016 was an inflection year for Indonesia and Taiwan, with both of these businesses turning profitable on the back of broad-based momentum across products and segments. We also saw good traction in China, with double-digit income growth and improving operating efficiency. Across the region, despite a challenging environment, income from investment products recorded broad-based growth across asset classes and segments. While the business faced margin compression due to competitive pricing, customer activities remained resilient and engagement deepened through constant product innovation.
In Taiwan, our refinancing and top-up mortgage offerings were well received by our wealth customers. In the fourth quarter of 2016, we launched the HomeAdvisor

| 45Consumer Banking/Wealth Management
mobile app, which provided home buyers with a one-stop service for property searches, affordability calculations, valuations and engaging DBS for assistance. In Indonesia, our mortgage loan portfolio tripled, albeit from a relatively small base, as we continued to improve our proposition, customer journey and home sales advisor effectiveness.
In India, we launched digibank, the country’s first mobile-only bank. This was a revolutionary offering as it brought together an entire suite of ground-breaking technology – from biometrics to artificial intelligence – to enable customers to enjoy a whole new way of banking. We have done away with onerous form-filling and cumbersome processes – digibank is a completely paperless, signatureless and branchless bank. We have since acquired over 840,000 customers since the launch in April 2016, which is a testament to the strength of our innovative offering.
Taking the lessons and key success factors gleaned from our experience in India, we have soft-launched digibank in Indonesia in November.
With India and Indonesia being large geographies, in the past, DBS would not have been able to penetrate the mass retail segment in both markets without an extensive and expensive brick-and-mortar network. Digibank changed that paradigm, allowing us to bank a whole new segment purely on mobile, and at a fraction of the cost of running a comparable traditional bank.
In October, we announced the acquisition of ANZ’s wealth management and retail businesses in five markets. A strategically and financially attractive opportunity, this transaction brings earnings accretion and significant cost synergies, and cements our position as a leading wealth manager in Asia.
By adding a large customer franchise to DBS in Indonesia and Taiwan, the acquisition will facilitate our efforts to scale up our wealth and digital strategy in these markets. In Indonesia, DBS will gain about 410,000 customers, effectively increasing our base there by six times. In Taiwan, DBS will add around 530,000 customers, expanding our base by 2.5 times.
Significant strides in our wealth business
With growing affluence in Asia, we identified building a leading regional wealth franchise as a key priority a number of years ago. Since then, our wealth franchise has grown from strength to strength, and today accounts for about 15% of total group income. The strong momentum is due to a number of factors. Instead of a one-size-fits-all strategy for all wealth clients, we have tailored offerings for priority banking, high net-worth and ultra high net-worth clients.
This year marks the fifth anniversary of our Treasures Private Client business, which caters to high net-worth individuals with investible assets of SGD 1.5–5 million, and is still the fastest growing segment.
Our wealth continuum allows us to deliver a seamless experience and work with clients at every stage of their wealth cycle.
In Asia, where many wealth clients are also entrepreneurs, our strong regional corporate and commercial banking franchise allows us to provide them with regional connectivity and advice beneficial to their business. As an Asian bank, we have a deep understanding of Asia, which continues to be a growth region.
We have also made a number of key enhancements to our wealth platform, DBS iWealth. The enhanced platform provides customers with all-in-one access via a single platform to conduct their banking transactions, manage their wealth and also trade on the go – a first in Singapore. DBS iWealth is also available on mobile and empowers clients with quick and intuitive access to services, product information and research.
Leveraging data analytics
Over 2016, we leveraged data analytics to significantly enhance our customer engagement, empower our staff and reduce our risk exposure. We rolled out a contextual marketing programme, starting with Singapore, where we leveraged data to reach our customers with relevant messages at the most suitable time and place. This personalisation and outreach at scale is now being rolled out region-wide.
We have also implemented analytics-driven tools to allow our relationship managers to get a comprehensive view of customer profiles, investment holdings and other relevant information on one integrated mobile platform, enabling them to engage in a much more personalised conversation and tailor financial advice accordingly.
Our investment in data analytics has enabled us to serve our customers better. As we move forward on this journey, we are confident that our continued focus in this field will strengthen our businesses and enhance our customer interactions.
2017 focus areas
• Integrate ANZ retail and wealth business across five markets
• Accelerate digitalisation and further enhance end-to-end customer journey
• Embed iWealth 2.0 to fundamentally enhance wealth digital assets and capabilities
• Drive digibank in India and Indonesia

46 | DBS Annual Report 2016
POSB Neighbours first, bankers second
As a key institution in Singapore, POSB has served Singaporeans from all walks of life since its founding in 1877. They include the young, families, seniors and the community at large.
From creating a nationwide savings movement to playing a key role in the development of Singapore, our aim as Singapore’s oldest and most loved bank is to always remain at the forefront of providing pioneering financial solutions that cater to the evolving needs of Singaporeans.
Other than bringing value to Singaporeans, POSB has also continuously entrenched itself as the “People’s Bank” by widening its reach in the community through various initiatives.
We announced the successful trial run of a global first – the POSB Smart Buddy programme. The programme creates a contactless payments ecosystem within the school environment to help cultivate sensible savings and spending habits among young students in an interactive, engaging manner. Our accompanying mobile app allows parents to remotely manage their children’s spending and savings, while empowering students to monitor their own finances.
POSB also partnered the Info-communications Media Development Authority of Singapore (IMDA) to launch an e-savings programme that uses robotics to engage primary school students. With support from students of Nanyang Polytechnic, the POSB eYoung
Savers programme was the first project by a bank to be showcased on IMDA Lab on Wheels, a bus-based interactive programme that aims to ignite passion in technology among the young through engaging and experiential activities.
Through this collaboration, we hope to promote financial literacy and further spread the culture of saving among the young, while incorporating elements of technology and robotics.
Close to 7,500 participants joined us at the eighth edition of the POSB PAssion Run for Kids. A total of SGD 1 million was raised for the POSB PAssion Kids Fund, bringing the total amount raised to date to SGD 5.74 million. The fund has benefitted over 245,000 children to date.
For children and families
Title: DBS Annual Report 2016 SIZE: 220mm X 300mm D:17-004 GS1701040 175# GP10B-OLH
DBS AR17_FrontSec_FA_070317-ok.indd 46 08/03/2017 21:13
| 47POSB
As part of the POSB Active Neighbours programme, we have been hiring seniors and training them to assist others at our branches, with the aim of promoting more active lifestyles for older Singaporeans. Today, we have over 80 Active Neighbours across our branches, where they also actively share the convenience of digital banking.
In Singapore, we believe in contributing towards an inclusive society where everyone can access our services. While we ramp up our digital offerings, we understand our customers’ need to continue to access our physical locations and have provided new and innovative ways for them to do so. In August 2016, we piloted POSB Video Teller Machines (VTMs), the fi rst of its kind in Singapore. POSB VTMs are able to provide round-the-clock branch banking services to customers, with the option of “face-to-face” assistance from bank tellers via live-video streaming. In addition to providing services such as balance enquiries, change of particulars and statement requests,
For seniors
For the community
POSB VTMs are also able to dispense Internet banking security tokens as well as debit cards instantly.
In the lead-up to the nation’s 51st birthday, we announced the return of the iconic POSB Save-As-You-Earn (SAYE) programme. First launched in 1974, the POSB SAYE programme was introduced to encourage Singaporeans to cultivate a habit of setting aside a portion of their salary as savings. Those who did so were rewarded with bonus interest on their savings. The bonus interest and additional benefi ts were also offered exclusively to full-time national servicemen to recognise their
contributions towards nation building under the POSB Save-As-You-Serve initiative.
We continue to offer our customers greater value through our innovative products, services and deals. In October 2016, we launched a “bank and earn” programme which rewards our customers based on their banking relationships with us. Since most of our customers already conduct regular banking transactions with us, this means that they can enjoy monthly cashbacks with POSB Cashback Bonus without doing a lot more.
As an organisation that banks most of Singapore, we recognise the need to invest in our communities and services to prepare ourselves for the future challenges of an ageing population. We have put in place dementia training for our branch staff and equipped them with knowledge on how to engage with customers who display signs of dementia. They are trained to take extra care and exercise patience with customers who may have dementia, and to always show
respect and provide reassurance. Over 1,000 frontline staff have been trained.
Through various programmes done in partnership with North East CDC, IMDA and non-profi t women’s education centre WINGS, we have reached out to seniors in the community to educate them on fi nancial literacy, self-service banking and digital skills. These programmes benefi tted over 800 seniors in the past year.
Title: DBS Annual Report 2016 SIZE: 220mm X 300mm D:17-004 GS1701040 175# GP10B-OLH
DBS AR17_FrontSec_FA_070317-ok.indd 47 08/03/2017 21:13

48 | DBS Annual Report 2016
Compliance and approvalFor the financial year ended 31 December 2016, we have complied:
• with the Banking (Corporate Governance) Regulations 2005 (Banking Regulations), and
• in all material aspects with the principles laid down by the Guidelines on Corporate Governance for Financial Holding Companies, Banks, Direct Insurers, Reinsurers and Captive Insurers which are incorporated in Singapore issued on 3 April 2013, which comprises the Code of Corporate Governance 2012 (Code) and supplementary guidelines and policies added by the Monetary Authority of Singapore (MAS) (collectively referred to as the Guidelines) to cater to the diverse and complex risks undertaken by financial institutions.
We provide a summary disclosure on our compliance with the Guidelines on pages 70 to 73 of this Annual Report.
Contents
48 Governance framework 1. Leadership 2. Controls 3. Culture 4. Accountability to shareholders
64 Remuneration report
70 Summary of disclosures
Governance framework
We have a clearly defined governance framework that promotes transparency, fairness and accountability.
The Board believes that corporate governance principles should be embedded in our corporate culture. Our corporate culture is anchored on (a) competent leadership, (b) effective internal controls, (c) a strong risk culture and (d) accountability to shareholders. Our internal controls cover financial, operational, compliance and technology, as well as risk management policies and systems.
We work closely with our regulators to ensure that our internal governance standards meet their increasing expectations. We are committed to the highest standards of corporate governance, and have been recognised for it. We have won SIAS’ Corporate Governance Award in the Big Cap category four years in a row (2013 to 2016). We are ranked first runner-up in the Singapore Governance and Transparency Index (SGTI) 2016, moving up two spots from the year before. The SGTI 2016 has been updated based on guidelines from the Code and G20/ OECD Principles of Corporate Governance.
Corporate governance
Key features of our Board • Separation of the role of Chairman and
Chief Executive Officer (CEO)• Other than the CEO, none of the other
Directors is a former or current employee of DBSH or its subsidiaries
• Chairpersons of the Board and all Board committees are Independent Directors
• Remuneration of Non-Executive Directors (including the Chairman) does not include any variable component
22
1
22
Director’s length of service No. of years (Y)
4Y 5Y 6Y 7Y 8Y
• To stimulate fresh thinking, external experts are regularly invited to the annual Board strategy offsite and to conduct Directors’ training sessions
Independence
Independent Non-Executive Directors (including Chairman)
Non-Independent& Non-Executive Director
Executive Director/CEO
67%
11%
22%
Gender diversity
Male Directors
Female Directors
78%
22%
Where to find key information on each Director?In this Annual Report:• Pages 58 to 59 – Directors’
independence status, appointment dates, meeting attendance and remuneration details
• Pages 194 to 198 – Directors’ length of directorship, academic and professional qualifications and present and past directorships
At our website (www.dbs.com): Directors’ biodata
Age group of our Directors
2
1
3
2
1
50-54 55-59 60-64 65-69 > 70
DBS corporate governance framework
Competent leadership
Effective internal controls
Strong risk culture
Accountability to shareholders

| 49
1 Leadership
Board compositionThe Board has adopted a diversity policy, which recognises the importance of having an appropriate balance of industry knowledge, skills, experience, professional qualifications, gender and nationalities to build an effective and cohesive board. In particular, the Board has set an objective of having female representation.
Board members have a broad range of experience and deep industry expertise. We have a good balance between continuity and fresh perspectives on the Board. We have a high proportion of Independent Non-Executive Directors (six out of nine directors). The size and composition of the Board is appropriate given the current size and geographic footprint of DBS’ operations.
Role of the Chairman and the CEOThere is a very positive and constructive working relationship between our Chairman (Mr Peter Seah) and CEO (Mr Piyush Gupta). Our leadership model ensures an appropriate
Mr Peter Seah’s role in our board committees
Chairman• Board Executive Committee• Compensation and Management
Development Committee• Nominating Committee
Member• Audit Committee (AC) • Board Risk Management
Committee (BRMC)
• There are separate chairpersons for the Board committees, which oversee the internal controls and risk management functions, namely the AC (Mr Danny Teoh) and the BRMC (Ms Euleen Goh) respectively
• Chairpersons of the AC and BRMC are Non-Executive and Independent Directors
Role of the Board
• Directs DBS in conduct of its affairs
– Ensures that corporate responsibility and ethical standards underpin the conduct of DBS’ business
• Provides sound leadership to CEO and management
– Sets the strategic vision, direction and long-term goals of DBS
– Ensures that adequate resources are available to meet these objectives
• Bears ultimate responsibility for DBS’:
– Governance – Strategy – Risk management – Financial performance
Securities Investors Association (Singapore) (SIAS) Investors’ Choice Awards 2016• Corporate Governance Award• Board Diversity Award (Merit) • Most Transparent Company – Financials category – Golden Circle Award
Singapore Governance and Transparency Index 2016• First runner-up
Singapore Corporate Awards 2016• Best Annual Report (Silver)
Corporate Governance Asia – Asian Excellence Awards 2016 • Best Corporate Social
Responsibility (CSR)• Best Environmental Responsibility• Best Investor Relations, Singapore
Corporate governance
balance of power, accountability and independence in decision-making.
The CEO heads the Group Executive Committee and the Group Management Committee. He oversees the execution of DBS’ strategy and is responsible for managing the day-to-day operations. The Chairman is responsible for leading the Board and maintaining our corporate governance standards. The Chairman provides clear leadership with respect to DBS’ long-term growth and strategy. He guides the Board through its decision-making process and also ensures that the Board operates effectively as a team.
The Chairman oversees, guides and advises the CEO and senior management. The Chairman maintains open lines of communication with senior management, and acts as a sounding board on strategic and operational matters.
Time commitment of the Chairman’s roleThe role of the Chairman of DBSH requires significant time commitment. Mr Peter Seah
sits on all Board committees. He performs a key role as an ambassador for DBS in our dealings with various stakeholders as well as in ensuring effective communication with our shareholders. Mr Peter Seah regularly represents DBS in official external engagements, and he also sets aside time to attend DBS’ internal events upon the invitation of management.
The Nominating Committee held an ad-hoc meeting to discuss Mr Peter Seah’s ability to commit time to the Board and to DBS generally prior to his appointment as chairman of Singapore Airlines Limited. Before he took on the role as deputy chairman of Singapore Airlines Limited, Mr Peter Seah had stepped down from the boards of CapitaLand Limited and STATS ChipPAC Ltd. He has since also stepped down from the board of StarHub Ltd. The Nominating Committee (other than Mr Peter Seah who recused himself from the decision) agreed that he has sufficient time and bandwidth to discharge his obligations to DBS. The Board (other than Mr Peter Seah who recused himself from the decision) considered the matter and agreed with the Nominating Committee’s view.

50 | DBS Annual Report 2016
• Establish a framework for risks to be assessed and managed
• Review management performance• Determine DBS’ values and standards
(including ethical standards) and ensure that obligations to its stakeholders are understood and met
• Develop succession plans for the Board and CEO
• Consider sustainability issues (including environmental and social factors) as part of DBS’ strategy
Board’s key areas of focus• Review DBS’ strategic and business plans• Monitor the responsibilities delegated
to the Board committees to ensure proper and effective oversight and control of DBS’ activities
Board meetings and activitiesWe have a highly engaged Board with diverse perspectives. Board and Board committee meetings are held regularly to discuss key topics such as strategic, governance and operational issues.
Before meeting• To facilitate meaningful participation, all
Board and Board committee meetings are planned and scheduled well in advance in consultation with the Directors
• The Chairman oversees the setting of the agenda of Board meetings in consultation with the CEO to ensure that there is sufficient information and time to address all agenda items
• The agenda of the Board meetings is carefully thought out and well-managed. At the same time, the agenda allows for flexibility when it is needed
• Directors are provided with complete information related to agenda items in a timely manner. For example, management provides Board members with detailed reports on the Group’s financial and franchise performance prior to the Board meeting
• All materials for Board and Board committee meetings are uploaded onto a secure portal which can be readily accessed on tablet devices provided to the Board members
• When exigencies prevent a Director from attending a Board or Board committee meeting in person, that Director can participate by telephone or video-conference
• Directors have the discretion to engage external advisers
At every meeting• The Chairman promotes open and frank
debates by all Directors at Board meetings• The Board members come well prepared
and engage in robust discussions on key matters pertaining to the Group
• If there are any situations where there is a conflict of interest, the Director in question will recuse him or herself from the discussions and abstain from participating in any Board decision
• Chairperson of each Board committee provides a thorough update on significant matters discussed at the Board committee meetings which are typically scheduled before the quarterly Board meeting
• The CEO gives a complete and comprehensive update on the Group’s business and operations as well as a macro perspective on industry trends and developments
• The Chief Financial Officer (CFO) presents the financial performance and significant financial highlights
• Certain business heads provide an update on their areas of business
• As members of the Group Executive Committee are present at all Board meetings, Directors have the opportunity to discuss specific areas with them and give constructive challenge to ideas
• In compliance with the Banking Act, exposures of DBS Bank Ltd to the individual Directors and their respective related concerns are tabled
• The Board holds a private session for Directors
• External professionals or in-house subject matter experts are also invited to present key topics identified by the Board as well as updates on corporate governance, risk management, capital, tax, accounting, listing and other regulations, which may have an impact on DBS’ affairs
Frequent and effective engagement with the Board• The Board is regularly updated on the
performance and prospects of DBS• Outside of Board meetings, Board
approvals for matters in the ordinary course of business can be obtained through the circulation of written resolutions
• Ad-hoc meetings are held when necessary. There was no ad-hoc Board meeting held in 2016
• The CFO provides the Board with detailed financial performance reports on a monthly basis
• Directors have direct access to senior management and may request from management any additional information to make informed and timely decisions
• Throughout the year, the Directors also have various opportunities to interact with members of the Group Management Committee (for instance at Board hosted dinners)
• Directors have ongoing interactions across various levels, functions and countries within DBS. This allows Directors to have a better understanding of the business and operations of DBS. In addition, some Directors also sit on the Boards of the overseas subsidiaries in the Group; this arrangement gives the Board access to first hand insight on the activities of these subsidiaries
• Directors have separate and independent access to the Group Secretary at all times. The Group Secretary attends all Board meetings and generally assists Directors in the discharge of their duties. The Group Secretary facilitates communication between the Board, its committees and management. The Group Secretary helps with the induction of new Directors. The appointment and removal of the Group Secretary require the approval of the Board

| 51
30%
5%5%10%
15%
15%
20%
Board committees
Delegation by the Board to the Board committeesTo discharge its stewardship and fiduciary obligations more effectively, the Board has delegated authority to various Board committees to enable them to oversee certain specific responsibilities based on clearly defined terms of reference. Any change to the terms of reference for any Board committee requires Board approval.
5 Board committees• Constituted in accordance with
Banking Regulations • Comprises Directors only
Terms of referenceSets out the:• Responsibilities of the Board committee• Conduct of meetings including quorum• Voting requirements• Qualifications for Board committee
membership
Nominating Committee (NC) The NC is chaired by Mr Peter Seah and its members are Ms Euleen Goh, Mr Ho Tian Yee, Mrs Ow Foong Pheng and Mr Danny Teoh.
All NC members are subject to an annual independence assessment as prescribed by the Guidelines and the Banking Regulations. The assessment takes into account the NC members’ business relationships with the Group, relationships with members of management, relationships with DBSH’s substantial shareholder as well as the NC members’ length of service.
Key responsibilities of the NC• Review regularly the composition of the
Board and Board committees• Identify, review and recommend Board
appointments for approval by the Board, taking into account the experience, expertise, knowledge and skills of the candidate and the needs of the Board
• Conduct an evaluation of the performance of the Board, the Board committees and the Directors on an annual basis
• Determine independence of proposed and existing Directors, and assess if each proposed and/or existing Director is a fit and proper person and is qualified for the office of Director
• Exercise oversight of the induction programme and continuous development programme for Board members
• Review and recommend to the Board the re-appointment of any Non-Executive Director having regard to their performance, commitment and ability to contribute to the Board as well as his or her skillset
• Make an annual assessment of whether each Director has sufficient time to discharge his or her responsibilities, taking into consideration multiple board representations and other principal commitments
• Review the Board’s succession plans for Directors, in particular, the Chairman and the CEO
• Review key staff appointments including the CFO and the Chief Risk Officer
Highlights of the NC’s activities are as follows:
Selection criteria and nomination process for DirectorsThe NC leads and has put in place a formal and transparent process for the appointment and re-appointment of Directors to the Board.
The NC oversees a rigorous process for the appointment of Directors. Directors are selected not just for their experience and competencies but also for their fit with DBS. The NC regularly reviews the composition of the Board and Board committees. The NC utilises a skills matrix, which takes into account each Director’s skills and experience, to identify the staffing needs of each Board committee.
Before a new Director is appointed, suitable candidates are identified from various sources. Thereafter, the NC conducts an assessment to:
(i) review the candidate (including qualifications, attributes, capabilities, skills, age, past experience) to determine whether the candidate is fit and proper in accordance with the MAS’ fit and proper guidelines; and (ii) ascertain whether the candidate is independent from DBSH’s substantial shareholder and/or from management and business relationships with DBS.
The NC then interviews the short listed candidates and makes its recommendations to the Board. Upon the appointment of a new Director, the NC will recommend to the Board his or her appointment to the appropriate Board committee(s) after matching the Director’s skillset to the needs of each Board committee.
Board performanceThe NC makes an assessment at least once a year to determine whether the Board and Board committees are performing effectively and identifies steps for improvement.
Board evaluation processThe NC uses a Board evaluation framework to track and analyse Board performance, which includes an appraisal of Directors. The Board evaluation process promotes Board effectiveness by identifying areas for improvement. A well conducted Board evaluation is vital in helping the Board, Board committees and each individual Director to perform to their maximum capability.
The Board engages an independent external evaluator to facilitate the Board evaluation approximately once every three years. The Board believes that an independent external
• In accordance with the requirements of the Guidelines and Banking Regulations, a majority (three out of five members of the NC including the NC Chairperson) are Non-Executive and Independent Directors (INED).
• The NC members who are not INEDs are Mr Ho Tian Yee and Mrs Ow Foong Pheng, who are non-executive directors. Mr Ho and Mrs Ow are considered non-independent by virtue of a substantial shareholder relationship. Mr Ho and Mrs Ow do not have any business or management relationship with DBS.
How the board spent its time in 2016
Strategy
Feedback from the board committees
Financial performance and significant financial updates
Governance
Directors’ training
Business and operations updates, market and competitive landscape review
Board networking and engagement
Corporate governance

52 | DBS Annual Report 2016
evaluator aids the Board by providing an independent perspective on the Board’s performance. It also helps benchmark the Board’s performance against peer boards and shares best practices.
Annual Board evaluation in 2016The NC considered the results and action items from the 2015 Board evaluation and decided to use the same evaluation questionnaire for 2016.
Each Director was asked to complete the questionnaire and submit it directly to the Group Secretary who collated the responses and produced a summary report for the NC. The NC analysed the report and submitted its findings to the Board.
Each Director participated actively, giving honest feedback on issues such as Board composition, succession planning and the quality of information provided to the Board.
The Board discussed the findings of the evaluation and agreed to follow-up on certain items.
Board diversityWe believe that one of the ways to enhance corporate governance is through having an effective and diverse board of directors.
The NC is responsible for implementing and monitoring the diversity policy.
The make-up of our Board reflects diversity of gender, nationality, skills and knowledge. Such diversity will provide a wider range of perspectives, skills and experience, which will allow Board members to better identify possible risks, raise challenging questions and contribute to problem-solving. This will, in turn, enable the Board to better guide and advise management from this broader perspective and contribute to more effective decision-making to assist DBS in achieving its strategic objectives.
As women represent half of our customer base, the Board believes that it is important to have adequate female representation on the Board. Our commitment to diversity has garnered recognition. DBS won the Board Diversity Award at the SIAS Investors’ Choice Awards in 2014 and 2015, and received the Board Diversity Award (Merit) in 2016.
The NC gives due regard to the benefits of all aspects of diversity, including but not limited to those described above, and strives to ensure that the Board is appropriately balanced to support the long-term success of DBS. All Board appointments are based on merit, taking into account the contributions the candidates can bring to the Board to enhance its effectiveness.
Annual review of Directors’ independenceThe NC reviews and determines annually whether each Director is independent. Independence is assessed to comply with the stringent standards required of financial institutions prescribed under the Banking Regulations.
In making its determination, the NC considers whether a Director is:• independent from management and
business relationships; • independent from any substantial
shareholder; and • independent based on length of service
The Independent Directors are Dr Bart Broadman, Ms Euleen Goh, Mr Nihal Kaviratne, Mr Peter Seah, Mr Andre Sekulic and Mr Danny Teoh.
Ms Euleen Goh, Mr Nihal Kaviratne, Mr Peter Seah and Mr Danny Teoh are on the boards of companies that have a banking relationship with DBS, and are also directors of companies in which DBSH’s substantial shareholder, Temasek Holdings (Private) Limited (Temasek) has investments (collectively, Temasek portfolio companies). The NC considers these Directors (i) independent of business relationships as the revenues arising from such relationships
Board committee Composition Members
Nominating Committee (NC)
• Five members: All Non-Executive Directors (NED) • Three out of five members including NC Chairperson
are Non-Executive and Independent Directors (INED)
• Mr Peter Seah (Chairperson)• Ms Euleen Goh• Mr Ho Tian Yee• Mrs Ow Foong Pheng• Mr Danny Teoh
Board Executive Committee(EXCO)
• Three members• Two out of three members including EXCO
Chairperson are INEDs
• Mr Peter Seah (Chairperson)• Mr Piyush Gupta• Ms Euleen Goh
Audit Committee(AC)
• Five members: All NEDs• Four out of five members including AC Chairperson
are INEDs
• Mr Danny Teoh (Chairperson)
• Mr Peter Seah• Mr Nihal Kaviratne• Mrs Ow Foong Pheng • Mr Andre Sekulic
Board Risk ManagementCommittee(BRMC)
• Six members: Five out of six members including BRMC Chairperson are INEDs
• Ms Euleen Goh (Chairperson)
• Mr Peter Seah• Dr Bart Broadman• Mr Ho Tian Yee• Mr Nihal Kaviratne• Mr Danny Teoh
Compensation & Management Development Committee (CMDC)
• Four members: All INEDs including CMDC Chairperson
• Mr Peter Seah (Chairperson) • Dr Bart Broadman • Ms Euleen Goh• Mr Andre Sekulic

| 53
are not material; and (ii) independent of Temasek as their appointments on the boards of Temasek portfolio companies are non-executive in nature and they are not involved in the day-to-day conduct of the businesses of the Temasek portfolio companies. In addition, none of these Directors sits on any of the boards of the Temasek portfolio companies as a representative of Temasek and they do not take instructions from Temasek in acting as director.
Mr Ho Tian Yee, who is the Chairman of Fullerton Fund Management Company. Ltd (“Fullerton”), was appointed as interim CEO of Fullerton in November 2016 after its then CEO left. As Fullerton is a wholly-owned subsidiary of Temasek, Mr Ho Tian Yee is considered not independent of Temasek while he is acting as the interim CEO of Fullerton. However, he is considered independent of management and business relationships with the Company. The NC will re-assess the independence status of Mr Ho when he ceases to be interim CEO of Fullerton.
Mrs Ow Foong Pheng, who is the Permanent Secretary for the Ministry of National Development, Singapore, is considered not independent of Temasek as the Singapore government is its ultimate owner. However, Mrs Ow Foong Pheng is considered independent of management and business relationships with the Company.
Dr Bart Broadman, who was appointed on 17 December 2008, would have served on the Board for nine years by 17 December 2017 and would be deemed non-independent under the Banking Regulations if he continues serving as a DBS director beyond the nine years.
Ms Euleen Goh, who was appointed on 1 December 2008, would have served on the Board as a non-executive independent director for nine years by 1 December 2017 and would be deemed non-independent under the Banking Regulations if she continues serving as a DBS director beyond the nine years.
Directors’ trainingThe NC exercises oversight on the training of Directors including induction for new Directors and continuous development programme for all Directors.
Induction for new DirectorsUpon appointment, a new Director receives a letter of appointment and a guidebook on Director’s duties, responsibilities, and disclosure obligations as a Director of a financial institution. The new Director goes through a comprehensive induction programme. The new Director is introduced to the Group’s senior management and briefed on the Group’s activities (business, operations and governance practices, among others). The new Director also receives briefings on his/her
key disclosure duties and statutory obligations. The Group encourages first-time Directors to attend the Singapore Institute of Directors’ “Listed Companies Directorships” programme.
Continuous development programme for all DirectorsThe NC oversees the continuous development programme. It monitors the frequency and quality of the training sessions, which are conducted either by external professionals or management. The NC selects topics which are relevant to the Group’s activities. Board members also contribute by highlighting areas of interests and possible topics. In 2016, there were 3 training sessions: (i) a briefing on cyber security, (ii) a talk on the technology mega-trends and the future of Fintech, and (iii) a training session on risk stress testing.
Terms of appointment of DirectorsThe NC reviews and recommends to the Board the tenure of each Non-Executive Director.
Each Non-Executive Director is appointed for a three-year term. Prior to the end of each three-year term, the NC considers whether to re-appoint the Non-Executive Director for an additional term. Each member of the NC recuses him/herself from deliberations on his/her re-appointment.
Rotation and re-election of DirectorsThe NC reviews and recommends to the Board the rotation and re-election of Directors at the AGM.
One-third of Directors who are longest-serving are required to retire from office every year at the AGM. Based on this rotation process, each Director is required to submit himself or herself for re-election by shareholders at least once every three years.
Where an incumbent Director is required to retire from office, the NC reviews the composition of the Board and decides whether to recommend that Director for re-election taking into account factors such as the Director’s attendance, participation, contribution and competing time commitments. Dr Bart Broadman, Mr Ho Tian Yee and Mrs Ow Foong Pheng will be retiring by rotation at the AGM to be held on 27 April 2017 (2017 AGM). At the recommendation of the NC and as approved by the Board, they will be seeking re-election as Director at the 2017 AGM.
Directors’ time commitmentThe NC conducts a review of the time commitment of each Director on an ongoing basis.
The NC has implemented guidelines and a process to assess each Director’s ability to commit time to DBS’ affairs. The guidelines consider the number of other board and committee memberships a Director holds,
In accordance with the requirements of the Guidelines and Banking Regulations, a majority (two out of three members of the EXCO including the EXCO Chairperson) are Non-Executive and Independent Directors.
as well as size and complexity of the companies in which s/he is a board member. Additionally, each Director is required to complete a self-assessment of his/her time commitments on annual basis. While the Board has not set a maximum number of listed company board representations a Director may hold, all Directors appreciate the high level of commitment required as a Director. All Directors have met the requirements under the NC’s guidelines. The Board is satisfied that each Director has committed sufficient time to DBS and has contributed meaningfully to DBS.
The meeting attendance records of all Directors as well as their list of directorships are fully disclosed in our Annual Report.
Alternate DirectorsDBS has no alternate directors on its Board.
Board Executive Committee (EXCO) The EXCO is chaired by Mr Peter Seah and its members are Ms Euleen Goh and Mr Piyush Gupta.
Key responsibilities of the EXCO• Review and provide recommendations
on matters that would require Board approval, including:
– acquisitions and divestments exceeding certain material limits
– delegation of authority stipulated by the Group Approving Authority
– weak credit cases• Approve certain matters specifically
delegated by the Board such as acquisitions and divestments up to a certain material limit, credit transactions, investments, capital expenditure and expenses that exceed the limits that can be authorised by the CEO
Highlights of the EXCO’s activities are as follows:
Key matters reviewed by EXCO in 2016The EXCO assists the Board to enhance the business strategies and strengthen core competencies of DBS. The EXCO meets frequently (11 meetings in 2016) and is able to offer greater responsiveness in the decision-making process of DBS.
Corporate governance

54 | DBS Annual Report 2016
In 2016, the EXCO reviewed proposed divestments and investments, and matters related to capital planning and expenditure as well as corporate actions. It also reviewed weak credit cases every quarter.
Audit Committee (AC) The AC is chaired by Mr Danny Teoh and its members are Mr Nihal Kaviratne, Mr Peter Seah, Mrs Ow Foong Pheng and Mr Andre Sekulic.
Mr Teoh possesses an accounting qualification and was formerly the managing partner of KPMG, Singapore. All members of the AC are Non-Executive Directors, and have recent and relevant accounting or related financial management expertise or experience.
Key responsibilities of the AC Financial reporting• Monitor the financial reporting process
and ensure the integrity of the Group’s consolidated financial statements
• Review the Group’s consolidated financial statements and any announcements relating to the Group’s financial performance prior to submission to the Board
• Review the significant financial reporting issues and judgements so as to ensure the integrity of the consolidated financial statements of the Group
• Ensure that the consolidated financial statements of the Group are prepared in accordance with Singapore Financial Reporting Standards
possible improprieties in matters of financial reporting or other matters and to ensure that arrangements are also in place for such concerns to be raised and independently investigated and for appropriate follow-up action to be taken
• Approve changes to the Group Disclosure Policy
Internal audit• Review the adequacy and effectiveness of
the Group’s internal audit function (Group Audit) and processes, as well as ensure that Group Audit is adequately resourced and set up to carry out its functions, including approving its budget
• Oversee Group Audit• Review Group Audit’s plans, the scope
and results of audits, and effectiveness of Group Audit
• Approve the hiring, removal, resignation, evaluation and compensation of Head of Group Audit
External auditor• Determine the criteria for selecting,
monitoring and assessing the external auditor. Make recommendations to the Board on the proposals to shareholders on the appointment, re-appointment and removal of the external auditor and approve the remuneration and terms of engagement of the external auditor
• Review the scope and results of the external audits and the independence and objectivity of the external auditor, and ensure that the external auditor promptly communicates to the AC any information regarding internal control weaknesses or deficiencies, and that significant findings and observations regarding weaknesses are promptly rectified
• Review the assistance given by management to the external auditor
Related party transactions• Review all material related party
transactions (including interested person transactions) and keep the Board informed of such transactions, and the findings and conclusions from its review
Highlights of the AC’s activities are as follows:
Oversight of financial reporting and other key mattersThe AC performed quarterly reviews of consolidated financial statements and made recommendations to the Board for approval. The CEO and CFO provided the AC with a letter of representation attesting to the integrity of the quarterly financial statements. The AC reviewed the Group’s audited consolidated financial statements and discussed with management and the external auditor the significant matters which involved management judgment (see Table 1 below).
The AC is of the view that the Group’s consolidated financial statements for 2016 are fairly presented in conformity with relevant Singapore Financial Reporting Standards in all material aspects.
The Board has also received communication from the external auditor that it has nothing to report with reference to any financial or non-financial information in the Annual Report as defined in Singapore Standard of Auditing 720.
The AC reviewed and approved the annual audit plan and the legal and compliance plans.
The AC performed quarterly reviews of reports from Group Audit, Group Legal and Compliance. Key risks concerning legal
Table 1 Significant matters
How the AC reviewed these matters
Allowance for loans and advances
The AC reviewed the significant non-performing and weak credit exposures periodically and considered management’s judgments, assumptions and methodologies used in the determination of the level of specific and general allowances required.
Goodwill impairment assessment
The AC reviewed the methodology and key assumptions, including the macroeconomic outlook and other key drivers of cash flow projections, used in the determination of the value-in-use of cash generating units. It also assessed the sensitivities of the forecasts to reasonably possible changes in the valuation parameters.
Valuation matters The AC reviewed the quarterly movements in valuation reserves and the fair value of level 3 financial instruments for reasonableness and considered the continued appropriateness of the Group’s valuation methodology in light of industry developments.
• In accordance with the requirements of the Guidelines and Banking Regulations, a majority (four out of the five members of the AC including the AC Chairperson) are Non-Executive and Independent Directors (INED).
• The only AC member who is not an INED is Mrs Ow Foong Pheng, who is a Non-Executive Director. Mrs Ow is considered non-independent by virtue of a substantial shareholder relationship, but she does not have any business or management relationship with DBS.
Internal controls• Review the adequacy and effectiveness
of internal controls, such as financial, operational, compliance and information technology controls, as well as accounting policies and systems
• Review the policy and arrangements by which DBS staff and any other persons may, in confidence, raise concerns about
| 55
or compliance matters, and actions taken (including policy and training), are tabled to the AC, which updates the Board as necessary.
The AC has the authority to investigate any matter within its terms of reference, and has full access to and cooperation by management.
Oversight of Group Audit The AC has direct oversight of Group Audit. Please refer to the section on ‘Internal Controls’ for details on Group Audit’s key responsibilities and processes.
The AC assessed the effectiveness of Group Audit in compliance with Paragraph 12.4(c) of the Code. The AC is of the view that Group Audit has performed well. It understands the risks that the Group faces and has aligned its work to review these risks.
There is at least one scheduled private session annually for the Head of Group Audit to meet the AC. The chair of the AC meets the Head of Group Audit regularly to discuss its plan, current work, key findings and other significant matters.
Reviewing independence and objectivity of external auditorThe AC makes recommendations to the Board for the appointment, re-appointment and dismissal of the external auditor including the remuneration and terms of engagement. Upon Board approval, the re-appointment of the external auditor is subject to shareholder approval at the AGM.
The AC has unfettered access to the external auditor. During the financial year, separate sessions were held for the AC to meet with the external auditor without the presence of management at each AC meeting to discuss matters that might have to be raised privately.
The Group has complied with Rule 712 and Rule 715 of the SGX Listing Rules in relation to its external auditor. The total fees due to the Group’s external auditor, PricewaterhouseCoopers LLP (PwC), for the financial year ended 31 December 2016, and the breakdown of the fees for audit and non-audit services respectively are set out as follows:
The AC reviewed the non-audit services provided by the external auditor during the financial year and the associated fees. The AC is satisfied that the independence and objectivity of the external auditor has not been impaired by the provision of those services. The external auditor has provided a confirmation of their independence to the AC. At the recommendation of the AC and as approved by the Board, the re-appointment of the external auditor is subject to the shareholders’ approval at the 2017 AGM.
Keeping updated on relevant informationThe AC members are regularly kept updated on changes to accounting standards and issues related to financial reporting through quarterly meetings with Group Finance, Group Audit, and internal audit bulletins.
Board Risk Management Committee (BRMC) The BRMC is chaired by Ms Euleen Goh and its members are Dr Bart Broadman, Mr Ho Tian Yee, Mr Nihal Kaviratne, Mr Peter Seah and Mr Danny Teoh.
All BRMC members are appropriately qualified to discharge their responsibilities, and have the relevant technical financial expertise in risk disciplines or businesses.
• Discuss large risk events and subsequent remedial action plans
• Monitor market developments, such as macro-economic, credit, industry, country risk and stress tests related to these developments
• Approve the Group’s overall and specific risk governance frameworks
• Have direct oversight of the Chief Risk Officer
• Review (in parallel with the AC) the adequacy and effectiveness of the Group’s internal control framework
• Approve risk models which are used for capital computation and monitor the performance of previously approved models
• Oversee an independent group-wide risk management system and adequacy of resources to monitor risks
• Exercise oversight of the Internal Capital Adequacy Assessment Process (ICAAP) including approval of stress scenarios and commensurate results for capital, risk-weighted assets, profit and loss and liquidity
• Approve the Business Continuity Management attestation and Group-wide Recovery Plan
Highlights of the BRMC’s activities are as follows:
Reviewing the risk landscapeThe risk dashboard informs DBS of all major risk positions and risk developments. During discussions, the BRMC monitored the global economic environment and, in particular, paid close attention to developments which could have material consequences for the key Asian countries where DBS operates. The BRMC also provided guidance, where appropriate, to management. The BRMC considered vulnerabilities such as the global economic outlook, political landscape, liquidity tightening, risk of rising interest rates and currency volatility as well as the outlook on commodity prices, all of which could impact DBS’ strategy and portfolios in these countries.
Through the course of 2016, the BRMC discussed the findings and the impact arising from scenario analyses and portfolio reviews conducted on certain countries and specific sectors. For example: • the downward trend in global economic
growth forecast and the effect of Brexit• China hard landing and consequences from
state-owned enterprise restructuring• possibility of US interest rate hike and the
contagion effect on emerging markets• weakening of RMB and its effect on our
clients’ RMB derivatives portfolio• headwind faced in real estate such as both
retail and industrial properties in Singapore• weak demand in the shipping sector
and challenges faced by the contracting services sector
Fees relating to PwC services for 2016 SGD m
For Audit and Audit-Related Services
For Non-Audit Services
7.7
1.7
Total 9.4
• Five out of six members (including the BRMC Chairperson) are Non-Executive and Independent Directors (INED)
• The number of INEDs exceeds the requirements of the Guidelines and the Banking Regulations
• The only BRMC member who is not an INED is Mr Ho Tian Yee, who is a Non-Executive Director. Mr Ho is considered non-independent by virtue of a substantial shareholder relationship, but he does not have any business or management relationship with DBS
Corporate governance
Key responsibilities of the BRMC• Guide the development of and recommend
for Board approval the risk appetite for various types of risk and exercise oversight on how this is operationalised into individual risk appetite limits
• Monitor risk exposures and profile against risk limits and risk strategy in accordance with approved risk appetite and/or guidelines
• Review the risk dashboard to keep track of major risk positions and risk developments
• Monitor the quarterly portfolio reviews of total exposures as well as large exposures and asset quality

56 | DBS Annual Report 2016
The BRMC also reviewed management’s assessment of the impact of a prolonged period of low commodity prices (such as oil, coal, steel and non-ferrous metals) on our commodity customers and portfolios which included the oil and gas support services segment. It was kept informed of the utilisation of market risk limits for commercial banking as well as the trading books and the liquidity risk profile of the Group. In its review of key operational risk profiles and among other updates, the BRMC was advised on the financial crime and cyber security environment and efforts made to address these risks.
The scenario analyses are in addition to the review of various stress testing results required by the regulators and under ICAAP. The BRMC also approved and monitored the performance of various risk models. The BRMC received regular updates on risk appetite and economic capital utilisation. It spent some time during 2016 to deliberate on the calibration of economic capital allocation to the various units and across the different types of risk. The BRMC was apprised of regulatory feedback and developments such as approaches for risk models and capital computation, Basel 3.5 and Qualitative Impact Studies results.
Please refer to the section on ‘Risk Management’ in this Annual Report for more information on the BRMC’s activities.
Compensation and Management Development Committee (CMDC) The CMDC is chaired by Mr Peter Seah and its members are Dr Bart Broadman, Ms Euleen Goh and Mr Andre Sekulic.
The CMDC has direct access to senior management and works closely with the BRMC and the AC when performing its role. Dr Bart Broadman, Ms Euleen Goh and Mr Peter Seah are also members of the BRMC while Mr Peter Seah and Mr Andre Sekulic are members of the AC. As a result of their membership in other Board committees, the members of the CMDC are able to make strategic remuneration decisions in an informed and holistic manner.
The CMDC reviews and recommends a framework to the Board for determining the remuneration of Non-Executive Directors, including the Chairman.
The remuneration of Non-Executive Directors, including the Chairman, has been benchmarked against global and local financial institutions. Non-Executive Directors will receive 70% of their fees in cash and the remaining 30% in share awards. The share awards are not subject to a vesting period, but are subject to a selling moratorium whereby each Non-Executive Director is required to hold the equivalent of one year’s basic retainer fees for his or her tenure as a Director and for one year after the date he or she steps down. The fair value of share grants to the Non-Executive Directors are based on the volume-weighted average price of the ordinary shares of DBSH over the 10 trading days immediately following the AGM. The actual number of ordinary shares to be awarded are rounded down to the nearest share, and any residual balance will be paid in cash. Other than these share awards, the Non-Executive Directors did not receive and are not entitled to receive any other share incentives or securities pursuant to any of DBSH’s share plans during the financial year.
There is no change to the annual fee structure for the Board for 2016 from the fee structure in 2015. As per previous years, remuneration of Non-Executive Directors does not include any variable component. Table 2 at page 57 sets out the proposed annual fee structure for the Non-Executive Directors for 2016. Shareholders are entitled to vote on the remuneration of Non-Executive Directors at the 2017 AGM.
In 2016 there was one employee of DBS Bank Ltd, Ms Lesley Teoh, who is an immediate family member (daughter) of a Director, Mr Danny Teoh. Ms Lesley Teoh’s remuneration for 2016 falls within the band of SGD 50,000 to 100,000. Mr Teoh is not involved in the determination of his family member’s remuneration. Apart from Ms Lesley Teoh, none of the Group’s employees was an immediate family member of a Director in 2016.
All CMDC members (including the CMDC Chairperson) are Non-Executive and Independent Directors (INED). The number of INEDs exceeds the requirements of the Guidelines and Banking Regulations.
Key responsibilities of the CMDC• Oversee the governance of DBS’
remuneration policy (including design, implementation and ongoing review) and the annual bonus pool (Board endorsement also required) in accordance with the corporate governance practices as stipulated under the Guidelines and the Banking Regulations
• Oversee the remuneration of senior executives, including reviewing and approving the remuneration of the Executive Director/CEO
• Oversee DBS’ principles and framework of compensation to ensure alignment with prudent risk-taking principles (deferral mechanism is adequate as a risk management process) in order to build a sustainable business in the long term
• Ensure alignment between reward and the Group Talent Management initiatives with particular focus on attraction and retention of talent including current and future leaders of DBS
• Oversee management development and succession planning for management
• Oversee plans to deepen core competencies, bench strength and leadership capabilities of management
• Oversee talent development and talent pipeline
Highlights of the CMDC’s activities are as follows:
Group remuneration policy and annual variable pay pool
Please refer to the section on ‘Remuneration Report’ for details on remuneration of the CEO and on DBS’ remuneration strategy.
The CMDC reviews and approves DBS’ remuneration policy and the annual variable pay pool which are also endorsed at the Board level.
The CMDC provides oversight of the remuneration of the CEO, senior executives and control functions in line with the Financial Stability Board’s guidelines. The CMDC also reviews cases where total remuneration exceeds a pre-defined threshold, or where a deferral mechanism is implemented as a risk control process.
Remuneration of Non-Executive Directors
Please refer to pages 58 to 59 of this Annual Report for details of remuneration of each Non-Executive Director (including the Chairman) for 2016.

| 57
Table 2 Annual fee structure for 2016
SGD
Basic annual retainer fees
Board 80,000
Additional Chairman fees for:
Board 1,350,000
Audit Committee 75,000
Board Risk Management Committee 75,000
Compensation and Management Development Committee 65,000
Executive Committee 75,000
Nominating Committee 35,000
Additional committee member fees for:
Audit Committee 45,000
Board Risk Management Committee 45,000
Compensation and Management Development Committee 35,000
Executive Committee 45,000
Nominating Committee 20,000
Group Approving Authority An integral part of our corporate governance framework is the Group Approving Authority (GAA).
The Board’s responsibilities are well defined in the GAA. The Board is the decision-making body for matters with significant impact to DBS as a whole; these include matters with strategic, financial or reputational implications or consequences. The specific matters that require board approval under the GAA includes:
• Group’s annual and interim financial statements
• Acquisitions and divestments exceeding certain material limits
• Group’s annual budget • Capital expenditures and expenses
exceeding certain material limits • Capital-related matters including capital
adequacy objectives, capital structure, capital issuance and redemption
Scope of delegation of authority in the GAA
Board
Board committees Chairman CEO
• Dividend policy • Risk strategy and risk appetite
The Board approves the GAA and any change to it. The GAA ensures that appropriate controls and decision-making are consistently applied throughout DBS. The GAA covers internal authority only, and does not override any specific provisions arising from statutory, regulatory, exchange listing requirements, or the DBSH Constitution. It is applied group-wide.
The GAA is regularly reviewed and updated to accommodate changes in the scope and activities of DBS’ business and operations.
Annual Board strategy offsite Each year, the Board and our senior executives attend a four-day strategy offsite held in one of our markets. In 2016, the Board strategy offsite was held in India.
Main objectives of our 2016 annual Board strategy offsite • Opportunity for the Board to focus on
DBS’ long-term strategy apart from the regular agenda at the quarterly Board meetings
• Dynamic and in-depth strategic discussion to promote deeper understanding of our business environment and our operations, and refine our strategy
• Engagements with our stakeholders in host country
– Regulators – Media – Customers, including CEOs and CFOs
of our corporate clients in India – Staff in local franchise, including the
new technology hub in Hyderabad
Strategic discussions• Long-term strategy including progress
review, refinements based on external developments and competitive analysis, as well as validation against risk appetite and capital availability
• Digitalisation of the bank across the business units, support units and technology, including the value created
• Strategy for our India business, including strategic partnerships with target ecosystems
• Outlook and insights on India, including political and economic developments
Corporate governance
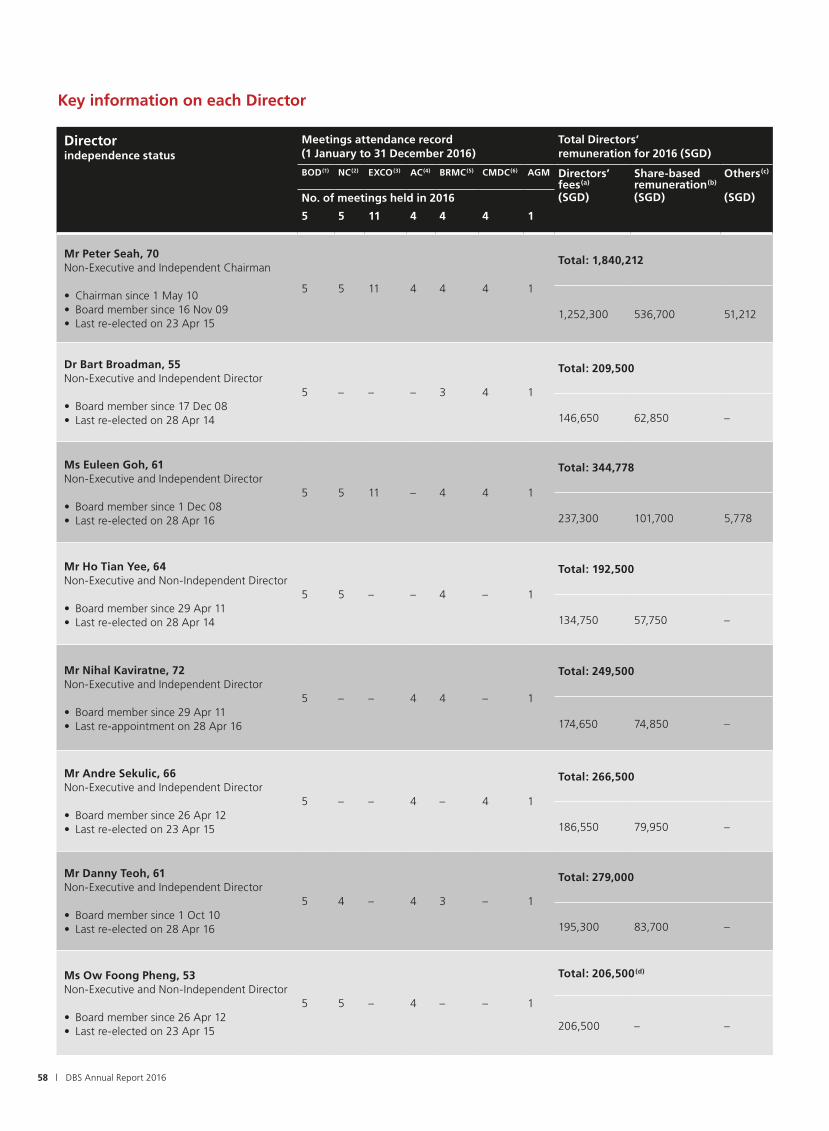
58 | DBS Annual Report 2016
Directorindependence status
Meetings attendance record(1 January to 31 December 2016)
Total Directors’ remuneration for 2016 (SGD)
BOD(1) NC(2) EXCO(3) AC(4) BRMC(5) CMDC(6) AGM Directors’ fees(a)
(SGD)
Share-based remuneration(b)
(SGD)
Others(c)
(SGD)No. of meetings held in 2016
5 5 11 4 4 4 1
Mr Peter Seah, 70 Non-Executive and Independent Chairman
• Chairman since 1 May 10• Board member since 16 Nov 09• Last re-elected on 23 Apr 15
5 5 11 4 4 4 1
Total: 1,840,212
1,252,300 536,700 51,212
Dr Bart Broadman, 55Non-Executive and Independent Director
• Board member since 17 Dec 08 • Last re-elected on 28 Apr 14
5 – – – 3 4 1
Total: 209,500
146,650 62,850 –
Ms Euleen Goh, 61Non-Executive and Independent Director
• Board member since 1 Dec 08 • Last re-elected on 28 Apr 16
5 5 11 – 4 4 1
Total: 344,778
237,300 101,700 5,778
Mr Ho Tian Yee, 64Non-Executive and Non-Independent Director
• Board member since 29 Apr 11 • Last re-elected on 28 Apr 14
5 5 – – 4 – 1
Total: 192,500
134,750 57,750 –
Mr Nihal Kaviratne, 72 Non-Executive and Independent Director
• Board member since 29 Apr 11 • Last re-appointment on 28 Apr 16
5 – – 4 4 – 1
Total: 249,500
174,650 74,850 –
Mr Andre Sekulic, 66Non-Executive and Independent Director
• Board member since 26 Apr 12 • Last re-elected on 23 Apr 15
5 – – 4 – 4 1
Total: 266,500
186,550 79,950 –
Mr Danny Teoh, 61Non-Executive and Independent Director
• Board member since 1 Oct 10 • Last re-elected on 28 Apr 16
5 4 – 4 3 – 1
Total: 279,000
195,300 83,700 –
Ms Ow Foong Pheng, 53Non-Executive and Non-Independent Director
• Board member since 26 Apr 12 • Last re-elected on 23 Apr 15
5 5 – 4 – – 1
Total: 206,500(d)
206,500 – –
Key information on each Director

| 59
Directorindependence status
Meetings attendance record(1 January to 31 December 2016)
Total Directors’ remuneration for 2016 (SGD)
BOD(1) NC(2) EXCO(3) AC(4) BRMC(5) CMDC(6) AGM Directors’ fees(a)
(SGD)
Share-based remuneration(b)
(SGD)
Others(c)
(SGD)No. of meetings held in 2016
5 5 11 4 4 4 1
Mr Piyush Gupta, 57Executive Director/CEO
• Board member since 9 Nov 09 • Last re-elected on 28 Apr 16
5 5# 11 4# 4# 4# 1Please refer to the Remuneration Report on page 69 of this Annual Report for details on the CEO’s compensation
2 Controls
Board’s commentary on adequacy and effectiveness of internal controls The Board has received assurance from the CEO and CFO that, as at 31 December 2016: (a) the Group’s financial records have been
properly maintained, and the financial statements give a true and fair view of DBS Group’s operations and finances; and
(b) the Group’s risk management and internal
control systems were adequate and effective to address financial, operational, compliance and information technology risks which the Group considers relevant and material to its operations.
Based on the internal controls established and maintained by the Group, work performed by internal and external auditors, reviews performed by management and various Board Committees as well as the said CEO and CFO assurance, the Board, with the concurrence of the AC, is of the opinion that the Group’s internal controls and risk management systems were adequate and effective as at 31 December 2016 to address financial, operational, compliance risks and information technology risks which the Group considers relevant and material to its operations.
The Board notes that the internal controls and risk management systems provide reasonable, but not absolute, assurance that the Group will not be affected by any event that could be reasonably foreseen as it strives to achieve its business objectives. In this regard, the Board also notes that no system can provide absolute assurance against the occurrence of material errors, poor judgment in decision-making, human error, fraud or other irregularities.
Internal controls framework Our internal controls framework covers financial, operational, compliance and information technology controls, as well as risk management policies and systems. The Board, supported by the AC and BRMC, oversees the Group’s system of internal controls and risk management. DBS has three lines of defence when it comes to risk taking where each line of defence has a clear responsibility.
• Appointment Dates# Mr Gupta attended these meetings at the invitation of the respective committees
(1) Board of Directors (BOD)(2) Nominating Committee (NC)(3) Board Executive Committee (EXCO)(4) Audit Committee (AC)(5) Board Risk Management Committee (BRMC)(6) Compensation and Management Development Committee (CMDC)
(a) Fees payable in cash, in 2017, for being a Director in 2016. This is 70% of each Director’s total remuneration and is subject to shareholder approval at the 2017 AGM
(b) This is 30% of each Director’s total remuneration and shall be granted in the form of DBSH’s ordinary shares. The actual number of DBSH’s ordinary shares to be awarded will be rounded down to the nearest share, and any residual balance will be paid in cash. This is subject to shareholder approval at the 2017 AGM
(c) Represents non-cash component and comprises (i) for Mr Peter Seah: car and driver, and (ii) for Ms Euleen Goh: carpark charges (d) Director’s remuneration payable to Mrs Ow Foong Pheng will be paid fully in cash to a government agency, the Directorship & Consultancy
Appointments Council
(Note: Directors are also paid attendance fees for Board and Board committee meetings, as well as for attending the AGM and the annual Board offsite)
Board CEO Senior Management Provides oversight of the 3 lines of defence
First line of defence
Second line of defence
Third line of defence
Responsibility Strategy, performance and risk management
Policy and monitoring
Independent assurance
Function Business units, countries and support units
Corporate oversight and control functions
Group audit
Key activities Identification and management of risk in the businesses
Framework, risk oversight and reporting
Independent challenge and review of adequacy and effectiveness of processes and controls
Corporate governance

60 | DBS Annual Report 2016
Working closely with the support units, our business units are our first line of defence for risk. This includes identification and management of risks inherent in their businesses/countries and ensuring that we remain within approved boundaries of our risk appetite and policies.
Corporate oversight and control functions such as Risk Management Group (RMG), Group Legal and Compliance and parts of Group Technology and Group Finance form the second line of defence. They are responsible for design and maintenance of the internal control frameworks covering financial, operational, compliance and information technology controls as well as risk management policies and systems. In addition, RMG is responsible for identifying individual and portfolio risk, approving transactions and trades and ensuring that they are within approved limits, and monitoring and reporting on the portfolio. These are done in view of current and future potential developments, and evaluated through stress testing.
Group Audit forms the third line of defence. It provides an independent assessment and assurance on the reliability, adequacy and effectiveness of our system of internal controls, risk management procedures, governance framework and processes.
Assessing the effectiveness of internal controlsDBS has a risk management process that requires all units to perform a half-yearly Risk and Control Self Assessment (RCSA) to assess the effectiveness of their internal controls. In addition, all units of the Group are required to submit quarterly attestations on their controls relating to the financial reporting process, and annual attestations on their compliance with the overall internal controls framework. Based on the RCSA and the quarterly and annual attestations, the CEO and CFO provide an annual attestation to the AC relating to adequacy and effectiveness of DBS’ risk management and internal control systems. Group Audit performs regular independent reviews to provide assurance on the adequacy and effectiveness of DBS’ internal controls on risk management, control and governance processes. The overall adequacy and effectiveness of DBS’ internal controls framework is reviewed by the AC and BRMC.
Group audit
Key responsibilities and processesGroup Audit is independent of the activities it audits. Its objectives, scope of authority and responsibilities are defined in the Audit
Charter, which is approved by the AC. Group Audit reports functionally to the Chairperson of the AC and administratively to the CEO.
Group Audit’s responsibilities include:
(i) Evaluating the reliability, adequacy and effectiveness of the Group’s risk management and internal controls systems, including whether there is prompt and accurate recording of transactions and proper safeguarding of assets;
(ii) Providing an objective and independent assessment of the Group’s credit portfolio quality, the execution of approved credit portfolio strategies and control standards relating to credit management processes;
(iii) Reviewing whether DBS complies with laws and regulations and adheres to established policies; and
(iv) Reviewing whether management is taking appropriate steps to address control deficiencies
Group Audit adopts a risk-based approach in its auditing activities. An annual audit plan is developed using a structured risk and control assessment framework through which the inherent risk and control effectiveness of each auditable entity in DBS Group is assessed. The assessment also covers risks arising from new lines of business or new products. Audit projects are planned based on the results of the assessment, with priority given to auditing higher risk areas and as required by regulators.
Group Audit has unfettered access to the AC, the Board and management, as well as the right to seek information and explanation. Group Audit has an organisational and strategic alignment to the Group. The head of Group Audit has a seat in the Group Management Committee, and attends all the business reviews and strategic planning forums. In each of the five key locations outside Singapore, the country head of audit also sits in the country management team.
Group Audit adheres to the Code of Conduct and the Code of Ethics established by the Institute of Internal Auditors (IIA). It is also guided by the Mission Statement in the Audit Charter and has aligned its practices with the latest International Professional Practices Framework released in July 2015 by IIA. Group Audit’s effectiveness is measured with reference to the IIA’s Ten Core Principles for the professional practice of internal auditing.
Audit reports containing identified issues and corrective action plans are reported to the AC and senior management. Progress of the corrective action plans is monitored and past due action plans are included in regular reports to the senior management and the AC.
Group Audit apprises the regulators and external auditors of all relevant audit matters. It works closely with the external auditor to coordinate audit efforts.
Quality assurance and key developmentsIn line with leading practices, Group Audit has a quality assurance and improvement programme (QAIP) that covers all aspects of its audit activity and conforms to the International Standards for the Professional Practice of Internal Auditing. As part of our QAIP programme, external quality assessment reviews are carried out at least once every five years by qualified professionals from an external organisation. Internal quality assurance reviews were conducted quarterly by independent assessor KPMG in 2015 and 2016.
Group Audit has leveraged extensively on the use of data, technology and automation to provide greater insights and timely warnings on emerging risks. In 2016, Group Audit operationalised its Future of Auditing roadmap through the industrialisation of computer-assisted auditing techniques and the continuous auditing (CA) approach – the application of automated audit test scripts to perform control and risk assessments automatically on a frequent basis. To date, Group Audit has amassed significant number of CA test scripts to be used across functional and location audits. These automated test scripts have been made available to key business and support units for them to conduct self-assessments – as part of a group-wide effort to integrate risk and control governance across the three lines of defence.
Group Audit has closely collaborated with Singapore’s A*Star Institute of Infocomm Research (I2R) in developing predictive models to anticipate emerging risks in areas such as branch risk profiling, rogue trading analytics, and credit early warning through network effects. Group Audit’s trading analytics model, based on machine learning techniques, has won two awards in 2016: (a) the engineering award by the Institute of Engineers Singapore (IES) and (b) the ASEAN Outstanding Engineering Achievements Award.
Group Audit has further invested in its training programme to upskill auditors in key areas, such as data analytics, coding, and communication in order to move in tandem with DBS’ digitalisation strategy. Auditors’ IT skillsets are being enhanced through Group Audit’s 2-year iTransformation initiative launched in 2015, aimed at transforming business auditors into integrated auditors, to take on more IT application audits. IT auditors will focus in depth on three key areas: Digital Banking, IT Infrastructure and Cyber Security.

| 61
Group Audit has also piloted the agile auditing approach in selected audits, aimed at enhancing transparency, increasing collaboration and prioritising focus areas with auditees, while maintaining audit independence.
Significant incident protocol DBS has a significant incident protocol that sets out processes and procedures for the escalation of incidents according to the level of severity. In this way, appropriate levels of management are made aware of such incidents and can take action accordingly. There are also well-defined procedures for the escalation, investigation and follow up of any reported wrong-doing by a DBS employee, customer, vendor or third party.
Dealings in securities In conformance with the “black-out” policies prescribed under SGX Listing Rules, the Directors and employees are prohibited from trading in DBS’ securities one month before the release of the full-year results and two weeks before the release of the first, second and third quarter results. In addition, business units and subsidiaries engaging in proprietary trading are restricted from trading in DBS’ securities during the black-out period. Group Secretariat informs all Directors and employees of each black-out period ahead of time.
In addition, Group Management Committee members are only allowed to trade in DBS’ securities within specific window periods (15 market days immediately following the expiry of each black-out period) subject to pre-clearance. Group Management Committee members are also required to obtain pre-approval from the CEO before any sale of DBS’ securities. Similarly, the CEO is required to seek pre-approval from the Chairman before any sale of DBS’ securities. As part of our commitment to good governance and the principles of share ownership by senior management, the CEO is expected to build up and hold at least the equivalent of three times his annual base salary as shareholding over time. Directors and officers are prohibited at all times from trading in DBS’ securities if
they are in possession of material non-public information. DBS has put in place a personal investment policy which prohibits employees with access to price-sensitive information in the course of their duties from trading in securities in which they possess such price-sensitive information. Such employees are also required to seek pre-clearance before making any personal trades in securities, and may only trade through the Group’s stockbroking subsidiaries and bank channels for securities listed in Singapore and Hong Kong. The personal investment policy discourages employees from engaging in short-term speculative trading, and states that investment decisions should be geared towards long-term investment.
Related party transactionsDBS has embedded procedures to comply with all regulations governing related party transactions, including those in the Banking Act, MAS directives and the SGX Listing Rules. The Banking Act and MAS directives impose limits on credit exposures by DBS to certain related entities and persons, while the SGX Listing Rules cover interested person transactions in general.
All new Directors are briefed on all relevant provisions that affect them. If necessary, existing credit facilities to related parties are adjusted prior to a Director’s appointment, and all credit facilities to related parties are continually monitored. DBS has robust procedures to manage potential conflict of interest between a Director and DBS. Checks are conducted before DBS enters into credit or other transactions with related parties to ensure compliance with regulations.
As required under the SGX Listing Rules, please refer to Table 3 for details of interested person transactions in 2016. These interested person transactions are for the purpose of carrying out day-to-day operations such as leasing of premises, telecommunication/data services, IT systems and related services, logistics as well as security services.
Material contractsSince the end of the previous financial year, no material contracts involving the interest of any Director or controlling shareholder of DBS has been entered into by DBS or any of its subsidiary companies, and no such contract subsisted as at 31 December 2016, save as disclosed via SGXNET.
Table 3 Name of interested person
Aggregate value of all interested person transactions in 2016
(excluding transactions less than SGD 100,000)
Aetos Holdings Pte Ltd GroupAscendas-Singbridge Pte Ltd GroupCapitaLand Limited GroupCertis CISCO Security Pte Ltd GroupMapletree Investments Pte Ltd GroupSATS Ltd GroupSembcorp Industries Ltd GroupSingapore Telecommunications Limited GroupSMRT Corporation Ltd GroupStarHub Ltd GroupTemasek Management Services Pte Ltd Group
43,586,0691,742,400
360,00020,841,416
388,800797,272
4,549,84860,720,933
1,417,565988,692133,500
Total Interested Person Transactions (SGD) 135,526,495
3 Culture
We believe that effective safeguards against undesired business conduct have to go beyond a “tick-the-box” mentality. In DBS, other than relying on published codes of conduct, we also advocate the following organisational safeguards to maintain a strong risk and governance culture.
• Tone from the top: The tone set by the Board and senior management is vital; it is equivalent to the moral compass of the
organisation. In addition to having in place comprehensive policies, we conduct a robust self-assessment on the Group’s risk culture
• Aligning strategies and incentives via balanced scorecard: Please refer to the section “Our 2016 Priorities” on page 38 of this Annual Report for more information
• Respecting voice of control functions: We believe that respect for the voice of the control functions is a key safeguard. We ensure that control functions are well integrated into our organisational structure so that they can properly discharge their responsibilities
• Risk ownership: Please refer to page 59 of this Annual Report for details on our three lines of defence
• Having established escalation protocols: We designed a notification protocol that makes it mandatory for staff to report significant incidents. This means that the organisation is prepared to receive bad news and take necessary remedial actions without shooting the messengers
• Encouraging constructive challenges at all levels: More fundamentally, we inculcate a culture that encourages constructive challenges and debate, where all views are
Corporate governance

62 | DBS Annual Report 2016
evaluated for decision-making. We also operate a culture where we actively engage the Board for their views early
• Reinforcing cultural alignment: Finally, we conscientiously reinforce our cultural norms by rewarding right behaviours and censuring wrong ones
The DBS Code of Conduct (“Code of Conduct”):• Sets out the principles and standards of
behaviour that are expected of employees of the Group (including part-time and temporary employees) when dealing with customers, business associates, regulators and colleagues. The principles covered in the Code of Conduct include professional integrity, confidentiality, conflicts of interests, fair dealings with customers and whistle-blowing
• Defines the procedures for employees of DBS to report incidents and provides
protection for those staff for these disclosures
All employees of DBS are required to read and acknowledge the Code of Conduct on an annual basis. Members of the public may access the Code of Conduct on DBS’ website, as well as write in via an electronic feedback form on the website.
The Code of Conduct encourages employees of DBS to report their concerns to DBS’ dedicated, independent investigation team within Group Compliance which handles whistle-blowing cases according to a well defined protocol. Alternatively, in case of actual or potential conflict of interest or fear of retribution, employees of DBS may write in confidence to Human Resources, Group Audit, or even the CEO or Chairman. In addition, employees of DBS have the option of using the ‘DBS Speak Up’ service.
4 Accountability to our shareholders
Shareholder rightsDBS promotes fair and equitable treatment of all shareholders. All shareholders enjoy specific rights under the Singapore Companies’ Act and the Company’s Constitution.
These rights include, among others, the right to participate in profit distributions and the right to attend and vote at general meetings. Ordinary shareholders are entitled to attend and vote at the AGM by person or proxy. Pursuant to the introduction of the new multiple proxies regime under the Singapore Companies (Amendment) Act 2014, indirect investors who hold DBSH shares through a nominee company or custodian bank or through a CPF agent bank may attend and vote at the AGM.
DBS respects the equal information rights of all shareholders and is committed to the practice of fair, transparent and timely disclosure. All price-sensitive information is publicly released prior to any sessions with individual investors or analysts.
Communication with shareholdersOur investor relations activities promote regular, effective and fair communication with shareholders. Briefing sessions for the media and analysts are conducted when quarterly results are released. All press statements and quarterly financial statements are published on our website and the SGX website. A dedicated investor relations team supports the CEO and the CFO in maintaining a close and active dialogue with investors. The DBS website provides contact details for
The Board provides shareholders with quarterly and annual financial reports. In presenting these statements, the Board aims to give shareholders a balanced assessment of the Group’s financial performance and position. The Board also ensures timely and full disclosure of material corporate developments to shareholders.
Whistle-blowing policy
DBS Speak Up serviceDBS Speak Up is a hotline service run by an independent external party that gives employees of the Group the opportunity to speak up on misconduct and/or wrong-doing by a DBS employee, customer, vendor or third party.
DBS Speak Up service includes: • A dedicated hotline number, website, email
address, fax number and postal address for reporting of suspected incidents of misconduct and wrongdoing
• Specialist call centre operators with knowledge of individual organisations
• Expert forensic investigators to analyse reports• Timely reporting of incidents to dedicated
representatives within an organisation • Recommendations on corrective action
companies, an improvement from a ranking of 14th a year ago. DBS’ efforts to improve disclosure continued to be recognised at the 2016 SIAS Investors’ Choice Awards where it won the Golden Circle Award for the Most Transparent Company for the second consecutive year.
Conduct of shareholder meetingsThe AGM provides shareholders with the opportunity to share their views and tomeet the Board, including the chairpersons of the Board committees and certain members of senior management. Our external auditor is available to answer shareholders’ queries.
At the AGM, DBS’ financial performance for the preceding year is presented to shareholders.
At general meetings, the Chairman plays a pivotal role in fostering constructive dialogue between shareholders, Board members and management. DBS encourages and values shareholder participation at its general meetings.
In accordance with the recommendations contained in the Code and the Guidelines, resolutions requiring shareholder approval are tabled separately for adoption at the Company’s general meetings unless they are closely related and are more appropriately tabled together.
Since 2015, the minutes of our AGM and Extraordinary General Meeting (EGM) may be accessed via our website. We have disclosed the names of the Directors and senior executives who attended the 2016 AGM as well as detailed records of the proceedings including the questions raised by the meeting attendees.
investors to submit their feedback and raise any questions.
During the year, management held 600 debt and equity investor meetings. Management participated in 14 local and overseas investor conferences and non-deal road shows. These meetings provide a forum for management to explain DBS’ strategy and financial performance. Management also uses meetings with investors and analysts to solicit their perceptions of DBS. DBS has a disclosure policy to ensure that all disclosures of material information are timely, complete and accurate. The policy sets out how material information should be managed to prevent selective disclosure. Our Group Disclosure Committee (GDC) assists the CEO and CFO in implementing DBS’ disclosure policy. The GDC’s objectives are to: (a) periodically review DBS’ disclosure policy and update it as needed, (b) ensure that all material disclosures are appropriate, complete and accurate, and (c) ensure selective or inadvertent disclosure of material information is avoided. At the IR Magazine Awards and Conference Southeast Asia 2016, DBS was featured and ranked 11th among the Global Top 50

| 63
Electronic poll voting process
To enhance shareholder participation, DBS puts all resolutions at general meetings to vote by electronic poll and announces the results by showing the number of votes cast for and against each resolution and the respective percentage.
DBS appoints an independent external party as scrutineers for the electronic poll voting process. Prior to the commencement of the AGM/EGM, the scrutineers would review the proxies and the proxy process. DBS also has a
proxy verification process which has been agreed upon with the scrutineers.
At the DBS AGM/EGM, mobile devices are used for poll voting. When shareholders register their attendance at the meeting, they are handed the mobile device with details of their shareholding registered to the device. The shareholder is able to view his or her name and shareholding details which are clearly displayed onthe device.
When the Chairman opens the poll on a resolution, the shareholder presses the relevant voting button on the
device. Upon vote submission, the shareholder will receive a vote response acknowledgment on the device.
The results of the electronic poll voting are announced immediately after each resolution has been put to a vote, and the number of votes cast for and against and the respective percentage are displayed in real-time at the AGM/ EGM. DBS maintains an audit trail of all votes cast at the AGM/EGM. The outcome of the AGM/EGM (including detailed results of the poll vote for each resolution) is promptly disclosed on SGXNET after the meetings, on the same day of the AGM/EGM.
Corporate governance

64 | DBS Annual Report 2016
We believe that our long-term success depends in large measure on the contributions of our employees. Our remuneration framework is designed to be consistent with market best practices while driving business strategy and creating long-term shareholder value. Remuneration policies and practices as set out in the following report are governed by a set of sound principles which are in compliance with various regulatory requirements.
1 Objectives of DBS remuneration strategy
DBS’ remuneration policy, which is applicable to DBS Bank and all our subsidiaries and overseas offices, seeks to ensure that we are able to attract, motivate and retain employees to deliver long-term shareholder returns taking into consideration risk management principles and standards set out by the Financial Stability Board (FSB) and the Code.
When formulating our remuneration strategy, consideration was given to aligning our remuneration approach with DBS PRIDE! values in order to drive desired behaviours and achieve the objectives set out in our balanced scorecard.
The following shows the three main thrusts of our remuneration strategy and how they are implemented within DBS:
2 Summary of current total compensation elements
An employee’s total compensation is made up of the following elements:
Main thrusts How
Pay for performance measured against the balanced scorecard
• Instill and drive a pay-for-performance culture• Ensure close linkage between total compensation and our annual and long-term business
objectives as measured through the balanced scorecard• Calibrate mix of fixed and variable pay to drive sustainable performance and alignment to
DBS PRIDE! values, taking into account both the “what” and “how” of achieving KPIs
Provide market competitive pay
• Benchmark our total compensation against other organisations of similar size and standing in the markets we operate in
• Drive performance differentiation by benchmarking total compensation for top performing employees against the upper quartile or higher in each market
Guard against excessive risk-taking
• Focus on achieving risk-adjusted returns that are consistent with our prudent risk and capital management, as well as emphasis on long-term sustainable outcomes
• Design payout structure to align incentive payments with the long-term performance of the company through deferral and clawback arrangements
Remunerationreport
Total compensation Fixed pay Variable pay Variable pay
Salary Cash bonus Long-term incentive+ +

| 65
3 Determination of variable pay pool
The variable pay pool is derived from a combination of a bottom-up and top-down approach. It is underpinned by our aim to drive a pay-for- performance culture which is aligned to our risk framework.
The table below provides a breakdown of total compensation elements, their purpose and link to our compensation strategy, and the policy governing their execution.
Elements What Why and linkages to strategy How
Fixed pay Salary • Attract and retain talent by ensuring our fixed pay is competitive vis-a-vis comparable institutions
• Set at an appropriate level taking into account market dynamics, skills, experience, responsibilities, competencies and performance of the employee
• Paid in cash monthly• Typically reviewed annually
Variable pay Cash bonus and long-term incentive
• Provide a portion of total compensation that is performance-linked
• Focus employees on the achievement of objectives which are aligned to value creation for our shareholders and multiple stakeholders
• Align to time horizon of risk
• Based on overall Group, business or support unit and individual performance
• Measured against a balanced scorecard which is agreed to at the start of the year
• Awards in excess of a certain threshold are subject to a tiered deferral rate that ranges from 20% to 60%
• Deferred remuneration is paid in restricted shares and comprises two elements: the main award and the retention award (constituting 20% of the shares given in the main award and designed to retain talent and compensate staff for the time value of deferral)
• Deferred awards vest over four years• Paid cash bonus, unvested and vested deferred
share awards are subject to clawback from employees whose bonus exceeds a certain threshold
Remuneration report
Determining total variable pool A function of net profit before tax benchmarked against market and calibrated against the following prisms:• Risk adjustment through review
of Returns on Risk-Adjusted Capital (RoRAC)
• Distribution of earnings between employees and shareholders
Modulated by our performance against balanced scorecard• Comprises financial and non-financial
metrics encompassing employees, customers, shareholders, risks and compliance objectives
• Evaluated by CMDC, with pool subsequently endorsed by the Board
Allocating pool to business units Pool allocation takes into account the relative performance of each unit• Measured through each unit’s
balanced scorecard and evaluated by the CEO
Inputs from control functions such as Audit, Compliance and Risk are sought. Country heads are also consulted in the allocation process
Determining individual award Unit heads cascade their allocated poolto their teams and individuals• Performance measurement through
balanced scorecard
Individual variable pay determined based on individual performance• Linked to achievement of quantitative
as well as qualitative objectives as set out in individual’s key performance indicators (KPIs)
Control functions (Risk, Finance, Compliance and Audit) are measured independently from the business units they support to prevent any conflictsof interests. The remuneration of the Chief Risk Officer (CRO) and Group Head of Audit are endorsed by the Chairman of BRMC and AC respectively and subsequently approved by the Board.
Sales employees are incentivised to promote the development of mutually beneficial long-term relationships with their customers, rather than a sole focus on short term gains. Non-financial metrics such as customer satisfaction and compliance with fair dealing principles are incorporated into their KPIs.

66 | DBS Annual Report 2016
Long-term incentive Main Award Retention Award*
Plan objectives Award types
• Foster a culture that aligns employees’ interests with shareholders• Enable employees to share in the bank’s performance• Talent retention
• Annual Deferred Remuneration • DBSH Share Plan (“Share Plan”) for Vice President & above • DBSH Employee Share Plan (“ESP”) for Assistant Vice
President & below• Awards as part of talent retention (“Special Award”)
Vesting scheduleMalus of unvested awards & Clawback of vested awards
Main Award• 33% vest two years after grant date• Another 33% vest three years after grant date• Remaining 34% vest four years after grant date
Retention Award• 100% vest four years after grant date
Malus and/or Clawback will be triggered by• Material violation of risk limits• Material losses due to negligent risk-taking or inappropriate
individual behaviour• Material restatement of DBS’ financials due to inaccurate
performance measures• Misconduct or fraud
Prior to 2016 Performance Year, only unvested awards are subject to malus. Starting from 2016 Performance Year onwards, unvested and/or vested awards are subject to malus/clawback. Such awards may be clawed back during the seven years period from the date of grant.
4 Long-term share incentives
Award elements• Long-term share incentives are delivered in the form of restricted share awards (“Share Awards”) which comprise two elements:
* Constitutes 20% of Main Award under the Annual Deferred Remuneration
Details of the Share Plan appear on pages 183 to 184 of the Annual Report.
+=
5 Senior management and material risk takers
The balance between fixed and variable elements of total compensation changes according to performance, rank and function. This is in line with theFSB principle of ensuring that employee incentives remain focused on prudent risk-taking and effective control, depending on the employee’s role. It is aimed at incentivising employees whose decisions can have a material impact on DBS to adopt appropriate risk behaviours. These employees include senior management, key personnel at business units and senior control staff. We define this group of staff based on their roles, quantum of their variable remuneration and the ratio of their variable to fixed pay.
In 2015/2016, an external management consulting firm, Oliver Wyman, was engaged to provide an independent review of the Group’s compensation system and processes to ensure compliance with the FSB Principles for Sound Compensation Practices. Oliver Wyman and its consultants are independent and not related to us or any of our Directors.
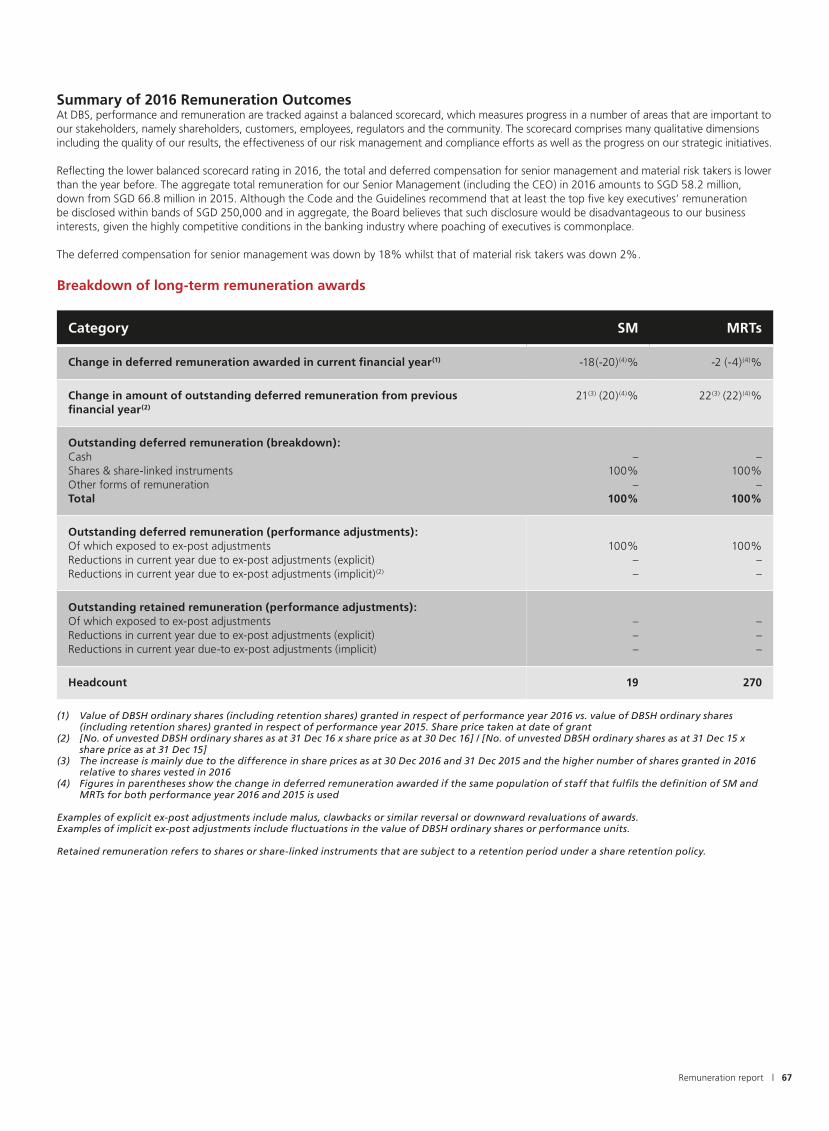
| 67Remuneration report
Category SM MRTs
Change in deferred remuneration awarded in current financial year(1) -18(-20)(4)% -2 (-4)(4)%
Change in amount of outstanding deferred remuneration from previous financial year(2)
21(3) (20)(4)% 22(3) (22)(4)%
Outstanding deferred remuneration (breakdown):CashShares & share-linked instrumentsOther forms of remunerationTotal
–100%
–100%
–100%
–100%
Outstanding deferred remuneration (performance adjustments):Of which exposed to ex-post adjustmentsReductions in current year due to ex-post adjustments (explicit)Reductions in current year due to ex-post adjustments (implicit)(2)
100%––
100%––
Outstanding retained remuneration (performance adjustments):Of which exposed to ex-post adjustmentsReductions in current year due to ex-post adjustments (explicit)Reductions in current year due-to ex-post adjustments (implicit)
–––
–––
Headcount 19 270
Breakdown of long-term remuneration awards
(1) Value of DBSH ordinary shares (including retention shares) granted in respect of performance year 2016 vs. value of DBSH ordinary shares (including retention shares) granted in respect of performance year 2015. Share price taken at date of grant
(2) [No. of unvested DBSH ordinary shares as at 31 Dec 16 x share price as at 30 Dec 16] / [No. of unvested DBSH ordinary shares as at 31 Dec 15 x share price as at 31 Dec 15]
(3) The increase is mainly due to the difference in share prices as at 30 Dec 2016 and 31 Dec 2015 and the higher number of shares granted in 2016 relative to shares vested in 2016
(4) Figures in parentheses show the change in deferred remuneration awarded if the same population of staff that fulfils the definition of SM and MRTs for both performance year 2016 and 2015 is used
Examples of explicit ex-post adjustments include malus, clawbacks or similar reversal or downward revaluations of awards. Examples of implicit ex-post adjustments include fluctuations in the value of DBSH ordinary shares or performance units.
Retained remuneration refers to shares or share-linked instruments that are subject to a retention period under a share retention policy.
Summary of 2016 Remuneration OutcomesAt DBS, performance and remuneration are tracked against a balanced scorecard, which measures progress in a number of areas that are important to our stakeholders, namely shareholders, customers, employees, regulators and the community. The scorecard comprises many qualitative dimensions including the quality of our results, the effectiveness of our risk management and compliance efforts as well as the progress on our strategic initiatives.
Reflecting the lower balanced scorecard rating in 2016, the total and deferred compensation for senior management and material risk takers is lower than the year before. The aggregate total remuneration for our Senior Management (including the CEO) in 2016 amounts to SGD 58.2 million, down from SGD 66.8 million in 2015. Although the Code and the Guidelines recommend that at least the top five key executives’ remuneration be disclosed within bands of SGD 250,000 and in aggregate, the Board believes that such disclosure would be disadvantageous to our business interests, given the highly competitive conditions in the banking industry where poaching of executives is commonplace.
The deferred compensation for senior management was down by 18% whilst that of material risk takers was down 2%.

68 | DBS Annual Report 2016
Senior Management Material risk takers
Note:We do not provide any other forms of fixed and variable remuneration aside from those disclosed in this section
Senior Management (SM) is defined as the CEO and members of the Group Management Committee who have the authority and responsibility for the Group’s overall direction and executing to strategy.
Fixed Pay Variable pay-cash Variable pay-deferred shares (including retention shares)
Material risk takers (MRTs) are defined as employees whose duties require them to take on material risk on our behalf in the course of their work. These can be either individual employees or a group of employees who may not pose a risk to DBS’ financial soundness on an individual basis, but may present a material risk collectively.
20%
40%
40%
22%
36%
42%
Category SM MRTs
Number of guaranteed bonuses 0 0
Number of sign-on bonuses 1 4
Number of severance payments 0 0
Total amounts of above payments made during the Financial Year (SGD ’000) 2,159*
* Due to data confidentiality, the total amount of payments for SM and MRTs have been aggregated for reporting
Other ProvisionsWe do not allow accelerated payment of deferred remuneration except in cases such as death in service or where legally required. There are no provisions for:• Special executive retirement plans;• Golden parachutes or special executive severance packages; and/or• Guaranteed bonuses beyond one year
The following charts show the mix of fixed and variable pay for both groups for performance year 2016.
Guaranteed bonuses, sign-on bonuses and severance payments

| 69
Salary remuneration
SGD
Cash bonus(1)
SGD
Share Plan(2)
SGDOthers(3)
SGDTotal(4)
SGD
Mr Piyush Gupta 1,200,000 3,117,000 4,063,000 61,132 8,441,132
(1) The amount has been accrued in 2016 financial statements(2) At DBS, dividends on unvested shares do not accrue to employees. For better comparability with other listed companies, this figure excludes
the estimated value of retention shares amounting to SGD 812,600, which serve as a retention tool and compensate staff for the time value of deferral. This is also similar in nature to practices in those companies which provide accrual of dividends for deferred awards
(3) Represents non-cash component and comprises club, car and driver(4) Refers to current year performance remuneration – includes fixed pay in current year, cash bonus received in following year and DBSH ordinary
shares granted in following year
Breakdown of remuneration for performance year 2016 (1 January – 31 December)
Remuneration report
Chief Executive Officer Since becoming CEO in November 2009, Piyush Gupta has grown DBS into a leading bank with multiple growth engines. This has built resiliency into the franchise, enabling DBS to withstand a slowdown in any single line of business and still turn in a sustainable performance.
In 2016, DBS delivered a strong operating performance with total income and net profit before allowances rising to new highs despite challenging economic conditions. This enabled the bank to absorb higher allowances due to stresses in the oil & gas support services sector and still maintain net profit at SGD 4.24 billion.
DBS continued to position itself well against the coming digital onslaught, shaping a culture of innovation within the bank, re-inventing systems and processes and reimagining banking. The traction it is making on these fronts is showing up in expanded customer reach and acquisition, and improved productivity and efficiency. In 2016, DBS successfully launched digibank, India’s first mobile-only bank, in a game-changing initiative that allowed it to break into the retail banking segment of a large geography without the need for expensive physical infrastructure. DBS is heartened that its efforts towards digital transformation have been recognised, having bagged a number of prestigious accolades including “World’s Best Digital Bank” by Euromoney in the course of the year.
Notwithstanding the above, Mr Gupta’s remuneration was adjusted down, reflecting the lower balanced scorecard rating in 2016.

70 | DBS Annual Report 2016
Summary of disclosures
Principle and guidelines Page reference in DBS Annual Report 2016
Guideline 1.3Delegation of authority, by the Board to any Board committee, to make decisions on certain Board matters
Pages 51 to 57
Guideline 1.4The number of meetings of the Board and Board committees held in the year, as well as the attendance of every Board member at these meetings
Pages 58 to 59
Guideline 1.5 The type of material transactions that require Board approval under guidelines
Page 57
Guideline 1.6The induction, orientation and training provided to new and existing Directors
Page 53
Guideline 1.16An assessment of how these programmes meet the requirements as set out by the NC to equip the Board and the respective Board committees with relevant knowledge and skills in order to perform their roles effectively
Page 53
Guideline 2.1Compliance with the guideline on proportion of independent Directors on the Board
Pages 52 to 53
Guideline 2.3The Board should identify in the Company’s Annual Report each Director it considers to be independent. Where the Board considers a Director to be independent in spite of the existence of a relationship as stated in the Code that would otherwise deem a Director not to be independent, the nature of the Director’s relationship and the reasons for considering him as independent should be disclosed
Pages 52 to 53
Guideline 2.4 Where the Board considers an independent Director, who has served on the Board for more than nine years from the date of his first appointment, to be independent, the reasons for considering him as independent should be disclosed
Not applicable
Express disclosure requirements in the Guidelines on Corporate Governance for Financial Holding Companies, Banks, Direct Insurers, Reinsurers and Captive Insurers which are incorporated in Singapore (which comprises the Code of Corporate Governance 2012), and the applicable disclosures pursuant to the Corporate Governance Disclosure Guide issued by the Singapore Exchange on 29 January 2015.

| 71
Principle and guidelines Page reference in DBS Annual Report 2016
Guideline 2.6 (a) The Board’s policy with regard to diversity in identifying Director nominees(b) Whether current composition of the Board provides diversity on skills, experience,
gender and knowledge of the Company, and elaborate with numerical data where appropriate
(c) Steps that the Board has taken to achieve the balance and diversity necessary to maximise its effectiveness
Pages 48, 49, 51 and 52
Guideline 2.13Names of the members of the EXCO and the key terms of reference of the EXCO, explaining its role and the authority delegated to it by the Board
Pages 53 to 54
Guideline 3.1 Relationship between the Chairman and the CEO where they are immediate family members
Not applicable
Guideline 4.1Names of the members of the NC and the key terms of reference of the NC, explaining its role and the authority delegated to it by the Board
Page 51
Guideline 4.4(a) The maximum number of listed company Board representations which
Directors may hold should be disclosed(b) Reasons for not determining maximum number of listed company
Board representations(c) Specific considerations in deciding on the capacity of Directors
Page 53
Guideline 4.6 Process for the selection, appointment and re-appointment of new Directors to the Board, including the search and nomination process
Pages 51 to 53
Guideline 4.7Key information regarding Directors, including which Directors are executive, non-executive or considered by the NC to be independent
Pages 52, 58 and 59
Guideline 4.13Resignation or dismissal of key appointment holders
Not applicable
Guideline 4.14Deviation and explanation for the deviation from the internal guidelineson time commitment referred to in Guidelines 4.4 and 4.10
Page 53
Guideline 5.1The Board should state in the Company’s Annual Report how assessment of the Board, its Board committees and each Director has been conducted. If an external facilitator has been used, the Board should disclose in the Company’s Annual Report whether the external facilitator has any other connection with the Company or any of its Directors. This assessment process should be disclosed in the Company’s Annual Report
Pages 51 to 52
Guideline 6.1 Types of information which the Company provides to independent Directors to enable them to understand its business, the business and financial environment as well as the risks faced by the Company, and how frequent is such information provided.
Pages 50, 53, 55, 56 and 59
Summary of disclosures

72 | DBS Annual Report 2016
Principle and guidelines Page reference in DBS Annual Report 2016
Guideline 7.1 Names of the members of the Remuneration Committee (RC) and the key terms of reference of the RC, explaining its role and the authority delegated to it by the Board
Page 56
Guideline 7.3Names and firms of the remuneration consultants (if any) should be disclosed in the annual remuneration report, including a statement on whether the remuneration consultants have any relationships with the Company
Page 66
Principle 9Clear disclosure of remuneration policies, level and mix of remuneration, and procedure for setting remuneration
Pages 64 to 68
Guideline 9.1Remuneration of Directors, the CEO and at least the top five key management personnel (who are not also Directors or the CEO) of the Company. The annual remuneration report should include the aggregate amount of any termination, retirement and post-employment benefits that may be granted to Directors, the CEO and the top five key management personnel (who are not Directors or the CEO)
For the CEO and management:Page 67For the Company’s other Directors:Page 58
Guideline 9.2Fully disclose the remuneration of each individual Director and the CEO on a named basis. There will be a breakdown (in percentage or dollar terms) of each Director’s and the CEO’s remuneration earned through base/fixed salary, variable or performance-related income/bonuses, benefits in kind, stock options granted, share-based incentives and awards, and other long-term incentives
For the CEO:Page 69For the Company’s other Directors:Page 58
Guideline 9.3Name and disclose the remuneration of at least the top five key management personnel (who are not Directors or the CEO) in bands of SGD 250,000. There will be a breakdown (in percentage or dollar terms) of each key management personnel’s remuneration earned through base/fixed salary, variable or performance-related income/bonuses, benefits in kind, stock options granted, share-based incentives and awards, and other long-term incentives. In addition, the Company should disclose in aggregate the total remuneration paid to the top five key management personnel (who are not Directors or the CEO). As best practice, companies are also encouraged to fully disclose the remuneration of the said top five key management personnel
Page 67
Guideline 9.4 Details of the remuneration of employees who are immediate family members of a Director or the CEO, and whose remuneration exceeds SGD 50,000 during the year.This will be done on a named basis with clear indication of the employee’s relationship with the relevant Director or the CEO. Disclosure of remuneration should be in incremental bands of SGD 50,000
Page 56
Guideline 9.5Details and important terms of employee share schemes
Pages 66, 183 and 184
Guideline 9.6For greater transparency, companies should disclose more information on the link between remuneration paid to the executive Directors and key management personnel, and performance. The annual remuneration report should set out a description of performance conditions to which entitlement to short-term and long-term incentive schemes are subject, an explanation on why such performance conditions were chosen, and a statement of whether such performance conditions are met
Pages 64 to 69
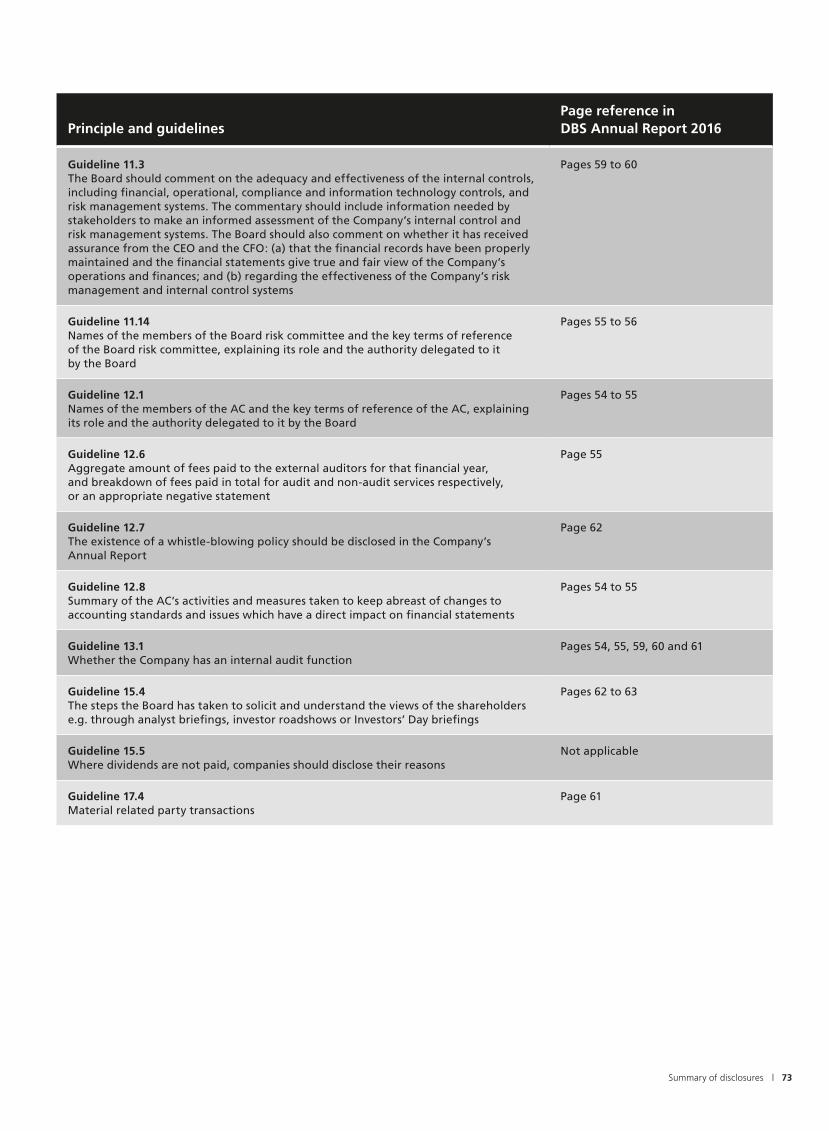
| 73
Principle and guidelines Page reference in DBS Annual Report 2016
Guideline 11.3The Board should comment on the adequacy and effectiveness of the internal controls, including financial, operational, compliance and information technology controls, and risk management systems. The commentary should include information needed by stakeholders to make an informed assessment of the Company’s internal control and risk management systems. The Board should also comment on whether it has received assurance from the CEO and the CFO: (a) that the financial records have been properly maintained and the financial statements give true and fair view of the Company’s operations and finances; and (b) regarding the effectiveness of the Company’s risk management and internal control systems
Pages 59 to 60
Guideline 11.14Names of the members of the Board risk committee and the key terms of reference of the Board risk committee, explaining its role and the authority delegated to it by the Board
Pages 55 to 56
Guideline 12.1 Names of the members of the AC and the key terms of reference of the AC, explaining its role and the authority delegated to it by the Board
Pages 54 to 55
Guideline 12.6Aggregate amount of fees paid to the external auditors for that financial year,and breakdown of fees paid in total for audit and non-audit services respectively,or an appropriate negative statement
Page 55
Guideline 12.7The existence of a whistle-blowing policy should be disclosed in the Company’s Annual Report
Page 62
Guideline 12.8Summary of the AC’s activities and measures taken to keep abreast of changes to accounting standards and issues which have a direct impact on financial statements
Pages 54 to 55
Guideline 13.1Whether the Company has an internal audit function
Pages 54, 55, 59, 60 and 61
Guideline 15.4The steps the Board has taken to solicit and understand the views of the shareholders e.g. through analyst briefings, investor roadshows or Investors’ Day briefings
Pages 62 to 63
Guideline 15.5Where dividends are not paid, companies should disclose their reasons
Not applicable
Guideline 17.4Material related party transactions
Page 61
Summary of disclosures

74 | DBS Annual Report 2016
CRO statement
Top and emerging risks
We understand that top and emerging risks can affect our business activities, fi nancial results, reputation and our strategic priorities. That is why we proactively identify, control, mitigate, monitor and report these risks as part of our risk management process. We begin our identifi cation process by reviewing internal risk data and industry research, after which senior management assesses our key focus areas, as well as the risk outlook for the banking industry as a whole. After further deliberation by the Board and management risk committees, our top and emerging risks are prioritised and monitored. Our action plans are periodically updated and this information is disseminated to the relevant risk committees.
amounted to SGD 14 billion and remains resilient. The majority was granted to investment grade-equivalent borrowers, which include global trading houses, international oil companies and national oil companies. This exposure was typically in short-term and trade-related facilities.
Our exposure to the oil and gas support services segment amounted to SGD 8 billion, of which SGD 2 billion was to state-owned/government linked shipyards. Of the remaining SGD 6 billion, about half have been more affected by the decline in oil prices. We took allowances for three large exposures in 2016, of which two were in the offshore contracting business. This led us to re-evaluate our contract services portfolio and enhance the guidelines.
We expect the oil and gas support services sector to remain under some pressure due to structural overcapacity and low charter rates. While oil prices have rebounded off the lows, the slow recovery in prices indicates that capital expenditure by major oil and gas companies will remain constrained. Major oil companies have also driven down costs by re-
Focus areas for 2016
1. Credit risk and portfolio management
2. Digitalisation - Cyber security3. Regulatory compliance
and reporting4. Application development
and insourcing5. Digitalisation - Ecosystem
partners, vendors and outsourcing service providers
6. Risk and control construct7. Data management
and protection8. Resiliency and capacity
(including crisis management)9. Liquidity and capital
management10. Large programme initiatives
Of the above, there were three particularly challenging areas: (i) Credit risk and portfolio management, (ii) Regulatory compliance and (iii) Cyber security and data protection.
Credit risk and portfolio management
DBS faced a challenging operating environment in 2016 with headwinds from low oil prices and a slowdown in the Chinese economy. Challenges were seen in the segments of oil and gas support services and SME portfolios. We also faced pressure in sections of our commodity exposures such as steel and coal. In addition, our North Asia portfolio was impacted by the depreciation of the RMB. Despite these headwinds, our portfolios, especially in Singapore and China, continued to be resilient refl ecting the inherent strength of our franchise.
Commodity prices have been under pressure since 2014. This has affected our oil and gas support services portfolio. Our exposure to the whole oil and gas complex – comprising not only producers and traders but also processors and support services – has remained around SGD 22 billion, of which SGD 18 billion was in the form of loans. Our exposure to the producer, trader and processor segments

| 75
negotiating contracts across the exploration and production segments. We are closely monitoring this portfolio and working with our borrowers to re-profile their loans in line with the lower cashflows.
Our exposure to commodities other than oil and gas was SGD 21 billion, of which SGD 17 billion was in the form of loans. This portfolio, which is mostly in short-term and trade-related facilities, was spread over 400 borrowers. Close attention has been paid to the structure and collateral of individual trades. We have conducted several portfolio reviews and remain generally comfortable with our exposure. While there continues to be some stress in the steel and coal sectors, we expect credit losses to be manageable.
The shipping industry continues to be challenging. However, we draw comfort that majority of our borrowers have adequate financial resources to withstand the protracted industry downturn. We remain highly selective of new exposures and continue to focus on credits with strong track records and sound financial profiles.
The residential housing market in Singapore has remained subdued with property prices continuing to ease and transaction volumes remaining low. The outlook for commercial and industrial properties in Singapore has also weakened because of the slower macroeconomic environment. At the same time, the sharp rise in housing prices in Hong Kong and some cities in China has been an area of concern as it has heightened the risk of a sharp price correction. Because of this, we have stress tested our portfolio rigorously. We remain vigilant to any signs of market weakness and will continue to exercise prudence when underwriting new loans. Overall, we remain comfortable with our exposure to the property sector.
Across the region as a whole, there was no growth in exposure to the SME portfolio during the year, although growth levels varied between individual country portfolios. Credit quality was impacted by a combination of macroeconomic conditions and country or sector-specific issues, such as (i) the impact of RMB derivatives affecting clients in Hong Kong, China and Taiwan, and (ii) ongoing strains in the oil and gas support services sector in Singapore. The SME portfolios are subject to regular reviews, stress tests and ad hoc scenario assessments, with the results subsequently used to optimise lending criteria.
From a geographical perspective, in Greater China, our customers reduced their RMB positions substantially as they matured or through an early unwinding. The remaining contracts, with maturities up to the third quarter of 2017, are now quite small. For customers that have opted to unwind their RMB contracts, term loans have been offered to term out such liabilities where the credit risk is justified. We have taken specific allowances of SGD 173 million pertaining to customers with RMB derivative exposures.
In China, our customer and trade loans fell from SGD 37 billion at the end of 2015 to SGD 34 billion. The drop was due largely to the trade loans, which now accounted for half of the exposure, or SGD 17 billion, and were mostly backed by letters of credit issued by top-tier financial institutions. The bulk of the remaining SGD 17 billion of non-trade exposure was to well-rated large corporates. Our exposure to SMEs also declined as we continued to tighten our lending criteria. In the property sector, we are focused on the top local and international names.
The banking sector in India continued to be impacted by stressed assets. The recent demonetisation has also impacted short-term growth momentum. Downside risks remain for borrowers in weaker sectors such as infrastructure and engineering procurement and construction, as well as commodities such as steel as they continue to face challenges such as stalled projects, overcapacity, a downturn in commodity prices and the dumping of goods from other countries. While recent government initiatives, such as arbitration claims, the Bankruptcy Code and the Insolvency Act, are positive for our borrowers, our portfolio in India continues to be challenged due to industry and macroeconomic issues as well as slow progress in de-leveraging. We have tightened our Target Market and Risk Acceptance Criteria(1) and continue to actively monitor the portfolio, paying particular attention to identifying warning signals at an earlier stage.
From a country transfer risk perspective, our operations are concentrated in a few countries. In 2016, we paid closer attention to China as its economy slowed and the momentum of capital outflows picked up as interest rate differentials moved in favour of USD assets. Policy actions have been introduced to manage the capital outflows.
Although China’s foreign exchange reserves have declined, they remain large enough to smoothen exchange rate volatility and serve as a cushion against external shocks. We also believe that the government has sufficient monetary and fiscal levers to weather an economic downturn. There is no material change in our assessment of China. We will continue to keep a close watch on policy development and actions.
Regulatory compliance
The key areas which required attention in 2016 were anti-money laundering efforts, sales process (client suitability) in RMB derivatives and cross-border taxation.
The Monetary Authority of Singapore (MAS) took action against us for breaches of money laundering regulations attributable to events in 2013 and 2014. The issues giving rise to the breaches – centred on onboarding, transaction monitoring and suspicious activity reporting – have been rectified. In 2017, we will be focusing on greater enhancements to our anti-money laundering capabilities including front office controls and training, enhancements to transaction monitoring and leading or participating in efforts to share more information on criminal behaviour with law enforcement and our regulators.
We were subjected to regulatory actions in Taiwan for lapses in sales processes on derivatives. Actions are under way to implement enhancements aligned to the Taiwan regulator’s expectations. We operate, globally, a standardised process for classifying product risk and matching this to client risk before a product is sold to a particular client. The data is reported to the Fair Dealing Committee, which submits a quarterly report to our Board Audit Committee. The Fair Dealing Committee will, from time to time, instruct any relevant global enhancements which are appropriate in connection with derivatives sales.
As part of the Organisation for Economic Co-operation and Development (OECD) Base Erosion and Profit Shifting (BEPS) and its local adoption by tax regulators, DBS is required to provide additional documentation in respect of “Country-by-Country Reporting” and Transfer Pricing documentation. In addition, BEPS has heightened the focus on cross-border tax issues in general. DBS has implemented relevant tax policies and procedures in response to this. We aim to apply both
(1) We use Target Market (TM) to define industry and geographical target markets and identify acceptable business/industry segments. Risk Acceptance Criteria (RAC) is used as a client screening tool to guide credit extension and how much risk is acceptable or tolerable.
CRO statement

76 | DBS Annual Report 2016
the letter and the spirit of tax laws in the jurisdictions in which to operate and support the work by OECD and others to promote transparency. As local tax regulators start to adopt the BEPS action points, we would expect an increasing amount of tax audits focussing on cross border tax arrangements.
Cyber security and data protection
As cyber-attacks against public and private infrastructures grow worldwide, cyber security has become increasingly important for both governments and regulators across the globe. DBS takes an approach which converges the management of physical, cyber and data-related risks into a central Chief Information Security Officer, who also oversees the financial crime risk management programme. We take an overall approach of
defence in depth, combined with employee education and industry collaboration; and we keep abreast of techniques and threats as they evolve in order to develop the appropriate countermeasures.
Data protection and governance are cornerstones for customers’ trust in the banking sector, and are also critical enabling factors for innovation in a digital economy. In 2016, we had a data related incident in Hong Kong which was reported in media, stemming from reports which we submitted to the authorities. It remains our belief that it is important to supply information which facilitates prosecutions of criminal activity. We will be putting more focus in 2017 on controls to detect or prevent loss of data, as well as improving our policy framework around data management.
Our top focus areas in 2017 are similar to 2016’s, with the top three remaining unchanged, as follows:
1. Credit risk and portfolio management
2. Cyber security3. Regulatory compliance
For more details on our principal risks and risk management approach, please refer to pages 77 to 102.

| 77
The table below gives an overview of the locations of our risk disclosures.
Risk management
Risk management sectionOther locations in Annual Report
Pillar 3 quantitative disclosures (3)
Risk overview
1 Risk overview2 Risk-taking and our
business segments
7878
Capital management and planning
103 1 Introduction3 Capital adequacy6 Exposures and
risk- weighted assets (RWA)
Risk governance
3 Risk governance 7980
Corporate governance report 48
Risk Appetite
4.1 Risk thresholds and economic capital usage
4.2 Stress testing
80
81
Remuneration report 64
Credit risk 5.1 Credit risk management at DBS
5.2 Credit risk mitigants5.3 Internal credit risk models5.4 Credit risk in 2016
82
848487
Note 14 Financial assets and liabilities subject to netting agreement
Note 41.1 Maximum exposure to credit risk
Note 41.2 Loans and advances to customers
Note 41.3 Credit quality of government securities and treasury bills and bank and corporate debt securities
Note 41.4 Credit risk by geography and industry
137
164
165
169
169
7.1 Credit risk assessed using Internal Ratings-Based Approach
7.2 Credit risk assessed using standardised approach
7.3 Credit risk mitigation7.4 Counterparty credit
risk- related exposures8 Equity exposures
under IRBA9 Securitisation exposures10.1 Credit exposures10.2 Major credit exposures by
geography and industry10.3 Loans and advances to
customers (by performing/ non-performing)
10.4 Movements in specific and general allowances
Market risk 6.1 Market risk management at DBS
6.2 Market risk in 2016
89
90
10.6 Interest rate risk in the banking book
10.7 Equity exposures in the banking book
Liquidity risk 7.1 Liquidity risk management at DBS
7.2 Liquidity risk in 20167.3 Liquid assets7.4 Regulatory requirements
91
939494
Note 42.1 Contractual maturity profile of assets and liabilities
171 10.5 Total assets by residual contractual maturity
Operational risk
8.1 Operational risk management at DBS
8.2 Operational risk in 2016
95
96
Reputational risk
9.1 Reputational risk management at DBS
9.2 Reputational risk in 2016
97
97
(1) See “Enhancing the Risk Disclosure of Banks” published by the Financial Stability Board in October 2012(2) The additional considerations under the existing EDTF recommendations fall into the following three categories: • Permanent: Disclosures made in the pre-transition period, which should continue following the adoption of the ECL framework • Temporary: Disclosures made in the pre-transition period, which should cease following the adoption of the ECL framework • Post ECL Adoption Permanent: Disclosures to be made following the adoption of an ECL framework only(3) Please refer to http://www.dbs.com/investor/index.html for DBS’ Pillar 3 Quantitative Disclosures
Risk management
In 2016, we continue to implement most of the recommendations from the Enhanced Disclosure Task Force (EDTF) to improve bank risk disclosures(1). We have also implemented the temporary and permanent disclosure recommendations(2) that are applicable to DBS from the EDTF’s November 2015 report, “Impact of expected credit loss (ECL) approaches on bank risk disclosures”.For an overview of the recommendations and where we have incorporated the relevant disclosures, please refer to Appendix on page 98.

78 | DBS Annual Report 2016
1 Risk overview Business and strategic riskAn overarching risk arising from adverse business and economic changes materially affecting DBS’ long-term objectives. This risk is managed separately under other governance processes.
Please refer to page 28 for our material matters.
Credit risk (page 82)A risk arising from borrowers or counterparties failing to meet their debt or contractual obligations.
The sections marked by a grey line in the left margin form part of the Group’s audited financial statements
2 Risk-taking and our business segments
Because we focus on Asia’s markets, we are exposed to concentration risks within the region. We manage these risks by engaging in industry diversification and overseeing individual exposures. In addition, DBS uses the specialist knowledge we have of our regional
markets and industry segments to effectively assess our risks.
As a commercial bank, DBS allocates more economic capital to our Institutional Banking and Consumer Banking business segments, as compared to Treasury. A buffer is also maintained for other risks as well, including country risk, operational risk, reputational risk and model risk.
The chart below provides an overview of the risks arising from our business segments. The asset size of each business segment reflects its contribution to the balance sheet, and the risk-weighted assets (RWA) refer to the amount of risk incurred.
Please refer to Note 44 to the financial statements on page 174 for more information about DBS’ business segments.
Market risk (page 89)A risk arising from adverse changes in interest rates, foreign exchange rates, equity prices, credit spreads and commodity prices, as well as related factors.
Liquidity risk (page 91)A risk that arises if DBS is unable to meet our obligations when they are due.
Operational risk (page 95)A risk arising from inadequate internal processes, people or systems, as well as external events. This includes legal risk, and excludes strategic and reputational risk.
Reputational risk (page 97)A risk that arises if our shareholder value (including earnings and capital) is adversely affected by any negative stakeholder perception of DBS’ image. This influences our ability to establish new relationships or services, continue servicing existing relationships, and have continued access to sources of funding. Reputational risk usually occurs when the other risks are poorly managed.
(a) Encompasses assets/RWA from capital and balance sheet management, funding and liquidity activities, DBS Vickers Group and The Islamic Bank of Asia Limited
(b) Before goodwill and intangibles
Consumer Banking/ Wealth Management
Institutional Banking Treasury Others(a) Total
SGD m
Assets(b) 96,405 231,929 102,701 45,418 476,453
Risk-weighted assets 34,609 171,280 51,776 20,953 278,618
% of RWA
Credit risk 84% 94% 40% 71% 81%
Market risk 0% 0% 56% 24% 12%
Operational risk 16% 6% 4% 5% 7%

| 79Risk management
3 Risk governance
The Board oversees DBS’ affairs and provides sound leadership for the CEO and management. Authorised by the Board, various Board committees oversee specific responsibilities based on clearly defined terms of reference.
Under our risk management frameworks, the Board, through the Board Risk Management Committee (BRMC), sets our Risk Appetite, oversees the establishment of enterprise-wide risk management policies and processes, and sets risk limits to guide DBS’ risk-taking.
Note: The lines reflect possible escalation protocols and are not reporting lines per se
Group Board
Board of Directors
Board Executive Committee
Board Audit Committee
Nominating Committee
Compensation and Management Development Committee
Board Risk Management Committee
Group Management
Group CEO
Group Executive Committee
Group Management Committee
Group Asset and Liability Committee
Group Capital Committee
Group Disclosure Committee
Fair Dealing Committee
Group Human Capital Committee
Risk Executive Committee
Product Approval Committee
Group Credit Risk Models Committee
Group Credit Policy Committee
Group Scenario and Stress Testing Committee
Group Credit Risk Committee
Group Market and Liquidity Risk Committee
Group Operational Risk Committee
Group Management
Location Board/Board Committees
Location Management Committees
Location Risk Committees
Business Control Committees

80 | DBS Annual Report 2016
The BRMC oversees the identification, monitoring, management and reporting of credit, market, liquidity, operational and reputational risks. To facilitate the BRMC’s risk oversight, the following risk management committees have been established.
Risk management committees
Risk Executive Committee (Risk ExCo) As the overall executive body regarding risk matters, the Risk ExCo oversees DBS’ risk management as a whole.
Product Approval Committee (PAC) The PAC oversees new product approvals, which are vital for mitigating risk within DBS.
Group Credit Risk Models Committee (GCRMC) Group Credit Policy Committee (GCPC) Group Scenario and Stress Testing Committee (GSSTC) Group Credit Risk Committee (GCRC) Group Market and Liquidity Risk Committee (GMLRC) Group Operational Risk Committee (GORC)
Each committee reports to the Risk ExCo, and the committees as a whole serve as an executive forum to discuss and implement DBS’ risk management.
Key responsibilities:• Assess and approve risk-taking activities• Oversee DBS’ risk management infrastructure, which includes
frameworks, decision criteria, authorities, people, policies, standards, processes, information and systems
• Approve risk policies such as model governance standards, stress testing scenarios, and the evaluation and endorsement of risk models
• Identify specific concentrations of risk• Recommend scenarios and the resulting macroeconomic variable
projections used for enterprise-wide stress tests
The members in these committees comprise representatives from the Risk Management Group (RMG) as well as key business and support units.
Most of the above committees are supported by local risk committees in all major locations, where appropriate. These local risk committees oversee the local risk positions for all businesses and support units, ensuring that they keep within the limits set by the group risk committees. They also approve location-specific risk policies.
The Chief Risk Officer (CRO), who is a member of the Group Executive Committee and reports to the Chairman of the BRMC and the CEO, oversees the risk management function. The CRO is independent of business lines and is actively involved in key decision-making processes. He often engages with regulators to discuss risk matters, enabling a more holistic risk management perspective.
Working closely with the risk and business committees, the CRO is responsible for the following:• Management of DBS’ risks, including systems and processes to identify, approve, measure, monitor, control and report risks• Engagement with senior management about material matters regarding all risk types• Development of risk controls and mitigation processes• Ensuring DBS’ risk management is effective, and the Risk Appetite established by the Board is adhered to
4 Risk Appetite
DBS’ Risk Appetite is set by the Board and governed by the Risk Appetite Policy – a key part of our risk culture. A strong organisational risk culture is imperative for DBS to move forward, and this includes an effective incentive framework (please refer to the Remuneration Report section on page 64).
4.1 Risk thresholds and economic capital usageOur Risk Appetite takes into account a spectrum of risk types, and it is implemented using thresholds, policies, processes and controls.
Threshold structures are essential in making DBS’ Risk Appetite an intrinsic part of our businesses, because they help to keep all our risks within acceptable levels. Portfolio risk limits for the quantifiable risk types reach all parts of DBS from the top down, and these are implemented using formal frameworks. As for the non-quantifiable risk types, these are controlled using qualitative principles.
To ensure that the thresholds pertaining to our Risk Appetite are completely risk-sensitive, we have adopted economic capital (EC) as our primary risk metric. EC is also a core component in our Internal Capital Adequacy Assessment Process (ICAAP).
The following chart provides a broad overview of how our Risk Appetite permeates throughout DBS. Please refer to Sections 5 through 9 for more information about each risk type.

| 81Risk management
Risk Executive Committee
Capital allocation
Credit risk
Manage concentration risk by using triggers and limits
Market risk
Manage market risk by using limits
Manage through policies and standards
Operational risk
Maintain counterbalancing capacity to meet the liquidity risk exposure
Reputational risk
Manage through policies and standards
• Obligor• Industry• Country
(transfer risk)
Obligor economic capital triggers• Corporate• Banks
Expected Shortfall limits• Business group• Business unit• Entity• Desk
Industry economic capital triggers• Financial institutions• Non-financial
institutions
Country (transfer risk) limits• Strategic• Non-strategic
• Trading book (product desk)
• Banking book (business segment)
Liquidity risk
• Currency• Location
4.2 Stress testingStress testing is an integral part of our risk management process, and includes both sensitivity analysis and scenario analysis.
This element alerts senior management of our potential vulnerability to exceptional but plausible adverse events. As such, stress testing enables us to assess capital adequacy, identify potentially risky portfolio segments and inherent systematic risks. This then allows us to develop the right contingency plans, exit strategies and mitigating actions beforehand.
Stress testing is conducted at least once annually, and additional stress tests are carried out in response to microeconomic and macroeconomic conditions. Every stress test is documented.
The capital planning process according to our ICAAP seeks to align our expected business trajectory to our Risk Appetite. This is done by comparing the projected demand for capital to the projected supply of capital in stress scenarios.

82 | DBS Annual Report 2016
5 Credit risk
The most significant measurable risk DBS faces -– credit risk arises from our daily activities in our various businesses. These activities include lending to retail, corporate and institutional customers; trading endeavours such as foreign exchange, derivatives and debt securities; and the settlement of transactions.
Please refer to Note 41.1 to the financial statements on page 164 for details on DBS’ maximum exposure to credit risk.
5.1 Credit risk management at DBS
DBS’ approach to credit risk management comprises the following building blocks:
The usage of credit ratings and lending limits are an integral part of DBS’ credit risk management process, and we use an array of rating models for our corporate and retail portfolios. Most of these models are built internally using DBS’ loss data, and the limits are driven by DBS’ Risk Appetite Statement and the TMRAC.
Wholesale borrowers are assessed individually using both judgmental credit models and statistical credit models. They are further reviewed and evaluated by experienced credit risk managers who consider relevant credit risk factors in the final determination of the borrower’s risk. For some portfolios within the SME segment, DBS also uses a programme-based approach to achieve a balanced management of risks and rewards. Retail exposures are assessed using credit scoring models, credit bureau records, and internally and externally available customer behaviour records. These are supplemented by our Risk Acceptance Criteria.
After the credit exposures are assessed, credit extensions are proposed by the business unit, and these are approved by the credit risk function after taking into account independent credit assessments and the business strategies set by senior management.
Please refer to Section 5.3 on page 84 to read more about our internal credit risk models.
Pre-settlement credit risk for derivatives arising from a counterparty potentially defaulting on its obligations is quantified by a mark-to-market evaluation, as well as any potential exposure in the future. This is used to calculate DBS’ regulatory capital under the Current Exposure Method (CEM), and is included under DBS’ overall credit limits to counterparties for internal risk management.
Issuer default risk that may also arise from derivatives and securities are generally measured based on jump-to- default computations.
DBS actively monitors and manages our exposure to counterparties in over-the-counter (OTC) derivative trades to protect our balance sheet in the event of a counterparty default. Counterparty risk exposures that may be adversely affected by market risk events are identified, reviewed and acted upon by management, and highlighted to the appropriate risk committees. Specific wrong-way risk arises when the exposure to a counterparty positively correlates with the probability of defaulting due to the nature of the transactions. DBS has a policy to guide the handling of specific wrong-way risk transactions, and its risk measurement metric takes into account the higher risks associated with such transactions.
Concentration risk managementOur risk management processes, which are aligned with our Risk Appetite, ensure that an acceptable level of risk diversification is maintained across DBS.
For credit risk, we use EC as our measurement tool, since it combines the individual risk factors of probability of default (PD), loss given default (LGD) and exposure at default (EAD), as well as portfolio concentration factors. Granular EC thresholds are set to ensure that the allocated EC stays within our Risk Appetite.
Thresholds regarding major industry groups and single counterparty exposures are monitored regularly, and notional limits for country exposures are set as well. Governance processes are in place to ensure that our exposures are regularly monitored with these thresholds in mind, and appropriate action is taken when the thresholds are breached.
DBS continually examines how we can enhance the scope of our thresholds to effect better risk management.
Country riskCountry risk refers to the risk of loss due to events in a specific country (or a group of countries). This includes political, exchange rate, economic, sovereign and transfer risks.
DBS manages country risk through the Group Credit Risk Management Policy and CCRP, and the said risk is part of our concentration risk management. The way we manage transfer risk at DBS is set out in our Country Risk Management Standard. This includes an internal transfer risk and sovereign risk rating system, where assessments are made independently of business decisions. Our transfer risk limits are set in accordance with DBS’ Risk Appetite Policy.
Limits for strategic and non-strategic countries are set based on country-specific strategic business considerations as well as the acceptable potential loss according to our Risk Appetite. Senior management and credit management actively evaluate what the right transfer risk exposures for DBS should be, taking into account the risks and rewards, as well as whether they are in line with our strategic intent. Limits for all other countries are set using a model-based approach.
All country limits are subject to approval by the BRMC.
Policies
Risk methodologies
Processes, systems and reports
PoliciesThe dimensions of credit risk and the scope of its application are defined in the Group Credit Risk Management Policy. Senior management sets the overall direction and policy for managing credit risk at the enterprise level.
The Group Core Credit Risk Policies established for Consumer Banking/Wealth Management and Institutional Banking (herein referred to as CCRPs) set forth the principles by which DBS conducts its credit risk management and control activities. These policies, supplemented by a number of operational policies and standards, ensure consistency in identifying, assessing, underwriting, measuring, reporting and controlling credit risk across DBS, and provide guidance in the formulation of business-specific and/or location-specific credit risk policies and standards.
The operational policies and standards are established to provide greater details on the implementation of the credit principles within the Group CCRPs and are adapted to reflect different credit environments and portfolio risk profiles. The CCRPs are considered and approved by GCPC.
Risk methodologiesCredit risk is managed by thoroughly understanding our customers – the businesses they are in, as well as the economies in which they operate.
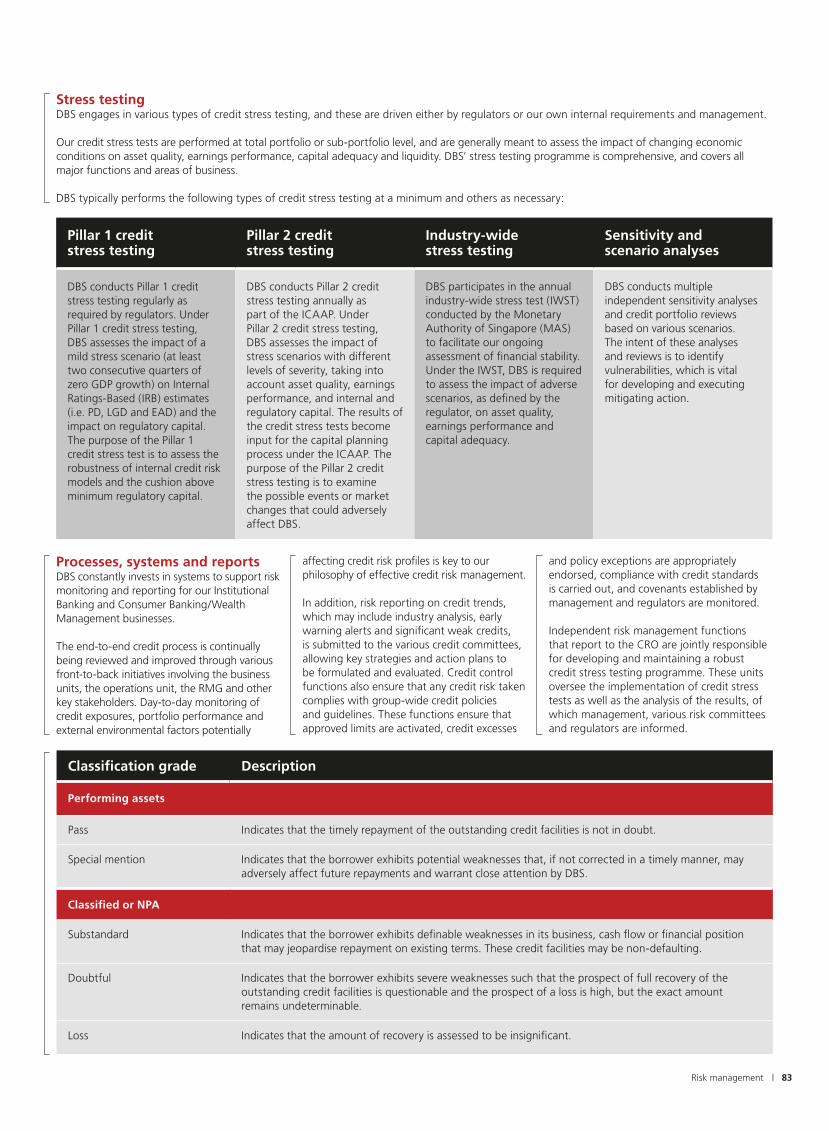
| 83Risk management
Stress testingDBS engages in various types of credit stress testing, and these are driven either by regulators or our own internal requirements and management.
Our credit stress tests are performed at total portfolio or sub-portfolio level, and are generally meant to assess the impact of changing economic conditions on asset quality, earnings performance, capital adequacy and liquidity. DBS’ stress testing programme is comprehensive, and covers all major functions and areas of business.
DBS typically performs the following types of credit stress testing at a minimum and others as necessary:
affecting credit risk profiles is key to our philosophy of effective credit risk management.
In addition, risk reporting on credit trends, which may include industry analysis, early warning alerts and significant weak credits, is submitted to the various credit committees, allowing key strategies and action plans to be formulated and evaluated. Credit control functions also ensure that any credit risk taken complies with group-wide credit policies and guidelines. These functions ensure that approved limits are activated, credit excesses
and policy exceptions are appropriately endorsed, compliance with credit standards is carried out, and covenants established by management and regulators are monitored.
Independent risk management functions that report to the CRO are jointly responsible for developing and maintaining a robust credit stress testing programme. These units oversee the implementation of credit stress tests as well as the analysis of the results, of which management, various risk committees and regulators are informed.
Classification grade Description
Performing assets
Pass Indicates that the timely repayment of the outstanding credit facilities is not in doubt.
Special mention Indicates that the borrower exhibits potential weaknesses that, if not corrected in a timely manner, may adversely affect future repayments and warrant close attention by DBS.
Classified or NPA
Substandard Indicates that the borrower exhibits definable weaknesses in its business, cash flow or financial position that may jeopardise repayment on existing terms. These credit facilities may be non-defaulting.
Doubtful Indicates that the borrower exhibits severe weaknesses such that the prospect of full recovery of the outstanding credit facilities is questionable and the prospect of a loss is high, but the exact amount remains undeterminable.
Loss Indicates that the amount of recovery is assessed to be insignificant.
Pillar 1 credit stress testing
Pillar 2 credit stress testing
Industry-wide stress testing
Sensitivity and scenario analyses
DBS conducts Pillar 1 credit stress testing regularly as required by regulators. Under Pillar 1 credit stress testing, DBS assesses the impact of a mild stress scenario (at least two consecutive quarters of zero GDP growth) on Internal Ratings-Based (IRB) estimates (i.e. PD, LGD and EAD) and the impact on regulatory capital. The purpose of the Pillar 1 credit stress test is to assess the robustness of internal credit risk models and the cushion above minimum regulatory capital.
DBS conducts Pillar 2 credit stress testing annually as part of the ICAAP. Under Pillar 2 credit stress testing, DBS assesses the impact of stress scenarios with different levels of severity, taking into account asset quality, earnings performance, and internal and regulatory capital. The results of the credit stress tests become input for the capital planning process under the ICAAP. The purpose of the Pillar 2 credit stress testing is to examine the possible events or market changes that could adversely affect DBS.
DBS participates in the annual industry-wide stress test (IWST) conducted by the Monetary Authority of Singapore (MAS) to facilitate our ongoing assessment of financial stability. Under the IWST, DBS is required to assess the impact of adverse scenarios, as defined by the regulator, on asset quality, earnings performance and capital adequacy.
DBS conducts multiple independent sensitivity analyses and credit portfolio reviews based on various scenarios. The intent of these analyses and reviews is to identify vulnerabilities, which is vital for developing and executing mitigating action.
Processes, systems and reportsDBS constantly invests in systems to support risk monitoring and reporting for our Institutional Banking and Consumer Banking/Wealth Management businesses.
The end-to-end credit process is continually being reviewed and improved through various front-to-back initiatives involving the business units, the operations unit, the RMG and other key stakeholders. Day-to-day monitoring of credit exposures, portfolio performance and external environmental factors potentially
84 | DBS Annual Report 2016
Non-performing assetsDBS’ credit facilities are classified as “Performing assets” or “Non-performing assets” (NPA), in accordance with the MAS Notice to Banks No. 612 “Credit Files, Grading and Provisioning” (MAS Notice 612).
These guidelines require credit portfolios to be categorised into one of the following five categories, according to our assessment of a borrower’s ability to repay a credit facility from its normal sources of income.
The link between the MAS categories shown below and DBS’ internal ratings is shown in Section 5.3.2 on page 85.
A default is considered to have occurred with regard to a particular borrower when either or both of the following events have taken place:
• Subjective default: Borrower is considered to be unlikely to pay its credit obligations in full, without DBS taking action such as realising security (if held)
• Technical default: Borrower is more than 90 days past due on any credit obligation to DBS
This is consistent with the guidance provided under the MAS’ Notice to Banks No. 637 “Notice on Risk Based Capital Adequacy Requirements for Banks incorporated in Singapore” (MAS Notice 637).
Credit facilities are classified as restructured assets when we grant non-commercial concessions to a borrower because it is in a worse financial position or is unable to meet the original repayment schedule. A restructured credit facility is classified into the appropriate non-performing grade based on the assessment of the borrower’s financial condition and its ability to repay according to the restructured terms.
Such credit facilities are not returned to the performing status until there are reasonable grounds to conclude that the borrower will be able to service all future principal and interest payments on the credit facility in accordance with the restructured terms. Apart from what has been described, we do not grant concessions to borrowers in the normal course of business. Any restructuring of credit facilities are reviewed on a case-by-case basis and conducted only on commercial terms.
In addition, it is not within DBS’ business model to acquire debts that have been restructured at inception (e.g. distressed debts).
Please refer to Note 2.11 to the financial statements on page 129 for our accounting policies regarding specific and general allowances for credit losses.
In general, specific allowances are recognised for defaulting credit exposures rated substandard and below.
The breakdown of our NPA by loan grading and industry and the related amounts of specific allowances can be found in Note 41.2 to the financial statements on page 165. A breakdown of past due loans can also be found in the same note.
When required, we will take possession of all collateral and dispose of them as soon as practicable. Realised proceeds are used to reduce outstanding indebtedness.
A breakdown of collateral held for NPA is shown in Note 41.2 to the financial statements on page 168.
Repossessed collateral is classified in the balance sheet as other assets. The amounts of such other assets for 2016 and 2015 were not material.
5.2 Credit risk mitigants
Collateral receivedWhere possible, DBS takes collateral as a secondary recourse to the borrower. This includes cash, marketable securities, properties, trade receivables, inventory and equipment, and other physical and/or financial collateral. We may also take fixed and floating charges on the assets of borrowers.
Policies are in place to determine the eligibility of collateral for credit risk mitigation. These include requiring specific collateral to meet minimum operational requirements in order to be considered as effective risk mitigants. DBS’ collateral is generally diversified and valued periodically. Properties constitute the bulk of our collateral, while marketable securities and cash are immaterial.
For derivatives, repurchase agreements (repo) and other repo-style transactions with financial market counterparties, collateral arrangements are typically covered under market-standard documentation, such as Master Repurchase Agreements and International Swaps and Derivatives Association (ISDA) Agreements. The collateral received is mark-to-market on a frequency DBS and the counterparties mutually agreed upon. This is governed by internal guidelines with respect to the eligibility of the collateral. In the event of a default, the credit risk exposure is reduced by master-netting arrangements where DBS is allowed to offset what we owe a counterparty against what is due from that counterparty in a netting-eligible jurisdiction.
Please refer to Note 14 to the financial statements on page 137 for further information on financial assets and liabilities subject to netting agreement but not offset on the balance sheet.
Collateral held against derivatives generally consists of cash in major currencies and highly rated government or quasi-government bonds. Exceptions may arise in certain countries,
where due to domestic capital markets and business conditions, the bank may be required to accept less highly rated or liquid government bonds and currencies. Reverse repo-transactions are generally limited to large institutions with reasonably good credit standing. The bank takes haircuts against the underlying collateral of these transactions that commensurate with collateral quality to ensure credit risks are adequately mitigated.
In times of difficulty, we will review the customer’s specific situation and circumstances to assist them in restructuring their repayment liabilities. However, should the need arise, disposal and recovery processes are in place to dispose of collateral held by DBS. We also maintain a panel of agents and solicitors that helps us to dispose of non-liquid assets and specialised equipment quickly.
Collateral postedDBS is required to post additional collateral in the event of a rating downgrade. As at 31 December 2016, for a three-notch downgrade of its Standard & Poor’s Ratings Services and Moody’s Investors Services ratings, DBS Bank will have to post additional collateral amounting to SGD 44 million (2015: SGD 57 million).
Other risk mitigantsDBS uses guarantees as credit risk mitigants. Internal thresholds for considering the eligibility of guarantors for credit risk mitigation are in place.
5.3 Internal credit risk modelsDBS adopts rating systems for the different asset classes under the Internal Ratings-Based Approach (IRBA).
There is a robust governance process for the development, independent validation and approval of any credit risk model. The models go through a rigorous review process before they are endorsed by the GCRMC and the Risk ExCo. They must also be approved by the BRMC before being used. The key risk measures generated by the internal credit risk rating models to quantify regulatory capital include PD, LGD and EAD. For portfolios under the Foundation IRBA, the supervisory LGD estimates are applied. For retail portfolios under the Advanced IRBA, internal estimates are used. In addition, the ratings from the credit models act as the basis for underwriting credit risk, monitoring portfolio performance and determining business strategies.
The performance of the rating systems is monitored regularly and informed to the GCRMC and the BRMC to ensure their ongoing effectiveness. This serves to highlight material deterioration in the rating systems for management attention.
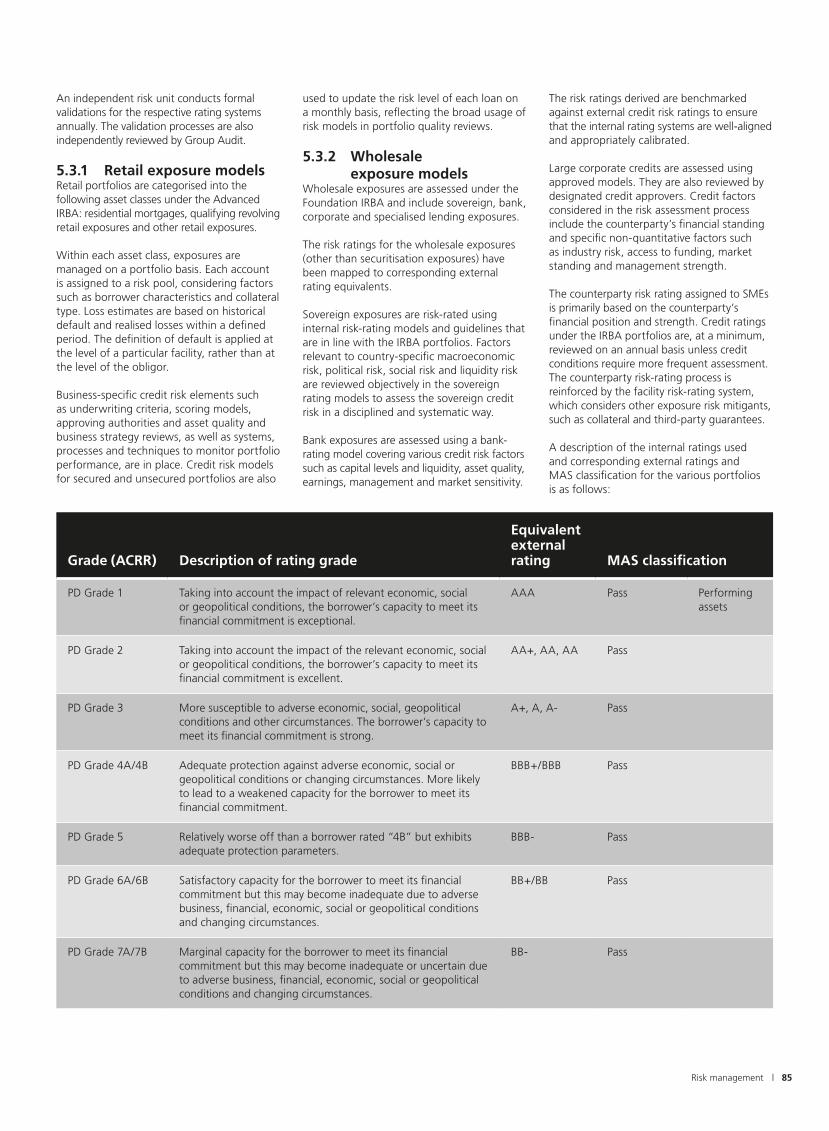
| 85Risk management
An independent risk unit conducts formal validations for the respective rating systems annually. The validation processes are also independently reviewed by Group Audit.
5.3.1 Retail exposure modelsRetail portfolios are categorised into the following asset classes under the Advanced IRBA: residential mortgages, qualifying revolving retail exposures and other retail exposures.
Within each asset class, exposures are managed on a portfolio basis. Each account is assigned to a risk pool, considering factors such as borrower characteristics and collateral type. Loss estimates are based on historical default and realised losses within a defined period. The definition of default is applied at the level of a particular facility, rather than at the level of the obligor.
Business-specific credit risk elements such as underwriting criteria, scoring models, approving authorities and asset quality and business strategy reviews, as well as systems, processes and techniques to monitor portfolio performance, are in place. Credit risk models for secured and unsecured portfolios are also
used to update the risk level of each loan on a monthly basis, reflecting the broad usage of risk models in portfolio quality reviews.
5.3.2 Wholesale exposure models
Wholesale exposures are assessed under the Foundation IRBA and include sovereign, bank, corporate and specialised lending exposures.
The risk ratings for the wholesale exposures (other than securitisation exposures) have been mapped to corresponding external rating equivalents.
Sovereign exposures are risk-rated using internal risk-rating models and guidelines that are in line with the IRBA portfolios. Factors relevant to country-specific macroeconomic risk, political risk, social risk and liquidity risk are reviewed objectively in the sovereign rating models to assess the sovereign credit risk in a disciplined and systematic way.
Bank exposures are assessed using a bank-rating model covering various credit risk factors such as capital levels and liquidity, asset quality, earnings, management and market sensitivity.
The risk ratings derived are benchmarked against external credit risk ratings to ensure that the internal rating systems are well-aligned and appropriately calibrated.
Large corporate credits are assessed using approved models. They are also reviewed by designated credit approvers. Credit factors considered in the risk assessment process include the counterparty’s financial standing and specific non-quantitative factors such as industry risk, access to funding, market standing and management strength.
The counterparty risk rating assigned to SMEs is primarily based on the counterparty’s financial position and strength. Credit ratings under the IRBA portfolios are, at a minimum, reviewed on an annual basis unless credit conditions require more frequent assessment. The counterparty risk-rating process is reinforced by the facility risk-rating system, which considers other exposure risk mitigants, such as collateral and third-party guarantees.
A description of the internal ratings used and corresponding external ratings and MAS classification for the various portfolios is as follows:
Grade (ACRR) Description of rating grade
Equivalent external rating MAS classification
PD Grade 1 Taking into account the impact of relevant economic, social or geopolitical conditions, the borrower’s capacity to meet its financial commitment is exceptional.
AAA Pass Performing assets
PD Grade 2 Taking into account the impact of the relevant economic, social or geopolitical conditions, the borrower’s capacity to meet its financial commitment is excellent.
AA+, AA, AA Pass
PD Grade 3 More susceptible to adverse economic, social, geopolitical conditions and other circumstances. The borrower’s capacity to meet its financial commitment is strong.
A+, A, A- Pass
PD Grade 4A/4B Adequate protection against adverse economic, social or geopolitical conditions or changing circumstances. More likely to lead to a weakened capacity for the borrower to meet its financial commitment.
BBB+/BBB Pass
PD Grade 5 Relatively worse off than a borrower rated “4B” but exhibits adequate protection parameters.
BBB- Pass
PD Grade 6A/6B Satisfactory capacity for the borrower to meet its financial commitment but this may become inadequate due to adverse business, financial, economic, social or geopolitical conditions and changing circumstances.
BB+/BB Pass
PD Grade 7A/7B Marginal capacity for the borrower to meet its financialcommitment but this may become inadequate or uncertain due to adverse business, financial, economic, social or geopolitical conditions and changing circumstances.
BB- Pass

86 | DBS Annual Report 2016
Grade (ACRR) Description of rating grade
Equivalent external rating MAS classification
PD Grade 8A Sub-marginal capacity for the borrower to meet its financial commitment. Adverse business, financial or economic conditions will likely impair its capacity or willingness to meet its financial commitment.
B+ Pass
PD Grade8B/8C(a)
Low capacity for the borrower to meet its financialcommitment. Adverse business, financial or economic conditions will likely impair its capacity or willingness to meet its financial commitment.
B/B- Specialmention
PD Grade 9 Borrower is vulnerable to non-payment and is dependent upon favourable business, financial and economic conditions to meet its financial commitment. Likely to have little capacity to meet its financial commitment under adverse conditions.
CCC-C Substandard(non-defaulting)
Non-performingassets
PD Grade 10and above
A borrower rated “10” and above is in default (as defined under MAS Notice 637).
D Substandardand below(defaulting)
(a) For companies scored by the HK SME Scoring Model, in addition to the ACRR, there is a further test to evaluate whether the borrower meets the criteria of Special mention. If it does not, the ACRR can remain as 8B/8C but is not classified as Special mention
5.3.3 Specialised lending exposures
Specialised lending IRBA portfolios include income-producing real estate, project finance, object finance, hotel finance and commodities finance. These adopt the supervisory slotting criteria specified under Annex 7v of MAS Notice 637, which are used to determine the risk weights to calculate credit risk-weighted exposures.
5.3.4 Securitisation exposuresDBS is not active in securitisation activities that are motivated by credit risk transfer or other strategic considerations. As a result,we do not securitise our own assets, nor do we acquire assets with the view of securitising them. We arrange securitisation transactions for our clients for fees. These transactions do not involve special-purpose entities we control. For transactions that are not underwritten, no securitisation exposures are assumed as a direct consequence of arranging the transactions. Any decision to invest in any of such arranged transactions is subject to independent risk assessment.
Where DBS provides an underwriting commitment, any securitisation exposure that arises will be held in the trading book to be traded or sold down in accordance with our internal policy and risk limits. In addition, DBS does not provide implicit support for any transactions we structure or have invested in.
We invest in our clients’ securitisation transactions from time to time. These may include securitisation transactions arranged by us or other parties. We may also act as a liquidity facility provider, working capital facility provider or swap counterparty. Such exposures require the approval of the independent risk function, and are subject to regular risk reviews after they take place. We also have processes in place to monitor the credit risk of our securitisation exposures.
5.3.5 Credit exposures falling outside internal credit risk models
DBS applies the standardised approach (SA) for portfolios that are individually immaterial in terms of both size and risk profile, as wellas for identified transitioning portfolios. These portfolios include:
• IRBA-transitioning retail and wholesale exposures
• IRBA-exempt retail exposures• IRBA-exempt wholesale exposures
Any identified transitioning retail and wholesale exposures are expected to go through the Advanced IRBA and Foundation IRBA respectively, subject to certification by MAS. In the meantime, the SA will have been applied. The portfolios under the SA are subject to our overall governance framework and credit risk management practices. DBS will continue to monitor the size and risk profile of these portfolios, and will enhance the relevant risk measurement processes if these risk exposures become material.
DBS uses external ratings for credit exposures under the SA where relevant, and we only accept ratings from Standard & Poor’s, Moody’s and Fitch in such cases. DBS follows the process prescribed in MAS Notice 637 to map the ratings to the relevant risk weights.
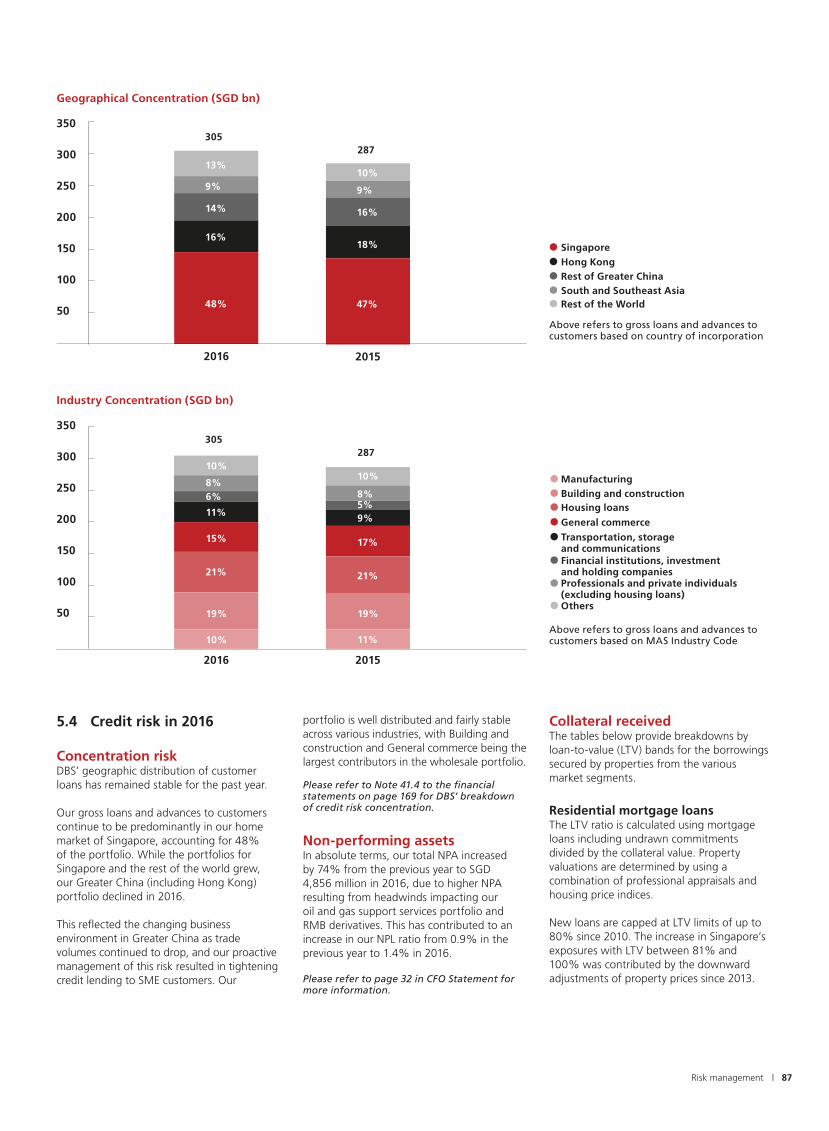
| 87
350
300
250
200
150
100
50
Risk management
2015
19%
21%
17%
9%5%8%
10%
11%
Singapore
South and Southeast Asia
Hong KongRest of Greater China
Rest of the World
Geographical Concentration (SGD bn)
Above refers to gross loans and advances to customers based on country of incorporation
48%
16%
14%
9%
13%
305
305
287
287
2016
18%
16%
9%
10%
47%
2015
19%
21%
15%
11%
6%8%
10%
10%
2016
Industry Concentration (SGD bn)
Above refers to gross loans and advances to customers based on MAS Industry Code
Financial institutions, investment and holding companies
Manufacturing
General commerce
Professionals and private individuals (excluding housing loans)
Building and constructionHousing loans
Transportation, storage and communications
Others
5.4 Credit risk in 2016
Concentration riskDBS’ geographic distribution of customer loans has remained stable for the past year.
Our gross loans and advances to customers continue to be predominantly in our home market of Singapore, accounting for 48% of the portfolio. While the portfolios for Singapore and the rest of the world grew, our Greater China (including Hong Kong) portfolio declined in 2016.
This reflected the changing business environment in Greater China as trade volumes continued to drop, and our proactive management of this risk resulted in tightening credit lending to SME customers. Our
portfolio is well distributed and fairly stable across various industries, with Building and construction and General commerce being the largest contributors in the wholesale portfolio.
Please refer to Note 41.4 to the financial statements on page 169 for DBS’ breakdown of credit risk concentration.
Non-performing assetsIn absolute terms, our total NPA increased by 74% from the previous year to SGD 4,856 million in 2016, due to higher NPA resulting from headwinds impacting our oil and gas support services portfolio and RMB derivatives. This has contributed to an increase in our NPL ratio from 0.9% in the previous year to 1.4% in 2016.
Please refer to page 32 in CFO Statement for more information.
Collateral receivedThe tables below provide breakdowns by loan-to-value (LTV) bands for the borrowings secured by properties from the various market segments.
Residential mortgage loansThe LTV ratio is calculated using mortgage loans including undrawn commitments divided by the collateral value. Property valuations are determined by using a combination of professional appraisals and housing price indices.
New loans are capped at LTV limits of up to 80% since 2010. The increase in Singapore’s exposures with LTV between 81% and 100% was contributed by the downward adjustments of property prices since 2013.
350
300
250
200
150
100
50

88 | DBS Annual Report 2016
Loans and advances to corporates secured by propertyThese loans are extended for the purpose of acquisition and/or development of real estate, as well as for general working capital. 90% of our loans are fully collateralised, as compared to 86% in 2015. Majority of these loans have LTV <80%. Our property loans are mainly concentrated in Singapore and Hong Kong, which together accounted for 84% of total property loans.
The LTV ratio is calculated as loans and advances divided by the value of property, including other tangible collaterals that secure the same facility. The latter include cash, marketable securities, bank guarantees, vessels, and aircrafts. Where collateral assets are shared by multiple loans and advances, the collateral value is pro-rated across the loans and advances secured by the collateral.
50.8%
75.3%
Percentage of residential mortgage loans (breakdown by LTV band and geography)
Singapore
Singapore
Hong Kong
Hong Kong
Rest of Greater China
Rest of Greater China
South and Southeast Asia
South and Southeast Asia
23.0%
25.1%
36.4%
38.8%
31.6%
35.2%
96.5%
96.3%
61.8%
60.7%
45.1%
44.7%
67.9%
64.8%
3.4%
3.6%
15.2%
14.2%
18.3%
16.5%
0.5%
0.0%
0.1%
0.1%
0.0%
0.0%
0.2%
0.0%
0.0%
0.0%
0.0%
0.0%
LTV band
LTV band
As at 31 December 2016
As at 31 December 2015
Up to 50%
Up to 50%
51% to 80%
51% to 80%
81% to 100%
81% to 100%
Partially collateralised
Partially collateralised
Percentage of loans and advances to corporates secured by property (breakdown by LTV band and geography)
51.2%
53.7%
63.8%
52.4%
50.0%
47.5%
32.8%
10.3%
22.8%
37.9%
35.7%
15.0%
19.6%
22.4%
17.5%
33.3%
27.0% 47.5%
6.7%
5.9%
9.9%
7.8%
7.0%
7.6%
6.8%
8.5%
0.0%
0.0%
4.2%
4.6%
11.3%
20.2%
20.6%
27.4%
27.1%
54.2%
1.9%
1.7%
As at 31 December 2016
As at 31 December 2015
Singapore
Singapore
Hong Kong
Hong Kong
Rest of Greater China
Rest of Greater China
South and Southeast Asia
Rest of the World
South and Southeast Asia
Rest of the World
LTV band
LTV band
Up to 50%
Up to 50%
51% to 80%
51% to 80%
81% to 100%
81% to 100%
Partially collateralised
Partially collateralised

| 89Risk management
Loans and advances to banksIn line with market convention, loans and advances to banks are typically unsecured. DBS manages the risk of such exposures by keeping tight control of the exposure tenor, and monitoring the credit quality of the bank counterparties.
Derivatives counterparty credit risk by markets and settlement methodsDBS continues to manage our derivatives counterparty risk exposures with netting and collateral arrangements, thereby protecting our balance sheet in the event of counterparty defaulting.
A breakdown of our derivatives counterparty credit risk by markets (OTC versus exchange-traded) and settlement methods (cleared through a central counterparty versus settled bilaterally) can be found below.
Notional OTC and exchange-traded products
In notional terms, SGD m
As at 31 Dec
2016
OTC derivatives cleared through a central counterparty
751,315
OTC derivatives settled bilaterally
1,301,713
Total OTC derivatives 2,053,028
Exchange-traded derivatives
17,515
Total derivatives (only with external parties)
2,070,543
Please refer to Note 37 to the financial statements on page 156 for a breakdown of the derivatives positions held by DBS.
(iii) strategic stakes in entities and (iv) structural foreign exchange risk arising mainly from our strategic investments, which are denominated in currencies other than the SGD.
6.1 Market risk management at DBS
DBS’ approach to market risk management comprises the following building blocks:
For back-testing, VaR at the 99% level of confidence and over a one-day holding period is used. We adopt the standardised approach to compute market risk regulatory capital under MAS Notice 637 for the trading book positions. As such, VaR back-testing does not impact our regulatory capital for market risk.
VaR models allow us to estimate the aggregate portfolio market risk potential loss due to a range of market risk factors and instruments. However, there are limitations to VaR models; for example, past changes in market risk factors may not provide accurate predictions of future market movements, and the risk arising from adverse market events may be understated.
To monitor DBS’ vulnerability to unexpected but plausible extreme market risk-related events, we conduct multiple market risk stress tests regularly. These cover trading and non-trading portfolios and follow a combination of historical and hypothetical scenarios depicting risk-factor movement.
ES is the key risk metric used to manage our assets and liabilities. As an exception, credit spread risk arising from loans and receivables is managed under the credit risk management framework. We also manage banking book interest rate risk arising from mismatches in the interest rate profiles of assets, liabilities and capital instruments (and associated hedges), which includes basis risk arising from different interest rate benchmarks, interest rate re-pricing risk, yield curve risk and embedded optionality. Behavioural assumptions are applied when managing the interest rate risk of banking book deposits with indeterminate maturities. DBS measures interest rate risk in the banking book on a weekly basis.
Credit derivatives are used in the trading book with single name or index underlying instruments to support DBS’ business strategy to build a regional fixed income franchise. We actively monitor our counterparty credit risk in credit derivative contracts.
More than 90% of the gross notional value of our credit derivative positions as at 31 December 2016 was to 19 established names, which we maintain collateral agreements with.
Processes, systems and reportsRobust internal control processes and systems have been designed and implemented to support our market risk management approach. DBS reviews these control processes and systems regularly, and these reviews allow senior management to assess their effectiveness.
The RMG Market and Liquidity Risk unit – an independent market risk management function reporting to the CRO – monitors, controls and analyses DBS’ market risk daily. The unit comprises risk control, risk analytics, production and reporting teams.
6 Market risk
Our exposure to market risk is categorised into:
Trading portfolios: Arising from positions taken for (i) market-making, (ii) client-facilitation and (iii) benefiting from market opportunities. Non-trading portfolios: Arising from (i) positions taken to manage the interest rate risk of our Institutional Banking and Consumer Banking assets and liabilities, (ii) equity investments comprising of investments held for yield and/or long-term capital gains,
Policies
Risk methodologies
Processes, systems and reports
Policies The Market Risk Management Policy sets our overall approach towards market risk management, while the Market Risk Management Standard establishes the basic requirements for the said management within DBS.
The Market Risk Management Guide complements the Market Risk Management Standard by providing more details regarding specific subject matters. Both the Market Risk Management Standard and Market Risk Management Guide facilitate the identification, measurement, control, monitoring and reporting of market risk in a consistent manner. They also set out the overall approach, standards and controls governing market risk stress testing across DBS.
The criteria for determining the positions to be included in the trading book are stipulated in the Trading Book Policy Statement.
Risk methodologiesValue-at-Risk (VaR) is a method that computes the potential losses of risk positions as a result of market movement over a specified time horizon and according to a given level of confidence.
Our VaR model is based on historical simulation with a one-day holding period. We use Expected Shortfall (ES), which is the average of potential loss beyond a given level of confidence, to monitor and limit market risk exposures. The market risk economic capital that is allocated by the BRMC is linked to ES by a multiplier. ES is supplemented by risk control metrics such as sensitivities to risk factors and loss triggers for management action.
DBS conducts back-testing to verify the predictiveness of the VaR model. Back-testing compares VaR calculated for positions at the close of each business day with the profit and loss (P&L) that actually arises in those positions on the following business day. The back-testing P&L excludes fees and commissions, and revenues from intra-day trading.

90 | DBS Annual Report 2016
6.2 Market risk in 2016DBS’ ES considers the market risks of both the trading and banking books. Our ES (based on a 97.5% level of confidence) is tabulated below. The period-end, average, high and low ES are shown.
1 Jan 2016 to 31 Dec 2016
SGD m As at 31 Dec 2016 Average High Low
Total 89 98 112 84
1 Jan 2016 to 31 Dec 2016
SGD m As at 31 Dec 2016 Average High Low
Diversified 26 21 31 14
Interest Rates 16 18 27 14
Foreign Exchange 10 12 18 7
Equity 1 2 3 1
Credit Spread 18 11 19 6
Commodity # # 1 #
1 Jan 2015 to 31 Dec 2015
SGD m As at 31 Dec 2015 Average High Low
Diversified 16 20 32 15
Interest Rates 17 15 21 9
Foreign Exchange 11 8 19 3
Equity 3 3 5 2
Credit Spread 8 16 23 7
Commodity # 1 2 #
1 Jan 2015 to 31 Dec 2015
SGD m As at 31 Dec 2015 Average High Low
Total 101 117 147 75
DBS’ major market risk driver is interest rate risk in the trading and banking books. The average ES for 2016 was lower than 2015 mainly due to drop-off of volatile rates scenarios for ES calculation and updates to models used to measure interest rate risks in banking book. The following table shows the period-end, average, high and low diversified ES and ES by risk class for Treasury’s trading portfolios. The ES reported below are based on a 97.5% level of confidence.
# Amount under SGD 500,000

| 91Risk management
At DBS, the main risk factors driving Treasury’s trading portfolios in 2016 were interest rates, foreign exchange and credit spreads. Treasury’s trading portfolios’ average diversified ES remained relatively flat compared to 2015.
Treasury’s trading portfolios experienced five back-testing exceptions in 2016. The exceptions occurred in January, February, March, September and December. The four exceptions for the period from January to September were mainly due to (i) pronounced volatilities in SGD interest rates and SGD swap spreads; and (ii) basis risks in onshore/offshore Chinese foreign exchange and interest rate. The exception in December was due to valuation adjustments carried out at the month end.
Backtesting profit and loss VaR at 99% confidence interval
40
30
20
10
0
-10
-20
-30
-40
J F M A M J J A S O N DSGD m
The key market risk drivers of our non-trading portfolios are SGD and USD interest rate positions. The economic value impact of changes in interest rates was simulated under various assumptions for the non-trading portfolio. The economic value changes were negative SGD 156 million and SGD 239 million (2015: negative SGD 250 million and SGD 425 million) based on interest rate changes of 100 basis points and 200 basis points respectively. The negative economic value impact declined in December 2016 mainly due to a refinement of the behavioural assumptions for current account balances.
7 Liquidity risk
DBS’ liquidity risk arises from our obligations to honour withdrawals of deposits, repayments of borrowed funds at maturity, and our commitments to extend loans to our customers. We seek to manage our liquidity in a manner that ensures that our liquidity obligations will continue to be honoured under normal as well as adverse circumstances.
7.1 Liquidity risk management at DBS
Liquidity management and funding strategyDBS strives to develop a diversified funding base with access to funding sources across retail and wholesale channels. Our funding strategy is anchored on strengthening our core deposit franchise as the foundation of the Group’s long-term funding advantage.
Customer deposits grew by SGD 27 billion in 2016, contributing to 93% of total funding sources. Current and savings deposits, which are favourable for the liquidity coverage ratio, were the main drivers of growth with an increase of SGD 18 billion. Within wholesale funding, senior medium term notes were gradually replaced with covered bonds which are more cost effective.
Wholesale Funding Breakdown (SGD bn)
28
38
19%8%
42%
23%
2016
Other debt securities
Negotiable certificates of deposits
Senior medium term notes
Covered bonds
Commercial papers
17%3%
4%
50%
26%
2015
40
35
30
25
20
15
10
5
8%
Funding Sources (SGD bn)
93%
375
7%
89%
358
11%
2016 2015
Customer deposits
Wholesale funding
400
350
300
250
200
150
100
50
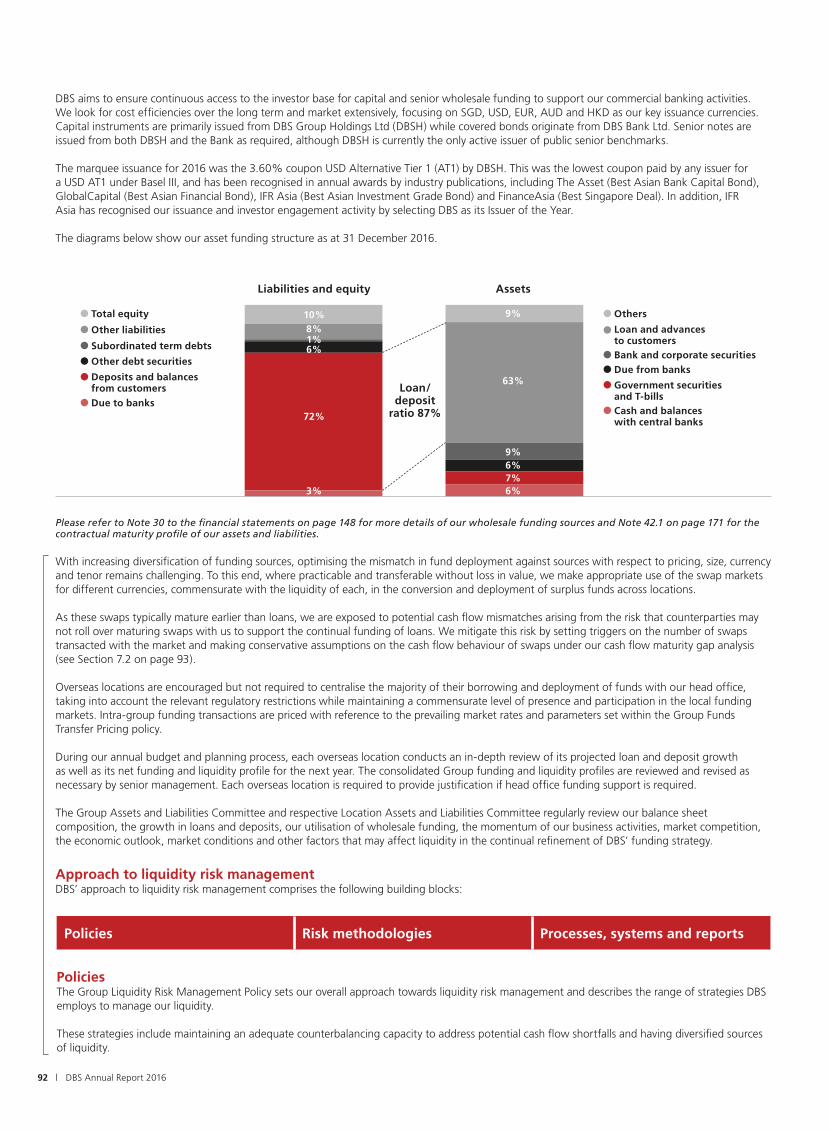
92 | DBS Annual Report 2016
DBS aims to ensure continuous access to the investor base for capital and senior wholesale funding to support our commercial banking activities. We look for cost efficiencies over the long term and market extensively, focusing on SGD, USD, EUR, AUD and HKD as our key issuance currencies. Capital instruments are primarily issued from DBS Group Holdings Ltd (DBSH) while covered bonds originate from DBS Bank Ltd. Senior notes are issued from both DBSH and the Bank as required, although DBSH is currently the only active issuer of public senior benchmarks.
The marquee issuance for 2016 was the 3.60% coupon USD Alternative Tier 1 (AT1) by DBSH. This was the lowest coupon paid by any issuer for a USD AT1 under Basel III, and has been recognised in annual awards by industry publications, including The Asset (Best Asian Bank Capital Bond), GlobalCapital (Best Asian Financial Bond), IFR Asia (Best Asian Investment Grade Bond) and FinanceAsia (Best Singapore Deal). In addition, IFR Asia has recognised our issuance and investor engagement activity by selecting DBS as its Issuer of the Year.
The diagrams below show our asset funding structure as at 31 December 2016.
Total equity
Other debt securities
Other liabilities
Deposits and balances from customers
Subordinated term debts
Due to banks
Others
Due from banks
Loan and advances to customers
Government securities and T-bills
Bank and corporate securities
Cash and balances with central banks
Assets
9%
63%
9%6%7%6%
Liabilities and equity
10%8%1%6%
72%
3%
Loan/deposit
ratio 87%
Please refer to Note 30 to the financial statements on page 148 for more details of our wholesale funding sources and Note 42.1 on page 171 for the contractual maturity profile of our assets and liabilities.
With increasing diversification of funding sources, optimising the mismatch in fund deployment against sources with respect to pricing, size, currency and tenor remains challenging. To this end, where practicable and transferable without loss in value, we make appropriate use of the swap markets for different currencies, commensurate with the liquidity of each, in the conversion and deployment of surplus funds across locations.
As these swaps typically mature earlier than loans, we are exposed to potential cash flow mismatches arising from the risk that counterparties may not roll over maturing swaps with us to support the continual funding of loans. We mitigate this risk by setting triggers on the number of swaps transacted with the market and making conservative assumptions on the cash flow behaviour of swaps under our cash flow maturity gap analysis (see Section 7.2 on page 93).
Overseas locations are encouraged but not required to centralise the majority of their borrowing and deployment of funds with our head office, taking into account the relevant regulatory restrictions while maintaining a commensurate level of presence and participation in the local funding markets. Intra-group funding transactions are priced with reference to the prevailing market rates and parameters set within the Group Funds Transfer Pricing policy.
During our annual budget and planning process, each overseas location conducts an in-depth review of its projected loan and deposit growth as well as its net funding and liquidity profile for the next year. The consolidated Group funding and liquidity profiles are reviewed and revised as necessary by senior management. Each overseas location is required to provide justification if head office funding support is required.
The Group Assets and Liabilities Committee and respective Location Assets and Liabilities Committee regularly review our balance sheet composition, the growth in loans and deposits, our utilisation of wholesale funding, the momentum of our business activities, market competition, the economic outlook, market conditions and other factors that may affect liquidity in the continual refinement of DBS’ funding strategy.
Approach to liquidity risk managementDBS’ approach to liquidity risk management comprises the following building blocks:
Policies Risk methodologies Processes, systems and reports
PoliciesThe Group Liquidity Risk Management Policy sets our overall approach towards liquidity risk management and describes the range of strategies DBS employs to manage our liquidity.
These strategies include maintaining an adequate counterbalancing capacity to address potential cash flow shortfalls and having diversified sources of liquidity.
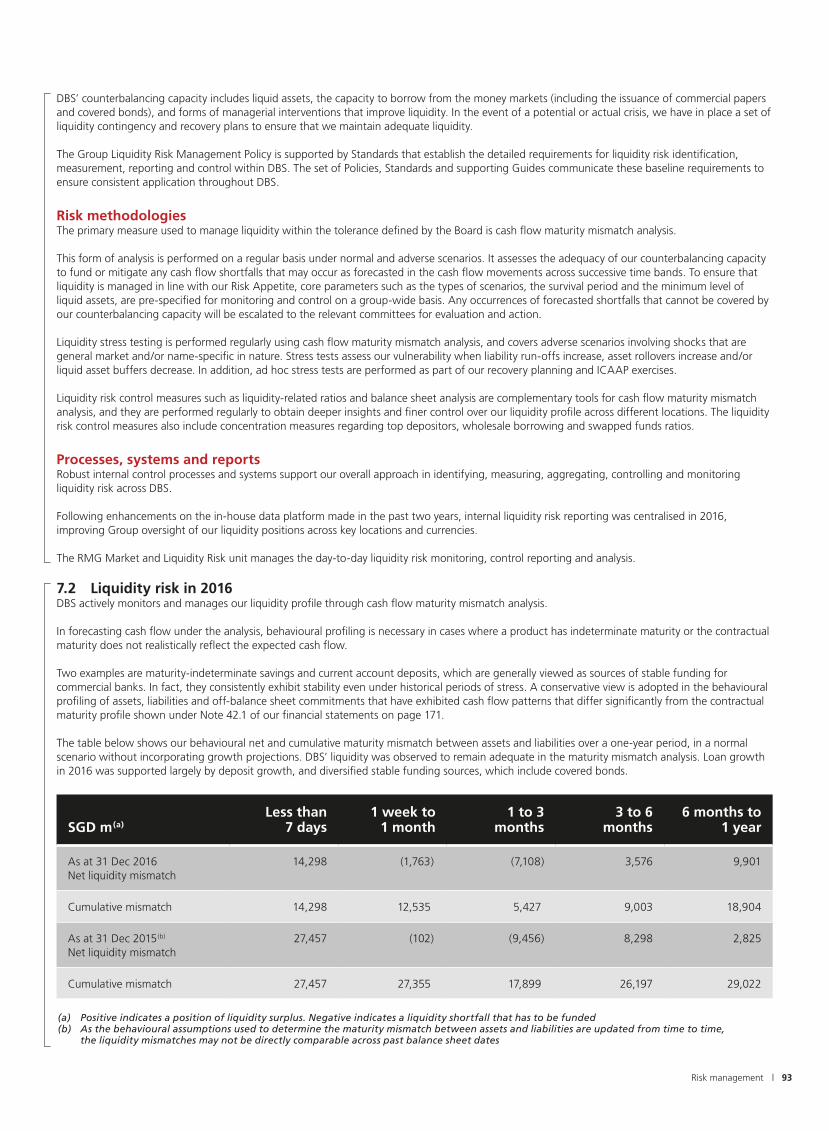
| 93Risk management
DBS’ counterbalancing capacity includes liquid assets, the capacity to borrow from the money markets (including the issuance of commercial papers and covered bonds), and forms of managerial interventions that improve liquidity. In the event of a potential or actual crisis, we have in place a set of liquidity contingency and recovery plans to ensure that we maintain adequate liquidity.
The Group Liquidity Risk Management Policy is supported by Standards that establish the detailed requirements for liquidity risk identification, measurement, reporting and control within DBS. The set of Policies, Standards and supporting Guides communicate these baseline requirements to ensure consistent application throughout DBS.
Risk methodologiesThe primary measure used to manage liquidity within the tolerance defined by the Board is cash flow maturity mismatch analysis.
This form of analysis is performed on a regular basis under normal and adverse scenarios. It assesses the adequacy of our counterbalancing capacity to fund or mitigate any cash flow shortfalls that may occur as forecasted in the cash flow movements across successive time bands. To ensure that liquidity is managed in line with our Risk Appetite, core parameters such as the types of scenarios, the survival period and the minimum level of liquid assets, are pre-specified for monitoring and control on a group-wide basis. Any occurrences of forecasted shortfalls that cannot be covered by our counterbalancing capacity will be escalated to the relevant committees for evaluation and action.
Liquidity stress testing is performed regularly using cash flow maturity mismatch analysis, and covers adverse scenarios involving shocks that are general market and/or name-specific in nature. Stress tests assess our vulnerability when liability run-offs increase, asset rollovers increase and/or liquid asset buffers decrease. In addition, ad hoc stress tests are performed as part of our recovery planning and ICAAP exercises.
Liquidity risk control measures such as liquidity-related ratios and balance sheet analysis are complementary tools for cash flow maturity mismatch analysis, and they are performed regularly to obtain deeper insights and finer control over our liquidity profile across different locations. The liquidity risk control measures also include concentration measures regarding top depositors, wholesale borrowing and swapped funds ratios.
Processes, systems and reportsRobust internal control processes and systems support our overall approach in identifying, measuring, aggregating, controlling and monitoring liquidity risk across DBS.
Following enhancements on the in-house data platform made in the past two years, internal liquidity risk reporting was centralised in 2016, improving Group oversight of our liquidity positions across key locations and currencies.
The RMG Market and Liquidity Risk unit manages the day-to-day liquidity risk monitoring, control reporting and analysis.
7.2 Liquidity risk in 2016DBS actively monitors and manages our liquidity profile through cash flow maturity mismatch analysis.
In forecasting cash flow under the analysis, behavioural profiling is necessary in cases where a product has indeterminate maturity or the contractual maturity does not realistically reflect the expected cash flow.
Two examples are maturity-indeterminate savings and current account deposits, which are generally viewed as sources of stable funding for commercial banks. In fact, they consistently exhibit stability even under historical periods of stress. A conservative view is adopted in the behavioural profiling of assets, liabilities and off-balance sheet commitments that have exhibited cash flow patterns that differ significantly from the contractual maturity profile shown under Note 42.1 of our financial statements on page 171.
The table below shows our behavioural net and cumulative maturity mismatch between assets and liabilities over a one-year period, in a normal scenario without incorporating growth projections. DBS’ liquidity was observed to remain adequate in the maturity mismatch analysis. Loan growth in 2016 was supported largely by deposit growth, and diversified stable funding sources, which include covered bonds.
SGD m(a)Less than
7 days1 week to
1 month1 to 3
months3 to 6
months 6 months to
1 year
As at 31 Dec 2016Net liquidity mismatch
14,298 (1,763) (7,108) 3,576 9,901
Cumulative mismatch 14,298 12,535 5,427 9,003 18,904
As at 31 Dec 2015(b)
Net liquidity mismatch27,457 (102) (9,456) 8,298 2,825
Cumulative mismatch 27,457 27,355 17,899 26,197 29,022
(a) Positive indicates a position of liquidity surplus. Negative indicates a liquidity shortfall that has to be funded(b) As the behavioural assumptions used to determine the maturity mismatch between assets and liabilities are updated from time to time,
the liquidity mismatches may not be directly comparable across past balance sheet dates

94 | DBS Annual Report 2016
Liquid assets Others[d] Total
SGD mEncumbered Unencumbered Total
[1] Average(c)
[2] [1] + [2]
As at 31 Dec 2016Cash and balances with central banks(a)
6,708 9,797 16,505 15,458 10,335 26,840
Due from banks(b) – 8,425 8,425 7,486 21,593 30,018
Government securities and treasury bills
2,810 29,451 32,261 35,052 1,140 33,401
Banks and corporate securities
414 31,793 32,207 29,978 13,210 45,417
Total 9,932 79,466 89,398 87,974 46,278 135,676
7.3 Liquid assetsLiquid assets are assets that are readily available and can be easily monetised to meet obligations and expenses under times of stress.
Such assets are internally defined under the governance of the relevant oversight committees, taking into account asset class, issuer type and credit rating, among other criteria, before they are reflected as available funds through cash flow maturity mismatch analysis. DBS’ Treasury function expects to be able to operationally monetise our pool of liquid assets to meet liquidity shortfalls when the need arises. These liquid assets must be unencumbered and free of any legal, regulatory, contractual or other restrictions.
In practice, liquid assets are maintained in key locations and currencies to ensure that operating entities in such locations possess a degree of self-sufficiency to support business needs and guard against contingencies. The main portion of our liquid assets is centrally maintained in Singapore to support liquidity needs in smaller overseas subsidiaries and branches. Internally, DBS sets a requirement to maintain its pool of liquid assets above a minimum level as a source of contingent funds, taking into account projected stress shortfalls under its cash flow maturity mismatch analysis and other factors.
The table below shows DBS’ encumbered and unencumbered liquid assets by instrument and counterparty against other assets in the same category under the balance sheet. The figures are based on the carrying amount at the balance sheet date.
(a) Unencumbered balances with central banks comprise holdings that are unrestricted and available overnight. The encumbered portion represents the mandatory balances held with central banks, which includes a minimum cash balance (MCB) amount that may be available for use under a liquidity stress situation. The “Others” portion include term placements with central banks
(b) Liquid assets comprise nostro accounts and eligible certificates of deposits(c) Total liquid assets reflected on an average basis over the four quarters in 2016(d) “Others” refer to assets that are not recognised as part of the available pool of liquid assets for liquidity management under stress due to
(but not limited to) inadequate or non-rated credit quality, operational challenges in monetisation (e.g. holdings in physical scrips), and other considerations
In addition to the above table, collateral received in reverse repo-transactions amounting to SGD 5,649 million were recognised for liquidity management under stress. It can be observed from the table that our funding strategy in the normal course of business does not rely on collateralised wholesale funding. Instead, liquid assets are usually maintained only as a source of contingent funding.
7.4 Regulatory requirementsUnder MAS’ Notice to Banks No. 649 “Minimum Liquid Assets (MLA) and Liquidity Coverage Ratio (LCR)” (MAS Notice 649), DBS, as a domestic bank incorporated and headquartered in Singapore, is required to comply with the LCR standards. For the full year of 2016, Group LCR was maintained well above the minimum LCR requirements under MAS Notice 649. Based on our internal assessment and participation in the Quantitative Impact Studies by the Basel Committee on Banking Supervision, DBS is well-positioned to meet the minimum standards of the Basel III Net Stable Funding Ratio (NSFR), which will be implemented by 1 January 2018.

| 95Risk management
8 Operational risk Operational risk includes processing errors, fraudulent acts, inappropriate behaviour of staff, vendor misperformance, system failure and natural disasters. Operational risk is inherent in our businesses and activities.
DBS’ objective is to keep operational risk at appropriate levels, taking into account the markets we operate in, the characteristics of the businesses as well as our economic and regulatory environment.
8.1 Operational risk management at DBS
DBS’ approach to operational risk management comprises the following building blocks:
based on certain established thresholds. Key risk indicators with pre-defined escalation triggers are employed to facilitate risk monitoring in a forward-looking manner.
Additional methodologies are in place to address subject-specific risks, including, but not limited to, the following:
Technology riskInformation Technology (IT) risk is managed through an enterprise technology risk approach. This covers risk governance, communication, monitoring, assessment, mitigation and acceptance, and is supported by a set of IT policies and standards, control processes and risk mitigation programmes.
We have also established policies and standards to manage and address cyber security risk. To enhance the management of this risk, we have appointed a Chief Information Security Officer who is responsible for our cyber security risk management strategy and programme.
Compliance risk Compliance risk refers to the risk of DBS not being able to successfully conduct our business because of any failure to comply with laws, regulatory requirements, industry codes or standards of business and professional conduct applicable to the financial sector.
This includes, in particular, laws and regulations applicable to the licensing and conducting of banking or other financial businesses, financial crime such as anti-money laundering and countering the financing of terrorism, fraud and bribery/corruption. We maintain a compliance programme designed to identify, assess, measure, mitigate and report on such risks through a combination of policy and relevant systems and controls.
DBS also provides relevant training and implements assurance processes. We strongly believe in the need to promote a strong compliance culture as well, and this is developed through the leadership of our Board and senior management.
Fraud risk DBS has established minimum standards for our business and support units to prevent, detect, investigate and remediate fraud and related events. This is based on the Fraud Management Programme, through which standards are implemented at the unit and geographical levels. These standards aim to provide end-to-end management for fraud and related issues within DBS.
Money laundering, financing of terrorism and sanctions risks There are minimum standards for our business and support units to mitigate and manage our actual and/or potential exposure to money laundering, terrorist financing, sanctions, corruption, or other illicit financial activities. Accountabilities have also been established for the protection of DBS’ assets and reputation, as well as the interests of our customers and shareholders.
New product and outsourcing risksEach new product, service or outsourcing initiative is subject to a risk review and sign-off process, where relevant risks are identified and assessed by departments independent of the risk-taking unit proposing the product or service. Variations of existing products or services and outsourcing initiatives are also subject to a similar process.
Other mitigation programmes To manage business disruptions effectively, business continuity management is vital as part of DBS’ risk mitigation programme.
A robust crisis management and business continuity management programme is in place within essential business services for unforeseen events. Planning for business resilience includes the identification of key business processes via Business Impact Analysis as well as the documentation and maintenance of our Business Continuity Plan (BCP).
DBS’ BCP aims to minimise the impact of business interruption stemming from severe loss scenarios, and provide a reasonable level of service until normal business operations are resumed. Within the crisis management structure, we have in place an incident management process. This covers the situation from the point it begins and the crisis is declared to when the relevant committees or teams are activated to manage the crisis.
Exercises are conducted annually, simulating different scenarios to test our BCPs and crisis management protocol. These scenarios include technology issues affecting essential banking services across DBS, natural disasters with wide geographical impact, safety-at-risk incidents (e.g. terrorism) and other events leading to significant business disruption. The effectiveness of these exercises, as well as DBS’ business continuity readiness, our alignment to regulatory guidelines and our disclosure of residual risks, are communicated and verified with the BRMC on an annual basis.
To mitigate losses from specific unexpected and significant event risks, DBS purchases group-wide insurance policies – under the
PoliciesThe Group Operational Risk Management (ORM) Policy sets our overall approach for managing operational risk in a structured, systematic and consistent manner.
There are policies, standards, tools and programmes in place to govern ORM practices across DBS. These include corporate operational risk policies and standards that are owned by the respective corporate oversight and control functions. The key policies address risk areas relating to technology, compliance, fraud, money laundering, financing of terrorism and sanctions, new product and outsourcing.
Risk methodologiesDBS adopts the standardised approach to compute operational risk regulatory capital.
To manage and control operational risk, we use various tools, including risk and control self-assessment, operational risk event management and key risk indicator monitoring. Risk and control self-assessment is used by each business or support unit to identify key operational risk and assess how effective the internal controls are. When control issues are identified, the units develop action plans and track the resolution of the issues.
Operational risk events are classified in accordance with Basel standards. Such events, including any significant incidents that may impact DBS’ reputation, must be reported
Policies
Risk methodologies
Processes, systems and reports

96 | DBS Annual Report 2016
Group Insurance Programme – from third-party insurers. DBS has acquired insurance policies relating to crime and professional indemnity; director and officer liability; property damage and business interruption; general liability; and terrorism.
Processes, systems and reportsRobust internal control processes and systems are integral to identifying, monitoring, managing and reporting operational risk.
DBS has implemented a web-based system that supports multiple operational risk
management processes and tools, including operational risk event reporting, risk and control self-assessment, key risk indicators, the tracking of issues or action plans and operational risk reporting.
All units are responsible for the day-to-day management of operational risk in their products, processes, systems and activities, in accordance with the various frameworks and policies. The RMG Operational Risk unit and other corporate oversight and control functions oversee and monitor the effectiveness of operational risk
management, assess key operational risk issues with the units to determine the impact across DBS, and report and/or escalate key operational risks to relevant senior management and Board-level committees with recommendations on appropriate risk mitigation strategies.
8.2 Operational risk in 2016Total operational risk losses in 2016 was SGD 20 million which represented 0.18% of our total operating income. The losses may be categorised into the following seven Basel risk event categories:
2016 2015
Basel risk event types SGD m % SGD m %
External fraud 12.86 63% 2.97 38%
Clients, products and business practices (CPBP) 4.83 24% 0.28 4%
Execution, delivery and process management (EDPM) 2.31 12% 4.28 56%
Internal fraud 0.28 1% 0.14 2%
Damage to physical assets 0.04 0% 0 0%
Business disruption and system failures 0.01 0% 0.03 0%
Employment practices and workplace safety 0 0% 0 0%
Total(1) 20.33 100% 7.70(2) 100%
Notes: (1) Reportable operational risk events are those with net loss greater than SGD 10,000 and are reported based on the date of detection(2) Adjusted to account for material recoveries under external fraud and provision adjustment under EDPM
External fraud and CPBP accounted for 87% of the Group’s operational risk losses in 2016. The increase in losses for external fraud was attributable largely to an isolated incident. The operational risk losses for CPBP comprised mainly settlement of a lawsuit by a client for a processing error and a regulatory penalty imposed by MAS for breaches of money laundering regulations attributable to events in 2013 and 2014. Operational risk losses under EDPM have declined with fewer processing errors compared to the year before.
| 97Risk management
9 Reputational risk DBS views reputational risk as an outcome of any failure to manage risks in our day-to-day activities/decisions, and from changes in the operating environment. These risks include:
• Financial risk (credit, market and liquidity risks)
• Inherent risk (operational and business/strategic risks)
9.1 Reputational risk management at DBS
DBS’ approach to reputational risk management comprises the following building blocks:
such risks are articulated in the respective risk policies. These are reinforced by sound corporate values that reflect ethical behaviours and practices throughout DBS.
At DBS, we have policies in place to protect the consistency of our brand, and to safeguard our corporate identity and reputation.
Risk methodologiesUnder the various risk policies, we have established a number of mechanisms for ongoing risk monitoring.
These mechanisms take the form of risk limits, key risk indicators and other operating metrics, and includes the periodic risk and control self-assessment process. Apart from observations from internal sources, alerts from external parties/stakeholders also serve as an important source to detect potential reputational risk events. In addition, there are policies relating to media communications, social media and corporate social responsibility to protect DBS’ reputation. There are also escalation and response mechanisms in place for managing reputational risk.
While the respective risk policies address the individual risk types, the Reputational Risk Policy focuses specifically on our stakeholders’ perception of how well DBS manages its reputational risks. Stakeholders include customers, government agencies and regulators, investors, rating agencies,
business alliances, vendors, trade unions, the media, the general public, the Board and senior management, and DBS’ employees.
We recognise that creating a sense of shared value through engagement with key stakeholder groups is imperative for our brand and reputation.
For more information on how we engage our stakeholders, please refer to page 30.
Processes, systems and reportsOur units are responsible for the day-to- day management of reputational risk, and ensure that processes and procedures are in place to identify, assess and respond to this risk. Events affecting DBS’ reputational risk are also included in our reporting of risk profiles to senior management and Board-level committees.
9.2 Reputational risk in 2016DBS’ priority is to prevent the occurrence of a reputational risk event, instead of taking mitigating action when it occurs. There were no significant reputational risk incidents endangering the DBS franchise in 2016. However, there were some media reports on our credit exposure to the oil and gas industry and anti-money laundering lapses in 2013 and 2014. We will continue to uphold and enhance our reputation through sound corporate values and robust policies and processes.
Policies
Risk methodologies
Processes, systems and reports
PoliciesDBS adopts a four-step approach for reputational risk management, which is to prevent, detect, escalate and respond to reputational risk events.
As reputational risk is a consequence from the failure to manage other risk types, the definitions and principles for managing

98 | DBS Annual Report 2016
Appendix
General recommendations
Where have we disclosed this? (in Risk management section unless otherwise stated)
1 Present all related risk information together in any particular report. Refer to the table on page 77
2 Define the bank’s risk terminology and risk measures and present key parameter values used.
Permanent considerations regarding the impact of expected credit loss approaches:
Describe how the bank interprets and applies the key concepts within an ECL approach.
Disclose the credit loss modelling techniques developed to implement the ECL approach.
Sections 1, 5.1, 6.1, 7.1, 8.1
Refer to Note 1 below
Refer to Note 1 below
3 Describe and discuss top and emerging risks, incorporating relevant information in the bank’s external reports on a timely basis.
Temporary considerations regarding the impact of expected credit loss approaches:
Provide disclosures describing how the concepts applied and modelling techniques under the current impairment approaches compare with the new ECL approach to highlight factors that may drive changes in ECL that may not have been relevant in current impairment approaches.
Refer to CRO statement
Refer to Note 1 below
4 Once the applicable rules are finalised, outline plans to meet each new key regulatory ratio, e.g. the net stable funding ratio, liquidity coverage ratio and leverage ratio, and, once the applicable rules are in force, provide such key ratios.
Temporary considerations regarding the impact of expected credit loss approaches:
Banks should consider describing the intended implementation strategy including the current timeline for the implementation.
Disclose how the risk management organisation, processes and key functions have been organised to run the ECL methodology.
Section 7.4Refer to Capital management and planning section
Refer to Note 1 below
Refer to Note 1 below
Risk governance and risk management strategies/business model
5 Summarise prominently the bank’s risk management organisation, processes and key functions.
Section 3
6 Provide a description of the bank’s risk culture, and how procedures and strategies are applied to support that culture.
Section 4Refer to Corporate Governance section
7 Describe the key risks arising from the bank’s business models and activities, the bank’s Risk Appetite in the context of its business models and how the bank manages such risks.
Sections 1, 2 and 4
8 Describe the usage of stress testing within the bank’s risk governance and capital frameworks. Stress testing disclosures should provide a narrative overview of the bank’s internal stress testing process and governance.
Temporary considerations regarding the impact of expected credit loss approaches:
Describe the relationship, if any, between the stress testing programs and the implementation of ECL accounting requirements.
Sections 4.2, 5.1, 6.1, 7.1
Not applicable

| 99Risk management
General recommendations
Where have we disclosed this? (in Risk management section unless otherwise stated)
Capital adequacy and risk-weighted assets
9 Provide minimum Pillar 1 capital requirements, including capital surcharges for G-SIBs and the application of counter-cyclical and capital conservation buffers or the minimum internal ratio established by management.
Refer to Capital management and planning section and Pillar 3 disclosures published on DBS website
10 Summarise information contained in the composition of capital templates adopted by the Basel Committee to provide an overview of the main components of capital, including capital instruments and regulatory adjustments. A reconciliation of the accounting balance sheet to the regulatory balance sheet should be disclosed.
Refer to Pillar 3 disclosures published on DBS website
11 Present a flow statement of movements since the prior reporting date in regulatory capital, including changes in common equity tier 1, tier 1 and tier 2 capital.
Refer to Capital management and planning section
12 Qualitatively and quantitatively discuss capital planning within a more general discussion of management’s strategic planning, including a description of management’s view of the required or targeted level of capital and how this will be established.
Temporary considerations regarding the impact of expected credit loss approaches:
Banks should consider explaining how ECL requirements are anticipated to have an impact on capital planning (particularly in meeting capital adequacy requirements), including any strategic changes expected by management, to the extent that the impact is material. If regulatory requirements are unclear or not yet fully determined, the effects of such uncertainty should be discussed.
Refer to Capital management and planning section
Not applicable(regulatory requirements have not yet been fully determined)
13 Provide granular information to explain how risk-weighted assets (RWAs) relate to business activities and related risks.
Section 2
14 Present a table showing the capital requirements for each method used for calculating RWAs for credit risk, including counterparty credit risk, for each Basel asset class as well as for major portfolios within those classes. For market risk and operational risk, present a table showing the capital requirements for each method used for calculation.
Refer to Pillar 3 disclosures published on the DBS website
15 Tabulate credit risk in the banking book showing the average PD and LGD as well as the EAD, total RWAs and the RWA density for Basel asset classes and major portfolios within classes at a suitable level of granularity, based on internal ratings grades.
Refer to Pillar 3 disclosures published on the DBS website
16 Present a flow statement that reconciles movements in RWAs for the period for each RWA risk type.
To be implemented under revised Pillar 3 disclosures, effective from 1 January 2018
17 Provide a narrative putting Basel Pillar 3 back-testing requirements into context, including how the bank has assessed model performance and validated its models against default and loss.
Section 6.1, 6.2
Liquidity
18 Describe how the bank manages its potential liquidity needs and provide a quantitative analysis of the components of the liquidity reserve held to meet these needs, ideally by providing averages as well as period-end balances.
Sections 7.1, 7.3

100 | DBS Annual Report 2016
General recommendations
Where have we disclosed this? (in Risk management section unless otherwise stated)
Funding
19 Summarise encumbered and unencumbered assets in a tabular format by balance sheet categories, including collateral received that can be rehypothecated or otherwise redeployed. This is to facilitate an understanding of available and unrestricted assets to support potential funding and collateral needs.
Section 7.3
20 Tabulate consolidated total assets, liabilities and off-balance sheet commitments by retaining contractual maturity at the balance sheet date. Present separately (i) senior unsecured borrowing (ii) senior secured borrowing (separately for covered bonds and repos) and (iii) subordinated borrowing. Banks should provide a narrative discussion of management’s approach in determining the behavioural characteristics of financial assets and liabilities.
Section 7.2Financial statements Note 42.1
21 Discuss the bank’s funding strategy, including key sources and any funding concentrations, to enable effective insight into available funding sources, our reliance on wholesale funding, any geographical or currency risks and changes in those sources over time.
Section 7.1
22 Provide information that facilitates the user’s understanding of the links between line items in the balance sheet and the income statement with positions included in the traded market risk disclosures [using the bank’s primary risk management measures such as Value at Risk (VaR)] and non-traded market risk disclosures such as risk factor sensitivities, economic value and earnings scenarios and/or sensitivities.
Sections 6.1
23 Provide further qualitative and quantitative breakdowns of significant trading and non-trading market risk factors that may be relevant to the bank’s portfolios beyond interest rate, foreign exchange, commodity and equity measures.
Sections 6.1, 6.2
24 Provide qualitative and quantitative disclosures that describe significant market risk measurement model limitations, assumptions, validation procedures, usage of proxies, changes in risk measures and models through time, reasons for back-testing exceptions, and how these results are used to enhance the parameters of the model.
Sections 6.1, 6.2
25 Provide a description of the primary risk management techniques employed by the bank to measure and assess the risk of loss beyond reported risk measures and parameters, such as VaR, earnings or economic value scenario results, through methods such as stress tests, expected shortfall, economic capital, scenario analysis, stressed VaR or other alternative approaches. The disclosure should discuss how market liquidity horizons are considered and applied within such measures.
Sections 6.1, 6.2

| 101Risk management
General recommendations
Where have we disclosed this? (in Risk management section unless otherwise stated)
Credit risk
26 Provide information that facilitates the user’s understanding of the bank’s credit risk profile, including any significant credit risk concentrations.
Temporary considerations regarding the impact of expected credit loss approaches:
Banks should consider whether existing segmentation for disclosure purposes is sufficiently granular to appropriately understand credit risk through an ECL approach.
Once practical and when disclosures are reliable, provide users with a quantitative assessment of the potential impact of applying an ECL approach.
Permanent considerations regarding the impact of expected credit loss approaches:
Where it aids understanding of credit risk exposures, provide disclosure of vintage.
Section 5.4Financial statements Note 41.4
Not applicable(quantitative assessment not yet available)
Not applicable
27 Describe the policies for identifying impaired or non-performing loans, including how the bank defines impaired or non-performing, restructured and returned-to-performing (cured) loans, as well as explanations for loan forbearance policies.
Sections 5.1
28 Provide reconciliation for the opening and closing balances of non-performing or impaired loans in the period and the allowance for loan losses. Disclosures should include an explanation of the effects of loan acquisitions on ratio trends, and qualitative and quantitative information about restructured loans.
Sections 5.1, 5.4Financial statements Note 41.2
29 Provide a quantitative and qualitative analysis of the bank’s counterparty credit risk, which arises from its derivatives transactions.
Section 5.1, 5.4
30 Provide qualitative information about credit risk mitigation and collateral held for all sources of credit risk, as well as quantitative information where meaningful.
Section 5.2, 5.4
Other risks
31 Describe “other risk” types based on management’s classifications and discuss how each one is identified, governed, measured and managed. In addition to risks such as operational risk, reputational risk, fraud risk and legal risk, it may be relevant to include topical risks such as business continuity, regulatory compliance, technology, and outsourcing.
Section 1, 8.1, 9
32 Discuss publicly known risk events related to other risks, including operational, regulatory, compliance and legal risks, where material or potentially material loss events have occurred. Such disclosures should concentrate on the effect on the business, the lessons learned and the resulting changes to risk processes already implemented or in progress.
Section 8.2

102 | DBS Annual Report 2016
Note 1: New impairment methodology
In 2018, Financial Reporting Standard (FRS) 109 will take effect. This new accounting standard will govern how Singapore reporting entities classify and measure financial instruments; take impairment (or allowance) charges; and account for hedges.
Current impairment approachAt present, for impairment assessment, DBS complies with the provisions of MAS Notice 612 where banks maintain, in addition to specific allowances, a prudent level of general allowances of at least 1% of uncollateralised exposures. This is an intended departure from the incurred loss provisioning approach prescribed under FRS 39, and possible changes to the current regulatory specifications will determine how FRS 109’s Expected Credit Loss (ECL) model is eventually implemented. In the meantime, the Group has made further progress in its preparations, leveraging existing credit rating systems, models, processes and tools.
FRS 109 impairment methodologyUnder FRS 109, impairment charges will be determined using an ECL model, which classifies financial assets into three categories or stages, each of which is associated with an ECL requirement that is reflective of the assessed credit risk profile:• A financial asset is classified under Stage
1 if it was not credit-impaired upon origination and there has not been a significant increase in its credit risk since. Under this stage, the ECL of a financial asset will be that which is expected to result from defaults occurring over the next 12 months;
• A financial asset is classified under Stage 2 if it was not credit-impaired upon origination but has since suffered a
significant increase in credit risk. The ECL will be that which is expected over the remaining lifetime of the asset;
• A financial asset which has been credit-impaired with objective evidence of default is classified under Stage 3. The assessed ECL for Stage 3 financial asset is not expected to be materially different from the existing specific allowances taken.
Further guidance has also been specified by the Basel Committee in its December 2015 report, “Guidance on credit risk and accounting for expected credit losses”.
Implementation Plan A steering committee, chaired by the CFO, has been established to oversee the FRS 109 implementation, including the development of the ECL model. The steering committee is supported by an implementation working group consisting of subject matter experts from Finance, Risk Management, Business and Technology which will collectively manage key workstreams covering, among others, financial reporting, systems, processes and controls, as well as constituent engagement. Periodic progress updates are being provided to the Audit Committee.
Credit risk modelling techniquesPortfolio-specific adjustments will be made to the Bank’s existing credit rating systems, models, processes and tools, to meet the requirements of FRS 109. In particular, for the wholesale portfolios, credit risk cycles for significant industries and geographies will be used as inputs to convert through-the-cycle loss estimates measures into the point-in-time equivalents and in determining the forward-looking estimates.
In determining ECL, management will evaluate a range of possible outcomes, taking into account past events, current conditions and assessments of future economic
conditions. Additional considerations that are assessed to have been inadequately addressed in model estimates will be addressed through the application of a management overlay.
Transfer criteriaIn accordance with FRS 109, financial assets are considered to be Stage 2 where their credit risk profile is assessed to have increased significantly since initial recognition, such that it is appropriate to recognise lifetime ECL. The analysis underpinning this assessment is multi-factor in nature, and management will consider a range of qualitative and quantitative parameters.
These would include, for the wholesale portfolio is the change in probability of default derived from the internal credit risk rating for each obligor. For the retail portfolio, days past due will be considered, supplemented with additional mechanisms linked to the probability of default.
Impact assessmentDBS intends to quantify the potential impact of FRS 109 once it is practicable to provide reliable estimates and when there is full clarity on the possible changes to the current regulatory specifications. This is expected to be available in the annual report and financial statements for the year ending 31 December 2017. Until then, DBS is also unable to definitively determine any consequential effects that FRS 109 implementation could have on regulatory capital requirements. In this regard, we note that the Basel Committee is also considering how the new ECL requirements would impact existing regulatory capital rules.
At this juncture, our view remains that any such changes are unlikely to result in material additional allowance charges for DBS at the point of adoption.

| 103
Capital management and planning
Objective
The Board is responsible for setting our capital management objective, which is to maintain a strong capital position consistent with regulatory requirements under the Monetary Authority of Singapore’s Notice to Banks No. 637 “Notice on Risk Based Capital Adequacy Requirements for Banks Incorporated in Singapore” (MAS Notice 637) and the expectations of various stakeholders, e.g. customers, investors and rating agencies. The Board articulates this objective in the form of capital targets. This objective is pursued while delivering returns to shareholders and ensuring that adequate capital resources are available for business growth and investment opportunities as well as adverse situations, taking into consideration our strategic plans and risk appetite. Our dividend policy is to pay sustainable dividends over time, consistent with our capital management objective, long-term growth prospects and the need to maintain prudent capital levels in view of the uncertain impact of regulatory change. In line with our dividend policy, the Board has recommended a final dividend of SGD 0.30 per ordinary share, to which the Scrip Dividend Scheme will be applicable, bringing the total ordinary dividend for the year to SGD 0.60.
Process
Our capital management objective is implemented via a capital management and planning process that is overseen by the Capital Committee. The Chief Financial Officer chairs the Capital Committee. The Capital Committee receives regular updates on our current and projected capital position. A key tool for capital planning is the annual Internal Capital Adequacy Assessment Process (ICAAP) through which we assess our forecast capital supply and demand relative to regulatory requirements and our capital
Refer to Note 32 to the financial statements for details on the movement of share capital and treasury shares during the year.
Additional Tier 1 capital• DBS Group Holdings Ltd, on 7 September 2016,
issued USD 750 million 3.60% Non-Cumulative Non-Convertible Perpetual Capital Securities First Callable in 2021.
Tier 2 capital• DBS Group Holdings Ltd, on 11 January 2016,
purchased SGD 134.25 million of the SGD 1,000 million DBS Bank Ltd. 3.30% Subordinated Notes due 2022 Callable in 2017.
• DBS Group Holdings Ltd, on 11 January 2016, purchased SGD 491.75 million of the SGD 1,000 million DBS Bank Ltd. 3.10% Subordinated Notes due 2023 Callable in 2018.
• DBS Group Holdings Ltd, on 20 January 2016, issued SGD 250 million 3.80% Subordinated Notes due 2028 Callable in 2023.
• DBS Group Holdings Ltd, on 8 March 2016, issued JPY 10,000 million 0.918% Subordinated Notes due 2026.
• DBS Group Holdings Ltd, on 19 April 2016, issued HKD 1,500 million 3.24% Subordinated Notes due 2026 Callable in 2021.
• DBS Bank Ltd., on 15 July 2016, redeemed the outstanding SGD 500 million 4.47% Subordinated Notes due 2021 Callable with Step-up in 2016.
• DBS Bank Ltd., on 15 July 2016, redeemed the outstanding USD 900 million Floating Rate Subordinated Notes due 2021 Callable with Step-up in 2016.
Refer to Notes 31, 33 and 35 to the financial statements as well as the Pillar 3 Disclosures (http://www.dbs.com/investor/capital-disclosures.html) for the terms of the capital instruments that are included in Eligible Total Capital.
Capital management and planning
targets. The ICAAP has a three-year horizon and covers various scenarios, including stress scenarios of differing scope and severity.
Capital capacity is allocated on two dimensions: by business line and by entity. Capital allocations by business line are set as part of the budget process and monitored during the year. Return on regulatory capital is one of several metrics used to measure business performance. Capital allocations by entity seek to optimise the distribution of capital resources across entities, taking into account the capital adequacy requirements imposed on each subsidiary in its respective jurisdiction. Capital is allocated to ensure that each subsidiary is able to comply with regulatory requirements as it executes its business strategy in line with our strategy. During the course of the year, these subsidiaries did not experience any impediments to the distribution of dividends.
Capital structure
We manage our capital structure in line with our capital management objective and seek to optimise the cost and flexibility offered by various capital resources. In order to achieve this, we assess the need and the opportunity to raise or retire capital. The following capital transactions were undertaken during the year.
Common Equity Tier 1 capital• DBS Group Holdings Ltd, on 20 June 2016,
issued 16,700,472 ordinary shares pursuant to the Scrip Dividend Scheme in respect of the final dividend for the year ended 31 December 2015. This added SGD 249 million to ordinary share capital.
• DBS Group Holdings Ltd, on 29 September 2016, issued 17,480,864 ordinary shares pursuant to the Scrip Dividend Scheme in respect of the interim dividend for the year ended 31 December 2016. This added SGD 259 million to ordinary share capital.

104 | DBS Annual Report 2016
The table below analyses the movement in Common Equity Tier 1, Additional Tier 1 and Tier 2 capital during the year.
Statement of changes in regulatory capital for the year ended 31 December 2016
In $ millions
Common Equity Tier 1 capitalOpening amount 37,068
Issue of shares pursuant to Scrip Dividend Scheme 508 Purchase of treasury shares (60) Profit for the year (attributable to shareholders) 4,238 Dividends paid to shareholders(1) (1,545) Cost of share-based payments 109 Movements in other comprehensive income, including available-for-sale revaluation reserves (24) Transitional arrangements and others (878)
Closing amount 39,416
Common Equity Tier 1 capital 39,416
Additional Tier 1 capitalOpening amount –
Issuance of Additional Tier 1 capital instruments 1,009 Movements in Additional Tier 1 capital instruments issued by fully-consolidated subsidiaries that meet criteria for inclusion (189) Transitional arrangements and others 673
Closing amount 1,493
Tier 1 capital 40,909
Tier 2 capitalOpening amount 5,045
Issuance of Tier 2 capital instruments 645 Movements in Tier 2 capital instruments issued by fully-consolidated subsidiaries that meet criteria for inclusion (1,427)
Movement in provisions eligible as Tier 2 capital (145)
Closing amount 4,118
Total capital 45,027
Note:(1) Includes distributions paid on captial securities classified as equity.

| 105Capital management and planning
Capital adequacy ratios
As at 31 December 2016, our Basel III fully phased-in Common Equity Tier 1 capital adequacy ratio (CAR), calculated by dividing Common Equity Tier 1 capital after all regulatory adjustments applicable from 1 January 2018 by the prevailing risk-weighted assets, was 13.3%. This ratio comfortably exceeds the eventual minimum CET1 CAR requirement under MAS Notice 637 of 9.0% (including capital conservation buffer but excluding countercyclical capital buffer) effective from 1 January 2019. On a transitional basis, our Common Equity Tier 1 CAR, Tier 1 CAR and Total CAR, were well above the Monetary Authority of Singapore’s minimum requirements (including applicable capital conservation buffer and countercyclical capital buffer) of 7.2%, 8.7% and 10.7% respectively. The table below sets out our capital resources and capital adequacy ratios.
We are also well-positioned to comply with forthcoming leverage ratio requirements. Our consolidated leverage ratio stood at 7.7%, well above the minimum 3.0% envisaged by the Basel Committee.
Refer to ‘Five-Year Summary’ for the historical trend of Tier 1 and Total CAR. Refer to http://www.dbs.com/investor/index.html for the Group’s Pillar 3 Disclosures which set out details on the Group’s risk-weighted assets.
In $ millions 2016 2015
Share capital 10,899 10,391Disclosed reserves and others 31,930 29,269Total regulatory adjustments to Common Equity Tier 1 capital (3,413) (2,219)Regulatory adjustments due to insufficient Additional Tier 1 capital – (373)
Common Equity Tier 1 capital 39,416 37,068
Additional Tier 1 capital instruments(1) 3,761 2,941Total regulatory adjustments to Additional Tier 1 capital (2,268) (2,941)
Tier 1 capital 40,909 37,068
Provisions eligible as Tier 2 capital 1,263 1,408Tier 2 capital instruments(1) 2,857 3,639Total regulatory adjustments to Tier 2 capital (2) (2)
Total capital 45,027 42,113
Risk-Weighted Assets (RWA)Credit RWA 226,014 216,380Market RWA 34,037 40,212Operational RWA 18,567 17,437
Total RWA 278,618 274,029
Capital Adequacy Ratio (CAR) (%)Basel III fully phased-in Common Equity Tier 1(2) 13.3 12.4Common Equity Tier 1 14.1 13.5Tier 1 14.7 13.5Total 16.2 15.4
Minimum CAR including Buffer Requirements (%)(3)
Common Equity Tier 1 7.2 6.5Effective Tier 1 8.7 8.0Effective Total 10.7 10.0
Of which: Buffer Requirements (%)Capital Conservation Buffer 0.625 –Countercyclical Buffer 0.1 –
Notes:(1) As part of the Basel III transitional arrangements, regulatory capital recognition of outstanding Additional Tier 1 and Tier 2 capital instruments
that no longer meet the minimum criteria is gradually being phased out. Fixing the base at the nominal amount of such instruments outstanding on 1 January 2013, their recognition was capped at 90% in 2013, with this cap decreasing by 10 percentage points in each subsequent year. To the extent a capital instrument is redeemed or amortised after 1 January 2013, the nominal amount serving as the base is not reduced.
(2) Calculated by dividing Common Equity Tier 1 capital after all regulatory adjustments (e.g., for goodwill and capital investments exceeding certain thresholds) applicable from 1 January 2018 by RWA as at each reporting date.
(3) Includes minimum Common Equity Tier 1, Tier 1 and Total CAR of 6.5%, 8.0% and 10.0% respectively.

106 | DBS Annual Report 2016
The chart below analyses the drivers of the movement in Common Equity Tier 1 CAR during the year.
Group Common Equity Tier 1 CAR
Dec 2015 CET1
(Transitional)
Net profit attributable
to shareholders
Dividends paid to
shareholders(1)
Issue of shares
pursuant to Scrip
Dividend Scheme
Transitional arrangements
and others
Credit RWA
Market RWA
Operational RWA
Dec 2016CET1
(Transitional)
Basel III phase-in
Dec 2016 Basel III fully
phased-in CET1(2)
13.5%-0.8%
1.6%0.2% -0.3%
-0.6%
-0.5% 0.3% -0.1% 14.1%
13.3%
Notes:(1) Includes distributions paid on captial securities classified as equity.(2) Calculated by dividing Common Equity Tier 1 capital after all regulatory adjustments (e.g., for goodwill and capital investments exceeding
certain thresholds) applicable from 1 January 2018 by RWA as at each reporting date.
The following table sets out the RWA and capital adequacy ratios as at 31 December 2016 of our significant banking subsidiaries calculated in accordance with the regulatory requirements applicable in the country of incorporation.
CAR (%)
As at 31 December 2016Total RWA
($ m)Common Equity
Tier 1 Tier 1 Total
DBS Bank (Hong Kong) LimitedDBS Bank (China) Limited
38,10716,852
15.612.9
16.212.9
18.315.9

| 107Capital management and planning
Regulatory change
The Monetary Authority of Singapore has revised MAS Notice 637 to incorporate the Basel III capital standards into Singapore regulations. These took effect from 1 January 2013 and are phased in over time. The transitional arrangements for minimum capital adequacy ratio requirements are summarised in the table below.
From 1 January 2016 2017 2018 2019
Minimum CAR %Common Equity Tier 1 (a) 6.5 6.5 6.5 6.5Capital Conservation Buffer (CCB) (b) 0.625 1.25 1.875 2.5Common Equity Tier 1 including CCB (a) + (b) 7.125 7.75 8.375 9.0Tier 1 including CCB 8.625 9.25 9.875 10.5Total including CCB 10.625 11.25 11.875 12.5
Maximum Countercyclical Buffer (1) 0.625 1.25 1.875 2.5
Notes: (1) The countercyclical buffer is not an ongoing requirement, and is only applied as and when specified by the relevant banking supervisors.
The applicable magnitude will be a weighted average of the country-specific countercyclical buffer requirements that are required by national authorities in jurisdictions to which a bank has private sector credit exposures. The Basel Committee expects jurisdictions to implement the countercyclical buffer during periods of excessive credit growth. Of the jurisdictions where we have material private sector credit exposures, Hong Kong has applied a countercyclical buffer of 0.625% for 2016, which will increase to 1.25% from 1 January 2017.
The MAS has designated DBS Bank as a domestic systemically important bank (“D-SIB”). Under the MAS’ framework for identifying and supervising D-SIBs, the higher loss absorbency requirement for locally-incorporated D-SIBs is met by the foregoing minimum ratios being two percentage points higher than those established by the Basel Committee. The Basel Committee has developed an indicator-based methodology for identifying global systemically important banks (G-SIBs) on which higher loss absorbency requirements will be imposed. While we are not a G-SIB, we are required to disclose the 12 indicators which are published on the Group website (http://www.dbs.com/investor/index.html).
In addition to the changes implemented in 2013, there are changes to the regulatory capital adequacy framework that will be adopted in the near future. These are, inter alia, changes in the standardised approach for measuring counterparty credit risk exposures and the revised market risk framework, which are not expected to increase our risk-weighted assets significantly. The Basel Committee is considering further rule changes but these are yet to be finalised. We continue to assess the impact of the outstanding regulatory reforms and, if necessary, will manage exposures within our strategy, to help mitigate that impact.
The MAS has published a series of consultation papers on proposed enhancements to the resolution regime for financial institutions in Singapore. The proposed enhancements include a statutory bail-in regime that is only applied to unsecured subordinated liabilities issued or contracted after the implementation of the statutory bail-in regime. This reflects, inter alia, that Singapore-incorporated banks are well-capitalised and already subject to capital standards that are stricter than Basel III capital standards.

108 | DBS Annual Report 2016
The Board has overall responsibility for sustainability at DBS and considers environmental, social and governance (ESG) matters in the development of the Group’s strategy.
For more information on corporate governance, please refer to page 48.
ESG matters that are material to value creation are integrated into our balanced scorecard, which is used to set objectives, drive behaviours, measure performance and determine remuneration.
For more information, please refer to page 28.
We manage sustainability matters using the following lenses:
We seek to create long-term value for our stakeholders in a sustainable way. We believe that generating profits responsibly goes hand in hand with creating social impact. This aligns with our corporate value of being purpose-driven and our desire to make a difference beyond banking to touch real people, real businesses and real lives.
This report has been prepared in accordance with the Global Reporting Initiative (GRI) G4 Sustainability Reporting Guidelines. Please refer to Appendix on page 116 for the GRI Index.
Sustainability
Employer of Choice
Continued investment in our people is a key priority for us. We are committed to providing an inclusive work environment where every employee can develop professionally and personally.
Creating Social Impact
We recognise that not all returns stem from financial gains. We seek to create social impact by championing social entrepreneurship in Asia and through our staff volunteerism movement, “People of Purpose”.
Responsible Corporate Citizenship
As a good corporate citizen, we are conscious about managing our direct environmental footprint and seek to influence our supply chain towards sustainable practices.
Responsible Banking
We seek to conduct our business in a fair and responsible manner by ensuring that we only offer products and services that are suitable for our customers (otherwise known as fair dealing). We take a proactive stance to protect our customers’ information from cyber attacks and illicit usage. We have zero tolerance for financial crime, including bribery and corruption. We are committed to advancing responsible financing and financial inclusion as part of our role in promoting sustainable development.
As society continues to increase its expectation for businesses to deliver solutions sustainable for our planet, we see opportunities to offer banking solutions that can help meet those expectations. We are encouraged by how the advancement of technology, including fintech, opens up viable banking solutions for new areas such as financial inclusion and green financing. We are exploring these opportunities, which at the same time allow us to do more for the communities we operate in.

| 109
Responsible banking
Fair dealingIt is important that our customers trust the products and services we provide.
We are committed to:• Being responsive to our customers’
needs and requests• Selling products and services that
are suitable for them• Ensuring our sales staff are trained
to deal with customers fairly• Communicating with our customers
in a clear and transparent manner.
Staff remuneration is based on a balanced scorecard approach, which ensures alignment between the interests of our staff and customers. A significant proportion of the remuneration depends on staff’s ability to demonstrate understanding of the customer’s needs, recommend suitable products, provide adequate disclosures and conduct the advisory and sales process professionally. In 2016, we made improvements to the way that we track individual staff’s sales performance and the way that supervisors are held accountable for such performance.
All our employees receive annual training on compliance and fair dealing, in addition to training on our product suite. They also undergo product knowledge and skills tests regularly. We place great emphasis on the oversight of our sales staff and hold their supervisors accountable for their coaching, monitoring and supervision.
In the interest of improving our products and services, we avail various channels for customers to provide valuable feedback.
For more information, see “CRO statement” on page 75. See also page 39 for our customer satisfaction measures.
Customer privacy and cyber securityCyber security continues to be one of the top 10 focus areas on our risk management agenda for 2016. For more information on our overall management approach on cyber security, see “Cyber security and data protection” on page 76 and “Technology Risk” on page 95.
Combating financial crime Our financial crime risk mitigation controls include a policy framework, subject matter expertise on anti-money laundering/
sanctions and anti-bribery/ corruption matters, training, transaction screening and periodic testing.
identify and assess potential ESG risks as part of the credit evaluation process.
Our ESG risk assessment approach is centred on the need to ensure that material ESG issues are considered for all new borrowing customers, new credit applications and periodic reviews. Where appropriate, specific sector guidelines or approach for ESG-sensitive industries are established to provide further guidance on ESG risks unique to that industry. These include requirements for additional levels of review by relevant industry specialists. These are established taking into consideration our strategy and level of exposures to a sector and presently cover eight sectors namely agriculture, chemicals, energy, infrastructure, mining and metals, waste management, forestry and defence.
If any company is suspected to have, or there are credible allegations that it is, involved in undesirable ESG practices, we will promptly engage the company concerned. If the company is not willing to take steps to adequately manage and mitigate the identified ESG risks or it is found to be in deliberate breach, we are prepared to turn down the transaction or re-assess the banking relationship.
The Responsible Financing Standard, which includes general ESG guidance for all sectors, and the relevant sector guidelines, are subject to regular review and will be enhanced over time.
As part of the industry’s push towards sustainable development, the Association of Banks in Singapore (ABS) released a set of industry guidelines to enhance the implementation of responsible financing in October 2015. Developed in consultation with banks, including DBS, the guidelines underscore the sector’s commitment to advancing responsible financing in a more structured and transparent manner. The guidelines will help achieve systematic environmental and social criteria integration into banks’ lending decision-making as well as provide higher levels of transparency and accountability. DBS is committed to fully implementing the ABS guidelines by 2017.
Sustainability
Communication and training in 2016
All our employees are required to complete training on anti-money laundering on an annual basis
All new joiners are required to complete mandatory anti-bribery and corruption training
All employees are required to read and acknowledge our Code of Conduct (see page 62), which contains our stance on anti-corruption, on an annual basis.
We made significant enhancements in 2016, in particular upgrading our system platforms in overseas locations, focusing on incremental risk from digital banking, and deploying technology in alerts management for fraud and money laundering. We will continue to focus on improving policies, systems and operations in 2017. These will ensure that we are closely tracking regulatory developments, and are benchmarked well against international standards. We will also focus on enhancing metrics to support the Board and senior management in understanding the effectiveness of the financial crime programme.
For more information, see “Regulatory compliance” on page 75 and “Compliance risk” on page 95.
Responsible financing We recognise that our lending practices have a significant impact on society, and are committed to promoting sustainable development. To this end, when granting loans, we assess how our customers address material risks, including their exposure to environmental and social risks where relevant.
This requirement is outlined in our Core Credit Risk Policy, which was expanded in 2016 to incorporate the principles and approach for managing ESG issues in our lending practices and capital market activities. The policy is supplemented by a new Responsible Financing Standard which sets out our overarching approach to responsible financing and provides more structured and detailed guidance to

110 | DBS Annual Report 2016
Spotlight on the agricultural sector
In Southeast Asia, severe trans-boundary haze pollution caused by land and forest fires from agricultural land clearance has adversely impacted the environment, economy and people. As a result, the agricultural sector has come under increased scrutiny.
We will not consciously finance companies in the agricultural sector that we know are deliberately violating local or national regulations or engaged in unlawful activities that involve land clearance by burning;adversely affect high-conservation value forests; involve new planting on peatland; or violate rights of workers or local communities.
We conduct ESG risk assessment on all existing and new borrowing customers in the agricultural sector. We understand that some customers are more advanced than others in adopting good practices to mitigate ESG risks. Where there are identified gaps, we monitor our customers’ commitments to addressing them on an ongoing basis. We recognise that responsible financing is a journey and seek to support companies that are able to demonstrate commitment or are taking positive steps to mitigate material environmental and social risks associated with their business activities.
we benchmark ourselves against external environmental certifications to ensure that we incorporate sustainable designs and practices into our offices and branches.
We maintained the Building and Construction Authority Green Mark certification for all our Singapore office buildings, with DBS Asia Central upgrading its certification to Platinum (office outfit category) through improved energy and water consumption efficiencies, sustainable management and operations, and indoor environmental quality. We also maintained the WasteWi$e certificate – Excellence level for all our Hong Kong office buildings. In Taiwan, we were the first foreign bank to achieve the ISO 50001 certification for energy management and we have continued to uphold this through efficient energy use.
For our branch network in Singapore, DBS was the first bank to achieve the Green Mark certification. Endorsed by the National Environment Agency, the award recognises efforts to achieve a sustainable built environment by incorporating best practices in environmental design and construction, and by the adoption of green building technologies. We have gone beyond the Green Mark criteria with some branches achieving higher lighting efficiency and installing air-conditioning systems with the highest Green Mark ratings, contributing to as much as 50% reduction in carbon emissions. Overall, the bank has received the certification for over 20 branches, with two receiving a Gold Plus Green Mark Award. We target to achieve the Green Mark Certification for at least 20 more branches in 2017.
Financial inclusion – Being the People’s Bank In Singapore, living our heritage as the “People’s Bank”, we continue to bring affordable banking services to the heartlands. We have a large segment of customers that we provide subsidised banking services to. Fees are waived for many, including the young, seniors, national servicemen and people under public assistance schemes. We also waive fees for ex-offenders to help ease their reintegration into society. DBS is also the key bank for migrant workers in Singapore.
Read more about our POSB initiatives on page 46.
We further seek to leverage technology to improve access to financial services to all of our customers, including those with special needs. We believe in empowering the community to make sound financial decisions to improve their lives, by enhancing their financial literacy.
In 2016, we rolled out India’s first mobile-only digibank, which enables us to bring high quality, affordable financial services to the masses, at reduced transaction costs.
Responsible corporate citizenship
Managing our environmental footprintOur most direct environmental impact stems from the carbon emissions from our office buildings and branches through the consumption of purchased electricity. Hence,
2016 2015 2014(baseline)6
Energy consumption
(mWh)
Carbon emissions
from purchased electricity (tCO2e)(1)
Carbon emissions
from air travel
(tCO2e)
Weight of paper recycled (tonnes)
(3)
Energy consumption
(mWh)
Carbon emissions
from purchased electricity (tCO2e)(1)
Carbon emissions
from air travel
(tCO2e)
Weight of paper recycled (tonnes)
(3)
Carbonemissions
frompurchasedelectricity(tCO2e)(1)
Singapore 45,965 19,912 4,139 239 45,514 19,717 4,469 221 19,509
Hong Kong 11,278 8,871 1,100 171 11,911 9,369 1,255 195 9,422
Rest of Greater China(4)
13,252 9,550 Notavailable(2)
40 15,120 11,384 Notavailable(2)
36 11,247
South and Southeast Asia(5)
7,117 6,974 Notavailable(2)
6 6,657 6,735 Notavailable(2)
10 6,714
Total 77,612 45,307 5,239 456 79,202 47,205 5,724 462 46,892
(1) Based on relevant grid emission factor conversion for each country(2) We plan to track carbon emissions from air travel across the markets with effect from 2017(3) Based on weight of paper at recycling points. Comparative figures have been restated to include recycled confidential waste in Singapore(4) Rest of Greater China includes Mainland China and Taiwan(5) South and Southeast Asia includes India and Indonesia(6) 2014 is the baseline year when we start tracking our carbon emissions
Table 1 Environmental data by region

| 111
Despite an increase in our physical footprint with the new DBS Academy in Singapore and offshore tech hub in Hyderabad, DBS offices and branches across six markets consumed 78,000 mWh of energy in 2016 – reducing carbon emissions by 4% and resulting in estimated cost savings of SGD 1.2 million compared to 2015.
Across Singapore and Hong Kong, we reduced air travel, cutting carbon emissions by 8% from 2015. This reflects our efforts to reduce business travel and encourage alternatives to face-to-face business meetings such as video conferencing and online collaboration tools. Total air mileage fell from 31.9 million in 2015 to 29.2 million in 2016.
On waste management, we collected 456 tonnes of paper waste for recycling from properties across the six markets. This reflects our continual efforts, particularly in Singapore, to reduce paper consumption and encourage responsible waste disposal. Initiatives include placement of eye-catching Pokemon-themed recycling bins at branches and more strategic placement of paper recycling bins across floors at offices.
IT waste management remains a priority as we continue with our digital transformation. As part of our strategic cost management programme, we sold more than 4,000 (2015: 8,000) decommissioned desktops and notebooks to a recycling vendor at the end of their four- or five-year replacement cycle. We continued to recycle corporate mobile phones
Environmental conservation initiatives at DBS
Upgrade to energy-efficient indoor air-conditioning system across the region
Install three-tick water efficiency labelled kitchen tap fittings at each branch, reducing our water consumption by 50%
Over 90% of indoor lighting is fitted with LED and high frequency fluorescent fixtures, making them 35% more energy-efficient
Support fight against climate change by observing “Earth Hour”
Reduce office copier paper consumption in Singapore from 150,000 to 126,000 reams in 2016 and converting all paper procurement to Green Label certified by end 2016
Sustainability
with vendors who either resell, salvage reusable parts or otherwise dispose of them through a recycling company.
Sustainable sourcingWe seek to influence our supply chain towards sustainable practices through the DBS Sustainable Sourcing framework. Central to the framework are DBS Sustainable Sourcing Principles (SSP), which outline our expectations of all suppliers, regardless of value or volume of purchase, in four key areas – human rights, health and safety, environment sustainability, business integrity and ethics.
In Singapore, due diligence is done at the new supplier registration stage, as well as at regular intervals as part of our ongoing supplier management process. In 2016, we met the target of 100% SSP sign-up for new suppliers. We plan to roll out similar due diligence processes across the region.
In addition to the SSP, we conduct sustainability risk materiality assessment to identify spend categories with high ESG risks. The assessment takes into account the supplier’s manufacturing process, service delivery, business volume and industry-specific guidelines, and is reviewed every two years to ensure relevance. For competitive tenders in high-risk categories, up to 10% of the supplier selection criteria are attributed to sustainability considerations. This reflects our position that, all else being equal, we will always award our business to more sustainable products and services.
DBS will continue to work with our suppliers and stakeholders to fine-tune the DBS Sustainable Sourcing framework and drive improvement in our supply chain.

112 | DBS Annual Report 2016
Creating Social Value
Championing social entrepreneurshipDBS has a long history of supporting SMEs across Asia, and has been a strong advocate of entrepreneurship and innovation. It is therefore natural for us to leverage these strengths to support social enterprises (SEs) in delivering innovative solutions to build a better and more sustainable future for the region.
DBS Foundation (DBSF) was launched in February 2014 with a SGD 50 million fund to champion social entrepreneurship and make an even greater impact in addressing Asia’s evolving social needs.
2016 highlights
• As at 31 December 2016, we had 459 (2015: 398) customers under the SE Banking Package and SGD 1.72 million (2015: SGD 1.74 million) of committed unsecured SE business loans
2016 highlights
• 63 SEs placed in capacity building programmes
• More than 400 SEs attended SE Summit, boot camps and research briefings
• More than 5,500 hours of skilled volunteerism
• Awarded SGD 1 million (2015: SGD 1 million) in grants to 12 (2015: 16) SEs to encourage them to deploy social innovations in areas such as healthcare, education and environmental sustainability
2016 highlights
• More than 2,500 SEs reached through local forums and workshops
• More than 1,000 entries received for DBS-NUS Social Venture Challenge and DBS Foundation Grant Programme
• Over 300 SEs featured on Asia For Good website
Promoting the development of the SE sector SEs lack recognition and public awareness of their work and the social impact they create. We strive to generate awareness and advocacy for SEs in our key markets through digital outreach and signature events.
The Asia For Good website was created to connect more people to SEs and encourage socially conscious living.
Nurturing innovative and impactful SEs through funding, mentorship and volunteerism Across our six core markets, DBSF identifies innovative and high potential SEs and supports them on their growth journey.
Our SE Grant programme provides much needed capital to support SEs. The grants enable SEs in various stages of growth to test prototypes built around their innovative ideas, improve existing processes, add critical capabilities or scale their existing business.
We also provide capacity building programmes and access to holistic support customised to SEs’ needs – such as executive mentoring and skilled staff volunteerism.
Embedding SEs into DBS’ culture and operations We demonstrate commitment to SEs by providing customised banking solutions and engaging them as DBS procurement vendors.
First launched in Singapore in 2008, the SE Banking Package allows SEs to open corporate accounts with no minimum deposit or monthly balance requirements, and offers waivers of transaction fees for banking services such as telegraphic transfers and IDEAL. The package also offers unsecured business loans below the commercial rate.
Social Enterprises are businesses that have a social mission at their core and use sustainable commercial models to achieve their social mission.
To find out more, go to:https://www.youtube.com/watch?v=kBhwDjoWEcg
We are committed to developing SEs across Asia in the following ways.
For more information, refer to page 19 “Supporting social innovators”.

| 113
People of Purpose “People of Purpose” is an in-house volunteerism movement to rally employees to use their skills and time for the good of the community. In 2016, employees from Singapore, Hong Kong, China, Taiwan, India and Indonesia volunteered more than 37,000 hours to serve the elderly, children and persons with disabilities as well as to create positive change for the environment.
The programmes we supported include horticulture therapy for the elderly organised by our Hong Kong employees, active ageing and dementia prevention workshops run by Singapore volunteers, outdoor activities conducted by the Taiwan team for persons with disabilities, the packing and delivery of daily necessities to disadvantaged families by staff in China, mangrove planting carried out by DBS India along the coastline of Mumbai, and DBS Indonesia’s waste management project contributing to the nation’s recycling efforts. Volunteers also offered their skills and knowledge to help SEs in financial and tax matters, digital marketing and business development.
Sustainability
One unique feature of DBS’ volunteer activities is that many of these were not centrally organised. Instead, they were designed, owned and executed by the nearly 300 volunteer leaders across the bank.
Employer of Choice
Our ability to attract, retain and develop the best talent is essential for our continued success.
Refer to page 39 for more information on our employee KPIs.
Hiring and employee engagementOur total headcount remains stable, with selective hiring primarily in Singapore and India. In Singapore we hired UX designers, coders, software engineers and data analysts in line with our digital agenda. In India, we recruited for DBS Asia Hub 2, our first offshore tech hub in Hyderabad.
Our workforce mix remains stable. The new hire rate across the age groups is a reflection of voluntary attrition as well as the changing nature of entry level jobs due to digitalisation.
Our engagement and retention rates were better than the industry average. 81% of our employees were engaged based on the 2016 My Voice Survey, an employee engagement survey conducted by Aon Hewitt. We saw an improvement in our voluntary attrition rate from 13% in 2015 to 12% in 2016, primarily driven by an improved employer value proposition and a muted economic outlook. Our efforts to build a great workplace have paid off and we continue to be an employer of choice for employees across gender and age groups.
We won over 50 HR awards in 2016, a testament to our high employee engagement. We were named “Aon Best Employer Asia Pacific” for inspiring strong commitment and superior performance from employees, driving business results through effective people practices, and managing our business in ways that build long-term success and sustainability.
2016 2015
Head- count(2)
Workforce Mix
No. of New
Hires(2)
New Hire
Rate(3)
No. ofVoluntary
Attrition
Voluntary Attrition
Rate(4)Head-
count(2)Workforce
Mix
No. of New
Hires(2)
New Hire
Rate(3)
No. ofVoluntary
Attrition
Voluntary Attrition
Rate(4)
By age group
<=30>30 & <=50>50
5,93114,048
2,215
27%63%10%
2,0231,909
91
34%14%4%
1,0001,460
87
23%9%4%
6,35013,6412,026
29%62%9%
2,9672,009
79
47%15%4%
1,2821,395
86
25%10%4%
By gender
FemaleMale
12,3499,845
56%44%
1,8232,200
15%22%
1,3081,239
11%13%
12,4249,593
56%44%
2,6212,434
21%25%
1,4441,319
12%15%
By region
SingaporeHong KongRest of Greater China(5)
South and Southeast Asia(6)
Rest of the World(7)
10,3814,350
3,609
3,587
267
47%20%
16%
16%
1%
1,438783
738
1,027
37
14%18%
20%
29%
14%
1,000617
575
342
13
10%14%
16%
11%
5%
10,2994,527
3,870
3,067
254
47%20%
18%
14%
1%
2,015997
1,202
791
50
20%22%
31%
26%
20%
1,099668
621
357
18
11%15%
17%
13%
8%
Total 22,194 100% 4,023 18% 2,547 12% 22,017 100% 5,055 23% 2,763 13%
(1) The table excludes involuntary termination as well as contract, temporary and agency staff attrition(2) Headcount and new hires include permanent, contract and temporary staff, and exclude agency staff(3) New hire rate is computed based on number of new hires divided by headcount at the end of the year(4) Voluntary attrition rate is computed based on number of voluntary attrition divided by monthly average headcount for permanent employees only(5) Rest of Greater China includes Mainland China and Taiwan(6) South and Southeast Asia includes India, Indonesia, Malaysia, Vietnam and the Philippines(7) Rest of the World includes South Korea, Japan, Dubai, United States of America and United Kingdom
Table 2 Total number and rates of new employee hires and voluntary attrition by age group, gender and region(1)

114 | DBS Annual Report 2016
Learning and talent developmentAt DBS, we have an integrated approach to developing talent with equal opportunities for all. Our talent development initiatives are built upon the “triple-E” framework – experience, exposure and education.
To build our talent pipeline, we have talent development programmes catering to various career aspirations and abilities. They include the management associate programme, the strategic talent assignment and rotation programme to groom high-potential employees in the early stages of their career. Talent at senior management levels have one-on-one interactions with Group Management Committee leaders to learn from them and seek advice on career advancement. Managing directors are invited to attend board meetings to gain exposure and insight into decision-making at top-leadership level.
DBS’ triple-E framework for talent development
Experience Exposure Education
Objective To broaden our people’s skillsets across business and geographies, and enable them to take on larger roles as they grow with us.
To enable our people to expand their horizons by learning from peers and seniors through networking, mentoring and coaching.
To develop a learning organisation, balancing the needs of today with future proofing for tomorrow.
Initiatives We support internal mobility, job rotations, cross-functional projects and other experiential learning opportunities across DBS. Our internal mobility programme allows employees to move within departments and across businesses or geographies. This empowers them to gain greater lateral exposure or acquire different skillsets and experience.
More than 5,500 employees engaged in innovation programmes and gained exposure to digital culture, agile methodology and other digital working concepts through human-centred design workshops and hackathons. By immersing themselves in the process of learning by doing, they learn best practices and put ideas into action.
The DBS Academy is our in-house centre that provides a progressive, integrated and career-based learning curriculum for staff. The academy offers a well-rounded curriculum, spanning leadership development, functional up-skilling and digital. New courses are introduced each year, such as agile project management and human-centred design. We blend formal training with informal methods, such as communities-based learning.
Key performance indicators
In 2016, 30% of positions were filled via internal transfer.
Training days per permanent employee fell from 6.4 to 5.2. While formal training hours fell, there was an increase in our employee engagement through immersion programmes. Employees participated in customer and employee journeys, picking up skills such as human-centred design and agile project management.
DBS invested SGD 26 million on staff development in 2016. Our learning centres in Singapore, Indonesia and Taiwan set a new benchmark for innovative learning spaces in the region.
Table 3 Average hours of training(1) per year per employee by gender, and by employee category(2)
2016 2015
Total days of training (in thousand) 107 129
Average days of training
Per permanent employee 5.2 6.4
By gender
FemaleMale
5.15.5
6.26.7
By employee category
SVP to MDAnalyst to VPSenior Officer and below
4.05.6
4.4
5.26.85.9
(1) Excludes informal learning methods such as communities-based learning; and exposure opportunities such as immersion programmes including customer and employee journeys
(2) Employee categories refer to Senior Vice President (SVP) to Managing Director (MD), Analyst to Vice President (VP), and Senior Officer and below

| 115
Diversity and equal opportunityWe view the diversity of our people as a source of strength. We seek to create an environment that allows all our employees to thrive because the diversity of experiences, knowledge and approaches they bring are necessary to drive performance and innovation. We have an inclusive work environment encompassing gender diversity and a multi-cultural and multi-generational workforce.
We run diversity campaigns to underscore our commitment to an inclusive culture. In 2016, we launched “Celebrating The Woman In Me”, a series of events that focused on gender diversity; and TEAM Challenge, a regional initiative to encourage employees to collaborate as multi-generational teams and appreciate the benefits of diversity.
Our workforce mix by age group and gender remains stable. 56% of our workforce and more than one-third of senior management positions (SVP to MD) are held by women. In 2016, we were named among the top 10 companies in Asia for female financial services professionals in eFinancialCareers “Ideal Employer ranking” and “Aon Best Employer for Women” in Hong Kong, Indonesia and Taiwan.
2016 2015
SVP to MD
Analyst to VP
Senior Officer and below Total
SVP to MD
Analyst to VP
Senior Officer and below Total
Headcount 1,607 15,095 5,074 21,776(2) 1,415 14,289 5,798 21,502(3)
Breakdown by gender
FemaleMale
38%62%
53%47%
71%29%
56%44%
37%63%
53%47%
70%30%
57%43%
Breakdown by age group
<=30>30 & <=50>50
0%74%26%
24%68%
8%
43%48%
9%
27%63%10%
0%73%27%
24%68%
8%
47%46%
7%
29%62%9%
Table 4 Breakdown of permanent employees by employee category1 according to gender and age group
(1) Employee categories refer to Senior Vice President (SVP) to Managing Director (MD), Analyst to Vice President (VP), and Senior Officer and below
(2) Total headcount 22,194 less contract and temporary staff 418 = 21,776 permanent staff(3) Total headcount 22,017 less contract and temporary staff 515 = 21,502 permanent staff
Sustainability

116 | DBS Annual Report 2016
Global reporting initiative (GRI) index
General standard disclosures
General standard disclosures Disclosure requirements Where have we disclosed this?
Strategy and analysis
G4-1 Statement from the most senior decision-maker
Refer to page 8 “Letter from the Chairman and CEO”.
Organisational profile
G4-3 Name of the organisation DBS Group Holdings Ltd
G4-4 Primary brands, products and services Refer to page 22 “Business model – How we create value”.
G4-5 Location of headquarters 12 Marina BoulevardMarina Bay Financial Centre Tower 3Singapore 018982
G4-6 Countries of operation Refer to page 2 “Who we are”.
G4-7 Nature of ownership and legal form Public limited company listed on the Singapore Exchange.
G4-8 Markets served Refer to page 2 “Who we are”.
G4-9 Scale of the organisation Refer to page 2 “Who we are”.
G4-10 Employee profile Refer to page 119 Table 1 and Table 2.
Read more about our employee initiatives on page 113.
G4-11 Collective bargaining agreements Our house union in Singapore, the DBS Staff Union, is an affiliate of the National Trades Union Congress (NTUC). 2,036 (2015: 2,278) of our employees are eligible for collective bargaining under the Memorandum of Understanding between DBS and NTUC. We do not have house unions in other markets.
G4-12 Supply chain Refer to Page 111 “Sustainable sourcing”.
G4-13 Significant changes during the reporting period
There were no significant changes to our organisational profile during the reporting period.
G4-14 Precautionary approach or principle DBS does not explicitly refer to the precautionary approach or principle in its risk management framework. We seek to contribute to society by generating profits responsibly, which ties in with our corporate value of being purpose-driven.
Refer to page 108 “Sustainability”.
G4-15 Externally developed sustainability initiatives subscribed to or endorsed
Refer to inside cover “About this report”.
We have applied the GRI G4 Sustainability Reporting Guidelines in the preparation of our Annual Report.
G4-16 Memberships of associations Our key memberships include Institute of International Finance and The Association of Banks in Singapore (Vice Chairman Bank).
Identified material aspects and boundaries
G4-17 List of entities included in consolidated financial statements
Refer to “Subsidiaries and consolidated structured entities” on page 143 and “Associates” on page 144.
G4-18 Process for defining report content Our Annual Report is prepared in accordance with the International Integrated Reporting <IR> Framework.
Under <IR>, our disclosures primarily focus on matters that substantively affect our ability to create long-term value.
Refer to page 28 for our material matters identification process.
In addition, through internal evaluation and our stakeholder interactions, we have identified additional GRI aspects where our operations may impact the environment or society. These are outlined below (see G4-19).

| 117
General standard disclosures
General standard disclosures Disclosure requirements Where have we disclosed this?
G4-19 List of GRI aspects applicable to DBS
We impact environmental, social and economic conditions directly through our business conduct and indirectly through our customers, suppliers and other stakeholders.
In this context, the GRI aspects applicable to DBS are as follows:
GRI aspect Related matter material for our value creation, where applicable*
Economic performanceCustomer privacyComplianceAnti-corruptionProduct service and labellingProduct responsibilityEmploymentTraining and educationDiversity and equal opportunityLocal communitiesEmissionsEffluents and wasteSupplier environmental assessmentSupplier assessment for labour practicesSupplier human rights assessmentSupplier assessment for impact on society
Challenging macro-economic environmentCyber securityEvolving regulatory landscapeCombating financial crimeFair dealingResponsible financingTalent management and retentionTalent management and retentionTalent management and retentionFinancial inclusionClimate changeClimate changeClimate changeNot applicableNot applicableNot applicable
*Refer to page 28 “Material Matters”
G4-20 Aspect boundary for each GRI aspect within DBS
All GRI aspects identified are applicable to all subsidiaries and branches within the DBS Group.
G4-21 Aspect boundary for each GRI aspect outside DBS
We consider all GRI aspects applicable to DBS to be relevant to all stakeholder groups identified on page 30 “What our stakeholders are telling us”.
G4-22 Effect of any restatements of information
Restatements of information, where applicable, are noted within the relevant data sets.
G4-23 Significant changes in scope and aspect boundaries
There are significant changes in scope and aspect boundaries.
Stakeholder engagement
G4-24 List of stakeholder groups engaged
Refer to page 30 “What our stakeholders are telling us”.
G4-25 Basis for identification and selection of stakeholders with whom to engage
G4-26 Approach to stakeholder engagement
G4-27 Key topics and concerns raised by stakeholders
Report profile
G4-28 Reporting period This report covers the period 1 January to 31 December 2016.
G4-29 Date of most recent previous report 31 December 2015
G4-30 Reporting cycle Annual
G4-31 Contact point for the report For any questions regarding this report or its contents, please contact Investor Relations at [email protected].
G4-32 “In accordance” option and GRI Index DBS has chosen the “in accordance - core” option to focus on the matters most material to our stakeholders.
This Appendix is the GRI Content Index.
G4-33 External assurance for the report This report has not been externally assured. DBS will consider external assurance in the future.
Governance
G4-34 Governance structure Refer to page 48 “Corporate governance”.
Ethics and integrity
G4-35 Description of values, principles, standards and norms of behaviour
Refer to page 61 “Culture”.
See also “values-led culture” on page 23.
Global reporting initiative (GRI) index

118 | DBS Annual Report 2016
Specific standard disclosures
DMA and indicators Standard disclosure title Where have we disclosed this?
Category: Economic
GRI aspect: Economic performance
G4-DMA Generic disclosures on management approach Refer to page 32 “CFO Statement”.
See also page 108 “Sustainability” on our community investment strategy.
G4-EC1 Direct economic value generated and distributed Refer to “Consolidated income statement” on page 121. Further breakdown of income and expenses by geography can be found in “Geographical segment reporting”on page 176.
See also “How we distribute value created” on page 27.
Category: Environmental
GRI aspect: Emissions
G4-DMA Generic disclosures on management approach Refer to page 110 “Managing our environmental footprint”.
G4-EN16 Energy indirect greenhouse gas (GHG) emissions (Scope 2) Our Scope 2 GHG emissions relate to carbon emissions from purchased electricity. Refer to page 110 “Managing our environmental footprint” Table 1.
GRI aspect: Effluents and waste
G4-DMA Generic disclosures on management approachRefer to page 110 “Managing our environmental footprint” Table 1.
G4-EN23 Total weight of waste by type and disposal method
GRI aspect: Supplier environmental assessment
G4-DMA Generic disclosures on management approach
Refer to page 111 “Sustainable sourcing”.G4-EN32 Percentage of new suppliers that were screened using environmental criteria
Category: Social
Sub-category: Labour practices and decent work
GRI aspect: Employment
G4-DMA Generic disclosures on management approach Refer to page 113 “Employer of Choice”.
G4-LA1 Total number and rates of new employee hires and employee turnover by age group, gender and region
Refer to page 113 “Employer of Choice” Table 2.
GRI aspect: Training and education
G4-DMA Generic disclosures on management approach Refer to page 113 “Employer of Choice”.
G4-LA9 Average hours of training per year per employee by gender, and by employee category
Refer to page 114 “Employer of Choice” Table 3.
G4-LA11 Percentage of employees receiving regular performance and career development reviews, by gender and by employee category
All our permanent employees received regular performance and career development reviews in 2015 and 2016.
GRI aspect: Diversity and equal opportunity
G4-DMA Generic disclosures on management approach Refer to page 49 “Board composition” and page 115 “Diversity and equal opportunity”.
G4-LA12 Composition of governance bodies and breakdown of employees per employee category according to gender, age group, minority group membership, and other indicators of diversity
Refer to page 48 “Key features of our Board”
See also page 115 “Employer of Choice” Table 4.
GRI aspect: Supplier assessment for labour practices
G4-DMA Generic disclosures on management approach
Refer to page 111 “Sustainable sourcing”.G4-LA14 Percentage of new suppliers that were screened using human rights criteria
Sub-category: Human rights
GRI aspect: Supplier human rights assessment
G4-DMA Generic disclosures on management approach
Refer to page 111 “Sustainable sourcing”.G4-HR10 Percentage of new suppliers that were screened using human rights criteria

| 119
Specific standard disclosures
DMA and indicators Standard disclosure title Where have we disclosed this?
Sub-category: Society
GRI aspect: Local communities
FS14 Initiatives to improve access to financial services for disadvantaged people (people with disabilities or impairment and people facing language, cultural, age or gender barriers)
Refer to page 110 “Financial inclusion - Being the People’s Bank”.
GRI aspect: Anti-corruption
G4-DMA Generic disclosures on management approach
Refer to page 109 “Combating financial crime”.G4-SO4 Communication and training on anti-corruption policies and procedures
GRI aspect: Supplier assessment for impact on society
G4-DMA Generic disclosures on management approach
Refer to page 111 “Sustainable sourcing”.G4-SO9 Percentage of new suppliers that were screened using criteria for impact on society
Sub-category: Product responsibility
GRI aspect: Product and service labelling
G4-DMA Generic disclosures on management approach Refer to page 109 “Fair dealing”.
G4-PR5 Results of surveys measuring customer satisfaction Refer to page 39 “Customer KPIs”.
GRI aspect: Customer privacy
G4-DMA Generic disclosures on management approach
Refer to page 109 “Customer privacy and cyber security”.G4-PR8 Total number of substantiated complaints regarding breaches of customer privacy and losses of customer data
GRI aspect: Compliance
G4-DMA Generic disclosures on management approachRefer to page 109 “Combating financial crime”.
See also page 96 “Operational risk in 2016”.G4-PR9 Monetary value of significant fines for non-compliance
with laws and regulations concerning the provision and use of products and services
GRI aspect: Product portfolio
G4-DMA Generic disclosures on management approach
Refer to page 109 “Responsible financing”.FS6 % of the portfolio for business lines by specific region, size and by sector
Workforce MixTable 1 Total number of employees by contract type and gender 2016 2015 Female Male Total Female Male Total
Type of contractPermanent 12,163 9,613 21,776 12,179 9,323 21,502 Of which: Full time 12,088 9,611 21,699 12,098 9,320 21,418 Part time 75 2 77 81 3 84Contract/Temporary(1) 186 232 418 245 270 515
Total 12,349 9,845 22,194 12,424 9,593 22,017
(1) Headcount on DBS’ payroll
Table 2 Total number of employees by region and gender 2016 2015 Female Male Total Female Male Total
CountrySingapore 6,226 4,155 10,381 6,227 4,072 10,299 Hong Kong 2,272 2,078 4,350 2,322 2,205 4,527 Rest of Greater China(1) 2,359 1,250 3,609 2,492 1,378 3,870South and Southeast Asia(2) 1,386 2,201 3,587 1,277 1,790 3,067Rest of the World(3) 106 161 267 106 148 254
Total 12,349 9,845 22,194 12,424 9,593 22,017
(1) Rest of Greater China includes Mainland China and Taiwan(2) South and Southeast Asia includes India, Indonesia, Malaysia, Vietnam and the Philippines(3) Rest of the World includes South Korea, Japan, Dubai, United States of America, United Kingdom and Australia
Global reporting initiative (GRI) index

120 | DBS Annual Report 2016
DBS Group Holdings Ltd and its Subsidiaries
121 Consolidated Income Statement122 Consolidated Statement of Comprehensive Income123 Balance Sheets124 Consolidated Statement of Changes in Equity125 Consolidated Cash Flow Statement
Notes to the Financial Statements126 Domicile and Activities Summary of Significant Accounting Policies133 Critical Accounting Estimates
Income Statement134 Net Interest Income Net Fee and Commission Income Net Trading Income Net Income from Investment Securities Other Income Employee Benefits135 Other Expenses Allowances for Credit and Other Losses136 Income Tax Expense137 Earnings Per Ordinary Share
Balance Sheet: Assets137 Classification of Financial Instruments140 Cash and Balances with Central Banks Government Securities and Treasury Bills Bank and Corporate Securities141 Loans and Advances to Customers142 Financial Assets Transferred Other Assets143 Deferred Tax Assets/Liabilities Subsidiaries and Consolidated Structured Entities144 Associates145 Unconsolidated Structured Entities Acquisition146 Properties and Other Fixed Assets147 Goodwill and Intangibles
Balance Sheet: Liabilities147 Deposits and Balances from Customers148 Other Liabilities Other Debt Securities 149 Subordinated Term Debts
Balance Sheet: Share Capital and Reserves151 Share Capital 152 Other Equity Instruments Other Reserves and Revenue Reserves155 Non-controlling Interests
Off-Balance Sheet Information156 Contingent Liabilities and Commitments Financial Derivatives
Additional Information159 Share-based Compensation Plans160 Related Party Transactions161 Fair Value of Financial Instruments164 Credit Risk171 Liquidity Risk174 Capital Management Segment Reporting176 Subsequent Event
DBS Bank Ltd
177 Income Statement178 Statement of Comprehensive Income179 Balance Sheet180 Notes to the Supplementary Financial Statements
183 Directors’ Statement187 Independent Auditor’s Report
Financial statements

| 121Financial statements
In $ millions Note 2016 2015
Interest income 9,748 9,644Interest expense 2,443 2,544
Net interest income 4 7,305 7,100
Net fee and commission income 5 2,331 2,144Net trading income 6 1,357 1,204Net income from investment securities 7 330 339Other income 8 166 150
Non-interest income 4,184 3,837
Total income 11,489 10,937
Employee benefits 9 2,725 2,651Other expenses 10 2,247 2,249
Total expenses 4,972 4,900
Profit before allowances 6,517 6,037Allowances for credit and other losses 11 1,434 743
Profit before tax 5,083 5,294Income tax expense 12 723 727
Net profit 4,360 4,567
Attributable to: Shareholders 4,238 4,454Non-controlling interests 122 113
4,360 4,567
Basic and diluted earnings per ordinary share ($) 13 1.66 1.77
(The notes on pages 126 to 176 as well as the Risk management section on pages 77 to 102 form part of these financial statements)
Consolidated income statement
DBS Group Holdings Ltd and its Subsidiaries
for the year ended 31 December 2016

122 | DBS Annual Report 2016
In $ millions 2016 2015
Net profit 4,360 4,567 Other comprehensive income(a): Foreign currency translation differences for foreign operations 27 29Share of other comprehensive income of associates (6) 2Available-for-sale financial assets and others Net valuation taken to equity 129 (218) Transferred to income statement (187) 61 Tax on items taken directly to or transferred from equity 12 7
Other comprehensive income, net of tax (25) (119)
Total comprehensive income 4,335 4,448
Attributable to: Shareholders 4,214 4,327Non-controlling interests 121 121
4,335 4,448
(a) Items recorded in “Other comprehensive income” above will be reclassified to the income statement when specific conditions are met (e.g. when foreign operations or available-for-sale financial assets are disposed of)
(The notes on pages 126 to 176 as well as the Risk management section on pages 77 to 102 form part of these financial statements)
Consolidated statement of comprehensive income
DBS Group Holdings Ltd and its Subsidiaries
for the year ended 31 December 2016

| 123Financial statements
The Group The CompanyIn $ millions Note 2016 2015 2016 2015
Assets Cash and balances with central banks 15 26,840 18,829 Government securities and treasury bills 16 33,401 34,501 Due from banks 30,018 38,285 18 10Derivatives 37 25,757 23,631 29 46Bank and corporate securities 17 45,417 40,073 Loans and advances to customers 18 301,516 283,289 Other assets 20 11,042 11,562 Associates 23 890 1,000 Subsidiaries 22 – – 22,285 19,547Properties and other fixed assets 26 1,572 1,547 Goodwill and intangibles 27 5,117 5,117
Total assets 481,570 457,834 22,332 19,603
Liabilities Due to banks 15,915 18,251 Deposits and balances from customers 28 347,446 320,134 Derivatives 37 24,497 22,145 22 –Other liabilities 29 15,895 12,404 50 24Other debt securities 30 27,745 38,078 2,400 1,884Subordinated term debts 31 3,102 4,026 645 –
Total liabilities 434,600 415,038 3,117 1,908
Net assets 46,970 42,796 19,215 17,695
Equity Share capital 32 10,670 10,114 10,690 10,144Other equity instruments 33 1,812 803 1,812 803Other reserves 34 4,322 6,705 168 168Revenue reserves 34 27,805 22,752 6,545 6,580
Shareholders’ funds 44,609 40,374 19,215 17,695
Non-controlling interests 35 2,361 2,422
Total equity 46,970 42,796 19,215 17,695
(The notes on pages 126 to 176 as well as the Risk management section on pages 77 to 102 form part of these financial statements)
Balance sheets
DBS Group Holdings Ltd and its Subsidiaries
as at 31 December 2016

124 | DBS Annual Report 2016
Total Non- Share Other equity Other Revenue Shareholders’ controlling TotalIn $ millions capital instruments reserves reserves funds interests equity
2016 Balance at 1 January 10,114 803 6,705 22,752 40,374 2,422 42,796Cost of share-based payments 109 109 109Draw-down of reserves upon vesting of performance shares 108 (108) – –Issue of shares pursuant to Scrip Dividend Scheme 508 508 508Purchase of treasury shares (60) (60) (60)Issue of perpetual capital securities 1,009 1,009 1,009Transfers (2,360) 2,360 – –Dividends paid to shareholders(a) (1,545) (1,545) (1,545)Dividends paid to non-controlling interests – (124) (124)Change in non-controlling interests – (58) (58)Total comprehensive income (24) 4,238 4,214 121 4,335
Balance at 31 December 10,670 1,812 4,322 27,805 44,609 2,361 46,970
2015 Balance at 1 January 10,171 803 6,894 19,840 37,708 2,498 40,206Issue of shares upon exercise of share options 4 4 4Cost of share-based payments 103 103 103Reclassification of reserves upon exercise of share options 1 (1) – –Draw-down of reserves upon vesting of performance shares 86 (86) – –Issue of shares pursuant to Scrip Dividend Scheme 110 110 110Purchase of treasury shares (258) (258) (258)Dividends paid to shareholders(a) (1,542) (1,542) (1,542)Dividends paid to non-controlling interests – (125) (125)Acquisition of non-controlling interests (78) (78) (72) (150)Total comprehensive income (127) 4,454 4,327 121 4,448
Balance at 31 December 10,114 803 6,705 22,752 40,374 2,422 42,796
(a) Includes distributions paid on capital securities classified as equity
(The notes on pages 126 to 176 as well as the Risk management section on pages 77 to 102 form part of these financial statements)
Consolidated statement of changes in equity
DBS Group Holdings Ltd and its Subsidiaries
for the year ended 31 December 2016

| 125Financial statements
In $ millions 2016 2015
Cash flows from operating activities Net profit 4,360 4,567 Adjustments for non-cash items: Allowances for credit and other losses 1,434 743Depreciation of properties and other fixed assets 275 251Share of profits or losses of associates 47 (14)Net gain on disposal (net of write-off) of properties and other fixed assets (47) (82)Net income from investment securities (330) (339)Cost of share-based payments 109 103Interest expense on subordinated term debts 107 116Income tax expense 723 727
Profit before changes in operating assets and liabilities 6,678 6,072
Increase/(Decrease) in: Due to banks (2,354) 1,858Deposits and balances from customers 25,659 (1,592)Other liabilities 4,282 1,624Other debt securities and borrowings (10,426) 5,958 (Increase)/Decrease in: Restricted balances with central banks 17 960Government securities and treasury bills 1,616 (4,350)Due from banks 8,243 4,361Bank and corporate securities (5,265) (1,911)Loans and advances to customers (17,363) (4,076)Other assets (841) (5,192)Tax paid (809) (730)
Net cash generated from operating activities (1) 9,437 2,982
Cash flows from investing activities Dividends from associates 36 32Proceeds from disposal of interest in associates 3 –Acquisition of interest in associate – (21)Proceeds from disposal of properties and other fixed assets 76 140Purchase of properties and other fixed assets (321) (334)Acquisition of non-controlling interests – (150)
Net cash used in investing activities (2) (206) (333)
Cash flows from financing activities Issue of subordinated term debts 630 –Interest paid on subordinated term debts (114) (108)Redemption/purchase of subordinated term debts (1,586) (743)Increase in share capital – 4Purchase of treasury shares (60) (258)Issue of perpetual capital securities 1,009 –Dividends paid to shareholders of the Company, net of scrip dividends(a) (1,037) (1,432)Change in non-controlling interests (58) –Dividends paid to non-controlling interests (124) (125)
Net cash used in financing activities (3) (1,340) (2,662)
Exchange translation adjustments (4) 163 240
Net change in cash and cash equivalents (1)+(2)+(3)+(4) 8,054 227Cash and cash equivalents at 1 January 12,078 11,851
Cash and cash equivalents at 31 December (Note 15) 20,132 12,078
(a) Includes distributions paid on capital securities classified as equity
(The notes on pages 126 to 176 as well as the Risk management section on pages 77 to 102 form part of these financial statements)
Consolidated cash flow statement
DBS Group Holdings Ltd and its Subsidiaries
for the year ended 31 December 2016

126 | DBS Annual Report 2016
DBS Group Holdings Ltd and its Subsidiaries
Notes to the financial statementsfor the year ended 31 December 2016
These Notes are integral to the financial statements. The consolidated financial statements for the year ended 31 December 2016 were authorised for issue by the Directors on 15 February 2017.
1 Domicile and Activities
The Company, DBS Group Holdings Ltd, is incorporated and domiciled in the Republic of Singapore and has its registered office at 12 Marina Boulevard, Marina Bay Financial Centre Tower Three, Singapore 018982.
The Company is listed on the Singapore Exchange.
The Company is an investment holding, treasury and funding vehicle for the group. Its main subsidiary is DBS Bank Ltd (the Bank), which is wholly owned and engaged in a range of commercial banking and financial services, principally in Asia.
The financial statements relate to the Company and its subsidiaries (the Group) and the Group’s interests in associates.
2 Summary of Significant Accounting Policies
2.1 Basis of preparation
Compliance with Singapore Financial Reporting Standards (FRS)The financial statements of the Company and the consolidated financial statements of the Group are prepared in accordance with Singapore Financial Reporting Standards (FRS) and related Interpretations promulgated by the Accounting Standards Council (ASC). In accordance with Section 201(18) of the Companies Act (the Act), the requirements of FRS 39 Financial Instruments: Recognition and Measurement in respect of loan loss provisioning are modified by the requirements of Notice to Banks No. 612 “Credit Files, Grading and Provisioning” (MAS Notice 612) issued by the Monetary Authority of Singapore. As permitted by Section 201(10)(b) of the Act, the Company’s income statement has not been included in these financial statements.
The financial statements are presented in Singapore dollars and rounded to the nearest million, unless otherwise stated.
Differences between International Financial Reporting Standards (IFRS) and FRSOther than the above modification to FRS related to MAS Notice 612, there are no significant differences between IFRS and FRS in terms of their application to the Group. The consolidated financial statements and the notes thereon satisfy all necessary disclosures under IFRS and FRS.
The Group notes the intention, as announced by the ASC on 29 May 2014, for Singapore-incorporated companies listed on the Singapore Exchange to apply a new financial reporting framework identical to
IFRS with effect from 1 January 2018. The implementation of FRS 109’s credit impairment requirements will be dependent on any changes that could be made to the current regulatory specifications and the Group will continue to monitor developments on this front.
2.2 Significant estimates and judgement
The preparation of financial statements requires management to exercise judgement, use estimates and make assumptions in the application of policies and in reporting the amounts in the financial statements. Although these estimates are based on management’s best knowledge of current events and actions, actual results may differ from these estimates. Critical accounting estimates and assumptions used that are significant to the financial statements, and areas involving a higher degree of judgement and complexity, are disclosed in Note 3.
2.3 New or amended FRS and Interpretations effective for 2016 year-end
On 1 January 2016, the Group adopted the following revised FRS that are issued by the ASC and relevant for the Group. The adoption has no significant impact on the Group’s financial statements.
• Amendments to FRS 1: Disclosure initiatives
• Amendments to FRS 27: Equity Method in Separate Financial Statements
• Amendments to FRS 111: Accounting for Acquisitions of Interests in Joint Operations
• Improvements to FRSs (issued in November 2014)
2.4 New or amended FRS and Interpretations effective for future periods
The significant new or amended FRS and Interpretations that are applicable to the Group in future reporting periods, and which have not been early-adopted, include:
• FRS 115 Revenue from Contracts with Customers (effective 1 January 2018) replaces the existing revenue recognition guidance and establishes a comprehensive framework for determining whether, how much and when revenue is recognised.
• FRS 116 Leases (effective 1 January 2019) replaces the existing lease accounting guidance and requires almost all leases to be recognised on the balance sheet. It also changes the way in which lease expenses are presented in the income statement.
• FRS109 Financial Instruments (effective 1 January 2018)
FRS 109: Financial InstrumentsFRS 109 replaces the existing guidance in FRS 39 Financial Instruments: Recognition and Measurement. It includes revised guidance on the classification and measurement of financial instruments; requires a more timely recognition of expected credit losses arising from the impairment of financial assets; and introduces revised requirements for general hedge accounting.

| 127Financial statements
It is currently not yet practical to reliably estimate the financial impact of FRS 109 on the Group’s financial statements.
Classification and measurement FRS 109 will replace the classification and measurement model in FRS 39 with a new model that categorises financial assets based on the business model within which the assets are managed, and whether the contractual cash flows from the financial assets solely represent the payment of principal and interest.
The Group expects that the current measurement approach for most of its financial assets will remain unchanged. The Group is evaluating the impact on (a) a portfolio of financial assets that contains embedded derivatives, which may subsequently be measured at fair value through profit or loss (FVPL), as well as (b) a portfolio of quoted available-for-sale (AFS) debt securities that are held to collect contractual cash flows, which may subsequently be measured at amortised cost.
Subsequent changes in fair value from non-trading equity instruments can be taken through profit or loss or other comprehensive income (FVOCI), as elected.
ImpairmentUnder FRS 109, expected credit losses (ECL) will be assessed using an approach which classifies financial assets into three categories or stages, each of which is associated with an ECL requirement that is reflective of the assessed credit risk profile in each instance.
• A financial asset is classified under Stage 1 if it was not credit-impaired upon origination and there has not been a significant increase in its credit risk since. A provision for 12-month ECL is required.
• A financial asset is classified under Stage 2 if it was not credit-impaired upon origination but has since suffered a significant increase in credit risk. A provision for life-time ECL is required.
• A financial asset which has been credit-impaired with objective evidence of default is classified under Stage 3. The assessed ECL is expected to be unchanged from the existing specific allowances taken for such assets.
ECL are probability-weighted amounts determined by evaluating a range of possible outcomes and taking into account past events, current conditions and assessments of future economic conditions, and will necessarily involve the use of management judgement.
Hedge accountingFRS 109 will introduce a more principles-based approach to assess hedge effectiveness. The Group expects that all its existing hedges that are designated in effective hedging relationships will continue to qualify for hedge accounting under FRS 109.
A) General Accounting Policies
A summary of the most significant group accounting policies is described further below starting with those relating to the entire financial statements followed by those relating to the income statement, the balance sheet and other specific topics. This does not reflect the relative importance of these policies to the Group.
2.5 Group Accounting
SubsidiariesSubsidiaries are entities (including structured entities) over which the Group has control. The Group controls an entity when it is exposed to, or has rights to, variable returns from its involvement with the entity and has the ability to affect those returns through its power over the entity.
Subsidiaries are consolidated from the date control is transferred to the Group to the date control ceases.
The acquisition method is used to account for business combinations. Refer to Note 2.13 for the Group’s accounting policy on goodwill.
All intra-group transactions and balances are eliminated on consolidation.
Associates Associates are entities over which the Group has significant influence, but no control where the Group generally holds a shareholding of between and including 20% and 50% of the voting rights. Investments in associates are accounted for using the equity method.
2.6 Foreign currency treatment
Functional and presentation currencyItems in the financial statements are measured using the functional currency of each entity in the Group, this being the currency of the primary economic environment in which the entity operates. The Group’s financial statements are presented in Singapore dollars, which is the functional currency of the Company.
Foreign currency transactions and balancesTransactions in foreign currencies are measured using the exchange rate at the date of the transaction.
Monetary assets and liabilities denominated in foreign currencies are translated into the functional currency of the entity undertaking the transaction at the exchange rates at the balance sheet date. Foreign exchange differences arising from this translation are recognised in the income statement within “Net trading income”.
Non-monetary assets and liabilities measured at cost in a foreign currency are translated using the exchange rates at the date of the transaction.
Non-monetary assets and liabilities measured at fair values in foreign currencies are translated using the exchange rates at the date when the fair values are determined, which is generally the balance sheet date.
Unrealised foreign exchange differences arising from non-monetary financial assets and liabilities classified as fair value through profit or loss are recognised in the income statement as trading income. For non-monetary financial assets such as equity investments classified as available-for-sale, unrealised foreign exchange differences are recorded in other comprehensive income and accumulated in equity until the assets are disposed of or become impaired, upon which they are reclassified to the income statement.

128 | DBS Annual Report 2016
Subsidiaries and branchesThe results and financial position of subsidiaries and branches whose functional currency is not Singapore dollars (“foreign operations”) are translated into Singapore dollars in the following manner:
• Assets and liabilities are translated at the exchange rates at the balance sheet date;
• Income and expenses in the income statement are translated at exchange rates prevailing at each month-end, approximating the exchange rates at the dates of the transactions; and
• All resulting exchange differences are recognised in other comprehensive income and accumulated under capital reserves in equity. When a foreign operation is partially or fully disposed of, or when share capital is repaid, such exchange differences are recognised in the income statement as part of the gain or loss when share capital is repaid.
For acquisitions prior to 1 January 2005, the foreign exchange rates at the respective dates of acquisition were used. Please refer to Note 27 for an overview of goodwill recorded. Goodwill and fair value adjustments arising on the acquisition of a foreign operation on or after 1 January 2005 are treated as assets and liabilities of the foreign operation and translated at the closing rate.
2.7 Segment reporting
Operating segments are reported in a manner consistent with the internal reporting provided to management.
In preparing the segment information, amounts for each business segment are shown after the allocation of certain centralised costs, funding income and the application of transfer pricing, where appropriate. Transactions between segments are recorded within the segment as if they are third party transactions and are eliminated on consolidation.
Please refer to Note 44 for further details on business and geographical segment reporting.
B) Income Statement
2.8 Income recognition
Interest income and interest expenseInterest income and interest expense as presented in Note 4 arise from all interest-bearing financial assets and financial liabilities regardless of their classification and measurement, with the exception of the Group’s structured investment deposits which are carried at fair value through profit or loss. Interest expense on such structured investment deposits is presented together with other fair value changes in trading income.
Interest income and interest expense are recognised on a time-proportionate basis using the effective interest method. The calculation includes significant fees and transaction costs that are integral to the effective interest rate, as well as premiums or discounts.
Fee and commission incomeThe Group earns fee and commission income from a diverse range of products and services provided to its customers.
Fee and commission income is generally recognised on the completion of a transaction. Such fees include underwriting fees, brokerage fees, bancassurance sales commission and variable service fees and fees related to completion of corporate finance transactions.
For a service that is provided over a period of time, fee and commission income is recognised over the period during which the related service is provided or credit risk is undertaken. Such fees include the income from issuance of financial guarantees and bancassurance fixed service fees.
Fee and commission income is recorded net of expenses directly related to it. These expenses typically include brokerage fees paid, card-related expenses and sales commissions, but do not include expenses for services delivered over a period (such as service contracts) and other expenses that are not specifically related to fee and commission income transactions.
Dividend incomeDividend income is recognised when the right to receive payment is established. This is generally the ex-dividend date for listed equity securities, and the date when shareholders approve the dividend for unlisted equity securities. Dividend income arising from held-for-trading financial assets is recognised in “Net trading income”, while those arising from available-for-sale financial assets is recognised in “Net income from investment securities”.
Allowances for credit and other lossesPlease refer to Note 2.11 for the accounting policy on impairment of financial assets.
C) Balance Sheet
2.9 Financial assets
Initial recognition Purchases and sales of all financial assets, even if their classification and measurement are subsequently changed, are recognised on the date that the Group enters into the contractual arrangements with counterparties. When the Group acts as a trustee or in a fiduciary capacity for assets it does not directly control or benefit from, the assets and the corresponding income belonging to a customer are excluded from the financial statements.
Financial assets are initially recognised at fair value, which is generally the transaction price.
Classification and subsequent measurementThe Group classifies and measures financial assets based on their nature and the purpose for which they are acquired. This generally corresponds to the business models in which they are applied and how management monitors performance, as follows:
• Non-derivative financial assets that are managed mainly for longer-term holding and collection of payments are classified as loans and receivables. These assets have fixed or determinable payments, are not quoted in an active market and are mainly in the “Consumer Banking/Wealth Management” and “Institutional Banking” segments. Loans and receivables are carried at amortised cost using the effective interest method.
• Non-derivative financial assets that are managed on a fair value basis, which are mainly in the “Treasury” segment, are classified as financial assets at fair value through profit or loss. Such assets include instruments held for the purpose of short-term selling and market-making (“held for trading”), or designated under the fair value option if doing so eliminates or significantly reduces measurement or recognition inconsistencies that would otherwise arise, or if the financial asset contains an embedded derivative that would otherwise need to be separately recorded (“designated at fair value through profit or loss”).

| 129Financial statements
Realised or unrealised gains or losses on such financial assets, except interest income, are taken to “Net trading income” in the income statement in the period they arise.
Derivatives (including derivatives embedded in other contracts but separated for accounting purposes) are also categorised as held for trading unless they are designated as hedging instruments in accordance with Note 2.19. Derivatives are classified as assets when the fair value is positive and as liabilities when the fair value is negative. Changes in the fair value of derivatives other than those designated as hedging instruments in cash flow or net investment hedges are included in “Net trading income”.
• Non-derivative financial assets that the Group intends to hold to maturity are classified as held to maturity. These are Singapore Government securities that the Group holds for satisfying regulatory liquidity requirements and are held within the “Others” segment. These assets are carried at amortised cost using the effective interest method.
• The Group also holds other non-derivative financial assets for the purpose of investment or satisfying regulatory liquidity requirements. Such assets are held for an indefinite period and may be sold in response to needs for liquidity or changes in interest rates, credit spreads, exchange rates or equity prices. Financial assets in this category are held in all business segments as well as the liquidity management unit in the “Others” segment. These assets are classified as available-for-sale and initially and subsequently measured at fair value.
Unrealised gains or losses arising from changes in fair value are recognised in other comprehensive income and accumulated in available-for-sale revaluation reserves. When sold or impaired, the accumulated fair value adjustments in the available-for-sale revaluation reserves are reclassified to the income statement. Unquoted equity investments classified as available-for-sale for which fair values cannot be reliably determined are carried at cost, less impairment (if any).
Where the classification and measurement of financial assets do not reflect the management of the financial assets (or financial liabilities), the Group may apply hedge accounting where permissible and relevant to better reflect the management of the financial assets. Please refer to Note 2.19 for details on hedging and hedge accounting.
Please refer to Note 14 for further details on the types of financial assets classified and measured as above.
ReclassificationWhen the purpose for holding a financial asset changes, or when FRS otherwise requires it, non-derivative financial assets are reclassified accordingly. Financial assets may be classified out of the fair value through profit or loss or available-for-sale categories only in particular circumstances as prescribed by FRS 39. In 2008 and 2009, the Group reclassified certain financial assets between categories as a result of a change in its holding intention. The reclassifications did not have a material impact on the income statement and statement of comprehensive income for the current year.
Determination of fair valueThe fair value of financial assets is the price that would be received if the asset is sold in an orderly transaction between market participants at the measurement date. Fair value is generally estimated by discounting the future contractual cash flows at the current market interest rate that is available to the Group for similar financial instruments. Where applicable, a valuation reserve or pricing adjustment is applied to arrive at the fair value. The determination of fair value is considered a significant accounting policy for the Group and further details are disclosed in Note 40.
OffsettingFinancial assets and liabilities are presented net when there is a legally enforceable right to offset the recognised amounts and there is an intention to settle them on a net basis, or realise the asset and settle the liability simultaneously.
DerecognitionFinancial assets are derecognised when the rights to receive cash flows from the financial assets have expired or when they have been transferred together with substantially all the risks and rewards of ownership.
The Group enters into certain transactions where it transfers financial assets recognised on its balance sheet but retains either all or a portion of the risks and rewards of the transferred financial assets. In such cases, the transferred financial assets are not derecognised from the balance sheet. Such transactions include repurchase transactions described in Note 2.12. They also include transactions where control over the financial asset is retained, for example, by a simultaneous transaction (such as options) with the same counterparty to which the asset is transferred. These are mainly transacted in the “Treasury” segment. In such cases, the Group continues to recognise the asset to the extent of its continuing involvement which is the extent to which it is exposed to changes in the value of the transferred asset.
Please refer to Note 19 for disclosures on transferred financial assets.
2.10 Cash and cash equivalents
For the purposes of the cash flow statement, cash and cash equivalents comprise cash on hand and non-restricted balances with central banks which are readily convertible into cash.
2.11 Impairment of financial assets
The Group assesses at each balance sheet date whether there is evidence that a financial asset or a group of financial assets is impaired.
(a) Financial assets classified as loans and receivables and held to maturity
The Group carries out regular and systematic reviews of all credit facilities extended to customers.
The criteria that the Group uses to determine whether there is evidence of an impairment loss include:
• Significant financial difficulty of the issuer or obligor, including breach of covenants and/or financial conditions.
• A breach of contract, such as a default or delinquency in interest or principal payments.
• Granting of a concession to the borrower, for economic or legal reasons relating to the borrower’s financial difficulty, that the Group would not otherwise consider.
• High probability of bankruptcy or other financial reorganisation of the borrower.
Specific allowances for credit lossesA specific allowance for credit losses is recognised if there is evidence that the Group will be unable to collect all amounts due under a claim according to the original contractual terms or the equivalent value. A “claim” means a loan, debt security or a commitment such as financial guarantees and letters of credit.

130 | DBS Annual Report 2016
A specific allowance for credit losses is recorded as a reduction in the carrying value of a claim on the balance sheet. For an off-balance sheet item such as a commitment, a specific allowance for credit loss is recorded as “provision for loss in respect of off-balance sheet credit exposures” within “Other liabilities”.
Specific allowances for credit losses are evaluated either individually or collectively for a portfolio.
Specific allowance for an individual credit exposure is made when existing facts, conditions or valuations indicate that the Group is not likely to collect the principal and interest due contractually on the claim. An allowance is reversed only when there has been an identifiable event that has led to an improvement in the collectability of the claim. The amount of specific allowance also takes into account the collateral value, which may be discounted to reflect the impact of a forced sale or untimely liquidation.
Overdue unsecured consumer loans which are homogenous in nature, such as credit card receivables, are pooled according to their delinquency behaviour and evaluated for impairment collectively as a group, taking into account the historical loss experience of such loans.
When a loan is uncollectible, it is written off against the related allowance for loan impairment. Such loans are written off after all the recovery procedures have been exhausted and the amount of the loss has been determined. Recoveries in full or in part of amounts previously written off are credited to the income statement in “Allowances for credit and other losses”.
General allowances for credit lossesApart from specific allowances, the Group also recognises general allowances for credit losses. The Group maintains a level of allowances that is deemed sufficient to absorb the estimated credit losses inherent in its loan portfolio (including off-balance sheet credit exposures). The Group maintains general allowances of at least 1% of credit exposures arising from both on and off-balance sheet items (against which specific allowances have not been made), adjusted for collateral held. This is in accordance with the transitional arrangements under MAS Notice 612.
(b) Financial assets classified as available- for-sale
The Group assesses at each balance sheet date whether there is evidence that an available-for-sale financial asset is impaired.
In the case of an equity investment, a significant or prolonged decline in the fair value of the security below its cost is a factor in determining whether the asset is impaired.
When there is evidence of an impairment of an available-for-sale financial asset, the cumulative loss – measured as the difference between the acquisition cost and the current fair value, less any impairment loss on that financial asset previously recognised in the income statement – is reclassified from the revaluation reserve within equity to the income statement as “Allowances for credit and other losses”.
For equity investments, impairment losses are not reversed until they are disposed of. For impaired debt instruments that subsequently recover in value, the impairment losses are reversed through the income statement if there has been an identifiable event that led to the recovery.
2.12 Repurchase agreements
Repurchase agreements (Repos) are treated as collateralised borrowings. The amount borrowed is reflected as a financial liability
either as “Due to banks” or “Deposits and balances from customers”. The securities sold under repos are treated as pledged assets and remain on the balance sheet at amortised cost or fair value depending on their classification.
Reverse repurchase agreements (Reverse repos) are treated as collateralised lending. The amount lent is reflected as a financial asset as “Cash and balances with central banks”, “Due from banks” or “Loans and advances to customers”.
Amounts paid and received in excess of the amounts borrowed and lent on the repos and reverse repos are amortised as interest expense and interest income respectively using the effective interest method.
2.13 Goodwill
Goodwill arising from business combinations generally represents the excess of the acquisition cost over the fair value of identifiable assets acquired and liabilities and contingent liabilities assumed on the acquisition date. Goodwill is stated at cost less impairment losses and is tested at least annually for impairment.
At the acquisition date, any goodwill acquired is allocated to each of the cash-generating units (CGU) or group of CGUs expected to benefit from the combination’s synergies.
An impairment loss is recognised when the carrying amount of a CGU, or group of CGUs, including the goodwill, exceeds the applicable recoverable amount. The recoverable amount of a CGU or CGU group is the higher of the CGU’s or CGU group’s fair value less cost to sell and its value-in-use. An impairment loss on goodwill is recognised in the income statement and cannot be reversed in subsequent periods.
2.14 Properties and other fixed assets
Properties (including investment properties) and other fixed assets are stated at cost less accumulated depreciation and impairment losses.
Depreciation is calculated using the straight-line method over the estimated useful lives of the assets.
Generally, the useful lives are as follows:
Buildings 50 years or over the remaining lease period, whichever is shorter.
Leasehold land 100 years or over the remaining lease period, whichever is shorter. Leasehold land where the unexpired lease period is more than 100 years is not depreciated.
Computer software 3 – 5 years
Office equipment, 5 – 10 yearsfurniture and fittings
Please refer to Note 26 for the details of properties and other fixed assets and their movements during the year.
2.15 Financial liabilities
Initial recognition, classification and subsequent measurementFinancial liabilities are initially recognised at fair value. The Group generally classifies and measures its financial liabilities in accordance with the purpose for which the financial liabilities are incurred and managed. Accordingly:

| 131Financial statements
• Financial liabilities are classified as financial liabilities at fair value through profit or loss if they are incurred for the purpose of repurchasing in the near term (“held for trading”), and this may include debt securities issued and short positions in securities for the purpose of ongoing market-making or trading. Financial liabilities at fair value through profit or loss can also be designated by management on initial recognition (“designated at fair value through profit or loss”) if doing so eliminates or significantly reduces measurement or recognition inconsistencies that would otherwise arise, or if the financial liability contains an embedded derivative that would otherwise need to be separately recorded. Financial liabilities in this classification are usually within the “Treasury” segment.
Realised or unrealised gains or losses on financial liabilities held for trading and financial liabilities designated under the fair value option, except interest expense, are taken to “Net trading income” in the income statement in the period they arise. Interest expense on structured investment deposits at fair value through profit or loss is also presented together with other fair value changes in “Net trading income”.
• Derivative liabilities are treated consistently with derivative assets. Please refer to Note 2.9 for the accounting policy on derivatives.
• Other financial liabilities are carried at amortised cost using the effective interest method. These comprise predominantly the Group’s “Deposits and balances from customers”, “Due to banks” and “Other debt securities”.
Please refer to Note 14 for further details on the types of financial liabilities classified and measured as above.
Determination of fair valueThe fair value of financial liabilities is the price that would be paid to transfer the liability in an orderly transaction between market participants at the measurement date.
Please refer also to Note 40 for further fair value disclosures.
DerecognitionA financial liability is derecognised from the balance sheet when the obligation specified in the contract is discharged, cancelled or expired.
2.16 Loan commitments, letters of credit and financial guarantees
Loan commitmentsLoan commitments are typically not financial instruments and are not recognised on the balance sheet. They are disclosed in accordance with FRS 37 and form part of the disclosures in Note 36. Upon a loan draw-down, the amount of the loan is accounted for under “loans and receivables” as described in Note 2.9.
Letters of creditLetters of credit are recorded off-balance sheet as contingent liabilities upon issuance, and the corresponding payables to the beneficiaries and receivables from the applicants are recognised on balance sheet upon acceptance of the underlying documents.
Financial guaranteesA financial guarantee is initially recognised in the financial statements at fair value on the date the guarantee is given. This is generally the amount (fee) paid by the counterparty. Subsequently, the fee is recognised over time as income in accordance with the principles in Note 2.8.
Off-balance sheet credit exposures are managed for credit risk in the same manner as financial assets.
Please refer to Note 2.11 on the Group’s accounting policies on allowances for credit losses.
2.17 Provisions and other liabilities
Provisions for other liabilities of uncertain timing and amounts are recognised when:
• the Group has a present legal or constructive obligation as a result of past events;
• it is probable that an outflow of resources embodying economic benefits will be required to settle the obligation; and
• a reliable estimate of the amount of the obligation can be made.
The amount recognised as a provision is the best estimate of the expenditure required to settle the present obligation at the balance sheet date.
2.18 Share capital and other instruments classified as equity
Ordinary shares, preference shares and other instruments which do not result in the Group having a contractual obligation to deliver cash or another financial asset, or to exchange financial assets or financial liabilities with the holder under conditions that are potentially unfavourable to the Group, are classified as equity. Distributions arising from such instruments are recognised in equity as there is no contractual obligation to pay distributions on these instruments. Incremental external costs directly attributable to the issuance of such instruments are accounted for as a deduction from equity.
When any entity within the Group purchases the Company’s ordinary shares (“treasury shares”), the consideration paid, including any directly attributable incremental cost is presented as a component within equity, until they are cancelled, sold or reissued.
When treasury shares are subsequently cancelled, the cost of the treasury shares is deducted against either the share capital account or retained earnings. When treasury shares are subsequently sold or reissued, any realised gain or loss on sale or reissue, net of any directly attributable incremental transaction costs and related income tax, is recognised in capital reserves.
For ordinary and preference shares, interim dividends are recorded during the financial year in which they are declared payable. Final dividends are recorded during the financial year in which the dividends are approved by the shareholders at the Annual General Meeting.
D) Other Specific Topics
2.19 Hedging and hedge accounting
The Group uses derivative contracts mainly as part of its risk management strategies for hedging interest rate risk arising from maturity mismatches or for hedging currency risk arising from currency mismatches and cash flows in foreign currencies.
In some cases, where the strict criteria in FRS 39 are met, hedge accounting is applied as set out in subsequent paragraphs. At the inception of each hedging relationship, the Group documents the relationship between the hedging instrument and the hedged item; the risk management objective for undertaking the hedge transaction; and the methods used to assess the effectiveness of the hedge.
132 | DBS Annual Report 2016
At inception and on an on-going basis, the Group also documents its assessment of whether the hedging instrument is highly effective in offsetting changes in the fair value or cash flows of the hedged item.
Fair value hedgeThe Group’s fair value hedges consist principally of interest rate swaps used for managing the interest rate gaps that naturally arise from its purchases or issues of debt securities, and where a mismatch in the measurement between the hedging derivative and the hedged item exists. Such hedges are mainly used in the “Treasury” and “Others” segments.
For a qualifying fair value hedge, the changes in the fair value of the hedging derivatives are recorded in the income statement, together with any changes in the fair value of the hedged item attributable to the hedged risk.
If the hedge no longer meets the criteria for hedge accounting, the adjustment to the carrying amount of a hedged item is amortised to the income statement over its remaining maturity, using the effective interest method.
Cash flow hedgeFor transactions with highly probable cash flows, derivatives are used to hedge against cash flow variability due to exchange rate movements in certain situations. Cash flow hedge accounting is principally applied in such cases.
The effective portion of changes in the fair value of a derivative designated and qualifying as a cash flow hedge is recognised in other comprehensive income and accumulated under the cash flow hedge reserve in equity. This amount is reclassified to the income statement in the periods when the hedged forecast cash flows affect the income statement. The ineffective portion of the gain or loss is recognised immediately in the income statement under “Net trading income”.
When a hedging instrument expires or is sold, or when a hedge no longer meets the criteria for hedge accounting, any cumulative gain or loss existing in the cash flow hedge reserve remains until the forecast transaction is recognised in the income statement. When a forecast transaction is no longer expected to occur, the cumulative gain or loss in the cash flow hedge reserve is reclassified from equity to the income statement.
Net investment hedgeNet investment hedge accounting is applied to hedged investments in foreign operations which comprise certain subsidiaries, branches and associates with a functional currency different from that of the Company. Under the Group’s hedging strategy, the carrying amount of these investments could be fully hedged, partially hedged or not hedged at all.
Hedges of net investments in the Group’s foreign operations are accounted for in a manner similar to cash flow hedges. On disposal of the foreign operations, the cumulative gain or loss in the capital reserves is reclassified to the income statement as part of the gain or loss on disposal.
Economic hedges which do not qualify for hedge accountingSome derivatives may be transacted as economic hedges as part of the Group’s risk management but do not qualify for hedge accounting under FRS 39. These include swaps and other derivatives (e.g. futures and options) that the Group transacts to manage interest rate, foreign exchange or other risks. Such derivatives are treated in the same way as derivatives held for trading purposes, i.e. realised and unrealised gains
and losses are recognised in “Net trading income”. In some cases, the hedged exposures are designated at fair value through profit or loss, thereby achieving some measure of offset in the income statement.
Please refer to Note 37.2 for disclosures on hedging derivatives.
2.20 Employee benefits
Employee benefits, which include base pay, cash bonuses, share-based compensation, contribution to defined contribution plans such as the Central Provident Fund and other staff-related allowances, are recognised in the income statement when incurred. For defined contribution plans, contributions are made to publicly or privately administered funds on a mandatory, contractual or voluntary basis. Once the contributions have been paid, the Group has no further payment obligations.
Employee entitlement to annual leave is recognised when they accrue to employees. A provision is made for the estimated liability for annual unutilised leave as a result of services rendered by employees up to the balance sheet date.
2.21 Share-based compensation
Employee benefits also include share-based compensation, namely the DBSH Share Ownership Scheme (the Scheme), the DBSH Share Plan and the DBSH Employee Share Plan (the Plans). The details of the Scheme and Plans are described in Note 38.
Equity instruments granted and ultimately vested under the Plans are recognised in the income statement based on the fair value of the equity instrument at the date of grant. The expense is amortised over the vesting period of each award, with a corresponding adjustment to the share option/plan reserves. Monthly contributions to the Scheme are expensed off when incurred.
For the DBSH Share Plan and the DBSH Employee Share Plan, a trust has been set up for each share plan. The employee trust funds are consolidated and the DBSH shares held by the trust funds are accounted for as “treasury shares”, which is presented as a deduction within equity.
2.22 Current and deferred taxes
Current income tax for current and prior periods is recognised as the amount expected to be paid or recovered from the tax authorities, using the tax rates and tax laws that have been enacted or substantively enacted by the balance sheet date. The Group considers uncertain tax positions generally at the level of the total tax liability to each tax authority for each period. The liability is determined based on the total amount of current tax expected to be paid, taking into account all tax uncertainties, using either an expected value approach or a single best estimate of the most likely outcome.
Tax assets and liabilities of the same type (current or deferred) are offset when a legal right of offset exist and settlement in this manner is intended. This applies generally when they arise from the same tax reporting group and relate to the same tax authority.
Deferred income tax is provided on temporary differences arising between the tax bases of assets and liabilities and their carrying amounts in the financial statements. The amount of deferred tax provided is based on the expected manner of realisation or settlement of the carrying amount of assets and liabilities, using tax rates enacted or substantively enacted by the balance sheet date.
| 133Financial statements
The amount of deferred tax assets recognised takes into account the likelihood the amount that can be used to offset payable taxes on future profits.
Deferred tax related to fair value re-measurement of available-for-sale investments, which are recognised outside profit or loss, is also recognised outside profit or loss, i.e. in other comprehensive income and accumulated in the available-for-sale revaluation reserves.
3 Critical Accounting Estimates
The Group’s accounting policies and use of estimates are integral to the reported amounts in the financial statements. Certain accounting estimates require management’s judgement in determining the appropriate methodology for valuation of assets and liabilities. Procedures are in place to ensure that methodologies are reviewed and revised as appropriate. The Group believes its estimates for determining the valuation of its assets and liabilities are appropriate. The following is a brief description of the Group’s critical accounting estimates that involve management’s valuation judgement.
3.1 Impairment of financial assets
It is the Group’s policy to recognise, through charges against profit, specific and general allowances in respect of estimated and inherent credit losses in its portfolio as described in Note 2.11.
In estimating specific allowances, the Group assesses the gap between borrowers’ obligations to the Group and their repayment ability. The assessment takes into account various factors, including the economic or business outlook, the future profitability of the borrowers and the liquidation value of collateral. Such assessment requires considerable judgement.
Another area requiring judgement is the calculation of general allowances, which are determined after taking into account historical data and management’s assessment of the current economic and credit environment, country and portfolio risks, as well as industry practices. Please refer to Risk Management section for a further description of the Group’s credit risk management.
3.2 Fair value of financial instruments
The majority of the Group’s financial instruments reported at fair value are based on quoted and observable market prices or on internally developed models that are based on independently sourced market parameters. The fair value of financial instruments without an observable market price in an active market may be determined using valuation models. The choice of model requires significant judgement for complex products especially those in the “Treasury” segment.
Policies and procedures have been established to facilitate the exercise of judgement in determining the risk characteristics of various financial instruments, discount rates, estimates of future cash flows and other factors used in the valuation process.
Please refer to Note 40 for details on fair valuation and fair value hierarchy of the Group’s financial instruments measured at fair value.
3.3 Goodwill impairment
The Group performs an impairment review to ensure that the carrying amount of a CGU to which goodwill is allocated does not exceed the recoverable amount of the CGU. Note 27 provides details of goodwill at the reporting date.
The recoverable amount represents the present value of the estimated future cash flows expected to arise from continuing operations. Therefore, in arriving at the recoverable amount, management exercises judgement in estimating the future cash flows, growth rate and discount rate.
3.4 Income taxes
The Group has exposure to income taxes in numerous jurisdictions. Significant judgement is involved in determining the Group’s provision for income taxes. The Group recognises liabilities for expected tax issues based on reasonable estimates of whether additional taxes will be due. Where uncertainty exists around the Group’s tax position including resolution of any related appeals or litigation processes, appropriate provisions are provided based on technical merits of the positions with the same tax authority. Note 21 provides details of the Group’s deferred tax assets/liabilities. In general, determination of the value of assets/liabilities relating to carry forward tax losses requires judgement.

134 | DBS Annual Report 2016
4 Net Interest Income
The GroupIn $ millions 2016 2015
Cash and balances with central banks 371 466 and Due from banksCustomer non-trade loans 6,628 6,126Trade assets 958 1,294Securities and others 1,791 1,758
Total interest income 9,748 9,644
Deposits and balances from customers 1,726 1,940Other borrowings 717 604
Total interest expense 2,443 2,544
Net interest income 7,305 7,100
Comprising: Interest income from financial assets at fair value 552 648 through profit or lossInterest income from financial assets not 9,196 8,996 at fair value through profit or lossInterest expense from financial liabilities (193) (204) at fair value through profit or lossInterest expense from financial liabilities (2,250) (2,340) not at fair value through profit or loss
Total 7,305 7,100
5 Net Fee and Commission Income
The GroupIn $ millions 2016 2015
Brokerage 155 180Investment banking 189 165Transaction services(b) 585 556Loan-related 434 442Cards(c) 483 434Wealth management 714 599Others 86 76
Fee and commission income 2,646 2,452Less: fee and commission expense 315 308
Net fee and commission income(a) 2,331 2,144
(a) Includes net fee and commission income of $56 million (2015: $51 million), which was derived from the provision of trust and other fiduciary services during the year. Net fee and commission income earned from financial assets or liabilities not at fair value through profit or loss was $793 million (2015: $776 million) during the year
(b) Includes trade & remittances, guarantees and deposit-related fees(c) Card fees are net of interchange fees paid
6 Net Trading Income
The GroupIn $ millions 2016 2015
Net trading income – Foreign exchange 822 989– Interest rates, credit, equities and others(a) 538 224Net gain/(loss) from financial assets designated 80 (89) at fair valueNet (loss)/gain from financial liabilities designated (83) 80 at fair value
Total 1,357 1,204
(a) Includes dividend income of $24 million (2015: $23 million)
7 Net Income from Investment Securities
The GroupIn $ millions 2016 2015
Debt securities – Available-for-sale 247 117– Loans and receivables 5 #Equity securities(a)(b) 78 222
Total(c) 330 339
Of which: net gains transferred from available-for-sale revaluation reserves 268 140
# Amount under $500,000(a) Includes dividend income of $60 million (2015: $63 million)(b) 2015 includes an amount of $136 million relating to gain from
disposal of a property investment (c) Includes fair value impact of hedges for the investment securities
8 Other Income
The GroupIn $ millions 2016 2015
Rental income 37 37Net gain on disposal of properties and other fixed assets 54 90Others(a) 75 23
Total 166 150
(a) Includes share of profits or losses of associates
9 Employee Benefits
The GroupIn $ millions 2016 2015
Salaries and bonuses 2,203 2,149Contributions to defined contribution plans 149 135Share-based expenses 108 102Others 265 265
Total 2,725 2,651

| 135Financial statements
10 Other Expenses
The GroupIn $ millions 2016 2015
Computerisation expenses(a) 877 883Occupancy expenses(b) 402 398Revenue-related expenses 273 301Others(c) 695 667
Total 2,247 2,249
(a) Includes hire and maintenance costs of computer hardware and software
(b) Includes rental expenses of office and branch premises of $247 million (2015: $241 million) and amounts incurred in the maintenance and service of buildings
(c) Includes office administration expenses (e.g. printing, stationery, telecommunications, etc), and legal and professional fees
The GroupIn $ millions 2016 2015
Depreciation expenses 275 251Hire and maintenance costs of fixed assets, 476 453 including building-related expensesExpenses on investment properties 7 7Audit fees payable to external auditors(a): – Auditors of the Company 3 3– Associated firms of Auditors of the Company 4 4Non- audit fees payable to external auditors(a): – Auditors of the Company 1 1– Associated firms of Auditors of Company 1 1
(a) PricewaterhouseCoopers network firms
11 Allowances for Credit and Other Losses
The GroupIn $ millions 2016 2015
Loans and advances to customers (Note 18) 1,000 676Investment securities – Available-for-sale 7 19– Loans and receivables 17 (8)Properties and other fixed assets – (14)Off-balance sheet credit exposures 157 8Others 253 62
Total 1,434 743

136 | DBS Annual Report 2016
12 Income Tax Expense
The GroupIn $ millions 2016 2015
Current tax expense– Current year 804 828– Prior years’ provision (59) (55)Deferred tax expense – Prior years’ provision – (10)– Origination of temporary differences (22) (36)
Total 723 727
The deferred tax credit in the income statement comprises the following temporary differences:
The GroupIn $ millions 2016 2015
Accelerated tax depreciation 3 5Allowances for loan losses (46) (49)Other temporary differences 21 (2)
Deferred tax credit to income statement (22) (46)
The tax on the Group’s profit before tax differs from the theoretical amount that would arise using the Singapore basic tax rate as follows:
The GroupIn $ millions 2016 2015
Profit before tax 5,083 5,294
Prima facie tax calculated at a tax rate 864 900 of 17% (2015: 17%)Effect of different tax rates in other countries (1) 9Net income not subject to tax (60) (51)Net income taxed at concessionary rate (114) (79)Expenses not deductible for tax 15 17Others 19 (69)
Income tax expense charged to income statement 723 727
Deferred income tax relating to available-for-sale financial assets and others of $12 million (2015: $7 million) was credited directly to equity.
Refer to Note 21 for further information on deferred tax assets/liabilities.
The table below shows the movements in specific and general allowances during the year for the Group:
The Group Charge/ Net (Write-back) write-off Exchange Balance at to income during and other Balance atIn $ millions 1 January statement the year movements 31 December
2016Specific allowancesLoans and advances to customers (Note 18) 821 1,111 (788) 126 1,270Investment securities 92 7 (19) 1 81Properties and other fixed assets 27 – – 1 28Off-balance sheet credit exposures 10 122 – (63) 69Others 85 253 (95) (17) 226
Total specific allowances 1,035 1,493 (902) 48 1,674
Total general allowances for credit losses 3,222 (59) – 3 3,166
Total allowances 4,257 1,434 (902) 51 4,840
2015Specific allowances Loans and advances to customers (Note 18) 983 551 (748) 35 821Investment securities 80 19 (12) 5 92Properties and other fixed assets 47 (14) (8) 2 27Off-balance sheet credit exposures 5 4 – 1 10Others 44 62 (24) 3 85
Total specific allowances 1,159 622 (792) 46 1,035
Total general allowances for credit losses 3,054 121 – 47 3,222
Total allowances 4,213 743 (792) 93 4,257

| 137Financial statements
13 Earnings Per Ordinary Share
The GroupNumber of shares (millions) 2016 2015
Weighted average number of ordinary shares in issue (basic and diluted) (a) 2,517 2,496
The GroupIn $ millions 2016 2015
Net profit attributable to shareholders (Net profit less dividends on other equity instruments) (b) 4,188 4,417
Earnings per ordinary share ($)Basic and diluted (b)/(a) 1.66 1.77
14 Classification of Financial Instruments
The Group Designated Loans and at fair value receivables/ Held for through amortised Available- Held to HedgingIn $ millions trading profit or loss cost for-sale maturity derivatives Total
2016Assets Cash and balances with central banks 2,822 – 20,783 3,235 – – 26,840Government securities and treasury bills 8,998 – – 22,441 1,962 – 33,401Due from banks 5,852 – 22,984 1,182 – – 30,018Derivatives 25,307 – – – – 450 25,757Bank and corporate securities 7,750 57 21,145 16,465 – – 45,417Loans and advances to customers – 459 301,057 – – – 301,516Other financial assets – – 10,709 – – – 10,709
Total financial assets 50,729 516 376,678 43,323 1,962 450 473,658
Other asset items outside the scope 7,912 of FRS 39(a)
Total assets 481,570
Liabilities Due to banks 481 – 15,434 – – – 15,915Deposits and balances from customers 81 1,306 346,059 – – – 347,446Derivatives 24,230 – – – – 267 24,497Other financial liabilities 2,303 – 12,450 – – – 14,753Other debt securities 4,450 599 22,696 – – – 27,745Subordinated term debts – – 3,102 – – – 3,102
Total financial liabilities 31,545 1,905 399,741 – – 267 433,458
Other liability items outside the scope 1,142 of FRS 39(b)
Total liabilities 434,600

138 | DBS Annual Report 2016
The Group Designated Loans and at fair value receivables/ Held for through amortised Available- Held to HedgingIn $ millions trading profit or loss cost for-sale maturity derivatives Total
2015AssetsCash and balances with central banks 241 – 14,364 4,224 – – 18,829Government securities and treasury bills 7,569 – – 25,267 1,665 – 34,501Due from banks 4,961 – 32,571 753 – – 38,285Derivatives 23,190 – – – – 441 23,631Bank and corporate securities 9,035 77 17,380 13,581 – – 40,073Loans and advances to customers – 1,269 282,020 – – – 283,289Other financial assets – – 11,263 – – – 11,263
Total financial assets 44,996 1,346 357,598 43,825 1,665 441 449,871
Other asset items outside the scope 7,963 of FRS 39(a)
Total assets 457,834
Liabilities Due to banks 954 – 17,297 – – – 18,251Deposits and balances from customers 91 1,254 318,789 – – – 320,134Derivatives 21,971 – – – – 174 22,145Other financial liabilities 886 – 10,439 – – – 11,325Other debt securities 4,114 1,424 32,540 – – – 38,078Subordinated term debts – – 4,026 – – – 4,026
Total financial liabilities 28,016 2,678 383,091 – – 174 413,959
Other liability items outside the scope 1,079 of FRS 39(b)
Total liabilities 415,038
(a) Includes associates, goodwill and intangibles, properties and other fixed assets and deferred tax assets(b) Includes current tax liabilities, deferred tax liabilities and provision for loss in respect of off-balance sheet credit exposures
Financial assets and liabilities are presented net when there is a legally enforceable right to offset the recognised amounts, and there is intention to settle them on a net basis or to realise the asset and settle the liability simultaneously.
Financial assets and liabilities offset on the balance sheet As at 31 December 2016, there was no offset of financial assets and liabilities. As at 31 December 2015, “Loans and advances to customers” of $170 million were offset against “Deposits and balances from customers” of $170 million because contractually the Group has a legally enforceable right to offset these amounts, and intends to settle the loans and the deposits simultaneously at maturity or termination dates.
Financial assets and liabilities subject to netting agreement but not offset on the balance sheet The Group enters into master netting arrangements with counterparties where it is appropriate and feasible to do so to mitigate counterparty risk. The credit risk associated with favourable contracts is reduced by a master netting arrangement to the extent that if an event of default occurs, all amounts with the counterparty are settled on a net basis. Master netting arrangements do not result in an offset of financial assets and liabilities on the balance sheet, as the legal right to offset the transactions is conditional upon default.
These agreements include derivative master agreements (including the International Swaps and Derivatives Association (ISDA) Master Agreement), global master repurchase agreements and global securities lending agreements. The collateral received and pledged under these agreements is generally conducted under terms that are in accordance with normal market practice. In these agreements, the counterparty is typically allowed to sell or re-pledge those non-cash collateral (i.e. securities) lent or transferred, but has an obligation to return the securities at maturity. If the securities decrease in value, the Group may, in certain circumstances, be required to place additional cash collateral, and typically the counterparty has recourse only to the securities.
In addition, the Group receives cash and other collateral such as marketable securities to reduce its credit exposure. The Group also engages in a variety of counterparty credit mitigation arrangements in addition to netting and collateral arrangements.
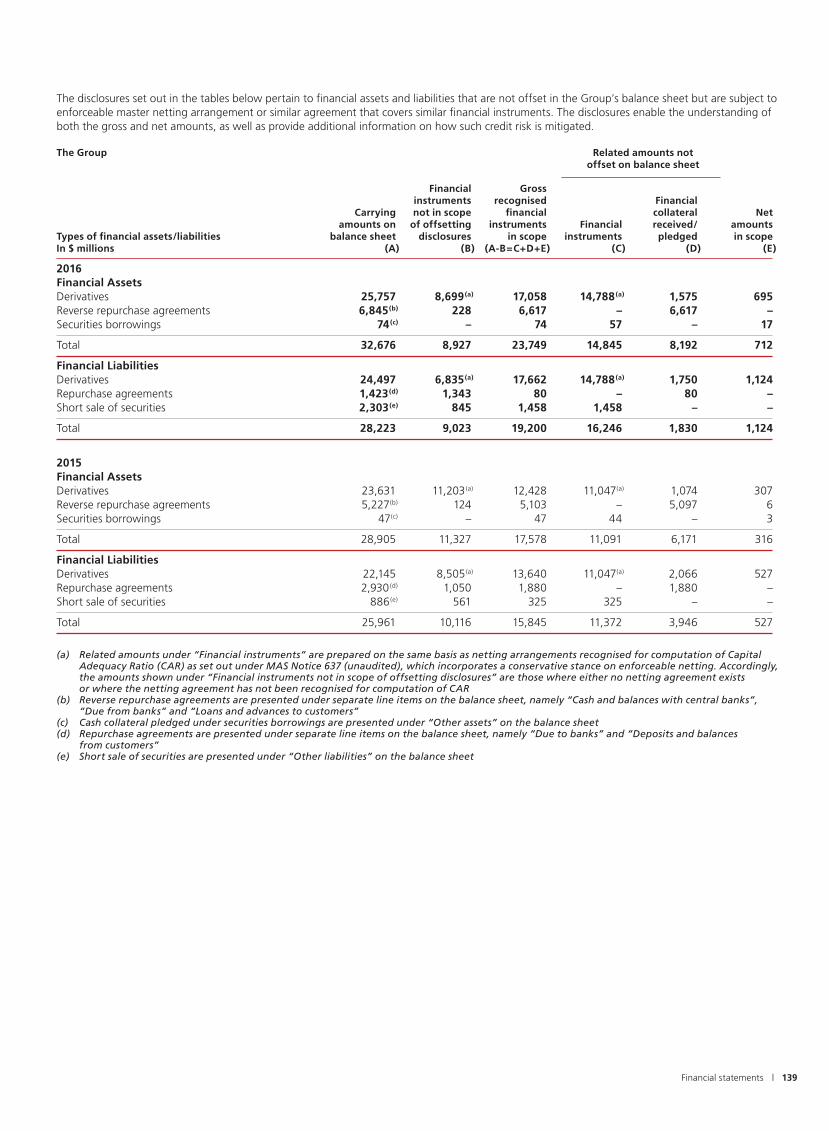
| 139Financial statements
The disclosures set out in the tables below pertain to financial assets and liabilities that are not offset in the Group’s balance sheet but are subject to enforceable master netting arrangement or similar agreement that covers similar financial instruments. The disclosures enable the understanding of both the gross and net amounts, as well as provide additional information on how such credit risk is mitigated.
The Group Related amounts not offset on balance sheet
Financial Gross instruments recognised Financial Carrying not in scope financial collateral Net amounts on of offsetting instruments Financial received/ amountsTypes of financial assets/liabilities balance sheet disclosures in scope instruments pledged in scopeIn $ millions (A) (B) (A-B=C+D+E) (C) (D) (E)
2016Financial AssetsDerivatives 25,757 8,699(a) 17,058 14,788(a) 1,575 695Reverse repurchase agreements 6,845(b) 228 6,617 – 6,617 –Securities borrowings 74(c) – 74 57 – 17
Total 32,676 8,927 23,749 14,845 8,192 712
Financial LiabilitiesDerivatives 24,497 6,835(a) 17,662 14,788(a) 1,750 1,124Repurchase agreements 1,423(d) 1,343 80 – 80 –Short sale of securities 2,303(e) 845 1,458 1,458 – –
Total 28,223 9,023 19,200 16,246 1,830 1,124
2015Financial AssetsDerivatives 23,631 11,203(a) 12,428 11,047(a) 1,074 307Reverse repurchase agreements 5,227(b) 124 5,103 – 5,097 6Securities borrowings 47(c) – 47 44 – 3
Total 28,905 11,327 17,578 11,091 6,171 316
Financial LiabilitiesDerivatives 22,145 8,505(a) 13,640 11,047(a) 2,066 527Repurchase agreements 2,930(d) 1,050 1,880 – 1,880 –Short sale of securities 886(e) 561 325 325 – –
Total 25,961 10,116 15,845 11,372 3,946 527
(a) Related amounts under “Financial instruments” are prepared on the same basis as netting arrangements recognised for computation of Capital Adequacy Ratio (CAR) as set out under MAS Notice 637 (unaudited), which incorporates a conservative stance on enforceable netting. Accordingly, the amounts shown under “Financial instruments not in scope of offsetting disclosures” are those where either no netting agreement exists or where the netting agreement has not been recognised for computation of CAR
(b) Reverse repurchase agreements are presented under separate line items on the balance sheet, namely “Cash and balances with central banks”, “Due from banks” and “Loans and advances to customers”
(c) Cash collateral pledged under securities borrowings are presented under “Other assets” on the balance sheet(d) Repurchase agreements are presented under separate line items on the balance sheet, namely “Due to banks” and “Deposits and balances
from customers”(e) Short sale of securities are presented under “Other liabilities” on the balance sheet

140 | DBS Annual Report 2016
15 Cash and Balances with Central Banks
The GroupIn $ millions 2016 2015
Cash on hand 2,938 3,070Non-restricted balances with central banks 17,194 9,008
Cash and cash equivalents 20,132 12,078
Restricted balances with central banks(a) 6,708 6,751
Total 26,840 18,829
(a) Mandatory balances with central banks
16 Government Securities and Treasury Bills
The Group Available- Held toIn $ millions Held for trading for-sale maturity Total
2016Singapore Government securities and treasury bills(a) 3,567 6,454 1,962 11,983Other government securities and treasury bills(b) 5,431 15,987 – 21,418
Total 8,998 22,441 1,962 33,401
2015Singapore Government securities and treasury bills(a) 2,569 8,078 1,665 12,312Other government securities and treasury bills(b) 5,000 17,189 – 22,189
Total 7,569 25,267 1,665 34,501
(a) Includes financial assets transferred of $70 million (2015: $579 million) (See Note 19)(b) Includes financial assets transferred of $2,740 million (2015: $1,900 million) (See Note 19)
17 Bank and Corporate Securities
The Group Designated at fair value Held for through Loans and Available-In $ millions trading profit or loss receivables for-sale Total
2016Bank and corporate debt securities(a) 5,340 57 21,299 14,897 41,593Less: Impairment allowances – – (154) – (154)Equity securities 2,410 – – 1,568 3,978
Total 7,750 57 21,145 16,465 45,417
2015Bank and corporate debt securities(a) 7,654 77 17,530 11,884 37,145Less: Impairment allowances – – (150) – (150)Equity securities 1,381 – – 1,697 3,078
Total 9,035 77 17,380 13,581 40,073
(a) Includes financial assets transferred of $414 million (2015: $787 million) (See Note 19)

| 141Financial statements
18 Loans and Advances to Customers
The GroupIn $ millions 2016 2015
Gross 305,415 286,871Less: Specific allowances 1,270 821 General allowances 2,629 2,761
301,516 283,289
Analysed by product Long-term loans 136,305 124,362Short-term facilities 65,894 62,976Housing loans 64,465 58,569Trade loans 38,751 40,964
Gross total 305,415 286,871
Analysed by currency Singapore dollar 123,733 117,587Hong Kong dollar 35,588 34,386US dollar 102,120 89,283Chinese yuan 11,577 19,516Others 32,397 26,099
Gross total 305,415 286,871
Refer to Note 41.4 for breakdown of loans and advances to customers by geography and by industry.
The table below shows the movements in specific and general allowances for loans and advances to customers during the year:
The Group Charge/ Net (Write-back) write-off Exchange Balance at to income during and other Balance atIn $ millions 1 January statement the year movements 31 December
2016Specific allowancesManufacturing 224 204 (143) 13 298Building and construction 120 39 (26) 3 136Housing loans 7 1 – – 8General commerce 157 239 (146) 21 271Transportation, storage and communications 94 404 (261) 79 316Financial institutions, investment and holding companies 60 13 (59) 1 15Professionals and private individuals (excluding housing loans) 58 125 (116) 4 71Others 101 86 (37) 5 155
Total specific allowances 821 1,111 (788) 126 1,270
Total general allowances 2,761 (111) – (21) 2,629
Total allowances 3,582 1,000 (788) 105 3,899
2015Specific allowancesManufacturing 331 185 (303) 11 224Building and construction 115 43 (43) 5 120Housing loans 8 (2) – 1 7General commerce 140 144 (133) 6 157Transportation, storage and communications 153 25 (87) 3 94Financial institutions, investment and holding companies 90 14 (48) 4 60Professionals and private individuals (excluding housing loans) 53 102 (99) 2 58Others 93 40 (35) 3 101
Total specific allowances 983 551 (748) 35 821
Total general allowances 2,583 125 – 53 2,761
Total allowances 3,566 676 (748) 88 3,582

142 | DBS Annual Report 2016
Included in loans and advances to customers are loans designated at fair value, as follows:
The GroupIn $ millions 2016 2015
Fair value designated loans and advances and related credit derivatives/enhancementsMaximum credit exposure 459 1,269Credit derivatives/enhancements – (459) (1,269) protection boughtCumulative change in fair value arising (98) (280) from changes in credit riskCumulative change in fair value of related 98 280 credit derivatives/enhancements
Changes in fair value arising from changes in credit risk are determined as the amount of change in fair value that is not attributable to changes in market conditions that give rise to market risk. These changes in market conditions include changes in a benchmark interest rate, foreign exchange rate or index of prices or rates.
During the year, the amount of change in the fair value of the loans and advances attributable to credit risk was a gain of $182 million (2015: loss of $86 million). During the year, the amount of change in the fair value of the related credit derivatives/enhancements was a loss of $182 million (2015: gain of $86 million).
19 Financial Assets Transferred
The Group transfers financial assets to third parties or structured entities in the course of business, for example when it pledges securities as collateral for repurchase agreements or when it undertakes securities lending arrangements.
Transferred assets are derecognised in the Group’s financial statements when substantially all of their risks and rewards are also transferred. Among them is pledged collateral (mainly cash) for derivative transactions under credit support annexes agreements. Derecognised assets that were subject to the Group’s partial continuing involvement were not material in 2016 and 2015.
Where the Group retains substantially all the risks and rewards of the transferred assets, they continue to be recognised in the Group’s financial statements. These assets are described below.
Securities Securities transferred under repurchase agreements and securities lending arrangements are generally conducted under terms in line with normal market practice. The counterparty is typically allowed to sell or re-pledge the securities but has an obligation to return them at maturity. If the securities decrease in value, the Group may, in certain circumstances, be required to place additional cash collateral. The counterparty typically has no further recourse to the Group’s other assets beyond the transferred securities.
For repurchase agreements, the securities transferred are either classified as “fair value through profit or loss” or “available-for-sale”. The Group receives cash in exchange and records a financial liability for the cash received. The Group also pledged assets to secure its short position in securities and to facilitate settlement operations. The fair value of the associated liabilities approximates the carrying amount of $2,881 million (2015: $3,255 million), which are recorded under “Due to banks”, “Deposits and balances from customers” and “Other liabilities” on the balance sheet.
For securities lending transactions, the securities lent are classified as “available-for-sale” or “loans and receivables” on the balance sheet, and the carrying amount approximates the fair value. As the Group mainly receives other financial assets in exchange, the associated liabilities recorded are not material.
The GroupIn $ millions 2016 2015
Securities pledged and transferred Singapore Government securities and treasury bills 70 579Other government securities and treasury bills 2,740 1,900Bank and corporate debt securities 414 787
Total securities pledged and transferred 3,224 3,266
Covered bondsPursuant to the Bank’s Global Covered Bond Programme, selected pools of residential mortgages originated by the Bank have been assigned to a bankruptcy-remote structured entity, Bayfront Covered Bonds Pte Ltd (see Notes 22.2 and 30.4). These residential mortgages continue to be recognised on the Bank’s balance sheet as the Bank remains exposed to the risks and rewards associated with them.
As at 31 December 2016, the carrying value of the covered bonds in issue was $2,227 million (2015: $1,412 million), while the carrying value of assets assigned was $8,636 million (2015: $4,268 million). The difference in values is attributable to an intended over-collateralisation required to maintain the credit ratings of the covered bonds in issue, and additional assets assigned to facilitate future issuances.
Other financial assetsThe Group also enters into structured funding transactions where it retains the contractual rights to receive cash flows of financial assets extended to third parties, but assumes a contractual obligation to pay these cash flows under the issued notes. The carrying amounts and fair values of these financial assets and liabilities both amount to $516 million (2015: $1,355 million).
20 Other Assets
The GroupIn $ millions 2016 2015
Accrued interest receivable 1,165 1,258Deposits and prepayments 423 317Receivables from securities business 643 316Sundry debtors and others 5,512 6,415Cash collateral pledged(a) 2,966 2,957Deferred tax assets (Note 21) 333 299
Total 11,042 11,562
(a) Mainly relates to cash collateral pledged in respect of derivative portfolios

| 143Financial statements
21 Deferred Tax Assets/Liabilities
Deferred tax assets and liabilities are offset when there is a legally enforceable right to set off current tax assets against current tax liabilities and when the deferred income taxes relate to the same tax authority. The deferred tax assets and liabilities are determined after appropriate offsetting as shown in “Other assets” (Note 20) and “Other liabilities” (Note 29) respectively.
Deferred tax assets and liabilities comprise the following temporary differences:
The GroupIn $ millions 2016 2015
Deferred income tax assetsAllowances for loan losses 356 310Available-for-sale financial assets and others 6 1Other temporary differences 177 146
539 457Amounts offset against deferred tax liabilities (206) (158)
Total 333 299
Deferred income tax liabilities Accelerated tax depreciation 114 111Available-for-sale financial assets and others 7 14Other temporary differences 118 66
239 191Amounts offset against deferred tax assets (206) (158)
Total 33 33
Net deferred tax assets 300 266
22 Subsidiaries and Consolidated Structured Entities
The CompanyIn $ millions 2016 2015
Investment in subsidiaries(a) Ordinary shares 17,376 16,726 Additional Tier 1 instruments 2,446 344 Other equity instruments 344 344
20,166 17,414Due from subsidiaries Subordinated term debts 1,699 1,046 Other receivables 420 1,087
2,119 2,133
Total 22,285 19,547
(a) The carrying amounts of certain investments which are designated as hedged items in a fair value hedge are adjusted for fair value changes attributable to the hedged risks
22.1 Main operating subsidiaries
The main operating subsidiaries within the Group are listed below: Effective shareholding %Name of subsidiary Country of incorporation 2016 2015
Commercial Banking DBS Bank Ltd Singapore 100 100DBS Bank (Hong Kong) Limited* Hong Kong 100 100DBS Bank (China) Limited* China 100 100DBS Bank (Taiwan) Limited* Taiwan 100 100PT Bank DBS Indonesia* Indonesia 99 99
Stockbroking DBS Vickers Securities Holdings Pte Ltd Singapore 100 100
* Audited by PricewaterhouseCoopers network firms outside Singapore

144 | DBS Annual Report 2016
The Group’s main subsidiaries are regulated banks and non-bank financial institutions. Statutory, contractual or regulatory requirements as well as protective rights of non-controlling interests may restrict the ability of the Company to access and transfer assets freely to or from other entities within the Group and to settle liabilities of the Group. Since the Group did not have any material non-controlling interests as at the balance sheet dates, any protective rights associated with these did not give rise to significant restrictions in 2015 and 2016.
Refer to Note 35 for information on non-controlling interests.
22.2 Consolidated structured entity
The structured entity consolidated by the Group is listed below:
Name of entity Purpose of consolidated structured entity Country of incorporation
Bayfront Covered Bonds Pte Ltd Covered bond guarantor Singapore
Bayfront Covered Bonds Pte Ltd is a bankruptcy-remote structured entity established in conjunction with the Bank’s USD 10 billion Global Covered Bond Programme (see Note 30.4). As part of the contractual structures that are integral to this programme, the Bank provides funding and hedging facilities to it.
23 Associates
The GroupIn $ millions 2016 2015
Quoted equity securities(a) 57 71Unquoted equity securities(b) 812 800
Sub-total 869 871
Share of post-acquisition reserves 21 129
Total 890 1,000
(a) The market value of the quoted associate amounted to $60 million (2015: $51 million) and was based on the last traded price on 1 September 2016 prior to its trading suspension
(b) The carrying amounts of certain investments which are designated as hedged items in a fair value hedge are adjusted for fair value changes attributable to the hedged risks
The Group’s share of income and expenses, assets and liabilities and off-balance sheet items of the associates at 31 December are as follows:
The GroupIn $ millions 2016 2015
Income statementShare of income 155 166Share of expenses (202) (152)Balance sheetShare of total assets 1,701 1,721Share of total liabilities 811 721Off-balance sheetShare of contingent liabilities and commitments # #
# Amount under $500,000
23.1 Main associates
The main associates of the Group are listed below: Effective shareholding %Name of associate Country of incorporation 2016 2015
UnquotedCentral Boulevard Development Pte Ltd** Singapore 33.3 33.3Network for Electronic Transfers (Singapore) Pte Ltd Singapore 33.3 33.3Changsheng Fund Management Company** China 33.0 33.0
** Audited by other auditors

| 145Financial statements
As of 31 December 2016 and 31 December 2015, no associate was individually material to the Group. As a non-controlling shareholder, the Group’s ability to receive dividends is subject to agreement with other shareholders. The associates may also be subject to statutory, contractual or regulatory requirements restricting dividend payments or to repay loans or advances made.
The Group’s share of commitments and contingent liabilities of the associates as well as its commitments to finance or otherwise provide resources to them are not material.
24 Unconsolidated Structured Entities
“Unconsolidated structured entities” are those structured entities as defined by FRS 112 and are not controlled by the Group. To facilitate customer transactions and for specific investment opportunities, the Group in the normal course of business enters into transactions with a range of counterparties, some of which would be defined as unconsolidated structured entities.
While the economic exposures may be the same as those to other type of entities, FRS 112 specifically requires companies to disclose such exposures arising from transactions with unconsolidated structured entities. The table below reflects exposures to third party securitisation structures where the Group holds an interest in the normal course of business.
As is the case with other types of counterparties, the carrying amount from transactions with unconsolidated structured entities have been included in the Group’s financial statements.
The risks arising from such transactions are subject to the Group’s risk management practices.
The table below represents the Group’s maximum exposure to loss which for on-balance sheet assets and liabilities is represented by the carrying amount, and does not reflect mitigating effects from the availability of netting arrangements and financial instruments that the Group may utilise to economically hedge the risks inherent in third party structured entities, or risk-reducing effects of collateral or other credit enhancements.
The GroupIn $ millions 2016 2015
Derivatives – 2Bank and corporate securities 1,267 1,317Loans and advances to customers 19 109Other assets # 1
Total assets 1,286 1,429Commitments and guarantees 23 203
Maximum Exposure to Loss 1,309 1,632
Derivatives 107 85
Total liabilities 107 85
# Amount under $500,000
The Group also sponsors third party structured entities, primarily by acting as lead arranger, underwriter or book runner for the issuance of securities by clients or by providing nominee services. Income, in the nature of fees from and assets transferred by all parties to sponsored structured entities, was not material.
The total assets of the third party structured entities are not considered meaningful for the purposes of understanding the related risks since they are neither representative of the Group’s exposure nor the income earned, and so have not been presented.
The Group has not provided any specific non-contractual financial support during the year and does not expect to provide non-contractual support to these third party structured entities in the future.
25 Acquisition
On 31 October 2016, DBS Bank Ltd agreed to acquire the wealth management and retail banking business of Australian and New Zealand Banking Group Limited (ANZ) in five markets for approximately $110 million above book value.
The portfolio of businesses being acquired is in Singapore, Hong Kong, China, Taiwan and Indonesia, representing total deposits of $17 billion and loans of $11 billion.
The acquisition of the businesses in each jurisdiction is independent of each other. Subject to obtaining regulatory approvals, the transaction is expected to be completed progressively from the second quarter of 2017 onwards, and the target is for full completion in all markets by early 2018. The transaction has no impact to 2016’s financial statements.

146 | DBS Annual Report 2016
26 Properties and Other Fixed Assets
The Group Subtotal of Owner- owner-occupied Investment occupied Other properties andIn $ millions properties properties fixed assets(a) other fixed assets Total
(1) (2) (3) (4)=(2)+(3) (5)=(1)+(4)2016CostBalance at 1 January 627 529 1,840 2,369 2,996Additions – 4 317 321 321Disposals (25) (2) (115) (117) (142)Exchange differences 1 14 14 28 29
Balance at 31 December 603 545 2,056 2,601 3,204
Less: Accumulated depreciationBalance at 1 January 172 139 1,111 1,250 1,422Depreciation charge 7 13 255 268 275Disposals (15) (2) (96) (98) (113)Exchange differences 1 11 8 19 20
Balance at 31 December 165 161 1,278 1,439 1,604
Less: Allowances for impairment – 28 – 28 28
Net book value at 31 December 438 356 778 1,134 1,572
Market value at 31 December 848 856
2015CostBalance at 1 January 644 538 1,553 2,091 2,735Additions – 6 328 334 334Disposals (24) (53) (69) (122) (146)Transfers (2) 2 – 2 –Exchange differences 9 36 28 64 73
Balance at 31 December 627 529 1,840 2,369 2,996
Less: Accumulated depreciationBalance at 1 January 170 120 913 1,033 1,203Depreciation charge 7 12 232 244 251Disposals (6) (11) (58) (69) (75)Transfers (1) 1 – 1 –Exchange differences 2 17 24 41 43
Balance at 31 December 172 139 1,111 1,250 1,422
Less: Allowances for impairment – 27 – 27 27
Net book value at 31 December 455 363 729 1,092 1,547
Market value at 31 December 868 831
(a) Refers to computer hardware, software, office equipment, furniture and fittings and other fixed assets
26.1 PWC Building was held as an asset for sale. Its net book value was $380 million as at 31 December 2016 (2015: $386 million) and its fair value based on the agreed property value in the sale of DBS China Square Limited (DCS), which owns PWC Building, was $747 million. As at 31 December 2015, its fair value was independently appraised at $711 million. Refer to Note 45 for the subsequent event disclosure on the sale of DCS.
26.2 The market values of the other properties are determined using investment method, or using a combination of comparable sales and investment methods. The properties are classified under Level 3 of the fair value hierarchy and the significant unobservable input used for valuation is market yields. As at 31 December 2016, there were no transfers into or out of Level 3.

| 147Financial statements
The Group leases out investment properties under operating leases. The leases typically run for an initial period of one to five years, and may contain an option to renew the lease after that date at which time all terms will be renegotiated.
The minimum lease receivables as at the balance sheet date are as follows: The GroupIn $ millions 2016 2015
Minimum lease receivables(a)
Not later than 1 year 31 33Later than 1 year but not later than 5 years 44 34
Total 75 67
(a) Includes lease receivables from operating leases under PWC Building, an asset held for sale. Refer to Note 45 for subsequent event disclosure on the sale of DBS China Square Limited, which owns PWC Building
27 Goodwill and Intangibles
The carrying amounts of the Group’s goodwill and intangibles arising from business acquisitions are as follows:
The GroupIn $ millions 2016 2015
DBS Bank (Hong Kong) Limited 4,631 4,631Others 486 486
Total 5,117 5,117
The carrying amounts of the CGUs are reviewed at least once a year to determine if the goodwill associated with them should be impaired. If a CGU’s carrying amount exceeds its recoverable value, a goodwill impairment charge is recognised in the income statement.
The recoverable value is determined based on a value-in-use calculation. The CGU’s five-year projected cash flows, taking into account projected regulatory capital requirements, are discounted by its cost of capital to derive its present value. To derive the value beyond the fifth year, a long-term growth rate is imputed to the fifth-year cash flow and then discounted by the cost of capital to derive the terminal value. The long-term growth rate used does not exceed the historical long-term growth rate of the market the CGU operates in. The recoverable value is the sum of the present value of the five-year cash flows and the terminal value.
A growth rate of 4.5% (2015: 4.5%) and discount rate of 9.0% (2015: 9.0%) were assumed in the value-in-use calculation for DBS Bank (Hong Kong) Limited’s franchise.
The process of evaluating goodwill impairment involves management judgement and prudent estimates of various factors including future cash flows as well as the cost of capital and long-term growth rates. The results can be highly sensitive to the assumptions used. Management believes that any reasonably possible change in the key assumptions would not cause the carrying amount of the operating unit to exceed its recoverable amount at 31 December 2016. However, if conditions in Hong Kong and the banking industry deteriorate and turn out to be significantly worse than anticipated in the Group’s performance forecast, the goodwill may be further impaired in future periods.
28 Deposits and Balances from Customers
The GroupIn $ millions 2016 2015
Analysed by currencySingapore dollar 152,115 140,772US dollar 112,107 101,298Hong Kong dollar 36,234 31,849Chinese yuan 9,822 14,500Others 37,168 31,715
Total 347,446 320,134
Analysed by productSavings accounts 140,617 131,065Current accounts 73,984 65,989Fixed deposits 130,178 120,269Other deposits 2,667 2,811
Total 347,446 320,134

148 | DBS Annual Report 2016
29 Other Liabilities
The GroupIn $ millions 2016 2015
Cash collateral received(a) 1,710 981Accrued interest payable 434 465Provision for loss in respect of off-balance sheet credit exposures 453 324Payables in respect of securities business 641 318Sundry creditors and others(b) 9,665 8,675Current tax liabilities 656 722Short sale of securities 2,303 886Deferred tax liabilities (Note 21) 33 33
Total 15,895 12,404
(a) Mainly relates to cash collateral received in respect of derivative portfolios(b) Includes income received in advance of $1,493 million (2015: $800 million) arising from a 15-year regional distribution agreement entered
with Manulife
30 Other Debt Securities
The Group The CompanyIn $ millions 2016 2015 2016 2015
Negotiable certificates of deposit (Note 30.1) 2,137 1,200 – –Senior medium term notes (Note 30.2) 6,410 9,870 2,400 1,884Commercial papers (Note 30.3) 11,586 19,174 – –Covered bonds (Note 30.4) 2,227 1,412 – –Other debt securities (Note 30.5) 5,385 6,422 – –
Total 27,745 38,078 2,400 1,884
Due within 1 year 17,539 26,839 – 103Due after 1 year 10,206 11,239 2,400 1,781
Total 27,745 38,078 2,400 1,884
30.1 Negotiable certificates of deposit issued and outstanding at 31 December are as follows:
In $ millions The GroupCurrency Interest Rate and Repayment Terms 2016 2015
Issued by the Bank and other subsidiariesHKD 2.25% to 4.22%, payable quarterly 314 503HKD 3M HIBOR +0.25%, payable quarterly – 46HKD 3M HIBOR +0.2%, payable quarterly – 70HKD 2.5% to 4.2%, payable annually 118 156HKD Zero-coupon, payable on maturity 84 –AUD 1.74% to 2.51%, payable on maturity 1,455 165USD 0.7%, payable on maturity – 42IDR 10.4% to 10.65%, payable on maturity – 46TWD 0.438% to 0.468%, payable on maturity – 172INR Zero-coupon, payable on maturity 41 –CNY 2.97%, payable on maturity 125 –
Total 2,137 1,200
The outstanding negotiable certificates of deposit as at 31 December 2016 were issued between 22 August 2008 and 22 December 2016 (2015: 22 August 2008 and 15 December 2015) and mature between 5 January 2017 and 16 March 2021 (2015: 5 January 2016 and 16 March 2021).

| 149Financial statements
30.2 Senior medium term notes issued and outstanding as at 31 December are as follows:
In $ millions The Group The CompanyCurrency Interest Rate and Repayment Terms 2016 2015 2016 2015
Issued by the CompanyUSD 2.246%, payable semi-annually 1,093 1,074 1,093 1,074HKD 1.87%, payable annually 97 – 97 –SGD 2.78%, payable semi-annually 487 – 487 –USD Floating rate note, payable quarterly 723 707 723 707AUD Floating rate note, payable quarterly – 103 – 103
Issued by the BankGBP Floating rate note, payable quarterly – 3,604 – –USD 2.35%, payable semi-annually 1,447 1,418 – –USD 1.27% to 1.41%, payable quarterly 984 – – –USD Floating rate note, payable quarterly 1,273 2,658 – –USD 1.454%, payable annually 145 141 – –HKD 2.24%, payable quarterly 93 92 – –CNH 4.4%, payable annually 68 73 – –
Total 6,410 9,870 2,400 1,884
The senior medium term notes were issued by the Company and the Bank under its USD 30 billion Global Medium Term Note Programme. The outstanding senior medium term notes as at 31 December 2016 were issued between 21 February 2012 and 7 September 2016 (2015: 21 February 2012 and 16 November 2015) and mature between 20 January 2017 and 11 January 2021 (2015: 14 January 2016 and 15 January 2020).
30.3 The zero-coupon commercial papers which are payable on maturity were issued by the Bank under its USD 5 billion Euro Commercial Paper Programme and USD 15 billion US Commercial Paper Programme. The outstanding notes as at 31 December 2016 were issued between 21 September 2016 and 16 December 2016 (2015: 2 July 2015 and 30 December 2015) and mature between 3 January 2017 and 12 April 2017 (2015: 4 January 2016 and 24 May 2016).
30.4 To augment its sources of wholesale funding, the Bank established a USD 10 billion Global Covered Bond Programme on 16 June 2015. A covered bond is a senior obligation of the Bank backed by a cover pool comprising assets that have been ring-fenced via contractual structures in a bankruptcy-remote structured entity, Bayfront Covered Bonds Pte Ltd. Bayfront Covered Bonds Pte Ltd has provided an unconditional and irrevocable guarantee, which is secured over the cover pool, to the covered bond holders.
The outstanding covered bonds as at 31 December 2016 were issued between 6 August 2015 and 3 June 2016 (2015: on 6 August 2015) and mature between 6 August 2018 and 3 June 2019 (2015: on 6 August 2018).
30.5 Other debt securities issued and outstanding at 31 December are as follows:
In $ millions The GroupType 2016 2015
Issued by the Bank and other subsidiariesEquity linked notes 1,521 1,603Credit linked notes 1,202 2,058Interest linked notes 2,042 1,817Foreign exchange linked notes 220 63Fixed rate bonds 400 881
Total 5,385 6,422
The outstanding securities as at 31 December 2016 were issued between 4 October 2011 and 30 December 2016 (2015: 31 March 2006 and 31 December 2015) and mature between 3 January 2017 and 30 August 2046 (2015: 4 January 2016 and 13 November 2045).
31 Subordinated Term Debts
The following subordinated term debts issued by the Company and the Bank are classified as liabilities. These term debt instruments have a junior or lower priority claim on the issuing entity’s assets in the event of a default or liquidation.
The subordinated term debts issued by the Company include provisions for them to be written-off if and when the Monetary Authority of Singapore notifies the Company that a write-off of the instruments, or a public sector injection of capital (or equivalent support), is necessary, without which the Company or the Group would become non-viable. These instruments qualify as Tier 2 capital under the Monetary Authority of Singapore Notice on Risk Based Capital Adequacy Requirements for Banks Incorporated in Singapore (MAS Notice 637), on the basis that the Company is subject to the application of MAS Notice 637.

150 | DBS Annual Report 2016
The subordinated term debts issued by the Bank are in the first instance ineligible as capital instruments under Basel III rules as they lack provisions for conversion to ordinary shares or write-off at the point of non-viability as determined by the Monetary Authority of Singapore, but are accorded partial eligibility as Tier 2 capital (subject to a cap) for calculating capital adequacy ratios under the Basel III transitional arrangements for capital instruments issued prior to 1 January 2013.
The Group The CompanyIn $ millions Maturity InterestInstrument Note Issue Date Date Payment 2016 2015 2016 2015
Issued by the CompanyS$250m 3.80% Subordinated Notes 31.1 20 Jan 2016 20 Jan 2028 Jan/Jul 252 – 252 – due 2028 Callable in 2023JPY10,000m 0.918% Subordinated Notes 31.2 8 Mar 2016 8 Mar 2026 Mar/Sep 123 – 123 – due 2026HK$1,500m 3.24% Subordinated Notes 31.3 19 Apr 2016 19 Apr 2026 Jan/Apr/ 270 – 270 – due 2026 Callable in 2021 Jul/Oct
Issued by the BankUS$900m Floating Rate Subordinated Notes 31.4 16 Jun 2006 15 Jul 2021 Jan/Apr/ – 495 – – due 2021 Callable with Step-up in 2016 Jul/OctS$500m 4.47% Subordinated Notes 31.4 11 Jul 2006 15 Jul 2021 Jan/Jul – 500 – – due 2021 Callable with Step-up in 2016S$1,000m 3.30% Subordinated Notes 31.5 21 Feb 2012 21 Feb 2022 Feb/Aug 866 991 – – due 2022 Callable in 2017US$750m 3.625% Subordinated Notes 31.6 21 Mar 2012 21 Sep 2022 Mar/Sep 1,085 1,064 – – due 2022 Callable in 2017S$1,000m 3.10% Subordinated Notes 31.7 14 Aug 2012 14 Feb 2023 Feb/Aug 506 976 – – due 2023 Callable in 2018
Total 3,102 4,026 645 –
Due within 1 year 866 613 – –Due after 1 year 2,236 3,413 645 –
Total 3,102 4,026 645 –
31.1 Interest on the notes is payable at 3.80% per annum up to 20 January 2023. Thereafter, the interest rate resets to the then-prevailing five-year Singapore Dollar Swap Offer Rate plus 1.10% per annum. Interest is paid semi-annually on 20 January and 20 July each year. The notes are redeemable on 20 January 2023 or on any interest payment date thereafter. Swaps have been entered into to exchange the fixed rate payments on the notes to floating rate payments based on the six-month Singapore Dollar Swap Offer Rate.
31.2 Interest on the notes is payable semi-annually at 0.918% per annum on 8 March and 8 September each year. Swaps have been entered into to exchange the fixed rate payments on the notes to floating rate payments based on the six-month Singapore Dollar Swap Offer Rate.
31.3 Interest on the notes is payable at 3.24% per annum up to 19 April 2021. Thereafter, the interest rate resets to the then-prevailing five-year Hong Kong Dollar Swap Rate plus 1.90% per annum. Interest is paid quarterly on 19 January, 19 April, 19 July and 19 October each year. The notes are redeemable on 19 April 2021 or on any interest payment date thereafter. Swaps have been entered into to exchange the fixed rate payments on the notes to floating rate payments based on the three-month Hong Kong Interbank Offered Rate.
31.4 These notes have been fully redeemed on 15 July 2016.
31.5 Interest on the notes is payable at 3.30% per annum up to 21 February 2017. Thereafter, the interest rate resets to the then-prevailing five-year Singapore Dollar Swap Offer Rate plus 2.147% per annum. Interest is paid semi-annually on 21 February and 21 August each year. The notes are redeemable on 21 February 2017 or on any interest payment date thereafter. Swaps have been entered into to exchange the fixed rate payments on the notes to floating rate payments based on the six-month Singapore Dollar Swap Offer Rate. On 11 January 2016, the Company purchased $134.25 million of the notes. Pursuant to a notice of redemption issued on 11 January 2017, all of the outstanding notes will be redeemed on 21 February 2017.
31.6 Interest on the notes is payable at 3.625% per annum up to 21 September 2017. Thereafter, the interest rate resets to the then-prevailing five-year U.S. Dollar Swap Rate plus 2.229% per annum. Interest is paid semi-annually on 21 March and 21 September each year. The notes are redeemable on 21 September 2017 or on any interest payment date thereafter. Swaps have been entered into to exchange the fixed rate payments on the notes to floating rate payments based on the three-month U.S. Dollar London Interbank Offered Rate.
31.7 Interest on the notes is payable at 3.10% per annum up to 14 February 2018. Thereafter, the interest rate resets to the then-prevailing 5-year Singapore Dollar Swap Offer Rate plus 2.085% per annum. Interest is paid semi-annually on 14 February and 14 August each year. The notes are redeemable on 14 February 2018 or on any interest payment date thereafter. Swaps have been entered into to exchange the fixed rate payments on the notes to floating rate payments based on the six-month Singapore Dollar Swap Offer Rate. On 11 January 2016, the Company purchased $491.75 million of the notes.
For more information on each instrument, please refer to the “Capital Disclosures” section (unaudited) at the Group’s website (http://www.dbs.com/investor/capital-disclosures.html).

| 151Financial statements
32 Share Capital
The Company issued 34,181,336 (2015: 5,292,246) ordinary shares during the year to eligible shareholders who elected to participate in the Scrip Dividend Scheme.
In 2015, pursuant to the DBSH Share Option Plan, the Company issued 350,623 ordinary shares, fully paid in cash upon the exercise of the options granted. Any outstanding unexercised options as of 1 March 2015 has lapsed following the expiry of all options granted under the Plan. In 2015, the Company also issued 30,011,421 ordinary shares upon the conversion of the outstanding 30,011,421 non-voting redeemable convertible preference shares (CPS). The newly issued shares rank pari passu in all respects with the previously issued shares.
As at 31 December 2016, the number of treasury shares held by the Group is 12,851,873 (2015: 14,873,769), which is 0.51% (2015: 0.59%) of the total number of issued shares net of treasury shares.
Movements in the number of shares and carrying amount of share capital are as follows:
The Group The Company Shares (‘000) In $ millions Shares (‘000) In $ millions 2016 2015 2016 2015 2016 2015 2016 2015
Ordinary sharesBalance at 1 January 2,514,781 2,479,126 10,391 10,113 2,514,781 2,479,126 10,391 10,113Issue of shares pursuant to 34,181 5,293 508 110 34,181 5,293 508 110 Scrip Dividend SchemeIssue of shares upon – 351 – 4 – 351 – 4 exercise of share optionsReclassification of reserves – – – 1 – – – 1 upon exercise of share optionsConversion from non- – 30,011 – 163 – 30,011 – 163 voting redeemable CPS
Balance at 31 December 2,548,962 2,514,781 10,899 10,391 2,548,962 2,514,781 10,899 10,391
Treasury sharesBalance at 1 January (14,874) (6,762) (277) (105) (13,000) (5,109) (247) (82)Purchase of treasury shares (4,010) (13,716) (60) (258) (4,010) (13,000) (60) (246)Draw-down of reserves 6,059 5,604 108 86 – – – – upon vesting of performance sharesIssue of shares pursuant (27) – # – – – – – to Scrip Dividend SchemeTransfer of treasury shares – – – – 5,282 5,109 98 81
Balance at 31 December (12,852) (14,874) (229) (277) (11,728) (13,000) (209) (247)
Convertible preference shares (CPS) Balance at 1 January – 30,011 – 163 – 30,011 – 163Conversion to ordinary shares – (30,011) – (163) – (30,011) – (163)
Balance at 31 December – – – – – – – –
Issued share capital 10,670 10,114 10,690 10,144 at 31 December
# Amount under $500,000

152 | DBS Annual Report 2016
33 Other Equity Instruments
The following perpetual capital securities issued by the Company are classified as other equity instruments. These instruments are subordinated to all liabilities of the Company and senior only to ordinary shareholders of the Company. Their terms require them to be written-off if and when the Monetary Authority of Singapore notifies the Company that a write-off of the instruments, or a public sector injection of capital (or equivalent support), is necessary, without which the Company or the Group would become non-viable. These instruments qualify as Additional Tier 1 capital under MAS Notice 637, on the basis that the Company is subject to the application of MAS Notice 637.
The Group and Distribution The CompanyIn $ millions Note Issue Date Payment 2016 2015
Issued by the Company S$805m 4.70% Non-Cumulative Non-Convertible 33.1 3 Dec 2013 Jun/Dec 803 803 Perpetual Capital Securities First Callable in 2019US$750m 3.60% Non-Cumulative Non-Convertible 33.2 7 Sep 2016 Mar/Sep 1,009 – Perpetual Capital Securities First Callable in 2021
Total 1,812 803
33.1 Distributions are payable at 4.70% per annum up to 3 June 2019. Thereafter, the distribution rate resets every 5 years to the then-prevailing five-year Singapore Dollar Swap Offer Rate plus 3.061% per annum. Distributions are paid semi-annually on 3 June and 3 December each year, unless cancelled by the Company. The capital securities are redeemable on 3 June 2019 or on any date thereafter.
33.2 Distributions are payable at 3.60% per annum up to 7 September 2021. Thereafter, the distribution rate resets every 5 years to the then-prevailing five-year U.S. Dollar Swap Rate plus 2.39% per annum. Distributions are paid semi-annually on 7 March and 7 September each year, unless cancelled by the Company. The capital securities are redeemable on 7 September 2021 or on any distribution payment date thereafter.
For more information on each instrument, please refer to the “Capital Disclosures” section (unaudited) at the Group’s website (http://www.dbs.com/investor/capital-disclosures.html).
34 Other Reserves and Revenue Reserves
34.1 Other reserves
The Group The CompanyIn $ millions 2016 2015 2016 2015
Available-for-sale revaluation reserves 26 96 – –Cash flow hedge reserves 19 8 (1) #General reserves 95 2,453 – –Capital reserves (180) (213) – –Share option and share plan reserves 169 168 169 168Others 4,193 4,193 – –
Total 4,322 6,705 168 168
# Amount under $500,000

| 153Financial statements
Movements in other reserves during the year are as follows:
The Group Available- Share for-sale Cash flow option and revaluation hedge General Capital share plan OtherIn $ millions reserves reserves reserves(a) reserves(b) reserves reserves(c) Total
2016Balance at 1 January 96 8 2,453 (213) 168 4,193 6,705Net exchange translation adjustments (5) – 2 31 – – 28Share of associates’ reserves (3) (5) – 2 – – (6)Cost of share-based payments – – – – 109 – 109Draw-down of reserves upon – – – – (108) – (108) vesting of performance sharesTransfer to revenue reserves (Note 34.2) – – (2,360) – – – (2,360)Available-for-sale (AFS) financial assets and others:– net valuation taken to equity 185 (56) – – – – 129– transferred to income statement (261)(d) 74 – – – – (187)– tax on items taken directly to 14 (2) – – – – 12 or transferred from equity
Balance at 31 December 26 19 95 (180) 169 4,193 4,322
2015Balance at 1 January 284 (33) 2,453 (233) 152 4,271 6,894Net exchange translation adjustments 1 1 – 19 – – 21Share of associates’ reserves (1) 2 – 1 – – 2Cost of share-based payments – – – – 103 – 103Reclassification of reserves upon – – – – (1) – (1) exercise of share optionsDraw-down of reserves upon – – – – (86) – (86) vesting of performance sharesAcquisition of non-controlling interests – – – – – (78) (78)Available-for-sale (AFS) financial assets and others:– net valuation taken to equity (74) (144) – – – – (218)– transferred to income statement (125)(d) 186 – – – – 61– tax on items taken directly to 11 (4) – – – – 7 or transferred from equity
Balance at 31 December 96 8 2,453 (213) 168 4,193 6,705
(a) During the year, the Group transferred $2.36 billion of general reserves to revenue reserves (b) Capital reserves include net exchange translation adjustments arising from translation differences on net investments in foreign subsidiaries,
associates and branches, and the related foreign currency financial instruments designated as a hedge(c) Other reserves mainly relate to share premium of the Bank prior to the restructuring of the Bank under the Company pursuant to a scheme
of arrangement under Section 210 of the Singapore Companies Act on 26 June 1999 (d) Includes impairment of AFS financial assets of $7 million (2015: $15 million)
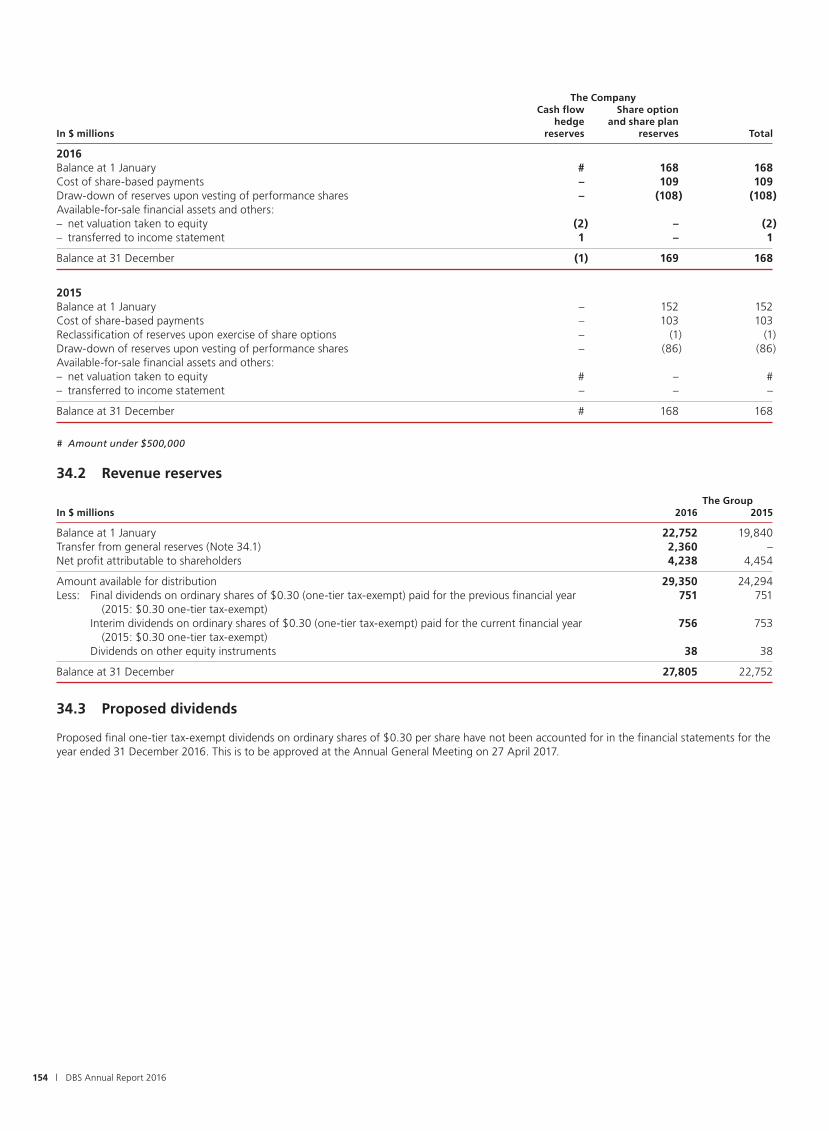
154 | DBS Annual Report 2016
The Company Cash flow Share option hedge and share planIn $ millions reserves reserves Total
2016Balance at 1 January # 168 168Cost of share-based payments – 109 109Draw-down of reserves upon vesting of performance shares – (108) (108)Available-for-sale financial assets and others:– net valuation taken to equity (2) – (2)– transferred to income statement 1 – 1
Balance at 31 December (1) 169 168
2015Balance at 1 January – 152 152Cost of share-based payments – 103 103Reclassification of reserves upon exercise of share options – (1) (1)Draw-down of reserves upon vesting of performance shares – (86) (86)Available-for-sale financial assets and others:– net valuation taken to equity # – #– transferred to income statement – – –
Balance at 31 December # 168 168
# Amount under $500,000
34.2 Revenue reserves
The GroupIn $ millions 2016 2015
Balance at 1 January 22,752 19,840Transfer from general reserves (Note 34.1) 2,360 –Net profit attributable to shareholders 4,238 4,454
Amount available for distribution 29,350 24,294Less: Final dividends on ordinary shares of $0.30 (one-tier tax-exempt) paid for the previous financial year 751 751 (2015: $0.30 one-tier tax-exempt) Interim dividends on ordinary shares of $0.30 (one-tier tax-exempt) paid for the current financial year 756 753 (2015: $0.30 one-tier tax-exempt) Dividends on other equity instruments 38 38
Balance at 31 December 27,805 22,752
34.3 Proposed dividends
Proposed final one-tier tax-exempt dividends on ordinary shares of $0.30 per share have not been accounted for in the financial statements for the year ended 31 December 2016. This is to be approved at the Annual General Meeting on 27 April 2017.
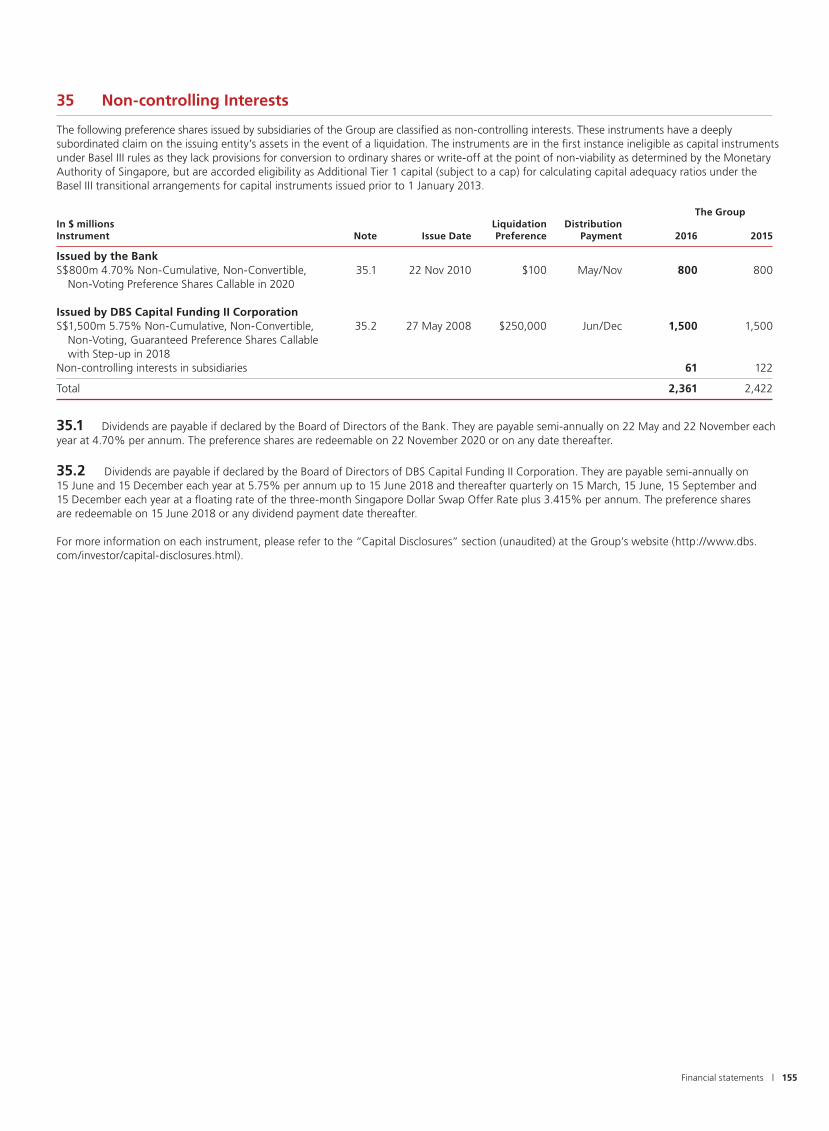
| 155Financial statements
35 Non-controlling Interests
The following preference shares issued by subsidiaries of the Group are classified as non-controlling interests. These instruments have a deeply subordinated claim on the issuing entity’s assets in the event of a liquidation. The instruments are in the first instance ineligible as capital instruments under Basel III rules as they lack provisions for conversion to ordinary shares or write-off at the point of non-viability as determined by the Monetary Authority of Singapore, but are accorded eligibility as Additional Tier 1 capital (subject to a cap) for calculating capital adequacy ratios under the Basel III transitional arrangements for capital instruments issued prior to 1 January 2013.
The GroupIn $ millions Liquidation DistributionInstrument Note Issue Date Preference Payment 2016 2015
Issued by the BankS$800m 4.70% Non-Cumulative, Non-Convertible, 35.1 22 Nov 2010 $100 May/Nov 800 800 Non-Voting Preference Shares Callable in 2020
Issued by DBS Capital Funding II CorporationS$1,500m 5.75% Non-Cumulative, Non-Convertible, 35.2 27 May 2008 $250,000 Jun/Dec 1,500 1,500 Non-Voting, Guaranteed Preference Shares Callable with Step-up in 2018Non-controlling interests in subsidiaries 61 122
Total 2,361 2,422
35.1 Dividends are payable if declared by the Board of Directors of the Bank. They are payable semi-annually on 22 May and 22 November each year at 4.70% per annum. The preference shares are redeemable on 22 November 2020 or on any date thereafter.
35.2 Dividends are payable if declared by the Board of Directors of DBS Capital Funding II Corporation. They are payable semi-annually on 15 June and 15 December each year at 5.75% per annum up to 15 June 2018 and thereafter quarterly on 15 March, 15 June, 15 September and 15 December each year at a floating rate of the three-month Singapore Dollar Swap Offer Rate plus 3.415% per annum. The preference shares are redeemable on 15 June 2018 or any dividend payment date thereafter.
For more information on each instrument, please refer to the “Capital Disclosures” section (unaudited) at the Group’s website (http://www.dbs.com/investor/capital-disclosures.html).

156 | DBS Annual Report 2016
36 Contingent Liabilities and Commitments
The Group issues guarantees, performance bonds and indemnities in the ordinary course of business. The majority of these facilities are offset by corresponding obligations of third parties.
Guarantees and performance bonds are generally written by the Group to support the performance of a customer to third parties. As the Group will only be required to meet these obligations in the event of the customer’s default, the cash requirements of these instruments are expected to be considerably below their nominal amount.
Endorsements are residual liabilities of the Group in respect of bills of exchange, which have been paid and subsequently rediscounted. The GroupIn $ millions 2016 2015
Guarantees on account of customers 15,078 13,605Endorsements and other obligations 7,636 6,296 on account of customersUndrawn credit commitments(a) 235,324 219,773Undisbursed and underwriting commitments 9 9 in securities
Sub-total 258,047 239,683Operating lease commitments 549 661 (Note 36.2)Capital commitments 69 48
Total 258,665 240,392
Analysed by industry (excluding operating lease and capital commitments)Manufacturing 42,718 38,188Building and construction 23,436 17,210Housing loans 7,155 9,239General commerce 50,338 52,695Transportation, storage and communications 13,933 13,203Financial institutions, investment and holding 22,686 22,007 companiesProfessionals and private individuals 75,615 67,140 (excluding housing loans)Others 22,166 20,001
Total 258,047 239,683
Analysed by geography (excluding operating lease and capital commitments)(b)
Singapore 105,141 101,521Hong Kong 48,334 48,550Rest of Greater China 22,533 18,073South and Southeast Asia 25,750 22,732Rest of the World 56,289 48,807
Total 258,047 239,683
(a) Includes commitments that are unconditionally cancellable at any time by the Group (2016: $193,016 million, 2015: $183,125 million)
(b) Based on the country of incorporation of the counterparty or borrower
36.1 The Group has existing outsourcing agreements for the provision of information technology and related support to the Group’s operations. There are various termination clauses in the agreements that could require the Group to pay termination fees on early termination of the contract or part thereof. The termination fees are stipulated in the agreements and are determined based on the year when the agreements or part thereof are terminated.
36.2 The Group has existing significant operating lease commitments including the leasing of office premises in Changi Business Park and Marina Bay Financial Centre in Singapore; and One Island East in Hong Kong. These include lease commitments for which the payments will be determined in the future based on the prevailing market rates in accordance with the lease agreements, of which the related amounts have not been included. The leases have varying terms, escalation clauses and renewal rights.
37 Financial Derivatives
Financial derivatives are financial instruments whose characteristics are derived from the underlying assets, or from interest and exchange rates or indices. These include forwards, swaps, futures and options. The following sections outline the nature and terms of the most common types of derivatives used by the Group.
Interest rate derivativesForward rate agreements give the buyer the ability to determine the underlying rate of interest for a specified period commencing on a specified future date (the settlement date). There is no exchange of principal and settlement is effected on the settlement date. The settlement amount is the difference between the contracted rate and the market rate prevailing on the settlement date.
Interest rate swaps involve the exchange of interest obligations with a counterparty for a specified period without exchanging the underlying (or notional) principal.
Interest rate futures are exchange-traded agreements to buy or sell a standard amount of a specified fixed income security or time deposit at an agreed interest rate on a standard future date.
Interest rate options give the buyer, on payment of a premium, the right but not the obligation, to fix the rate of interest on a future deposit or loan, for a specified period and commencing on a specified future date.
Interest rate caps and floors give the buyer the ability to fix the maximum or minimum rate of interest. There is no facility to deposit or draw down funds, instead the writer pays to the buyer the amount by which the market rate exceeds or is less than the cap rate or the floor rate respectively. This category includes combinations of interest rate caps and floors, which are known as interest rate collars.
Foreign exchange derivativesForward foreign exchange contracts are agreements to buy or sell fixed amounts of currency at agreed rates of exchange on a specified future date.
Cross currency swaps are agreements to exchange, and on termination of the swap, re-exchange principal amounts denominated in different currencies. Cross currency swaps may involve the exchange of interest payments in one specified currency for interest payments in another specified currency for a specified period.
Currency options give the buyer, on payment of a premium, the right but not the obligation, to buy or sell specified amounts of currency at agreed rates of exchange on or before a specified future date.
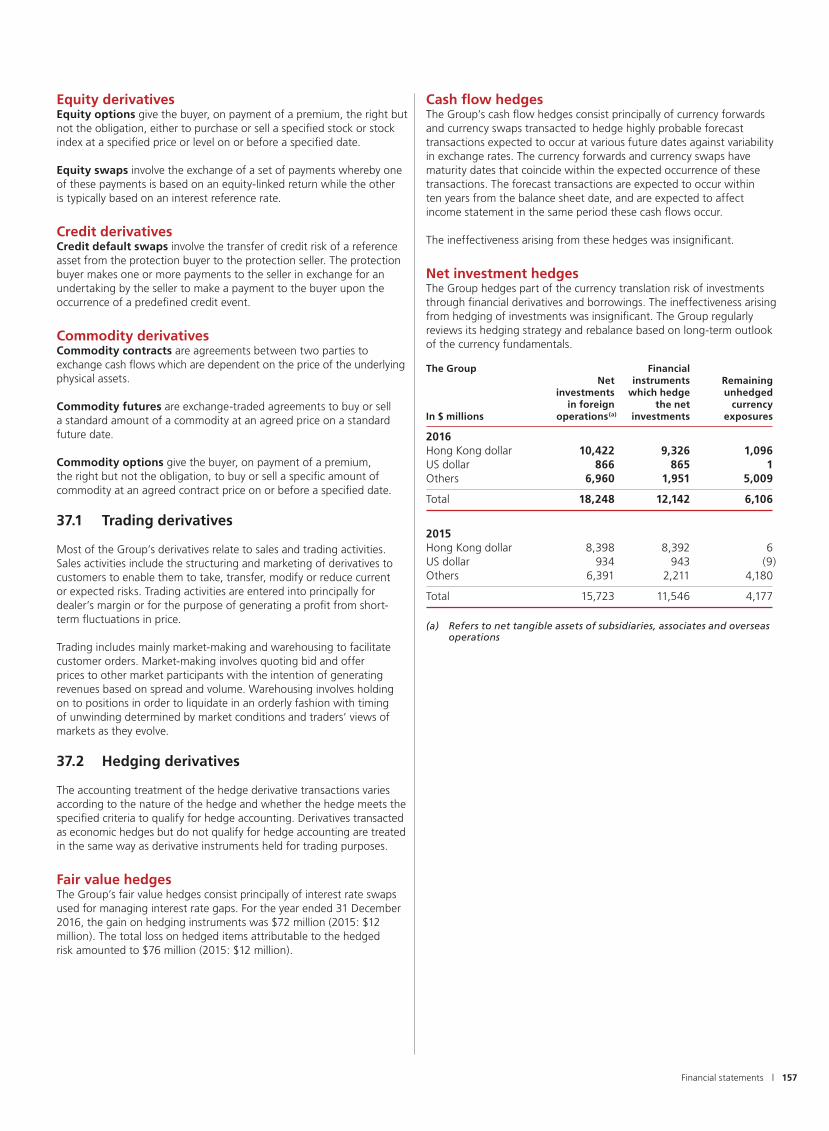
| 157Financial statements
Equity derivativesEquity options give the buyer, on payment of a premium, the right but not the obligation, either to purchase or sell a specified stock or stock index at a specified price or level on or before a specified date.
Equity swaps involve the exchange of a set of payments whereby one of these payments is based on an equity-linked return while the other is typically based on an interest reference rate.
Credit derivativesCredit default swaps involve the transfer of credit risk of a reference asset from the protection buyer to the protection seller. The protection buyer makes one or more payments to the seller in exchange for an undertaking by the seller to make a payment to the buyer upon the occurrence of a predefined credit event.
Commodity derivativesCommodity contracts are agreements between two parties to exchange cash flows which are dependent on the price of the underlying physical assets.
Commodity futures are exchange-traded agreements to buy or sell a standard amount of a commodity at an agreed price on a standard future date.
Commodity options give the buyer, on payment of a premium, the right but not the obligation, to buy or sell a specific amount of commodity at an agreed contract price on or before a specified date.
37.1 Trading derivatives
Most of the Group’s derivatives relate to sales and trading activities. Sales activities include the structuring and marketing of derivatives to customers to enable them to take, transfer, modify or reduce current or expected risks. Trading activities are entered into principally for dealer’s margin or for the purpose of generating a profit from short-term fluctuations in price.
Trading includes mainly market-making and warehousing to facilitate customer orders. Market-making involves quoting bid and offer prices to other market participants with the intention of generating revenues based on spread and volume. Warehousing involves holding on to positions in order to liquidate in an orderly fashion with timing of unwinding determined by market conditions and traders’ views of markets as they evolve.
37.2 Hedging derivatives
The accounting treatment of the hedge derivative transactions varies according to the nature of the hedge and whether the hedge meets the specified criteria to qualify for hedge accounting. Derivatives transacted as economic hedges but do not qualify for hedge accounting are treated in the same way as derivative instruments held for trading purposes.
Fair value hedgesThe Group’s fair value hedges consist principally of interest rate swaps used for managing interest rate gaps. For the year ended 31 December 2016, the gain on hedging instruments was $72 million (2015: $12 million). The total loss on hedged items attributable to the hedged risk amounted to $76 million (2015: $12 million).
Cash flow hedgesThe Group’s cash flow hedges consist principally of currency forwards and currency swaps transacted to hedge highly probable forecast transactions expected to occur at various future dates against variability in exchange rates. The currency forwards and currency swaps have maturity dates that coincide within the expected occurrence of these transactions. The forecast transactions are expected to occur within ten years from the balance sheet date, and are expected to affect income statement in the same period these cash flows occur.
The ineffectiveness arising from these hedges was insignificant.
Net investment hedgesThe Group hedges part of the currency translation risk of investments through financial derivatives and borrowings. The ineffectiveness arising from hedging of investments was insignificant. The Group regularly reviews its hedging strategy and rebalance based on long-term outlook of the currency fundamentals.
The Group Financial Net instruments Remaining investments which hedge unhedged in foreign the net currencyIn $ millions operations(a) investments exposures
2016Hong Kong dollar 10,422 9,326 1,096US dollar 866 865 1Others 6,960 1,951 5,009
Total 18,248 12,142 6,106
2015Hong Kong dollar 8,398 8,392 6US dollar 934 943 (9)Others 6,391 2,211 4,180
Total 15,723 11,546 4,177
(a) Refers to net tangible assets of subsidiaries, associates and overseas operations
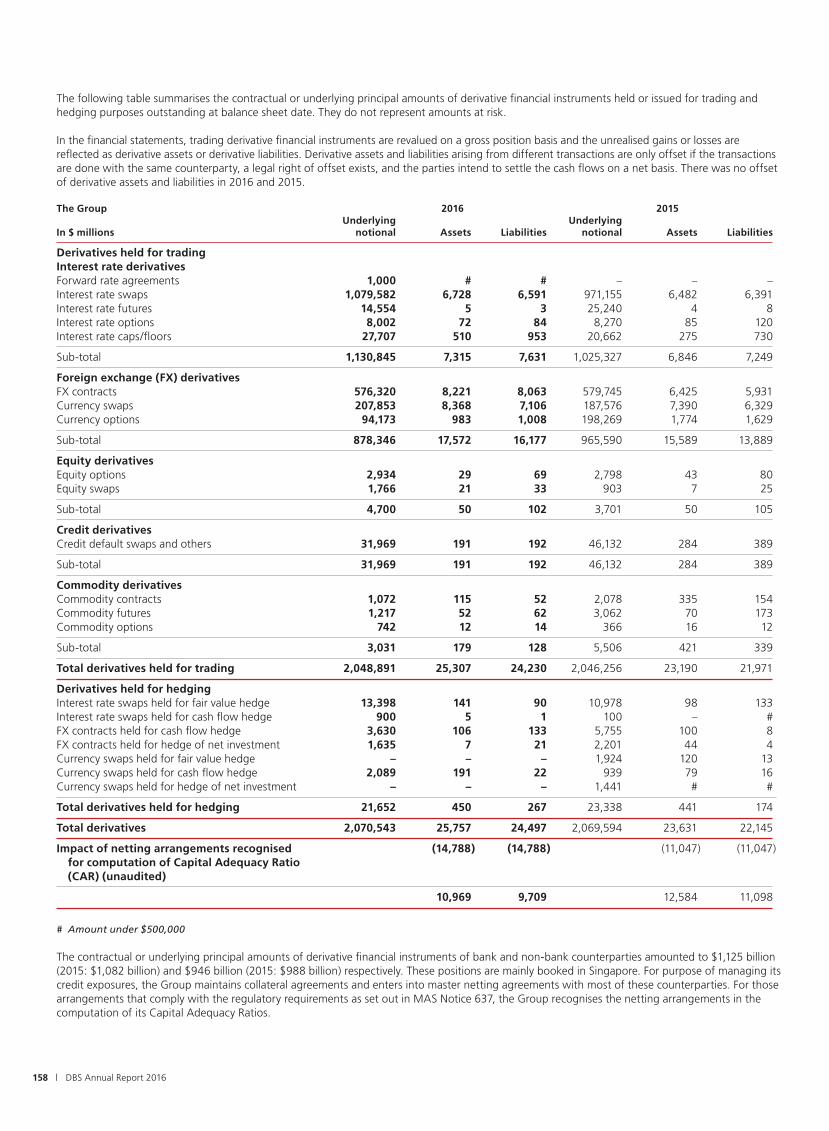
158 | DBS Annual Report 2016
The following table summarises the contractual or underlying principal amounts of derivative financial instruments held or issued for trading and hedging purposes outstanding at balance sheet date. They do not represent amounts at risk.
In the financial statements, trading derivative financial instruments are revalued on a gross position basis and the unrealised gains or losses are reflected as derivative assets or derivative liabilities. Derivative assets and liabilities arising from different transactions are only offset if the transactions are done with the same counterparty, a legal right of offset exists, and the parties intend to settle the cash flows on a net basis. There was no offset of derivative assets and liabilities in 2016 and 2015.
The Group 2016 2015 Underlying UnderlyingIn $ millions notional Assets Liabilities notional Assets Liabilities
Derivatives held for tradingInterest rate derivativesForward rate agreements 1,000 # # – – –Interest rate swaps 1,079,582 6,728 6,591 971,155 6,482 6,391Interest rate futures 14,554 5 3 25,240 4 8Interest rate options 8,002 72 84 8,270 85 120Interest rate caps/floors 27,707 510 953 20,662 275 730
Sub-total 1,130,845 7,315 7,631 1,025,327 6,846 7,249
Foreign exchange (FX) derivativesFX contracts 576,320 8,221 8,063 579,745 6,425 5,931Currency swaps 207,853 8,368 7,106 187,576 7,390 6,329Currency options 94,173 983 1,008 198,269 1,774 1,629
Sub-total 878,346 17,572 16,177 965,590 15,589 13,889
Equity derivativesEquity options 2,934 29 69 2,798 43 80Equity swaps 1,766 21 33 903 7 25
Sub-total 4,700 50 102 3,701 50 105
Credit derivativesCredit default swaps and others 31,969 191 192 46,132 284 389
Sub-total 31,969 191 192 46,132 284 389
Commodity derivativesCommodity contracts 1,072 115 52 2,078 335 154Commodity futures 1,217 52 62 3,062 70 173Commodity options 742 12 14 366 16 12
Sub-total 3,031 179 128 5,506 421 339
Total derivatives held for trading 2,048,891 25,307 24,230 2,046,256 23,190 21,971
Derivatives held for hedgingInterest rate swaps held for fair value hedge 13,398 141 90 10,978 98 133Interest rate swaps held for cash flow hedge 900 5 1 100 – #FX contracts held for cash flow hedge 3,630 106 133 5,755 100 8FX contracts held for hedge of net investment 1,635 7 21 2,201 44 4Currency swaps held for fair value hedge – – – 1,924 120 13Currency swaps held for cash flow hedge 2,089 191 22 939 79 16Currency swaps held for hedge of net investment – – – 1,441 # #
Total derivatives held for hedging 21,652 450 267 23,338 441 174
Total derivatives 2,070,543 25,757 24,497 2,069,594 23,631 22,145
Impact of netting arrangements recognised (14,788) (14,788) (11,047) (11,047) for computation of Capital Adequacy Ratio (CAR) (unaudited)
10,969 9,709 12,584 11,098
# Amount under $500,000
The contractual or underlying principal amounts of derivative financial instruments of bank and non-bank counterparties amounted to $1,125 billion (2015: $1,082 billion) and $946 billion (2015: $988 billion) respectively. These positions are mainly booked in Singapore. For purpose of managing its credit exposures, the Group maintains collateral agreements and enters into master netting agreements with most of these counterparties. For those arrangements that comply with the regulatory requirements as set out in MAS Notice 637, the Group recognises the netting arrangements in the computation of its Capital Adequacy Ratios.

| 159Financial statements
38 Share-based Compensation Plans
As part of the Group’s remuneration policy, the Group provides various share-based compensation plans to foster a culture that aligns employees’ interests with shareholders, enable employees to share in the bank’s performance and enhance talent retention.
Main Scheme/Plan Note
DBSH Share Plan (Share Plan)• The Share Plan is granted to Group executives as determined by the Committee appointed to administer 38.1
the Share Plan from time to time.• Participants are awarded shares of the Company or, at the Committee’s discretion, their equivalent
cash value or a combination. • Awards consist of main award and retention award (20% of main award). Dividends on unvested shares
do not accrue to employees.• The vesting of main award is staggered between 2 to 4 years after grant i.e. 33% will vest 2 years after grant;
another 33% will vest on the third year and the remaining 34% plus the retention award will vest 4 years after grant.• The market price of shares on the grant date is used to estimate the fair value of the shares awarded.• Vested and unvested shares are subject to clawback/malus. Conditions that trigger such clawback/malus
are in the Corporate Governance section of the Annual Report.• Shares are awarded to non-executive directors as part of director’s remuneration. Details of these awards
are disclosed in the Corporate Governance section of the Annual Report. DBSH Employee Share Plan (ESP) • The ESP caters to employees not eligible to participate in the above listed Share Plan. Eligible employees 38.1
are awarded ordinary shares of the Company, their equivalent cash value or a combination of both (at the discretion of the Committee), when time-based conditions are met.
• The awards structure and vesting conditions are similar to Share Plan.• There are no additional retention awards for shares granted to top performers and key employees.• However, in specific cases where the award forms part of an employee’s annual performance remuneration,
the retention award which constitutes 20% of the shares given in the main award will be granted. The shares in the retention award will vest 4 years after the date of grant. For such cases, vested and unvested shares are subject to clawback/malus. Conditions that trigger such clawback/malus are in the Corporate Governance section of the Annual Report.
DBSH Share Ownership Scheme • All Singapore-based employees with at least one year of service who hold the rank of Assistant Vice President 38.2
and below are eligible.• Participants contribute up to 10% of monthly salary and the Group will match up to 5% of monthly base salary
to buy units of the DBSH’s ordinary shares. DBSH Share Option Plan (Option Plan) • The Option Plan expired on 19 June 2009. Any outstanding unexercised options as of 1 March 2015 had lapsed 38.3
following the expiry of all options granted under the plan.
38.1 DBSH Share Plan and DBSH Employee Share Plan
The following table sets out the movements of the awards during the year. The Group 2016 2015Number of shares Share Plan ESP Share Plan ESP
Balance at 1 January 17,368,488 1,998,781 17,216,431 1,777,193Granted 8,251,608 1,067,078 5,718,522 889,166Vested (5,507,188) (551,646) (5,154,074) (471,393)Forfeited (449,630) (226,799) (412,391) (196,185)
Balance at 31 December 19,663,278 2,287,414 17,368,488 1,998,781
Weighted average fair value of the shares granted during the year $13.72 $13.69 $19.50 $19.51

160 | DBS Annual Report 2016
38.2 DBSH Share Ownership Scheme
The outstanding shares held under DBSH Share Ownership Scheme are as follows:
The Group Ordinary shares Market value Number (in $ millions) 2016 2015 2016 2015
Balance at 1 January 7,282,740 6,593,283 122 136Balance at 31 December 8,388,820 7,282,740 145 122
38.3 DBSH Share Option Plan
The following table sets out movements of the unissued ordinary shares of DBSH under outstanding options.
The Group Unissued number of ordinary shares under outstanding Weighted average options exercise price ($) 2016 2015 2016 2015
Balance at 1 January – 354,877 – 12.81Movements during the year: – Exercised – (350,623) – 12.81– Forfeited/Expired – (4,254) – 12.81
Balance at 31 December – – – –
In 2015, 350,623 options were exercised at their contractual exercise prices and the corresponding weighted average market price of the DBSH’s shares was $19.63.
39 Related Party Transactions
39.1 Transactions between the Company and its subsidiaries, including consolidated structured entities, which are related parties of the Company, have been eliminated on consolidation and are not disclosed in this Note.
39.2 During the financial year, the Group had banking transactions with related parties, consisting of associates and key management personnel of the Group. These included the taking of deposits and extension of credit card and other loan facilities. These transactions were made in the ordinary course of business and carried out at arms-length commercial terms, and were not material.
In addition, key management personnel received remuneration for services rendered during the financial year. Non-cash benefits including performance shares were also granted.
39.3 Total compensation and fees to key management personnel(a) are as follows:
The GroupIn $ millions 2016 2015
Short-term benefits(b) 40 46Share-based payments(c) 30 26
Total 70 72
Of which: Company Directors’ remuneration and fees 14 15
(a) Includes Company Directors and members of the Management Committee who have authority and responsibility in planning the activities and direction of the Group. The composition and number of Directors and Management Committee members may differ from year to year
(b) Includes cash bonus based on amount accrued during the year, to be paid in the following year
(c) Share-based payments are expensed over the vesting period in accordance with FRS 102

| 161Financial statements
40 Fair Value of Financial Instruments
40.1 Valuation Process
The valuation processes within the Group are governed by the Valuation Policy and supporting Standards, which are approved by the Board Risk Management Committee and the Group Market and Liquidity Risk Committee respectively. The policy and standards apply to financial assets and liabilities where mark-to-market or model valuation is required. The Valuation Policy and supporting Standards govern the revaluation of all financial assets and liabilities that are measured at fair value, covering both market prices as well as model inputs. Financial assets and liabilities are marked directly using reliable and independent market prices or by using reliable and independent market parameters (as model inputs) in conjunction with a valuation model. Products with a liquid market or those traded via an exchange will fall under the former while most over-the-counter (OTC) products will form the latter. Market parameters include interest rate yield curves, credit spreads, exchange prices, dividend yields, option volatilities and foreign exchange rates.
Valuation models go through an assurance process carried out by the Risk Management Group (RMG), independent of the model developers. This assurance process covers the review of the underlying methodology including its logic and conceptual soundness together with the model inputs and outputs. Model assurances are conducted prior to implementation and subject to regular review or when there are significant changes arising from market or portfolio changes. Where necessary, the Group also imposes model reserves and other adjustments in determining fair value. Models are approved by the Group Market and Liquidity Risk Committee.
The majority of OTC derivatives are traded in active markets. Valuations are determined using generally accepted models (for example discounted cash flows, Black-Scholes model, interpolation techniques) based on quoted market prices for similar instruments or underlyings or market parameters.
A process of independent price verification (IPV) is in place to establish the accuracy of the market parameters used when the marking is performed by the Front Office. The IPV process entails independent checks to compare traders’ marks to independent sources such as broker/dealer sources or market consensus providers. The results of the IPV are reviewed by independent control functions on a monthly basis.
For illiquid financial instruments where mark-to-market is not possible, the Group will value these products using an approved valuation model. Prices and parameters used as inputs to the model or to any intermediate technique involving a transformation process must be derived using approved market sources. Where possible, the inputs must be checked against multiple sources for reliability and accuracy. Reliance will be placed on the model assurance process established by RMG for assurance of valuation models as fit for purpose.
The Group uses various market accepted benchmark interest rates such as LIBOR and Swap Offer Rates to determine the fair value of the financial instruments. Where significant unobservable inputs are used in these models, the financial instruments are classified as Level 3 in the fair value hierarchy and valuation adjustments or reserves are taken to provide for any uncertainty in valuations. Valuation adjustments or reserve methodologies are also used to substantiate the significance of unobservable inputs. Such methodologies are approved by the Group Market and Liquidity Risk Committee and governed by the Valuation Policy and supporting Standards.
The main valuation adjustments and reserves are described below:
Model and Parameter Uncertainty AdjustmentsValuation uncertainties may occur during fair value measurement either due to uncertainties in the required input parameters or uncertainties in the modelling methods used in the valuation process. In such situations, adjustments may be necessary to take these factors into account.
For example, where market data such as prices or rates for an instrument are no longer observable after an extended period of time, these inputs used to value the financial instruments may no longer be relevant in the current market conditions. In such situations, adjustments may be necessary to address the pricing uncertainty arising from the use of stale market data inputs.
Credit Valuation AdjustmentsCredit valuation adjustments are taken to reflect the impact on fair value of counterparty credit risk. Credit valuation adjustments are based upon the creditworthiness of the counterparties, magnitude of the current or potential exposure on the underlying transactions, netting and collateral arrangements, and the maturity of the underlying transactions.
Funding Valuation AdjustmentsFunding valuation adjustments represent an estimate of the adjustment to fair value that a market participant would make in incorporating funding costs and benefits that arise in relation to uncollateralised derivatives positions.
Day 1 Profit or Loss (P&L) ReserveIn situations where the market for an instrument is not active and its fair value is established using a valuation model based on significant unobservable market parameters, the Day 1 P&L arising from the difference in transacted price and end-of-day model valuation is set aside as reserves. A market parameter is defined as being significant when its impact on the Day 1 P&L is greater than an internally determined threshold. The Day 1 P&L reserve is released to the income statement when the parameters become observable or when the transaction is closed out or amortised over the duration of the transaction. At year end, the unamortised Day 1 P&L was not material.
Bid-Offer AdjustmentsThe Group often holds, at varying points in time, both long or short positions in financial instruments which are valued using mid-market levels. Bid-offer adjustments are then made to account for close-out costs.
40.2 Fair Value Hierarchy
The fair value hierarchy accords the highest level to observable inputs such as unadjusted quoted prices in active markets for identical assets or liabilities and the lowest level to unobservable inputs. The fair value measurement of each financial instrument is categorised in accordance with the same level of the fair value hierarchy as the input with the lowest level that is significant to the entire measurement. If unobservable inputs are deemed significant, the financial instrument will be categorised as Level 3.
Financial instruments that are valued using quoted prices in active markets are classified as Level 1 within the fair value hierarchy. These would include government and sovereign securities, listed equities and corporate debt securities which are actively traded. Derivatives contracts which are traded in an active exchange market are also classified as Level 1 of the valuation hierarchy.
Where fair value is determined using quoted market prices in less active markets or quoted prices for similar assets and liabilities, such instruments are generally classified as Level 2. In cases where quoted prices are generally not available, the Group will determine the fair value based on valuation techniques that use market parameters as
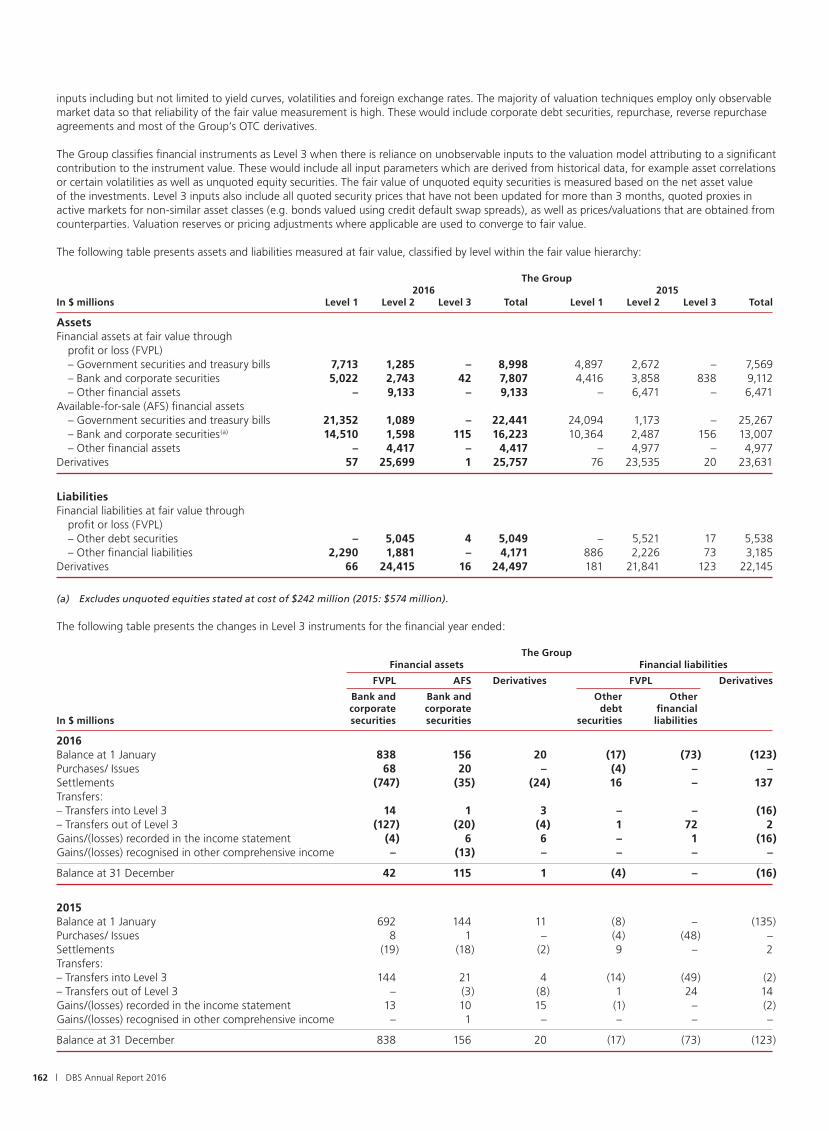
162 | DBS Annual Report 2016
inputs including but not limited to yield curves, volatilities and foreign exchange rates. The majority of valuation techniques employ only observable market data so that reliability of the fair value measurement is high. These would include corporate debt securities, repurchase, reverse repurchase agreements and most of the Group’s OTC derivatives.
The Group classifies financial instruments as Level 3 when there is reliance on unobservable inputs to the valuation model attributing to a significant contribution to the instrument value. These would include all input parameters which are derived from historical data, for example asset correlations or certain volatilities as well as unquoted equity securities. The fair value of unquoted equity securities is measured based on the net asset value of the investments. Level 3 inputs also include all quoted security prices that have not been updated for more than 3 months, quoted proxies in active markets for non-similar asset classes (e.g. bonds valued using credit default swap spreads), as well as prices/valuations that are obtained from counterparties. Valuation reserves or pricing adjustments where applicable are used to converge to fair value.
The following table presents assets and liabilities measured at fair value, classified by level within the fair value hierarchy:
The Group 2016 2015In $ millions Level 1 Level 2 Level 3 Total Level 1 Level 2 Level 3 Total
AssetsFinancial assets at fair value through profit or loss (FVPL) – Government securities and treasury bills 7,713 1,285 – 8,998 4,897 2,672 – 7,569 – Bank and corporate securities 5,022 2,743 42 7,807 4,416 3,858 838 9,112 – Other financial assets – 9,133 – 9,133 – 6,471 – 6,471Available-for-sale (AFS) financial assets – Government securities and treasury bills 21,352 1,089 – 22,441 24,094 1,173 – 25,267 – Bank and corporate securities(a) 14,510 1,598 115 16,223 10,364 2,487 156 13,007 – Other financial assets – 4,417 – 4,417 – 4,977 – 4,977Derivatives 57 25,699 1 25,757 76 23,535 20 23,631
LiabilitiesFinancial liabilities at fair value through profit or loss (FVPL) – Other debt securities – 5,045 4 5,049 – 5,521 17 5,538 – Other financial liabilities 2,290 1,881 – 4,171 886 2,226 73 3,185Derivatives 66 24,415 16 24,497 181 21,841 123 22,145
(a) Excludes unquoted equities stated at cost of $242 million (2015: $574 million).
The following table presents the changes in Level 3 instruments for the financial year ended:
The Group Financial assets Financial liabilities
FVPL AFS Derivatives FVPL Derivatives
Bank and Bank and Other Other corporate corporate debt financialIn $ millions securities securities securities liabilities
2016Balance at 1 January 838 156 20 (17) (73) (123)Purchases/ Issues 68 20 – (4) – –Settlements (747) (35) (24) 16 – 137Transfers: – Transfers into Level 3 14 1 3 – – (16)– Transfers out of Level 3 (127) (20) (4) 1 72 2Gains/(losses) recorded in the income statement (4) 6 6 – 1 (16)Gains/(losses) recognised in other comprehensive income – (13) – – – –
Balance at 31 December 42 115 1 (4) – (16)
2015 Balance at 1 January 692 144 11 (8) – (135)Purchases/ Issues 8 1 – (4) (48) –Settlements (19) (18) (2) 9 – 2Transfers: – Transfers into Level 3 144 21 4 (14) (49) (2)– Transfers out of Level 3 – (3) (8) 1 24 14Gains/(losses) recorded in the income statement 13 10 15 (1) – (2)Gains/(losses) recognised in other comprehensive income – 1 – – – –
Balance at 31 December 838 156 20 (17) (73) (123)

| 163Financial statements
Economic hedges entered into for Level 2 exposures may be classified within a different category (i.e. Level 1) and similarly, hedges entered for Level 3 exposures may also be classified within a different category (i.e. Level 1 and/or Level 2). The effects are presented gross in the table.
During the year, the Group transferred financial assets and liabilities from Level 1 to Level 2 due to reduced market activity and from Level 2 to Level 1 arising from increased market activity.
Gains and losses on Level 3 financial assets and liabilities measured at fair value
The Group Net income fromIn $ millions Net trading income investment securities Total
2016Total gain/(loss) for the period included in income statement (13) 6 (7)Of which: Change in unrealised gain/(loss) for assets and liabilities (8) – (8) held at the end of the reporting period
2015 Total gain for the period included in income statement 25 10 35Of which: Change in unrealised gain for assets and liabilities 25 – 25 held at the end of the reporting period
Fair value gains or losses taken to other comprehensive income are reported in the Statement of Comprehensive Income as “Net valuation taken to equity”.
Effect of changes in significant unobservable inputs to reflect reasonably possible alternatives
As at 31 December 2016, financial instruments measured with valuation techniques using significant unobservable inputs (Level 3) included equity investments, bank and corporate debt securities, interest rate and credit derivatives and financial liabilities from structured product issuances.
There are limited inter-relationships between unobservable inputs as the financial instruments are usually categorised as Level 3 because of a single unobservable input.
In estimating significance, the Group performed sensitivity analysis based on methodologies applied for fair value adjustments. These adjustments reflect the values which the Group estimates to be appropriate to reflect uncertainties in the inputs used (e.g. based on stress testing methodologies on the unobservable input). The methodologies used can be statistical or based on other relevant approved techniques.
The movement in fair value arising from reasonably possible changes to the significant unobservable inputs is assessed as not significant.
The GroupIn $ millions 2016 2015 Classification Valuation technique Unobservable input
AssetsBank and corporate debt securities 42 815 FVPL Discounted cash flows Credit spreads
Bank and corporate debt securities 20 46 AFS Discounted cash flows Credit spreads
Equity securities – 23 FVPL Equity pricing model Prices
Equity securities (Unquoted) 95 110 AFS Net asset value Net asset value of securities
Derivatives 1 20 FVPL Discounted cash flows/ Credit spreads/ CDS models/Option & Correlations/ interest rate pricing model Volatility
Total 158 1,014
LiabilitiesOther debt securities 4 17 FVPL Discounted cash flows/ Credit spreads/ Option pricing model Correlations
Other financial liabilities – 73 FVPL CDS models/Option & Credit spreads/ interest rate pricing model Correlations
Derivatives 16 123 FVPL Discounted cash flows/ Credit spreads/ CDS models/Option & Correlations/ interest rate pricing model Volatility
Total 20 213
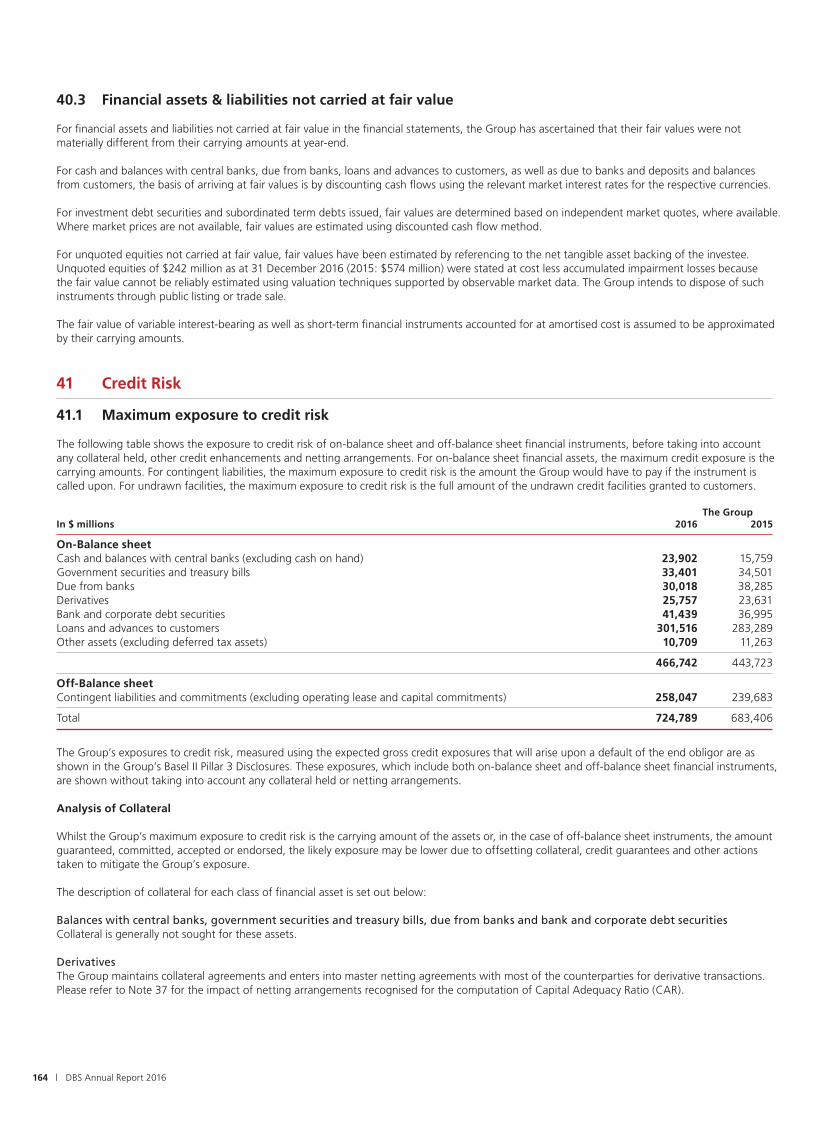
164 | DBS Annual Report 2016
40.3 Financial assets & liabilities not carried at fair value
For financial assets and liabilities not carried at fair value in the financial statements, the Group has ascertained that their fair values were not materially different from their carrying amounts at year-end.
For cash and balances with central banks, due from banks, loans and advances to customers, as well as due to banks and deposits and balances from customers, the basis of arriving at fair values is by discounting cash flows using the relevant market interest rates for the respective currencies.
For investment debt securities and subordinated term debts issued, fair values are determined based on independent market quotes, where available. Where market prices are not available, fair values are estimated using discounted cash flow method.
For unquoted equities not carried at fair value, fair values have been estimated by referencing to the net tangible asset backing of the investee. Unquoted equities of $242 million as at 31 December 2016 (2015: $574 million) were stated at cost less accumulated impairment losses because the fair value cannot be reliably estimated using valuation techniques supported by observable market data. The Group intends to dispose of such instruments through public listing or trade sale.
The fair value of variable interest-bearing as well as short-term financial instruments accounted for at amortised cost is assumed to be approximated by their carrying amounts.
41 Credit Risk
41.1 Maximum exposure to credit risk
The following table shows the exposure to credit risk of on-balance sheet and off-balance sheet financial instruments, before taking into account any collateral held, other credit enhancements and netting arrangements. For on-balance sheet financial assets, the maximum credit exposure is the carrying amounts. For contingent liabilities, the maximum exposure to credit risk is the amount the Group would have to pay if the instrument is called upon. For undrawn facilities, the maximum exposure to credit risk is the full amount of the undrawn credit facilities granted to customers.
The GroupIn $ millions 2016 2015
On-Balance sheetCash and balances with central banks (excluding cash on hand) 23,902 15,759Government securities and treasury bills 33,401 34,501Due from banks 30,018 38,285Derivatives 25,757 23,631Bank and corporate debt securities 41,439 36,995Loans and advances to customers 301,516 283,289Other assets (excluding deferred tax assets) 10,709 11,263
466,742 443,723
Off-Balance sheetContingent liabilities and commitments (excluding operating lease and capital commitments) 258,047 239,683
Total 724,789 683,406
The Group’s exposures to credit risk, measured using the expected gross credit exposures that will arise upon a default of the end obligor are as shown in the Group’s Basel II Pillar 3 Disclosures. These exposures, which include both on-balance sheet and off-balance sheet financial instruments, are shown without taking into account any collateral held or netting arrangements.
Analysis of Collateral
Whilst the Group’s maximum exposure to credit risk is the carrying amount of the assets or, in the case of off-balance sheet instruments, the amount guaranteed, committed, accepted or endorsed, the likely exposure may be lower due to offsetting collateral, credit guarantees and other actions taken to mitigate the Group’s exposure.
The description of collateral for each class of financial asset is set out below:
Balances with central banks, government securities and treasury bills, due from banks and bank and corporate debt securitiesCollateral is generally not sought for these assets.
DerivativesThe Group maintains collateral agreements and enters into master netting agreements with most of the counterparties for derivative transactions. Please refer to Note 37 for the impact of netting arrangements recognised for the computation of Capital Adequacy Ratio (CAR).

| 165Financial statements
Loans and advances to customers, contingent liabilities and commitmentsCertain loans and advances to customers, contingent liabilities and commitments are typically collateralised to a substantial extent. In particular, residential mortgage exposures are generally fully secured by residential properties. Income-producing real estate, which is a sub-set of the Specialised Lending exposure, is fully secured by the underlying assets financed.
The extent to which credit exposures are covered by Basel II-eligible collateral, besides real estate, after the application of the requisite regulatory hair-cuts, is shown in the Group’s Basel II Pillar 3 Disclosures. The amounts are a sub-set of the actual collateral arrangements entered by the Group as Basel II imposes strict legal and operational standards before collateral can be admitted as credit risk mitigants. As a result, certain collateral arrangements which do not meet its criteria will not be included. Certain collateral types which are not permitted as credit risk mitigants for credit exposures under the Standardised Approach are also excluded.
41.2 Loans and advances to customers
The GroupIn $ millions 2016 2015
Loans and advances to customers Performing Loans – Neither past due nor impaired (i) 299,602 282,946 – Past due but not impaired (ii) 1,397 1,313 Non-Performing Loans – Impaired (iii) 4,416 2,612
Total gross loans (Note 18) 305,415 286,871
(i) Neither past due nor impaired loans by grading and industry
The credit quality of the portfolio of loans and advances that are neither past due nor impaired can be assessed by reference to the loan gradings in MAS Notice 612:
The GroupIn $ millions Pass Special Mention Total
2016Manufacturing 29,184 1,053 30,237Building and construction 57,416 514 57,930Housing loans 63,859 3 63,862General commerce 44,873 1,005 45,878Transportation, storage and communications 28,815 1,585 30,400Financial institutions, investment and holding companies 16,535 71 16,606Professionals and private individuals (excluding housing loans) 24,387 37 24,424Others 29,941 324 30,265
Total 295,010 4,592 299,602
2015Manufacturing 29,409 791 30,200Building and construction 54,646 530 55,176Housing loans 58,023 – 58,023General commerce 46,459 891 47,350Transportation, storage and communications 25,541 451 25,992Financial institutions, investment and holding companies 13,602 18 13,620Professionals and private individuals (excluding housing loans) 23,492 13 23,505Others 28,740 340 29,080
Total 279,912 3,034 282,946

166 | DBS Annual Report 2016
(ii) Past due but not impaired loans by past due period and industry
The Group Less than 30 30 to 59 days 60 to 90 days In $ millions days past due past due past due Total
2016Manufacturing 87 3 4 94Building and construction 45 1 1 47Housing loans 370 76 23 469General commerce 108 10 5 123Transportation, storage and communications 104 24 9 137Financial institutions, investment and holding companies 53 – – 53Professionals and private individuals (excluding housing loans) 298 65 24 387Others 82 4 1 87
Total 1,147 183 67 1,397
2015Manufacturing 55 18 41 114Building and construction 63 4 7 74Housing loans 346 55 23 424General commerce 158 16 20 194Transportation, storage and communications 52 4 2 58Financial institutions, investment and holding companies 5 – – 5Professionals and private individuals (excluding housing loans) 328 59 10 397Others 30 5 12 47
Total 1,037 161 115 1,313
(iii) Non-performing assets (NPAs)
The GroupIn $ millions 2016 2015
Balance at 1 January 2,792 2,513New NPAs 3,556 1,398Upgrades, recoveries and translations (571) (293)Write-offs (921) (826)
Balance at 31 December 4,856 2,792

| 167Financial statements
Non-performing assets by grading and industry
The Group NPAs Specific allowances Sub- Sub-In $ millions standard Doubtful Loss Total standard Doubtful Loss Total
2016Manufacturing 661 142 101 904 73 124 101 298Building and construction 263 111 7 381 29 100 7 136Housing loans 121 8 5 134 – 3 5 8General commerce 523 310 47 880 48 176 47 271Transportation, storage and communications 1,147 44 236 1,427 37 43 236 316Financial institutions, investment 62 21 – 83 11 4 – 15 and holding companiesProfessional and private individuals 254 18 8 280 46 17 8 71 (excluding housing loans)Others 238 29 60 327 71 24 60 155
Total non-performing loans 3,269 683 464 4,416 315 491 464 1,270Debt securities, contingent liabilities and others 170 109 161 440 23 87 161 271
Total 3,439 792 625 4,856 338 578 625 1,541
Of which: restructured assets 467 139 7 613 91 93 7 191
2015Manufacturing 367 121 72 560 53 99 72 224Building and construction 219 87 28 334 19 73 28 120Housing loans 112 5 5 122 – 2 5 7General commerce 497 165 43 705 14 100 43 157Transportation, storage and communications 223 25 59 307 10 25 59 94Financial institutions, investment 36 50 14 100 10 36 14 60 and holding companiesProfessional and private individuals 176 19 8 203 34 16 8 58 (excluding housing loans)Others 206 52 23 281 40 38 23 101
Total non-performing loans 1,836 524 252 2,612 180 389 252 821Debt securities, contingent liabilities and others 88 70 22 180 26 46 22 94
Total 1,924 594 274 2,792 206 435 274 915
Of which: restructured assets 236 142 8 386 30 82 8 120

168 | DBS Annual Report 2016
Non-performing assets by geography(a)
The Group SpecificIn $ millions NPAs allowances
2016Singapore 1,725 383Hong Kong 687 187Rest of Greater China 432 136South and Southeast Asia 1,188 425Rest of the World 384 139
Total non-performing loans 4,416 1,270Debt securities, contingent liabilities and others 440 271
Total 4,856 1,541
2015Singapore 506 115Hong Kong 433 99Rest of Greater China 387 96South and Southeast Asia 856 415Rest of the World 430 96
Total non-performing loans 2,612 821Debt securities, contingent liabilities and others 180 94
Total 2,792 915
(a) Based on the country of incorporation of the borrower
Non-performing assets by past due period
The GroupIn $ millions 2016 2015
Not overdue 705 520
Less than 90 days past due 698 50891 to 180 days past due 1,215 424More than 180 days past due 2,238 1,340
Total past due assets 4,151 2,272
Total 4,856 2,792
Secured non-performing assets by collateral type
The GroupIn $ millions 2016 2015
Properties 973 670Shares and debentures 312 268Fixed deposits 11 21Others 1,318 467
Total 2,614 1,426
Past due non-performing assets by industry
The GroupIn $ millions 2016 2015
Manufacturing 822 502Building and construction 349 267Housing loans 110 95General commerce 687 604Transportation, storage and communications 1,295 183Financial institutions, investment 74 85 and holding companiesProfessional and private individuals 232 158 (excluding housing loans)Others 208 249
3,777 2,143Debt securities, contingent liabilities and others 374 129
Total 4,151 2,272
Past due non-performing assets by geography(a)
The GroupIn $ millions 2016 2015
Singapore 1,551 410Hong Kong 522 361Rest of Greater China 359 312South and Southeast Asia 1,048 771Rest of the World 297 289
3,777 2,143Debt securities, contingent liabilities and others 374 129
Total 4,151 2,272
(a) Based on the country of incorporation of the borrower
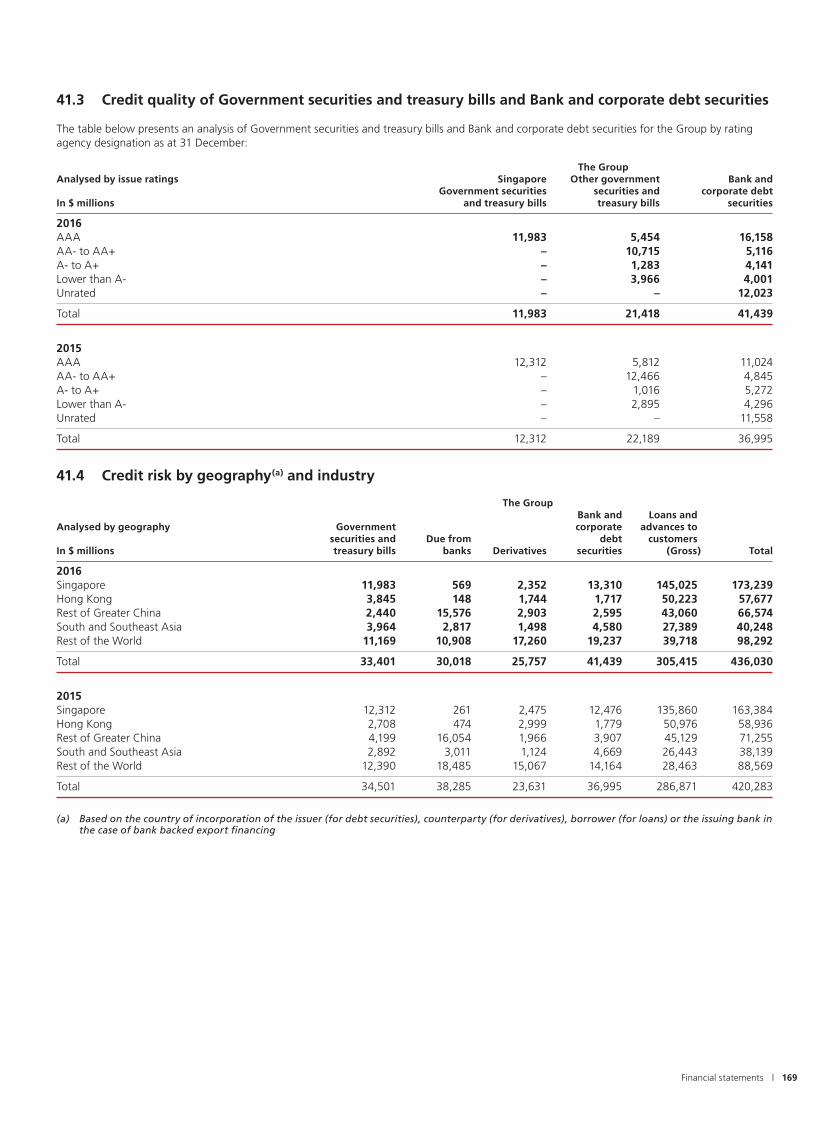
| 169Financial statements
41.3 Credit quality of Government securities and treasury bills and Bank and corporate debt securities
The table below presents an analysis of Government securities and treasury bills and Bank and corporate debt securities for the Group by rating agency designation as at 31 December:
The GroupAnalysed by issue ratings Singapore Other government Bank and Government securities securities and corporate debtIn $ millions and treasury bills treasury bills securities
2016AAA 11,983 5,454 16,158AA- to AA+ – 10,715 5,116A- to A+ – 1,283 4,141Lower than A- – 3,966 4,001Unrated – – 12,023
Total 11,983 21,418 41,439
2015 AAA 12,312 5,812 11,024AA- to AA+ – 12,466 4,845A- to A+ – 1,016 5,272Lower than A- – 2,895 4,296Unrated – – 11,558
Total 12,312 22,189 36,995
41.4 Credit risk by geography(a) and industry
The Group Bank and Loans andAnalysed by geography Government corporate advances to securities and Due from debt customersIn $ millions treasury bills banks Derivatives securities (Gross) Total
2016Singapore 11,983 569 2,352 13,310 145,025 173,239Hong Kong 3,845 148 1,744 1,717 50,223 57,677Rest of Greater China 2,440 15,576 2,903 2,595 43,060 66,574South and Southeast Asia 3,964 2,817 1,498 4,580 27,389 40,248Rest of the World 11,169 10,908 17,260 19,237 39,718 98,292
Total 33,401 30,018 25,757 41,439 305,415 436,030
2015 Singapore 12,312 261 2,475 12,476 135,860 163,384Hong Kong 2,708 474 2,999 1,779 50,976 58,936Rest of Greater China 4,199 16,054 1,966 3,907 45,129 71,255South and Southeast Asia 2,892 3,011 1,124 4,669 26,443 38,139Rest of the World 12,390 18,485 15,067 14,164 28,463 88,569
Total 34,501 38,285 23,631 36,995 286,871 420,283
(a) Based on the country of incorporation of the issuer (for debt securities), counterparty (for derivatives), borrower (for loans) or the issuing bank in the case of bank backed export financing

170 | DBS Annual Report 2016
The Group Bank and Loans andAnalysed by industry Government corporate advances to securities and Due from debt customersIn $ millions treasury bills banks Derivatives securities (Gross) Total
2016Manufacturing – – 457 2,632 31,235 34,324Building and construction – – 414 3,215 58,358 61,987Housing loans – – – – 64,465 64,465General commerce – – 460 1,063 46,881 48,404Transportation, storage and communications – – 669 2,509 31,964 35,142Financial institutions, investment and – 30,018 22,716 19,291 16,742 88,767 holding companiesGovernment 33,401 – – – – 33,401Professionals and private individuals – – 740 – 25,091 25,831 (excluding housing loans)Others – – 301 12,729 30,679 43,709
Total 33,401 30,018 25,757 41,439 305,415 436,030
2015Manufacturing – – 1,038 2,849 30,874 34,761Building and construction – – 330 2,976 55,584 58,890Housing loans – – – – 58,569 58,569General commerce – – 920 980 48,249 50,149Transportation, storage and communications – – 801 2,192 26,357 29,350 Financial institutions, investment and – 38,285 19,406 15,547 13,725 86,963 holding companiesGovernment 34,501 – – – – 34,501Professionals and private individuals – – 606 – 24,105 24,711 (excluding housing loans)Others – – 530 12,451 29,408 42,389
Total 34,501 38,285 23,631 36,995 286,871 420,283

| 171Financial statements
42 Liquidity Risk
42.1 Contractual maturity profile of assets and liabilities
The table below analyses assets and liabilities of the Group as at 31 December based on the remaining period as at balance sheet date to the contractual maturity date:
The Group Less 1 week More No than 7 to 1 1 to 3 3 to 12 1 to 3 3 to 5 than 5 specificIn $ millions days month months months years years years maturity Total
2016Cash and balances with central banks 15,674 6,853 2,394 1,300 619 – – – 26,840Government securities and treasury bills 470 1,475 3,178 7,524 6,874 4,452 9,428 – 33,401Due from banks 11,476 2,971 4,197 10,078 1,082 214 – – 30,018Derivatives(a) 25,757 – – – – – – – 25,757Bank and corporate securities 23 1,196 919 4,183 14,889 12,213 8,016 3,978 45,417Loans and advances to customers 27,832 39,568 28,797 44,478 54,008 39,447 67,386 – 301,516Other assets 5,543 917 1,316 2,324 143 24 32 743 11,042Associates – – – – – – – 890 890Properties and other fixed assets – – – – – – – 1,572 1,572Goodwill and intangibles – – – – – – – 5,117 5,117
Total assets 86,775 52,980 40,801 69,887 77,615 56,350 84,862 12,300 481,570
Due to banks 10,660 2,877 1,094 926 179 179 – – 15,915Deposits and balances from customers 239,622 43,131 34,511 26,475 3,127 187 393 – 347,446Derivatives(a) 24,497 – – – – – – – 24,497Other liabilities 6,500 1,095 2,095 3,231 37 7 128 2,802 15,895Other debt securities 1,074 3,516 8,891 4,058 5,972 2,168 2,066 – 27,745Subordinated term debts – – 866 – – – 2,236 – 3,102
Total liabilities 282,353 50,619 47,457 34,690 9,315 2,541 4,823 2,802 434,600
Non-controlling interests – – – – – – – 2,361 2,361Shareholders’ funds – – – – – – – 44,609 44,609
Total equity – – – – – – – 46,970 46,970

172 | DBS Annual Report 2016
The Group Less 1 week More No than 7 to 1 1 to 3 3 to 12 1 to 3 3 to 5 than 5 specificIn $ millions days month months months years years years maturity Total
2015Cash and balances with central banks 14,209 1,064 595 1,935 1,026 – – – 18,829Government securities and treasury bills 544 334 2,328 4,535 12,089 4,338 10,333 – 34,501Due from banks 19,276 3,020 5,799 9,511 381 298 – – 38,285Derivatives(a) 23,631 – – – – – – – 23,631Bank and corporate securities 117 241 988 5,148 13,384 9,083 8,034 3,078 40,073Loans and advances to customers 24,711 36,063 28,343 45,259 51,893 34,646 62,374 – 283,289Other assets 5,874 949 1,435 1,421 1,211 14 12 646 11,562Associates – – – – – – – 1,000 1,000Properties and other fixed assets – – – – – – – 1,547 1,547Goodwill and intangibles – – – – – – – 5,117 5,117
Total assets 88,362 41,671 39,488 67,809 79,984 48,379 80,753 11,388 457,834
Due to banks 13,575 2,634 1,835 98 36 73 – – 18,251Deposits and balances from customers 218,063 42,716 34,018 23,237 1,278 170 652 – 320,134Derivatives(a) 22,145 – – – – – – – 22,145Other liabilities 4,226 1,189 1,670 2,037 931 16 19 2,316 12,404Other debt securities 1,765 6,622 13,278 5,174 5,195 4,022 2,022 – 38,078Subordinated term debts – 613 – – – – 3,413 – 4,026
Total liabilities 259,774 53,774 50,801 30,546 7,440 4,281 6,106 2,316 415,038
Non-controlling interests – – – – – – – 2,422 2,422Shareholders’ funds – – – – – – – 40,374 40,374
Total equity – – – – – – – 42,796 42,796
(a) Derivative financial assets and liabilities are included in the “Less than 7 days” bucket as they are mainly held for trading. Refer to the table in Note 42.2 on cash flows associated with these derivatives
The above table includes disclosure of the contractual maturity of financial liabilities, which approximates the same analysis on an undiscounted basis as total future interest payments are not material relative to the principal amounts. Assets and liabilities (including non-maturing savings/current deposits) are represented on a contractual basis or in a period when it can legally be withdrawn. On a behavioural basis for liquidity risk analysis, the assets and liabilities cash flows may differ from the contractual basis.
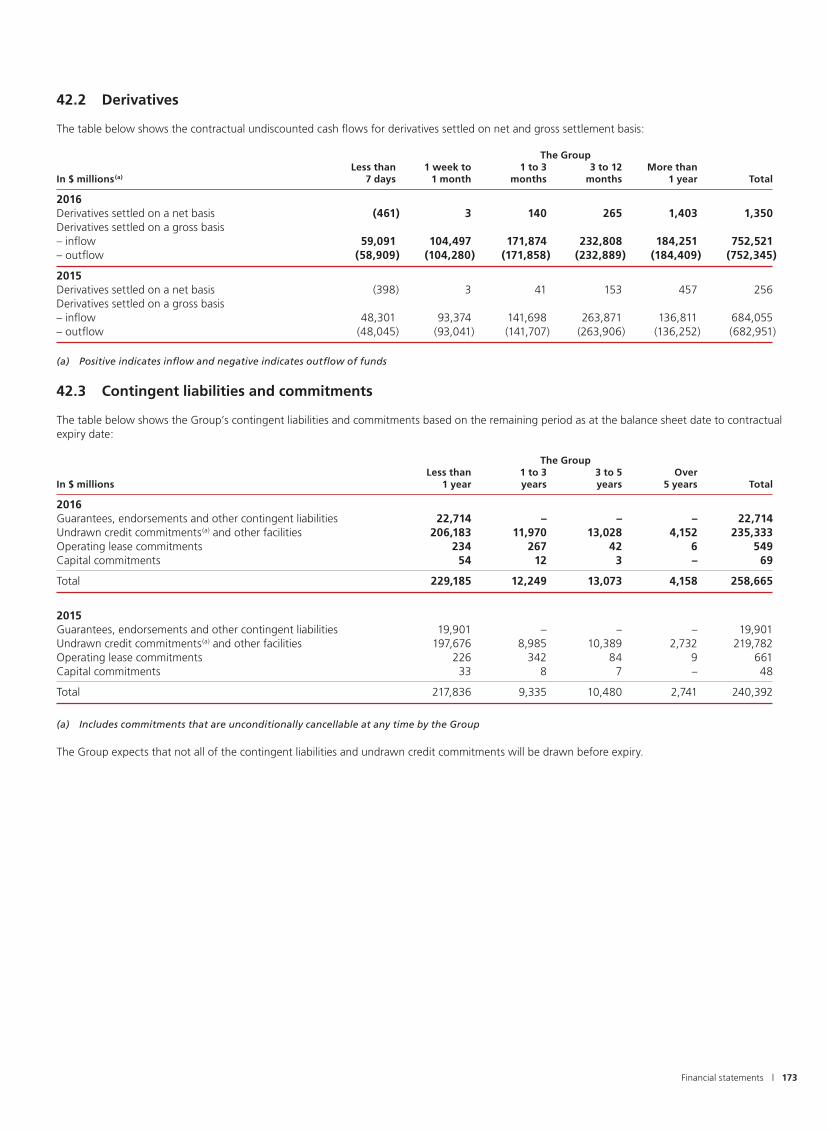
| 173Financial statements
42.2 Derivatives
The table below shows the contractual undiscounted cash flows for derivatives settled on net and gross settlement basis:
The Group Less than 1 week to 1 to 3 3 to 12 More thanIn $ millions(a) 7 days 1 month months months 1 year Total
2016Derivatives settled on a net basis (461) 3 140 265 1,403 1,350Derivatives settled on a gross basis– inflow 59,091 104,497 171,874 232,808 184,251 752,521– outflow (58,909) (104,280) (171,858) (232,889) (184,409) (752,345)
2015Derivatives settled on a net basis (398) 3 41 153 457 256Derivatives settled on a gross basis– inflow 48,301 93,374 141,698 263,871 136,811 684,055– outflow (48,045) (93,041) (141,707) (263,906) (136,252) (682,951)
(a) Positive indicates inflow and negative indicates outflow of funds
42.3 Contingent liabilities and commitments
The table below shows the Group’s contingent liabilities and commitments based on the remaining period as at the balance sheet date to contractual expiry date:
The Group Less than 1 to 3 3 to 5 OverIn $ millions 1 year years years 5 years Total
2016Guarantees, endorsements and other contingent liabilities 22,714 – – – 22,714Undrawn credit commitments(a) and other facilities 206,183 11,970 13,028 4,152 235,333Operating lease commitments 234 267 42 6 549Capital commitments 54 12 3 – 69
Total 229,185 12,249 13,073 4,158 258,665
2015Guarantees, endorsements and other contingent liabilities 19,901 – – – 19,901Undrawn credit commitments(a) and other facilities 197,676 8,985 10,389 2,732 219,782Operating lease commitments 226 342 84 9 661Capital commitments 33 8 7 – 48
Total 217,836 9,335 10,480 2,741 240,392
(a) Includes commitments that are unconditionally cancellable at any time by the Group
The Group expects that not all of the contingent liabilities and undrawn credit commitments will be drawn before expiry.

174 | DBS Annual Report 2016
43 Capital Management
The Board is responsible for setting the Group’s capital management objective, which is to maintain a strong capital position consistent with regulatory requirements under MAS Notice 637 and the expectations of various stakeholders, e.g. customers, investors and rating agencies. The Board articulates this objective in the form of capital targets. This objective is pursued while delivering returns to shareholders and ensuring that adequate capital resources are available for business growth and investment opportunities as well as adverse situations, taking into consideration our strategic plans and risk appetite.
The Group’s capital management objective is implemented via a capital management and planning process that is overseen by the Capital Committee. The Chief Financial Officer chairs the Capital Committee. The Capital Committee receives regular updates on the Group’s current and projected capital position. A key tool for capital planning is the annual Internal Capital Adequacy Assessment Process (ICAAP) through which the Group assesses its forecast capital supply and demand relative to regulatory requirements and internal capital targets. The ICAAP has a three-year horizon and covers various scenarios, including stress scenarios of differing scope and severity.
The Group is subject to and has compiled with the capital adequacy requirements set out in the MAS Notice 637, which effects the Basel Committee on Banking Supervision’s capital adequacy framework in Singapore throughout the year. The Group’s capital adequacy ratios as at 31 December 2016 have been subject to an external limited assurance review, pursuant to the MAS Notice 609 “Auditor’s Report and Additional Information to be submitted with Annual Accounts”.
44 Segment Reporting
44.1 Business segment reporting
The Group’s various business segments are described below:
Consumer Banking/Wealth ManagementConsumer Banking/Wealth Management provides individual customers with a diverse range of banking and related financial services. The products and services available to customers include current and savings accounts, fixed deposits, loans and home finance, cards, payments, investment and insurance products.
Institutional Banking Institutional Banking provides financial services and products to institutional clients including bank and non-bank financial institutions, government-linked companies, large corporates and small and medium-sized businesses. The business focuses on broadening and deepening customer relationships. Products and services comprise the full range of credit facilities from short-term working capital financing to specialised lending. It also provides global transactional services such as cash management, trade finance and securities and fiduciary services; treasury and markets products; corporate finance and advisory banking as well as capital markets solutions.
Treasury Treasury provides treasury services to corporations, institutional and private investors, financial institutions and other market participants. It is primarily involved in sales, structuring, market-making and trading across a broad range of financial products including foreign exchange, interest rate, debt, credit, equity and other structured derivatives. Income from these financial products and services offered to the customers of Consumer Banking/Wealth Management and Institutional Banking, is reflected in the respective segments. Treasury is also responsible for managing surplus funds.
OthersOthers encompass a range of activities from corporate decisions and include income and expenses not attributed to other business segments, including capital and balance sheet management, funding and liquidity. DBS Vickers Securities and Islamic Bank of Asia are also included in this segment.

| 175Financial statements
The following table analyses the results, total assets and total liabilities of the Group by business segment:
The Group Consumer Banking/ InstitutionalIn $ millions Wealth Management Banking Treasury Others Total
2016Net interest income 2,715 3,487 578 525 7,305Non-interest income 1,564 1,729 551 340 4,184Total income 4,279 5,216 1,129 865 11,489Expenses 2,384 1,737 564 287 4,972Allowances for credit and other losses 129 1,499 – (194) 1,434Profit before tax 1,766 1,980 565 772 5,083Income tax expense 723Net profit attributable to shareholders 4,238
Total assets before goodwill and intangibles 96,405 231,929 102,701 45,418 476,453Goodwill and intangibles 5,117Total assets 481,570Total liabilities 187,387 167,598 47,836 31,779 434,600
Capital expenditure 87 19 17 198 321Depreciation(a) 39 20 4 212 275
2015Net interest income 2,157 3,538 694 711 7,100Non-interest income 1,390 1,752 446 249 3,837Total income 3,547 5,290 1,140 960 10,937Expenses 2,261 1,722 572 345 4,900Allowances for credit and other losses 116 558 (38) 107 743Profit before tax 1,170 3,010 606 508 5,294Income tax expense 727Net profit attributable to shareholders 4,454
Total assets before goodwill and intangibles 90,685 224,196 91,257 46,579 452,717Goodwill and intangibles 5,117Total assets 457,834Total liabilities 172,723 155,231 43,354 43,730 415,038
Capital expenditure 75 28 12 219 334Depreciation(a) 37 11 4 199 251
(a) Amounts for each business segment are shown before allocation of centralised costs

176 | DBS Annual Report 2016
44.2 Geographical segment reporting
Income and net profit attributable to shareholders (Net profit) are based on the country in which the transactions are booked. Total assets are shown by geographical area in which the assets are booked. The total assets, income and net profit are stated after elimination of inter-group assets and revenues.
The Group Rest of South and Greater Southeast Rest ofIn $ millions Singapore Hong Kong China(a) Asia(b) the World(c) Total
2016Net interest income 4,888 1,317 464 425 211 7,305Non-interest income 2,652 785 370 292 85 4,184Total income 7,540 2,102 834 717 296 11,489Expenses 2,871 961 645 399 96 4,972Allowances for credit and other losses 658 302 191 196 87 1,434Profit before tax 4,011 839 (2) 122 113 5,083Income tax expense 494 126 19 29 55 723Net profit attributable to shareholders 3,396 713 (21) 92 58 4,238
Total assets before goodwill and intangibles 316,908 73,338 40,436 21,613 24,158 476,453Goodwill and intangibles 5,083 34 – – – 5,117Total assets 321,991 73,372 40,436 21,613 24,158 481,570Non-current assets(d) 1,941 382 80 53 6 2,462
2015Net interest income 4,658 1,330 547 382 183 7,100Non-interest income 2,151 959 485 179 63 3,837Total income 6,809 2,289 1,032 561 246 10,937Expenses 2,816 951 699 343 91 4,900Allowances for credit and other losses 320 58 140 181 44 743Profit before tax 3,673 1,280 193 37 111 5,294Income tax expense 469 189 26 5 38 727Net profit attributable to shareholders 3,091 1,091 167 32 73 4,454
Total assets before goodwill and intangibles 303,530 73,013 41,784 16,304 18,086 452,717Goodwill and intangibles 5,083 34 – – – 5,117Total assets 308,613 73,047 41,784 16,304 18,086 457,834Non-current assets(d) 2,022 386 85 46 8 2,547
(a) Rest of Greater China includes branch, subsidiary and associate operations in Mainland China and Taiwan(b) South and Southeast Asia includes branch, subsidiary and associate operations in India, Indonesia, Malaysia and Vietnam(c) Rest of the World includes branch operations in South Korea, Japan, Dubai, United Kingdom and Australia (d) Includes investments in associates, properties and other fixed assets
45 Subsequent Event
On 10 February 2017, the Company announced that the Bank had agreed to sell its entire equity interest in DBS China Square Limited (DCS) to an indirect subsidiary of Manulife Financial Corporation. The sale is expected to be completed by the end of March 2017 and will result in a net gain of approximately $350 million to be recognised in the first quarter of 2017.
As at 31 December 2016, DCS’ main asset, PWC Building, was classified as an asset held for sale (refer to Note 26.1). The remaining assets, liabilities and reserves of DCS were not material and hence not classified as held for sale.
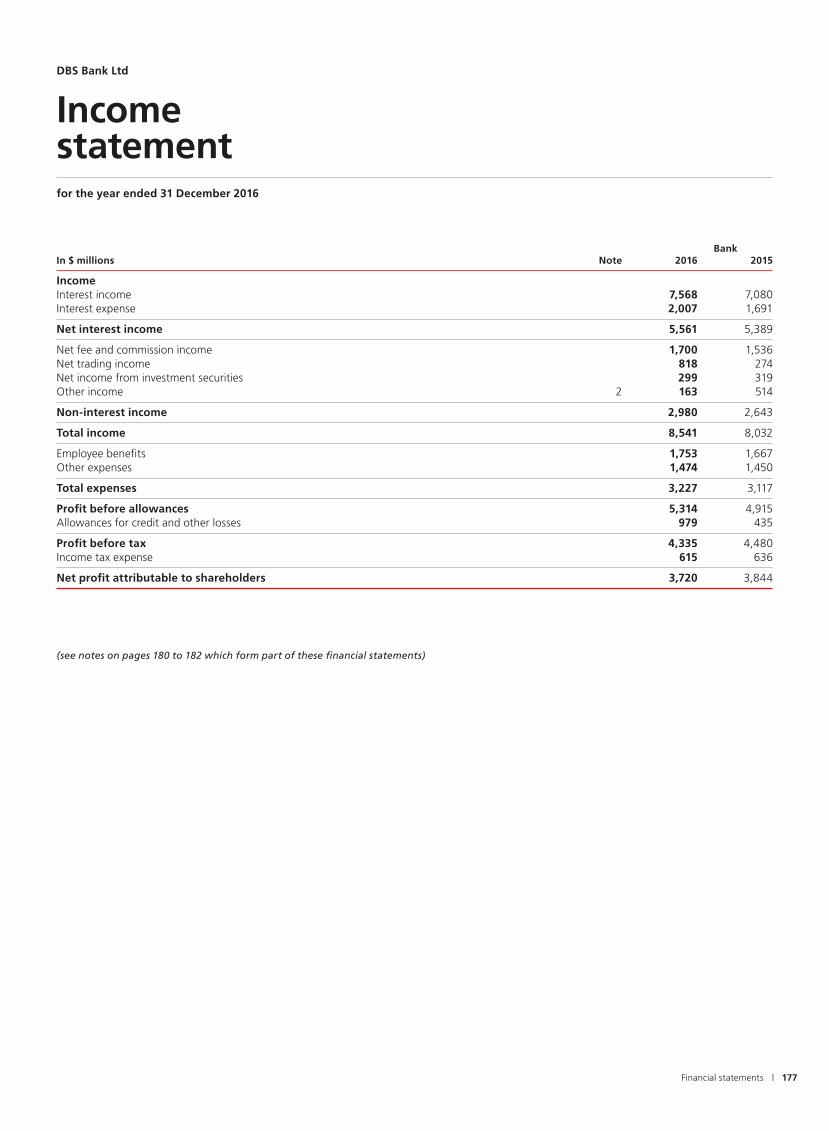
| 177Financial statements
BankIn $ millions Note 2016 2015
IncomeInterest income 7,568 7,080Interest expense 2,007 1,691
Net interest income 5,561 5,389
Net fee and commission income 1,700 1,536Net trading income 818 274Net income from investment securities 299 319Other income 2 163 514
Non-interest income 2,980 2,643
Total income 8,541 8,032
Employee benefits 1,753 1,667Other expenses 1,474 1,450
Total expenses 3,227 3,117
Profit before allowances 5,314 4,915Allowances for credit and other losses 979 435
Profit before tax 4,335 4,480Income tax expense 615 636
Net profit attributable to shareholders 3,720 3,844
(see notes on pages 180 to 182 which form part of these financial statements)
Income statement
DBS Bank Ltd
for the year ended 31 December 2016

178 | DBS Annual Report 2016
BankIn $ millions 2016 2015
Net profit 3,720 3,844
Other comprehensive income(a):Foreign currency translation differences for foreign operations 48 20Available-for-sale financial assets and others: Net valuation taken to equity 168 (222) Transferred to income statement (181) 58 Tax on items taken directly to or transferred from equity 4 7
Other comprehensive income, net of tax 39 (137)
Total comprehensive income attributable to shareholders 3,759 3,707
(a) Items recorded in “Other comprehensive income” above will be reclassified to the income statement when specific conditions are met (e.g. when foreign operations or available-for-sale financial assets are disposed of)
(see notes on pages 180 to 182 which form part of these financial statements)
Statement of comprehensive income
DBS Bank Ltd
for the year ended 31 December 2016

| 179Financial statements
Balance sheet
DBS Bank Ltd
as at 31 December 2016
BankIn $ millions Note 2016 2015
AssetsCash and balances with central banks 20,001 11,021Government securities and treasury bills 27,281 29,181Due from banks 24,971 32,704Derivatives 23,994 22,791Bank and corporate securities 41,700 35,978Loans and advances to customers 249,744 229,287Other assets 7,632 8,818Associates 192 239Subsidiaries 3 26,381 25,331Properties and other fixed assets 670 635Goodwill and intangibles 281 281
Total assets 422,847 396,266
LiabilitiesDue to banks 12,694 15,797Deposits and balances from customers 266,934 250,082Derivatives 22,944 21,386Other liabilities 10,339 8,726Other debt securities 24,393 34,554Due to holding company 1,029 1,085Due to subsidiaries 4 41,205 24,432Subordinated term debts 2,457 4,026
Total liabilities 381,995 360,088
Net assets 40,852 36,178
EquityShare capital 5 24,146 23,496Other equity instruments 6 1,813 –Other reserves 7 114 2,435Revenue reserves 7 14,779 10,247
Shareholders’ funds 40,852 36,178
Total equity 40,852 36,178
(see notes on pages 180 to 182 which form part of these financial statements)

180 | DBS Annual Report 2016
The supplementary financial statements of DBS Bank Ltd (the Bank) are extracted from the Audited Statutory Financial Statements of DBS Bank Ltd and its subsidiaries (the Bank Group) for the financial year ended 31 December 2016. The statutory financial statements of the Bank and the Bank Group which contained an unqualified audit report, will be delivered to the Accounting & Corporate Regulatory Authority in accordance with the Singapore Companies Act.
1 Summary of Significant Accounting Policies
The accounting policies applied by the Bank and the Bank Group are consistent with those applied by the Group as disclosed in Note 2 of the “Notes to the Financial Statements” (Notes) in the Group’s Consolidated Financial Statements.
2 Other Income
Other income includes the following:
In $ millions 2016 2015
Dividends from subsidiaries # 475Dividends from associates 14 10
Total 14 485
# Amount under $500,000
3 Subsidiaries
In $ millions 2016 2015
Investment in subsidiaries(a) (b) 11,471 11,407Due from subsidiaries 14,910 13,924
Total 26,381 25,331
(a) The carrying amounts of certain investments which are designated as hedged items in a fair value hedge are adjusted for fair value changes attributable to the hedged risks
(b) The carrying amounts presented are net of impairment allowances
4 Due to Subsidiaries
In $ millions 2016 2015
Subordinated term debts issued to DBS Capital Funding II Corporation (Note 4.1) 1,500 1,500Due to subsidiaries 39,705 22,932
Total 41,205 24,432
4.1 The $1,500 million 5.75% subordinated note was issued on 27 May 2008 by the Bank to DBS Capital Funding II Corporation, both wholly-owned subsidiaries of DBSH. Interest is payable in arrears on 15 June and 15 December each year at a fixed rate of 5.75% per annum up to 15 June 2018. Thereafter, interest is payable quarterly in arrears on 15 March, 15 June, 15 September and 15 December each year at a floating rate of three-month Singapore Dollar Swap Offer Rate + 3.415% per annum.
DBS Bank Ltd
Notes to the supplementary financial statementsfor the year ended 31 December 2016

| 181Financial statements
5 Share Capital
Shares (‘000) in $ millions 2016 2015 2016 2015
Ordinary sharesBalance at 1 January 2,574,643 2,489,381 22,697 21,297Issue of shares 36,599 85,262 650 1,400
Balance at 31 December 2,611,242 2,574,643 23,347 22,697
Non-cumulative preference shares Balance at 1 January S$800m 4.7% Non-Cumulative, Non-Convertible, Non-Voting 8,000 8,000 799 799 Preference Shares callable in 2020
Balance at 31 December 8,000 8,000 799 799
Issued share capital at 31 December 24,146 23,496
6 Other Equity Instruments
The following perpetual capital securities issued by the Bank are classified as other equity instruments. These instruments are subordinated to all liabilities of the Bank and senior only to ordinary shareholders of the Bank. Their terms require them to be written-off if and when the Monetary Authority of Singapore notifies the Bank that a write-off of the instruments, or a public sector injection of capital (or equivalent support), is necessary, without which the Group would become non-viable. These instruments qualify as Additional Tier 1 capital under the MAS Notice 637.
Issue DistributionIn $ millions Date Payment 2016 2015
S$550m 3.85% Non-Cumulative, Non-Convertible 1 Sep 2016 Sep 550 – Perpetual Capital Securities First Callable in 2021US$185m 4.0% Non-Cumulative, Non-Convertible 1 Sep 2016 Sep 252 – Perpetual Capital Securities First Callable in 2021US$750m 3.60% Non-Cumulative, Non-Convertible Perpetual Capital Securities First Callable in 2021 7 Sep 2016 Mar/Sep 1,011 –
Total 1,813 –
7 Other Reserves and Revenue Reserves
7.1 Other reserves
In $ millions 2016 2015
Available-for-sale revaluation reserves 66 92Cash flow hedge reserves 21 6General reserves – 2,360Capital reserves 27 (23)
Total 114 2,435

182 | DBS Annual Report 2016
Movements in other reserves of the Bank during the year are as follows:
Available-for- Cash flow sale revaluation hedge General CapitalIn $ millions reserves reserves reserves(a) reserves(b) Total
2016Balance at 1 January 92 6 2,360 (23) 2,435Net exchange translation adjustments (2) – – 50 48Transfer to revenue reserves (Note 7.2) (2,360) – (2,360)Available-for-sale (AFS) financial assets and others:– net valuation taken to equity 210 (42) – – 168– transferred to income statement (240)(c) 59 – – (181)– tax on items taken directly to or transferred from equity 6 (2) – – 4
Balance at 31 December 66 21 – 27 114
2015Balance at 1 January 288 (33) 2,360 (43) 2,572Net exchange translation adjustments – 1 – 20 21Available-for-sale (AFS) financial assets and others:– net valuation taken to equity (79) (144) – – (223)– transferred to income statement (128)(c) 186 – – 58– tax on items taken directly to or transferred from equity 11 (4) – – 7
Balance at 31 December 92 6 2,360 (23) 2,435
(a) During the year, the Bank transferred $2.36 billion of general reserves to revenue reserves (b) Capital reserves include net exchange translation adjustments arising from translation differences on net investments in foreign branches and the
related foreign currency instruments designated as a hedge(c) Include impairment of AFS financial assets of $1 million (2015: $NIL)
7.2 Revenue reserves
In $ millions 2016 2015
Balance at 1 January 10,247 7,941Transfer from general reserves (Note 7.1) 2,360 –Net profit attributable to shareholders 3,720 3,844
Amount available for distribution 16,327 11,785Less: Dividends paid to holding company 1,510 1,500 Dividends paid on preference shares 38 38
Balance at 31 December 14,779 10,247

| 183Directors’ statement
Directors’ statement
DBS Group Holdings Ltd and its subsidiaries
The Directors are pleased to submit their statement to the Members, together with the audited balance sheet of DBS Group Holdings Ltd (the Company or DBSH) and the consolidated financial statements of the Company and its subsidiaries (the Group) for the financial year ended 31 December 2016. These have been prepared in accordance with the provisions of the Companies Act, Chapter 50 (the Companies Act) and the Singapore Financial Reporting Standards, as modified by the requirements of Notice to Banks No. 612 “Credit Files, Grading and Provisioning” issued by the Monetary Authority of Singapore.
In the opinion of the Directors, the balance sheet of the Company and the consolidated financial statements of the Group, together with the notes thereon, as set out on pages 121 to 176, are drawn up so as to give a true and fair view of the financial position of the Company and the Group as at 31 December 2016, and the performance, changes in equity and cash flows of the Group for the financial year ended on that date. As at the date of this statement, there are reasonable grounds to believe that the Company and the Group will be able to pay their debts as and when they fall due.
DBSH Share Plan
During the financial year, time-based awards in respect of an aggregate of 8,251,608 ordinary shares were granted pursuant to the DBSH Share Plan to selected employees of the Group. This included 487,626 ordinary shares comprised in awards granted to the executive Director, Mr Piyush Gupta, which formed part of his remuneration. During the financial year, certain non-executive Directors received an aggregate of 68,136 share awards, which formed part of their directors’ fees. Details are set out below.
Share awards granted during Share awards vested during Directors of the Company the financial year under review the financial year under review
Peter Seah(2) 36,253 43,892Piyush Gupta 487,626(1) 338,811Bart Broadman(2) 4,367 6,014Euleen Goh(2) 7,188 10,149Ho Tian Yee(2) 4,157 5,165Nihal Kaviratne CBE(2) 4,995 6,359Andre Sekulic(2) 5,284 5,284Danny Teoh(2) 5,892 8,148
(1) Mr Gupta’s awards formed part of his remuneration for 2015(2) The awards of these non-executive Directors formed part of their directors’ fees for 2015, which had been approved by the shareholders at
DBSH’s annual general meeting held on 28 April 2016. All the awards granted to these non-executive Directors during the financial year under review vested immediately upon grant
Information on the DBSH Share Plan is as follows:
(i) Awards over DBSH’s ordinary shares may be granted to Group executives who hold such rank as may be determined by the Compensation and Management Development Committee of DBSH from time to time. Awards may also be granted to (amongst others) executives of associated companies of DBSH who hold such rank as may be determined by the Compensation and Management Development Committee from time to time, and non-executive Directors of DBSH. The participants of the DBSH Share Plan shall not be eligible to participate in the DBSH Employee Share Plan or other equivalent plans.
(ii) Where time-based awards are granted, participants are awarded ordinary shares of DBSH or, at the Compensation and Management Development Committee’s discretion, their equivalent cash value or a combination of both as part of their deferred bonus, at the end of the prescribed vesting periods. Dividends on unvested shares do not accrue to employees.
(iii) The DBSH Share Plan shall continue to be in force at the discretion of the Compensation and Management Development Committee, subject to a maximum period of ten years. At an Extraordinary General Meeting held on 8 April 2009, the DBSH Share Plan was extended for another ten years, from 18 September 2009 to 17 September 2019, provided always that the DBSH Share Plan may continue beyond the above stipulated period with the approval of the shareholders of DBSH by ordinary resolution in general meeting and of any relevant authorities which may then be required.
(iv) Awards under the DBSH Share Plan may be granted at any time in the course of a financial year, and may lapse by reason of cessation of employment or misconduct of the participant, except in cases such as retirement, redundancy, ill health, injury, disability, death, bankruptcy of the participant, or by reason of the participant, being a non-executive Director, ceasing to be a Director, or in the event of a take-over, winding up or reconstruction of DBSH.

184 | DBS Annual Report 2016
(v) Subject to the prevailing legislation and the rules of the Singapore Exchange, DBSH will have the flexibility to deliver ordinary shares of DBSH to participants upon vesting of their awards by way of an issue of new ordinary shares and/or the transfer of existing ordinary shares (which may include ordinary shares held by the Company in treasury).
(vi) The class and/or number of ordinary shares of DBSH comprised in an award to the extent not yet vested, and/or which may be granted to participants, are subject to adjustment by reason of any variation in the ordinary share capital of DBSH (whether by way of a capitalisation of profits or reserves or rights issue, reduction, subdivision, consolidation, or distribution) or if DBSH makes a capital distribution or a declaration of a special dividend (whether in cash or in specie), upon the written confirmation of the auditor of DBSH that such adjustment (other than in the case of a capitalisation issue) is fair and reasonable.
Board of Directors
The Directors in office at the date of this statement are:Peter Seah Lim Huat – ChairmanPiyush Gupta – Chief Executive OfficerBart Joseph Broadman Euleen Goh Yiu Kiang Ho Tian YeeNihal Vijaya Devadas Kaviratne CBE Andre SekulicDanny Teoh Leong KayWoo Foong Pheng (Mrs Ow Foong Pheng)
Dr Bart Broadman, Mr Ho Tian Yee and Mrs Ow Foong Pheng will retire in accordance with Article 99 of the Company’s Constitution at the forthcoming annual general meeting (AGM) and will offer themselves for re-election at the AGM.
Arrangements to enable Directors to acquire shares or debentures
Neither at the end of, nor at any time during the financial year, was the Company a party to any arrangement, the object of which is to enable the Directors to acquire benefits through the acquisition of shares in, or debentures of, the Company or any other body corporate, save as disclosed in this statement.

| 185
Directors’ interest in shares or debentures
The following Directors, who held office at the end of the financial year, had, according to the register of directors’ shareholdings required to be kept under Section 164 of the Companies Act, an interest in shares of the Company and related corporations as stated below:
Holdings in which Holdings in which Directors Directors are deemed have a direct interest to have an interest As at As at As at As at 31 Dec 2016 1 Jan 2016 31 Dec 2016 1 Jan 2016
DBSH ordinary sharesPeter Seah 175,911 125,994 – –Piyush Gupta 962,007 623,196 318,000 118,000Bart Broadman 109,876 28,862 – –Euleen Goh 45,209 34,245 – –Ho Tian Yee 38,591 12,017 – –Nihal Kaviratne CBE 16,224 9,865 – –Andre Sekulic 17,476 11,611 – –Danny Teoh 34,636 25,966 19,099 18,723Ow Foong Pheng 25,464 24,466 – –
Share awards (unvested) granted under the DBSH Share PlanPeter Seah – 7,639 – –Piyush Gupta(1) 1,201,521 1,052,706 – –Bart Broadman – 1,647 – –Euleen Goh – 2,961 – –Ho Tian Yee – 1,008 – –Nihal Kaviratne CBE – 1,364 – –Danny Teoh – 2,256 – –
DBS Bank 4.7% non-cumulative non-convertible redeemable perpetual preference shares Euleen Goh 3,000 3,000 – –
(1) Mr Gupta’s share awards form part of his remuneration. Details of the DBSH Share Plan are set out in Note 38 of the Notes to the 2016 Company’s financial statements
There was no change in any of the above-mentioned interests between the end of the financial year and 21 January 2017.
Directors’ statement

186 | DBS Annual Report 2016
Audit Committee
The Audit Committee comprises non-executive Directors Mr Danny Teoh (Chairman), Mr Nihal Kaviratne CBE, Mr Peter Seah, Mr Andre Sekulic and Mrs Ow Foong Pheng.
The Audit Committee performed its functions in accordance with the Companies Act, the SGX-ST Listing Manual, the Banking (Corporate Governance) Regulations 2005, the MAS Guidelines for Corporate Governance and the Code of Corporate Governance 2012, which include, inter alia, the following:
(i) reviewing the Group’s consolidated financial statements and financial announcements prior to submission to the Board;
(ii) reviewing the adequacy and effectiveness of the Group’s internal controls;
(iii) reviewing with the external auditor, its audit plan, its audit report, its evaluation of the internal accounting controls of DBS and assistance given by the management to the external auditor;
(iv) reviewing the internal auditor’s plans and the scope and results of audits; and
(v) overseeing the adequacy and effectiveness of the internal audit function, and the effectiveness, independence and objectivity of the external auditor.
In its review of the audited financial statements for the financial year ended 31 December 2016, the Audit Committee had discussed with management and the external auditor the accounting principles that were applied and their judgement on the items that might affect the financials. Based on the review and discussions with management and the external auditor, the Audit Committee is of the view that the financial statements are fairly presented in conformity with generally accepted accounting principles in all material aspects.
The Audit Committee has received the requisite information from PricewaterhouseCoopers LLP (PwC) and has considered the financial, business and professional relationship between PwC and the Group. It is of the view that such relationship is compatible with maintaining PwC’s independence.
The Audit Committee has recommended, to the Board of Directors, the re-appointment of PwC as independent external auditor at the forthcoming AGM of the Company on 27 April 2017.
Independent auditor
PricewaterhouseCoopers LLP has expressed its willingness to accept re-appointment as independent external auditor.
On behalf of the Directors
Peter Seah Lim Huat
Piyush Gupta
15 February 2017Singapore

| 187Independent auditor’s report
To the members of DBS Group Holdings Ltd (incorporated in Singapore)
Report on the Audit of the Financial Statements
Our opinion
In our opinion, the accompanying consolidated financial statements of DBS Group Holdings Ltd (the “Company”) and its subsidiaries (the “Group”) and the statement of financial position of the Company are properly drawn up in accordance with the provisions of the Companies Act, Chapter 50 (the “Act”) and Financial Reporting Standards in Singapore (“FRSs”), including the modification of the requirements of FRS 39 Financial Instruments: Recognition and Measurement in respect of loan loss provisioning by Notice to Banks No. 612 “Credit Files, Grading and Provisioning” issued by the Monetary Authority of Singapore (“MAS 612”) so as to give a true and fair view of the consolidated financial position of the Group and the financial position of the Company as at 31 December 2016 and of the consolidated financial performance, consolidated changes in equity and consolidated cash flows of the Group for the financial year ended on that date.
What we have auditedThe financial statements of the Company and the Group, as set out on pages 121 to 176, comprise:
• the consolidated statement of financial position of the Group and statement of financial position of the Company as at 31 December 2016;
• the consolidated statement of comprehensive income for the year then ended;
• the consolidated statement of changes in equity for the year then ended;
• the consolidated statement of cash flows of the Group for the year then ended; and
• the notes to the financial statements, including a summary of significant accounting policies.
Basis for opinion
We conducted our audit in accordance with Singapore Standards on Auditing (“SSAs”). Our responsibilities under those standards are further described in the “Auditor’s Responsibilities for the Audit of the Financial Statements” section of our report.
We believe that the audit evidence we have obtained is sufficient and appropriate to provide a basis for our opinion.
IndependenceWe are independent of the Group in accordance with the Accounting and Corporate Regulatory Authority (“ACRA”) Code of Professional Conduct and Ethics for Public Accountants and Accounting Entities (“ACRA Code”) together with the ethical requirements that are relevant to our audit of the financial statements in Singapore, and we have fulfilled our other ethical responsibilities in accordance with these requirements and the ACRA Code.
DBS Group Holdings Ltd and its Subsidiaries
Independent auditor’s report

188 | DBS Annual Report 2016
Our audit approach
Overview
Audit scope Materiality Key audit matters
• Audit procedures were performed over the Singapore Operations of DBS Bank Ltd and DBS Group (HK) Limited.
• We identified DBS Bank Ltd Hong Kong Branch, DBS Bank (China) Limited, PT Bank DBS Indonesia, DBS Bank (Taiwan) Limited and DBS Bank Ltd India Branch as component entities where certain account balances were considered to be significant in size in relation to the Group. Consequently, specific audit procedures for these components were performed to obtain sufficient appropriate audit evidence.
• We determined the overall Group materiality based on 5% of the Group’s profit before tax.
• Specific and general allowances for loans and advances to customers
• Goodwill and intangibles
• Complex or illiquid financial instruments
As part of designing our audit, we determined materiality and assessed the risks of material misstatement in the consolidated financial statements. In particular, we considered where management made subjective judgements; for example, in respect of significant accounting estimates that involved making assumptions and considering future events that are inherently uncertain. As in all of our audits, we also addressed the risk of management override of internal controls, including among other matters consideration of whether there was evidence of bias that represented a risk of material misstatement due to fraud.
MaterialityThe scope of our audit was influenced by our application of materiality. We set certain quantitative thresholds for materiality together with qualitative considerations to help us determine the scope of our audit and the nature, timing and extent of our audit procedures and to evaluate the effect of misstatements, both individually and on the financial statements as a whole.
Based on our professional judgement, we determined materiality for the financial statements as a whole as set out in the table below:
How we determined overall 5% of the Group’s profit before taxGroup materiality
Rationale for benchmark applied We chose ‘profit before tax’ as it is a commonly used benchmark for materiality. We selected 5% based on our professional judgement, noting that it is also within the range of commonly accepted profit-related thresholds.
In performing our audit, we allocated materiality levels to the significant components of the Group. These are less than the overall Group materiality.
How we developed the audit scopeWe tailored the scope of our audit in order to perform sufficient work to enable us to provide an opinion on the consolidated financial statements as a whole, taking into account the structure of the Group, the accounting processes and controls, and the industry in which the Group operates.
In establishing the overall Group audit approach, we determined the extent of audit procedures that are needed to be performed across the Group by us, or by other PwC network firms operating under our instruction who are familiar with the local laws and regulations in each of these territories (the “component auditors”). Where the work was performed by component auditors, we determined the level of involvement we needed to have in the procedures to be able to conclude whether sufficient appropriate audit evidence had been obtained as a basis for our opinion on the Group financial statements as a whole.
In addition, we visited several of the Group’s key locations and held a Group audit planning meeting. We also held regular conference calls with the component auditors.
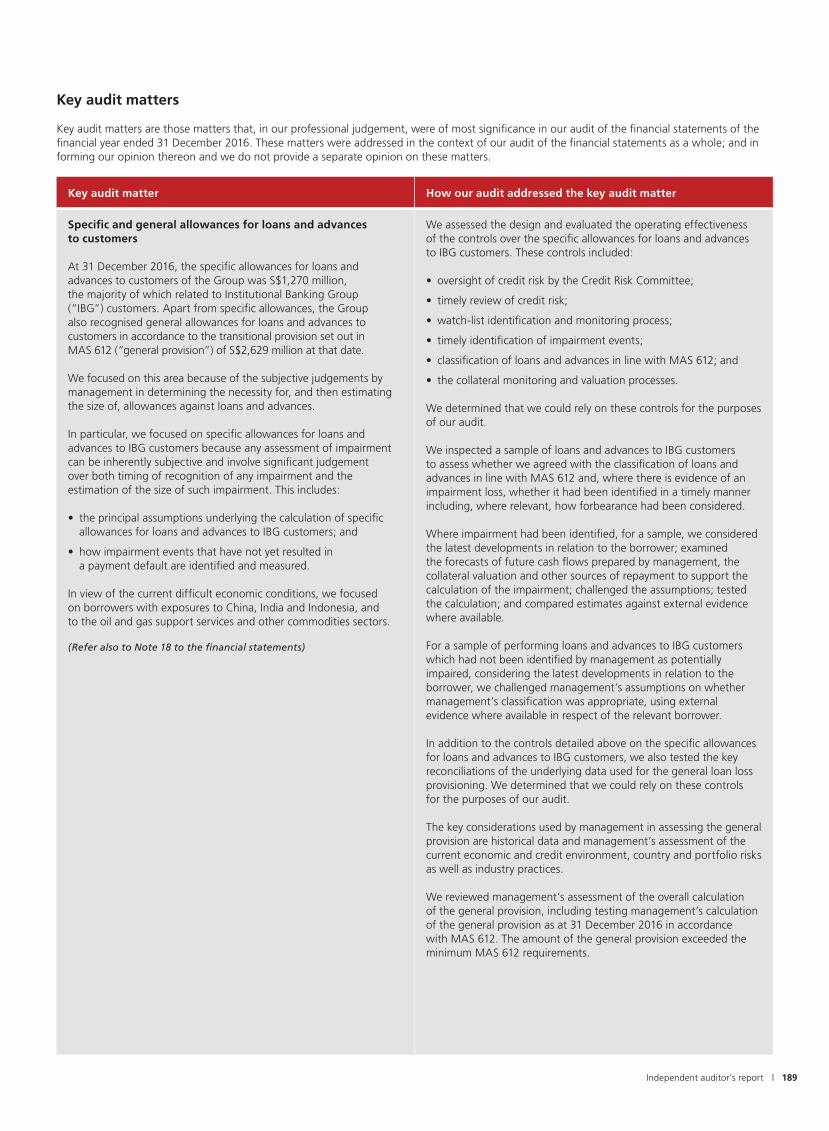
| 189
Key audit matters
Key audit matters are those matters that, in our professional judgement, were of most significance in our audit of the financial statements of the financial year ended 31 December 2016. These matters were addressed in the context of our audit of the financial statements as a whole; and in forming our opinion thereon and we do not provide a separate opinion on these matters.
Key audit matter How our audit addressed the key audit matter
Specific and general allowances for loans and advances to customers
At 31 December 2016, the specific allowances for loans and advances to customers of the Group was S$1,270 million, the majority of which related to Institutional Banking Group (“IBG”) customers. Apart from specific allowances, the Group also recognised general allowances for loans and advances to customers in accordance to the transitional provision set out in MAS 612 (“general provision”) of S$2,629 million at that date.
We focused on this area because of the subjective judgements by management in determining the necessity for, and then estimating the size of, allowances against loans and advances.
In particular, we focused on specific allowances for loans and advances to IBG customers because any assessment of impairment can be inherently subjective and involve significant judgement over both timing of recognition of any impairment and the estimation of the size of such impairment. This includes:
• the principal assumptions underlying the calculation of specific allowances for loans and advances to IBG customers; and
• how impairment events that have not yet resulted in a payment default are identified and measured.
In view of the current difficult economic conditions, we focused on borrowers with exposures to China, India and Indonesia, and to the oil and gas support services and other commodities sectors.
(Refer also to Note 18 to the financial statements)
We assessed the design and evaluated the operating effectiveness of the controls over the specific allowances for loans and advances to IBG customers. These controls included:
• oversight of credit risk by the Credit Risk Committee;
• timely review of credit risk;
• watch-list identification and monitoring process;
• timely identification of impairment events;
• classification of loans and advances in line with MAS 612; and
• the collateral monitoring and valuation processes.
We determined that we could rely on these controls for the purposes of our audit.
We inspected a sample of loans and advances to IBG customers to assess whether we agreed with the classification of loans and advances in line with MAS 612 and, where there is evidence of an impairment loss, whether it had been identified in a timely manner including, where relevant, how forbearance had been considered.
Where impairment had been identified, for a sample, we considered the latest developments in relation to the borrower; examined the forecasts of future cash flows prepared by management, the collateral valuation and other sources of repayment to support the calculation of the impairment; challenged the assumptions; tested the calculation; and compared estimates against external evidence where available.
For a sample of performing loans and advances to IBG customers which had not been identified by management as potentially impaired, considering the latest developments in relation to the borrower, we challenged management’s assumptions on whether management’s classification was appropriate, using external evidence where available in respect of the relevant borrower.
In addition to the controls detailed above on the specific allowances for loans and advances to IBG customers, we also tested the key reconciliations of the underlying data used for the general loan loss provisioning. We determined that we could rely on these controls for the purposes of our audit.
The key considerations used by management in assessing the general provision are historical data and management’s assessment of the current economic and credit environment, country and portfolio risks as well as industry practices.
We reviewed management’s assessment of the overall calculation of the general provision, including testing management’s calculation of the general provision as at 31 December 2016 in accordance with MAS 612. The amount of the general provision exceeded the minimum MAS 612 requirements.
Independent auditor’s report

190 | DBS Annual Report 2016
Key audit matter How our audit addressed the key audit matter
Goodwill and intangibles
As at 31 December 2016, the Group had S$5,117 million of goodwill and intangibles as a result of acquisitions in previous years.
We focused on this area as management makes significant judgements when estimating future cash flows and growth rates in undertaking its annual goodwill impairment testing.
We specifically focused on the following key assumptions used in the discounted cash flow analyses:
• Cash flow forecasts;
• Discount rate; and
• Growth rate.
(Refer also to Note 27 to the financial statements)
We assessed the appropriateness of management’s identification of the Group’s cash generating units and the process by which indicators of impairment were identified. There were no significant issues noted.
For DBS Bank (Hong Kong) Limited’s franchise (goodwill of S$4,631 million as at 31 December 2016), we evaluated management’s cash flow forecasts and the process by which they were developed, including verifying the mathematical accuracy of the underlying calculations. Valuation specialists in our team critically assessed the assumptions and methodologies used to forecast the value-in-use and compared key inputs (such as the discount rates and long-term growth rates) to the Group’s own historical data, performance and external available trend analysis, industry and economic indicators. Based on the evidence obtained, we found that the estimates used by management were within a reasonable range of expectations in the context of the value-in-use calculations.
We reviewed management’s stress test over the key assumptions to determine whether any reasonably possible change in these assumptions would not cause an impairment.
Additionally, we considered whether the Group’s disclosure of the application of judgement in estimating cash flow projections and the sensitivity of the results of those estimates adequately reflects the uncertainties and risks associated with goodwill impairment.
Complex or illiquid financial instruments
At 31 December 2016, the Group had financial assets of S$158 million and financial liabilities of S$20 million carried at fair value which are classified as Level 3.
We focused on the valuation of Level 3 financial assets and financial liabilities, as management makes significant judgements and assumptions (using valuation models) when valuing these financial instruments, as they are complex or illiquid and the external evidence supporting the Group’s valuations is limited due to the lack of a liquid market.
Management also makes significant judgements when calculating derivative valuation adjustments, including those made to reflect the cost of funding of uncollateralised derivatives and counterparty credit risk. The methods for calculating some of the adjustments continue to evolve across the banking industry.
(Refer also to Note 40 to the financial statements)
We assessed the design and tested the operating effectiveness of the controls over the Group’s complex or illiquid financial instrument valuation processes. These included the controls over:
• the completeness and accuracy of the data feeds and other inputs into valuation models;
• management’s testing and approval of new models or revalidation of existing models; and
• follow-up on collateral disputes to identify possibly inappropriate valuations.
We determined that we could rely on the controls for the purposes of our audit.
We assessed the reasonableness of the methodologies used and the assumptions made for a sample of financial instrument valuations with significant unobservable valuation inputs. We determined that the methodologies and assumptions made were appropriate.
In addition, we assessed the appropriateness of the methodologies for the derivative valuation adjustments and did not note any exception.

| 191
Other Information
Management is responsible for the other information. The other information comprises the Directors’ Statement included in pages 183 to 186 (but does not include the financial statements and our auditor’s report thereon), which we obtained prior to the date of this auditor’s report, and the other sections of the Annual Report (“the Other Sections”) which are expected to be made available to us after that date.
Our opinion on the financial statements does not cover the other information and we do not express any form of assurance conclusion thereon.
In connection with our audit of the financial statements, our responsibility is to read the other information identified above and, in doing so, consider whether the other information is materially inconsistent with the financial statements or our knowledge obtained in the audit, or otherwise appears to be materially misstated. If, based on the work we have performed on the other information that we obtained prior to the date of this auditor’s report, we conclude that there is a material misstatement of this other information, we are required to report that fact. We have nothing to report in this regard.
When we read the Other Sections, if we conclude that there is a material misstatement therein, we are required to communicate the matter to those charged with governance and take appropriate actions in accordance with SSAs.
Responsibilities of Management and Directors for the Financial Statements
Management is responsible for the preparation of financial statements that give a true and fair view in accordance with the provisions of the Act and FRSs, and for devising and maintaining a system of internal accounting controls sufficient to provide a reasonable assurance that assets are safeguarded against loss from unauthorised use or disposition; and transactions are properly authorised and that they are recorded as necessary to permit the preparation of true and fair financial statements and to maintain accountability of assets.
In preparing the financial statements, management is responsible for assessing the Group’s ability to continue as a going concern, disclosing, as applicable, matters related to going concern and using the going concern basis of accounting unless management either intends to liquidate the Group or to cease operations, or has no realistic alternative but to do so.
The directors’ responsibilities include overseeing the Group’s financial reporting process.
Auditor’s Responsibilities for the Audit of the Financial Statements
Our objectives are to obtain reasonable assurance about whether the financial statements as a whole are free from material misstatement, whether due to fraud or error, and to issue an auditor’s report that includes our opinion. Reasonable assurance is a high level of assurance, but is not a guarantee that an audit conducted in accordance with SSAs will always detect a material misstatement when it exists. Misstatements can arise from fraud or error and are considered material if, individually or in the aggregate, they could reasonably be expected to influence the economic decisions of users taken on the basis of these financial statements.
As part of an audit in accordance with SSAs, we exercise professional judgement and maintain professional scepticism throughout the audit. We also:
• Identify and assess the risks of material misstatement of the financial statements, whether due to fraud or error, design and perform audit procedures responsive to those risks, and obtain audit evidence that is sufficient and appropriate to provide a basis for our opinion. The risk of not detecting a material misstatement resulting from fraud is higher than for one resulting from error, as fraud may involve collusion, forgery, intentional omissions, misrepresentations, or the override of internal control.
• Obtain an understanding of internal control relevant to the audit in order to design audit procedures that are appropriate in the circumstances, but not for the purpose of expressing an opinion on the effectiveness of the Group’s internal control.
• Evaluate the appropriateness of accounting policies used and the reasonableness of accounting estimates and related disclosures made by management.
• Conclude on the appropriateness of management’s use of the going concern basis of accounting and, based on the audit evidence obtained, whether a material uncertainty exists related to events or conditions that may cast significant doubt on the Group’s ability to continue as a going concern. If we conclude that a material uncertainty exists, we are required to draw attention in our auditor’s report to the related disclosures in the financial statements or, if such disclosures are inadequate, to modify our opinion. Our conclusions are based on the audit evidence obtained up to the date of our auditor’s report. However, future events or conditions may cause the Group to cease to continue as a going concern.
• Evaluate the overall presentation, structure and content of the financial statements, including the disclosures, and whether the financial statements represent the underlying transactions and events in a manner that achieves fair presentation.
• Obtain sufficient appropriate audit evidence regarding the financial information of the entities or business activities within the Group to express an opinion on the consolidated financial statements. We are responsible for the direction, supervision and performance of the Group audit. We remain solely responsible for our audit opinion.
We communicate with the directors regarding, among other matters, the planned scope and timing of the audit and significant audit findings, including any significant deficiencies in internal control that we identify during our audit.
We also provide the directors with a statement that we have complied with relevant ethical requirements regarding independence, and to communicate with them all relationships and other matters that may reasonably be thought to bear on our independence, and where applicable, related safeguards.
Independent auditor’s report

192 | DBS Annual Report 2016
From the matters communicated with the directors, we determine those matters that were of most significance in the audit of the financial statements of the current period and are therefore the key audit matters. We describe these matters in our auditor’s report unless law or regulation precludes public disclosure about the matter or when, in extremely rare circumstances, we determine that a matter should not be communicated in our report because the adverse consequences of doing so would reasonably be expected to outweigh the public interest benefits of such communication.
Report on Other Legal and Regulatory Requirements
In our opinion, the accounting and other records required by the Act to be kept by the Company and by those subsidiary corporations incorporated in Singapore of which we are the auditors, have been properly kept in accordance with the provisions of the Act.
The engagement partner on the audit resulting in this independent auditor’s report is Karen Loon.
PricewaterhouseCoopers LLPPublic Accountants and Chartered Accountants
Singapore, 15 February 2017

| 193Five-year summary
Group 2016 2015 2014 2013 2012
Selected income statement items ($ millions)Total income(1) 11,489 10,801 9,618 8,927 8,064 Profit before allowances(1) 6,517 5,901 5,288 5,009 4,450 Allowances 1,434 743 667 770 417 Profit before tax 5,083 5,158 4,700 4,318 4,157 Net profit excluding one-time items 4,238 4,318 3,848 3,501 3,359 One-time items(2) – 136 198 171 450 Net profit 4,238 4,454 4,046 3,672 3,809
Selected balance sheet items ($ millions) Total assets 481,570 457,834 440,666 402,008 353,033 Customer loans 301,516 283,289 275,588 248,654 210,519 Total liabilities 434,600 415,038 400,460 364,322 317,035 Customer deposits(3) 347,446 320,134 317,173 292,365 253,464 Total shareholders’ funds 44,609 40,374 37,708 34,233 31,737
Per ordinary share ($)Earnings excluding one-time items and goodwill charges 1.66 1.71 1.55 1.43 1.39 Earnings 1.66 1.77 1.63 1.50 1.57 Net asset value 16.87 15.82 14.85 13.61 12.96 Dividends 0.60 0.60 0.58 0.58 0.56
Selected financial ratios (%) Dividend cover for ordinary shares (number of times) 2.78 2.94 2.80 2.58 2.79 Net interest margin 1.80 1.77 1.68 1.62 1.70 Cost-to-income 43.3 45.4 45.0 43.9 44.8 Return on assets(4) 0.92 0.96 0.91 0.91 0.97 Return on shareholders’ funds(4) (5) 10.1 11.2 10.9 10.8 11.2 Loan/deposit ratio 86.8 88.5 86.9 85.0 83.1Non-performing loan rate 1.4 0.9 0.9 1.1 1.2 Loss allowance coverage 97 148 163 135 142
Capital adequacy(6)
Common Equity Tier 1 14.1 13.5 13.1 13.7 – Tier I 14.7 13.5 13.1 13.7 14.0 Total 16.2 15.4 15.3 16.3 17.1 Basel III fully phased-in Common Equity Tier 1(7) 13.3 12.4 11.9 11.9 –
(1) Total income and profit before allowances for FY2016 and FY2015 include share of profit or losses of associates(2) One-time items include gains on sale of investments, an amount set aside to establish the DBS Foundation and a sum donated to National
Gallery Singapore(3) Includes deposits related to fund management activities of institutional investors from 2012 onwards. Prior to 2012, these deposits were classified
as “Due to Banks”(4) Excludes one-time items(5) Calculated based on net profit attributable to the shareholders net of dividends on preference shares and other equity instruments. Non-controlling
interests, preference shares and other equity instruments are not included as equity in the computation of return of equity(6) With effect from 1 January 2013, Basel III capital adequacy requirements came into effect in Singapore. Changes due to Basel III affected both
eligible capital and risk-weighted assets. Unless otherwise stated, capital adequacy disclosures relating to dates prior to 1 January 2013 are calculated in accordance with the then prevailing capital adequacy regulations and are thus not directly comparable to those pertaining to dates from 1 January 2013
(7) Calculated by dividing Common Equity Tier 1 capital after all regulatory adjustments (e.g. goodwill and capital investments exceeding certain thresholds) applicable from 1 January 2018 by RWA as at each reporting date
Five-year summary
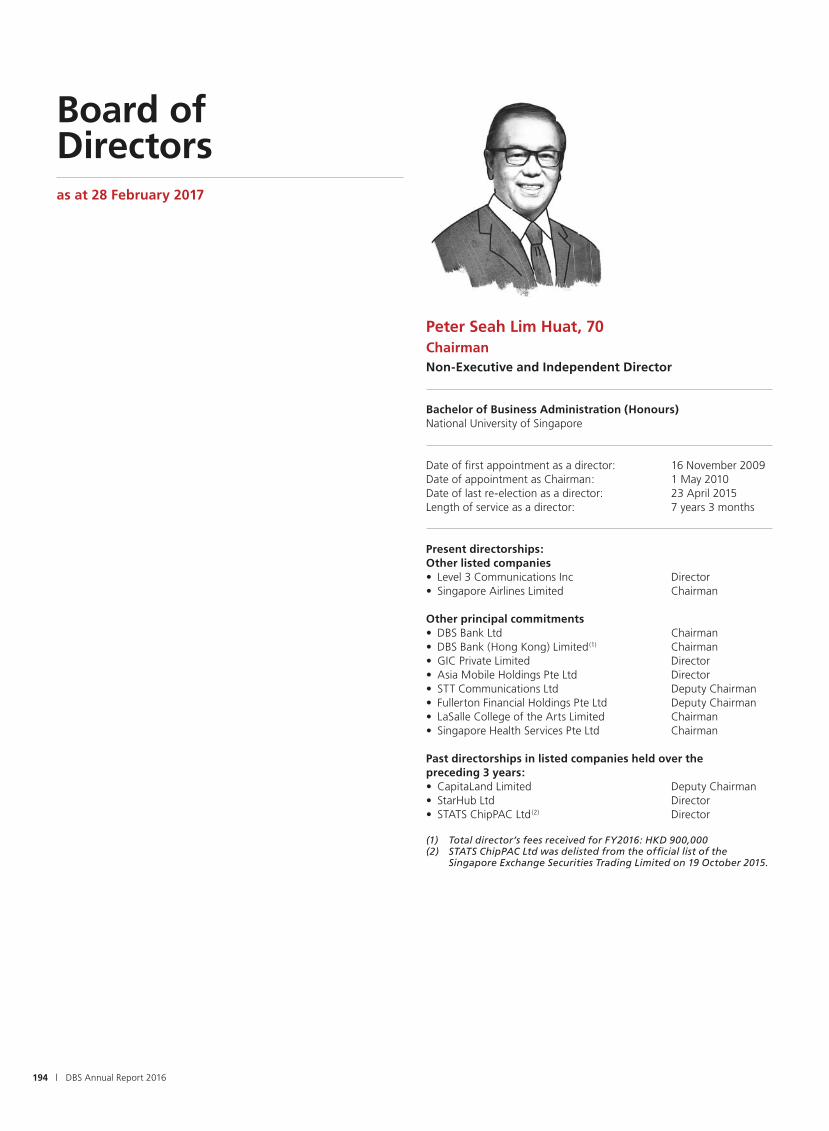
194 | DBS Annual Report 2016
Peter Seah Lim Huat, 70ChairmanNon-Executive and Independent Director
Bachelor of Business Administration (Honours)National University of Singapore
Date of fi rst appointment as a director: 16 November 2009Date of appointment as Chairman: 1 May 2010Date of last re-election as a director: 23 April 2015Length of service as a director: 7 years 3 months
Present directorships:Other listed companies • Level 3 Communications Inc Director• Singapore Airlines Limited Chairman
Other principal commitments • DBS Bank Ltd Chairman• DBS Bank (Hong Kong) Limited(1) Chairman• GIC Private Limited Director• Asia Mobile Holdings Pte Ltd Director• STT Communications Ltd Deputy Chairman• Fullerton Financial Holdings Pte Ltd Deputy Chairman• LaSalle College of the Arts Limited Chairman• Singapore Health Services Pte Ltd Chairman
Past directorships in listed companies held over thepreceding 3 years:• CapitaLand Limited Deputy Chairman• StarHub Ltd Director• STATS ChipPAC Ltd(2) Director
(1) Total director’s fees received for FY2016: HKD 900,000 (2) STATS ChipPAC Ltd was delisted from the offi cial list of the
Singapore Exchange Securities Trading Limited on 19 October 2015.
Board ofDirectorsas at 28 February 2017

| 195Board of Directors
Piyush Gupta, 57Chief Executive Offi cerExecutive Director
Post Graduate Diploma in ManagementIndian Institute of Management, Ahmedabad, India
Bachelor of Arts, EconomicsUniversity of Delhi, India
Date of fi rst appointment as a director: 9 November 2009Date of last re-election as a director: 28 April 2016Length of service as a director: 7 years 3 months
Present directorships:Other listed companies Nil
Other principal commitments • DBS Bank Ltd Chief Executive Offi cer & Director• DBS Bank (Hong Kong) Limited Vice Chairman• The Islamic Bank of Asia Limited Director• Institute of International Finance, Board Member Washington• Dr Goh Keng Swee Scholarship Fund Director• MasterCard Asia/Pacifi c, Middle East Director and Africa – Regional Advisory Board• SPRING Singapore Deputy Chairman• Asian Bureau of Finance and Council Member Economic Research• The Association of Banks in Singapore Vice Chairman• The Institute of Banking & Finance Council Member• Sim Kee Boon Institute for Chairman, Financial Economics Advisory Board• Indian Business-leaders Roundtable Member, under Singapore Indian Development Managing Council Association (SINDA)• Asia Society Member, Board of Trustees
Past directorships in listed companies held over thepreceding 3 years:Nil
Bart Joseph Broadman, 55Non-Executive and Independent Director
Bachelor of Science in Agricultural Science and ManagementUniversity of California at Davis
MBA in Financial EconomicsUniversity of Southern California, Graduate School of Business
Ph.D in Financial EconomicsUniversity of Southern California, Graduate School of Business
Date of fi rst appointment as a director: 17 December 2008Date of last re-election as a director: 28 April 2014Length of service as a director: 8 years 3 months
Present directorships:Other listed companies Nil
Other principal commitments • DBS Bank Ltd Director• Alphadyne Asset Management Pte Ltd Director• Alphadyne Asset Management, LLC Managing Member• Alphadyne Capital, LLC Managing Member
Past directorships in listed companies held over thepreceding 3 years:Nil

196 | DBS Annual Report 2016
Euleen Goh Yiu Kiang, 61Non-Executive and Independent Director
Fellow Institute of Singapore Chartered Accountants
Associate memberInstitute of Chartered Accountants in England and Wales
MemberChartered Institute of Taxation, UK
Associate memberInstitute of Financial Services, UK
FellowSingapore Institute of Directors
Date of fi rst appointment as a director: 1 December 2008Date of last re-election as a director: 28 April 2016Length of service as a director: 8 years 3 months
Present directorships:Other listed companies • CapitaLand Limited Director• Royal Dutch Shell PLC Director• SATS Ltd Chairman
Other principal commitments • DBS Bank Ltd Director• DBS Foundation Ltd Chairman• NorthLight School Chairman, Board of Governors• Singapore Chinese Girls’ School Chairman• Singapore Health Services Pte Ltd Director• Cinnamon College, National University Rector of Singapore• Temasek Trust Member, Board of Trustees
Past directorships in listed companies held over thepreceding 3 years:Nil
Ho Tian Yee, 64Non-Executive and Non-Independent Director
Master of Business AdministrationUniversity of Chicago
Bachelor of Arts (Honours), Economics (CNAA)Portsmouth University, UK
Date of fi rst appointment as a director: 29 April 2011Date of last re-election as a director: 28 April 2014Length of service as a director: 5 years 10 months
Present directorships:Other listed companies • AusNet Services Ltd Director
Other principal commitments • DBS Bank Ltd Director• Pacifi c Asset Management (S) Pte Ltd Managing Director• Fullerton Fund Management Company Ltd Chairman(1)
• Mount Alvernia Hospital Director• Blue Edge Advisors Pte. Ltd. Investment Advisor
Past directorships in listed companies held over thepreceding 3 years:Nil
(1) As incumbent Chairman, Mr Ho Tian Yee was appointed as the interim Chief Executive Offi cer (“CEO”) of Fullerton Fund Management Company Ltd in November 2016 after its then CEO left.

| 197Board of Directors
Nihal Vijaya Devadas Kaviratne CBE, 72Non-Executive and Independent Director
Bachelor of Arts, Economics (Honours)Bombay University, India
Date of fi rst appointment as a director: 29 April 2011Date of last re-appointment as a director: 28 April 2016Length of service as a director: 5 years 10 months
Present directorships:Other listed companies • Akzo Nobel India Limited Chairman• GlaxoSmithKline Pharmaceuticals Ltd Director• Olam International Limited Director• StarHub Ltd Director
Other principal commitments • DBS Bank Ltd Director• DBS Foundation Ltd Director• Caraway Pte. Ltd. Chairman• Bain & Company SE Asia, Inc Member, Advisory Board for Southeast Asia/Indonesia• The Department for International Member, UK Development (DFID) Government’s DFID Private Sector Portfolio Advisory Committee for India
Past directorships in listed companies held over thepreceding 3 years:• SATS Ltd Director
Andre Sekulic, 66Non-Executive and Independent Director
University of Sydney
Date of fi rst appointment as a director: 26 April 2012Date of last re-election as a director: 23 April 2015Length of service as a director: 4 years 10 months
Present directorships:Other listed companies Nil
Other principal commitments• DBS Bank Ltd Director• comGateway (S) Pte Ltd Chairman• Optal Limited Chairman• Hussar Pty Ltd Director• Insourcing International Pty Ltd Director• Plutus Commerce Inc. Director• Queenstar Pty Ltd Director• Royal Motor Yacht Club Broken Bay Director
Past directorships in listed companies held over thepreceding 3 years:Nil

198 | DBS Annual Report 2016
Danny Teoh Leong Kay, 61Non-Executive and Independent Director
Associate MemberInstitute of Chartered Accountants in England and Wales
Diploma in AccountingNewcastle-upon-Tyne Polytechnic, England
Date of fi rst appointment as a director: 1 October 2010Date of last re-election as a director: 28 April 2016Length of service as a director: 6 years 5 months
Present directorships:Other listed companies • Keppel Corporation Limited Director
Other principal commitments • DBS Bank Ltd Director• DBS Bank (China) Limited(1) Director• DBS Foundation Ltd Director• Ascendas-Singbridge Pte. Ltd. Director• Changi Airport Group (Singapore) Pte Ltd Director• JTC Corporation Director
Past directorships in listed companies held over the preceding 3 years:• CapitaLand Mall Trust Management Chairman Limited (the Manager of CapitaLand Mall Trust)
(1) Total director’s fees received for FY2016: CNY 365,000
Woo Foong Pheng (Mrs Ow Foong Pheng), 53Non-Executive and Non-Independent Director
Master of Science in Management Stanford University, USA
Bachelor of Arts, Politics, Philosophy and EconomicsSt John’s College, Oxford University
Date of fi rst appointment as a director: 26 April 2012Date of last re-election as a director: 23 April 2015Length of service as a director: 4 years 10 months
Present directorships:Other listed companies Nil
Other principal commitments • DBS Bank Ltd Director• Ministry of National Development Permanent Secretary• Centre for Liveable Cities Limited Director
Past directorships in listed companies held over the preceding 3 years:• Mapletree Greater China Commercial Director Trust Management Ltd (the Manager of Mapletree Greater China Commercial Trust)

| 199Group Management Committee
The Group Management Committee comprises 19 members, including members of the Group Executive Committee.
Piyush Gupta*Chief Executive Officer Piyush is Chief Executive Officer and Director of DBS Group. Prior to joining DBS, Piyush was Citigroup’s Chief Executive Officer for Southeast Asia, Australia and New Zealand. Piyush is a member of the Executive Committee of the Institute of International Finance, Washington and a member of the Board of Trustees of Asia Society. His other external appointments include serving as Deputy Chairman of SPRING Singapore and on the boards of The Institute of Banking and Finance and Dr. Goh Keng Swee Scholarship Fund. He is also Chairman of Sim Kee Boon Institute for Financial Economics Advisory Board, and a council member of the Asian Bureau of Finance and Economic Research.
Jerry ChenTaiwanJerry is the country head of DBS Taiwan. Prior to joining DBS in 2008, he was President of Ta Chong Bank for four years, during which he significantly improved the bank’s asset quality to attract foreign investments. Jerry has extensive experience in corporate banking, consumer banking and treasury businesses, and spent over 25 years in Citibank Taiwan.
Chng Sok Hui*Chief Financial OfficerSok Hui is Chief Financial Officer of DBS Group. Prior to this appointment in October 2008, she was Group Head of Risk Management for six years. Sok Hui is Supervisor of the Board of DBS Bank (China) Limited and a board member of the Inland Revenue Authority of Singapore and Singapore Exchange Limited. She also serves on the Industry Advisory Board of the NUS Centre for Future Ready Graduates
and the International Integrated Reporting Council. Sok Hui was named Best CFO at the Singapore Corporate Awards 2013. In 2014, she was awarded Accountant of the Year at the inaugural Singapore Accountancy Awards.
Eng-Kwok Seat MoeyCapital MarketsSeat Moey has been with DBS for over 25 years. As Group Head of Capital Markets, Seat Moey oversees and supervises several regional teams responsible for advisory and capital markets, including structuring and executing equity fund raising activities for companies, REITs and Business Trusts. Under her leadership, DBS is a market leader in Singapore and Asia ex-Japan and has won numerous awards including Best Asian Investment Bank in 2015 and 2016 (FinanceAsia), Best Equity House in Singapore since 2004 (FinanceAsia) and Best REIT House in Asia since 2012 (The Asset).
Neil GeChinaNeil is the country head of DBS China. A seasoned banker, he has over 25 years of international experience spanning Beijing, Shanghai, Hong Kong, Tokyo and New York. Formerly Managing Director at Credit Suisse’s Shanghai office, Neil played an instrumental role in building up the joint venture between Credit Suisse and Founder Securities.
David Gledhill*Chief Information OfficerDavid brings with him over 25 years of experience in the financial services industry and has spent over 20 years in Asia. Prior to joining DBS in 2008, he worked 20 years at JP Morgan, holding senior regional positions in Technology & Operations.
David manages about 10,000 professionals across the region and is focused on strengthening the bank’s technology and infrastructure platform to drive greater resilience, organisational flexibility and innovation. David is a director of Singapore Clearing House Pte Ltd and a member of IBM Advisory Board, as well as a member of National Super Computing Centre Steering
Committee. He is also Board Advisor to Singapore Management University (SMU) School of Information Systems.
Lam Chee KinLegal, Compliance & SecretariatChee Kin is Group Head of Legal, Compliance and Secretariat and has upwards of 20 years’ experience in financial services. Prior to joining DBS, he held various roles in Standard Chartered Bank, JPMorgan Chase, Rajah & Tann and Allen & Gledhill. Chee Kin also serves on the Disciplinary Committee of SGX, Advisory Panel to the NUS Centre for Banking and Finance Law, and Data Protection Advisory Committee of Singapore. In 2015, Chee Kin was recognised as a Distinguished Fellow by the Institute of Banking and Finance in the field of compliance.
Lee Yan HongHuman Resources With more than 25 years of human resources experience in a diverse range of industries, Yan Hong is responsible for driving the strategic people agenda of DBS. Prior to joining DBS in 2011, Yan Hong was Citigroup’s Managing Director of Human Resources, Singapore. She also worked at General Motors and Hewlett Packard previously.
Sim S Lim*SingaporeSim is the first DBS country head with dedicated oversight for Singapore. He is responsible for helping the bank deliver greater synergy and value across the Singapore franchise. He is also Chairman of DBS Vickers Securities Holdings Pte Ltd. Sim’s 34 years of banking experience spans Asia, North America and the Middle East.
Prior to joining DBS, Sim was the President and CEO of Nikko Citigroup Ltd. Sim is Chairman of the Singapore Land Authority and Vice Chairman, ASEAN Business Group, Singapore Business Federation. He sits on the board of Nikko Asset Management Co., Ltd in Japan, ST Engineering and ST Aerospace. He also serves on the Board of Governors for Nanyang Polytechnic.
Group Management Committee

200 | DBS Annual Report 2016
Andrew Ng*Treasury & MarketsAndrew joined DBS in 2000 and has over 31 years of experience in the treasury business. Prior to joining DBS, he was Executive Director at Canadian Imperial Bank of Commerce (CIBC) from 1995 to 1999. He set up CIBC’s trading platform and derivative capabilities on Asian currencies. Between 1986 and 1995, Andrew was Head of North Asia Trading and Treasurer of Chase Manhattan Bank in Taipei. He is currently President of ACI Singapore – The Financial Markets Association and Chairman of ASIFMA (Asia Securities Industry & Financial Markets Association).
Jimmy NgAuditJimmy is the Head of Audit, responsible for providing assurance to the Board, senior management and regulators on the adequacy and effectiveness of the Group’s risk and control governance processes. He plays a key role integrating the three lines of defence, through the innovative use of technology in strengthening the bank’s control environment, risk management and governance process.
Jimmy has over 20 years of banking experience in leadership roles across various functions, including technology & operations, risk management, product control and audit. Prior to DBS, his career spanned the globe in multinational corporations such as Morgan Guaranty Trust Company of New York, ABN Amro Bank and Royal Bank of Scotland, across Asia and Europe, including London and Amsterdam.
Karen NguiStrategic Marketing & Communications Karen is responsible for corporate communications, brand management, strategic marketing and corporate social responsibility. She has over 25 years of experience in corporate branding, marketing and communications for financial institutions. Prior to joining DBS, she was Global Head of Brand Management and Strategic Marketing for Standard Chartered Bank.
Sebastian Paredes*Hong KongSebastian is Chief Executive Officer of DBS Bank (Hong Kong) and also Chairman of the Board Risk Management Committee and Non-Executive Director of DBS Bank
(China). An Ecuadorian citizen and a banker for over 25 years, Sebastian has a strong track record in building franchises across multiple markets. Prior to joining DBS, Sebastian was President Director of P.T. Bank Danamon, Indonesia, from 2005 to 2010. Prior to that, he spent 20 years at Citigroup, as Country Head of Ecuador, Honduras, Turkey and Israel and CEO of Sub-Saharan Africa.
Elbert Pattijn*Chief Risk OfficerElbert joined DBS in 2007 as Head of Specialised Corporate and Investment Banking, responsible for DBS’ corporate and investment banking activities in the region. He was appointed Chief Risk Officer in 2008. Prior to this, he was Head of Debt Products Origination, Asia for ING Bank, where he was in charge of overseeing the Debt Capital Markets, Securitisation and Syndicated Lending product groups. Previously, Elbert held progressively senior positions at Barclays Bank, ABN Amro and ING Group. A Dutch national, Elbert holds a Master of Law from the University of Leiden in the Netherlands.
Shee Tse KoonStrategy & PlanningTse Koon has 22 years of experience in the banking industry. He started his career at Standard Chartered Bank and has held senior positions in a diverse range of roles across various front and back office functions. He has worked in several countries in Asia, the Middle East and the United Kingdom. Prior to joining DBS, he was CEO of Standard Chartered in Indonesia. Previous to that, he was Head of Governance (Europe, Middle East, Africa & Americas) and also Senior Executive Officer (Standard Chartered, Dubai International Financial Centre), based in the United Arab Emirates; as well as Chief Information Officer and Head of Technology & Operations for Standard Chartered Bank in Singapore.
Surojit ShomeIndiaSurojit is the country head of DBS India. He joined DBS Bank in April 2015. Surojit has more than 30 years of banking experience across corporate and investment banking, capital markets as well as consumer banking since graduating from Xavier School of Management (XLRI) Jamshedpur in 1986. Before he joined DBS, he was CEO of Rabobank in India. Prior to that, he worked for more than 19 years at Citibank before moving to Lehman Brothers and later Nomura Securities.
Paulus SutisnaIndonesiaPaulus is President Director of P.T. Bank DBS Indonesia and responsible for driving business growth in Indonesia. Prior to that, he was HSBC Indonesia’s head of client management for global banking and co-head of cash management. Paulus also spent 23 years in various functions in Citibank, including heading the multinational franchise in Indonesia.
Tan Su Shan*Consumer Banking/ Wealth ManagementSu Shan is responsible for leading DBS’ regional wealth management and consumer banking business. Prior to joining DBS in 2010, Su Shan was Morgan Stanley’s Head of Private Wealth Management for Southeast Asia. She has also worked at Citi Private Bank, responsible for Singapore, Malaysia and Brunei. In October 2014, Su Shan became the first Singaporean to be recognised as the world’s “Best Leader in Private Banking” by PWM and The Banker, leading wealth publications by the Financial Times Group.
Jeanette Wong*Institutional BankingA seasoned banker with over 30 years of experience, Jeanette oversees DBS’ institutional banking group, which includes corporate banking and global transaction services. She was CFO of DBS between 2003 and 2008. Prior to this, Jeanette was at JP Morgan for 16 years, responsible for regional businesses in FX, Fixed Income and Emerging Markets. Jeanette is a Director of DBS Bank China and Chairperson of DBS Bank Taiwan. She is a member of the advisory boards of NUS Business School Management and the University of Chicago Booth School of Business. She also sits on the board of the Singapore International Arbitration Centre, is a member of the Securities Industry Council and is Singapore’s alternate APEC Business Advisory Council (ABAC) member.
Those marked by * are also in the Group Executive Committee.

| 201
DBS Bank Ltd (“DBS Bank”)12 Marina BoulevardMarina Bay Financial Centre Tower 3Singapore 018982Tel: (65) 6878 8888100% owned by DBS Group Holdings Ltd
AXS Pte Ltd61 Mohamed Sultan Road#01-11 Sultan LinkSingapore 239001Tel: (65) 6560 2727Fax: (65) 6636 455026.41% owned by DBS Bank and 59.77% owned by Primefield Company Pte Ltd, a wholly-owned subsidiary of DBS Bank
Central Boulevard Development Pte. Ltd.8 Marina Boulevard #04-01 Marina Bay Financial Centre Tower 1Singapore 01898133% owned by Heedum Pte. Ltd., a wholly-owned subsidiary of DBS Bank
Changsheng Fund Management Company Limited21F Building A, Chengjian Plaza18 Beitaipingzhuang RoadHaidian District, Beijing 100088People’s Republic of ChinaTel: (86 10) 8201 9988Fax: (86 10) 8225 598833% owned by DBS Bank
DBS Asia Capital Limited 17th Floor, The Center99 Queen’s Road CentralHong KongTel: (852) 3668 1148Fax: (852) 2868 0250100% owned by DBS Bank
DBS Asia Hub 2 Private Limited15th Floor, Tower 2.1 TSI Waverock IT/ITES SEZ Nanakramguda, Gachibowli Serilingampally Mandal, Ranga Reddy DistrictHyderabad - 500008Telangana, IndiaTel: (91 40) 6752 2222100% owned by DBS Bank
DBS Bank (China) LimitedUnits 1301 & 1801 DBS Bank Tower1318 Lujiazui Ring RoadPudong New Area, Shanghai 200120People’s Republic of ChinaTel: (86 21) 3896 8888Fax: (86 21) 3896 8989100% owned by DBS Bank
DBS Bank (Hong Kong) Limited 11th Floor, The Center99 Queen’s Road CentralHong KongTel: (852) 3668 0808 Fax: (852) 2167 8222100% owned by DBS Diamond Holdings Ltd, a wholly-owned subsidiary of DBS Bank
DBS Bank (Taiwan) Ltd15th, 16th, 17th Floor No. 32 & 36 Songren RoadXinyi District, 110 Taipei CityTaiwan, R.O.C.Tel: (886 2) 6612 9889Fax: (886 2) 6612 9285100% owned by DBS Bank
DBS Compass Limited11th Floor, One Island East18 Westlands Road, Island EastHong KongTel: (852) 2290 8888Fax: (852) 2893 0410100% owned by DBS Bank (Hong Kong) Limited
DBS Nominees (Private) Limited10 Toh Guan Road, Level 4BDBS Asia GatewaySingapore 608838Tel: (65) 6878 8888Fax: (65) 6338 8936100% owned by DBS Bank
DBS Securities (Japan) Company Limited15th Floor, Otemahi First Square East Tower1-5-1, Otemachi, Chiyoda-ku, TokyoJapanTel: (81 3) 3213 4660Fax: (81 3) 3213 4415
DBS Trustee Limited 12 Marina BoulevardMarina Bay Financial Centre Tower 3Singapore 018982Tel: (65) 6878 8888Fax: (65) 6878 3977100% owned by DBS Bank
DBS Vickers Securities (Singapore) Pte Ltd 12 Marina Boulevard Level 3Marina Bay Financial Centre Tower 3Singapore 018982Tel: (65) 6327 2288Email: [email protected]% owned by DBS Vickers Securities Holdings Pte Ltd, a wholly-owned subsidiary of DBS Bank.
DBSN Services Pte. Ltd. 10 Toh Guan Road, Level 4BDBS Asia GatewaySingapore 608838Tel: (65) 6878 8888Fax: (65) 6338 8936100% owned by DBS Bank
Hwang Capital (Malaysia) Berhad Level 8, Wisma Sri Pinang60 Green Hall, 10200 PenangMalaysiaTel: (604) 263 6108Fax: (604) 263 62064.15% owned by DBS Bank and 23.51% owned by DBS Vickers Securities (Malaysia) Pte Ltd, an indirect wholly-owned subsidiary of DBS Bank
Network For Electronic Transfers (Singapore) Pte Ltd298 Tiong Bahru Road, #06-01Central PlazaSingapore 168730Tel: (65) 6272 0533/6274 1212Fax: (65) 6272 2334Email: [email protected]% owned by DBS Bank PT Bank DBS IndonesiaDBS Bank Tower, Lobby 32nd to 37th Floor, Ciputra World 1Jalan Prof. Dr. Satrio Kav. 3-5Jakarta 12940IndonesiaTel: (62 21) 2988 5000Fax: (62 21) 2988 500599% owned by DBS Bank
The Islamic Bank of Asia Limited12 Marina Boulevard #15-03Marina Bay Financial Centre Tower 3 Singapore 018982Tel: (65) 6878 5522Fax: (65) 6878 550050% owned by DBS Bank
Main subsidiaries and associated companies
Main subsidiaries and associated companies

202 | DBS Annual Report 2016
International banking offices
AustraliaDBS Bank Australia BranchSuite 1901, Level 19, Chifley Tower2 Chifley Square, Sydney NSW 2000AustraliaTel: (61 2) 8823 9300Fax: (61 2) 8823 9301
ChinaDBS Bank (China) LimitedUnits 1301 – 1801 DBS Bank Tower1318 Lujiazui Ring RoadPudong New Area, Shanghai 200120People’s Republic of ChinaTel: (86 21) 3896 8888Fax: (86 21) 3896 8989
Hong KongDBS Bank (Hong Kong) Limited11th Floor, The Center99 Queen’s Road CentralHong KongTel: (852) 3668 0808Fax: (852) 2167 8222
DBS Bank Hong Kong Branch18th Floor, The Center99 Queen’s Road CentralHong KongTel: (852) 3668 1900Fax: (852) 2596 0577
IndiaDBS Bank IndiaFort House, 3rd Floor221, Dr. D.N. Road, FortMumbai 400001, IndiaTel: (91 22) 6638 8888Fax: (91 22) 6638 8899
IndonesiaPT Bank DBS IndonesiaDBS Bank Tower, Lobby, 32nd – 37th FloorCiputra World 1Jalan Prof. Dr. Satrio Kav 3-5Jakarta 12940, IndonesiaTel: (62 21) 2988 5000Fax: (62 21) 2988 5005
JapanDBS Bank Tokyo BranchOtemachi First Square East Tower 15F5-1, Otemachi 1-chome,Chiyoda-ku, Tokyo 100-0004Tel: (81 3) 3213 4411Fax: (81 3) 3213 4415
Korea DBS Bank Seoul Branch18th Floor, Seoul Finance Center136 Sejong-daero Jung-GuSeoul Republic of Korea 04520Tel: (822) 6322 2660Fax: (822) 6322 2670
MacauDBS Bank (Hong Kong) Limited, Macau BranchNos 5 a 7E da Rua de Santa Clara, Edif, RibelroLoja C e D., MacauTel: (853) 2832 9338Fax: (853) 2832 3711
MalaysiaDBS Bank Kuala Lumpur Representative Office#08-01, Menara Keck Seng203 Jalan Bukit Bintang55100 Kuala Lumpur, MalaysiaTel: (60 3) 2116 3888Fax: (60 3) 2116 3901
DBS Bank Labuan BranchLevel 10 (A) Main Office TowerFinancial Park LabuanJalan Merdeka87000 F.T. Labuan, MalaysiaTel: (60 87) 595 500Fax: (60 87) 423 376

| 203International banking offices
MyanmarDBS Bank Yangon Representative OfficeUnit 1002 Sakura Tower, Level 10339 Bogyoke Aung San Road, Kyauktada TownshipYangon, MyanmarTel: (95 1) 255 299Fax: (95 1) 255 239
The PhilippinesDBS Bank Manila Representative Office22F, The Enterprise Center, Tower 1Ayala Avenue corner Paseo de RoxasMakati CityTel: (632) 869 3876Fax: (632) 750 2144
Taiwan DBS Bank (Taiwan) Limited15F-17F, No36Songren RoadXinyi DistrictTaipei City 110 Taiwan R.O.CTel: (886 2) 6612 9889Fax: (886 2) 6612 9285
ThailandDBS Bank Bangkok Representative Office989 Siam Piwat Tower Building 15th FloorRama 1 Road, PathumwanBangkok 10330, ThailandTel: (66 2) 658 1400-1Fax: (66 2) 658 1402
United Arab EmiratesDBS Bank Ltd (DIFC Branch)Suite 5, 3rd Floor, Building 3Gate Precinct, DIFCP.O. Box 506538Dubai, UAETel: (971) 4364 1800Fax: (971) 4364 1801
United KingdomDBS Bank London Branch4th Floor, Paternoster House65 St Paul’s ChurchyardLondon EC4M 8AB, UKTel: (44 207) 489 6550Fax: (44 207) 489 5850
United States of AmericaDBS Bank Los Angeles Representative Office725 South Figueroa Street, Suite 2000Los Angeles, CA 90017 USATel: (1 213) 627 0222Fax: (1 213) 627 0228
VietnamDBS Bank Hanoi Representative OfficeRoom 140414th Floor, Pacific Place83B Ly Thuong Kiet StreetHanoi, VietnamTel: (84 4) 3946 1688Fax: (84 4) 3946 1689
DBS Bank Ho Chi Minh City Branch11th floor, Saigon Centre65 Le Loi Boulevard, District 1Ho Chi Minh City, VietnamTel: (84 8) 3914 7888Fax: (84 8) 3914 4488

World’s Best Digital BankEuromoney
Digital Distribution, GlobalEfma Accenture Innovation Awards
Safest Bank, AsiaGlobal Finance
Best Bank in Asia/Pacific IDC Financial Insights Innovation Awards
Asia’s Best BankEuromoney
Best Retail Bank in Asia PacificThe Asian Banker
Best Wealth Manager, AsiaThe Asset
Trailblazer of the Year, Asia Retail Banker International
Awards and accolades won
Best Asian Investment Bank FinanceAsia
Best Overall Bank for Cash Management, Asia Pacific Global Finance
Best Regional Supply Chain Finance Bank, AsiaThe Banker
204 | DBS Annual Report 2016

| 205Awards and accolades won
Enterprise Innovator, AsiaEnterprise Innovation Awards
Best Digital Bank, ASEANAlpha Southeast Asia
Best Digital System/Service Initiative, GlobalBanking Technology Awards
Best Private Bank for Innovation, GlobalPWM/The Banker
Best Asian Private BankFinanceAsia
Most Valuable Banking Brand, ASEANBrand Finance Banking 500
Excellence in SME Banking, Asia Retail Banker International
Leadership in Customer Experience, AsiaCustomer Experience in Financial Services Asia Awards
Best Transaction Bank in Asia PacificThe Banker
Regional Best Employer, AsiaAon Hewitt
Best CSR, AsiaCorporate Governance Asia
Best FX Provider, SEAGlobal Finance

206 | DBS Annual Report 2016
2012 2013 2014 2015 2016
Share Price (SGD)High 14.99 17.90 20.60 21.43 18.32Low 11.70 14.35 15.66 16.13 13.02Close 14.84 17.10 20.60 16.69 17.34Average 13.98 16.19 17.62 19.14 15.44
Per Ordinary ShareGross dividend yield (%) 4.0 3.6 3.3 3.1 3.9 Price-to-earning ratio (number of times)(1) 10.1 11.3 11.4 11.2 9.3 Price-to-book ratio (number of times) 1.1 1.2 1.2 1.2 0.9
(1) Earnings exclude one-time items and goodwill charges
Share price
25
20
15
10
5
02012 2013 2014 2015 2016 2017

| 207Financial calendar
Financial calendar
20163 May2016 First Quarter Results
20 JunePayment date of Final Dividends on Ordinary Shares for the financial year ended 31 December 2015
8 August2016 Second Quarter Results
29 SeptemberPayment date of Interim Dividends on Ordinary Shares for the six months ended 30 June 2016
31 October2016 Third Quarter Results
31 DecemberFinancial Year End
201716 February2016 Full Year Results
27 AprilAnnual General Meeting
2 May2017 First Quarter Results
JuneProposed payment of Final Dividends on Ordinary Shares for the financial year ended 31 December 2016
4 August2017 Second Quarter Results
6 November2017 Third Quarter Results
2018February2017 Full Year Results

208 | DBS Annual Report 2016
Shareholding statisticsAs at 28 February 2017
1. Class of Shares – Ordinary shares Voting Rights – One vote per share Total number of issued ordinary shares – 2,542,658,385 (excluding treasury shares) Treasury Shares – 6,303,700 (representing 0.248% of the total number of issued ordinary shares, excluding treasury shares)
No. of No. of Size of Shareholdings Shareholders % Shares %*
1 - 99 5,257 9.03 202,866 0.01 100 - 1,000 18,724 32.17 11,453,810 0.45 1,001 - 10,000 29,401 50.52 93,808,246 3.69 10,001 - 1,000,000 4,786 8.23 158,731,048 6.24 1,000,001 and above 29 0.05 2,278,462,415 89.61
Total 58,197 100.00 2,542,658,385 100.00
Location of Shareholders Singapore 55,111 94.70 2,523,233,856 99.23 Malaysia 1,902 3.27 13,164,733 0.52 Overseas 1,184 2.03 6,259,796 0.25
Total 58,197 100.00 2,542,658,385 100.00
Twenty largest shareholders (as shown in the register of members and depository register)
No. of Name of Shareholders Shareholdings %*
1 CITIBANK NOMINEES SINGAPORE PTE LTD 508,157,126 19.99 2 MAJU HOLDINGS PTE LTD 458,899,869 18.05 3 DBS NOMINEES PTE LTD 386,196,329 15.19 4 TEMASEK HOLDINGS (PRIVATE) LTD 284,145,301 11.18 5 DBSN SERVICES PTE LTD 244,851,872 9.63 6 HSBC (SINGAPORE) NOMINEES PTE LTD 164,547,907 6.47 7 UNITED OVERSEAS BANK NOMINEES PTE LTD 63,140,475 2.48 8 RAFFLES NOMINEES (PTE) LTD 47,021,255 1.85 9 BNP PARIBAS SECURITIES SERVICES 33,504,104 1.32 10 LEE PINEAPPLE COMPANY PTE LTD 19,450,000 0.76 11 DB NOMINEES (S) PTE LTD 13,723,996 0.54 12 LEE FOUNDATION 10,930,886 0.43 13 DBS VICKERS SECURITIES (S) PTE LTD 6,916,340 0.27 14 BNP PARIBAS NOMINEES SINGAPORE PTE LTD 6,522,369 0.26 15 OCBC NOMINEES SINGAPORE PTE LTD 3,809,739 0.15 16 OCBC SECURITIES PRIVATE LTD 3,377,515 0.13 17 MORGAN STANLEY ASIA (SINGAPORE) SECURITIES PTE LTD 3,180,898 0.13 18 UOB KAY HIAN PTE LTD 3,047,959 0.12 19 PHILLIP SECURITIES PTE LTD 2,098,789 0.08 20 SOCIETE GENERALE SINGAPORE BRANCH 2,092,939 0.08
TOTAL 2,265,615,668 89.11
* Percentage is calculated based on the total number of issued ordinary shares, excluding treasury shares
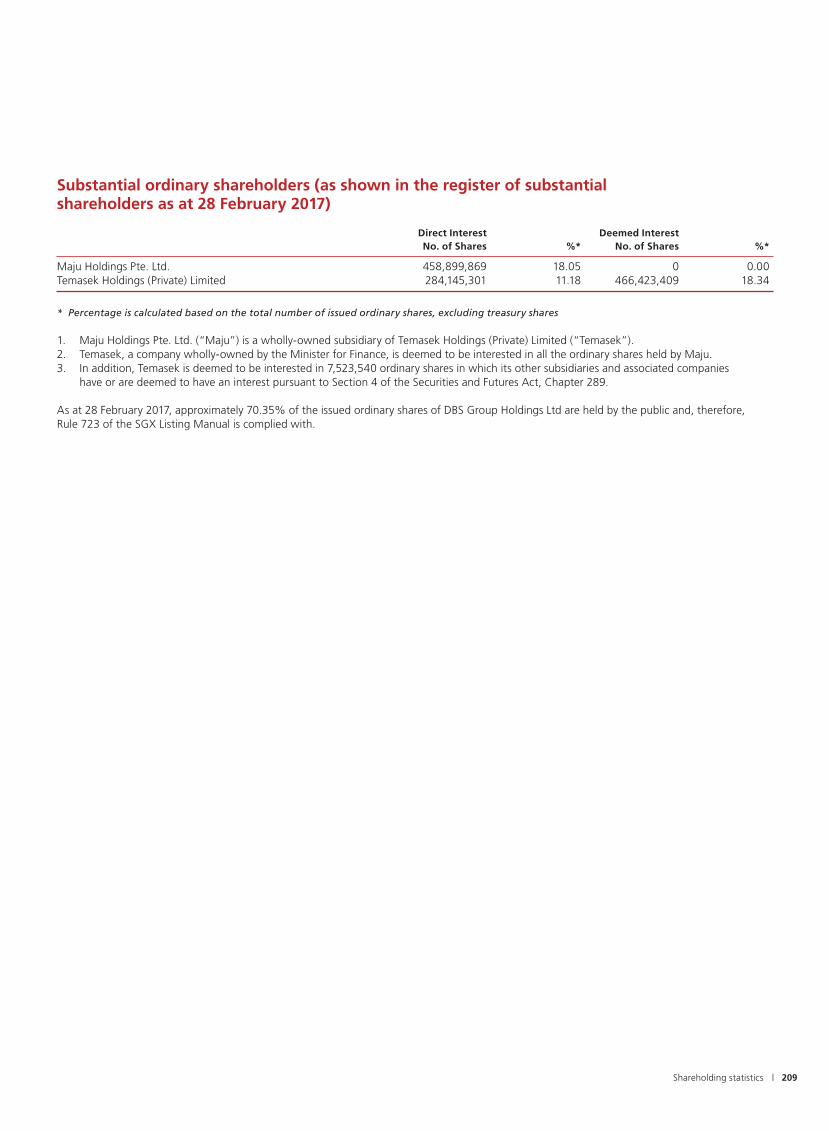
| 209Shareholding statistics
Substantial ordinary shareholders (as shown in the register of substantial shareholders as at 28 February 2017) Direct Interest Deemed Interest No. of Shares %* No. of Shares %*
Maju Holdings Pte. Ltd. 458,899,869 18.05 0 0.00Temasek Holdings (Private) Limited 284,145,301 11.18 466,423,409 18.34
* Percentage is calculated based on the total number of issued ordinary shares, excluding treasury shares
1. Maju Holdings Pte. Ltd. (“Maju”) is a wholly-owned subsidiary of Temasek Holdings (Private) Limited (“Temasek”).2. Temasek, a company wholly-owned by the Minister for Finance, is deemed to be interested in all the ordinary shares held by Maju.3. In addition, Temasek is deemed to be interested in 7,523,540 ordinary shares in which its other subsidiaries and associated companies
have or are deemed to have an interest pursuant to Section 4 of the Securities and Futures Act, Chapter 289. As at 28 February 2017, approximately 70.35% of the issued ordinary shares of DBS Group Holdings Ltd are held by the public and, therefore, Rule 723 of the SGX Listing Manual is complied with.

210 | DBS Annual Report 2016
Routine Business Ordinary Resolution No.
To receive and adopt the Directors’ Statement and Audited Financial Statements for the year ended 31 December 2016 and the Auditor’s Report thereon.
Resolution 1
To declare a one-tier tax exempt Final Dividend of 30 cents per ordinary share, for the year ended 31 December 2016. [2015: Final Dividend of 30 cents per ordinary share, one-tier tax exempt]
Resolution 2
To approve the amount of SGD 3,588,490 proposed as Directors’ remuneration for the year ended 31 December 2016. [2015: SGD 3,688,541]
Resolution 3
To re-appoint Messrs PricewaterhouseCoopers LLP as Auditor of the Company and to authorise the Directors to fix its remuneration.
Resolution 4
To re-elect the following Directors, who are retiring under article 99 of the Company’s Constitution and who, being eligible, offer themselves for re-election:
(a) Dr Bart Broadman (b) Mr Ho Tian Yee (c) Mrs Ow Foong Pheng
Key information on Dr Broadman, Mr Ho and Mrs Ow can be found on pages 195, 196 and 198 respectively of the 2016 Annual Report.
Resolution 5Resolution 6Resolution 7
Special Business Ordinary Resolution No.
To consider and, if thought fit, to pass the following Resolutions which will be proposed as ORDINARY RESOLUTIONS:
That authority be and is hereby given to the Directors of the Company to offer and grant awards in accordance with the provisions of the DBSH Share Plan and to allot and issue from time to time such number of ordinary shares of the Company (“DBSH Ordinary Shares”) as may be required to be issued pursuant to the vesting of awards under the DBSH Share Plan, PROVIDED ALWAYS THAT:
(a) the aggregate number of new DBSH Ordinary Shares (i) issued and/or to be issued pursuant to the DBSH Share Plan; and (ii) issued pursuant to the DBSH Share Option Plan, shall not exceed 5% of the total number of issued shares (excluding treasury shares) of the Company from time to time; and
(b) the aggregate number of new DBSH Ordinary Shares under awards to be granted pursuant to the DBSH Share Plan during the period commencing from the date of this Annual General Meeting of the Company and ending on the date of the next Annual General Meeting of the Company or the date by which the next Annual General Meeting of the Company is required by law to be held, whichever is the earlier, shall not exceed 2% of the total number of issued shares (excluding treasury shares) of the Company from time to time.
Resolution 8
DBS Group Holdings Ltd(Incorporated in the Republic of Singapore)Company Registration No.: 199901152M
To: All shareholders of DBS Group Holdings Ltd NOTICE IS HEREBY GIVEN that the Eighteenth Annual General Meeting of the shareholders of DBS Group Holdings Ltd (the “Company” or “DBSH”) will be held at Marina Bay Sands Expo and Convention Centre, Level 4, Roselle and Simpor Ballrooms, 10 Bayfront Avenue, Singapore 018956 on Thursday, 27 April 2017 at 2.00 pm to transact the following business:
Notice of Annual General Meeting
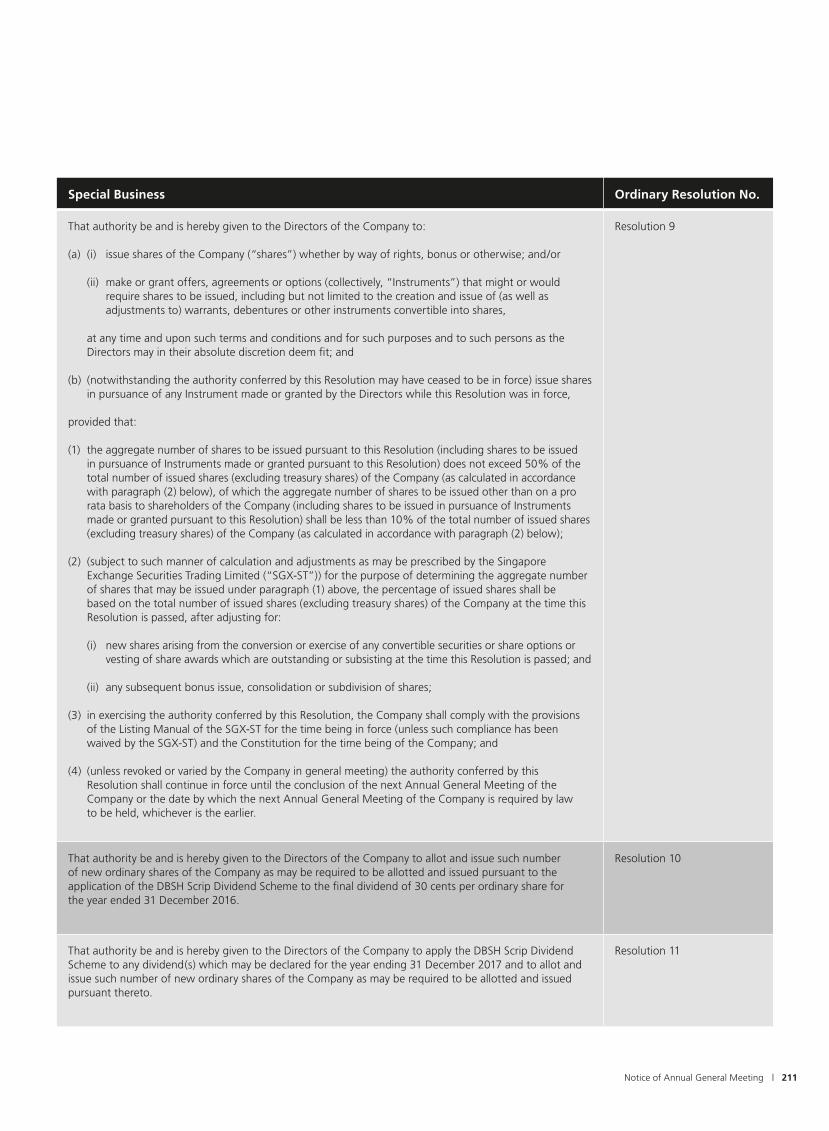
| 211Notice of Annual General Meeting
Special Business Ordinary Resolution No.
That authority be and is hereby given to the Directors of the Company to:
(a) (i) issue shares of the Company (“shares”) whether by way of rights, bonus or otherwise; and/or
(ii) make or grant offers, agreements or options (collectively, “Instruments”) that might or would require shares to be issued, including but not limited to the creation and issue of (as well as adjustments to) warrants, debentures or other instruments convertible into shares,
at any time and upon such terms and conditions and for such purposes and to such persons as the Directors may in their absolute discretion deem fit; and
(b) (notwithstanding the authority conferred by this Resolution may have ceased to be in force) issue shares in pursuance of any Instrument made or granted by the Directors while this Resolution was in force,
provided that:
(1) the aggregate number of shares to be issued pursuant to this Resolution (including shares to be issued in pursuance of Instruments made or granted pursuant to this Resolution) does not exceed 50% of the total number of issued shares (excluding treasury shares) of the Company (as calculated in accordance with paragraph (2) below), of which the aggregate number of shares to be issued other than on a pro rata basis to shareholders of the Company (including shares to be issued in pursuance of Instruments made or granted pursuant to this Resolution) shall be less than 10% of the total number of issued shares (excluding treasury shares) of the Company (as calculated in accordance with paragraph (2) below);
(2) (subject to such manner of calculation and adjustments as may be prescribed by the Singapore Exchange Securities Trading Limited (“SGX-ST”)) for the purpose of determining the aggregate number of shares that may be issued under paragraph (1) above, the percentage of issued shares shall be based on the total number of issued shares (excluding treasury shares) of the Company at the time this Resolution is passed, after adjusting for:
(i) new shares arising from the conversion or exercise of any convertible securities or share options or vesting of share awards which are outstanding or subsisting at the time this Resolution is passed; and
(ii) any subsequent bonus issue, consolidation or subdivision of shares;
(3) in exercising the authority conferred by this Resolution, the Company shall comply with the provisions of the Listing Manual of the SGX-ST for the time being in force (unless such compliance has been waived by the SGX-ST) and the Constitution for the time being of the Company; and
(4) (unless revoked or varied by the Company in general meeting) the authority conferred by this Resolution shall continue in force until the conclusion of the next Annual General Meeting of the Company or the date by which the next Annual General Meeting of the Company is required by law to be held, whichever is the earlier.
Resolution 9
That authority be and is hereby given to the Directors of the Company to allot and issue such number of new ordinary shares of the Company as may be required to be allotted and issued pursuant to the application of the DBSH Scrip Dividend Scheme to the final dividend of 30 cents per ordinary share for the year ended 31 December 2016.
Resolution 10
That authority be and is hereby given to the Directors of the Company to apply the DBSH Scrip Dividend Scheme to any dividend(s) which may be declared for the year ending 31 December 2017 and to allot and issue such number of new ordinary shares of the Company as may be required to be allotted and issued pursuant thereto.
Resolution 11

212 | DBS Annual Report 2016
Special Business Ordinary Resolution No.
That:
(a) for the purposes of Sections 76C and 76E of the Companies Act, Chapter 50 (the “Companies Act”), the exercise by the Directors of the Company of all the powers of the Company to purchase or otherwise acquire issued ordinary shares of the Company (“Ordinary Shares”) not exceeding in aggregate the Maximum Percentage (as hereafter defined), at such price or prices as may be determined by the Directors from time to time up to the Maximum Price (as hereafter defined), whether by way of:
(i) market purchase(s) on the Singapore Exchange Securities Trading Limited (“SGX-ST”) and/or any other securities exchange on which the Ordinary Shares may for the time being be listed and quoted (“Other Exchange”); and/or
(ii) off-market purchase(s) (if effected otherwise than on the SGX-ST or, as the case may be, Other Exchange) in accordance with any equal access scheme(s) as may be determined or formulated by the Directors as they consider fit, which scheme(s) shall satisfy all the conditions prescribed by the Companies Act,
and otherwise in accordance with all other laws and regulations and rules of the SGX-ST or, as the case may be, Other Exchange as may for the time being be applicable, be and is hereby authorised and approved generally and unconditionally (the “Share Purchase Mandate”);
(b) unless varied or revoked by the Company in general meeting, the authority conferred on the Directors of the Company pursuant to the Share Purchase Mandate may be exercised by the Directors at any time and from time to time during the period commencing from the date of the passing of this Resolution and expiring on the earliest of:
(i) the date on which the next Annual General Meeting of the Company is held;
(ii) the date by which the next Annual General Meeting of the Company is required by law to be held; and
(iii) the date on which purchases and acquisitions of Ordinary Shares pursuant to the Share Purchase Mandate are carried out to the full extent mandated;
(c) in this Resolution:
“Average Closing Price” means the average of the closing market prices of an Ordinary Share over the last five market days on which transactions in the Ordinary Shares on the SGX-ST or, as the case may be, Other Exchange were recorded, immediately preceding the date of the market purchase by the Company or, as the case may be, the date of the making of the offer pursuant to the off-market purchase, and deemed to be adjusted, in accordance with the listing rules of the SGX-ST, for any corporate action that occurs after the relevant five-day period;
“date of the making of the offer” means the date on which the Company announces its intention to make an offer for the purchase or acquisition of Ordinary Shares from Shareholders, stating therein the purchase price (which shall not be more than the Maximum Price calculated on the basis set out below) for each Ordinary Share and the relevant terms of the equal access scheme for effecting the off-market purchase;
“Maximum Percentage” means that number of issued Ordinary Shares representing 1% of the issued Ordinary Shares of the Company as at the date of the passing of this Resolution (excluding any Ordinary Shares which are held as treasury shares as at that date); and
“Maximum Price” in relation to an Ordinary Share to be purchased or acquired, means the purchase price (excluding related brokerage, commission, applicable goods and services tax, stamp duties, clearance fees and other related expenses) which shall not exceed:
(i) in the case of a market purchase of an Ordinary Share, 105% of the Average Closing Price of the Ordinary Shares; and
(ii) in the case of an off-market purchase of an Ordinary Share, 105% of the Average Closing Price of the Ordinary Shares; and
Resolution 12

| 213Notice of Annual General Meeting
Notes:1. (a) A member of the Company who is not
a relevant intermediary is entitled to appoint not more than two proxies to attend, speak and vote at the Meeting. Where such member’s form of proxy appoints more than one proxy, the proportion of the shareholding concerned to be represented by each proxy shall be specified in the form of proxy.
(b) A member of the Company who is a relevant intermediary is entitled to appoint more than two proxies to attend, speak and vote at the Meeting, but each proxy must be appointed to exercise the rights attached to a different share or shares held by such member. Where such member’s form of proxy appoints more than two proxies, the number and class of shares in relation to which each proxy has been appointed shall be specified in the form of proxy.
“Relevant intermediary” has the meaning ascribed to it in Section 181 of the Companies Act, Chapter 50.
2. A member of the Company which is a corporation is entitled to appoint its authorised representative or proxy to vote on its behalf.
3. A proxy need not be a member of the Company.
4. The instrument appointing a proxy or proxies must be deposited at the office of the Company’s Share Registrar, Tricor Barbinder Share Registration Services (a division of Tricor Singapore Pte Ltd) at 80 Robinson Road, #11-02, Singapore 068898 at least 72 hours before the time for holding the Meeting.
Personal data privacy:By submitting an instrument appointing a proxy(ies) and/or representative(s) to attend, speak and vote at the Annual General Meeting and/or any adjournment thereof, a member of the Company (i) consents to the collection, use and disclosure of the
member’s personal data by the Company (or its agents or service providers) for the purpose of the processing, administration and analysis by the Company (or its agents or service providers) of proxies and representatives appointed for the Annual General Meeting (including any adjournment thereof) and the preparation and compilation of the attendance lists, minutes and other documents relating to the Annual General Meeting (including any adjournment thereof), and in order for the Company (or its agents or service providers) to comply with any applicable laws, listing rules, take-over rules, regulations and/or guidelines (collectively, the “Purposes”), (ii) warrants that where the member discloses the personal data of the member’s proxy(ies) and/or representative(s) to the Company (or its agents or service providers), the member has obtained the prior consent of such proxy(ies) and/or representative(s) for the collection, use and disclosure by the Company (or its agents or service providers) of the personal data of such proxy(ies) and/or representative(s) for the Purposes, and (iii) agrees to provide the Company with written evidence of such prior consent upon reasonable request.
Explanatory notes
Routine Business
Ordinary Resolution 2: Declaration of final dividend on ordinary sharesResolution 2 is to approve the declaration of a final dividend of 30 cents per ordinary share. Please refer to page 103 of the Capital Management and Planning section in the 2016 Annual Report for an explanation of DBSH’s dividend policy.
Ordinary Resolution 3: Directors’ remuneration for 2016Resolution 3 is to approve the payment of
an aggregate amount of SGD 3,588,490 as Directors’ remuneration for the non-executive Directors of the Company for the year ended 31 December 2016. If approved, each of the non-executive Directors (with the exception of Mrs Ow Foong Pheng) will receive 70% of his or her Directors’ fees in cash and 30% of his or her Directors’ fees in the form of share awards granted pursuant to the DBSH Share Plan. The share awards will not be subject to a vesting period, but will be subject to a selling moratorium whereby each non-executive Director will be required to hold the equivalent of one year’s basic retainer for the duration of his or her tenure as a Director, and for one year after the date he or she steps down as a Director. The actual number of shares to be awarded will be determined by reference to the volume-weighted average price of a share on the SGX-ST over the 10 trading days immediately following the date of the forthcoming 2017 Annual General Meeting, rounded down to the nearest share, and any residual balance will be paid in cash. The Director’s fees for Mrs Ow Foong Pheng will be paid in cash to a government agency, the Directorship & Consultancy Appointments Council. Please refer to pages 58 and 59 of the Corporate Governance Report in the 2016 Annual Report for more details on the non-executive Directors’ remuneration for 2016.
Ordinary Resolutions 5, 6 and 7: Re-election of Directors retiring under article 99 (a) Dr Bart Broadman, upon re-election
as a Director of the Company, will remain as a member of each of the Board Risk Management Committee and Compensation and Management Development Committee. Dr Broadman, who will have served as an independent Director beyond 9 years by the end of December 2017, will be re-designated as a non-executive and non- independent Director with effect from 17 December 2017.
By Order of the Board
Goh Peng Fong (Mr)Group Secretary DBS Group Holdings Ltd
29 March 2017Singapore
Special Business Ordinary Resolution No.
(d) the Directors of the Company and/or any of them be and are hereby authorised to complete and do all such acts and things (including executing such documents as may be required) as they and/or he may consider expedient or necessary to give effect to the transactions contemplated and/or authorised by this Resolution.

214 | DBS Annual Report 2016
(b) Mr Ho Tian Yee, upon re-election as a Director of the Company, will remain as a member of each of the Nominating Committee and Board Risk Management Committee. Mr Ho, who is the Chairman of Fullerton Fund Management Company Ltd. (“Fullerton”), was appointed as interim CEO of Fullerton in November 2016 after its then CEO left. As Fullerton is a wholly-owned subsidiary of Temasek Holdings (Private) Limited (a substantial shareholder of the Company), Mr Ho is considered non-independent of the substantial shareholder while he is acting as the interim CEO of Fullerton. Mr Ho is a non-executive Director and has no management or business relationships with the Company. The Nominating Committee will re-assess the independence status of Mr Ho when he ceases to be the interim CEO of Fullerton.
(c) Mrs Ow Foong Pheng, upon re-election as a Director of the Company, will remain as a member of each of the Audit Committee and Nominating Committee. Mrs Ow is considered non-independent of the substantial shareholder as she is a senior civil servant. Mrs Ow is a non-executive Director and has no management or business relationships with the Company.
Special Business
Ordinary Resolution 8: DBSH Share Plan Resolution 8 is to empower the Directors to offer and grant awards and to issue ordinary shares of the Company pursuant to the DBSH Share Plan, provided that: (a) the maximum number of ordinary shares which may be issued under the DBSH Share Plan and the DBSH Share Option Plan is limited to 5% of the total number of issued shares of the Company (excluding treasury shares) from time to time; and (b) the aggregate number of new ordinary shares under awards which may be granted pursuant to the DBSH Share Plan from this Annual General Meeting to the next Annual General Meeting shall not exceed 2% of the total number of issued shares of the Company (excluding treasury shares) from time to time. The DBSH Share Option Plan expired on 19 June 2009 and was not extended or replaced. There are no longer any options outstanding under the DBSH Share Option Plan.
Ordinary Resolution 9: Share Issue Mandate Resolution 9 is to empower the Directors to issue shares of the Company and to make
or grant instruments (such as warrants or debentures) convertible into shares, and to issue shares in pursuance of such instruments, up to a number not exceeding in total 50% of the total number of issued shares (excluding treasury shares) of the Company, of which the number of shares that may be issued other than on a pro rata basis to shareholders must be less than 10% of the total number of issued shares (excluding treasury shares). For the purpose of determining the aggregate number of shares that may be issued, the percentage of issued shares shall be based on the total number of issued shares (excluding treasury shares) of the Company at the time that Resolution 9 is passed, after adjusting for (a) new shares arising from the conversion or exercise of any convertible securities or share options or vesting of share awards which are outstanding or subsisting at the time that Resolution 9 is passed, and (b) any subsequent bonus issue, consolidation or subdivision of shares.
Ordinary Resolution 10: DBSH Scrip Dividend Scheme Resolution 10 is to empower the Directors to issue such number of new ordinary shares of the Company as may be required to be issued pursuant to the application of the DBSH Scrip Dividend Scheme (the “Scheme”) to the final dividend of 30 cents per ordinary share for the year ended 31 December 2016 (“FY2016”).
In the announcement dated 16 February 2017, the Company proposed that the Scheme would be applied to the final dividend for FY2016, subject to shareholder approval being obtained for the said final dividend for FY2016.
Ordinary Resolution 11: DBSH Scrip Dividend SchemeResolution 11 is to authorise the Directors to apply the Scheme to any dividend(s) which may be declared for the year ending 31 December 2017 (“FY2017”), and to empower the Directors to issue such number of new ordinary shares of the Company as may be required to be issued pursuant thereto. The authority conferred by this Resolution will lapse at the conclusion of the next Annual General Meeting of the Company or the date by which the next Annual General Meeting of the Company is required by law to be held, whichever is the earlier.
If Resolution 11 is passed at the Annual General Meeting, and if the Directors should decide to apply the Scheme to a dividend declared in respect of FY2017, the current intention is that no discount will be given
for the scrip shares. If the Directors decide not to apply the Scheme to a dividend for FY2017, such dividend will be paid in cash to shareholders in the usual way.
Ordinary Resolution 12: Proposed renewal of the Share Purchase MandateResolution 12 is to renew the mandate to allow the Company to purchase or otherwise acquire its issued ordinary shares, on the terms and subject to the conditions set out in the Resolution.
The Company intends to use its internal sources of funds to finance its purchase or acquisition of the ordinary shares of the Company (“Ordinary Shares”). The amount of financing required for the Company to purchase or acquire its Ordinary Shares, and the impact on the Company’s financial position, cannot be ascertained as at the date of this Notice as these will depend on whether the Ordinary Shares are purchased or acquired out of capital or profits, the number of Ordinary Shares purchased or acquired and the price at which such Ordinary Shares were purchased or acquired.
Based on the existing issued and paid-up Ordinary Shares as at 28 February 2017 (the “Latest Practicable Date”) and excluding any Ordinary Shares held in treasury, the purchase by the Company of 1% of its issued Ordinary Shares will result in the purchase or acquisition of 25,426,583 Ordinary Shares.
Assuming that the Company purchases or acquires 25,426,583 Ordinary Shares at the Maximum Price, in the case of both market and off-market purchases, of SGD 19.69 for one Ordinary Share (being the price equivalent to 5% above the average closing prices of the Ordinary Shares traded on the SGX-ST over the last five market days on which transactions were recorded immediately preceding the Latest Practicable Date), the maximum amount of funds required is approximately SGD 0.5 billion.
The financial effects of the purchase or acquisition of such Ordinary Shares by the Company pursuant to the proposed Share Purchase Mandate on the financial statements of the Group and the Company for the financial year ended 31 December 2016 based on these and other assumptions are set out in paragraph 2.7 of the Letter to Shareholders dated 29 March 2017 (the “Letter”).
Please refer to the Letter for further details.

DBS GROUP HOLDINGS LTD (Incorporated in the Republic of Singapore)Company Registration No.: 199901152M
Annual General Meeting
*I / We (NRIC / Passport / Co. Reg No. )
of
being an Ordinary Shareholder of DBS Group Holdings Ltd (the “Company”) hereby appoint
as *my/our proxy/proxies, to attend, speak and vote for *me/us and on *my/our behalf, at the Eighteenth Annual General Meeting of the Company, to be held at Marina Bay Sands Expo and Convention Centre, Level 4, Roselle and Simpor Ballrooms, 10 Bayfront Avenue, Singapore 018956 on Thursday, 27 April 2017 at 2.00 pm and at any adjournment thereof in the following manner:
If you wish to exercise all your votes For or Against, please tick with “ ” within the relevant box. Alternatively, please indicate the number of votes For or Against each resolution.
The proxy may vote or abstain as the proxy deems fit on any of the above resolutions if no voting instruction is specified, and on any other matter arising at the Annual General Meeting.
Voting will be conducted by poll.
Dated this day of 2017.
Signature or Common Seal of Shareholder
*and/or
Proxy form
IMPORTANT:1. Relevant intermediaries (as defined in Section 181 of the Companies Act, Chapter 50) may
appoint more than two proxies to attend, speak and vote at the Annual General Meeting. 2. This Proxy form is not valid for use and shall be ineffective for all intents and purposes
if used or purported to be used by CPF/SRS investors who hold ordinary shares through their CPF/SRS funds. CPF/SRS investors should contact their respective Agent Banks/SRS Operators if they have any queries regarding their appointment as proxies.
3. By submitting an instrument appointing a proxy(ies) and/or representative(s), the member accepts and agrees to the personal data privacy terms set out in the Notice of Annual General Meeting dated 29 March 2017.
Name Address NRIC/Passport number Proportion of shareholdings (%)
No. Ordinary Resolutions For Against
Routine Business
1 Adoption of Director’s Statement, audited Financial Statements and Auditor’s Report
2 Declaration of Final Dividend on Ordinary Shares
3 Approval of proposed Directors’ remuneration of SGD 3,588,490 for FY2016
4 Re-appointment of PricewaterhouseCoopers LLP as Auditor
5 Re-election of Dr Bart Broadman as a Director retiring under article 99
6 Re-election of Mr Ho Tian Yee as a Director retiring under article 99
7 Re-election of Mrs Ow Foong Pheng as a Director retiring under article 99
Special Business
8 Authority to grant awards and issue shares under the DBSH Share Plan
9 General authority to issue shares subject to limits
10 Authority to issue shares pursuant to the DBSH Scrip Dividend Scheme for the FY2016 Final Dividend
11 Authority to apply the DBSH Scrip Dividend Scheme to dividends for FY2017, and to issue shares pursuant thereto
12 Approval of the proposed renewal of the Share Purchase Mandate
IMPORTANT PLEASE READ NOTES OVERLEAF.* delete as appropriate
No. of Ordinary Shares held

Notes:1 Please insert the total number of ordinary shares (“Ordinary Shares”) held by you. If you have Ordinary Shares entered against your name in the
Depository Register (maintained by The Central Depository (Pte) Limited), you should insert that number of Ordinary Shares. If you have Ordinary Shares registered in your name in the Register of Members (maintained by or on behalf of the Company), you should insert that number of Ordinary Shares. If you have Ordinary Shares entered against your name in the Depository Register and Ordinary Shares registered in your name in the Register of Members, you should insert the aggregate number of Ordinary Shares.
2 (a) A member of the Company (“Member”) who is not a relevant intermediary is entitled to appoint not more than two proxies to attend, speak and vote at the Meeting. Where such Member’s form of proxy appoints more than one proxy, the proportion of the shareholding concerned to be represented by each proxy shall be specified in the form of proxy.
(b) A Member who is a relevant intermediary is entitled to appoint more than two proxies to attend, speak and vote at the Meeting, but each proxy must be appointed to exercise the rights attached to a different share or shares held by such Member. Where such Member’s form of proxy appoints more than two proxies, the number and class of shares in relation to which each proxy has been appointed shall be specified in the form of proxy.
“Relevant intermediary” has the meaning ascribed to it in Section 181 of the Companies Act, Chapter 50.
3 The Instrument appointing a proxy or proxies must be deposited at the office of the Company’s Share Registrar, Tricor Barbinder Share Registration Services (a division of Tricor Singapore Pte Ltd) at 80 Robinson Road, #11-02, Singapore 068898 at least 72 hours before the time for holding the Meeting.
4 The Instrument appointing a proxy or proxies must be under the hand of the appointer or of his attorney duly authorised in writing. Where the Instrument appointing a proxy or proxies is executed by a corporation, it must be executed either under its seal or under the hand of an officer or attorney duly authorised.
5 A corporation which is a Member may, in accordance with Section 179 of the Companies Act, Chapter 50, authorise by resolution of its directors or other governing body such person as it thinks fit to act as its representative at the Meeting.
6 The Company shall be entitled to reject the Instrument appointing a proxy or proxies if it is incomplete, improperly completed or illegible or where the true intentions of the appointer are not ascertainable from the instructions of the appointer specified in the Instrument appointing a proxy or proxies. In addition, in the case of Members whose Ordinary Shares are entered against their names in the Depository Register, the Company may reject any Instrument appointing a proxy or proxies lodged if such Members are not shown to have Ordinary Shares entered against their names in the Depository Register 72 hours before the time appointed for holding the Meeting as certified by The Central Depository (Pte) Limited to the Company.

Board of Directors
Peter SeahChairman
Piyush GuptaChief Executive OfficerBart BroadmanEuleen Goh Ho Tian YeeNihal Kaviratne CBEOw Foong Pheng Andre SekulicDanny Teoh
Audit Committee
Danny Teoh Chairman
Nihal Kaviratne CBEOw Foong PhengPeter SeahAndre Sekulic
Nominating Committee
Peter SeahChairman
Euleen Goh Ho Tian YeeOw Foong PhengDanny Teoh
Board Risk Management Committee
Euleen Goh Chairman
Bart BroadmanHo Tian YeeNihal Kaviratne CBEPeter Seah Danny Teoh
Board Executive Committee
Peter SeahChairman
Euleen GohPiyush Gupta
Compensation and Management Development Committee
Peter SeahChairman
Bart BroadmanEuleen Goh Andre Sekulic
Group Secretary
Goh Peng Fong
Group Executive Committee
Piyush GuptaChief Executive Officer
Chng Sok HuiChief Financial Officer
David GledhillChief Information Officer
Sim S LimSingapore
Andrew NgTreasury & Markets
Sebastian ParedesHong Kong
Elbert PattijnChief Risk Officer
Tan Su ShanConsumer Banking/ Wealth Management
Jeanette WongInstitutional Banking
Group Management Committee Includes the Group Executive Committee and the following:
Jerry ChenTaiwan
Eng-Kwok Seat MoeyCapital Markets
Neil GeChina
Lam Chee KinLegal, Compliance & Secretariat
Lee Yan HongHuman Resources
Jimmy NgAudit
Karen NguiStrategic Marketing & Communications
Shee Tse KoonStrategy & Planning
Surojit ShomeIndia
Paulus SutisnaIndonesia
Registrar
Tricor Barbinder Share Registration Services(a division of Tricor Singapore Pte. Ltd.)80 Robinson Road, #02-00Singapore 068898Tel: (65) 6236 3333Fax: (65) 6236 3405
Auditor
PricewaterhouseCoopers LLP8 Cross Street #17-00PwC BuildingSingapore 048424
Partner in charge of the Audit
Karen LoonAppointed on 29 April 2013 (DBS Group Holdings Ltd) and 29 April 2013 (DBS Bank Ltd.)
Registered Office
12 Marina BoulevardMarina Bay Financial Centre Tower 3, Singapore 018982Tel: (65) 6878 8888Website: www.dbs.com
Investor Relations
Email: [email protected]
Corporate Information

Asia’s Safest,Asia’s BestSafest Bank in Asia 2009 – 2016Global Finance
Asia’s Best Bank 2016Euromoney
facebook.com/dbs
12 Marina BoulevardMarina Bay Financial Centre Tower 3 Singapore 018982Tel: (65) 6878 8888 www.dbs.com
Co. Reg. No. 199901152M
twitter.com/dbsbank
Living, Breathing Asia