Embed Size (px)
Citation preview

DB RREEF Trustannual report 2007
www.global-reports.com

contents
highlights
building value 2
international reach 4
portfolio highlights 6
letter from the chair 8
chief executive offi cer’s report 10
our portfolio 14
FRONT COVER: Sydney aerial view featuring DB RREEF assets – 30 The Bond, Gateway, 45 Clarence Street, One Margaret Street, Governor Phillip Tower and Governor Macquarie Tower, Australia Square, 309–321 Kent Street
ABOVE: View from Governor Phillip Tower and Governor Macquarie Tower to Australia Square, Sydney NSW
DB RREEF Trust (ASX: DRT) comprising DB RREEF Diversified Trust ARSN 089 324 541 (DDF), DB RREEF Industrial Trust ARSN 090 879 137 (DIT), DB RREEF Office Trust ARSN 090 768 531 (DOT) and DB RREEF Operations Trust ARSN 110 521 223 (DRO). The DB RREEF group refers to the business as a whole and includes the Responsible Entity of each of the Trusts, DB RREEF Funds Management Limited ABN 24 060 920 783.
DB RREEF Trust is referred to as DB RREEF Trust. DB RREEF group is referred to as DB RREEF. DB RREEF Funds Management Limited is referred to as the Responsible Entity.
USD/AUD conversion rate US$0.8487 as at 30 June 2007. €/AUD conversion rate €0.6311 as at 30 June 2007. All amounts are in Australian dollars unless otherwise stated.
funds management report 30
about DB RREEF 33
corporate responsibility and sustainability 38
corporate governance statement 58
fi nancial reports 66
investor information 128
directory 132
www.global-reports.com
delivering solidperformance
and leveraging our
integrated platform
www.global-reports.com

2 DB RREEF Trust Annual Report 2007
building value
SeptemberStapling of DDF, DIT, DOT and DRO to form DB RREEF Trust.
Enters into $1.6 billion retail joint venture with the Westfield Group.
Acquires $1.0 billion US industrial portfolio.
DecemberSecures US$200 million debt private placement.
2004 2005
MarchCompletes 30 The Bond, Sydney NSW, a winner of over 30 design and sustainability awards including Australia’s first 5 Star ABGR energy rating.
JuneUnderwrites $99 million DRP.
Issues $204 million of RENTS securities.
SeptemberEnters New Zealand with the acquisition of a premium grade office tower in Auckland.
www.global-reports.com

DB RREEF Trust Annual Report 2007 3
FebruarySuccessfully completes $200 million MTN issue into Australian debt capital market.
Completes $100 million Coles Distribution Centre at Laverton North VIC.
AprilDevelopment application lodged for new premium office tower in Brisbane QLD.
JuneAcquires the first industrial asset under the Whirlpool investment program in Orlando, Florida USA.
2006
JuneWinner of the FMA Environmental Achievement Award.
Enters Europe with the acquisition of $120 million French industrial portfolio.
JulyAchieves Standard & Poor’s long-term corporate credit rating of BBB+.
Acquires additional land to expand Laverton North Industrial Estate VIC.
Completes $250 million MTN issue into Australian debt capital market.
AugustAnnounces $600 million international investment program for Whirlpool logistics facilities.
DecemberExpands into Germany with $244 million logistics property portfolio acquisition.
Secures 92 percent interest in Summit Oaks, California USA a $65 million suburban office development project.
2007
July 2007Acquires $190 million industrial portfolio and development options in San Antonio, Texas USA.
Stage 2 DA lodged for 42,000 square metre development of Space 1 Bligh û Sydney NSW.
August 2007Announces disposal of five retail properties to DWPF.
Announces 50 percent disposal of Coles chilled distribution centre to the AXA Mandate.
www.global-reports.com

4 DB RREEF Trust Annual Report 2007
delivering on
STRATEGYwith selected international
ACQUISITIONS
international reachdelivering on strategy
2005 2006 2007
$3.7bn$4.1bn
$5.7bn
marketcapitalisation
5 countries 3 continents
developing a
DIVERSIFIED PORTFOLIO
expanding into
EUROPE
distributions cents per security
11.3centsup 2.7 percent
www.global-reports.com

DB RREEF Trust Annual Report 2007 5
4.23 MILLION SQUARE METRES of net lettable area
new acquisitions
$457 MILLION 24 ASSETS
2005 2006 2007
$1.37$1.47
$1.97
growing
NORTH AMERICAN portfolio
42.6% year ending 30 June 2007
totalshareholder return
security price
growth
Top to bottom: Governor Phillip Tower and Governor Macquarie Tower, Sydney NSW; 30 The Bond, Sydney NSW; Duisburg, Germany
www.global-reports.com

6 DB RREEF Trust Annual Report 2007
United States of America
Australia
New Zealand
portfolio highlights
View from Governor Phillip Tower and Governor Macquarie Tower, Sydney NSW
INDUSTRIAL PROPERTIES (162)
OFFICE PROPERTIES (30)
RETAIL PROPERTIES (6)
www.global-reports.com

DB RREEF Trust Annual Report 2007 7
198 properties
$9 BILLION portfolio value
96.7% portfolio occupancy
5.3 YEARS average lease duration
$864.6 MILLION valuation increases
1,152,000 square metres leased
4,992 tenants
n
n
n
n
n
n
n
GermanyFrance
Total assets
$9.5 billion2005 2006 2007
$7.0bn
$8.3bn
$9.5bn
www.global-reports.com

letter from the chair
DB RREEF Head Office, 343 George Street, Sydney NSW
www.global-reports.com

DB RREEF Trust Annual Report 2007 9
Dear Investor
DB RREEF Trust has continued to deliver strong performance, adding value and creating future income streams across the portfolio. The DB RREEF group is one of Australia’s largest integrated property groups with total funds under management at 30 June 2007 of approximately $13.6 billion, an increase of 15 percent during the period. DB RREEF Trust comprises over $9 billion of direct property assets in Australia, New Zealand, the United States and Europe. The third party portfolio comprises $4.6 billion of assets in Australia and New Zealand.
Key highlights for the year included:
continued active management of the portfolio leading to excellent results in operating income, occupancy, lease durations and revaluations
further expansion of the portfolio with strategic acquisitions and commitments in Australia, North America and Europe for a total of $1.1 billion
creation of significant development opportunities in Australia and internationally with $2.2 billion in the development pipeline
solid growth in third party funds under management, up $667 million
subsequent to year end, the Trust announced its intention to dispose of the 50 percent interest in five retail properties to the group’s unlisted platform, allowing DB RREEF Trust to concentrate on office and industrial
On behalf of the Board, I would like to thank you for your support over the past 12 months, which delivered total shareholder return of 42.6 percent, comparing favourably to the industry benchmark1 of 25.9 percent. I look forward to reporting back to you next year on the continuing growth and development of DB RREEF Trust.
Yours sincerely
Christopher T BeareChair
17 September 2007
n
n
n
n
n
I AM PLEASED TO PRESENT THE THIRD
ANNUAL REPORT FOR DB RREEF TRUST
FOR THE YEAR ENDED 30 JUNE 2007
1 S&P/ASX 200 Property Accounting Index.
www.global-reports.com
chief
executive officer’s report
View from Governor Phillip Tower and Governor Macquarie Tower, Sydney NSW
www.global-reports.com

DB RREEF Trust Annual Report 2007 11
delivering on strategy – a solid group performance DB RREEF Trust has two core activities: the management of its direct property portfolio and its third party funds management business. During the year, we continued to actively manage and develop these activities to maximise and improve total returns to security holders.
Our quality portfolio continued to deliver excellent results with further increases in property operating income to $693 million, occupancy levels strong at 96.7 percent and average lease durations at 5.3 years overall, which contributed to significant valuations uplift of $864.6 million.
We have secured $1.1 billion of domestic and international property portfolio acquisitions and commitments in Australia, France, Germany and North America. In addition, we have continued to grow the development pipeline in Australia and North America with more than 1,340,000 square metres of new space currently planned for development or under construction, providing substantial new lettable area for future growth.
In total, assets under management grew by 15 percent to $13.6 billion maintaining DB RREEF Trust’s position as the sixth largest listed property trust, the market leader in office space, and the third largest provider of industrial space in Australia.
DB RREEF Trust portfolio at a glance
30 June 2007
30 June 2006
30 June 2005
Funds under management ($ billion) 9.0 7.9 7.0Area leased during year (‘000 square metres) 1,152 730 470Occupancy (%) 96.7 96.1 93.1Development pipeline ($ billion) 2.2 1.3 0.9
financial resultsFinancial results improved over the period. Net profit for the year was $1,211 million (up 13.5 percent). This was based on total property revenue of $693 million, representing a 4.5 percent increase and $864 million in revaluations of property investments. Total assets at 30 June 2007 were $9,487 million, an increase of 14.5 percent over last year. Net tangible assets (NTA) per stapled security was $1.82 representing an increase of 29 cents per security or 19 percent since 30 June 2006.
Total distributions for the year were 11.3 cents per stapled security (as forecast), of which 35.9 percent represents tax deferred income.
Key financial results are summarised in the table below:
30 June 2007
30 June 2006
30 June 2005
Total income ($ million) 1,648 1,463 810EBIT ($ million) 1,420 1,253 605Profit after tax ($ million) 1,211 1,066 467Net profit attributable to security holders ($ million) 1,169 1,010 396
Funds under management ($ million) 9,027 7,995 6,597NTA per security ($) 1.82 1.53 1.28Gearing ratio (%) 35.6 38.3 39.0
Distribution ($ million) 324.6 306.3 281.3Distribution (cents/security) 11.3 11.0 10.5
acquisitionsDB RREEF has expanded its domestic and international portfolio through acquisitions in Australia, North America and Germany of approximately $457 million, as well as future commitments for properties of approximately $633 million.
THE YEAR ENDING 30 JUNE 2007 HAS BEEN ANOTHER STRONG
YEAR FOR DB RREEF TRUST WITH FURTHER IMPROVEMENTS
IN ALL KEY FINANCIAL AND PORTFOLIO INDICATORS
www.global-reports.com

12 DB RREEF Trust Annual Report 2007
Consistent with our international expansion strategy and following on from DB RREEF Trust’s entry into Europe in July 2006, we expanded into Germany in December 2006 with the acquisition of a $244 million portfolio of 14 logistics properties. In December 2006, DB RREEF secured a 92 percent interest in Summit Oaks, an office development project in California USA, with an estimated value on completion of $59 million.
In June 2007, DB RREEF Trust acquired in Orlando, Florida, the first distribution centre completed under the Whirlpool investment program for $30 million.
Since year end, DB RREEF Trust continued its acquisition activity in the US acquiring an industrial portfolio for $70 million and a $121 million development program in San Antonio, Texas. In doing so, DB RREEF entered into a joint venture with an experienced local developer which includes an option to access future development opportunities in the area.
These international acquisitions were secured with assistance from our strategic partner RREEF and take our international weighting to 20 percent. These acquisitions are also in line with DB RREEF Trust’s strategy to further enhance our industrial and office development pipeline – building and delivering quality properties for our tenants.
development pipelineDB RREEF Trust completed a number of developments in the period and six developments were underway as at 30 June 2007. When completed, these developments will add more than 167,457 square metres of net lettable area to DB RREEF Trust’s portfolio with an estimated value of approximately $393 million over the next five years.
In addition, DB RREEF Trust has 11 future developments planned, with a combined estimated value of more than $1.8 billion, bringing the total development pipeline to approximately $2.2 billion.
DB RREEF Trust will, where appropriate, seek to realise development value created and return an appropriate portion to investors.
funds managementAs at 30 June 2007, DB RREEF managed more than $13.6 billion of assets, an increase of $1.8 billion or 15 percent since 30 June 2006. DB RREEF’s third party funds under management increased by 18 percent or $667 million to $4.6 billion.
Third party funds management continued to deliver a strong investment performance, with the combined total return over five years ending 30 June 2007 of 14.5 percent, as compared to the benchmark of 14.2 percent.
disposal of retail portfolioSubsequent to 30 June 2007, DB RREEF Trust announced its intention to dispose of five of six retail properties to its third party funds management business. This transaction is expected to complete in October 2007 and will enable DB RREEF Trust to concentrate on the industrial and office sectors, both in Australia and internationally. It provides significant balance sheet strength by recycling capital to deliver improved and increasing value for security holders into the future.
diversified and actively managed debt profileDB RREEF Trust continues to maintain a strong balance sheet and diversified debt profile, which is supported by a Standard & Poors long-term corporate credit rating of BBB+.
DB RREEF Trust’s overall level of debt is $3.4 billion, which represents gearing of 35.6 percent. This is a reduction from 38.3 percent at 30 June 2006 and continues to be below DB RREEF Trust’s long-term targeted gearing range of
chief executive officer’s report (continued)
L–R: DB RREEF Industrial Estate, Laverton North VIC; Space 1 Bligh Street û Sydney NSW; 45 Clarence Street, Sydney NSW; 13755 Hutton Drive, Dallas TX
www.global-reports.com

DB RREEF Trust Annual Report 2007 13
40 to 45 percent, providing the Trust with substantial capacity to fund future investment opportunities.
During the 12 month period, DB RREEF Trust further diversified its sources of debt by successfully issuing a total of $450 million medium term notes (MTNs) into the domestic debt capital market. The two issues received a strong response from investors and each was subsequently increased from the original offer size to meet investor demand. Over the year, DB RREEF Trust took the opportunity to renegotiate the majority of its unsecured bank debt facilities. This initiative has significantly reduced DB RREEF Trust’s refinancing risk.
strong financial risk management profileDB RREEF Trust continues to maintain a prudent financial risk management profile. A high proportion of DB RREEF Trust’s debt is hedged (over 90 percent at the 2007 financial year end) and the weighted average duration of these hedges is approximately six years with the weighted average cost of debt at 5.7 percent, inclusive of margins and fees.
This profile provides significant protection to security holders in a rising interest rate environment. DB RREEF Trust seeks to match the currency of its investments with the currency of its debt, providing substantial protection to security holders from adverse movements in net tangible assets due to changes in foreign exchange rates.
Residual net foreign currency earnings are substantially hedged for periods up to five years.
corporate responsibility and sustainabilitySustainability and climate change issues are increasingly at the forefront of the property sector and wider business community. It has been almost a decade since the group commenced its first environmental management programs and over the years we have invested substantial financial and management resources to improve our understanding of and develop initiatives to address sustainability on a group-wide basis.
DB RREEF continues to lead the way in corporate responsibility and sustainable practices and we have progressed a number of new initiatives over the year. We recognise that there is always more to do and we are committed to continually reviewing and improving our activities, maximising resource efficiencies, minimising our environmental footprint and future-proofing our properties.
This year, in order to be more transparent in our reporting and communications in this area, we have adopted the Global Reporting Initiative (GRI) G3 reporting framework and, for the first time, we have prepared a stand alone Corporate Responsibility and Sustainability report. A summary of this report can be found on pages 38 to 57.
2008 strategic focusLooking forward, the primary objective of DB RREEF Trust is to continue to deliver superior performance and enhanced returns to security holders. We plan to achieve this through focusing on our core areas of operation and expertise in the office and industrial sectors.
We plan to further expand in Australia and overseas through acquisitions and the expansion of our $2.2 billion development pipeline. This will primarily be undertaken in markets where we can:
build scale
take advantage of favourable market conditions
deliver value and increased returns
DB RREEF operates an integrated platform as an owner, manager and developer of quality properties. We have an experienced team of property professionals offering property management, asset management and development services to our tenants.
Our strategy is to continue to deliver properties and services that meet and exceed our tenants’ needs while leveraging our integrated platform to recycle assets, maximise occupancy, increase rental income and grow fees and profits from development activities and funds management.
In summary, we made great progress last year and now have an even stronger platform from which to deliver future growth and increased returns to security holders.
Based on our strategy, we expect that distribution growth in 2008 will be in excess of five percent.
Victor P Hoog AntinkChief Executive Officer
17 September 2007
n
n
n
www.global-reports.com
our
portfolio
portfolio overview
australia/new zealand – office, retail, industrial
north america – industrial
europe – industrial
Australia Square, George Street, Sydney NSW
www.global-reports.com

DB RREEF Trust Annual Report 2007 15
portfolio overviewDuring the year, DB RREEF Trust’s direct property portfolio has delivered strong results across all sectors: office, industrial and retail.
In the period, we continued to actively manage the portfolio and build stronger relationships with our customers, increasing tenant retention and improving occupancy to a record high of 96.7 percent.
A number of refurbishments and upgrades have been completed to ensure the portfolio meets the needs of our customers now and into the future. This has resulted in significant leasing success in the period with total new leases, lease renewals and heads of agreement of 1,152,000 square metres which represents more than 36 percent of the portfolio.
This active approach to managing the portfolio, together with sound market fundamentals, ensured our portfolio continued to deliver value with an increase in valuations of $864.6 million, taking the total portfolio value to $9 billion.
looking forward
The outlook is positive for both the office and industrial sectors of the markets in which we operate. The disposal of our retail portfolio to the unlisted platform enables continued focus on growing our traditional asset classes of office and industrial and maximises the benefits of our integrated platform. The retail transaction will increase the third party funds under management by approximately $1 billion.
Ben LehmannFund Manager, DB RREEF Trust
direct property portfolio as at 30 June 2007
Property type Property value
($ million)
Area occupied
(%)
Average lease term by income
(years)
Office/Car parks – AUS 4,045.8 99.0 6.2Retail – AUS 1,204.5 99.9 5.5Industrial – AUS 1,760.9 98.3 4.7Industrial – USA 1,452.9 95.2 3.4Industrial – Europe 344.0 92.8 4.1
Total 8,808.0 96.7 5.3
direct property portfolio value by sector and geographyas at 30 June 2007
Office AUS/NZ 46%
Industrial AUS 20%
Retail AUS 14%
Industrial Europe 4%
Industrial US 16%$8,808 million*
* excludes cash
net property income as at 30 June 2007
Office AUS/NZ 45.2%
Industrial AUS 21.5%
Retail AUS 10.5%
Industrial Europe 2.7%
Industrial US 20.1%$693 million*
* excludes cash
ACTIVE PORTFOLIO MANAGEMENT DELIVERING
CONSISTENTLY STRONG PERFORMANCES
www.global-reports.com
16 DB RREEF Trust Annual Report 2007
office portfolioThe Australian office markets are well into the growth phase of the cycle. The portfolio has been positioned, both in its stabilised assets and its development pipeline, to take advantage of this growth.
The office portfolio contributed $239 million (2006: $231 million) in net property income to DB RREEF Trust, an increase of 3.4 percent over the year to 30 June 2006 including comparable property income growth of 5.3 percent. This contribution represents 45.2 percent (2006: 44.3 percent) of total net property income for the year.
The office portfolio is valued at $4 billion, an increase of 11 percent over the 2006 book value of $3.6 billion. This is due to increased valuations, capital expenditure and the disposal of a 50 percent share in The Zenith, Chatswood NSW.
The office portfolio comprises over 508,000 square metres of lettable area with 685 tenants in 24 properties and five car parks.
As the market leader in high quality offices in Australia, our customers are predominantly major Australian and international companies and government bodies. Premium grade accommodation comprised 22 percent of the office portfolio by area, 64 percent A-grade, and the remainder B-grade and associated retail.
Leases totalling 11 percent (72,000 square metres) of the office portfolio were secured during the period. All office portfolio fundamentals are tracking well with occupancy and lease durations increasing.
Our high quality portfolio continued to deliver value with an increase in valuations of 12.8 percent, up $452 million.
our portfolio – australia/new zealand
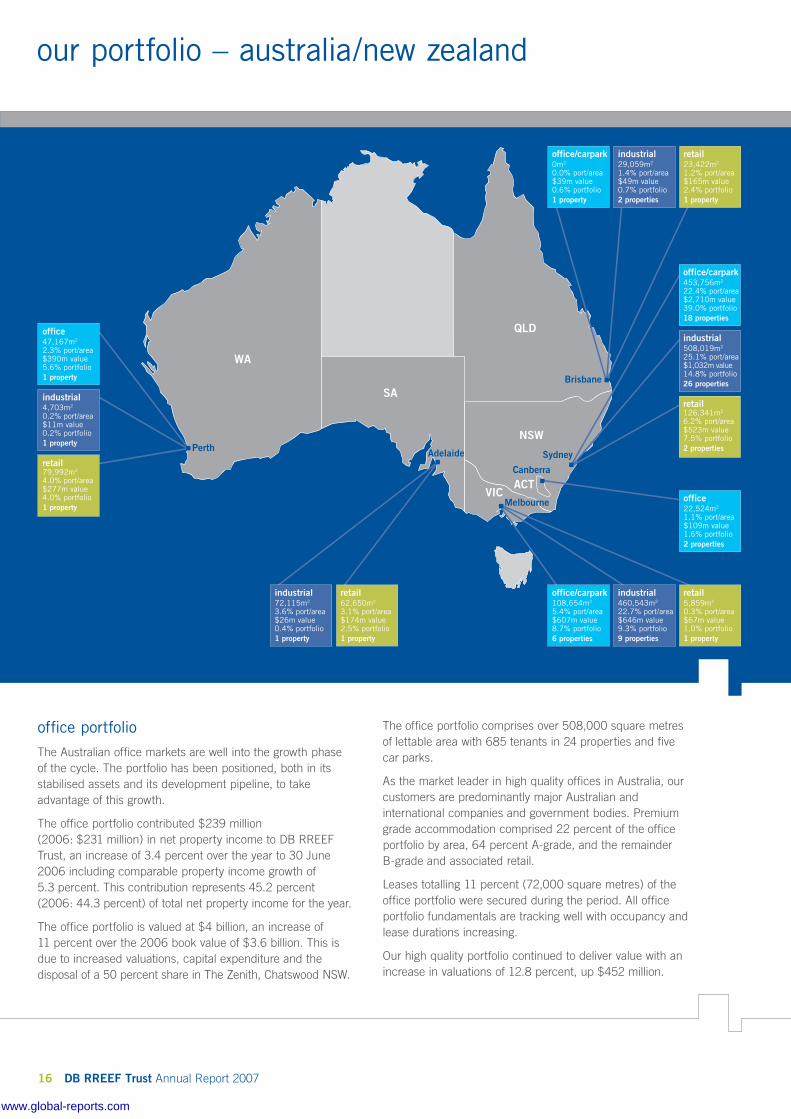
office/carpark453,756m2
22.4% port/area$2,710m value39.0% portfolio18 properties
office22,524m2
1.1% port/area$109m value1.6% portfolio2 properties
industrial508,019m2
25.1% port/area$1,032m value14.8% portfolio26 properties
retail126,341m2
6.2% port/area$523m value7.5% portfolio2 properties
office/carpark0m2
0.0% port/area$39m value0.6% portfolio1 property
industrial29,059m2
1.4% port/area$49m value0.7% portfolio2 properties
retail23,422m2
1.2% port/area$165m value2.4% portfolio1 property
office47,167m2
2.3% port/area$390m value5.6% portfolio1 property
industrial4,703m2
0.2% port/area$11m value0.2% portfolio1 property
retail79,992m2
4.0% port/area$277m value4.0% portfolio1 property
industrial72,115m2
3.6% port/area$26m value0.4% portfolio1 property
retail62,650m2
3.1% port/area$174m value2.5% portfolio1 property
industrial460,543m2
22.7% port/area$646m value9.3% portfolio9 properties
office/carpark108,654m2
5.4% port/area$607m value8.7% portfolio6 properties
retail 5,859m2
0.3% port/area$67m value1.0% portfolio1 property
www.global-reports.com
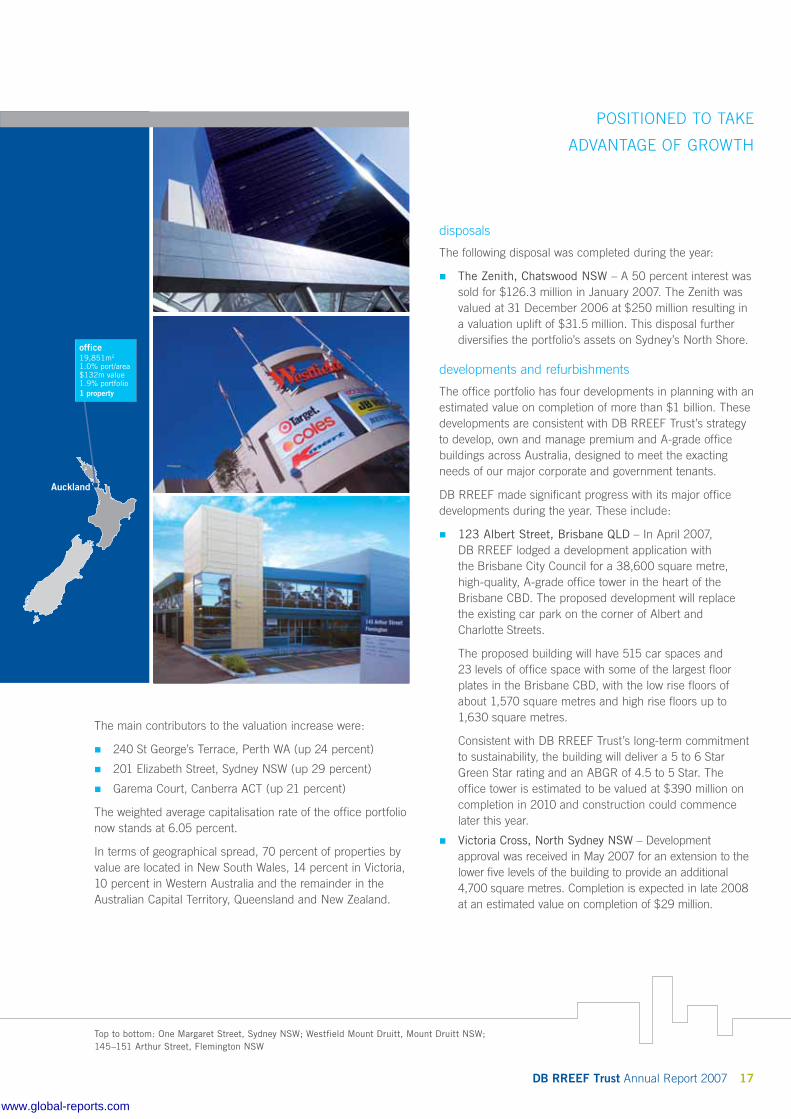
The main contributors to the valuation increase were:
240 St George’s Terrace, Perth WA (up 24 percent)
201 Elizabeth Street, Sydney NSW (up 29 percent)
Garema Court, Canberra ACT (up 21 percent)
The weighted average capitalisation rate of the office portfolio now stands at 6.05 percent.
In terms of geographical spread, 70 percent of properties by value are located in New South Wales, 14 percent in Victoria, 10 percent in Western Australia and the remainder in the Australian Capital Territory, Queensland and New Zealand.
n
n
n
disposals
The following disposal was completed during the year:
The Zenith, Chatswood NSW – A 50 percent interest was sold for $126.3 million in January 2007. The Zenith was valued at 31 December 2006 at $250 million resulting in a valuation uplift of $31.5 million. This disposal further diversifies the portfolio’s assets on Sydney’s North Shore.
developments and refurbishments
The office portfolio has four developments in planning with an estimated value on completion of more than $1 billion. These developments are consistent with DB RREEF Trust’s strategy to develop, own and manage premium and A-grade office buildings across Australia, designed to meet the exacting needs of our major corporate and government tenants.
DB RREEF made significant progress with its major office developments during the year. These include:
123 Albert Street, Brisbane QLD – In April 2007, DB RREEF lodged a development application with the Brisbane City Council for a 38,600 square metre, high-quality, A-grade office tower in the heart of the Brisbane CBD. The proposed development will replace the existing car park on the corner of Albert and Charlotte Streets.
The proposed building will have 515 car spaces and 23 levels of office space with some of the largest floor plates in the Brisbane CBD, with the low rise floors of about 1,570 square metres and high rise floors up to 1,630 square metres.
Consistent with DB RREEF Trust’s long-term commitment to sustainability, the building will deliver a 5 to 6 Star Green Star rating and an ABGR of 4.5 to 5 Star. The office tower is estimated to be valued at $390 million on completion in 2010 and construction could commence later this year.
Victoria Cross, North Sydney NSW – Development approval was received in May 2007 for an extension to the lower five levels of the building to provide an additional 4,700 square metres. Completion is expected in late 2008 at an estimated value on completion of $29 million.
n
n
n
office19,851m2
1.0% port/area$132m value1.9% portfolio1 property
POSITIONED TO TAKE
ADVANTAGE OF GROWTH
Top to bottom: One Margaret Street, Sydney NSW; Westfield Mount Druitt, Mount Druitt NSW; 145–151 Arthur Street, Flemington NSW
DB RREEF Trust Annual Report 2007 17
www.global-reports.com
18 DB RREEF Trust Annual Report 2007
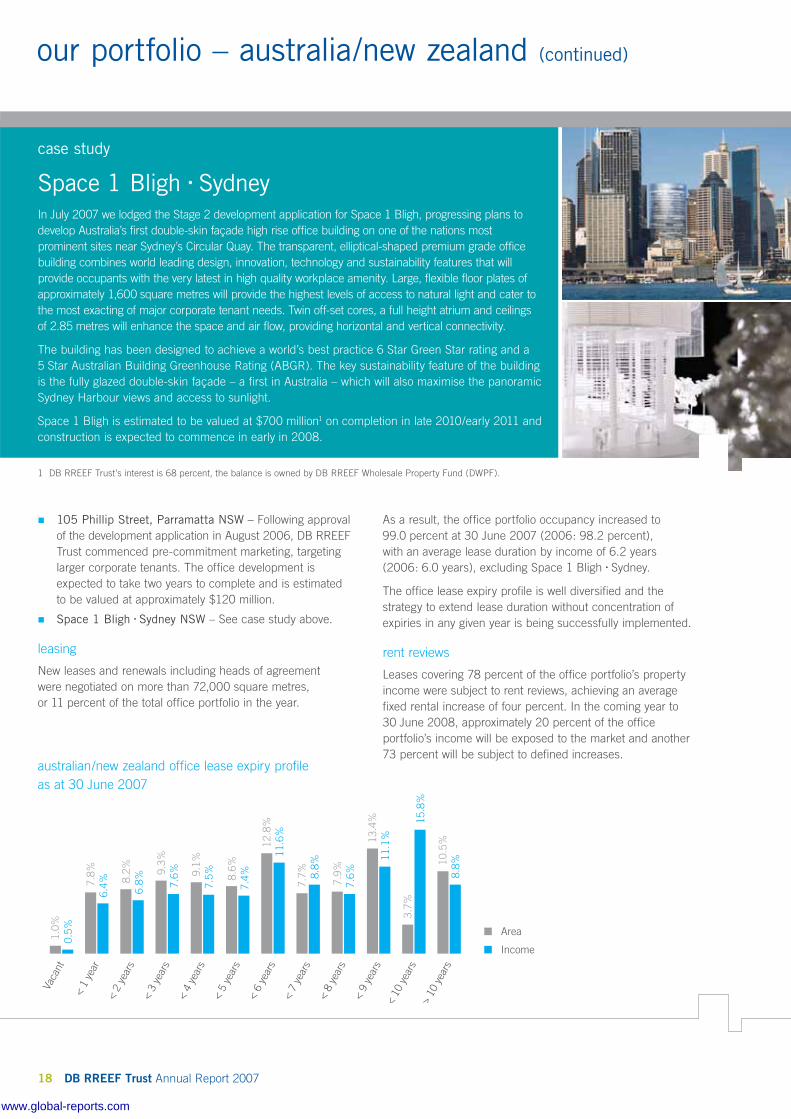
australian/new zealand office lease expiry profile as at 30 June 2007
7.8
% 6
.4%
1.0
% 0
.5%
8.2
% 6
.8% 9
.3%
7.6
%
9.1
% 7
.5%
8.6
% 7
.4%
12.
8% 1
1.6%
7.7
% 8
.8%
7.9
% 7
.6%
13.
4% 1
1.1%
3.7
% 1
5.8%
10.
5% 8
.8%
Vaca
nt
< 1
year
< 2
year
s
< 3
year
s
< 4
year
s
< 5
year
s
< 6
year
s
< 7
year
s
< 8
year
s
< 9
year
s<
10 y
ears
> 10
yea
rs
Area
Income
105 Phillip Street, Parramatta NSW – Following approval of the development application in August 2006, DB RREEF Trust commenced pre-commitment marketing, targeting larger corporate tenants. The office development is expected to take two years to complete and is estimated to be valued at approximately $120 million.
Space 1 Bligh û Sydney NSW – See case study above.
leasing
New leases and renewals including heads of agreement were negotiated on more than 72,000 square metres, or 11 percent of the total office portfolio in the year.
n
n
our portfolio – australia/new zealand (continued)
As a result, the office portfolio occupancy increased to 99.0 percent at 30 June 2007 (2006: 98.2 percent), with an average lease duration by income of 6.2 years (2006: 6.0 years), excluding Space 1 Bligh û Sydney.
The office lease expiry profile is well diversified and the strategy to extend lease duration without concentration of expiries in any given year is being successfully implemented.
rent reviews
Leases covering 78 percent of the office portfolio’s property income were subject to rent reviews, achieving an average fixed rental increase of four percent. In the coming year to 30 June 2008, approximately 20 percent of the office portfolio’s income will be exposed to the market and another 73 percent will be subject to defined increases.
case study
Space 1 Bligh û SydneyIn July 2007 we lodged the Stage 2 development application for Space 1 Bligh, progressing plans to develop Australia’s first double-skin façade high rise office building on one of the nations most prominent sites near Sydney’s Circular Quay. The transparent, elliptical-shaped premium grade office building combines world leading design, innovation, technology and sustainability features that will provide occupants with the very latest in high quality workplace amenity. Large, flexible floor plates of approximately 1,600 square metres will provide the highest levels of access to natural light and cater to the most exacting of major corporate tenant needs. Twin off-set cores, a full height atrium and ceilings of 2.85 metres will enhance the space and air flow, providing horizontal and vertical connectivity.
The building has been designed to achieve a world’s best practice 6 Star Green Star rating and a 5 Star Australian Building Greenhouse Rating (ABGR). The key sustainability feature of the building is the fully glazed double-skin façade – a first in Australia – which will also maximise the panoramic Sydney Harbour views and access to sunlight.
Space 1 Bligh is estimated to be valued at $700 million1 on completion in late 2010/early 2011 and construction is expected to commence in early in 2008.
1 DB RREEF Trust’s interest is 68 percent, the balance is owned by DB RREEF Wholesale Property Fund (DWPF).
www.global-reports.com

DB RREEF Trust Annual Report 2007 19
The retail portfolio contributed $55 million in net property income to DB RREEF Trust providing comparable growth of 6.7 percent on a like for like basis. This contribution represents 10.4 percent (2006: 10.9 percent) of total net property income for the year to 30 June 2007.
Moving Annual Turnover (MAT) for the 12 months was up 7.6 percent to $1.6 billion. Occupancy remains robust at 99.9 percent (2006: 99.4 percent) and the average lease duration by income is 5.5 years (2006: 5.1 years).
The retail portfolio is valued at $1.2 billion (2006: $915 million), an increase of 31.6 percent over 2006 book value with an increase in valuations of $214 million being a major contributor to this result.
At 30 June 2007, the retail portfolio comprised in total approximately 291,930 square metres of net lettable area in six properties with over 1,124 tenants. The retail portfolio is diversified across Australia with properties in New South Wales, Victoria, Queensland, South Australia and Western Australia, and provides a balance of secure income streams and development potential.
developments and refurbishments
There are two major development projects currently in the construction phase:
North Lakes, Brisbane QLD – The extension of North Lakes commenced in September 2006 with the addition of Myer, Woolworths, Big W, 80 specialty shops and ancillary car parking, increasing the existing centre to 60,931 square metres of gross lettable area. The expansion takes advantage of an increasing population in one of the fastest growing areas in South East Queensland. Phase 1 is due for completion in November 2007 and phase 2 (Myer) is due for completion in June 2008.
n
Plenty Valley Town Centre, VIC – Construction of the new Plenty Valley Town Centre commenced in November 2006 and includes the addition of Target, Safeway, Kmart and ALDI, as well as an additional 135 specialty shops and ancillary car parking. The project will add approximately 47,720 square metres of retail space, creating a total centre of 53,862 square metres and is estimated to be completed in June 2008.
revaluations
Revaluations resulted in an increase in asset value of the retail portfolio of $215 million or 22 percent over book value. Valuations of Plenty Valley and North Lakes increased significantly due to the current development programs. The weighted average capitalisation rate of the retail portfolio now stands at 5.6 percent.
rent reviews
Renewals over existing tenancies totalled 90 deals achieving 37 percent above passing rental.
New leases over existing vacancies and newly created tenancies totalled 179 deals and achieved nine percent above budget.
leasing
During the year, new leases, lease renewals and heads of agreement were secured on 269 leases, accounting for over 28,681 square metres.
visitations
More than 49.1 million visitations were made to the centres representing a 0.6 percent increase over the previous year.
Spend per visit averaged $33.44 across the six centres, an increase from $31.27 in 2006. Occupancy cost ratios for all centres are at acceptable levels.
n
retail portfolio – australia
Westfield Mount Druitt, Mount Druitt NSW
www.global-reports.com
20 DB RREEF Trust Annual Report 2007
our portfolio – australia (continued)
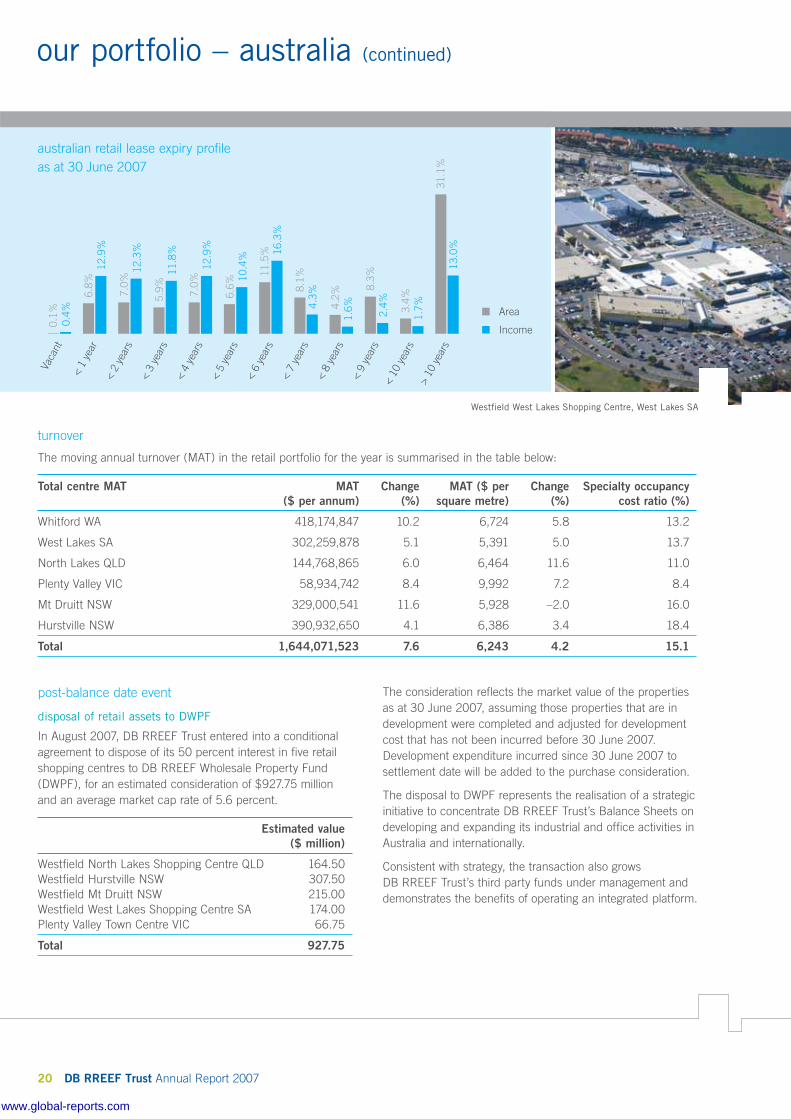
turnover
The moving annual turnover (MAT) in the retail portfolio for the year is summarised in the table below:
Total centre MAT MAT ($ per annum)
Change(%)
MAT ($ per square metre)
Change(%)
Specialty occupancy cost ratio (%)
Whitford WA 418,174,847 10.2 6,724 5.8 13.2
West Lakes SA 302,259,878 5.1 5,391 5.0 13.7
North Lakes QLD 144,768,865 6.0 6,464 11.6 11.0
Plenty Valley VIC 58,934,742 8.4 9,992 7.2 8.4
Mt Druitt NSW 329,000,541 11.6 5,928 –2.0 16.0
Hurstville NSW 390,932,650 4.1 6,386 3.4 18.4
Total 1,644,071,523 7.6 6,243 4.2 15.1
Area
Income
6.8
% 1
2.9%
0.1
% 0
.4%
7.0
% 12.
3%
5.9
% 11.
8%
7.0
% 12.
9%
6.6
% 10.
4%
11.
5% 16.
3%
8.1
% 4
.3%
4.2
% 1
.6%
8.3
% 2
.4%
3.4
% 1
.7%
31.
1% 1
3.0%
Vaca
nt
< 1
yea
r <
2 y
ears
< 3
yea
rs <
4 y
ears
< 5
yea
rs <
6 y
ears
< 7
yea
rs <
8 y
ears
< 9
yea
rs <
10
year
s>
10 y
ears
australian retail lease expiry profile as at 30 June 2007
post-balance date event
disposal of retail assets to DWPF
In August 2007, DB RREEF Trust entered into a conditional agreement to dispose of its 50 percent interest in five retail shopping centres to DB RREEF Wholesale Property Fund (DWPF), for an estimated consideration of $927.75 million and an average market cap rate of 5.6 percent.
Estimated value ($ million)
Westfield North Lakes Shopping Centre QLD 164.50Westfield Hurstville NSW 307.50Westfield Mt Druitt NSW 215.00Westfield West Lakes Shopping Centre SA 174.00Plenty Valley Town Centre VIC 66.75
Total 927.75
The consideration reflects the market value of the properties as at 30 June 2007, assuming those properties that are in development were completed and adjusted for development cost that has not been incurred before 30 June 2007. Development expenditure incurred since 30 June 2007 to settlement date will be added to the purchase consideration.
The disposal to DWPF represents the realisation of a strategic initiative to concentrate DB RREEF Trust’s Balance Sheets on developing and expanding its industrial and office activities in Australia and internationally.
Consistent with strategy, the transaction also grows DB RREEF Trust’s third party funds under management and demonstrates the benefits of operating an integrated platform.
Westfield West Lakes Shopping Centre, West Lakes SA
www.global-reports.com
DB RREEF Trust Annual Report 2007 21
The Australian industrial portfolio contributed $114 million (2006: $110 million) or 21.5 percent (2006: 21.9 percent) to total net property income. As a result of significant leasing activity, occupancy remains strong at 98.3 percent (2006: 99 percent) with the average lease duration at 4.7 years by income (2006: 4.8 years). The Australian industrial portfolio is valued at $1.8 billion following revaluations through the year of $82 million.
acquisitions
The Australian industrial portfolio acquired two industrial development sites in the year further increasing the DB RREEF Trust development pipeline.
Wicks Road, North Ryde NSW – In November 2006, DB RREEF Trust acquired a 50 percent interest in a development site in North Ryde for $27 million, plus acquisition costs, in partnership with the DB RREEF Wholesale Property Fund.
The acquisition takes advantage of a lift in the investment potential of North Ryde and forms part of DB RREEF Trust’s strategy to capitalise on this growing North Shore market while further enhancing our development pipeline. Development options are being considered to transform the site into a state-of-the-art office park over a number of stages.
n
Doherty’s Road, Laverton North VIC – DB RREEF Trust acquired a $32 million land parcel adjacent to DB RREEF Industrial Estate, Laverton North, on 1 November 2006. This acquisition provides a strategic extension to the estate and will enable DB RREEF to leverage off the infrastructure already developed at Laverton North.
disposals
During the year DB RREEF Trust sold three industrial assets:
121 Evans Road, Salisbury QLD for $24 million
27–33 Frank Street, Wetherill Park NSW for $16 million
706 Mowbray Road, Lane Cove NSW for $29 million
Subsequent to year end, DB RREEF Trust entered into a contract to sell 50 percent of the completed Coles Chilled Distribution Centre at Laverton North to the AXA Mandate, enabling DB RREEF Trust to capitalise on value created through the development process.
developments
During the year, six developments were completed in the Australian industrial portfolio at a value of approximately $173 million. An additional development valued at $34 million is currently under construction. A further five future developments are planned with an estimated value on completion of $645 million, bringing the total industrial development pipeline to approximately $680 million.
n
n
n
n
STABLE INDUSTRIAL MARKETS SUPPORTING
STRONG OCCUPANCY AND LEASING ACTIVITY
industrial portfolio – australia
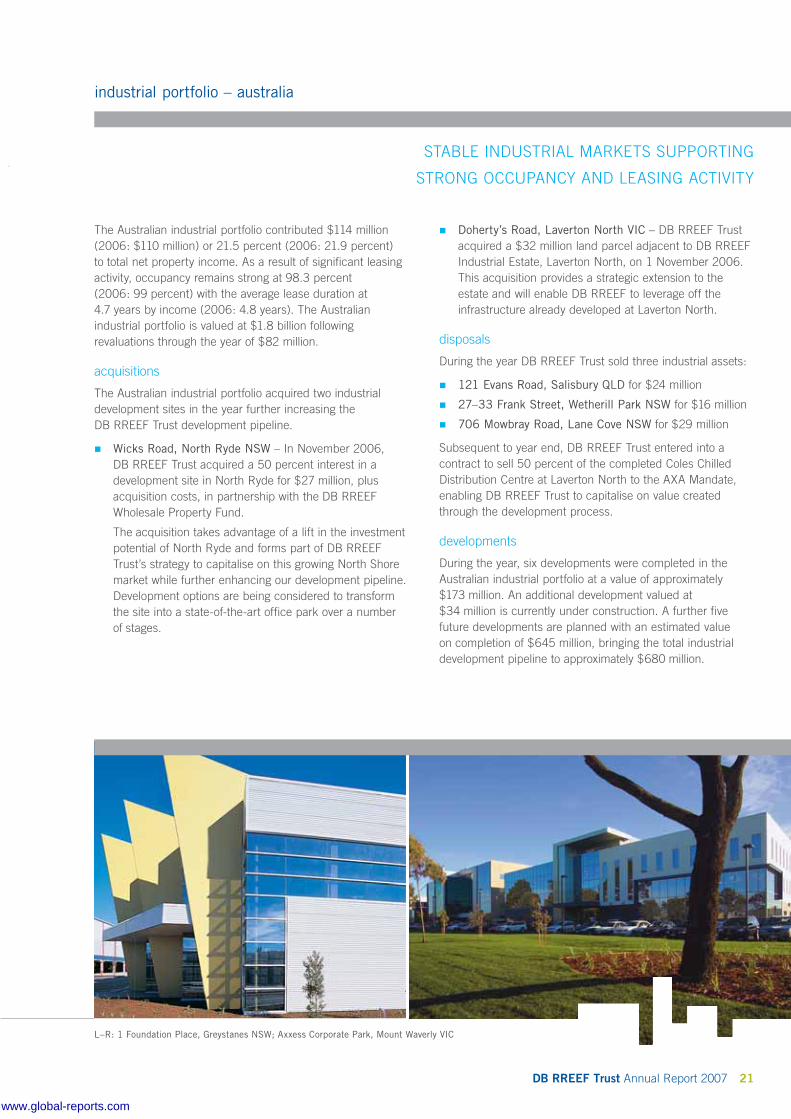
L–R: 1 Foundation Place, Greystanes NSW; Axxess Corporate Park, Mount Waverly VIC
www.global-reports.com

22 DB RREEF Trust Annual Report 2007
future developments
Doherty’s Road, Laverton North VIC – Master planning has commenced on this staged development project including density analysis, infrastructure planning and preliminary marketing. Rezoning of the site for industrial use was approved by Council and it is expected the rezoning will be completed by the end of this year. Estimated value on completion is $280 million.
Wicks Road, North Ryde NSW – This site is currently undergoing a Development Control Plan review through Ryde Council and tenders have been received for a staged development, estimated to be valued at $200 million.
Pound Road, West Dandenong VIC – Development of a purpose built powder coating facility for Orica commenced construction in July 2007 with completion expected in December 2007. Estimated value on completion is $10 million.
In addition, we have two future development projects located at Axxess Corporate Park, Mount Waverley VIC and 3 Brookhollow Avenue, Baulkham Hills NSW.
n
n
n
our portfolio – australia (continued)
8.2
% 8
.9%
1.7
% 1
.4%
13.
6% 1
2.6%
12.
1% 1
4.8%
8.3
% 11.
8%
29.
4% 1
9.2%
3.7
% 5
.5%
5.6
% 7
.7%
2.8
% 2
.9%
0.9
% 2
.0%
2.4
% 3
.1%
11.
2% 1
0.0%
Vaca
nt
< 1
yea
r <
2 y
ears
< 3
yea
rs <
4 y
ears
< 5
yea
rs <
6 y
ears
< 7
yea
rs <
8 y
ears
< 9
yea
rs <
10
year
s>1
0 ye
ars
Area Income
completed
Pound Road West, Dandenong South VIC
L’Oréal Australia – expansion work of 7,224 square metres was completed in August 2006 and is valued at $9 million.
DB RREEF Industrial Estate, Laverton North VIC
Wrightson Seeds Australia Pty Limited – construction of a purpose built distribution centre valued at $7 million was completed in October 2006.
Coles Group Limited – construction of a $116 million 42,954 square metre chilled distribution centre was completed in April 2007. (Subsequent to balance date, a 50 percent interest was sold to the AXA Mandate for $58 million).
underway
DB RREEF Industrial Estate, Laverton North VIC – Construction is underway for a 53,000 square metre distribution centre with an estimated value of $34 million. The asset is pre-leased to Fosters Limited for 10 years and is scheduled for completion in September 2007.
n
n
n
n
australian industrial lease expiry profile as at 30 June 2007
Pound Road West, Dandenong VIC
www.global-reports.com

DB RREEF Trust Annual Report 2007 23
refurbishments
Refurbishments are underway at 2 Minna Close, Belrose NSW and 114–120 Old Pittwater Road, Brookvale NSW. Plans have been approved to refurbish tenancies on expiry at 10–16 South Street, Rydalmere NSW.
leasing
The Australian industrial portfolio has 1,162,586 square metres of net lettable area. New leases and renewals including heads of agreements were negotiated over more than 199,437 square metres or 17 percent of the Australian industrial portfolio in the year to 30 June 2007.
The Australian industrial portfolio occupancy remained strong at 98.3 percent (2006: 99.2 percent), with an average lease duration (by income) of 4.7 years (2006: 4.8 percent).
rent reviews
Leases covering 7.6 percent of the Australian industrial portfolio’s property income were subject to market rent reviews in the period, achieving an average rental increase of 4.8 percent. Defined rent reviews accounted for 60.9 percent of the industrial portfolio’s property income with an average rental increase of 3.5 percent.
In the coming year to 30 June 2008, approximately 20.8 percent of the Australian industrial portfolio’s income will be exposed to the market and another 75.7 percent will be subject to defined increases.
revaluations
Revaluations resulted in an increase in asset value of the Australian industrial portfolio of $82 million or five percent over book value. Contributors to the uplift were:
114–120 Pittwater Road, Brookvale NSW (up 12.6 percent)
3 Brookhollow Avenue, Baulkham Hills NSW (up 21.1 percent)
Pound Road West, Dandenong VIC (up 18.8 percent)
25 Donkin Street, South Brisbane QLD (up 11 percent)
The weighted average capitalisation rate of the Australian industrial portfolio now stands at 7.25 percent.
n
n
n
n
L–R: DB RREEF Industrial Estate, Laverton North VIC; 11 Talavera Road, Macquarie Park NSW;114–120 Pittwater Road, Brookvale NSW
www.global-reports.com
24 DB RREEF Trust Annual Report 2007
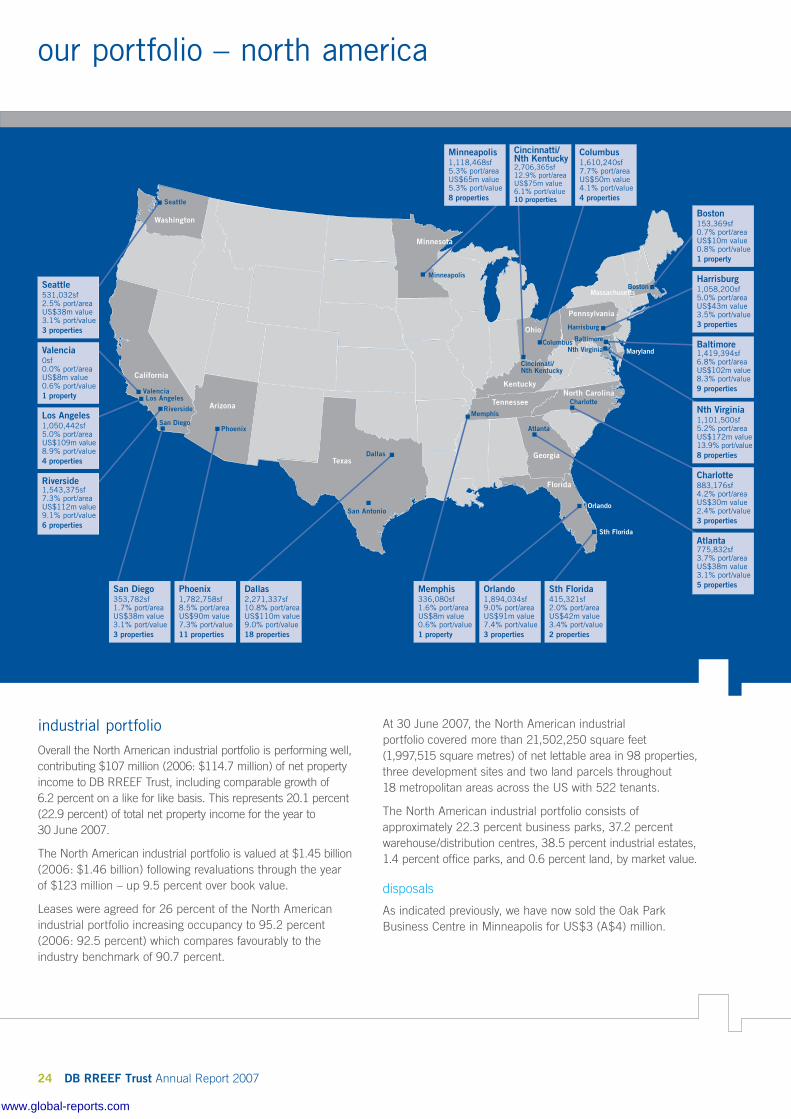
Boston153,369sf0.7% port/areaUS$10m value0.8% port/value1 property
Harrisburg1,058,200sf5.0% port/areaUS$43m value3.5% port/value3 properties
Baltimore1,419,394sf6.8% port/areaUS$102m value8.3% port/value9 properties
Nth Virginia1,101,500sf5.2% port/areaUS$172m value13.9% port/value8 properties
Charlotte883,176sf4.2% port/areaUS$30m value2.4% port/value3 properties
Atlanta775,832sf3.7% port/areaUS$38m value3.1% port/value5 propertiesPhoenix
1,782,758sf8.5% port/areaUS$90m value7.3% port/value11 properties
San Diego353,782sf1.7% port/areaUS$38m value3.1% port/value3 properties
Dallas2,271,337sf10.8% port/areaUS$110m value9.0% port/value18 properties
Memphis336,080sf1.6% port/areaUS$8m value0.6% port/value1 property
Orlando1,894,034sf9.0% port/areaUS$91m value7.4% port/value3 properties
Sth Florida415,321sf2.0% port/areaUS$42m value3.4% port/value2 properties
Minneapolis1,118,468sf5.3% port/areaUS$65m value5.3% port/value8 properties
Cincinnatti/Nth Kentucky2,706,365sf12.9% port/areaUS$75m value6.1% port/value10 properties
Columbus1,610,240sf7.7% port/areaUS$50m value 4.1% port/value4 properties
Seattle531,032sf2.5% port/areaUS$38m value3.1% port/value3 properties
Los Angeles1,050,442sf5.0% port/areaUS$109m value8.9% port/value4 properties
Valencia0sf0.0% port/areaUS$8m value0.6% port/value1 property
Riverside1,543,375sf7.3% port/areaUS$112m value9.1% port/value6 properties
Los Angeles
Phoenix
Dallas
San Antonio
Riverside
San Diego
Valencia
Seattle
Columbus
Massachusetts
Maryland
Minneapolis
Harrisburg
Baltimore
Boston
Nth Virginia
Memphis
Charlotte
Atlanta
Sth Florida
Orlando
Cincinnati/Nth Kentucky
California
Washington
Minnesota
Ohio
KentuckyNorth Carolina
Tennessee
Georgia
Florida
Pennsylvania
Arizona
Texas
industrial portfolioOverall the North American industrial portfolio is performing well, contributing $107 million (2006: $114.7 million) of net property income to DB RREEF Trust, including comparable growth of 6.2 percent on a like for like basis. This represents 20.1 percent (22.9 percent) of total net property income for the year to 30 June 2007.
The North American industrial portfolio is valued at $1.45 billion (2006: $1.46 billion) following revaluations through the year of $123 million – up 9.5 percent over book value.
Leases were agreed for 26 percent of the North American industrial portfolio increasing occupancy to 95.2 percent (2006: 92.5 percent) which compares favourably to the industry benchmark of 90.7 percent.
At 30 June 2007, the North American industrial portfolio covered more than 21,502,250 square feet (1,997,515 square metres) of net lettable area in 98 properties, three development sites and two land parcels throughout 18 metropolitan areas across the US with 522 tenants.
The North American industrial portfolio consists of approximately 22.3 percent business parks, 37.2 percent warehouse/distribution centres, 38.5 percent industrial estates, 1.4 percent office parks, and 0.6 percent land, by market value.
disposals
As indicated previously, we have now sold the Oak Park Business Centre in Minneapolis for US$3 (A$4) million.
our portfolio – north america
www.global-reports.com

DB RREEF Trust Annual Report 2007 25
acquisitions
The North American industrial portfolio acquired a number of properties and development sites valued at US$65 million (A$100 million), further enhancing the DB RREEF Trust development pipeline. The acquisitions include:
Orlando, Florida – DB RREEF Trust acquired the first property through the Whirlpool program in Orlando, Florida. This 503,504 square foot (46,776 square metre) distribution centre has been acquired for approximately US$25 (A$30) million plus acquisition costs on a yield of seven percent. It has been leased to Whirlpool Corporation for 10 years.
DB RREEF Trust also has an option to acquire an additional 11 acres (4.5 hectares) of land that will enable the facility to be expanded by approximately 250,000 square feet (23,225 square metres).
n
The Whirlpool Investment Program will see DB RREEF Trust progressively acquire 11 state-of-the-art industrial distribution facilities in the US, Canada and Poland. Each of these centres will be constructed on sites selected by Whirlpool, RREEF and DB RREEF, and will be fully leased to Whirlpool for 10 years, with four, five year options. DB RREEF Trust will acquire each facility after Whirlpool takes occupation and the development is complete.
In Toronto, Ontario, construction has commenced on a 750,000 square foot (69,675 square metre) distribution centre with completion expected by early 2008. The estimated cost of the acquisition is US$63 (A$71) million. Site selection for further sites in the US and one in Poland is well advanced. It is anticipated that these facilities will be acquired by DB RREEF Trust in 2008 and 2009.
post-balance date event
San Antonio, Texas – DB RREEF Trust exchanged contracts in July 2007 to acquire a portfolio of high quality, newly constructed industrial properties for US$60 (A$70) million. In addition, the Trust entered into a joint venture with Santa Barbara Development Services (DB RREEF Trust 96.5 percent and Santa Barbara Development Services 3.5 percent) to develop an additional 95 acres (38.4 hectares) of industrial land in two stages, valued at approximately US$101 (A$121) million.
The existing portfolio comprises seven properties containing 10 buildings totalling approximately 1,047,000 square feet (97,269 square metres) in various locations in San Antonio. Stage 1 of the development phase will see eight buildings totalling approximately 660,000 square feet (61,316 square metres) being developed over the next two years. The land for this development phase was purchased in July 2007. Stage 2 is an option to purchase additional land and develop another eight buildings totalling approximately 890,000 square feet (82,683 square metres).
This acquisition is consistent with DB RREEF Trust’s plans to expand its international portfolio further in the industrial and office sectors. The joint venture partnership also provides DB RREEF Trust with exclusive access to our joint venture partner’s development land pipeline and provides the potential to grow through select new developments and portfolio acquisitions with an experienced local developer in an attractively located growing market.
n
FURTHER EXPANSION THROUGH
DEVELOPMENTS AND ACQUISITIONS
Top to bottom: 5823 Newton Drive, San Diego CA; 2055 Diplomat Drive Dallas TX; Cornerstone Building, 1228 Cornerway Boulevard San Antonio TX
www.global-reports.com
26 DB RREEF Trust Annual Report 2007
our portfolio – north america (continued)
developments
During the year, one development was completed in our North American industrial portfolio and three development projects were underway, creating additional lettable area of approximately 496,545 square feet (46,131 square metres) with a total estimated value on completion of approximately US$114 (A$134) million. In addition, the North American industrial portfolio has two land parcels providing a further 39 acres (15.9 hectares) of development potential.
completed
Turnpike Distribution Centre, Medley, Florida – Located in Miami, on the Florida Turnpike, this US$21 (A$25) million development of a 268,119 square foot (24,908 square metre) distribution centre was completed in May 2007. The centre is 100 percent leased.
underway
Atlantic Corporate Park, Sterling, Virginia – See case study above.
Summit Oaks, Valencia, California – Construction on this 139,392 square foot (12,949 square metre) five storey Class A office building is progressing and is expected to be completed in the third quarter of 2008 with an estimated value on completion of US$51 (A$59) million. DB RREEF Trust has a 78 percent interest in this property.
n
n
n
The property is located in the Santa Clarita area, north east of Los Angeles at the intersection of State Route 126 and the Interstate 5 Freeway, and is within a strong growth market, close to Valencia Town Centre, 25 minutes drive to Burbank Airport and 40 minutes to downtown Los Angeles.
Beaumeade, Ashburn, Virginia – DB RREEF Trust is undertaking a development of approximately 137,131 square feet (12,740 square metres) with an estimated value on completion of US$18 (A$22) million and an expected yield on the cost of approximately eight percent.
The development, which is held in the US joint venture with CalWest, will comprise two flex-office buildings. Building 1 will be a 78,822 square foot (7,323 square metre) flex industrial building with a 24-foot clear height and rear loading docks. Building 2 will be a 58,309 square foot (5,416 square metre) flex office building with a 20-foot clear height and rear drive-in loading.
The Beaumeade development site is a 10.7 acre (4.3 hectare) infill development site in the Beaumeade Corporate Park in Ashburn, Virginia, and is approximately 27 miles from Washington DC. Construction is scheduled to commence in December 2007 with completion in early 2009.
n
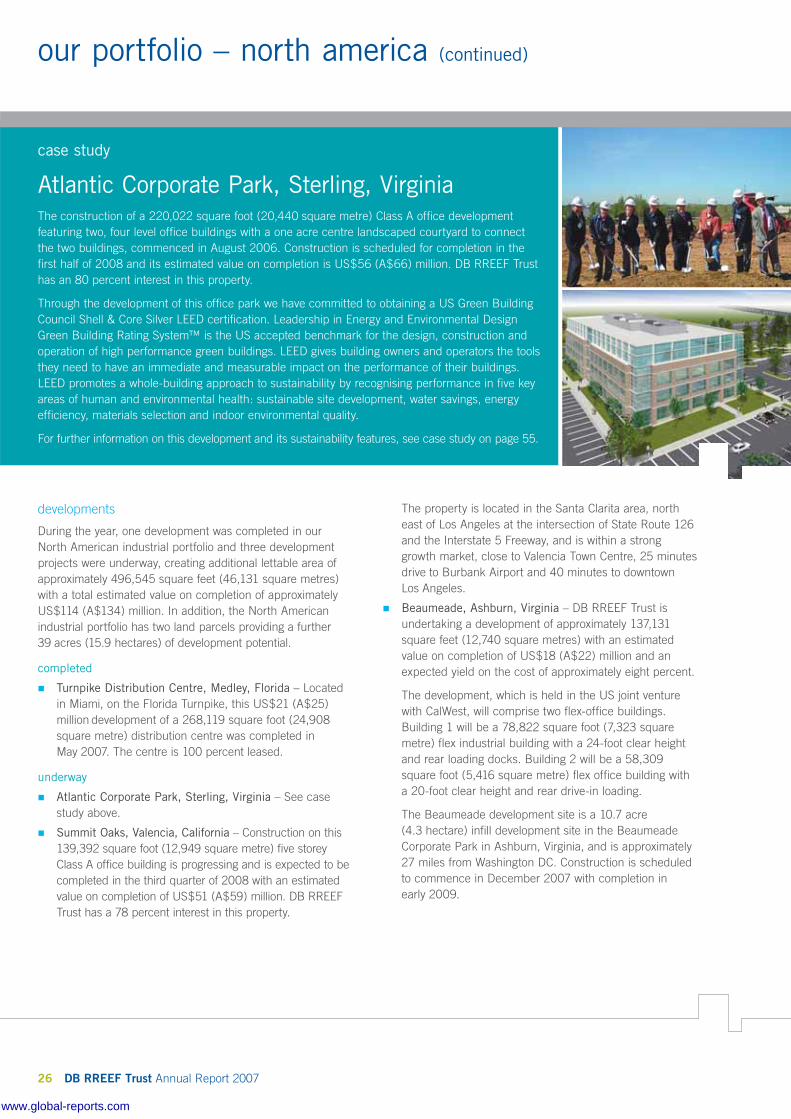
case study
Atlantic Corporate Park, Sterling, VirginiaThe construction of a 220,022 square foot (20,440 square metre) Class A office development featuring two, four level office buildings with a one acre centre landscaped courtyard to connect the two buildings, commenced in August 2006. Construction is scheduled for completion in the first half of 2008 and its estimated value on completion is US$56 (A$66) million. DB RREEF Trust has an 80 percent interest in this property.
Through the development of this office park we have committed to obtaining a US Green Building Council Shell & Core Silver LEED certification. Leadership in Energy and Environmental Design Green Building Rating System™ is the US accepted benchmark for the design, construction and operation of high performance green buildings. LEED gives building owners and operators the tools they need to have an immediate and measurable impact on the performance of their buildings. LEED promotes a whole-building approach to sustainability by recognising performance in five key areas of human and environmental health: sustainable site development, water savings, energy efficiency, materials selection and indoor environmental quality.
For further information on this development and its sustainability features, see case study on page 55.
www.global-reports.com
DB RREEF Trust Annual Report 2007 27
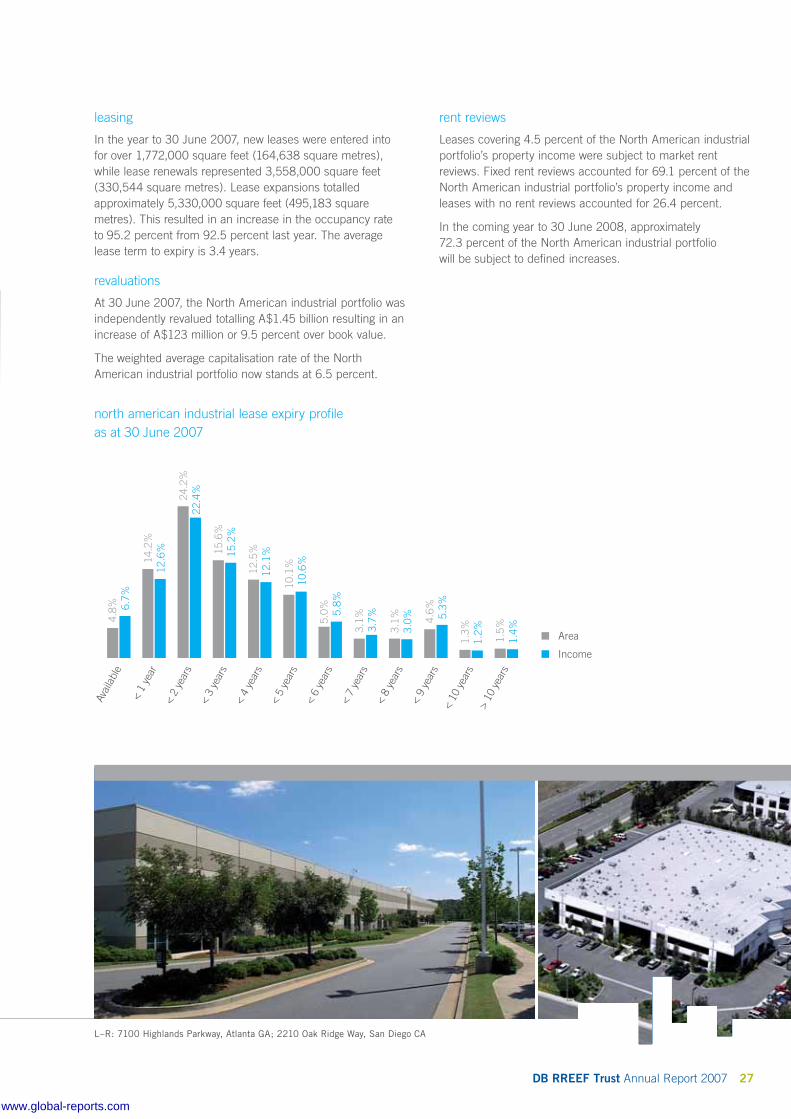
leasing
In the year to 30 June 2007, new leases were entered into for over 1,772,000 square feet (164,638 square metres), while lease renewals represented 3,558,000 square feet (330,544 square metres). Lease expansions totalled approximately 5,330,000 square feet (495,183 square metres). This resulted in an increase in the occupancy rate to 95.2 percent from 92.5 percent last year. The average lease term to expiry is 3.4 years.
revaluations
At 30 June 2007, the North American industrial portfolio was independently revalued totalling A$1.45 billion resulting in an increase of A$123 million or 9.5 percent over book value.
The weighted average capitalisation rate of the North American industrial portfolio now stands at 6.5 percent.
rent reviews
Leases covering 4.5 percent of the North American industrial portfolio’s property income were subject to market rent reviews. Fixed rent reviews accounted for 69.1 percent of the North American industrial portfolio’s property income and leases with no rent reviews accounted for 26.4 percent.
In the coming year to 30 June 2008, approximately 72.3 percent of the North American industrial portfolio will be subject to defined increases.
north american industrial lease expiry profile as at 30 June 2007
14.
2% 1
2.6%
4.8
% 6
.7%
24.
2% 2
2.4%
15.
6% 1
5.2%
12.
5% 1
2.1%
10.
1% 1
0.6%
5.0
% 5
.8%
3.1
% 3
.7%
3.1
% 3
.0%
4.6
% 5
.3%
1.3
% 1
.2%
1.5
% 1
.4%
Avai
labl
e
< 1
yea
r <
2 y
ears
< 3
yea
rs <
4 y
ears
< 5
yea
rs <
6 y
ears
< 7
yea
rs <
8 y
ears
< 9
yea
rs<
10 y
ears
> 10
yea
rs
Area
Income
L–R: 7100 Highlands Parkway, Atlanta GA; 2210 Oak Ridge Way, San Diego CA
www.global-reports.com

28 DB RREEF Trust Annual Report 2007
industrial portfolioThe European industrial portfolio contributed more than A$14 million in net property income to DB RREEF Trust. This contribution represents 2.7 percent of total net property income for the year to 30 June 2007. The European industrial portfolio is valued at A$344 million.
Leases were agreed for seven percent of the European industrial portfolio with occupancy reaching 92.8 percent and an average lease duration of 4.1 years.
At 30 June 2007, the European industrial portfolio comprised more than 372,209 square metres of net lettable area in 20 properties with 30 tenants. Distribution centres accounted for 100 percent of the portfolio.
Paris82,700m2
22.2% port/area¤55m value25.5% portfolio5 properties
Lyon27,350m2
7.4% port/area¤12m value5.6% portfolio1 property
Langenfeld37,314m2
10.0% port/area¤17m value7.6% portfolio2 properties
Düsseldorf13,781m2
3.7% port/area¤17m value7.9% portfolio1 property
Worms11,766m2
3.2% port/area¤4m value1.9% portfolio1 property
Berlin10,141m2
2.7% port/area¤11m value5.2% portfolio1 property
Löbau8,950m2
2.4% port/area¤1m value0.6% portfolio1 property
Friedewald15,539m2
4.2% port/area¤5m value2.5% portfolio1 property
Knetzgau21,361m2
5.7% port/area¤11m value4.8% portfolio1 property
Elhofen67,393m2
18.1% port/area¤38m value17.3% portfolio3 properties
Duisburg27,072m2
7.3% port/area¤21m value9.5% portfolio1 property
Unna27,444m2
7.4% port/area¤17m value8.1% portfolio1 property
Langenweddingen21,265m2
5.7% port/area¤8m value3.5% portfolio1 property
Lyon
Paris
Worms
Berlin
Löbau
FRANCE
GERMANYNorth Sea
Baltic Sea
Bay of Biscay
Ellhofen
Knetzgau
Friedewald
Langenweddingen
Langenfeld
UnnaDuisburg
Düsseldorf
our portfolio – europe
acquisitions
During the year DB RREEF Trust expanded further into Europe through the acquisition of a German industrial portfolio of 14 assets. This included the acquisition of the last industrial property in the German portfolio in Düsseldorf for €16.2 (A$27) million in June 2007.
revaluations
Revaluations resulted in a decrease in asset value of $7 million or 2.3 percent over portfolio book value. The weighted average capitalisation rate of the industrial portfolio now stands at 7.1 percent.
www.global-reports.com

DB RREEF Trust Annual Report 2007 29
16.
1% 1
5.6%
7.2
% 6
.8%
3.5
% 1
.6%
14.
0% 1
1.1%
7.6%
7.4
%
18.
2% 22.
1%
19.5
% 2
0.3%
7.5
% 6
.9%
0.0
% 0
.0%
0.0
% 0
.0%
6.4% 8.
0%
0.0
% 0
.0%
Avai
labl
e
< 1
yea
r
< 2
year
s
< 3
year
s
< 4
year
s
< 5
year
s
< 6
year
s
< 7
year
s
< 8
year
s
< 9
year
s<
10 y
ears
>10
year
s
Area
Income
european industrial lease expiry profile as at 30 June 2007
leasing
The French industrial portfolio occupancy remains at 87.7 percent with an average lease duration of 2.2 years (by income).
In Germany, a new lease was secured accounting for more than 13,781 square metres or 5.3 percent of the German industrial portfolio.
As a result, the German industrial portfolio occupancy remains high at 94.9 percent with an average lease duration of 5.1 years (by income).
rent reviews
Leases covering 100 percent of the French industrial portfolio’s property income were subject to fixed rent reviews based on the Construction Cost Index (CCI).
In the coming year to 30 June 2008, approximately 88 percent of the French industrial portfolio’s income will be subject to a CCI review.
ESTABLISHING OUR
EUROPEAN PRESENCE
Top to bottom: Duisburg Germany; 21 rue du Chemin Blanc, Champlan France; Straße 6, Unna Germany
www.global-reports.com
funds
management
report
overview
DB RREEF wholesale property fund
Direct mandates
DB RREEF property syndicates
Gateway, Sydney NSW
www.global-reports.com
DB RREEF Trust Annual Report 2007 31
overviewDB RREEF’s funds management business has a number of listed and unlisted property trusts, including DB RREEF Trust, DB RREEF RENTS Trust, DB RREEF Wholesale Property Fund (DWPF) and three property syndicates. It is also the investment manager for two direct property mandates, SAS Trustee Corporation (STC) and the AXA Group (AXA).
DB RREEF’s listed property portfolio comprises approximately $9 billion of direct property assets in Australia, New Zealand, the United States and Europe, and the unlisted property portfolio comprises approximately $4.6 billion of domestic assets.
In the year to 30 June 2007, the unlisted funds acquired approximately $359 million of new assets in the office, industrial and retail sectors. In addition, revaluations of the assets resulted in an increased value of $330 million.
DB RREEF has established a strong presence in the Australian unlisted property sector with over $4.6 billion of unlisted funds under management. DB RREEF’s unlisted funds have a strong track record of performance with average returns of 14.5 percent per annum over the five years to 30 June 2007.
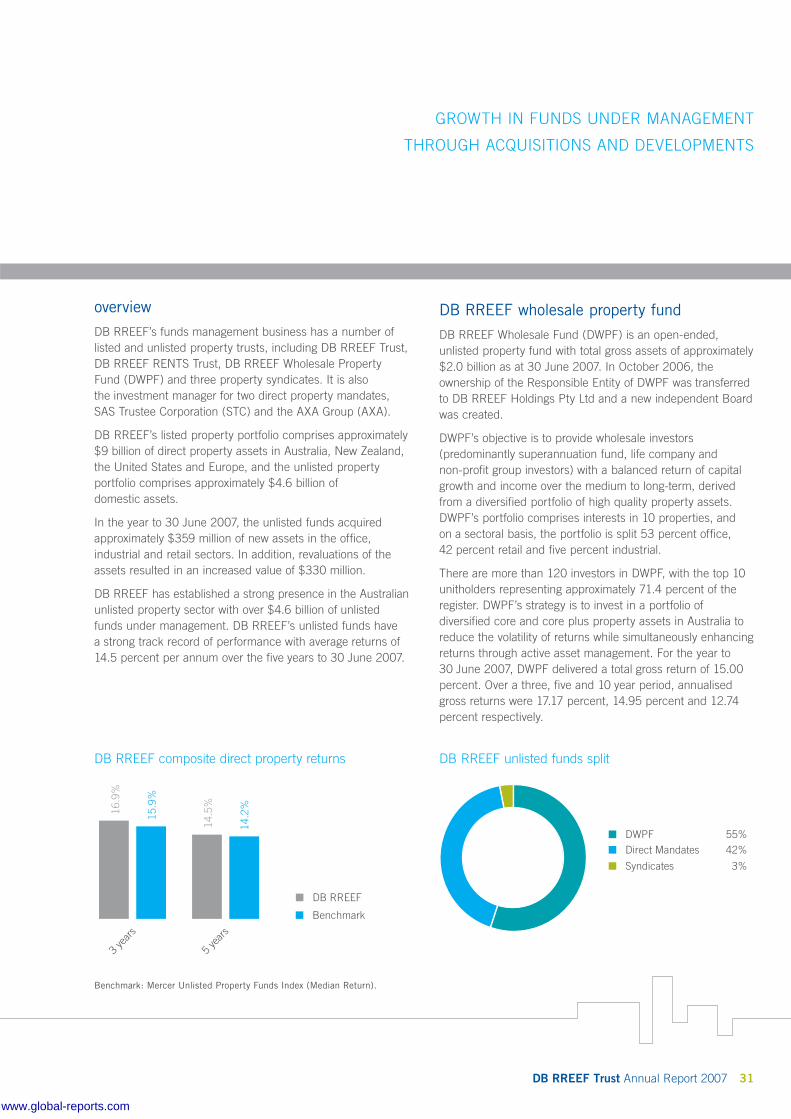
DB RREEF wholesale property fundDB RREEF Wholesale Fund (DWPF) is an open-ended, unlisted property fund with total gross assets of approximately $2.0 billion as at 30 June 2007. In October 2006, the ownership of the Responsible Entity of DWPF was transferred to DB RREEF Holdings Pty Ltd and a new independent Board was created.
DWPF’s objective is to provide wholesale investors (predominantly superannuation fund, life company and non-profit group investors) with a balanced return of capital growth and income over the medium to long-term, derived from a diversified portfolio of high quality property assets. DWPF’s portfolio comprises interests in 10 properties, and on a sectoral basis, the portfolio is split 53 percent office, 42 percent retail and five percent industrial.
There are more than 120 investors in DWPF, with the top 10 unitholders representing approximately 71.4 percent of the register. DWPF’s strategy is to invest in a portfolio of diversified core and core plus property assets in Australia to reduce the volatility of returns while simultaneously enhancing returns through active asset management. For the year to 30 June 2007, DWPF delivered a total gross return of 15.00 percent. Over a three, five and 10 year period, annualised gross returns were 17.17 percent, 14.95 percent and 12.74 percent respectively.
GROWTH IN FUNDS UNDER MANAGEMENT
THROUGH ACQUISITIONS AND DEVELOPMENTS
DB RREEF composite direct property returns
16.
9%
15.
9%
14.
5%
14.
2%
DB RREEF
Benchmark
3 ye
ars
5 ye
ars
DB RREEF unlisted funds split
Direct Mandates 42%
DWPF 55%
Syndicates 3%
Benchmark: Mercer Unlisted Property Funds Index (Median Return).
www.global-reports.com

32 DB RREEF Trust Annual Report 2007
funds management report (continued)
DWPF sector allocation by book value at 30 June 2007
Office 52.9%
Retail 41.9%
Industrial 5.2%
DWPF portfolio diversification by book value at 30 June 2007
Sydney Office 36.2%
Melbourne Office 29.6%
Brisbane Office 12.8%
Neighbourhood Retail 9.5%
Super Regional Retail 5.2%
Sub-regional Retail 3.9%
Sydney Industrial 2.7%
post-balance date event
acquisition of retail portfolio
DB RREEF Wholesale Property Fund entered into a conditional contract to acquire five of DB RREEF Trust’s shopping centres for an estimated consideration of $927.75 million.
The disposal to DWPF highlights the benefits of operating an integrated platform and is consistent with DB RREEF Trust’s plans to expand its third party funds management platform and expand the unlisted platform’s exposure to retail property.
direct mandatesDirect mandates comprise $2.39 billion of direct property assets at 30 June 2007, managed on behalf of SAS Trustee Corporation (STC) and the AXA Group (AXA) by DB RREEF Funds Management Limited. In total the two portfolios comprise 31 assets.
DB RREEF property syndicatesThe syndicate business consists of three unlisted trusts representing assets valued at approximately $196 million as at 30 June 2007. The syndicates have over 900 unitholders and are closed ended, fixed term products.
gordon property syndicate
This syndicate owns two retail assets, the Gordon Centre and the Gordon Village Arcade located in Gordon, NSW. At 30 June 2007 total assets of the syndicate were approximately $86.3 million.
northgate property syndicate
This syndicate owns the Northgate Shopping Centre at Glenorchy in Hobart, Tasmania. At 30 June 2007 total assets of the syndicate were approximately $91.4 million.
abbotsford property syndicate
This syndicate owns an office building in Abbotsford, Victoria. At 30 June 2007 total assets of the syndicate were approximately $18.5 million.
www.global-reports.com
about
DB RREEF
DB RREEF Head Office, 343 George Street, Sydney NSW
www.global-reports.com

DB RREEF is one of Australia’s largest integrated property groups, with properties in Australia, New Zealand, the United States and Europe. DB RREEF Trust is currently the sixth largest listed property trust and a Top 60 listed entity on the ASX, with a total market capitalisation of approximately $5.7 billion as at 30 June 2007.
The DB RREEF group is an integrated real estate platform with two core operating activities:
a direct property portfolio of approximately $9 billion as at 30 June 2007 and 198 properties
n
a 50 percent share in DB RREEF Funds Management Limited, a property funds management business, the remaining 50 percent being owned by a wholly owned Deutsche Bank subsidiary
DB RREEF Funds Management Limited is responsible for managing the group’s entire direct property portfolio, as well as approximately $4.6 billion of funds under management through three property syndicates, two direct property mandates for STC and AXA and a wholesale property fund (DB RREEF Wholesale Property Fund).
n
DB RREEF group
DB RREEF group structure
DB RREEF Trust Deutsche Bank
RENTS Investors
3rd Party Investors
100%
50%50%100%
DOT
DB RREEFRENTS Trust
DIT DDF
DRFM1
DB RREEF HoldingsDB RREEF Finance
DBPS DWPL2
STC Mandate
AXA Mandate
Syndicates
DWPF
DRO
1 DRFM is the Responsible Entity of DB RREEF Trust, DB RREEF RENTS Trust and the Syndicates.
2 DWPL is the Responsible Entity of DB RREEF Wholesale Property Fund (DWPF).
30 The Bond Gateway 45 Clarence Street One Margaret Street Australia Square GPT and GMT 309–321 Kent Street
34 DB RREEF Trust Annual Report 2007
www.global-reports.com

DB RREEF Trust Annual Report 2007 35
DB RREEF IS ONE OF THE LARGEST
INTEGRATED PROPERTY GROUPS IN
AUSTRALIA WITH $13.6 BILLION
IN FUNDS UNDER MANAGEMENT
These combine to give DB RREEF total funds under management of approximately $13.6 billion.
At 30 June 2007, the Australian and New Zealand assets represented approximately 81 percent of the value of DB RREEF’s property portfolio, with US and European assets making up the remainder.
DB RREEF’s investments are undertaken on both a wholly owned basis and through joint ventures with co-owners. DB RREEF has a strategic partnership with RREEF that provides access to global real estate investment opportunities and research expertise.
The group is committed to the long-term integration of sustainability practices throughout its property portfolio.
DB RREEF Trust’s operating model
50%50%100%100%
DWPF($2.0bn)
Private Clientmandates ($2.4bn)
Syndicates($200m)
AustralianIndustrial ($679m)
Funds, asset & developmentmanagement
Direct($9.0bn)
Deutsche BankDB RREEF Trust Security Holders
Developments $2.2bn(plus 3rd party development management of $800m)
FUM $13.6bnTotal Assets $9.0bn
3rd Party($4.6bn)
Office($4.0bn)
Industrial($1.8bn)
Retail($1.2bn)
US Industrial($1.4bn)
European Industrial ($0.4bn)
Direct property ownership Developments($2.2bn)
Australia($7.0bn)
International($1.8bn)
US Industrial($268m)
Australian Retail($225m)
Australian Office($1.0bn)
Above and left: DB RREEF Head Office, 343 George Street, Sydney NSW
www.global-reports.com

36 DB RREEF Trust Annual Report 2007
board of directors
Christopher T Beare BSc, BE (Hons), MBA, PhD, FAICDChair and Independent Director Age 56
Chris Beare has a wealth of experience in technology, finance and investment. He joined investment bank Hambros Australia in 1991, becoming head of corporate finance in 1994 and joint Chief Executive in 1995, serving until Hambros was acquired by Société Générale in 1998. During that period Hambros was active in infrastructure, telecoms and media. Chris remained a Director of SG Australia until 2002. From 1998, he helped form Radiata (a technology start-up spanning Sydney and Silicon Valley). As Chair and Chief Executive Officer, he then steered it to a successful sale to Cisco Systems in 2001. For four years prior to joining Hambros, Chris was Executive Director of the Melbourne-based Advent Management venture capital firm. Chris has been a director of a number of companies in the finance, infrastructure and technology sectors. Chris is both the Chair and an Independent, Non-Executive Director of DB RREEF Funds Management Limited. He is also the Chair of the Board Nomination and Remuneration Committee and a member of the Board Treasury Policy Committee.
Elizabeth A Alexander AM BComm, FCA, FAICD, CPAIndependent Director Age 64
Elizabeth Alexander was formerly a partner with PricewaterhouseCoopers and is currently Chairman of CSL Limited and a Director of Boral Limited, Deputy Chair of the Financial Reporting Council, and a member of the Takeovers Panel. Elizabeth’s previous appointments include National Chair of the Australian Institute of Company Directors, National President of the Australian Society of Certified Practising Accountants and a member of the Australian Accounting Standards Board. Elizabeth is also Chair of a number of Board audit committees. Elizabeth is an Independent, Non-Executive Director of DB RREEF Funds Management Limited and Chair of the Board Audit Committee.
Barry R Brownjohn BComm Independent Director Age 56
Barry Brownjohn is a senior consultant with Pacific Road Corporate Finance where he focuses on advising companies on strategic acquisitions and divestments in the financial services and related technology sectors. He was formerly the Australian Managing Director of the Bank of America. While with the Bank of America, Barry held a range of senior management roles in various overseas locations. He is currently an Advisory Board Member of the South Australia Financing Authority, and a Director of Citigroup Pty Limited and Bakers’ Delight Holdings Limited. Barry’s previous appointments include Chair of the International Banks and Securities Association, and the Asia Pacific Managed Futures Association. Barry is an Independent, Non-Executive Director of DB RREEF Funds Management Limited, Chair of the Board Treasury Policy Committee and a member of the Board Audit Committee.
Stewart F Ewen OAM FILEIndependent Director Age 58
Stewart Ewen has had over 40 years of extensive property experience, commencing with the Hooker Corporation in 1966 where he worked throughout Australia and South East Asia. In 1983 he established Byvan Limited which, by 2000, managed $8 billion in shopping centre assets in Australia, Asia and North America. In 1999, he sold his interest in Byvan to the Savills Group in London, remaining as Chair until 2001. As the major partner of NavyB Pty Ltd he has completed numerous residential and commercial property projects. He has also held the position of Managing Director of Enacon Ltd, was previously a Director of Abigroup Ltd, and was instrumental in the establishment of Converting Technology Pty Ltd. Stewart has previously served as President of the Property Council of NSW and is a Director of the Cure Cancer Australia Foundation and assisted in the establishment of Cell Bank Australia. Stewart is also a Director of CapitaCommercial Trust Management Limited, Singapore. Stewart is an Independent, Non-Executive Director of DB RREEF Funds Management Limited and a member of the Board Nomination and Remuneration Committee.
www.global-reports.com

DB RREEF Trust Annual Report 2007 37
Andrew J Fay BAg Econ (Hons), ASIAAlternate Director to Charles B Leitner III Age 42
Andrew Fay is Head of Deutsche Asset Management Australia Limited (DeAM), as well as its Chief Investment Officer for Australia. Andrew is dually responsible for the operation of DeAM’s Australian business and the consistency of the investment process for all asset classes within Australia. Andrew joined DeAM in 1994 after six years with the investment division of AMP Global Investors. Andrew sits on the Investment and Financial Services Association (IFSA) Investment Board in Australia. Andrew holds an Honours degree in Agricultural Economics from the University of Sydney and has completed a graduate diploma with the Securities Institute of Australia. Andrew is Deutsche Bank’s nominated Alternate Director to Charles Leitner.
Victor P Hoog Antink BComm, MBA, FCA, FAPI, MAICDExecutive Director Age 53
Victor Hoog Antink joined DB RREEF after almost nine years at Westfield Holdings where he was the Director of Funds Management, responsible for both the Westfield Trust and the Westfield America Trust. Victor has a commerce degree from the University of Queensland, an MBA from the Harvard Business School, is a fellow of the Australian Property Institute, a fellow of the Institute of Chartered Accountants in Australia, and a member of the Institute of Company Directors. Victor has over 25 years of experience in property and finance and is the immediate past president of the Property Council of Australia. Victor is CEO and an Executive Director of DB RREEF Funds Management Limited and a member of the Board Treasury Policy Committee. Victor is a Deutsche Bank nominated Director.
Charles B Leitner III BANon-Executive Director Age 47
Charles Leitner is the Global Head of RREEF, the global alternative investments operation of Deutsche Asset Management, which manages €65.3 billion of real estate, infrastructure, private equity and hedge fund investments worldwide. With 23 years of real estate investment experience, Charles joined RREEF in 1988 and became a partner in the firm in 1996. In 2001 he assumed overall responsibility for RREEF’s US property acquisition business and in 2004 was appointed Global Head of RREEF. Based in New York, Charles graduated from the University of Pennsylvania with a BA in Urban Studies/Regional Science. He is a Trustee of the Urban Land Institute, and a member of the Real Estate Roundtable, the National Association of Office and Industrial Parks, and the Pension Real Estate Association (PREA). Charles is a Non-Executive Director of DB RREEF Funds Management Limited and is a Deutsche Bank nominated Director.
Brian E Scullin BEcNon-Executive Director Age 56
Following a career in government and politics in Canberra, Brian Scullin was appointed the inaugural Executive Director of the Association of Superannuation Funds of Australia (ASFA) in 1987. He joined Bankers Trust in Australia in 1993 and held a number of senior positions, becoming President of Japan Bankers Trust in 1997. In 1999 he was appointed Chief Executive Officer – Asia/Pacific for Deutsche Asset Management and retired from this position in 2002. Brian is a panel member of the Financial Industry Complaints Service Limited and a Director of State Super Financial Services Limited. Brian is a Non-Executive Director of DB RREEF Funds Management Limited, Chair of the Board Risk and Compliance Committee and is a member of the Board Nomination and Remuneration Committee. Brian is a Deutsche Bank nominated Director.
www.global-reports.com
corporate
responsibility and
sustainability
our approachachievements about DB RREEFour peopleour communityour propertiesour environmental programlooking forward
30 The Bond, Sydney NSW
www.global-reports.com
DB RREEF Trust Annual Report 2007 39
our approachAt DB RREEF we strive to be a market leader in sustainability. For almost a decade, the group has been implementing programs which promote environmentally sustainable management practices and appropriate corporate social responsibility. In 1998, the group commenced a program to review our environmental impact, and we have been measuring and reporting on this ever since.
As one of Australia’s largest property owners, managers and developers, we take our responsibilities seriously with regards to sustainability and corporate responsibility. This is in line with our commitment to the highest standards of ethics and integrity, as well as acting responsibly as a good corporate citizen.
Our group-wide, holistic approach aims to fulfil the environmental, social and economic requirements of our properties, while meeting and striving to exceed the needs of our people, tenants, investors and the wider community. We aim to minimise the overall environmental impact of our operations, both in the development of new properties, and the management and refurbishment of existing properties. Our sustainability management programs are tailored to each property in accordance with best practice principles.
Sustainability strategies are increasingly being demanded by tenants, employees, investors, analysts, regulators and the wider community. This is particularly evident at DB RREEF where our tenants are predominantly major corporate and government organisations with exacting sustainability requirements of their own.
At DB RREEF we also take a pragmatic approach: all sustainability initiatives are undertaken after identifying a positive return under appropriate social, environmental and financial criteria. We focus on reducing the environmental and social impact of our operations without compromising economic viability or investor returns.
We believe that security holders’ value is enhanced by creating a sustainable working environment at our properties that is attractive to tenants and, in turn, enables them to increase business productivity and lower operational costs by becoming more resource-efficient. In the longer term, we believe this approach will see increased demand for DB RREEF properties, thereby contributing to further earning increases to investors.
Our strength lies not only in our track record, but in our holistic approach to sustainability. We apply triple bottom line reporting, that is, we consider the environmental, social and economic impact of our operations, not just resource efficiency. To reflect this approach, we have decided to expand our third sustainability report this year to a new Corporate Responsibility and Sustainability (CR&S) report.
At the time of writing this report, we had achieved, or were progressing on schedule, all target initiatives detailed in our 2006 sustainability report. These achievements are listed on page 40.
The DB RREEF Board, management team and employees are proud of our CR&S achievements to date. These were accomplished with the support of our entire team and through engaging our tenants, contractors, suppliers and corporate partners to support sustainable business practices.
Looking ahead, we have committed further resources to ensure that we remain at the forefront of the property sector in sustainability management practices. Key challenges and targets for 2008 include:
implementation of portfolio-wide resource consumption targets
green project opportunities to be implemented at every office property including waste reduction, energy saving and water efficiencies
expanding our market leading office sector initiatives to our industrial and retail sectors
We look forward to reporting back to you on our progress in next year’s CR&S report.
Christopher T Beare Victor P Hoog AntinkChair Chief Executive Officer
n
n
n
AT DB RREEF WE ARE COMMITTED TO CORPORATE
RESPONSIBILITY AND THE LONG-TERM INTEGRATION OF
SUSTAINABILITY PRACTICES THROUGHOUT OUR BUSINESS
www.global-reports.com

40 DB RREEF Trust Annual Report 2007
achievements DB RREEF’s Corporate Responsibility and Sustainability achievements over the last year include:
corporate reporting and ratings
Improving standards and transparency of our reporting and achieving external rating recognition
Completed our new Corporate Responsibility and Sustainability Report, in alignment with the GRI G3 frameworkCompleted our second annual Carbon Disclosure Project (CDP) reportAchieved our second year of constituency listing on the FTSE4Good IndexDeveloped a new Climate Change Strategy Received recognition for our progress on climate change: DB RREEF was named a Top 10 winner in a Citigroup Research report on Climate ChangeRecorded GHG1 emissions resulting from the group’s operations, including flights and waste disposalContinued to improve the green credentials, operational and environmental performance of the DB RREEF workplace
n
n
n
n
n
n
n
our people
Reinforcing CR&S as an integral part of our business and rolling out employee engagement initiatives
Rolled out a new DB RREEF Green Leaders program to our office sectorRolled out our first Employee Opinion Survey and subsequent action planLaunched our new online Sustainability Portal including interactive Environmental and OHS&L manuals and toolkits for Property Management teamsFormed a new Sustainability Working Group with cross sector representation to develop and promote initiatives group-wide
n
n
n
n
our community
Improving our participation with engagement of and communications to our tenants, investors and the wider community
Developed a Tenant Sustainability Guide to assist tenants to integrate sustainable practices into their businessesImproved the availability and transparency of CR&S information via a new Sustainability section on the DB RREEF websiteIncorporated Principles for Fair Contracting into all new service agreementsInitiated community support activities across the portfolioParticipated in and encouraged tenants to join the Earth Hour lights off event in March 2007 (over 600 tenants in 25 of our Sydney office buildings took part)Joined 3CBDs Greenhouse initiative, committing to obtaining a 4 Star ABGR2 rating for our head office tenancy
n
n
n
n
n
n
our properties Greening up and future-proofing our existing stock and developments
Collected 100 percent of environmental data for all properties in our portfolio through the rollout of our Global Resource Reporting InitiativeOn track for early completion of Green Star rating assessments for all existing office properties in Australia (target December 2007)On track for early completion of GHG emissions/ABGR benchmarking for all office properties within the Australian portfolio (target December 2007)Purchased 15 percent Green Power for the Australian office portfolio’s electricity consumption – one of the single largest allotments in the Australian property industryIntegrated sustainability considerations into all new developments and capital projects, for example: Space 1 Bligh û Sydney – 5 Star ABGR and 6 Star Green StarAll properties are fully compliant with our Environmental and Occupational Health Safety and Liability Risk management programsCommenced rollout of new Green Cleaning contracts as new contracts are tendered (eight office properties to date)Commenced smart metering (electricity, gas and water) across our office properties in AustraliaEstablished targets for resource3 consumption, GHG emissions and property-specific improvements to environmental performance ratingsCommenced an environmentally sound procurement project with preference given to cost-effective products which have superior environmental performance
n
n
n
n
n
n
n
n
n
n
1 GHG = Greenhouse Gas.
2 ABGR = Australian Building Greenhouse Rating.
3 DB RREEF defines resources as energy, water and waste to landfill.
cr&s – achievements
www.global-reports.com
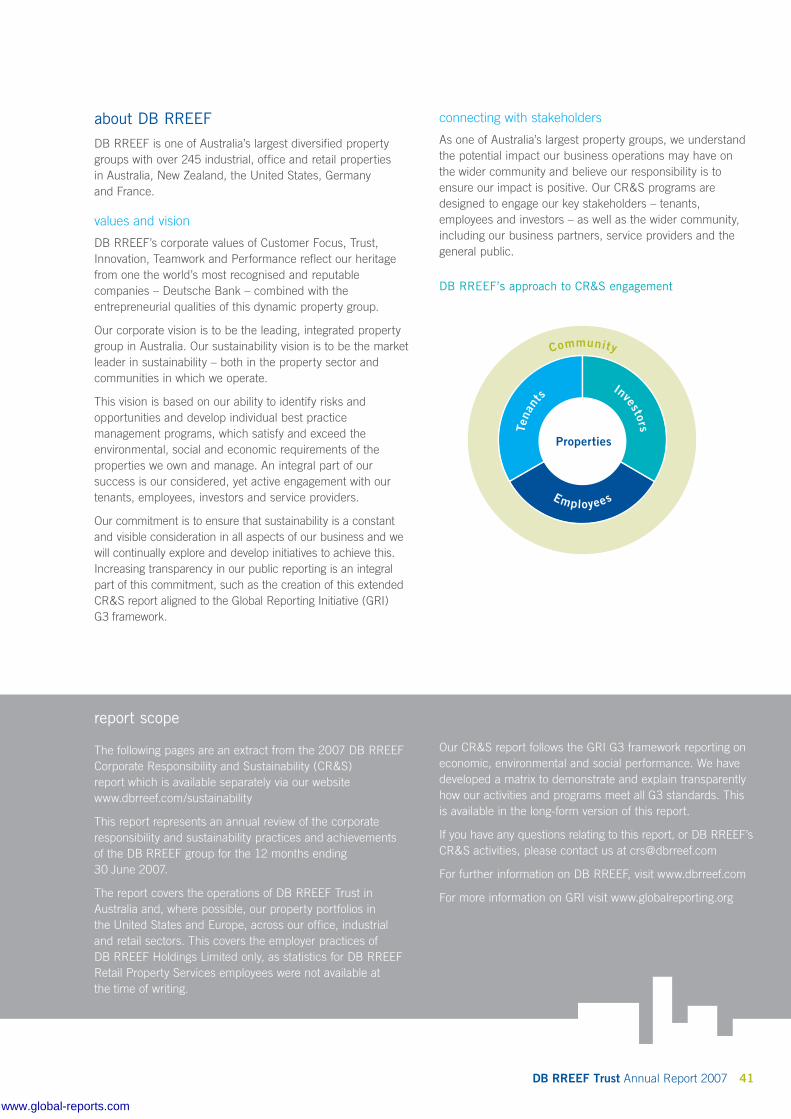
DB RREEF Trust Annual Report 2007 41
about DB RREEF DB RREEF is one of Australia’s largest diversified property groups with over 245 industrial, office and retail properties in Australia, New Zealand, the United States, Germany and France.
values and vision
DB RREEF’s corporate values of Customer Focus, Trust, Innovation, Teamwork and Performance reflect our heritage from one the world’s most recognised and reputable companies – Deutsche Bank – combined with the entrepreneurial qualities of this dynamic property group.
Our corporate vision is to be the leading, integrated property group in Australia. Our sustainability vision is to be the market leader in sustainability – both in the property sector and communities in which we operate.
This vision is based on our ability to identify risks and opportunities and develop individual best practice management programs, which satisfy and exceed the environmental, social and economic requirements of the properties we own and manage. An integral part of our success is our considered, yet active engagement with our tenants, employees, investors and service providers.
Our commitment is to ensure that sustainability is a constant and visible consideration in all aspects of our business and we will continually explore and develop initiatives to achieve this. Increasing transparency in our public reporting is an integral part of this commitment, such as the creation of this extended CR&S report aligned to the Global Reporting Initiative (GRI) G3 framework.
connecting with stakeholders
As one of Australia’s largest property groups, we understand the potential impact our business operations may have on the wider community and believe our responsibility is to ensure our impact is positive. Our CR&S programs are designed to engage our key stakeholders – tenants, employees and investors – as well as the wider community, including our business partners, service providers and the general public.
DB RREEF’s approach to CR&S engagement
Community
Tena
nt
s Investors
Employees
Properties
report scope
The following pages are an extract from the 2007 DB RREEF Corporate Responsibility and Sustainability (CR&S) report which is available separately via our website www.dbrreef.com/sustainability
This report represents an annual review of the corporate responsibility and sustainability practices and achievements of the DB RREEF group for the 12 months ending 30 June 2007.
The report covers the operations of DB RREEF Trust in Australia and, where possible, our property portfolios in the United States and Europe, across our office, industrial and retail sectors. This covers the employer practices of DB RREEF Holdings Limited only, as statistics for DB RREEF Retail Property Services employees were not available at the time of writing.
Our CR&S report follows the GRI G3 framework reporting on economic, environmental and social performance. We have developed a matrix to demonstrate and explain transparently how our activities and programs meet all G3 standards. This is available in the long-form version of this report.
If you have any questions relating to this report, or DB RREEF’s CR&S activities, please contact us at [email protected]
For further information on DB RREEF, visit www.dbrreef.com
For more information on GRI visit www.globalreporting.org
www.global-reports.com
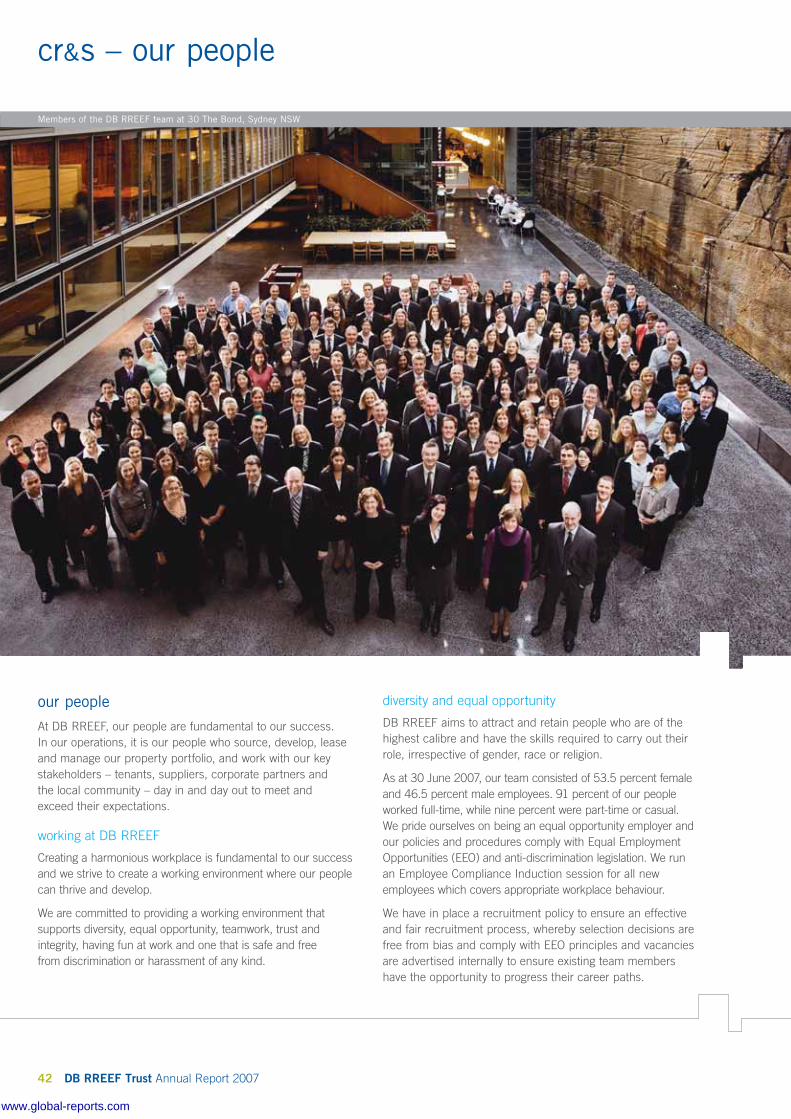
42 DB RREEF Trust Annual Report 2007
cr&s – our people
our peopleAt DB RREEF, our people are fundamental to our success. In our operations, it is our people who source, develop, lease and manage our property portfolio, and work with our key stakeholders – tenants, suppliers, corporate partners and the local community – day in and day out to meet and exceed their expectations.
working at DB RREEF
Creating a harmonious workplace is fundamental to our success and we strive to create a working environment where our people can thrive and develop.
We are committed to providing a working environment that supports diversity, equal opportunity, teamwork, trust and integrity, having fun at work and one that is safe and free from discrimination or harassment of any kind.
diversity and equal opportunity
DB RREEF aims to attract and retain people who are of the highest calibre and have the skills required to carry out their role, irrespective of gender, race or religion.
As at 30 June 2007, our team consisted of 53.5 percent female and 46.5 percent male employees. 91 percent of our people worked full-time, while nine percent were part -time or casual. We pride ourselves on being an equal opportunity employer and our policies and procedures comply with Equal Employment Opportunities (EEO) and anti-discrimination legislation. We run an Employee Compliance Induction session for all new employees which covers appropriate workplace behaviour.
We have in place a recruitment policy to ensure an effective and fair recruitment process, whereby selection decisions are free from bias and comply with EEO principles and vacancies are advertised internally to ensure existing team members have the opportunity to progress their career paths.
Members of the DB RREEF team at 30 The Bond, Sydney NSW
www.global-reports.com
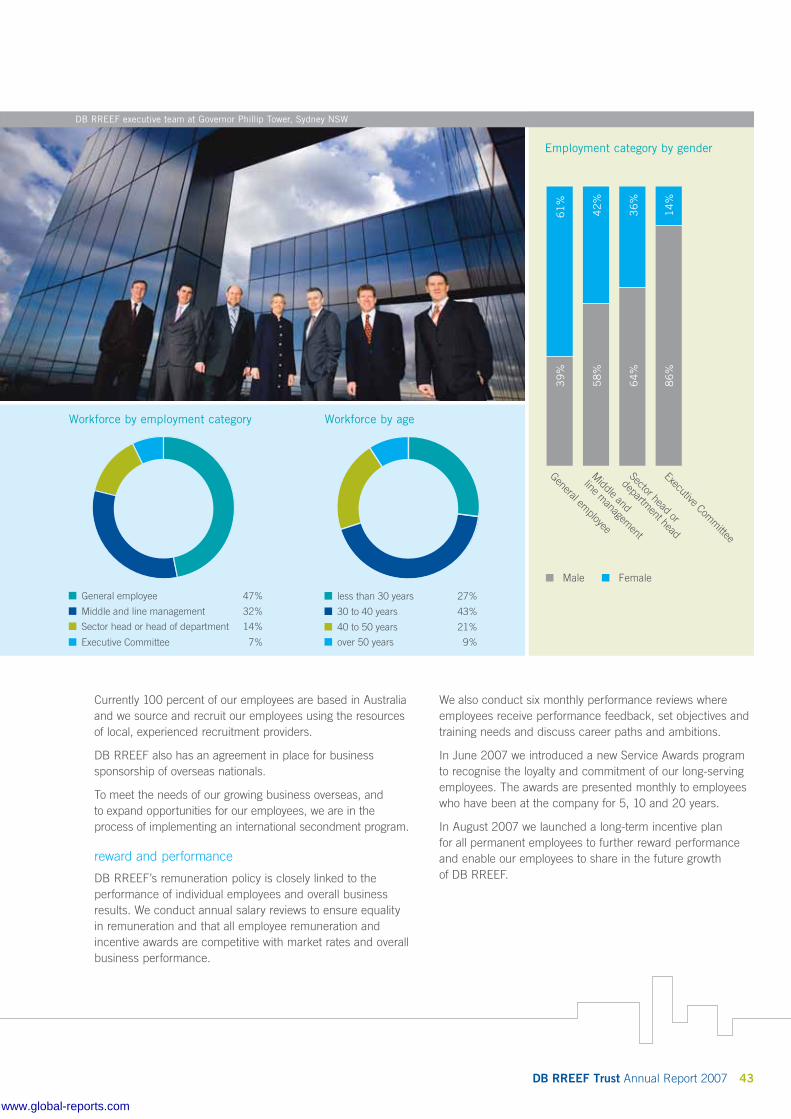
DB RREEF Trust Annual Report 2007 43
Workforce by employment category Workforce by age
Currently 100 percent of our employees are based in Australia and we source and recruit our employees using the resources of local, experienced recruitment providers.
DB RREEF also has an agreement in place for business sponsorship of overseas nationals.
To meet the needs of our growing business overseas, and to expand opportunities for our employees, we are in the process of implementing an international secondment program.
reward and performance
DB RREEF’s remuneration policy is closely linked to the performance of individual employees and overall business results. We conduct annual salary reviews to ensure equality in remuneration and that all employee remuneration and incentive awards are competitive with market rates and overall business performance.
We also conduct six monthly performance reviews where employees receive performance feedback, set objectives and training needs and discuss career paths and ambitions.
In June 2007 we introduced a new Service Awards program to recognise the loyalty and commitment of our long-serving employees. The awards are presented monthly to employees who have been at the company for 5, 10 and 20 years.
In August 2007 we launched a long-term incentive plan for all permanent employees to further reward performance and enable our employees to share in the future growth of DB RREEF.
5
8%
4
2%
6
4%
3
6%
8
6%
1
4%
Male Female
General employee
Middle and
line managem
ent
Sector head or
department head
Executive Comm
ittee
3
9%
6
1%
Employment category by gender
General employee 47%
Middle and line management 32%
Executive Committee 7%
Sector head or head of department 14%
less than 30 years 27%
30 to 40 years 43%
40 to 50 years 21%
over 50 years 9%
DB RREEF executive team at Governor Phillip Tower, Sydney NSW
www.global-reports.com
44 DB RREEF Trust Annual Report 2007
open communications and employee engagement
We believe that engaging our people in the business and in key initiatives such as corporate responsibility and sustainability is critical to our success. We have developed a number of training tools and communication forums to increase the knowledge and involvement of our teams.
At DB RREEF, we strive to actively engage our people and we have rolled out a number of initiatives to improve communication, better understand our people, gather feedback and exchange ideas. We have in place a management culture which promotes open communication through a flat management structure, open door policy and open plan offices. We have an active intranet to share news and information and an online feedback system to encourage idea sharing, best practice and suggestions for improvement.
In December 2006, we conducted our first Employee Opinion Survey (EOS) to measure engagement and receive feedback from our employees (see case study below).
In response to survey feedback, we introduced in 2007 a new quarterly newsletter and monthly Business Update Sessions to increase information sharing and networking across our multi-site teams. In 2007/2008 we will be investigating more team building activities and forums.
The property industry is a dynamic and fast-paced sector. To address this, and maintain the highest levels of employee satisfaction, we continually monitor and review our HR policies and engagement programs to retain and attract talent. We also actively review the marketplace to ensure we offer competitive and attractive remuneration packages. We complete exit interviews to learn from each departure and report findings to our Executive Committee monthly. In August 2007 we launched a new succession and talent pipeline program.
having fun at work
We believe that for our people to succeed and thrive they need a balance and so, as part of our commitment to “having fun at work”, we have in place a Social Committee which runs regular social functions. The Social Committee also organises events that include families, such as our annual Family Day and a visit from Santa in December.
cr&s – our people (continued)
case study 1
annual employee opinion surveyIn December 2006, we conducted the inaugural DB RREEF Employee Opinion Survey and received an overwhelming response with 70 percent of employees taking part – an excellent result for a first-time survey. The survey covered topics such as my role, my manager, leadership, training and communication. Employees were given the option of completing the survey anonymously and responses were collated by an independent service provider to ensure data integrity.
Stand-out results from the survey show that our people are proud to work for DB RREEF (98 percent) and would recommend DB RREEF as an employer (80 percent).
The results also indicated that employees enjoyed their roles and responsibilities, valued the group’s professionalism, believe innovation is encouraged within teams, that there is cohesiveness between teams and managers, and that the company has good growth potential. In addition, our working environment rated highly as one of the most satisfying elements of working at DB RREEF. We attribute this in part to the redevelopment of our heritage head office into a modern, light-filled and sustainable workspace.
The survey results indicated areas for improvement in training, career development, communication and work-life balance initiatives. In response we developed, and began rolling out, a number of initiatives in the first half of 2007:
multi-million dollar financial and document management systems to improve workflows, business productivity and work-life balance
internal newsletter, monthly business update presentations and an intranet feedback/ideas system to facilitate information sharing and communication
new training programs and an increased training budget to further develop the careers of our people
succession planning program
option to purchase 10 days additional leave annually
n
n
n
n
n
www.global-reports.com

DB RREEF Trust Annual Report 2007 45
case study 2
green leaders programAs part of our policy to actively engage our people and deliver successful sustainability initiatives, we created a Green Leaders program which we rolled out across the Sydney office portfolio in March 2007 and plan to implement in the retail and industrial portfolios in 2007/2008.
Under the Green Leaders program, we nominate one employee at each of our buildings to help meet DB RREEF’s sustainability aspirations by engaging tenants in environmental and sustainability programs, and helping make our buildings more resource efficient.
The Green Leaders’ role involves:
acting as the key point of contact for green/sustainability initiatives within each property management team
managing and assisting with the rollout of sustainability projects, for example, Resource Efficiency and Earth Hour
assisting property management teams with monthly reporting of resource consumption and green projects
reporting to DB RREEF on green/sustainability initiatives and case studies
networking with other Green Leaders
As a symbolic gesture of our green credentials and true to our belief in sourcing environmentally friendly materials where viable, our new Green Leaders are presented with a DB RREEF Green Leader t-shirt made from Australian organic cotton.
n
n
n
n
n
Death and Total and Permanent Disablement (TPD) insurance
incentivised Employee Referral Scheme
salary packaging options
annual flu immunisations
regular in-chair massages
Our head office in Sydney, a heritage building, was refurbished in 2005 to offer the best in workplace amenity, with:
large open floor space
floor-to-floor connectivity via an internal staircase spanning three levels
maximised access to natural light
100 percent fresh air supply through our chilled beam system
café and breakout spaces
Our head office has received external recognition, including a Master Builders Association Excellence in Construction award for Refurbishment, Renovation, Extension. The results of our Employee Opinion Survey showed that our people also value the high quality of our head office workspace.
n
n
n
n
n
n
n
n
n
n
employee wellbeing and benefits
At DB RREEF we are committed to the health and wellbeing of our employees, as it is vital to our success as an organisation. We offer flexible work practices, including flexible working hours and sabbaticals. In July 2007 we introduced a policy to enable full-time employees to purchase up to 10 additional annual leave days each year as part of our commitment to improving work-life balance.
All permanent, full-time and part-time employees are entitled to the same benefits, including:
paid maternity and paternity leave
access to an external Employee Assistance Program (EAP) – a free, confidential counselling and advisory service for employees and their families
annual study allowance and study/exam leave
annual allowance for professional memberships and professional magazine subscriptions
private health insurance discounts
travel discounts
n
n
n
n
n
n
www.global-reports.com

46 DB RREEF Trust Annual Report 2007
cr&s – our people (continued)
training, learning and professional development
DB RREEF supports our employees in their roles and encourages professional development to ensure our people have the most up-to-date industry knowledge and skills.
All DB RREEF employees are encouraged to undertake internal and external training each year, supported by a training budget, and take ownership of their professional development through the completion of annual personal development plans.
Currently our employees complete on average 30 hours training each year, the results of which are reported monthly to the Executive Committee.
average training hours per employee per category
Executive Committee 55 hours
Sector heads 27 hours
General employees 17 hours
Management 20 hours
Our Study Assistance Policy provides an annual allowance for employees to undertake formal qualifications such as undergraduate and postgraduate university study and specialist programs provided by recognised educational institutions and industry associations. The aim of this policy is twofold – to support our people in their ongoing personal and professional development, and to contribute to DB RREEF’s ongoing success. Employees are also entitled to claim the cost of one professional membership each year that is relevant to their role.
We also run training and information awareness events to improve employee understanding of key issues and business functions. In the area of sustainability and risk management, for example, we run annual Sustainability and Risk Management seminars for our Australian and New Zealand property management teams.
occupational health and safety programs
At DB RREEF we recognise a duty of care to all stakeholders including employees, clients, tenants, managing agents, contractors and visitors, and we ensure our obligations are met in relation to Occupational Health, Safety and Liability (OHS&L). DB RREEF is pleased to report that our rate of incidents, injury and lost days are very low with only one employee suffering a minor injury in the full-year period. Overall responsibility for OHS&L lies with the Risk Management Committee (see committee structure diagram on page 47).
We currently have two OHS&L systems in place:
corporate OHS&L
The Corporate OHS&L management system requires all DB RREEF employees to undertake a compulsory general induction and provides further information in the Employee Handbook to ensure full awareness of employee OHS&L responsibilities.
property OHS&L
DB RREEF also has a Property OHS&L management system in place that identifies, manages and monitors OHS&L practices to mitigate against the potential for harm within our properties. Each year, external auditors assess each property’s OHS&L performance according to a 5 Star performance rating system and key criteria, including:
fire systems and management
hazard and contractor management
first aid
building design and operation
emergency response plans
Each property is awarded a performance scorecard, a corresponding star rating and an improvement plan. This system enables DB RREEF to significantly minimise the OHS&L risk associated with each property, identify key areas that require additional resources and strive for best practice in this critical area of property management and operations.
Each year we also reward properties for best practice in the OHS&L area, such as in 2006:
Riverside Corporate Park, 25 Donkin Street, South Brisbane won Best Individual/Team Award for their demonstrated commitment to the OHS&L program, proactive approach and the improvement to their performance score.
88 Shortland Street, Auckland, New Zealand won the Most Improved Property Award for the team’s focus on enhancing contractor management and addressing all issues raised in their first OHS&L audit in 2005.
n
n
n
n
n
n
n
www.global-reports.com

DB RREEF Trust Annual Report 2007 47
corporate responsibility
At DB RREEF we believe a reputation of honesty and integrity is essential. We have a Code of Conduct that sets out guidelines to assist employees in ensuring that their conduct meets the highest ethical and professional standards.
In addition, DB RREEF has the following compliance policies and procedures in place, applicable to all employees:
Employee Trading
Gifts, Benefits & Entertainment
Inside Information and Insider Trading
Suspect Transactions and Anti-Money Laundering
Transaction Registration, Conflict Clearance and Related Party Dealings
All new DB RREEF employees attend a face to face Compliance Induction session, which is supplemented by refresher training. All policies are reviewed and updated annually and new training is provided as required. Adherence to policies is recorded by business units on a quarterly basis, is subject to ongoing monitoring by Compliance and is supported by an internal audit program.
public policy
DB RREEF does not currently have a formalised policy on participation in public policy development and lobbying, however, all employees are required to conduct themselves in an appropriate manner that does not bring DB RREEF’s reputation into disrepute. We do have strict rules regarding the payment or acceptance of gifts or benefits to third parties, as set out in our Gifts, Benefits & Entertainment Compliance Policy. This policy prohibits financial or in-kind contributions to political parties and politicians and there have been no gifts, benefits or donations made to political parties or politicians in 2006/2007.
product and customer privacy compliance
DB RREEF has numerous policies in place to ensure customer privacy and compliance with applicable regulations and laws.
To ensure appropriate and accurate customer communications, all marketing and communications materials are reviewed and signed off by the respective Heads of Marketing and Communications, Legal, Compliance and the relevant Property department. We also have in place a unique, online Marketing Approval Database to facilitate this sign-off process, which also acts as a database and audit trail for all external marketing and communications materials.
n
n
n
n
n
sustainability reporting lines and governance structure
At all times we endeavour to act in accordance with corporate responsibility and governance principles, through our commitment to the highest standards of ethics and integrity in our business and acting responsibly as a good corporate citizen.
DB RREEF, its business and practices are monitored by the Board of Directors. Sustainability considerations are embedded in our management forums and corporate governance, for example, our cross-divisional sustainability working group reports to the Risk Management Committee. For further information on DB RREEF’s corporate governance structure, please refer to our Corporate Governance Statement on page 58 or visit our website at www.dbrreef.com/governance
Board
Risk Management Committee– COO– Fund Manager, DB RREEF Trust– Head of Unlisted– Head of Compliance– General Counsel– Manager, Building Services– Business Operations Manager
Compliance & Internal Audit Committee– COO– Head of Compliance – General Counsel– Chief Financial Officer– Head of Unlisted Funds– Fund Manager, DB RREEF Trust
Board Risk & Compliance Committee
Sustainability Working Group– Head of Retail– Head of Industrial– Head of Office– Manager, Building Services– Development Manager– Fund/Trust Manager– Marketing & Communications Manager
Health and Safety Working Group– Health and Safety officers from each office
www.global-reports.com

48 DB RREEF Trust Annual Report 2007
our community: connecting with our stakeholders
community involvement
Simple, imaginative initiatives that engage and inspire our stakeholders provide ideal opportunities to raise awareness of social and environmental issues. An example of such an initiative is our support of the Earth Hour event in March 2007 (see case study below).
In May 2007, we signed up to 3CBDs Greenhouse Initiative (a partnership of City of Sydney, North Sydney and Parramatta Councils) joining more than 30 corporate participants in the challenge to reduce GHG emissions and tackle climate change. Under the 3CBDs initiative, DB RREEF has committed to achieve an accredited 4 Star or higher NABERS1 Energy/ABGR tenancy rating for our head office. This is in line with our commitment to reduce our environmental footprint.
community giving program
During the 2006/2007 financial year, DB RREEF supported a number of community initiatives at an individual, team and corporate level. These included:
Think Pink Day
Leukaemia Foundation
Movember
Salvation Army
Jeans for Genes Day
St Johns Ambulance
Cure Cancer Australia Foundation
n
n
n
n
n
n
n
Legacy
Landcare
Red Cross
St. Vincent De Paul
The Cancer Council
State Emergency Services (SES)
n
n
n
n
n
n
The community and charitable organisations we support are determined by our teams who work with, live in and understand the local community’s needs best. In addition to financial donations, we donate our time and provide space in our properties for charities and community groups to fund raise and profile their activities.
DB RREEF recognises that community participation is an integral part of its business and is in the process of reviewing its policies to ensure greater community participation is undertaken in the coming years. The progress of this review will be the subject of future CR&S reporting. Key objectives anticipated include the alignment of our community engagement strategy with our CR&S strategy to achieve maximum community engagement in the areas in which we operate, leveraging the size and reach of our business.
tenant engagement
Our tenants are our customers, and in order to improve our communication with them, we have created an online portal with a secure login system providing:
a Tenant Document Library with access to all tenant related documents including tenant information packs, fit-out conditions and emergency procedures
a Tenant Service Request (TSR) System where tenants can lodge service requests and track the property management team’s performance in actioning and resolving their requests. At the time of writing this report, a total of 197,402 TSRs had been submitted, demonstrating the popularity of this tenant communications tool
a Tenant Notice Board and email broadcast service to communicate building related events
n
n
n
cr&s – our community
case study 3
Earth Hour“As environmental issues come to the forefront of the national and international political agenda, it’s time for businesses to step up and take the lead on sustainability initiatives. By taking part in Earth Hour in our offices and encouraging our 600-plus corporate tenants in the 25 buildings we own and manage in Sydney to participate, DB RREEF hopes to raise awareness about how the property industry can make a lasting commitment to the environment and sustainability practices.”
DB RREEF CEO, Victor Hoog Antink
On 31 March 2007, DB RREEF took part in Earth Hour, a joint initiative of the World Wildlife Fund and the Sydney Morning Herald to promote awareness of energy efficiency and reduction in lighting usage. Companies, government departments and households in Sydney were invited to turn off their lights for one hour between 7.30 and 8.30pm.
DB RREEF signed up to the initiative as a corporate participant at our George Street head office. We also committed our entire Sydney office portfolio (25 properties) and encouraged our office tenants to take part. With more than 600 tenants participating, this event was a resounding collaborative success.
1 National Australian Built Environment Rating System, formerly ABGR.
www.global-reports.com

DB RREEF Trust Annual Report 2007 49
As at 30 June 2007, the online portal was available to over 60 of our office and industrial properties. The system effectively engages tenants and assists us in providing efficient, high quality property management services.
investor engagement
DB RREEF has dedicated Investor Relations teams for its property funds to ensure investors are adequately informed and updated regarding their investments. In addition, we have an investor relations program in place to maintain regular and timely contact. In order to gain a better understanding of our investors’ requirements and improve our investor communications, DB RREEF engaged an independent consultant to complete an Investor Perception Survey in 2006. We used the findings of this survey to enhance our existing investor relations communications.
industry engagement
As a leading property company, we actively engage in the property industry and are members of local, regional, state and national industry bodies including the Property Council of Australia, Facilities Management Association of Australia, Green Building Council and the Australian Property Institute.
As part of our commitment to industry engagement, we are proud to support the development and enhancement of environmental rating tools. For example, we are currently trialling the re-released Green Star Office Existing and the Green Star Shopping Centre tools, developed by the Green Building Council. These tools rate each property on their environmental performance and provide direction about what improvements are required now and into the future to meet market, tenant and investor expectations.
case study 4
Laverton North – developing buildings in partnership with our clientsColes Distribution Centre (CDC) in Laverton North, Victoria is a 42,000 square metre chilled distribution centre. It includes a 10,000 square metre (-25ºC) freezer and a 25,000 square metre (-2ºC) chilled room and supplies all of Coles’ Victorian supermarkets. Completed in February 2007, it forms part of DB RREEF’s 160 hectare Laverton North Industrial Estate.
The design of the centre was driven by a detailed brief provided by the customer at the commencement of the project. DB RREEF together with its design and construction contractor and Coles’ Project Manager, developed and improved the brief to a fit-for-purpose design. This design brief incorporated spatial requirements, down to the smallest details.
Coles and DB RREEF’s development team worked closely together from commencement through to completion, to ensure delivery of a building that was perfectly suited for Coles’ long-term operational requirements.
security and emergency management (SEM) program
DB RREEF has adopted a balanced and realistic approach to security, terrorist threats and emergency risk management and our SEM program aims to identify, manage and monitor risks at each property. Key initiatives for the SEM program this year have been:
working with the Shopping Centre Council of Australia on ATM ram raids within shopping centres
planning for major dignitary visits and assessing their effect on commercial business districts and specifically our office portfolio
planning for CBD mass evacuation programs
planning for major events such as the APEC 2007 forum in Sydney
development and implementation of a monthly Security eNewsletter to our property management teams
DB RREEF works closely with the authorities, our security consultants, our tenants and the wider community to ensure security risks and issues are managed and communicated appropriately.
n
n
n
n
n
www.global-reports.com

50 DB RREEF Trust Annual Report 2007
cr&s – our properties
case study 6
sustainability in developments: Space 1 Bligh û Sydney
“Space 1 Bligh û Sydney will revolutionise the way people are able to work together. It will bring a completely new perspective to workspace design, sustainability and energy efficiency, and create a working space that people will enjoy experiencing day by day.”
DB RREEF CEO, Victor Hoog Antink
Space 1 Bligh û Sydney is our latest and most prominent development in Australia and marks the next generation in office design and sustainability. The transparent, elliptical-shaped premium grade office building will be constructed on the corner of Bligh, Bent and O’Connell Streets, in the heart of Sydney’s financial district and will make a profound impact on the CBD skyline and enhance the existing streetscape.
The 42,000 square metre building has been designed to achieve a world’s best practice 6 Star Green Star rating and a 5 Star ABGR rating. The key sustainability feature of the building, and one which will maximise Sydney Harbour views and access to sunlight, is the fully glazed double-skin façade – a first in Australia.
case study 5
existing buildings on life-cycle assessmentsA vital step in future-proofing our existing properties is determining where they are within their life-cycle. To achieve this, DB RREEF commenced a “Technical Asset Management” project which addresses:
a detailed and up to date asset registers
life-cycle assessment on all assets
condition assessment on all assets
capital expenditure forecasts
replacement cost assessments
tax and depreciation schedules
n
n
n
n
n
n
our propertiesAt DB RREEF we aim to minimise the overall environmental impact of our operations, both in the development of new properties, and the management and refurbishment of existing properties.
investing in sustainability
DB RREEF recognises that investment in environmental management not only reduces our footprint, but adds value to the services we offer and attracts potential tenants and employees. It also brings direct commercial advantage via reduced resource consumption and competitive insurance premiums, bringing financial savings to our tenants as well as environmental benefits. In addition, our investment in sustainability can bring positive social benefits such as a reduced environmental footprint, tenant and employee satisfaction and positive corporate citizenship.
At DB RREEF we believe the greatest challenge and opportunity facing the property industry is future-proofing. Significant resources have been applied to determining how and what needs to be done to our existing properties to ensure they meet the demands of future tenants, the challenges of climate change and appropriate resource management.
We have already started the future-proofing process through the refurbishment of our corporate headquarters in Sydney. We transformed a heritage listed building into a state-of-the-art, resource efficient, highly functional and productive work space. Our approach to future-proofing our existing properties is explained in Case Study 5.
sustainability initiatives for acquisitions and developments
DB RREEF assesses each new development and acquisition to ensure they meet and exceed the expectations of our stakeholders via:
identifying and understanding each project’s sustainability and green credentials
identifying opportunities to improve these credentials while taking into consideration the cost and social and environmental benefits
ensuring the development is future-proofed
DB RREEF is a leader in developing properties to world best practice standards in sustainability and green credentials. For example:
30 The Bond, Sydney, Australia’s first 5 Star office building, is owned and managed by DB RREEF and so far has won over 30 sustainability, environmental and design awards
Space 1 Bligh Street û Sydney (see Case Study 6)
123 Albert Street, Brisbane, a 5 to 6 Green Star Rating and a 4.5 to 5 Star ABGR
n
n
n
n
n
n
www.global-reports.com

DB RREEF Trust Annual Report 2007 51
The double-skin façade comprises two layers of glass; an outer glass skin separated by a large ventilated cavity from an inner double glazed skin. The cavity contains adjustable and retractable automatic horizontal blinds which shade the internal skin and dramatically reduce solar heat gain while maintaining the harbour views.
Other sustainability features contributing to the 6 Star Green Star rating include black water recycling for the bathroom flushing systems and recycled rain water for irrigation. An innovative tri-generation system will use gas to generate energy for the building’s cooling, heating and electricity, and roof-mounted evacuated tube solar panels will produce heat for electricity.
A full height atrium provides high quality access to daylight and fresh air and dynamic views throughout the building, from each floor up, across and down, through the building. Glass lifts travelling through the atrium core will further enhance the experience. Twin off-set cores, a full height atrium and ceilings of 2.85 metres enhance space and air flow and provide horizontal and vertical connectivity.
Large, flexible floor plates of approximately 1,600 square metres, and a lack of perimeter columns will further enhance the lightness and transparency of the façade. The innovative design offers any tenant, large or small, the utmost flexibility in terms of maximising floor space.
Naturally ventilated space in the atrium for reception, break-out and meeting rooms provides a spectacular working environment. The development also incorporates a large, sun-filled forecourt and entry hall, accessible to the public during working hours and enhancing the public space of Farrer Place.
This project is being rolled out to all properties in Australia. The benefits of the program include:
providing consistent and independent capital expenditure forecasting, life-cycle costing and condition assessments
enabling asset and property management teams to determine with greater accuracy when major works and refurbishments should be planned
ensuring assets reach their effective lives by tracking their condition more closely
enabling a better understanding of the impact of the asset’s maintenance and service delivery, ensuring we maximise each asset’s performance physically and financially
optimising tenant and leasing strategies.
This information is then coupled with the properties overall strategic asset plan including its leasing profile to quickly and holistically determine an appropriate repositioning strategy for each property. This is true life-cycle based asset management at work.
n
n
n
n
n
www.global-reports.com

52 DB RREEF Trust Annual Report 2007
cr&s – our environmental program
our environmental programDB RREEF’s commitment to environmental best practice is demonstrated through our Environmental Management Program which has been developed to the international standard for Environmental Management Systems (ISO 14001: 2004) and complies with relevant legislation.
Through this program we identify and control environmental impacts on our properties with the objective of reducing or eliminating environmental impact caused by the property or DB RREEF’s associated operational activities. Our properties are subject to an annual independent audit carried out by our environmental consultants to measure their performance against environmental benchmarks.
We promote best practice to our stakeholders by ensuring that all employees, managing agents, contractors, service providers and tenants are made aware of the impact of their actions on the environment and conduct their activities in an environmentally responsible manner. This is supported by training and communication tools.
our environmental footprint
At DB RREEF we take an integrated approach to minimising our environmental footprint. We have followed the GRI G3 guidelines to assess our environmental footprint which we define as the consumption and use of resources, and our impact on the environment at a corporate and property level, as shown below.
DB RREEF’s environmental footprint
Scope 1: Direct fuel consumption
and onsite fuel use 6,403 tCO2e
Scope 3:Indirect emissions from fuel extraction,
production transport and transmission loss
49,858 tCO2e
Scope 2: Indirect emissions
from electricity consumption
194,539 tCO2e
Air Travel (Head Office employees)240.5 tCO2e
Total Greenhouse Gas (GHG) Emissions*
251,042 tCO2e
* GHG emissions arising from the global portfolio represent properties located within the United States, Australia and New Zealand. The Global Resource Reporting Initiative captures emissions arising from DB RREEF controlled aspects of the portfolio (100 percent of the portfolio within our scope of control).
Throughout this report, tCO2e represents tonnes of carbon dioxide equivalent.
measuring our biodiversity impact
DB RREEF operates primarily in metropolitan areas and our developments are generally on brown-field sites, thereby limiting our biodiversity footprint and impact on ecosystem services (such as water, air, soil, flora and fauna).
We have assessed our interaction with ecosystem services and perceive our greatest impact is through our organisational activities in the areas of:
land use (our property portfolio and infrastructure)
extraction (our use of natural resources for building materials)
outputs (our emissions, including GHG emissions)
We measure and report on our performance in regard to biodiversity principally via:
internal and external reporting
the Carbon Disclosure Project (CDP) – our second report is available on our website
the requirements under the Energy Efficiency Opportunities Act
n
n
n
n
n
n
Electricity Total Electricity Purchased 211,175,069.1 kWh
Gas Total Onsite Consumption 118,598,720.7 MJ
Air Travel Total Air Travel 2,105,251 km
Short Haul (less than 500 km) 37,837 km
Medium Haul (less than 1,600 km) 735,663 km
Long Haul (more than 1,600 km) 1,331,751 km
GHG Emissions 240.5 tCO2e
Paper Total Paper Consumed 13,792.8 kg
Water Total Water Consumption 113,323,845 KL
Waste Total Waste Generated 85,000 m3
Total Waste Recycled 15,694 m3
Waste Diversion Rate 18.5%
www.global-reports.com

DB RREEF Trust Annual Report 2007 53
our carbon footprint
Since our last Sustainability Report we have implemented programs that allow us to estimate our entire portfolio’s total GHG emissions. The table above shows our carbon footprint for the 2006 calendar year. This has been calculated following methodologies within the Greenhouse Gas Protocol: A Corporate Accounting and Reporting Standard (Revised Edition), developed by the World Resources Institute (WRI) and the World Business Council for Sustainable Development (WBCSD).
climate change risks, opportunities and strategy
Climate change presents an array of risks to the property industry, including commercial, regulatory and physical risks. At DB RREEF we recognise the need to proactively consider, understand and address the risks presented by climate change and as such, we address climate change within our risk management framework and our sustainability program.
The indirect risks associated with climate change are generally related to rising energy, fuel and water costs. Accordingly we have implemented a suite of proactive measures, with the aim of achieving greater building efficiencies, positive stakeholder relations and reduced environmental impact.
Through our operations DB RREEF has already gained valuable experience in responding to resource shortages, whether imposed by regulation or natural processes. The progressive implementation of the Green Building and Resource Management System is establishing a structured platform and management system from which to continue to proactively manage future resource shortages. Stakeholder education has been shown to be critical to success, and we provide considerable information and training to tenants and property management teams to enable skills and knowledge to be enhanced.
We are pleased to report that in acknowledgement of our ability to respond to climate change, DB RREEF was listed as a Top 10 “winner” in a Citigroup Research report covering climate change in ASX Top 100 companies, released in November 2006.
emissions and CDP global reach
DB RREEF’s Global Resource Reporting initiative was established in late 2006 and our property management teams began capturing the following emissions data for DB RREEF controlled aspects of the portfolio in 2007 (see table above).
Scope 1: Emissions from direct fuel consumption at our properties. Fuels include natural gas, diesel, and distillate oil used to power combustion engines, boilers and stand-by generators. It should be noted that emissions arising from hydrofluorocarbons (HFCs) in refrigeration and air conditioning equipment are not currently included, however, a key action for next year is to establish a baseline for these emissions.
Scope 2: Indirect emissions from the consumption of electricity purchased by DB RREEF for use within properties.
Scope 3: Emissions from fuel extraction, production, transport and transmission loss arising from our energy purchases. Scope 3 emissions from Australian properties are included. Other countries of operation will be included as relevant emissions factors become available.
This data capture and analysis mechanism enables the global portfolio to identify and report on GHG emissions from our properties in the United States, Australia and New Zealand. The industrial properties acquired in France and Germany will be accounted for in future reporting periods.
GHG calculations for 2006 are based on the consumption of resources managed by DB RREEF in the “base building”, but excludes GHG emissions arising from tenant activities.
Further analysis of our emissions is presented in our 2007 Carbon Disclosure Project (CDP) report, available at www.dbrreef.com/sustainability
n
n
n
AUS/NZ emissions (tCO2e) USA emissions (tCO2e) Totals
Scope 1 emissions
Scope 2 emissions
Scope 3 emissions
Scope 1 emissions
Scope 2 emissions
Scope 3 emissions
Office 4,556.0 114,255 29,489.3 0* 0* 0* 148,300.3
Retail 1,585.3 57,563.3 16,332.4 0* 0* 0* 75,481.0
Industrial 250.6 16,520.6 3,611.6 11.9 6,059.3 156.5 26,610.5
Car Parks 0* 141.7 268.22 0* 0* 0* 409.92
Totals 6,391.9 188,480.6 49,701.52 11.9 6,059.3 156.5 250,801.7
All emissions are base building (i.e. common areas) unless marked * in which case there are no base building emissions.
annual GHG emissions by sector and by emission scope
www.global-reports.com

54 DB RREEF Trust Annual Report 2007
our response to managing our environmental footprint
We have developed a Green Building and Resource Management System (GBRMS) to manage our environmental footprint. This system is currently being rolled out across our Australian office portfolio, where the greatest efficiency gains can be made.
The GBRMS involves three phases, as detailed below, and we are currently on track to complete Phase 1 for all Australian office buildings by the end of 2007.
Phase 1: Green Profiling
The initial phase measures each property’s green building and resource performance and establishes its environmental performance rating under:
NABERS/Water
Green Star/Office Existing Ratings
n
n
Phase 2: Green Project Opportunities
Under Phase 2, we identify opportunities to improve the environmental performance of our buildings by developing a “Property-specific Green List” of projects to action.
As part of this process we assess each project’s impact on the building’s environmental performance rating and resource efficiency, and calculate its cost-benefit.
Phase 3: Implementing Tailored Projects
The GBRMS helps our property asset and management teams to develop tailored and comprehensive environmental management projects for each property. Having identified a list of projects to action in Phase 2, each project is then considered against the overall strategic asset plan of each property and then progressively implemented.
DB RREEF plans to roll out the GBRMS across the industrial and retail sectors in future reporting periods.
Post-implementation, our property and asset managers will continue to monitor, manage and improve each property’s environmental management performance.
cr&s – our environmental program (continued)
Entry level to Green Building andResource Management System
Target Green BuildingHealthy, safe and productive workplace
Energy, water and waste efficientLow carbon footprint
Environmentally compliant
Initial Green RatingsGreen Star & NABERS
Target Green Ratings
Phase 2: Green Project Opportunities
Phase 1: Green Profiling
Phase 3:Implementing Tailored
Programs
Monitor, Manage and
Improve
The Green Building and Resource Management System
www.global-reports.com

DB RREEF Trust Annual Report 2007 55
resource efficiency
We take a three tiered approach to resource efficiency:
reduce our use of resources
reuse resources through projects such as water harvesting and recycling
offset our use of resources through projects such as our purchase of Green Power
To assist in the environmental monitoring and management process, we are progressively installing smart meters throughout our office portfolio for real time monitoring of all electricity, gas and water use. We produce Monthly Resource Management Reports to enable our property management teams to monitor resource usage (electricity, gas, water and waste) and to track the rollout of initiatives against targeted reductions at a portfolio-wide and property-specific level.
energy consumption
DB RREEF’s office buildings consume the greatest amount of energy of the property sectors in which we operate. A large amount of energy is consumed in providing base building services, such as heating, ventilation, air conditioning, lifts and underground car parks. Consequently, the office sector is the focus of our energy efficiency initiatives.
n
n
n
The following graph shows DB RREEF’s total annual energy consumption, broken down by energy type and property sector.
DB RREEF’s total annual energy consumption in 2006
Electricity
Natural gas
100,000
0
200,000
300,000
400,000
DeiselOffice Retail Industrial
Ene
rgy
cons
umpt
ion
(GJ)
We are proud to report that many of our property management teams have already identified and implemented a number of opportunities for energy reduction. We expect the portfolio’s footprint will decline steadily with the continued expansion of the GBRMS.
case study 7
Atlantic Corporate Park – US Silver LEEDDB RREEF is currently developing two, Class A, multi-tenant office buildings totalling 220,000 square feet in Virginia US. To be known as Atlantic Corporate Park, the buildings have been designed to achieve a US Green Building Council Core and Shell Silver LEED certification (equivalent to an Australian Rating of a 4 Star Green Star Rating).
The Leadership in Energy and Environmental Design (LEED) Green Building Rating System™ is the accepted benchmark in the US for the design, construction and operation of high performance green buildings. LEED gives building owners and operators the tools they need to have an immediate and measurable impact on their buildings’ performance. LEED promotes a whole-building approach to sustainability and recognises performance in five key areas: sustainable site development; water savings; energy efficiency; materials selection; and indoor environmental quality.
To obtain the LEED certification we have designed Atlantic Corporate Park with the following sustainable aspects as per LEED defined criteria:
Sustainable sites – white roof, inclusion of bus stopsand developing tenant guidelines on sustainability
Water efficiency – recycled water for water features and landscaping, water free urinals, dual flush toilets
Optimise energy performance – energy efficient HVAC and electrical systems
Materials and recyclables – using regional/local materials, dedicated recycling areas, recycling manual for tenants
Indoor air quality – increased ventilation, construction IAQ plan, low emitting materials, thermal control
Innovation and design process – use of LEED accredited professionals providing education to all stakeholders on the design process and green housekeeping
Supporting alternative transportation via the inclusion of bike storage, showers and locker facilities
Construction waste management – reviewing best practice policies
n
n
n
n
n
n
n
n
www.global-reports.com

56 DB RREEF Trust Annual Report 2007
water
DB RREEF operates in regions facing challenging water shortages and to address this we combine portfolio-wide water-saving initiatives with industry and regulatory schemes.
DB RREEF is currently piloting water-saving projects such as rainwater harvesting at our industrial business parks and waterless urinals in our office properties. We are also working in partnership with a number of our major tenants to evaluate options for converting existing office buildings to grey and black water recycling.
We are currently finalising our Eco and Water Wise Landscaping Guidelines, to be rolled out across the portfolio in 2007/2008. These guidelines specify native and drought-tolerant plant species to be used for landscaping, and promote water saving initiatives such as the use of harvested rainwater for irrigation across the portfolio.
We take an active role in industry engagement and we are a member of Sydney Water’s Every Drop Counts program, and have completed Water Savings Action Plans (NSW) and Water Efficiency Management Plans (QLD) on our water-intensive properties.
water discharges and pollutants
Water discharges from our properties typically emanate from cooling towers, storm water runoff and manufacturing processes conducted by our tenants. Our Environmental Management Program recognises water discharge as a potential risk and we undertake annual site inspections and audits to ensure that all water leaving our properties complies with regulatory requirements as a minimum.
In addition, we require that any potential pollutants used at our properties, such as chemicals and fuels, are stored within secondary containment, ensuring that storm water pollution and associated ecosystem degradation is prevented.
waste
In 2006, we commenced profiling of current waste performance and associated emissions across the portfolio. As at December 2006, our total waste to landfill for the year was 85,000 cubic metres, representing 19,379 tCO2e. A total of 15,694 cubic metres of waste was recycled, representing an 18.5 percent diversion rate.
DB RREEF is committed to continually improving our waste management and recognises the importance of “reducing, reusing and recycling”. Accordingly, we are investigating a number of waste monitoring and recycling programs for the industrial, retail and office sectors to ensure every property reduces their waste generation.
Our property management teams access waste management procedures via our online Environmental Manual and seek the specialist advice of our external auditors, ensuring waste is disposed of in accordance with applicable legislation. In addition, we require that all our waste management contractors are licensed and all waste management documentation is reviewed annually by external auditors.
business travel
Each year, DB RREEF employees travel considerable distances by air to manage and service our national and international portfolio. While our property management teams are locally based, head office staff accumulated a total of 2,105,251 kilometres (1,308,097 miles) between May 2006 and April 2007 (12 month period).
This year, we have focused on establishing a baseline for air travel emissions, and going forward, we will investigate our options for offsetting these emissions.
Annual emissions arising from business travel
Flight type Definition Total distance
(km)
Scope 3 emissions
(tCO2e)
Short haul less than 500 km 37,837 5.7Medium haul less than 1,600 km 735,663 88.3Long haul more than 1,600 km 1,331,751 46.5
Totals 2,105,251 240.5
Notes: Based on GHG Protocol (2007) and a workforce of 240 employees. Source: GHG Protocol, Greenhouse Gas Protocol (2007). Calculation Tools – CO2 Emissions from Business Travel – www.ghgprotocol.org
supply chain strategy
A further way to reduce our environmental footprint is through the selection of environmentally friendly suppliers. Intelligent procurement is essential to reducing the amount of waste generated by our business operations and we work closely with suppliers to specify, where possible, products that are environmentally sound. For example, in the past 12 months we have appointed a supplier who provides environmentally sound toilet requisites.
long-term performance
Our goal is to anticipate and respond to the environmental impacts arising from our business operations and properties to continue to lead the way in sustainability initiatives in the built environment.
We will continue to optimise the performance of our new developments and existing buildings to ensure they are responsive to climate change and meet regulatory requirements and market expectations of sustainability best practice.
cr&s – our environmental program (continued)
www.global-reports.com
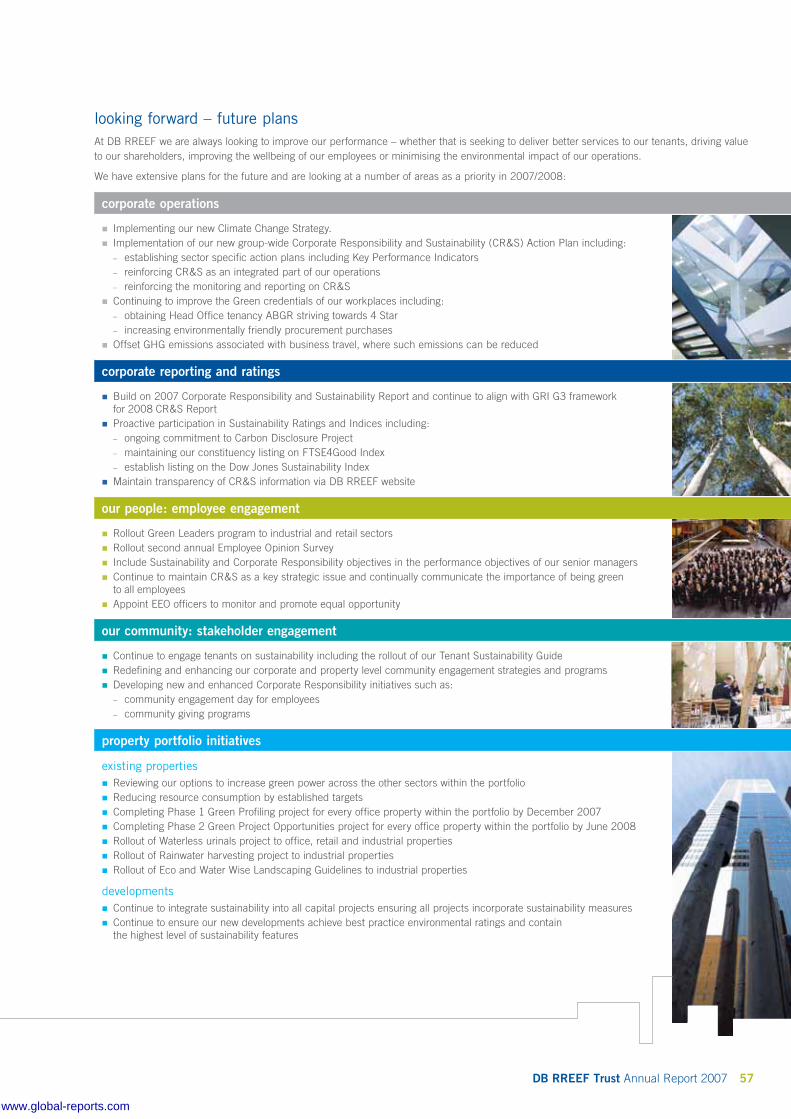
DB RREEF Trust Annual Report 2007 57
looking forward – future plansAt DB RREEF we are always looking to improve our performance – whether that is seeking to deliver better services to our tenants, driving value to our shareholders, improving the wellbeing of our employees or minimising the environmental impact of our operations.
We have extensive plans for the future and are looking at a number of areas as a priority in 2007/2008:
corporate operations
Implementing our new Climate Change Strategy.Implementation of our new group-wide Corporate Responsibility and Sustainability (CR&S) Action Plan including:
establishing sector specific action plans including Key Performance Indicatorsreinforcing CR&S as an integrated part of our operationsreinforcing the monitoring and reporting on CR&S
Continuing to improve the Green credentials of our workplaces including:obtaining Head Office tenancy ABGR striving towards 4 Starincreasing environmentally friendly procurement purchases
Offset GHG emissions associated with business travel, where such emissions can be reduced
n
n
–
–
–
n
–
–
n
corporate reporting and ratings
Build on 2007 Corporate Responsibility and Sustainability Report and continue to align with GRI G3 framework for 2008 CR&S ReportProactive participation in Sustainability Ratings and Indices including:
ongoing commitment to Carbon Disclosure Projectmaintaining our constituency listing on FTSE4Good Indexestablish listing on the Dow Jones Sustainability Index
Maintain transparency of CR&S information via DB RREEF website
n
n
–
–
–
n
our people: employee engagement
Rollout Green Leaders program to industrial and retail sectorsRollout second annual Employee Opinion SurveyInclude Sustainability and Corporate Responsibility objectives in the performance objectives of our senior managersContinue to maintain CR&S as a key strategic issue and continually communicate the importance of being green to all employeesAppoint EEO officers to monitor and promote equal opportunity
n
n
n
n
n
our community: stakeholder engagement
Continue to engage tenants on sustainability including the rollout of our Tenant Sustainability GuideRedefining and enhancing our corporate and property level community engagement strategies and programsDeveloping new and enhanced Corporate Responsibility initiatives such as:
community engagement day for employeescommunity giving programs
n
n
n
–
–
property portfolio initiatives
existing propertiesReviewing our options to increase green power across the other sectors within the portfolioReducing resource consumption by established targetsCompleting Phase 1 Green Profiling project for every office property within the portfolio by December 2007Completing Phase 2 Green Project Opportunities project for every office property within the portfolio by June 2008Rollout of Waterless urinals project to office, retail and industrial propertiesRollout of Rainwater harvesting project to industrial propertiesRollout of Eco and Water Wise Landscaping Guidelines to industrial properties
developmentsContinue to integrate sustainability into all capital projects ensuring all projects incorporate sustainability measuresContinue to ensure our new developments achieve best practice environmental ratings and contain the highest level of sustainability features
n
n
n
n
n
n
n
n
n
www.global-reports.com

corporate
governance
statement
Governor Phillip Tower and Governor Macquarie Tower, Sydney NSW
www.global-reports.com

DB RREEF Trust Annual Report 2007 59
DB RREEF Funds Management is also the Responsible Entity of three property syndicates and DB RREEF RENTS Trust, and is the investment manager for two private client property mandates. To ensure consistency of governance across DB RREEF’s funds and mandates, the Board has determined that the following corporate governance framework will apply to these funds and mandates. These trusts, syndicates and client mandates are collectively referred to in this corporate governance statement as the Trusts.
the governance frameworkThe corporate governance framework is designed to support the strategic objectives of each of its Trusts by defining accountability and creating control systems appropriate to mitigate the risks inherent in the day to day operations of the Trusts.
To achieve this objective, DB RREEF has implemented a corporate governance framework that meets each of the ASX Principles of Good Corporate Governance (ASX Principles). A reconciliation of the ASX Principles against DB RREEF’s own governance framework can be found on the web page www.dbrreef.com/governance
principle 1. a solid foundation for oversight and managementDB RREEF is committed to maintaining, through both the Executive management and the Board, a balance of skills, experience and independence appropriate to the nature and extent of its operations. The governance framework enables the Board to provide strategic guidance, while exercising effective oversight of management. The framework also defines the roles and responsibilities of the Board and management in order to facilitate Board and management accountability and ensure a balance of authority.
DB RREEF Funds Management is a wholly owned subsidiary of DB RREEF Holdings. DB RREEF Holdings is 50 percent owned by DB RREEF Operations Trust and 50 percent owned by First Australian Property Group Holdings Pty Limited, a subsidiary of Deutsche Bank AG (DB). DB RREEF Funds Management and DB RREEF Holdings share a common Board of Directors.
The Shareholders’ Deed between DB RREEF Operations Trust and First Australian Property Group Holdings Pty Limited (Deed) prescribes the composition of the Boards of DB RREEF Funds Management and DB RREEF Holdings and requires agreement of the shareholders regarding the management of personnel in the Human Resources, Internal Audit, Legal and Compliance functions. Further, the Deed prescribes a number of matters that require an ordinary resolution of shareholders, rather than a resolution of the Board. The Board has considered the provisions of the Deed and concluded that the Deed does not compromise the ability of the Board to act independently and in the best interests of investors. The Board’s committee structure is outlined at www.dbrreef.com/governance
1.1 role of the board
The Board is responsible for establishing objectives and ensuring strategies for their achievement are in place and their achievement monitored. The Board also carries ultimate responsibility for the approval of property acquisitions, divestments and major developments. The Board ensures that the fiduciary and statutory obligations of each Trust to its investors are met, and that such duties have priority over all other duties including the interests of DRFM’s shareholders.
The Board is responsible for appointing and removing the Chief Executive Officer (CEO), ratifying the appointment of the Chief Financial Officer (CFO), Chief Operating Officer (COO) and Company Secretary, and monitoring the performance of the senior management team. A copy of the Board’s Terms of Reference and the Directors’ Code of Conduct is available at www.dbrreef.com/governance
DB RREEF FUNDS MANAGEMENT IS THE RESPONSIBLE ENTITY
OF EACH OF THE FOUR TRUSTS THAT COMPRISE DB RREEF TRUST
www.global-reports.com

60 DB RREEF Trust Annual Report 2007
corporate governance statement (continued)
1.2 role of management
The day to day management of each of the Trusts rests in the hands of the management team. To assist this team in the direction, implementation and monitoring of its plans and strategies, a number of management committees have been established and responsibilities delegated. The management committees include the Executive Committee, Investment Committee, Portfolio Review Committee, Risk Management Committee, Compliance and Internal Audit Committee and the Capital Markets Committee.
A summary of the responsibilities of DB RREEF’s management committees is available at www.dbrreef.com/governance
principle 2. structuring the board to add value
2.1 structure of the board
The composition of the Board reflects its role and the duties and responsibilities it discharges. It reflects the need for the Board to work together as a team with each Director making their own contribution to the Board’s decision making process. General qualifications for Board membership include the ability and competence to make appropriate business recommendations and decisions, an entrepreneurial talent for contributing to the creation of investor value, relevant experience in the industry sector, high ethical standards, sound practical sense and a total commitment to the fiduciary and statutory obligations to further the interests of investors and achieve each Trust’s objectives.
The Board currently comprises seven members, four of whom are independent and three of whom are appointed by DB, including the CEO. Specific skills the incumbent Directors bring to the Board include strategy, property management, funds management, capital markets and financial management.
The members of the Board as at the date of this Annual Report are detailed in the Directors section of this Annual Report.
The Board meets regularly throughout the year therefore ensuring sufficient time is available to deal with Board related matters and when required Directors also meet to consider specific business. At each regular Board meeting the Independent Directors also meet without Executive Directors. Each year the Directors also meet to specifically consider strategy in conjunction with senior management.
2.2 director independence
Independent Directors are independent of management and free of any business or other relationship that could materially interfere with the exercise of their unfettered and independent judgement. Independent Directors are active in areas which enable them to relate to the strategies of DB RREEF and to make a meaningful contribution to the Board’s deliberations. The Board regularly assesses the independence of its Independent Directors, in light of interests disclosed to it.
Independent Directors hold office for three years, following their first appointment (or, if appointed by the Board between annual meetings, from the date of the Annual General Meeting immediately succeeding this appointment). It is not generally expected that an Independent Director would hold office for more than ten years, or be nominated for more than three consecutive terms, whichever is the longer.
Although the Board is advised by internal Legal Counsel and the Company Secretary, Independent Directors are encouraged to take independent professional advice, at the group’s expense, as required. Independent Directors also confer regularly, outside Board meetings, without the involvement of management and Executive Directors.
Please refer to www.dbrreef.com/governance for a description of the procedure for the selection and appointment of new Directors to the Board which includes specific criteria used in the determination of Director independence.
2.3 role of the chair
The Chair is an Independent Director, and is responsible for the leadership of the Board, for the efficient organisation and conduct of the Board’s functions, and for the briefing of Directors in relation to issues arising pertinent to the Board. The Board has also clearly defined, and the Chair monitors, the responsibilities and performance of the CEO.
2.4 board nomination and remuneration committee
A Board Nomination and Remuneration Committee has been established by the Board to assist in the fulfilment of its responsibilities, by overseeing all aspects of Director and Executive remuneration, performance evaluation, training, succession planning and Director nominations.
It comprises two Independent Directors (one of whom is the Chair) and two DB appointed members. The members of the Board Nomination and Remuneration Committee are as follows:
Committee member Status
Christopher T Beare (Chair) Independent Director
Stewart F Ewen OAM Independent Director
Brian E Scullin DB appointed representative and Non-Executive Director
Andrew J Fay DB appointed representative and Alternate Director
www.global-reports.com

DB RREEF Trust Annual Report 2007 61
The Board Nomination and Remuneration Committee’s composition of two Independent Directors, one of whom is the Chair, one DB appointed Non-Executive Director and one DB appointed Alternate Director is in line with the ASX Principles. However, it differs from the ASX Principles commentary and guidance in that it does not comprise a majority of Independent Directors. This departure reflects the unique shareholding of DB RREEF Funds Management, being 50 percent owned by DB RREEF and 50 percent owned by DB and enables DB to bring to deliberations its experience as a global financial institution, as well as recognising the materiality of its shareholding. The Board has considered this departure from ASX guidelines and has determined that the departure does not compromise the objectives of the Committee.
Reporting to the Board Nomination and Remuneration Committee and the Executive Committee, the management Compensation Committee oversees the development and implementation of all DB RREEF’s human resource management systems, including compensation and recruitment, and advises the Board Nomination and Remuneration Committee.
A copy of the Board Nomination and Remuneration Committee’s Terms of Reference is available at www.dbrreef.com/governance
principle 3. promoting ethical and responsible decision-making
3.1 code of conduct
To ensure the satisfaction of statutory and fiduciary obligations to each of its investor groups and to maintain confidence in its integrity, the Board has implemented a series of clearly articulated compliance policies and procedures by which it requires all employees to abide. In addition, it considers that it is important that its employees meet the highest ethical and professional standards and consequently has established an Employee Code of Conduct for all employees.
Please refer to www.dbrreef.com/governance for a copy of DB RREEF’s Employee Code of Conduct.
DB RREEF is committed to and strongly supports disclosure being made by employees of corrupt conduct, illegality or substantial waste of company assets. DB RREEF aims to provide protection to employees who make such disclosures from any detrimental action or reprisal.
Please refer to www.dbrreef.com/governance for a copy of DB RREEF’s whistle-blowing policy.
3.2 insider trading and trading in DB RREEF securities
The group has implemented a trading policy that sets out the requirements applying to Directors and employees who wish to trade or invest in any of the group’s financial products for their personal account or on behalf of an associate.
The policy specifies any Director or employee who wishes to trade in any security issued by or managed by DB RREEF must obtain written approval before entering into a trade. Generally, approval will not be granted during defined blackout periods. These periods commence at the end of the Trusts’ half-year or full-year reporting periods and end on the day the Trusts’ results are announced. In addition, if Compliance or the Chief Executive Officer considers that there is the potential that inside information may be held or the potential that a significant conflict of interest may arise, additional blackout periods will be imposed.
While the trading policy described above applies to Directors and Senior Executives, the Board has determined that Directors will not trade in any security managed by DB RREEF.
Directors have made this decision because the Board of DB RREEF has responsibility for DB RREEF Trust as well as the third party business. Directors are obliged to act in the best interests of each group of investors independently of each other. Therefore, to minimise the appearance of conflict that may arise by being a Director of multiple funds, the Board has determined that it will not invest in any fund managed by DB RREEF, including DB RREEF Trust. While this decision may fail to achieve the desired alignment of interest between investors and the Board, the Directors consider it to be of greater importance to demonstrate that they are not motivated to act in the interests of any one fund over another. This position is periodically reviewed by the Board.
With regard to aligning Senior Executives’ interests with DB RREEF Trust investors, the Board has put in place a long-term incentive scheme that it considers ensures an alignment of their interests with all investors. A description of Senior Executives’ long-term incentive scheme is contained in the Directors’ Report.
Please refer to www.dbrreef.com/governance for a copy of the Employee Trading Policy.
www.global-reports.com
62 DB RREEF Trust Annual Report 2007
3.3 related party dealings
The group has implemented a policy covering the management of related party dealings. Where a related party dealing has been identified, the following occurs:
at management level, the interests of both parties are represented by dedicated teams, each headed by a DB RREEF executive;
when required, at Board level the interests of both parties are represented by dedicated Board members;
information barriers are established with dedicated team members operating on either side of the “barrier”;
team members are briefed by Compliance of their obligations and responsibilities while working on the transaction;
a clean desk policy applies while the transaction is in progress;
documentation resulting from the transaction is maintained on a restricted access database; and
ongoing training is conducted for dedicated employees in relation to management of conflicts of interest during the life of the transaction.
On a monthly basis, Compliance reports to the Board on related party transactions that have been managed in the previous period. During the last financial year, related party transactions have included:
the lease of commercial premises at 343 George Street Sydney, an asset of DB RREEF Trust, to DB RREEF Funds Management Limited;
the acquisition by DB RREEF Holdings of DB RREEF Wholesale Property Limited, the Responsible Entity of DB RREEF Wholesale Property Fund;
the disposal of assets from DB RREEF Trust to various clients/mandates managed by DB RREEF; and
the disposal of 50 percent of five retail assets to DB RREEF Wholesale Property Fund.
principle 4. safeguarding the integrity of financial reporting
4.1 review and authorisation
To ensure the truthful and factual presentation of each Trust’s financial position, DB RREEF has put in place a structure of review and authorisation for each of the Trust’s financial records and reports. This structure includes:
the establishment of a Board Audit Committee to review the Financial Statements of each entity and review the independence and competence of the external auditor; and
semi-annual management representations to the Board Audit Committee, affirming the veracity of each entity’s Financial Statements.
n
n
n
n
n
n
n
n
n
n
n
n
n
4.2 board audit committee
A Board Audit Committee has been established by the Board, and its charter requires that all members are financially literate and have an understanding of the industry in which the group operates, and one or more members have specific financial expertise. The Board Audit Committee currently comprises two Independent Directors, including the Chair, and one DB appointed Director. The Board Audit Committee operates under formal Terms of Reference, has access to management, and internal and external auditors without management present, and has the right and opportunity to seek explanations and additional information. In addition, the external auditor is invited to attend all Board Audit Committee meetings. The Committee may also obtain independent professional advice in the satisfaction of its duties at the cost of the group. The Committee meets as frequently as required to undertake its role effectively and not less than four times per annum.
The membership of the Board Audit Committee is as follows:
Committee member Status
Elizabeth A Alexander AM (Chair)
Independent Director
Barry R Brownjohn Independent DirectorBrian E Scullin DB appointed Non-Executive Director
In order to ensure review of non-audit services by the external auditor, the Board Audit Committee has responsibility for approving the engagement of the auditor for any non-audit service of fee greater than $100,000.
A copy of the Board Audit Committee’s Terms of Reference including the Committee’s procedure for the selection and appointment of the external auditor and for the rotation of external audit engagement partners, is available at www.dbrreef.com/governance
principle 5. timely and balanced disclosure
5.1 continuous disclosure
In order to promote an informed and orderly market in DB RREEF’s securities, DB RREEF has implemented a process to ensure timely and balanced continuous disclosure for all material matters that impact the Trusts. The process puts in place mechanisms designed to ensure compliance with ASX Listing Rules and ASIC’s disclosure requirements such that:
all investors have equal and timely access to material information, including the financial situation, performance, ownership and governance of the Trusts; and
all announcements are factual and presented in a clear and balanced way.
Please refer to www.dbrreef.com/governance for a copy of the Continuous Disclosure and Analyst Briefings Policy.
n
n
corporate governance statement (continued)
www.global-reports.com

DB RREEF Trust Annual Report 2007 63
principle 6. respecting the rights of security holders
6.1 annual general meeting
DB RREEF respects the rights of investors and to facilitate the effective exercise of those rights, the Board has committed to the conduct of an annual general meeting for DB RREEF Trust.
Each annual general meeting is designed to:
supplement effective communication with investors;
provide investors ready access to balanced and understandable information about their fund;
increase the opportunities for investor participation; and
facilitate investors’ rights to ratify the appointment of Independent Directors.
The external auditor of the Trust attends each annual general meeting and will be available to answer investor questions about the conduct of the audits of both the Trusts’ financial records and their Compliance Plans and the preparation and content of the auditor’s report.
6.2 communications with investors
In addition to conducting an Annual General Meeting, the group has a communications and investor relations strategy that promotes an informed market and encourages participation with each Trust’s investors. This strategy includes the use of DB RREEF’s website to enable ready access to DB RREEF announcements, annual and half-year reports, presentations and analyst support material. DB RREEF also has available significant historical information on announcements, distributions and other related information on the website at www.dbrreef.com
principle 7. recognising and managing riskDB RREEF has a risk management system designed to identify, assess, monitor and manage risk and to report on its risk profile.
A copy of DB RREEF’s Risk Management Policy is available at www.dbrreef.com/governance
7.1 risk management
Board Risk and Compliance Committee
The Board has established a Board Risk and Compliance Committee to review risk and compliance matters and monitor the group’s conformance with the requirements of the Managed Investments Act, as specified in Section 601JC of the Corporations Act. The Committee includes only members who are familiar with the requirements of the Managed
n
n
n
n
Investments Act and have extensive risk and compliance experience. The Committee is also encouraged to obtain independent professional advice in the satisfaction of its duties at the cost of the group.
As at 30 June 2007, the Committee comprised five members, three of whom are external members (i.e. members who satisfy the requirements of Section 601JB(2) of the Corporations Act) and two of whom are executives of the group. The scope of the Committee includes all Trusts, including the group’s investment mandates. The Committee reports to the Responsible Entity any breach of the Corporations Act or breach of the provisions contained in any Trust’s Constitution, and further reports to ASIC if the Committee is of the view that the Responsible Entity has not taken appropriate action to deal with a matter reported to it.
The membership of the Board Risk and Compliance Committee, as at 30 June 2007, was as follows:
Committee member Status
Brian E Scullin (Chair) Independent Member
Elizabeth A Alexander AM Independent Member
Andy P Esteban Independent Member
Tanya L Cox Executive Member and Chair of the Risk Management Committee
John C Easy Executive Member and Chair of the Compliance and Internal Audit Committee
In addition to its responsibilities under the Act, the Board Risk and Compliance Committee is responsible for the oversight of DB RREEF’s risk management systems, including its internal compliance and control environment. The Committee’s Terms of Reference are available at www.dbrreef.com/governance
To enable the Board Risk and Compliance Committee to effectively fulfil its obligations, the Management Compliance, Internal Audit Committee and Risk Management Committee have been established to monitor the effectiveness of the group’s risk management, internal compliance and control systems.
Board Treasury Policy Committee
DB RREEF has significant interest rate and foreign exchange exposures. To assist in the effective management of these exposures the Board has established a number of committees to specifically manage DB RREEF’s financial risks. These committees are the Board Treasury Policy Committee and management Capital Markets Committee. The Board Treasury Policy Committee’s role is to review and recommend for approval to the Board financial risk management policies and hedging and funding strategies, and to monitor overall financial risk management exposures.
www.global-reports.com

64 DB RREEF Trust Annual Report 2007
The membership of the Board Treasury Policy Committee is:
Committee member Status
Barry R Brownjohn (Chair) Independent Director
Christopher T Beare Independent Director
Victor P Hoog Antink Chief Executive Officer and Executive Director
Peter C Roberts1 Executive Member and Chair of Capital Markets Committee
1 Peter C Roberts resigned on 8 June 2007.
A copy of the Board Treasury Policy Committee’s Terms of Reference is available at www.dbrreef.com/governance
7.2 management representations
In addition to the operation of the above management committees, the Chief Executive Officer makes the following representations in relation to risk management:
at least quarterly to the Head of Compliance, regarding conformance with compliance policies and procedures. Any exceptions are reported by Compliance to the Board Risk and Compliance Committee quarterly; and
on a semi-annual basis to the Board Audit Committee regarding the veracity of DB RREEF’s Financial Statements.
7.3 compliance
Compliance is an important aspect in DB RREEF’s activities, consequently the group has a segregated Compliance function reporting to the General Counsel on a day to day basis and ultimately to the Board Risk and Compliance Committee. Compliance’s responsibility is to promote an effective compliance culture including the provision of compliance advice, the drafting and updating of relevant compliance policies and procedures, conducting compliance training and monitoring and reporting adherence to key compliance policies and procedures.
principle 8. encouraging enhanced performanceThe Board is committed to enhancing both its own and management’s effectiveness. To achieve this objective the group has implemented a training and education regime that facilitates increased performance through increasing all DB RREEF Directors and employees skills bases. DB RREEF has also implemented a comprehensive performance evaluation program for its employees to support the effectiveness of its education and training programs.
n
n
8.1 board education, independent advice and performance evaluation
The Board Nomination and Remuneration Committee is also responsible for ensuring the effectiveness of the induction process and overseeing the regular performance evaluation of the Board, its committees and individual Directors.
DB RREEF is subject to a variety of regulatory and legal obligations, arising from:
the Corporations Act (including specifically the provisions of the Managed Investments Act);
the Australian Stock Exchange listing rules and governance requirements;
the requirements of an Australian Financial Services Licence holder; and
the group’s governance and compliance framework.
To ensure that new Directors are able to meet their responsibilities effectively, Directors receive an induction briefing and an information pack which includes the corporate governance framework, committee structures and their terms of reference, any governing documents and Directors’ and Officers’ insurance details, along with background reports. In addition, Directors undertake training, through regular presentations by management and external advisers on sector, fund and industry specific trends and conditions.
Directors are also encouraged to:
take independent professional advice, at the group’s expense;
seek additional information from management; and
directly access the Company Secretary, General Counsel and Head of Compliance.
The Board Nomination and Remuneration Committee has implemented a Board performance evaluation program which extends over a two year period. The process is designed to identify opportunities for performance improvement. In 2006, the evaluation process looked at the performance of the whole Board and its Committees and in 2007, individual Director performance was evaluated. In each alternate year the Board also reviews the progress of findings of the previous year’s evaluation. The evaluation is undertaken through the use of questionnaires and face to face interviews on a broad range of issues.
A copy of the Board, committee and Director performance evaluation process including Directors’ Code of Conduct is available at www.dbrreef.com/governance
n
n
n
n
n
n
n
corporate governance statement (continued)
www.global-reports.com

DB RREEF Trust Annual Report 2007 65
8.2 employee education and performance evaluation
DB RREEF requires all employees to undertake and maintain a minimum level of ongoing training and professional development. The specific type and amount of training is determined by the employee’s job function and professional skills. Managers and supervisors have the day to day responsibility for ensuring all employees reporting to them have undertaken the required training. The Human Resources division is responsible for monitoring all DB RREEF employee training requirements and reporting on all training activities regularly to the Executive Committee.
In addition, employees considered “advisers” are required to have in place an annual training plan and to undertake a specified number of hours of training per annum. Employees who provide financial product advice to retail investors are also required to maintain accreditation pursuant to ASIC Regulatory Guide RG146.
8.3 employee performance evaluation
To foster continuous improvement and to ensure the effectiveness of its education and training programs, the group conducts an annual performance evaluation of all employees.
Each year the Board ensures that the goals of the group are clearly established and that strategies are in place for the achievement of those goals. Goals are reviewed periodically to ensure they remain consistent with the group’s priorities and the changing nature of its business. These goals become the performance targets for the CEO and Executive Committee. Performance against these goals is reviewed annually by the Board Nomination and Remuneration Committee and is taken into account in the remuneration review of Executive Committee members.
Cascading goals and objectives are established for all other employees and their performance is reviewed annually by the Executive Committee. Remuneration and incentive payments are considered by the Compensation Committee and recommended to the Board Nomination and Remuneration Committee, based on the achievement of approved performance objectives and market comparatives.
principle 9. remunerating fairly and responsiblyDetails of the group’s remuneration framework for Non-Executive Directors and employees are set out in the Remuneration Report that forms part of the Directors’ Report contained in this Annual Report.
principle 10. recognising the legitimate interests of stakeholdersThe group is aware that the creation of value through the better management of natural, human, social, financial and other resources is essential to the development of its reputation, and acknowledges the interests of its stakeholders including investors, employees, tenants, bankers/financiers and the broader community, in the further pursuit of this objective.
To address these objectives the group has in place a Directors’ Code of Conduct, which addresses Directors’ duties and responsibilities, conflicts of interest, use and confidentiality of information and Director independence. The Directors’ Code of Conduct is available at www.dbrreef.com/governance
DB RREEF has also developed a Corporate Responsibility and Sustainability strategy which can be found at www.dbrreef.com/sustainability
websiteFurther information and documents are available at www.dbrreef.com/governance including a full description of the group’s Governance Framework along with various Committee Terms of Reference, Policies and Codes of Conduct, along with reconciliation to the ASX Principles.
www.global-reports.com

66 DB RREEF Trust Financial Reports 2007
directors’ report 67
auditor’s independence declaration 78
fi nancial statements
income statements 79
balance sheets 80
statements of changes in equity 81
cash fl ow statements 82
–
–
–
–
notes to the fi nancial statements 83
directors’ declaration 125
independent auditor’s report 126
DB RREEF DIVERSIFIED TRUST (ARSN 089 324 541)
ANNUAL FINANCIAL REPORT 30 JUNE 2007
financial reports
ABOVE: Pound Road West, Dandenong VIC
DB RREEF Trust (DRT) (ASX Code: DRT), consists of DB RREEF Diversified Trust (DDF), DB RREEF Industrial Trust (DIT), DB RREEF Office Trust (DOT) and DB RREEF Operations Trust (DRO), (the Trusts).
Under Australian equivalents to International Financial Reporting Standards (AIFRS), DDF has been deemed the parent entity for accounting purposes. Therefore the DDF consolidated Financial Statements include all entities forming part of DRT.
All press releases, financial reports and other information are available on our website: www.dbrreef.com
www.global-reports.com
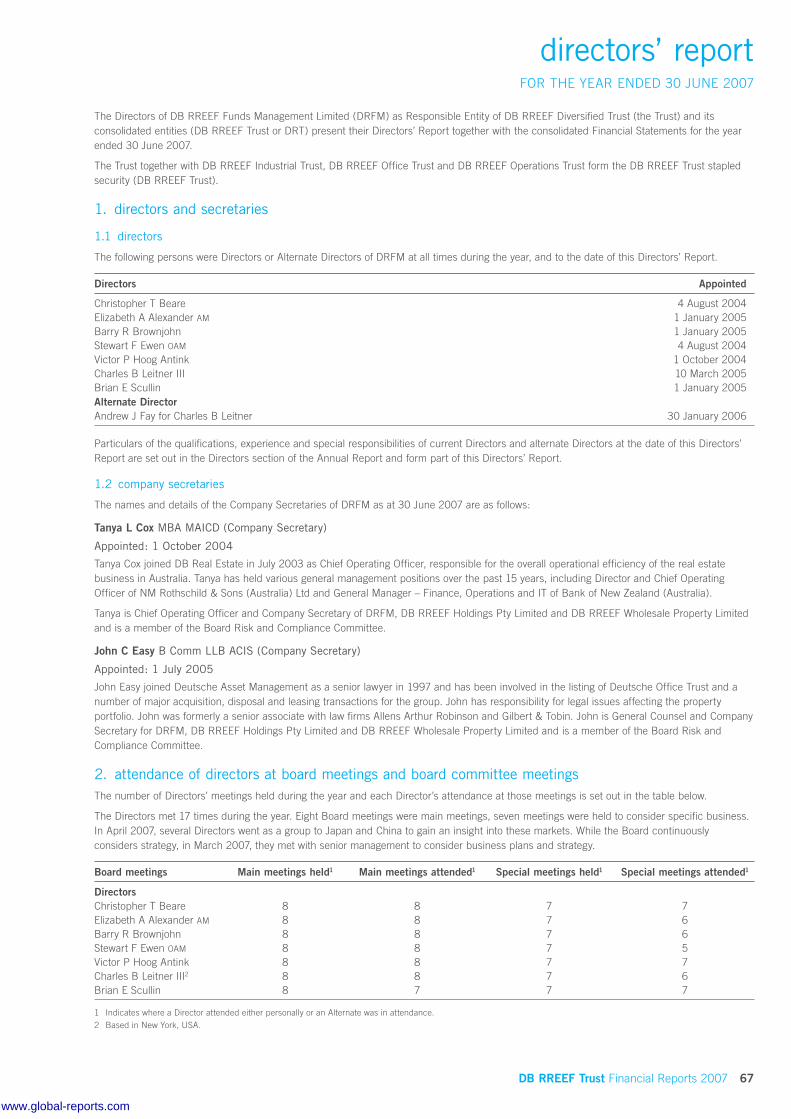
DB RREEF Trust Financial Reports 2007 67
directors’ reportFOR THE YEAR ENDED 30 JUNE 2007
The Directors of DB RREEF Funds Management Limited (DRFM) as Responsible Entity of DB RREEF Diversified Trust (the Trust) and its consolidated entities (DB RREEF Trust or DRT) present their Directors’ Report together with the consolidated Financial Statements for the year ended 30 June 2007.
The Trust together with DB RREEF Industrial Trust, DB RREEF Office Trust and DB RREEF Operations Trust form the DB RREEF Trust stapled security (DB RREEF Trust).
1. directors and secretaries
1.1 directors
The following persons were Directors or Alternate Directors of DRFM at all times during the year, and to the date of this Directors’ Report.
Directors Appointed
Christopher T Beare 4 August 2004Elizabeth A Alexander AM 1 January 2005Barry R Brownjohn 1 January 2005Stewart F Ewen OAM 4 August 2004Victor P Hoog Antink 1 October 2004Charles B Leitner III 10 March 2005Brian E Scullin 1 January 2005Alternate Director Andrew J Fay for Charles B Leitner 30 January 2006
Particulars of the qualifications, experience and special responsibilities of current Directors and alternate Directors at the date of this Directors’ Report are set out in the Directors section of the Annual Report and form part of this Directors’ Report.
1.2 company secretaries
The names and details of the Company Secretaries of DRFM as at 30 June 2007 are as follows:
Tanya L Cox MBA MAICD (Company Secretary)
Appointed: 1 October 2004
Tanya Cox joined DB Real Estate in July 2003 as Chief Operating Officer, responsible for the overall operational efficiency of the real estate business in Australia. Tanya has held various general management positions over the past 15 years, including Director and Chief Operating Officer of NM Rothschild & Sons (Australia) Ltd and General Manager – Finance, Operations and IT of Bank of New Zealand (Australia).
Tanya is Chief Operating Officer and Company Secretary of DRFM, DB RREEF Holdings Pty Limited and DB RREEF Wholesale Property Limited and is a member of the Board Risk and Compliance Committee.
John C Easy B Comm LLB ACIS (Company Secretary)
Appointed: 1 July 2005
John Easy joined Deutsche Asset Management as a senior lawyer in 1997 and has been involved in the listing of Deutsche Office Trust and a number of major acquisition, disposal and leasing transactions for the group. John has responsibility for legal issues affecting the property portfolio. John was formerly a senior associate with law firms Allens Arthur Robinson and Gilbert & Tobin. John is General Counsel and Company Secretary for DRFM, DB RREEF Holdings Pty Limited and DB RREEF Wholesale Property Limited and is a member of the Board Risk and Compliance Committee.
2. attendance of directors at board meetings and board committee meetingsThe number of Directors’ meetings held during the year and each Director’s attendance at those meetings is set out in the table below.
The Directors met 17 times during the year. Eight Board meetings were main meetings, seven meetings were held to consider specific business. In April 2007, several Directors went as a group to Japan and China to gain an insight into these markets. While the Board continuously considers strategy, in March 2007, they met with senior management to consider business plans and strategy.
Board meetings Main meetings held1 Main meetings attended1 Special meetings held1 Special meetings attended1
DirectorsChristopher T Beare 8 8 7 7Elizabeth A Alexander AM 8 8 7 6Barry R Brownjohn 8 8 7 6Stewart F Ewen OAM 8 8 7 5Victor P Hoog Antink 8 8 7 7Charles B Leitner III2 8 8 7 6Brian E Scullin 8 7 7 7
1 Indicates where a Director attended either personally or an Alternate was in attendance.2 Based in New York, USA.
www.global-reports.com

68 DB RREEF Trust Financial Reports 2007
Special meetings are held at a time to enable the maximum number of Directors to attend and are generally held to consider specific items that cannot be held over to the next scheduled main meeting.
The number of Board Committee meetings held during the year and each Director’s attendance at those meetings is set out in the table below.
Board Audit Committee Board Risk and Compliance Committee
Board Nomination and Remuneration Committee
Board Treasury Policy Committee
Meetings held
Meeting attended
Meetings held
Meetings attended
Meetings held
Meetings attended
Meetings held
Meetings attended
DirectorsChristopher T Beare – – – – 5 5 2 2Elizabeth A Alexander AM1 6 6 – – – – – –Barry R Brownjohn 6 6 – – – – 2 2Stewart F Ewen OAM – – – – 5 5 – –Andrew J Fay2 – – – – 1 1 – –Victor P Hoog Antink – – – – – – 2 2Charles B Leitner III – – – – – – – –Brian E Scullin 6 6 4 4 5 5 – –
1 Appointed to the Board Risk and Compliance Committee on 31 May 2007.2 Appointed to the Board Nomination and Remuneration Committee on 23 May 2007.
3. remuneration reportThe Directors of DRFM as Responsible Entity of the Trust and its consolidated entities (DB RREEF Trust or DRT) and DB RREEF Holdings Pty Limited (DRH) present the Remuneration Report. Sections 3.1, 3.2, 3.3, 3.4, 3.6, 3.7 and 3.8 of this Remuneration Report for the year ended 30 June 2007 have been prepared by the Board Nomination and Remuneration Committee and adopted by the Board in accordance with AASB 124: Related Party Disclosures which has been transferred from the financial report and has been audited. The remaining disclosures required by the Corporations Law have not been audited.
Please note that a reference to remuneration in this report has the same meaning as compensation for the purposes of AASB 124.
3.1 board nomination and remuneration committee
The Board Nomination and Remuneration Committee oversees the remuneration of Directors and Senior Executives. The role and membership of the Board Nomination and Remuneration Committee is set out in the Corporate Governance Statement in this Annual Report. The terms of reference of the Board Nomination and Remuneration Committee can be found on the web page www.dbrreef.com/governance
3.2 non-executive director remuneration
The disclosures in this section of the report relate to the Non-Executive Directors of DRFM who held office during the year ended 30 June 2007.
3.2.1 Non-Executive Directors’ remuneration framework
The objective of the Non-Executive Directors’ remuneration framework is to ensure Non-Executive Directors’ fees reflect the responsibilities of Directors and the demands which are made on them, as well as ensuring they are in line with market.
Non-Executive Directors’ fees are reviewed annually by the Board Nomination and Remuneration Committee. The Committee also obtains advice from independent remuneration consultants from time to time. Non-Executive Directors, other than the Chair, receive a base fee plus an additional fee for membership of a Board Committee. The Chair receives no Board Committee fees. Taking into account the greater time commitment required, the Chair receives a higher fee than other Directors, which is benchmarked to market. The Chair is not present during any discussion relating to the determination of his own fees.
Fees paid to Non-Executive Directors are paid from a remuneration pool of $1,250,000 per annum, which was approved by DB RREEF Trust investors at the Annual General Meeting held on 25 November 2005.
directors’ report (continued)
www.global-reports.com
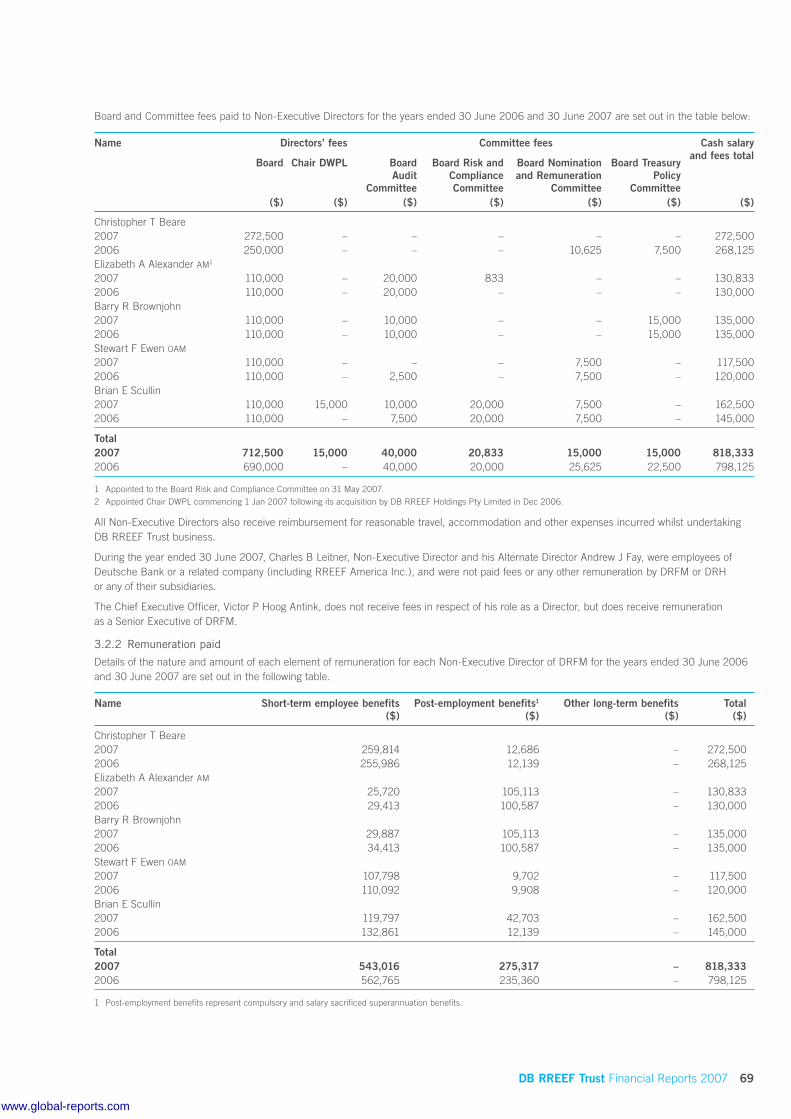
DB RREEF Trust Financial Reports 2007 69
Board and Committee fees paid to Non-Executive Directors for the years ended 30 June 2006 and 30 June 2007 are set out in the table below:
Name Directors’ fees Committee fees Cash salary and fees total
Board Chair DWPL Board Audit
Committee
Board Risk and Compliance Committee
Board Nomination and Remuneration
Committee
Board Treasury Policy
Committee($) ($) ($) ($) ($) ($) ($)
Christopher T Beare2007 272,500 – – – – – 272,5002006 250,000 – – – 10,625 7,500 268,125Elizabeth A Alexander AM1
2007 110,000 – 20,000 833 – – 130,8332006 110,000 – 20,000 – – – 130,000Barry R Brownjohn2007 110,000 – 10,000 – – 15,000 135,0002006 110,000 – 10,000 – – 15,000 135,000Stewart F Ewen OAM
2007 110,000 – – – 7,500 – 117,5002006 110,000 – 2,500 – 7,500 – 120,000Brian E Scullin2007 110,000 15,000 10,000 20,000 7,500 – 162,5002006 110,000 – 7,500 20,000 7,500 – 145,000
Total2007 712,500 15,000 40,000 20,833 15,000 15,000 818,3332006 690,000 – 40,000 20,000 25,625 22,500 798,125
1 Appointed to the Board Risk and Compliance Committee on 31 May 2007.2 Appointed Chair DWPL commencing 1 Jan 2007 following its acquisition by DB RREEF Holdings Pty Limited in Dec 2006.
All Non-Executive Directors also receive reimbursement for reasonable travel, accommodation and other expenses incurred whilst undertaking DB RREEF Trust business.
During the year ended 30 June 2007, Charles B Leitner, Non-Executive Director and his Alternate Director Andrew J Fay, were employees of Deutsche Bank or a related company (including RREEF America Inc.), and were not paid fees or any other remuneration by DRFM or DRH or any of their subsidiaries.
The Chief Executive Officer, Victor P Hoog Antink, does not receive fees in respect of his role as a Director, but does receive remuneration as a Senior Executive of DRFM.
3.2.2 Remuneration paid
Details of the nature and amount of each element of remuneration for each Non-Executive Director of DRFM for the years ended 30 June 2006 and 30 June 2007 are set out in the following table.
Name Short-term employee benefits ($)
Post-employment benefits1
($)Other long-term benefits
($)Total
($)
Christopher T Beare2007 259,814 12,686 – 272,5002006 255,986 12,139 – 268,125Elizabeth A Alexander AM
2007 25,720 105,113 – 130,8332006 29,413 100,587 – 130,000Barry R Brownjohn2007 29,887 105,113 – 135,0002006 34,413 100,587 – 135,000Stewart F Ewen OAM
2007 107,798 9,702 – 117,5002006 110,092 9,908 – 120,000Brian E Scullin2007 119,797 42,703 – 162,5002006 132,861 12,139 – 145,000
Total2007 543,016 275,317 – 818,3332006 562,765 235,360 – 798,125
1 Post-employment benefits represent compulsory and salary sacrificed superannuation benefits.
www.global-reports.com

70 DB RREEF Trust Financial Reports 2007
3.3 DB RREEF remuneration framework
The objective of DRFM’s remuneration framework is to ensure remuneration for performance is competitive and appropriate for the results delivered. The framework aligns each employee’s remuneration with the achievement of strategic objectives and the creation of value for investors, and conforms to market best practice.
The remuneration framework is designed to attract and retain talented and motivated employees and to encourage enhanced performance. The remuneration framework provides employees with a remuneration structure that encourages capability and performance by:
providing clear performance objectives;
delivering competitive remuneration for contributing to the creation of value; and
providing recognition for contribution.
DRFM’s annual performance management program incorporates the establishment of specific, measurable, financial and non-financial objectives for all employees, which are then monitored throughout the year. Each of these individual objectives contributes to the achievement of DB RREEF’s overall plans and objectives. At each year end the degree of an employee’s achievement against the objectives is assessed and the results reflected in their “at risk” performance incentive allocation.
Employee remuneration structure is a mix of:
fixed salary subject to annual review; and
variable “at risk” pay through short-term and long-term performance incentive plans.
The balance of an employee’s remuneration between these components changes to reflect the employee’s accountability and responsibility for results. As an employee’s accountability and responsibility increases the lower will be the fixed component and the greater the “at risk” incentive component of their remuneration.
No employee receives DB RREEF Trust securities or securities in any other DB RREEF product as part of their remuneration package. This is in line with DB RREEF’s trading policy as outlined in the Corporate Governance Statement. The Board has made this decision because DRFM has responsibility for DB RREEF Trust as well as a number of third party funds and mandates. To minimise any appearance of conflict that may arise by being a manager of multiple funds, the Directors have determined that they will not invest in any fund managed by DB RREEF including DRT. This action ensures that the Directors are not motivated to act in the interests of any one group of investors over another.
Recognising the need to achieve an alignment of interest with all DB RREEF’s investors and the contribution DB RREEF’s managed funds make to DB RREEF Trust’s performance, the Board has implemented a long-term incentive scheme based on the combined performance of DB RREEF Trust and each fund managed by DB RREEF. A detailed description of the long-term incentive plan is outlined below.
Fixed remuneration
To ensure that the fixed component of an employee’s remuneration is competitive, external remuneration consultants are retained to provide analysis and advice regarding market remuneration for comparable roles, responsibility and accountability. The fixed pay for all employees is reviewed annually. However, there are no guaranteed fixed pay increases for any employee.
n
n
n
n
n
Performance incentive pool
All short-term incentive payments and long-term incentive allocations are taken from a single performance incentive pool. The size of the performance incentive pool in any year is determined after reference to the group’s performance against certain financial and non-financial targets determined by the Board. Should these predetermined performance targets be achieved, an incentive pool, approved by the Board following the recommendation of the Board Nomination and Remuneration Committee, is made available for allocation to all employees, including Senior Executives and the Chief Executive Officer, for the financial year.
Short-term performance incentive
At the end of each year, performance against set targets is assessed and the results reflected in the short-term performance incentive allocation from the incentive pool to each employee. The performance assessment is weighted to non-financial measures that vary between positions but include matters such as achieving delivery of projects, operational improvements, performance enhancements, leadership and team work.
Where performance falls below minimum threshold levels, no short term performance incentive is paid. Short-term performance incentives are payable in cash in August/September each year.
Long-term incentive scheme
In 2005 the Board implemented a long-term incentive scheme, which has operated without change. The scheme is designed to achieve the following outcomes:
to more closely align participants’ interests with those of investors;
to give participants an incentive to create long-term, sustainable value for investors by enabling them to benefit from the long-term success of DB RREEF activities; and
to assist in attracting and retaining high quality executives.
At the end of each year, performance against set targets is assessed and the results reflected in the long-term performance incentive allocation from the incentive pool to each participant. The performance assessment is weighted to financial measures that vary between positions but include matters such as DRT’s total return, earnings and distribution growth, net tangible asset backing and third party fund performance. No long-term performance incentive allocation is granted for less than satisfactory performance. The Nomination and Remuneration Committee recommends to the Board the employees, including executives, who will be eligible to participate in the long-term incentive scheme and the amount of long term incentive that should be allocated to each participant.
In 2007, the Board determined that all employees who were employed as at 30 June 2007 will have a minimum participation of $1,000 per employee.
The long-term incentive scheme employs the following concepts:
the “Composite Total Return” is 50 percent of the total return of DB RREEF Trust, plus 50 percent of the combined asset weighted total return of DB RREEF’s unlisted funds and mandates; and
the “Performance Benchmark” is 50 percent of the S&P/ASX 200 Property Accumulation Index for DB RREEF Trust and 50 percent of the Mercers Unlisted Property Fund Index for the unlisted funds and mandates.
n
n
n
n
n
directors’ report (continued)
www.global-reports.com

DB RREEF Trust Financial Reports 2007 71
DRFM’s long-term incentive scheme operates as follows:
each year the Board, following a recommendation from the Board Nomination and Remuneration Committee, allocates participants a long-term incentive value. The long-term incentive value allocated varies depending on the role of the participant and the participant’s performance against key performance indicators;
the long-term incentive value is held by DRH until the end of the three year vesting period, and is notionally reinvested during the vesting period in DB RREEF Trust (50 percent of long-term incentive value) and DB RREEF’s other unlisted funds and mandates (50 percent of long-term incentive value). This means that the “banked value” of the long-term incentive fluctuates up and down in line with changes in the Composite Total Return;
at the end of the three year vesting period the final long-term incentive payment is determined by grossing up the final “banked value” by the Performance Multiplier;
the relevant Performance Multiplier is determined by comparing the Composite Total Return over the three year vesting period against the Benchmark. The table below sets out the appropriate Performance Multiplier based on the comparison of Composite Total Return against the relevant Benchmark performance groups:
Performance hurdle Less than 95% of benchmark
Up to 100% of benchmark
Up to 115% of benchmark
Up to 130% of benchmark
Greater than 130% of benchmark
Performance Multiplier 100% 110% 120% 140% 150%
and consequently, the long-term incentive payment made to each participant at the end of the vesting period reflects the overall return received by DB RREEF investors, with performance exceeding the benchmark being recognised by a greater long-term incentive payment.
In determining the construction of the Composite Total Return the DRFM Board considered the obligations participants have to investors in DB RREEF Trust and the unlisted funds and mandates. Following due consideration the Board determined that the appropriate measure for DB RREEF Trust and the unlisted funds and mandates should be the total return of each fund. The Board further determined that the Performance Benchmark should be the S&P/ASX 200 Property Accumulation Index for DRT and the Mercers Unlisted Property Fund Index for unlisted funds and mandates.
Participants in the long-term incentive scheme will only receive cash payments. In addition, if a participant terminates their employment during the vesting period their long-term incentive grant is forfeited, unless otherwise determined by the Nomination and Remuneration Committee.
Performance indicators
Key performance indicators are typically a combination of financial and non-financial indicators which reflect the employee’s role, seniority, accountability and responsibility and their personal objectives, and may include one or more of the following measures:
Performance indicators Reason for use
Financial performance indicatorsTotal return to ensure focus on an improving security price and delivering income to investorsEarnings growth to ensure focus on improving earningsDistributions growth to ensure focus on investor distributionsNet tangible asset growth to ensure the value of assets is maintained and improvedThird party funds performance to ensure focus on achieving each fund’s objectives
Property performance indicatorsNet property income per property to ensure focus on target income returns to investorsPercentage of vacant space per property to ensure focus on target income returns to investorsExpenses against budget to ensure focus on appropriate cost model
Non-financial indicatorsProject delivery to ensure focus on achievement of non-financial drivers of performanceTeam work to ensure focus on achievement of non-financial drivers of performance
3.4 senior executive remuneration
The disclosures in this section of the report relate to the executives listed below, being the Chief Executive Officer and the Senior Executives with authority and responsibility for planning, directing and controlling the activities of DB RREEF Trust during the financial year.
Name Title The date they qualified or ceased to qualify as a Senior Executive during the 12 months ended 30 June 2007
Victor P Hoog Antink Chief Executive OfficerTanya L Cox Chief Operating OfficerJohn C Easy General CounselBen J Lehmann Fund Manager, DB RREEF TrustPeter C Roberts1 Chief Financial Officer Ceased to qualify 8 June 2007Paul G Say Head of Corporate Development Qualified 19 March 2007Mark F Turner Head of Unlisted Funds
1 Resigned 8 June 2007.
n
n
n
n
n
www.global-reports.com

72 DB RREEF Trust Financial Reports 2007
directors’ report (continued)
3.4.1 Senior Executive remuneration framework
The Nomination and Remuneration Committee, in consultation with external remuneration consultants, has implemented a specific framework for Senior Executive remuneration (including the remuneration of the Chief Executive Officer) that is market competitive and is line with DB RREEF’s overall remuneration framework.
The framework for Senior Executive remuneration is based on the following key criteria:
transparency, competitiveness and reasonableness;
linked to performance;
the ability to attract and retain high quality executives; and
aligns executives’ and investors’ interests.
Alignment to investors’ interests is achieved by a substantial proportion of Senior Executive remuneration being dependent upon performance. This ensures that remuneration for Senior Executives, including the Chief Executive Officer, is closely linked to:
delivery of forecast returns; and
achievement of key non-financial value drivers.
3.4.2 Components of Senior Executive remuneration
Each Senior Executive’s remuneration package comprises the following components:
fixed remuneration;
short-term performance incentives; and
long-term performance incentives.
Subsequent to DRFM’s corporate restructure in September 2004 and following consideration of guidance from external advisors, the Board Nomination and Remuneration Committee commissioned the development of a long-term incentive scheme and revised the target remuneration mix for the Chief Executive Officer and other Senior Executives to more closely reflect the remuneration structure of DRFM’s peer group.
Application of the target mix to the remuneration of the Chief Executive Officer and new Senior Executives was effected immediately. The target mix for other Senior Executives is being progressively introduced and will be fully implemented by 2008.
n
n
n
n
n
n
n
n
n
DRFM’s target remuneration mix between fixed, short-term and long-term incentives for the Chief Executive Officer and other Senior Executives is outlined below:
Fixedremuneration
At risk –short-term
At risk –long-term
2007(%)
2006 (%)
2007 (%)
2006 (%)
2007 (%)
2006 (%)
Chief Executive Officer 45 50 25 25 30 25Other Senior Executives 50 60 25 25 25 15
The Board Nomination and Remuneration Committee continues to review the target remuneration mix for all Senior Executives.
3.5 DB RREEF performance
DB RREEF Trust was created as a single stapled security in September 2004. Since stapling DB RREEF Trust’s operational and financial performance has been in line with expectations.
Funds under management performance
As at 30 June DRT funds under
management($ billion)
Third party funds under
management($ billion)
Total DB RREEF
funds under management
($ billion)
2007 9.03 4.63 13.662006 7.85 3.90 11.752005 7.00 3.50 10.50
DB RREEF Trust – ASX Market Capitalisation
Year to 30 June Market capitalisation($ billion)
2007 5.692006 4.1020051 3.70
Source: IRESS.1 Trading in DB RREEF Trust commenced 6 October 2004.
DB RREEF Trust Security Price Performance
1.00
1.40
1.60
2.00
1.20
1.80
2.20
Pri
ce (
$)
Weekly volume weighted average price
Mar
07
Jun
07
Dec
06
Sep
06
Jun
06
Mar
06
Dec
05
Sep
05
Jun
05
Mar
05
Dec
05
Source: IRESS/DB RREEF Estate.
www.global-reports.com

DB RREEF Trust Financial Reports 2007 73
DB RREEF Trust – Earnings, Distributions and Net Tangible Assets (NTA) performance
Year to 30 June Earnings per security Distribution per security NTA per security
2007 40.90 cents 11.3 cents $1.822006 36.44 cents 11.0 cents $1.532005 18.25 cents 10.5 cents $1.28
Total return analysis
Composite Total Return – 50 percent of the total return of DB RREEF Trust, plus 50 percent of the combined asset weighted total return of DB RREEF’s unlisted funds and mandates.
Composite Performance Benchmark – 50 percent of the Mercers Unlisted Property Fund Index and 50 percent of the S&P/ASX 200 Property Accumulation Index.
Period to 30 June 2007 1 year (% per annum)
2 years (% per annum)
Since 1 October 20041 (% per annum)
Composite Total Return 29.0 25.0 22.0Composite Performance Benchmark 23.0 20.0 20.0DB RREEF Trust 42.6 22.3 25.5S&P/ASX 200 Property Accumulation Index 25.9 23.7 19.8
1 Inception date is 1 October 2004.
During the year DB RREEF Trust did not buy back or cancel any of its securities.
3.6 details of senior executive remuneration paid
Details of the nature and amount of each element of remuneration for the Chief Executive Officer and other Senior Executives for the years ended 30 June 2006 and 30 June 2007 are set out in the following table.
Name Short-term employee benefits Post-employment benefits
Other long-term benefits Total
Cash salary and fees
($)
Short-term incentive
($)
Other short-term benefit
($)
Pension and superannuation benefits3
($)
Long-term incentive value
($)
Other long-term benefit
($) ($)
Victor P Hoog Antink2007 907,167 550,000 – 92,833 650,000 – 2,200,0002006 907,714 500,000 – 92,286 250,000 – 1,750,000Tanya L Cox2007 311,828 175,000 – 3,172 110,000 – 600,0002006 237,861 175,000 – 12,139 60,000 – 485,000John C Easy2007 286,314 110,000 – 28,686 75,000 – 500,0002006 287,861 100,000 – 12,139 50,000 – 450,000Ben J Lehmann2007 407,314 250,000 – 12,686 250,000 – 920,0002006 387,861 230,000 – 12,139 120,000 – 750,000Peter Roberts1
2007 292,438 – – 539,206 – – 831,6442006 150,469 125,000 130,000 22,350 75,000 25,000 527,819Paul G Say2
2007 122,438 20,000 280,000 4,229 – – 426,6672006 – – – – – – –Mark F Turner2007 297,615 200,000 – 42,385 180,000 – 720,0002006 274,900 180,000 – 25,100 70,000 – 550,000
Total2007 2,625,114 1,305,000 280,000 723,197 1,265,000 – 6,198,3112006 2,246,666 1,310,000 130,000 176,153 625,000 25,000 4,512,819
1 Peter Roberts resigned 8 June 2007.2 Paul Say commenced 19 March 2007.3 Some employees elected to salary sacrifice prior year short-term incentive which restricted their ability to contribute to superannuation in 2007.
n
n
www.global-reports.com
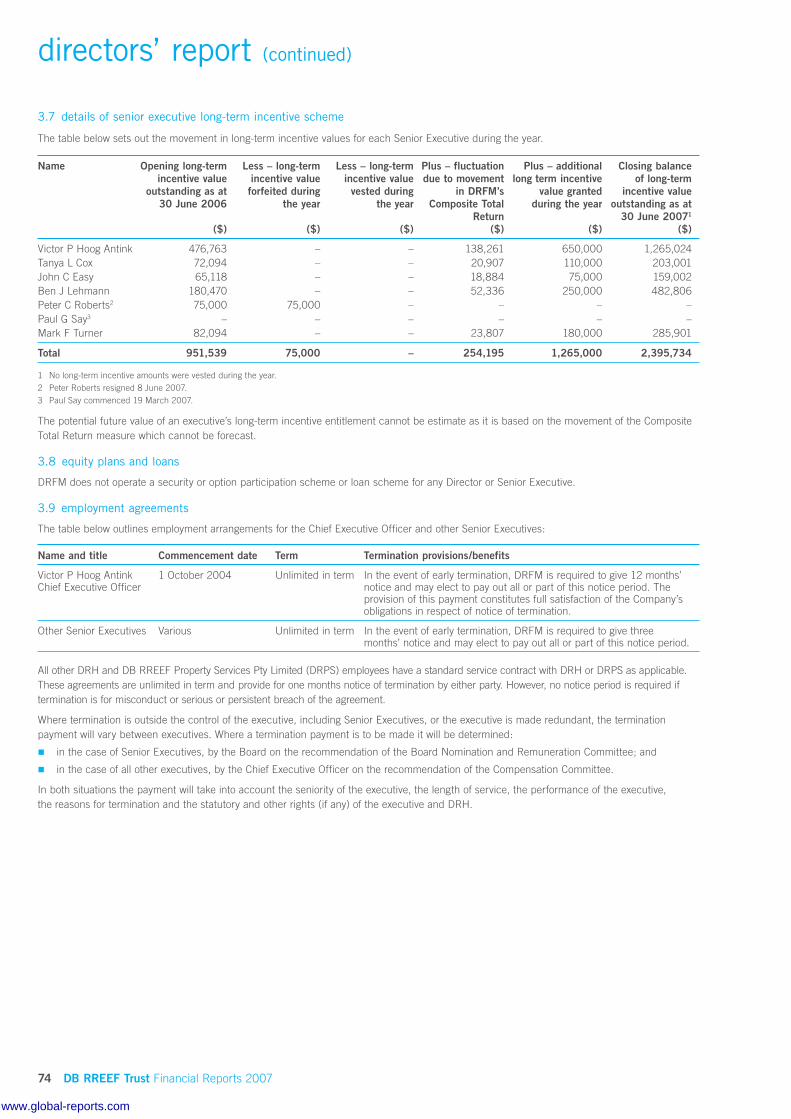
74 DB RREEF Trust Financial Reports 2007
directors’ report (continued)
3.7 details of senior executive long-term incentive scheme
The table below sets out the movement in long-term incentive values for each Senior Executive during the year.
Name Opening long-term incentive value
outstanding as at 30 June 2006
($)
Less – long-term incentive value forfeited during
the year
($)
Less – long-term incentive value
vested during the year
($)
Plus – fluctuation due to movement
in DRFM’s Composite Total
Return($)
Plus – additional long term incentive
value granted during the year
($)
Closing balance of long-term
incentive value outstanding as at
30 June 20071
($)
Victor P Hoog Antink 476,763 – – 138,261 650,000 1,265,024Tanya L Cox 72,094 – – 20,907 110,000 203,001John C Easy 65,118 – – 18,884 75,000 159,002Ben J Lehmann 180,470 – – 52,336 250,000 482,806Peter C Roberts2 75,000 75,000 – – – –Paul G Say3 – – – – – –Mark F Turner 82,094 – – 23,807 180,000 285,901
Total 951,539 75,000 – 254,195 1,265,000 2,395,734
1 No long-term incentive amounts were vested during the year.2 Peter Roberts resigned 8 June 2007.3 Paul Say commenced 19 March 2007.
The potential future value of an executive’s long-term incentive entitlement cannot be estimate as it is based on the movement of the Composite Total Return measure which cannot be forecast.
3.8 equity plans and loans
DRFM does not operate a security or option participation scheme or loan scheme for any Director or Senior Executive.
3.9 employment agreements
The table below outlines employment arrangements for the Chief Executive Officer and other Senior Executives:
Name and title Commencement date Term Termination provisions/benefits
Victor P Hoog Antink Chief Executive Officer
1 October 2004 Unlimited in term In the event of early termination, DRFM is required to give 12 months’ notice and may elect to pay out all or part of this notice period. The provision of this payment constitutes full satisfaction of the Company’s obligations in respect of notice of termination.
Other Senior Executives Various Unlimited in term In the event of early termination, DRFM is required to give three months’ notice and may elect to pay out all or part of this notice period.
All other DRH and DB RREEF Property Services Pty Limited (DRPS) employees have a standard service contract with DRH or DRPS as applicable. These agreements are unlimited in term and provide for one months notice of termination by either party. However, no notice period is required if termination is for misconduct or serious or persistent breach of the agreement.
Where termination is outside the control of the executive, including Senior Executives, or the executive is made redundant, the termination payment will vary between executives. Where a termination payment is to be made it will be determined:
in the case of Senior Executives, by the Board on the recommendation of the Board Nomination and Remuneration Committee; and
in the case of all other executives, by the Chief Executive Officer on the recommendation of the Compensation Committee.
In both situations the payment will take into account the seniority of the executive, the length of service, the performance of the executive, the reasons for termination and the statutory and other rights (if any) of the executive and DRH.
n
n
www.global-reports.com

DB RREEF Trust Financial Reports 2007 75
4. directors’ interestsThe Board’s policy on insider trading and trading in DB RREEF Trust securities or securities in any of the funds managed by DB RREEF by any Director or employee is outlined in the Corporate Governance Statement.
While the trading policy described in the Corporate Governance Statement applies to Directors and Senior Executives, the Board has determined that Directors will not trade in any security managed by DB RREEF.
Directors have made this decision because the Boards of DB RREEF have responsibility for DB RREEF Trust as well as the third party businesses. Directors are obliged to act in the best interest of each group of investors independently of each other. Therefore, to minimise the appearance of conflict that may arise by being a Director of multiple funds, the Directors have determined that they will not invest in any fund managed by DB RREEF including DRT. While this decision may fail to achieve the desired alignment of interests between investors and the Board, the Directors consider it to be of greater importance to demonstrate that they are not motivated to act in the interests of any one fund over another. This position is periodically reviewed by the Board.
As a direct result of DB RREEF’s policy regarding Directors holding DRT securities, or securities in any of the funds managed by DB RREEF, as at the date of this Directors’ Report no Director or Alternate Director directly or indirectly held:
securities in DB RREEF Trust; or
options over, or any other contractual interest in, securities in DB RREEF Trust; or
an interest in any other fund managed by DRFM or any other entity that forms part of DB RREEF Trust.
5. directors’ directorships in other listed entitiesThe following table sets out directorships of other listed entities, not including DRFM, held by the Directors at any time in the three years immediately prior to the end of the year, and the period for which each directorship was held.
Director Company Date appointed Date resigned or ceased being a Director of a listed security
Elizabeth A Alexander AM CSL Limited July 1991Boral Limited September 1994AMCOR Limited April 1994 October 2005
Brian E Scullin Deutsche Asset Management (Australia) Limited1 20 December 1999 17 October 2006IYS Instalment Receipt Limited1 24 October 2005 17 October 2006SPARK Infrastructure RE Limited2 1 January 2006
Alternate DirectorAndrew J Fay Deutsche Asset Management (Australia) Limited1 4 May 2005 17 October 2006
IYS Instalment Receipt Limited1 4 May 2005 17 October 2006SPARK Infrastructure RE Limited2 1 January 2006
1 IYS Instalment Receipt Limited had until 29 November 2006 issued ASX listed instalment receipts over units in the Deutsche Retail Infrastructure Trust, a managed investment scheme that was until 17 October 2006 listed but not quoted on ASX and whose responsible entity was Deutsche Asset Management (Australia) Limited.
2 SPARK Infrastructure RE Limited has issued ASX listed stapled securities trading as SPARK Infrastructure Group (ASX: SKI)
6. principal activitiesDuring the year the principal activity of DB RREEF Trust was real estate funds management and investment in real estate assets. There were no significant changes in the nature of DB RREEF Trust’s activities during the year.
The number of employees of DB RREEF Trust at the end of the reporting period being 30 June 2007 was 227 (2006: 132). The increase in 2007 is primarily due to the internalisation of retail property management.
7. total value of trust assetsThe total value of the assets of DB RREEF Trust as at 30 June 2007 was $9,486.8 million (2006: $8,287.5 million). Details of the basis of this valuation are outlined in note 1 of the Notes to the financial statements and form part of this Directors’ Report.
8. review and results of operationsA review of the results, financial position, operations including business strategies and the expected results of operations of DB RREEF Trust, is set out in the Chief Executive Officer’s Report in this Annual Report and forms part of this Directors’ Report.
9. likely developments and expected results of operationsIn the opinion of the Directors, disclosure of any further information regarding business strategies and the future developments or results of DB RREEF Trust, other than the information already outlined in this Directors’ Report or the Financial Statements accompanying this Directors’ Report would be unreasonably prejudicial to DB RREEF Trust.
n
n
n
www.global-reports.com

76 DB RREEF Trust Financial Reports 2007
directors’ report (continued)
10. significant changes in the state of affairsThe Directors of DRFM are not aware of any matter or circumstance, not otherwise dealt with in this Directors’ Report or the Financial Statements that has significantly or may significantly affect the operations of DB RREEF Trust, the results of those operations, or the state of DB RREEF Trust’s affairs in future financial years.
11. matters subsequent to the end of the financial year
Since the end of the year the Directors of DRFM are not aware of any matter or circumstance not otherwise dealt with in this Directors’ Report or the Financial Statements that has significantly or may significantly affect the operations of DB RREEF Trust, the results of those operations, or the state of DB RREEF Trust’s affairs in future financial years.
12. distributionsDistributions paid or payable by DB RREEF Trust for the year ended 30 June 2007 were 11.3 cents per security (2006: 11.0 cents per security) as outlined in note 31 of the Notes to the financial statements.
13. DRFM’s fees and associate interestsDetails of fees paid or payable by DB RREEF Trust to DRFM for the year ended 30 June 2007 are outlined in note 35 of the Notes to the financial statements and form part of this Directors’ Report.
The number of interests in DB RREEF Trust held by DRFM or its associates as at the end of the financial year are nil (2006: nil).
14. interests in DB RREEF TrustThe movement in securities on issue in DB RREEF Trust during the year and the number of securities on issue as at 30 June 2007 are detailed in note 28 of the Notes to the financial statements and form part of this Directors’ Report.
DB RREEF Trust did not have any options on issue as at 30 June 2007 (2006: nil).
15. environmental regulationThe Directors of DRFM are satisfied that adequate systems are in place for the management of its environmental responsibilities and compliance with its various licence requirements and regulations. Further, the Directors are not aware of any breaches of these requirements and to the best of their knowledge all activities have been undertaken in compliance with environmental requirements.
16. indemnification and insuranceThe insurance premium for a policy of insurance indemnifying Directors, officers and others (as defined in the relevant policy of insurance) is paid by DRH. The auditors are in no way indemnified out of the assets of DB RREEF Trust.
17. audit
17.1 auditor
PricewaterhouseCoopers (PwC or the Auditor) continues in office in accordance with section 327 of the Corporations Act 2001.
17.2 non-audit services
Details of the amounts paid to the Auditor, which include amounts paid for non-audit services are set out in note 7 of the Notes to the financial statements.
The Board Audit Committee is satisfied that the provision of non-audit services provided during the year by the Auditor (or by another person or firm on the Auditor’s behalf) is compatible with the general standard of independence for auditors imposed by the Corporations Act 2001. The reasons for the Directors being satisfied are:
Board Audit Committee has determined that the external auditor will not provide services that have the potential to impair the independence of its audit role, including:
– participating in activities that are normally undertaken by management; and
– being remunerated on a “success fee” basis.
Board Audit Committee has determined that the Auditor will not provide services where the Auditor may be required to review or audit its own work, including:
– the preparation of accounting records;
– the design and implementation of information technology systems;
– conducting valuation, actuarial or legal services;
– promoting, dealing in or underwriting securities; or
– providing internal audit services.
Board Audit Committee regularly reviews the performance and independence of the Auditor and whether the independence of this function has been maintained having regard to the provision of non-audit services. The Auditor has provided a written declaration to the Board regarding its independence at each reporting period and Board Audit Committee approval is required before the engagement of the Auditor to perform any non-audit service for a fee in excess of $100,000.
The above Directors’ statements are in accordance with the advice received from the Board Audit Committee.
17.3 audit independence declaration
A copy of the Auditors’ Independence Declaration as required under section 307C of the Corporations Act 2001 is set out in the Financial Statements and forms part of this Directors’ Report.
n
n
n
www.global-reports.com

DB RREEF Trust Financial Reports 2007 77
18. corporate governanceDRFM’s Corporate Governance Statement is set out in a separate section of the Annual Report.
19. rounding of amounts and currencyDB RREEF Trust is a registered scheme of a kind referred to in Class Order 98/0100, issued by the Australian Securities & Investments Commission, relating to the “rounding off” of amounts in this Directors’ Report and the Financial Statements. Amounts in this Directors’ Report and Financial Statements have been rounded off in accordance with that Class Order to the nearest thousand dollars, unless otherwise indicated. All figures in this Directors’ Report and the Financial Statements, except where otherwise stated, are expressed in Australian dollars.
20. management representationThe Chief Executive Officer and Chief Operating Officer, the person who effectively holds the role of Chief Financial Officer, have reviewed DB RREEF Trust’s financial reporting processes, policies and procedures together with its risk management and internal control and compliance policies and procedures. Following that review it is their opinion that DB RREEF Trust’s financial records for the financial year have been properly maintained in accordance with the Corporations Act 2001 and the Financial Statements and their notes comply with the accounting standards and give a true and fair view.
21. directors’ authorisationThis Directors’ Report is made in accordance with a resolution of the Directors.
Christopher T BeareChair
27 August 2007
Victor P Hoog AntinkChief Executive Officer
27 August 2007
www.global-reports.com
78 DB RREEF Trust Financial Reports 2007
auditor’s independence declaration
www.global-reports.com

DB RREEF Trust Financial Reports 2007 79
income statementsFOR THE YEAR ENDED 30 JUNE 2007
Consolidated Parent Entity
Note(s)2007
$’0002006$’000
2007$’000
2006$’000
Revenue from ordinary activitiesProperty revenue 2 693,430 663,496 153,063 145,763Distribution revenue – – 33,400 40,647Interest revenue 8,106 8,153 560 627
Total revenue from ordinary activities 701,536 671,649 187,023 187,037
Share of net profits of associates accounted for using the equity method 18 52,715 26,911 – –Proceeds from sale of inventory 3,959 – – –Net gain on sale of investment properties 3,355 1,490 15 112Net fair value gain of investment properties 831,330 686,490 217,847 186,002Net fair value gain of investments – – 89,559 99,488Net fair value gain of derivatives 52,458 73,271 11,687 15,349Net foreign exchange gain/(loss) 1,349 2,903 33,322 (3,154)Other income 1,672 519 87 190
Total income 1,648,374 1,463,233 539,540 485,024
ExpensesProperty expenses (170,120) (159,295) (39,470) (36,211)Responsible Entity fees 35 (33,650) (28,695) (11,961) (10,534)Finance costs 3 (184,786) (166,116) (42,672) (35,377)Carrying value of inventory sold (3,478) – – –Depreciation (2,488) (1,023) – –Costs associated with the Transaction 4 – (480) – (160)Impairment of goodwill – (3,287) – –Other expenses 6 (10,588) (8,829) (1,580) (1,523)
Total expenses (405,110) (367,725) (95,683) (83,805)
Profit before tax 1,243,264 1,095,508 443,857 401,219Tax expenseIncome tax benefit/(expense) 5(a) 1,110 (1,169) – –Withholding tax expense 5(d) (33,583) (27,954) – –
Total tax expense (32,473) (29,123) – –
Profit after tax 1,210,791 1,066,385 443,857 401,219
Profit attributable to:Equity holders of the parent entity 446,378 398,925 443,857 401,219Equity holders of other stapled entities (minority interest) 722,441 611,417 – –
Stapled security holders 1,168,819 1,010,342 443,857 401,219Net profit attributable to other minority interests 41,972 56,043 – –
Net profit 1,210,791 1,066,385 443,857 401,219
Earnings per unit Cents Cents Cents Cents
Basic earnings per unit on profit attributable to equity holders of the parent entity 40 15.62 14.39 15.53 14.47Diluted earnings per unit on profit attributable to equity holders of the parent entity 40 15.62 14.39 15.53 14.47
The above Income Statements should be read in conjunction with the accompanying notes.
www.global-reports.com

80 DB RREEF Trust Financial Reports 2007
balance sheetsAS AT 30 JUNE 2007
Consolidated Parent Entity
Note(s)2007
$’0002006$’000
2007$’000
2006$’000
Current assetsCash and cash equivalents 8 59,603 106,428 9,096 15,743Receivables 9 36,389 35,254 19,495 22,109Held for sale investment properties 15 – 24,000 – –Inventories 10 – 3,344 – –Derivative financial instruments 12 145,425 92,478 33,124 26,054Other financial instruments 13 51,936 45,092 – –Current tax assets 112 289 – –Other 14 9,664 6,050 2,439 1,227
Total current assets 303,129 312,935 64,154 65,133
Non-current assetsInvestment properties 15 8,585,703 7,558,945 1,987,034 1,673,804Property plant and equipment 16 314,021 173,468 – –Other financial assets at fair value through profit and loss 17 – – 294,901 247,172Investments accounted for using the equity method 18 270,155 235,062 – –Investments in associates 18 – – 481,712 454,398Deferred tax assets 19 3,921 116 – –Other 20 9,907 7,012 803 750
Total non-current assets 9,183,707 7,974,603 2,764,450 2,376,124
Total assets 9,486,836 8,287,538 2,828,604 2,441,257
Current liabilitiesPayables 21 124,509 100,901 24,129 15,671Interest bearing liabilities 22 18,443 244,553 – –Loans with related parties 11 – – 34,332 34,332Current tax liabilities 1,930 3,156 – –Provisions 23 164,992 155,523 68,470 54,178Derivative financial instruments 12 21,333 20,477 7,861 9,052Other 24 3,150 5,452 – –
Total current liabilities 334,357 530,062 134,792 113,233
Non-current liabilitiesInterest bearing liabilities 22 3,334,884 2,950,494 702,914 706,986Deferred tax liabilities 25 73,809 48,726 – –Financial liability with other minority interest 26 28,305 29,105 – –Other 27 10,538 13,638 1,210 1,084
Total non-current liabilities 3,447,536 3,041,963 704,124 708,070
Total liabilities 3,781,893 3,572,025 838,916 821,303
Net assets 5,704,943 4,715,513 1,989,688 1,619,954
EquityEquity attributable to equity holders of the parent entityContributed equity 28 1,151,526 1,094,144 1,151,526 1,094,144Reserves 29 (925) 739 – –Undistributed income 29 839,248 524,375 838,162 525,810
Parent entity security holders’ interest 1,989,849 1,619,258 1,989,688 1,619,954
Equity attributable to equity holders of other entities stapled to DDF (minority interest)Contributed equity 28 2,182,833 2,094,887 – –Reserves 29 3,054 (561) – –Undistributed income 29 1,091,034 574,078 – –
Other stapled security holders’ interest 3,276,921 2,668,404 – –
Stapled security holders’ interest 5,266,770 4,287,662 1,989,688 1,619,954Other minority interest 30 438,173 427,851 – –
Total equity 5,704,943 4,715,513 1,989,688 1,619,954
The above Balance Sheets should be read in conjunction with the accompanying notes.
www.global-reports.com

DB RREEF Trust Financial Reports 2007 81
Consolidated Parent Entity
Note(s)2007
$’0002006$’000
2007$’000
2006$’000
Total equity at the beginning of the year 4,715,513 3,865,712 1,619,954 1,288,981Adjustment on adoption of AASB 132 and AASB 139, net of tax:
Undistributed income – 3,443 – 2,165Exchange differences on translation of foreign operations 29 1,951 1,301 – –
Net income recognised directly in equity 1,951 4,744 – 2,165
Net profit 1,210,791 1,066,385 443,857 401,219
Total recognised income and expense for the year 1,212,742 1,071,129 443,857 403,384
Transactions with equity holders in their capacity as equity holders:Contributions of equity, net of transaction costs 28 145,328 94,776 57,382 34,278Distributions provided for or paid 31 (324,638) (306,259) (131,505) (106,689)
Transactions with other minority interest:Contributions of equity, net of transaction costs 4,130 7,649 – –Distributions provided for or paid 31 (19,045) (21,964) – –Foreign currency translation reserve (29,087) 4,470 – –
Total transactions with equity holders (223,312) (221,328) (74,123) (72,411)
Total equity at the end of the year 5,704,943 4,715,513 1,989,688 1,619,954
Total recognised income and expense for the year is attributable to:Equity holders of the parent entity – DDF unitholders 444,714 403,377 443,857 403,384Equity holders of other entities stapled to DDF (minority interest) 726,056 611,428 – –
Security holders of DB RREEF Diversified Trust 1,170,770 1,014,805 443,857 403,384
Other minority interest 41,972 56,324 – –
Total recognised income and expense for the year 1,212,742 1,071,129 443,857 403,384
The above Statements of Changes in Equity should be read in conjunction with the accompanying notes.
statements of changes in equityFOR THE YEAR ENDED 30 JUNE 2007
www.global-reports.com
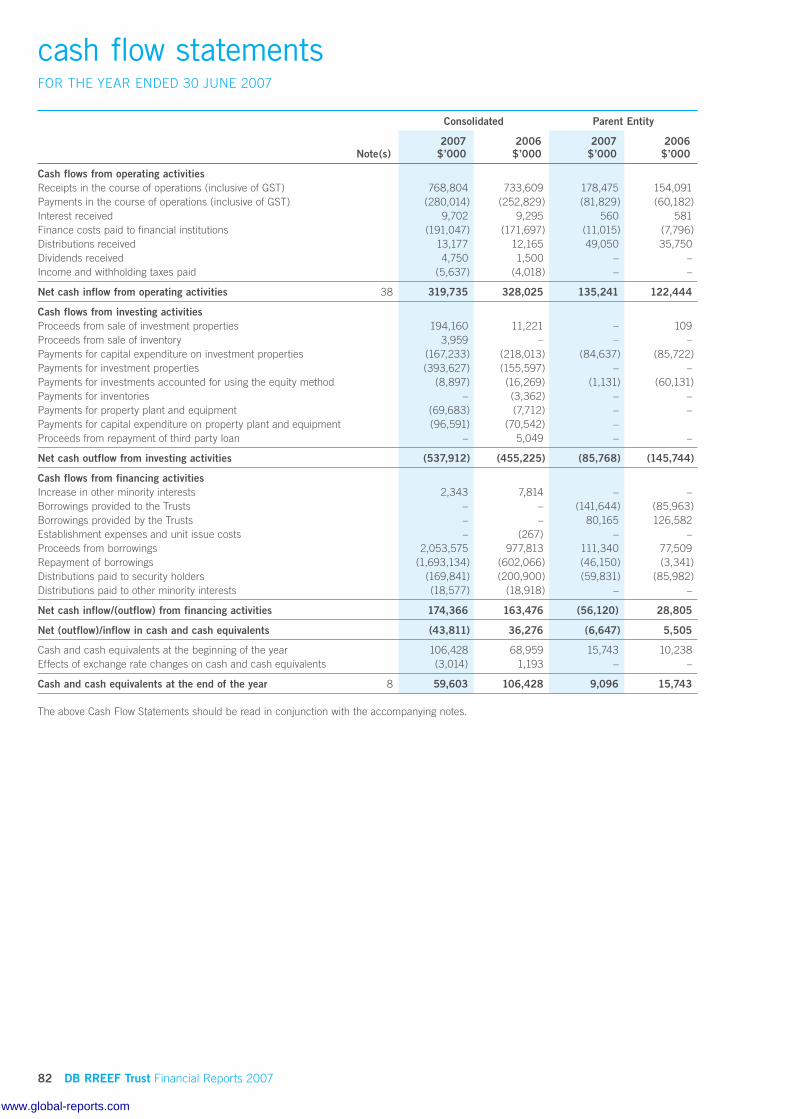
82 DB RREEF Trust Financial Reports 2007
cash flow statementsFOR THE YEAR ENDED 30 JUNE 2007
Consolidated Parent Entity
Note(s)2007
$’0002006$’000
2007$’000
2006$’000
Cash flows from operating activitiesReceipts in the course of operations (inclusive of GST) 768,804 733,609 178,475 154,091Payments in the course of operations (inclusive of GST) (280,014) (252,829) (81,829) (60,182)Interest received 9,702 9,295 560 581Finance costs paid to financial institutions (191,047) (171,697) (11,015) (7,796)Distributions received 13,177 12,165 49,050 35,750Dividends received 4,750 1,500 – –Income and withholding taxes paid (5,637) (4,018) – –
Net cash inflow from operating activities 38 319,735 328,025 135,241 122,444
Cash flows from investing activitiesProceeds from sale of investment properties 194,160 11,221 – 109Proceeds from sale of inventory 3,959 – – –Payments for capital expenditure on investment properties (167,233) (218,013) (84,637) (85,722)Payments for investment properties (393,627) (155,597) – –Payments for investments accounted for using the equity method (8,897) (16,269) (1,131) (60,131)Payments for inventories – (3,362) – –Payments for property plant and equipment (69,683) (7,712) – –Payments for capital expenditure on property plant and equipment (96,591) (70,542) –Proceeds from repayment of third party loan – 5,049 – –
Net cash outflow from investing activities (537,912) (455,225) (85,768) (145,744)
Cash flows from financing activitiesIncrease in other minority interests 2,343 7,814 – –Borrowings provided to the Trusts – – (141,644) (85,963)Borrowings provided by the Trusts – – 80,165 126,582Establishment expenses and unit issue costs – (267) – –Proceeds from borrowings 2,053,575 977,813 111,340 77,509Repayment of borrowings (1,693,134) (602,066) (46,150) (3,341)Distributions paid to security holders (169,841) (200,900) (59,831) (85,982)Distributions paid to other minority interests (18,577) (18,918) – –
Net cash inflow/(outflow) from financing activities 174,366 163,476 (56,120) 28,805
Net (outflow)/inflow in cash and cash equivalents (43,811) 36,276 (6,647) 5,505
Cash and cash equivalents at the beginning of the year 106,428 68,959 15,743 10,238Effects of exchange rate changes on cash and cash equivalents (3,014) 1,193 – –
Cash and cash equivalents at the end of the year 8 59,603 106,428 9,096 15,743
The above Cash Flow Statements should be read in conjunction with the accompanying notes.
www.global-reports.com

DB RREEF Trust Financial Reports 2007 83
note 1. summary of significant accounting policies
(a) basis of preparation
In accordance with AASB Interpretation 1002: Post-Date-of-Transition Stapling Arrangements, the Trusts must be consolidated. The parent entity and deemed acquirer of the Trusts is DDF.
The DDF Consolidated column represents the consolidated result of DDF, which comprises DDF and its controlled entities, DIT and its controlled entities, DOT and its controlled entities and DRO and its controlled entities. Equity attributable to other trusts stapled to DDF is a form of minority interest in accordance with AASB 1002 and, in the DDF consolidated column, represents the equity of DIT, DOT and DRO. Other minority interests represent the equity attributable to parties external to the Trusts.
DB RREEF Trust stapled securities are quoted on the Australian Stock Exchange under the code “DRT” and comprise one unit in each of DDF, DIT, DOT and DRO. Each entity forming part of DRT continues as a separate legal entity in its own right under the Corporations Act 2001 and is therefore required to comply with the reporting and disclosure requirements under the Corporations Act 2001 and Australian Accounting Standards.
DB RREEF Funds Management Limited as Responsible Entity for each of the Trusts may only un-staple the Trusts if approval is obtained by special resolution of the stapled security holders.
This general purpose financial report for the year ended 30 June 2007 has been prepared in accordance with the requirements of the Trusts’ Constitutions, the Corporations Act 2001 and Australian Equivalents to International Financial Reporting Standards (AIFRS). Compliance with AIFRS ensures that the consolidated Financial Statements and notes comply with International Financial Reporting Standards (IFRS). The Trusts changed their accounting policies on 1 July 2005 to comply with AIFRS.
This financial report is prepared on the going concern basis and in accordance with historical cost conventions and has not been adjusted to take account of either changes in the general purchasing power of the dollar or changes in the values of specific assets, except for the revaluation of certain non-current assets and financial instruments (refer notes 1(f), 1(n), 1(p) and 1(r)).
The accounting policies adopted are consistent with those of the previous financial year and corresponding interim reporting period, unless otherwise stated.
Critical accounting estimates
The preparation of Financial Statements in conformity with AIFRS may require the use of certain critical accounting estimates and management to exercise its judgement in the process of applying the Trusts’ accounting policies. Other than the estimation of fair values described in notes 1(f) and 1(p), no key assumptions concerning the future or other estimation of uncertainty at the reporting date have a significant risk of causing material adjustments to the Financial Statements in the next annual reporting period.
(b) principles of consolidation
Controlled entities
The Financial Statements have been prepared on a consolidated basis in recognition of the fact that while the securities issued by the Trusts are stapled into one trading security and cannot be traded separately, the Financial Statements must be presented on a consolidated basis. The parent entity and deemed acquirer of the Trusts is DDF. The accounting policies of the subsidiary trusts are consistent with those of the parent.
The Financial Statements incorporate an elimination of inter-entity transactions and balances to present the Financial Statements on a consolidated basis. Net profit and equity in controlled entities, which is attributable to the unit holdings of minority interests, are shown separately in the Income Statements and Balance Sheets respectively. Where control of an entity is obtained during a financial year, its results are included in the Income Statements from the date on which control is gained. The Financial statements incorporate all the assets, liabilities and results of the parent and its controlled entities.
Partnerships and joint ventures
Where assets are held in a partnership or joint venture with another entity directly, the Trusts’ share of the results and assets of this partnership or joint venture are consolidated into the Income Statements and Balance Sheets of the Trusts. Where assets are jointly controlled via ownership of units in single purpose unlisted unit trusts or shares in companies, the Trusts apply equity accounting to record the operations of these investments (refer note 1(s)).
(c) other financial assets at fair value through profit and loss
Interests held by the Trust in controlled entities and associates are measured at fair value with changes in fair value recognised immediately in the Income Statements.
(d) revenue recognition
Rent
Rental income is brought to account on a straight-line basis over the lease term for leases with fixed rent review clauses. In all other circumstances rental income is brought to account on an accruals basis. If not received at balance date, rental income is reflected in the Balance Sheets as a receivable. Recoverability of receivables is reviewed on an ongoing basis. Debts which are known to be not collectable are written off.
Interest income
Interest income is brought to account on an accruals basis using the effective interest rate method and, if not received at the balance date, is reflected in the Balance Sheets as a receivable.
Dividends and distribution income
Income from dividends and distributions are recognised when declared. Amounts not received at balance date are included as a receivable in the Balance Sheets.
(e) expenses
Expenses are brought to account on an accruals basis and, if not paid at the balance date, are reflected in the Balance Sheets as a payable.
Property expenses
Property expenses include rates, taxes and other property outgoings incurred in relation to investment properties and property plant and equipment where such expenses are the responsibility of the Trusts.
Financing costs to financial institutions
Financing costs include interest expense and other costs incurred in respect of obtaining finance. Other transaction costs incurred including loan establishment fees in respect of obtaining finance are applied against the related financings with the amortisation of such costs being recognised through the effective interest rate on the financing over the term of the respective agreement.
notes to the financial statementsFOR THE YEAR ENDED 30 JUNE 2007
www.global-reports.com

84 DB RREEF Trust Financial Reports 2007
notes to the financial statements (continued)
note 1. summary of significant accounting policies (continued)
(e) expenses (continued)
Financing costs are expensed unless they relate to qualifying assets. Qualifying assets are assets which take a substantial period of time to prepare for their intended use or sale. Where funds are borrowed specifically for the acquisition or construction of a qualifying asset, financing costs capitalised are those incurred in relation to that financing, net of any interest earned on those financings. Where funds are borrowed generally, financing costs are capitalised using a weighted average capitalisation rate.
(f) derivatives and other financial instruments
(i) Derivatives
The Trusts’ activities expose it to changes in interest rates and foreign exchange rates. Accordingly, the Trusts enter into various derivative financial instruments to manage its exposure to the movements in interest rates and foreign exchange rates. Policies and limits are approved by the Board of Directors of the Responsible Entity in respect of the usage of derivatives and other financial instruments to hedge those cash flows and earnings which are subject to interest rate risks and foreign currency risks respectively. In conjunction with its advisers, the Responsible Entity continually reviews the Trusts’ exposures and updates its treasury policies and procedures. The Trusts do not trade in derivative instruments for speculative purposes.
Even though the derivatives entered into aim to provide an economic hedge to interest rate and foreign currency risks, the Trusts have elected not to apply hedge accounting under AASB 139: Financial Instruments – Recognition and Measurement. Accordingly, derivatives including interest rate swaps and foreign exchange contracts, are measured at fair value with any changes in fair value recognised immediately in the Income Statements.
(ii) Embedded derivatives
Derivatives embedded in other financial instruments or other host contracts are treated as separate derivatives when their risks and characteristics are not closely related to those of host contracts and the host contracts are not measured at fair value with changes in fair value recognised in the Income Statements.
(iii) Debt and equity instruments issued by DRT
Financial instruments issued by DRT are classified as either liabilities or as equity in accordance with the substance of the contractual arrangements. Accordingly, ordinary units issued by DDF, DIT, DOT and DRO are classified as equity.
Interest and distributions are classified as expenses or as distributions of profit consistent with the balance sheet classification of the related debt or equity instruments. Transaction costs arising on the issue of equity instruments are recognised directly in equity (net of tax) as a reduction of the proceeds of the equity instruments to which the costs relate. Transaction costs are the costs that are incurred directly in connection with the issue of those equity instruments and which would not have been incurred had those instruments not been issued.
(iv) Financial guarantee contracts
Financial guarantee contracts are recognised as a financial liability at the time the guarantee is issued. The liability is initially measured at fair value and subsequently at the higher of the amount determined in accordance with AASB 137 Provisions: Contingent Liabilities and
Contingent Assets and the amount initially recognised less cumulative amortisation, where appropriate.
The fair value of financial guarantees is determined as the present value of the difference in the net cash flows between the contractual payments under the debt instrument and the payments that would be required without the guarantee, or the estimated amount that would be payable to a third party for assuming the obligations. Where guarantees in relation to loans or other payables of subsidiaries or associates are provided for no compensation, the fair values are accounted for as contributions and recognised as part of the cost of the investment.
Change in accounting policy
The policy of recognising financial guarantee contracts as financial liabilities was adopted for the first time in the current financial year. In previous reporting periods, a liability for financial guarantee contracts was only recognised if it was probable that the debtor would default and a payment would be required under the contract.
The change in policy was necessary following the change to AASB 139: Financial Instruments – Recognition and Measurement. The new policy has been applied retrospectively. There were no adjustments to current and prior period numbers as the fair value calculated by management was not material.
(v) Loans and receivables
Loans and other receivables are measured at amortised cost using the effective interest rate method less impairment.
(g) goods and services tax/value added tax
Revenues, expenses and capital assets are recognised net of the amount of Australian/New Zealand goods and services tax (GST) or French and German value added tax (VAT), except where the amount of GST/VAT incurred is not recoverable. In these circumstances the GST/VAT is recognised as part of the cost of acquisition of the asset or as part of the expense.
Cash flows are included in the Cash Flow Statements on a gross basis. The GST component of cash flows arising from investing and financing activities which is recoverable from or payable to the ATO is classified as operating cash flows.
(h) taxation
Under current Australian income tax legislation DDF, DIT and DOT, are not liable for income tax provided they satisfy certain legislative requirements. These Trusts may be liable for income tax in jurisdictions where foreign property is held (i.e. USA, France, Germany or New Zealand).
DRO is a trading trust and is subject to Australian income tax as follows:
the income tax expense for the year is the tax payable on the current year’s taxable income based on a tax rate of 30 percent adjusted for changes in deferred tax assets and liabilities and unused tax losses;
deferred tax assets and liabilities are recognised for temporary differences arising from differences between the carrying amount of assets and liabilities and the corresponding tax base of those items. The relevant tax rates are applied to the cumulative amounts of deductible and taxable temporary differences to measure the deferred tax assets or liabilities. An exception is made for certain temporary differences arising from the initial recognition of an asset or a liability (where they do not arise as a result of a business combination and did not affect either accounting profit/loss or taxable profit/loss);
n
n
www.global-reports.com

DB RREEF Trust Financial Reports 2007 85
deferred tax assets are recognised for deductible temporary differences and unused tax losses only if it is probable that future taxable amounts will be available to utilise those temporary differences and losses;
deferred tax assets and liabilities are not recognised for temporary differences between the carrying amount and tax bases of investments in controlled entities where the parent entity is able to control the timing of the reversal of the temporary differences and it is probable that the differences will not reverse in the foreseeable future; and
current and deferred tax balances attributable to amounts recognised directly in equity are also recognised directly in equity.
Withholding tax payable on distributions received by DRT from DB RREEF Industrial Properties Inc (US REIT) and DB RREEF Properties Inc (US REIT II) are recognised as an expense when tax is withheld.
In addition, a deferred tax liability or asset and related deferred tax expense/benefit is recognised on differences between the tax cost base of US assets and liabilities in DRT (held by US REIT and US REIT II) and their accounting carrying values at balance date. Any deferred tax liability or asset is calculated using a blend of the current withholding tax rate applicable to income distributions and the applicable US federal and state taxes.
Under current Australian income tax legislation, the security holders will generally be entitled to receive a foreign tax credit for US withholding tax deducted from distributions paid by the US REIT and US REIT II.
DIT France Logistique SAS (DIT France), a wholly owned sub-trust of DIT, is liable for French corporation tax on its taxable income at the rate of 34.43 percent. In addition a deferred tax liability or asset and its related deferred tax expense/benefit is recognised on differences between the tax cost base of the French real estate assets and their accounting carrying value at balance date.
DB RREEF GLOG Trust, a wholly owned Australian sub-trust of DIT, is liable for German income tax on its German taxable income at the rate of 26.375 percent (note that this rate is reduced to 15 percent from 1 January 2008). In addition a deferred tax liability or asset and its related deferred tax expense/benefit is recognised on differences between the tax cost base of the German real estate assets and their accounting carrying value at balance date.
DOT NZ Sub-Trust No. 1, a wholly owned Australian sub-trust of DOT is liable for New Zealand corporate tax on its New Zealand taxable income at the rate of 33 percent. In addition, a deferred tax liability or asset and its related deferred tax expense/benefit is recognised on differences between the tax cost base of the New Zealand real estate assets and their accounting carrying value at balance date.
(i) distributions
In accordance with the Trust’s Constitution, the Trust distributes its distributable income to unitholders by cash or reinvestment. Distributions are provided for when they are approved by the Board of Directors and declared.
(j) repairs and maintenance
Plant is required to be overhauled on a regular basis and is managed as part of an ongoing major cyclical maintenance program. The costs of this maintenance are charged as expenses as incurred, except where they relate to the replacement of a component of an asset, in which case the replaced component will be derecognised and the replacement costs capitalised in accordance with note 1(p). Other routine operating maintenance, repair costs and minor renewals are also charged as expenses as incurred.
n
n
n
(k) cash and cash equivalents
Cash and cash equivalents include cash on hand, deposits held at call with financial institutions and other short-term, highly liquid investments with original maturities of three months or less that are readily convertible to known amounts of cash and which are subject to an insignificant risk of changes in value.
(l) receivables
Trade receivables are recognised initially at fair value and subsequently measured at amortised cost, which is based on the invoiced amount less provision for doubtful debts. Trade receivables are required to be settled within 30 days and are assessed on an ongoing basis for impairment. Receivables which are known to be uncollectable are written off. A provision for doubtful debts is established when there is objective evidence that the Trusts will not be able to collect all amounts due according to the original terms of the receivables.
(m) inventories
Properties undergoing or having completed construction or development for ultimate sale are classified as inventory and are measured at the lower of cost or net realisable value. Cost is assigned by specific identification and includes the cost of acquisition, development and finance costs during development. When development is completed, finance costs and other holding charges are expensed as incurred.
(n) property plant and equipment
All property plant and equipment is initially recognised at cost including transaction costs. Land and freehold buildings are accounted for using the cost method. Construction in progress is subsequently recognised at fair value in the Financial Statements. Revaluation increments are credited directly to the asset revaluation reserve, unless they are reversing a previous decrement charged as an expense in the Income Statements, in which case they are credited directly to the Income Statements.
Revaluation decrements are recognised directly as an expense in the Income Statements, unless they are reversing a revaluation increment previously credited to, and still included in the balance of the asset revaluation reserve, in which case they are debited directly to the asset revaluation reserve.
(o) depreciation of property plant and equipment
Land is not depreciated. Depreciation on buildings (including fit-out) is calculated on a straight-line basis so as to write off the net cost of each non-current asset over its expected useful life. Buildings (including fit-out) have estimated useful lives of between five and 50 years. Estimates for useful lives are reviewed on a regular basis.
(p) investment properties
Investment properties consist of properties held for long-term rental yields, capital appreciation or both. Investment properties are initially recognised at cost including transaction costs. Investment properties are subsequently recognised at fair value in the Financial Statements.
The basis of valuations of investment properties is fair value being the amounts for which the assets could be exchanged between knowledgeable willing parties in an arm’s length transaction, based on current prices in an active market for similar properties in the same location and condition and subject to similar leases. Where this is not available, an appropriate valuation method is used, which may include the discounted cashflow and the capitalisation method.
www.global-reports.com

86 DB RREEF Trust Financial Reports 2007
notes to the financial statements (continued)
note 1. summary of significant accounting policies (continued)
(p) investment properties (continued)
Discount rates and capitalisation rates are determined based on industry expertise and knowledge, and where possible a direct comparison to third party rates for similar assets in a comparable location. Rental income from current leases and assumptions about future leases, as well as any expected operational cash outflows in relation to the property, are also reflected in fair value.
External valuations of the individual investments are carried out in accordance with the Trusts’ Constitutions, or may be earlier where the Responsible Entity believes there is a potential for a material change in the fair value of the property.
Changes in fair values are recorded in the Income Statements. The gain or loss on disposal of an investment property is calculated as the difference between the carrying amount of the asset at the date of disposal and the net proceeds from disposal and is included in the Income Statements in the year of disposal.
Subsequent redevelopment and refurbishment costs (other than repairs and maintenance) are capitalised to the investment property where they result in an enhancement in the future economic benefits of the property. Repairs and maintenance are accounted for in accordance with note 1(j).
(i) Held for sale investment properties
Investment properties intended for sale are separately disclosed on the Balance Sheets as “Held for sale investment properties”. Such properties are measured using the same methodology as investment properties.
(q) leasing fees
Leasing fees incurred are capitalised and amortised over the lease periods to which they relate.
(r) lease incentives
Prospective lessees may be offered incentives as an inducement to enter into operating leases. These incentives may take various forms including cash payments, rent free periods, or a contribution to certain lessee costs such as fit-out costs or relocation costs.
The costs of incentives are recognised as a reduction of rental income on a straight-line basis from the earlier of the date which the tenant has effective use of the premises or the lease commencement date to the end of the lease term. The carrying amount of the lease incentives is reflected in the fair value of investment properties.
(s) investments accounted for using the equity method
Some property investments are held through the ownership of units in single purpose unlisted trusts or shares in unlisted companies where the Trusts exert significant influence or joint control but does not have a controlling interest. These investments are considered to be associates and the equity method of accounting is applied in the consolidated Financial Statements.
Under this method, the entity’s share of the post-acquisition profits of associates is recognised as revenue in the Consolidated Income Statements. The cumulative post-acquisition movements are adjusted against the carrying amount of the investment. Dividends or distributions receivable from associates are recognised in the parent entity’s Income Statements, while in the consolidated Financial Statements they reduce the carrying amount of the investment.
When the Trust’s share of losses in an associate equal or exceed its interest in the associate (including any unsecured receivables) the Trusts do not recognise any further losses unless it has incurred obligations or made payments on behalf of the associate.
(t) acquisition of assets
The purchase method of accounting is used for all acquisitions including business combinations. Cost is measured as the fair value of the assets given up, shares issued or liabilities assumed at the date of exchange plus costs directly attributable to the acquisition. Where equity instruments are issued in an acquisition, the value of the instruments is their published market price as at the date of exchange unless, in rare circumstances, it can be demonstrated that the published price at the date of exchange is an unreliable indicator of fair value and that other evidence and valuation methods provide a more reliable measure of fair value. Transaction costs arising on the issue of equity instruments are recognised directly in equity.
Identifiable assets acquired and liabilities and contingent liabilities assumed in a business combination are measured initially at their fair values. The excess of the acquisition cost over the fair value of the assets and liabilities acquired is recorded as goodwill (refer note 1(u)). If the cost is less than the fair value of the net assets acquired, the difference is recognised directly in the Income Statements.
Where settlement of any part of cash consideration is deferred, the amounts payable in the future are discounted to their present value as at the date of exchange at the entity’s incremental financing rate.
(u) goodwill
Where a business combination is acquired, the identifiable net assets acquired are measured at fair value. The excess of the acquisition costs over the fair value of the identifiable net assets is brought to account as goodwill in the Balance Sheets. The carrying value of the goodwill is tested for impairment at each reporting date with any decrement in value taken to the Income Statements as an expense.
(v) fair value estimation of financial assets and liabilities
The fair value of financial assets and financial liabilities must be estimated for recognition and measurement and for disclosure purposes. The fair value of financial instruments traded in active markets (such as publicly traded derivatives and available for sale securities) is based on quoted market prices at the balance sheet date. The appropriate quoted market price used for financial assets held by the Trusts is the current bid price, the appropriate quoted market price for financial liabilities is the current ask price.
The fair value of financial instruments that are not traded in an active market (for example, over-the-counter derivatives) is determined using valuation techniques including dealer quotes for similar instruments and discounted cash flows. In particular, the fair value of interest rate swaps is calculated as the present value of the estimated future cash flows and the fair value of forward exchange rate contracts is determined using forward exchange market rates at the balance sheet date.
(w) payables
These amounts represent liabilities for amounts owing at balance date. The amounts are unsecured and are usually paid within 30 days of recognition.
www.global-reports.com
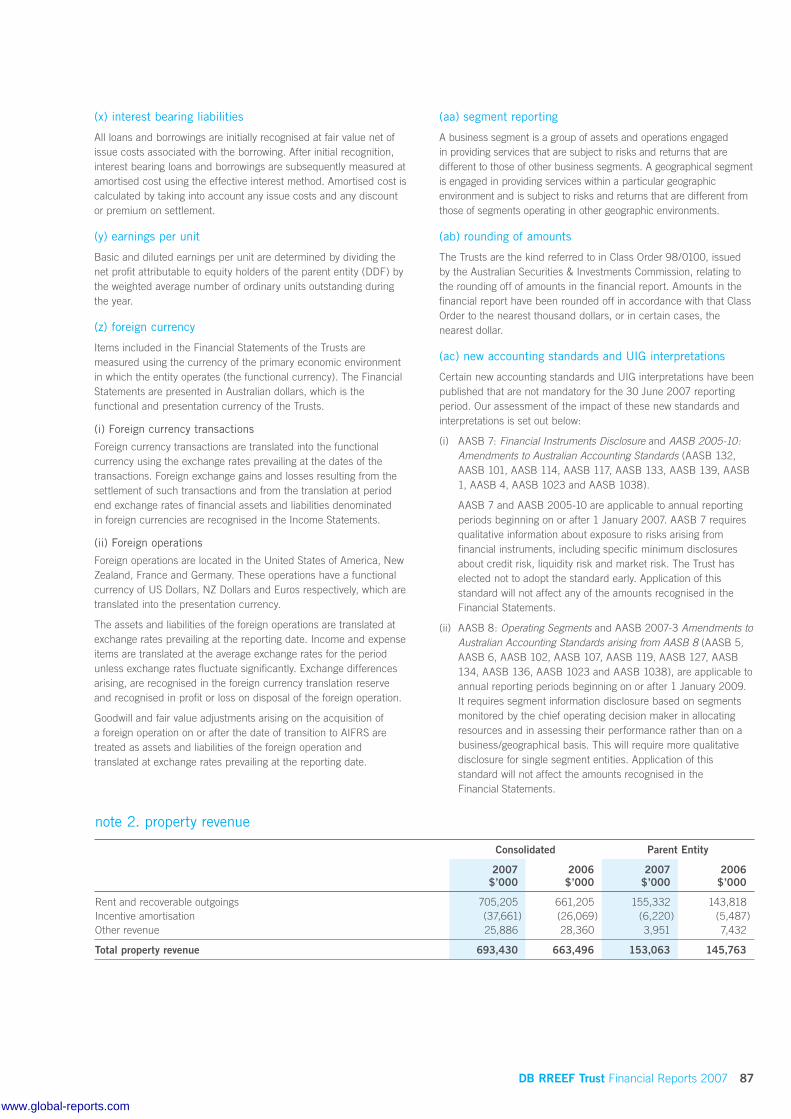
DB RREEF Trust Financial Reports 2007 87
(x) interest bearing liabilities
All loans and borrowings are initially recognised at fair value net of issue costs associated with the borrowing. After initial recognition, interest bearing loans and borrowings are subsequently measured at amortised cost using the effective interest method. Amortised cost is calculated by taking into account any issue costs and any discount or premium on settlement.
(y) earnings per unit
Basic and diluted earnings per unit are determined by dividing the net profit attributable to equity holders of the parent entity (DDF) by the weighted average number of ordinary units outstanding during the year.
(z) foreign currency
Items included in the Financial Statements of the Trusts are measured using the currency of the primary economic environment in which the entity operates (the functional currency). The Financial Statements are presented in Australian dollars, which is the functional and presentation currency of the Trusts.
(i) Foreign currency transactions
Foreign currency transactions are translated into the functional currency using the exchange rates prevailing at the dates of the transactions. Foreign exchange gains and losses resulting from the settlement of such transactions and from the translation at period end exchange rates of financial assets and liabilities denominated in foreign currencies are recognised in the Income Statements.
(ii) Foreign operations
Foreign operations are located in the United States of America, New Zealand, France and Germany. These operations have a functional currency of US Dollars, NZ Dollars and Euros respectively, which are translated into the presentation currency.
The assets and liabilities of the foreign operations are translated at exchange rates prevailing at the reporting date. Income and expense items are translated at the average exchange rates for the period unless exchange rates fluctuate significantly. Exchange differences arising, are recognised in the foreign currency translation reserve and recognised in profit or loss on disposal of the foreign operation.
Goodwill and fair value adjustments arising on the acquisition of a foreign operation on or after the date of transition to AIFRS are treated as assets and liabilities of the foreign operation and translated at exchange rates prevailing at the reporting date.
(aa) segment reporting
A business segment is a group of assets and operations engaged in providing services that are subject to risks and returns that are different to those of other business segments. A geographical segment is engaged in providing services within a particular geographic environment and is subject to risks and returns that are different from those of segments operating in other geographic environments.
(ab) rounding of amounts
The Trusts are the kind referred to in Class Order 98/0100, issued by the Australian Securities & Investments Commission, relating to the rounding off of amounts in the financial report. Amounts in the financial report have been rounded off in accordance with that Class Order to the nearest thousand dollars, or in certain cases, the nearest dollar.
(ac) new accounting standards and UIG interpretations
Certain new accounting standards and UIG interpretations have been published that are not mandatory for the 30 June 2007 reporting period. Our assessment of the impact of these new standards and interpretations is set out below:
(i) AASB 7: Financial Instruments Disclosure and AASB 2005-10:Amendments to Australian Accounting Standards (AASB 132, AASB 101, AASB 114, AASB 117, AASB 133, AASB 139, AASB 1, AASB 4, AASB 1023 and AASB 1038).
AASB 7 and AASB 2005-10 are applicable to annual reporting periods beginning on or after 1 January 2007. AASB 7 requires qualitative information about exposure to risks arising from financial instruments, including specific minimum disclosures about credit risk, liquidity risk and market risk. The Trust has elected not to adopt the standard early. Application of this standard will not affect any of the amounts recognised in the Financial Statements.
(ii) AASB 8: Operating Segments and AASB 2007-3 Amendments to Australian Accounting Standards arising from AASB 8 (AASB 5, AASB 6, AASB 102, AASB 107, AASB 119, AASB 127, AASB 134, AASB 136, AASB 1023 and AASB 1038), are applicable to annual reporting periods beginning on or after 1 January 2009. It requires segment information disclosure based on segments monitored by the chief operating decision maker in allocating resources and in assessing their performance rather than on a business/geographical basis. This will require more qualitative disclosure for single segment entities. Application of this standard will not affect the amounts recognised in the Financial Statements.
note 2. property revenue
Consolidated Parent Entity
2007$’000
2006$’000
2007$’000
2006$’000
Rent and recoverable outgoings 705,205 661,205 155,332 143,818Incentive amortisation (37,661) (26,069) (6,220) (5,487)Other revenue 25,886 28,360 3,951 7,432
Total property revenue 693,430 663,496 153,063 145,763
www.global-reports.com

88 DB RREEF Trust Financial Reports 2007
note 3. finance costs
Consolidated Parent Entity
2007$’000
2006$’000
2007$’000
2006$’000
Interest paid/payable 197,462 176,604 97 (26)Interest paid to related party – – 46,321 41,030Amount capitalised (14,639) (10,488) (3,746) (5,627)Other finance costs 1,963 – – –
Total finance costs 184,786 166,116 42,672 35,377
The average capitalisation rate used to determine the amount of borrowing costs eligible for capitalisation is 6.58 percent (2006: 6.23 percent).
note 4. costs associated with the transactionCosts incurred in the prior year relate to the fees and expenses arising from the stapling of the Trust, DIT, DOT and DRO, the acquisition of the US REIT, and the associated debt arranging and interest rate hedging (together referred to as the Transaction).
note 5. income tax
(a) income tax expense
Consolidated
2007$’000
2006$’000
Current tax 2,241 936Deferred tax (3,351) 233
Income tax expense/(benefit) (1,110) 1,169
Deferred income tax (revenue)/expense included in income tax expense comprises:(Increase)/decrease in deferred tax assets (3,729) 207Increase in deferred tax liabilities 378 26
(3,351) 233
(b) reconciliation of income tax expense to net profit
Consolidated
2007$’000
2006$’000
Profit before tax 1,243,264 1,095,508Profit not subject to income tax (note 1(h)) (1,241,409) (1,087,056)
1,855 8,452
Prima facie tax at the Australian tax rate of 30 percent (2006: 30 percent) 557 2,535Tax effect of amounts which are not deductible (taxable) in calculating taxable income:
Depreciation and amortisation (430) 88Share of net profits of associates 47 (1,454)Revaluation of investment properties 1,628 –Difference in overseas tax rates (194) –Previously unrecognised tax losses now recognised (390) –Tax offset for franked dividends (1,950) –Sundry items (3) –
(1,292) (1,366)
Over provision in prior year (375) –
Income tax expense/(benefit) (1,110) 1,169
notes to the financial statements (continued)
www.global-reports.com

DB RREEF Trust Financial Reports 2007 89
(c) amounts recognised directly in equity
Consolidated
2007$’000
2006$’000
Aggregate current and deferred tax arising in the reporting period and not recognised in net profit or loss but directly debited or credited to equity:
Net deferred tax – credited directly to equity – (196)
– (196)
(d) withholding tax expense
Withholding tax expense of $33,583,000 (2006: $27,954,000) includes $31,178,000 (2006: $24,727,000) of deferred tax expense which is recognised on differences between the tax cost base of the US assets and liabilities and their accounting carrying value at balance date. The majority of the deferred tax expense arises due to the tax depreciation and revaluation of US investment properties.
note 6. other expenses
Consolidated Parent Entity
Note(s)2007
$’0002006$’000
2007$’000
2006$’000
Audit and advisory fees 7 3,025 2,672 600 586Custodian fees 515 518 172 165Legal and other professional fees 448 415 1 –Bad and doubtful debts 2,083 1,654 644 95Registry costs and listing fees 443 377 142 47Other expenses 4,074 3,193 21 630
Total other expenses 10,588 8,829 1,580 1,523
note 7. audit and advisory feesDuring the year the auditor of the parent entity, its related practices and non-related audit firms earned the following remuneration:
(a) assurance services
Audit Services
Consolidated Parent Entity
2007$
2006$
2007$
2006$
PwC audit and review of financial reports and other audit work under the Corporations Act 2001 1,111,630 1,299,465 426,183 457,000PwC fees paid in relation to outgoings audit 194,627 72,155 38,250 –Fees paid to non-PwC audit firms 691,626 597,323 22,941 –
Total remuneration for assurance services 1,997,883 1,968,943 487,374 457,000
(b) taxation services
Consolidated Parent Entity
2007$
2006$
2007$
2006$
Fees paid to PwC Australia 318,843 370,690 112,307 126,000Fees paid to PwC US 443,588 213,160 – –Fees paid to non-PwC audit firms 263,815 109,975 –
Total remuneration for taxation services1 1,026,246 693,825 112,307 126,000
1 These services include general compliance work, one off project work and advice with respect to the management of day to day tax affairs of the Trusts.
www.global-reports.com

90 DB RREEF Trust Financial Reports 2007
note 7. audit and advisory fees (continued)
(c) advisory services
Consolidated Parent Entity
2007$
2006$
2007$
2006$
Fees paid to PwC Australia in relation to IFRS project – 8,950 – 3,000
Total remuneration for advisory services – 8,950 – 3,000
Total remuneration for assurance, taxation and advisory services 3,024,129 2,671,718 599,681 586,000
note 8. current assets – cash and cash equivalents
Consolidated Parent Entity
2007$’000
2006$’000
2007$’000
2006$’000
Cash at bank1 59,603 106,428 9,096 15,743
Total current assets – cash and cash equivalents 59,603 106,428 9,096 15,743
1 Consolidated cash at bank at 30 June 2006 includes $28,933,000 held for the purchase of DIT France Logistique SAS.
note 9. current assets – receivables
Consolidated Parent Entity
2007$’000
2006$’000
2007$’000
2006$’000
Rent receivable 17,671 24,108 2,840 5,424Less: Provision for doubtful debts (2,232) (1,783) (681) (273)
Total rental receivables 15,439 22,325 2,159 5,151
Distribution receivable from controlled entities – – – 3,100Dividend receivable 6,500 4,750 – –Other receivables from controlled entities – – 12,559 10,778GST receivable 1,513 954 891 405Interest receivable 6 8 – –Settlement adjustments receivable – 1,367 – 1,367Other receivables 12,931 5,850 3,886 1,308
Total other receivables 20,950 12,929 17,336 16,958
Total current assets – receivables 36,389 35,254 19,495 22,109
other receivables from controlled entities
Other receivables from controlled entities are an inter-entity loan, which is a non-interest bearing loan between the Trust and its controlled entities.
note 10. current assets – inventories
Consolidated Parent Entity
2007$’000
2006$’000
2007$’000
2006$’000
Land and buildings – 3,344 – –
Total current assets – inventories – 3,344 – –
Oak Park Business Centre, Minnesota
On 23 August 2006, DB RREEF Industrial Properties, Inc. sold Oak Park Business Centre, Minnesota for $4.0 million (US$3.0 million).
notes to the financial statements (continued)
www.global-reports.com

DB RREEF Trust Financial Reports 2007 91
note 11. loans with related parties
Consolidated Parent Entity
2007$’000
2006$’000
2007$’000
2006$’000
Current liabilities – loans with related partiesNon-interest bearing loans with the Trusts1 – – 34,332 34,332
Total current liabilities – loans with related parties – – 34,332 34,332
1 Non-interest bearing loans with the Trusts were created to effect the stapling of the Trust, DIT, DOT and DRO. These loan balances eliminate on consolidation.
note 12. derivative financial instruments
Consolidated Parent Entity
2007$’000
2006$’000
2007$’000
2006$’000
Current assetsInterest rate swap contracts 136,160 89,366 28,961 24,498Forward foreign exchange contracts 9,265 3,112 4,163 1,556
Total current assets – derivative financial instruments 145,425 92,478 33,124 26,054
Current liabilitiesInterest rate swap contracts 21,196 19,979 7,861 8,870Forward foreign exchange contracts 137 498 – 182
Total current liabilities – derivative financial instruments 21,333 20,477 7,861 9,052
Net current derivative financial instruments 124,092 72,001 25,263 17,002
Refer note 32 for further discussion regarding derivative financial instruments.
note 13. current assets – other financial assets
Consolidated Parent Entity
2007$’000
2006$’000
2007$’000
2006$’000
Loan notes receivable from DB RREEF Holdings Pty Limited 51,936 45,092 – –
Total current assets – other financial assets 51,936 45,092 – –
On 27 September 2004, DB RREEF Holdings Pty Limited (DRH) issued an equal amount of loan notes to its two owners – First Australian Property Group Holdings Pty Limited (FAP) and DRO, in order to fund its 100 percent acquisition of DB RREEF Funds Management Limited (the Responsible Entity of DRO). On 31 October 2006, DRH issued further loan notes of equal amounts to its two owners to fund the acquisition of DB RREEF Wholesale Property Limited (the Responsible Entity of DB RREEF Wholesale Property Fund). These loan notes pay a coupon of 11 percent per annum, mature on 1 October 2024 and may be redeemed at any time prior to maturity. It is not currently the intention of either the issuer or the holder to redeem the notes.
note 14. current assets – other
Consolidated Parent Entity
2007$’000
2006$’000
2007$’000
2006$’000
Prepayments 9,651 6,030 2,439 1,227Tenant bonds 13 20 – –
Total current assets – other 9,664 6,050 2,439 1,227
www.global-reports.com

92 DB RREEF Trust Financial Reports 2007
note 15 (a). current assets – held for sale investment properties
Property Ownership(%)
Acquisition date
121 Evans Road, Salisbury QLD 100 Jun 1997
Total held for sale investment properties
note 15 (b). non-current assets – investment properties
Property Ownership(%)
Acquisition date
Held by parent entity
Kings Park Industrial Estate, Bowmans Road, Marayong NSW 100 May 1990
Target Distribution Centre, Lot 1 Taras Avenue, Altona North VIC 100 Oct 1995
Axxess Corporate Park, 164–180 Foster Road, 11 & 21–45 Gilby Road 307–355 Ferntree Gully Road, Mount Waverley VIC
100 Oct 1996
Knoxfield Industrial Estate, 20 Henderson Road, Knoxfield VIC 100 Aug 1996
12 Frederick Street, St Leonards NSW 100 Jul 2000
40 Talavera Road, North Ryde NSW 100 Oct 2002
2 Alspec Place, Eastern Creek NSW 100 Mar 2004
Redwood Gardens Industrial Estate Stages 3,5,6 & 7 and Lot 4, Dingley VIC 1 76 Dec 1994
44 Market Street, Sydney NSW 100 Sep 1987
8 Nicholson Street, Melbourne VIC 100 Nov 1993
Ferguson Centre, 130 George Street, Parramatta NSW 100 May 1997
Flinders Gate Complex, 172 Flinders Street and 189 Flinders Lane, Melbourne VIC 100 Mar 1999
383–395 Kent Street, Sydney NSW 100 Sep 1987
14 Moore Street, Canberra ACT** 100 May 2002
Sydney CBD Floor Space2 100 Jul 2000
Whitford City Shopping Centre Marmion and Whitfords Avenue, Hillarys WA3 50 Oct 1984
Whitfords Avenue Lot 6 Endeavour Road, Hillarys WA3 50 Dec 1992
West Lakes Shopping Centre, West Lakes SA 50 Nov 1998
Plenty Valley Town Centre, 330–464 McDonalds Road, South Morang VIC3 50 Nov 1999
North Lakes Shopping Centre, Mango Hill QLD3 50 Aug 2004
Albert & Charlotte Streets Carpark, Brisbane QLD 100 Oct 1984
34–60 Little Collins Street, Melbourne VIC** 100 Nov 1984
32–44 Flinders Street, Melbourne VIC 100 Jun 1998
Flinders Gate Carpark, 172–189 Flinders Street, Melbourne VIC 100 Mar 1999
383–395 Kent Street, Sydney NSW 100 Sep 1987
John Martin’s Carpark and Retail Plaza Joint Venture 1 Sep 1994
Total parent entity
1 The valuation reflects 76 percent of the independent valuation, as 24 percent of the property was disposed.2 This relates to heritage floor space retained following the disposal of 1 Chifley Square, Sydney NSW.3 The valuation reflects 50 percent of the independent valuation amount.
The title to all properties is freehold, with the exception of the properties marked ** which are leasehold.
notes to the financial statements (continued)
www.global-reports.com

DB RREEF Trust Financial Reports 2007 93
Cost including all additions($’000)
Independent valuation date
Independent valuation amount
($’000)
Independent valuer Consolidated book value
30 June 2007($’000)
Consolidated book value
30 June 2006($’000)
n/a n/a n/a n/a – 24,000
– – – 24,000
Cost including all additions($’000)
Independent valuation date
Independent valuation amount
($’000)
Independent valuer Consolidated book value
30 June 2007($’000)
Consolidated book value
30 June 2006($’000)
79,432 Jun 2006 93,000 (f) 101,000 93,000
25,442 Jun 2005 35,000 (c) 36,512 36,500
156,675 Dec 2005 147,750 (f) 184,000 170,000
30,188 Jun 2006 37,050 (f) 37,098 37,050
25,575 Jun 2007 38,000 (f) 38,000 35,700
33,326 Dec 2006 31,200 (d) 33,800 32,500
23,567 Dec 2006 26,000 (a) 26,010 23,555
23,678 Jun 2006 28,850 (e) 29,950 28,850
172,185 Jun 2006 185,000 (f) 220,000 185,000
69,421 Jun 2005 91,800 (g) 98,000 98,000
99,562 Jun 2006 80,000 (d) 93,059 80,000
14,014 Jun 2006 18,000 (d) 18,265 18,000
105,791 Jun 2006 115,000 (d) 131,378 115,000
37,391 Apr 2005 36,250 (e) 45,000 38,000
– n/a – n/a 2,173 2,173
129,613 Jun 2007 252,350 (d) 252,350 221,500
5,506 Jun 2007 24,650 (d) 24,650 11,000
119,088 Jun 2007 174,000 (c) 174,000 143,000
38,138 Jun 2007 66,750 (c) 66,750 20,200
121,467 Jun 2007 164,500 (c) 164,500 77,176
14,636 Jun 2006 38,500 (e) 39,354 38,500
16,164 Jun 2006 37,500 (d) 39,500 37,500
21,319 Jun 2006 32,500 (d) 32,585 32,500
47,043 Jun 2006 39,000 (d) 39,000 39,000
30,257 Jun 2006 60,000 (d) 60,000 60,000
– – – – 100 100
1,439,478 1,852,650 1,987,034 1,673,804
www.global-reports.com
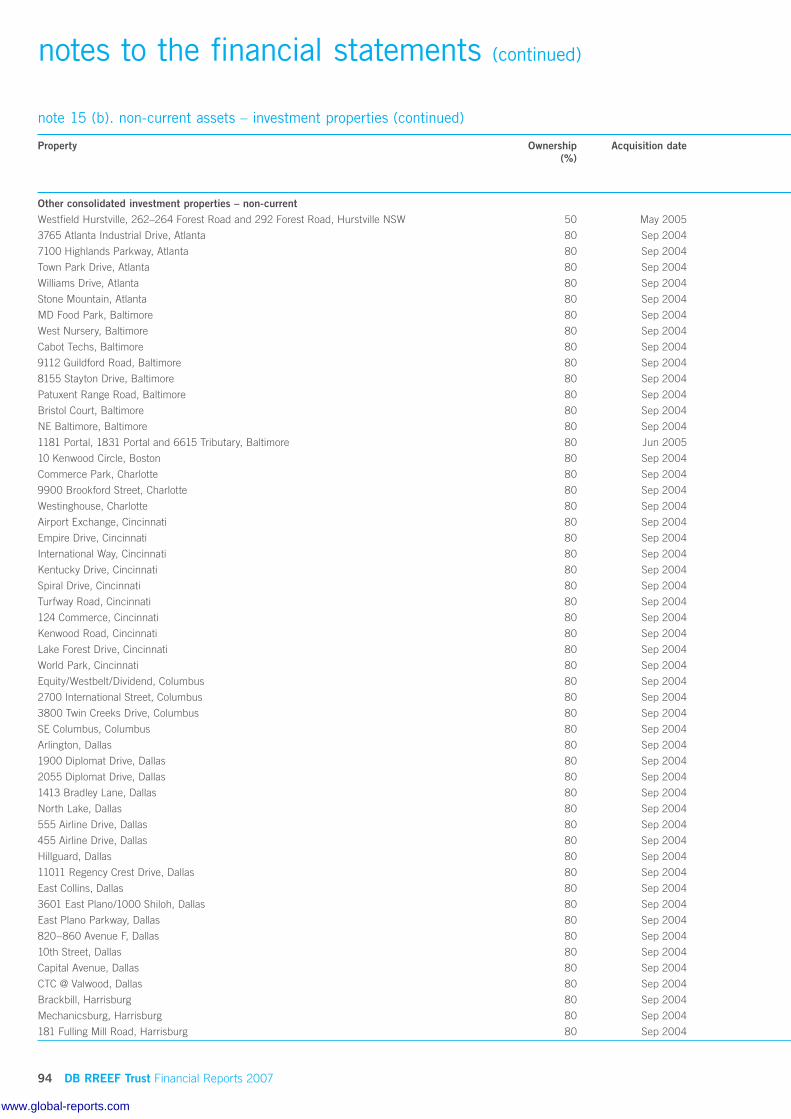
94 DB RREEF Trust Financial Reports 2007
note 15 (b). non-current assets – investment properties (continued)
Property Ownership(%)
Acquisition date
Other consolidated investment properties – non-currentWestfield Hurstville, 262–264 Forest Road and 292 Forest Road, Hurstville NSW 50 May 2005
3765 Atlanta Industrial Drive, Atlanta 80 Sep 2004
7100 Highlands Parkway, Atlanta 80 Sep 2004
Town Park Drive, Atlanta 80 Sep 2004
Williams Drive, Atlanta 80 Sep 2004
Stone Mountain, Atlanta 80 Sep 2004
MD Food Park, Baltimore 80 Sep 2004
West Nursery, Baltimore 80 Sep 2004
Cabot Techs, Baltimore 80 Sep 2004
9112 Guildford Road, Baltimore 80 Sep 2004
8155 Stayton Drive, Baltimore 80 Sep 2004
Patuxent Range Road, Baltimore 80 Sep 2004
Bristol Court, Baltimore 80 Sep 2004
NE Baltimore, Baltimore 80 Sep 2004
1181 Portal, 1831 Portal and 6615 Tributary, Baltimore 80 Jun 2005
10 Kenwood Circle, Boston 80 Sep 2004
Commerce Park, Charlotte 80 Sep 2004
9900 Brookford Street, Charlotte 80 Sep 2004
Westinghouse, Charlotte 80 Sep 2004
Airport Exchange, Cincinnati 80 Sep 2004
Empire Drive, Cincinnati 80 Sep 2004
International Way, Cincinnati 80 Sep 2004
Kentucky Drive, Cincinnati 80 Sep 2004
Spiral Drive, Cincinnati 80 Sep 2004
Turfway Road, Cincinnati 80 Sep 2004
124 Commerce, Cincinnati 80 Sep 2004
Kenwood Road, Cincinnati 80 Sep 2004
Lake Forest Drive, Cincinnati 80 Sep 2004
World Park, Cincinnati 80 Sep 2004
Equity/Westbelt/Dividend, Columbus 80 Sep 2004
2700 International Street, Columbus 80 Sep 2004
3800 Twin Creeks Drive, Columbus 80 Sep 2004
SE Columbus, Columbus 80 Sep 2004
Arlington, Dallas 80 Sep 2004
1900 Diplomat Drive, Dallas 80 Sep 2004
2055 Diplomat Drive, Dallas 80 Sep 2004
1413 Bradley Lane, Dallas 80 Sep 2004
North Lake, Dallas 80 Sep 2004
555 Airline Drive, Dallas 80 Sep 2004
455 Airline Drive, Dallas 80 Sep 2004
Hillguard, Dallas 80 Sep 2004
11011 Regency Crest Drive, Dallas 80 Sep 2004
East Collins, Dallas 80 Sep 2004
3601 East Plano/1000 Shiloh, Dallas 80 Sep 2004
East Plano Parkway, Dallas 80 Sep 2004
820–860 Avenue F, Dallas 80 Sep 2004
10th Street, Dallas 80 Sep 2004
Capital Avenue, Dallas 80 Sep 2004
CTC @ Valwood, Dallas 80 Sep 2004
Brackbill, Harrisburg 80 Sep 2004
Mechanicsburg, Harrisburg 80 Sep 2004
181 Fulling Mill Road, Harrisburg 80 Sep 2004
notes to the financial statements (continued)
www.global-reports.com

DB RREEF Trust Financial Reports 2007 95
Cost including all additions($’000)
Independent valuation date
Independent valuation amount
($’000)
Independent valuer Consolidated book value
30 June 2007($’000)
Consolidated book value
30 June 2006($’000)
247,092 Jun 2007 307,500 (d) 307,500 260,000
6,058 Jun 2007 5,302 (c) 5,302 4,978
16,523 Jun 2007 18,735 (c) 18,735 18,835
7,777 Jun 2007 10,015 (c) 10,015 10,628
11,731 Jun 2007 13,904 (c) 13,904 13,302
8,586 Jun 2007 7,305 (c) 7,305 6,592
21,945 Jun 2007 28,514 (c) 31,187 33,798
9,279 Jun 2007 10,015 (c) 10,015 11,570
24,550 Jun 2007 32,874 (c) 32,874 37,401
9,599 Jun 2007 12,608 (c) 12,608 13,454
8,190 Jun 2007 9,780 (c) 9,780 10,628
13,913 Jun 2007 15,789 (c) 15,789 17,355
12,251 Jun 2007 13,197 (c) 13,197 15,945
8,768 Jun 2007 10,487 (c) 10,487 11,301
12,374 Jun 2007 13,786 (i) 13,786 15,355
12,670 Jun 2007 14,139 (c) 14,774 14,933
8,593 Jun 2007 10,251 (c) 10,251 9,754
4,462 Jun 2007 5,302 (c) 5,302 5,045
23,445 Jun 2007 27,218 (c) 28,541 26,267
4,574 Jun 2007 4,566 (c) 4,566 4,978
6,522 Jun 2007 7,070 (c) 7,070 8,486
12,188 Jun 2007 13,668 (c) 13,668 14,463
13,109 Jun 2007 15,612 (c) 15,612 16,279
7,021 Jun 2007 6,716 (c) 6,716 6,054
6,014 Jun 2007 6,245 (c) 6,245 6,390
2,666 Jun 2007 3,181 (c) 3,181 3,363
21,457 Jun 2007 22,387 (c) 22,387 22,723
14,161 Jun 2007 16,025 (c) 16,025 16,548
14,976 Jun 2007 15,435 (c) 15,435 15,337
43,256 Jun 2007 48,780 (c) 48,780 50,081
5,259 Jun 2007 4,961 (c) 4,961 5,281
5,430 Jun 2007 5,950 (c) 5,950 6,794
15,355 Jun 2007 14,139 (c) 14,139 16,279
10,353 Jun 2007 10,840 (c) 10,840 12,243
5,336 Jun 2007 5,420 (c) 5,420 6,189
4,250 Jun 2007 4,507 (c) 4,507 4,843
3,645 Jun 2007 3,535 (c) 3,535 3,807
11,353 Jun 2007 15,671 (c) 15,671 17,355
7,654 Jun 2007 8,012 (c) 8,012 9,296
3,660 Jun 2007 4,595 (c) 4,595 5,112
10,215 Jun 2007 10,958 (c) 10,958 12,088
8,409 Jun 2007 8,955 (c) 8,955 9,046
4,225 Jun 2007 4,419 (c) 4,419 4,978
14,732 Jun 2007 17,262 (c) 18,282 20,030
24,731 Jun 2007 27,807 (c) 27,807 28,387
7,877 Jun 2007 7,729 (c) 7,729 9,687
10,871 Jun 2007 11,253 (c) 11,841 13,304
7,025 Jun 2007 7,859 (c) 7,859 7,601
3,989 Jun 2007 5,184 (c) 5,184 6,054
24,762 Jun 2007 28,632 (c) 28,632 33,634
21,178 Jun 2007 23,801 (c) 23,801 25,696
10,562 Jun 2007 11,311 (c) 11,311 12,108
www.global-reports.com
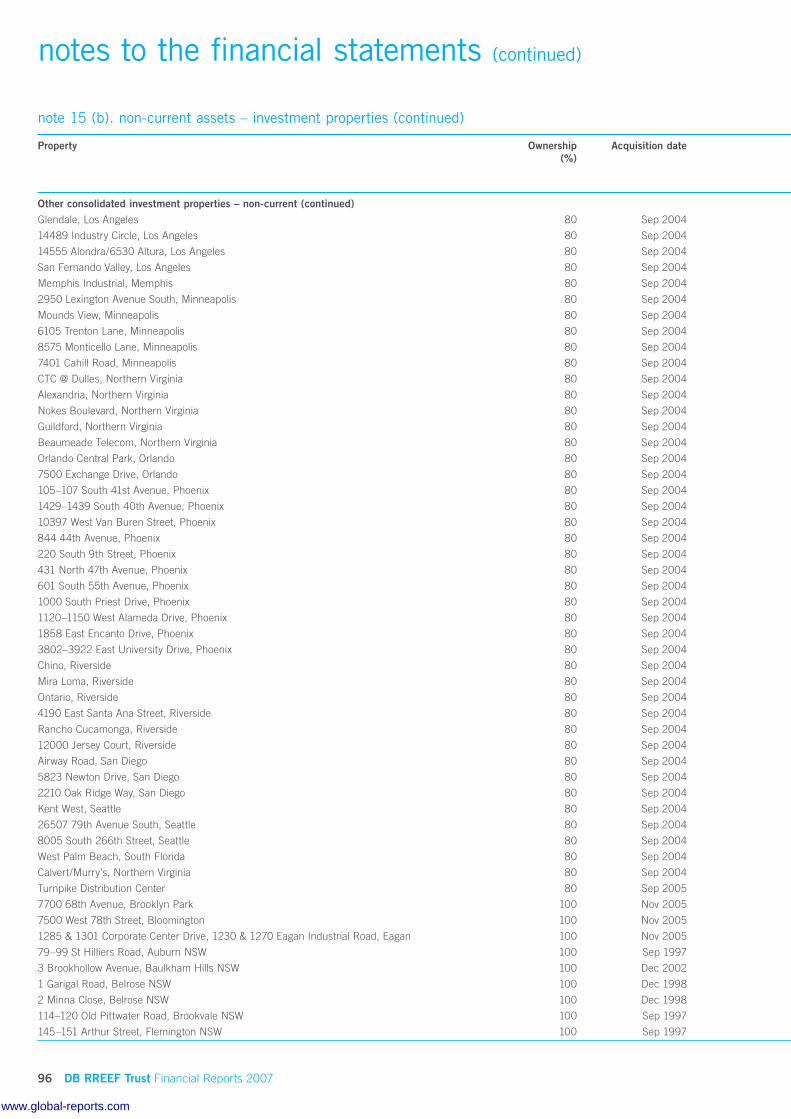
96 DB RREEF Trust Financial Reports 2007
note 15 (b). non-current assets – investment properties (continued)
Property Ownership(%)
Acquisition date
Other consolidated investment properties – non-current (continued)Glendale, Los Angeles 80 Sep 2004
14489 Industry Circle, Los Angeles 80 Sep 2004
14555 Alondra/6530 Altura, Los Angeles 80 Sep 2004
San Fernando Valley, Los Angeles 80 Sep 2004
Memphis Industrial, Memphis 80 Sep 2004
2950 Lexington Avenue South, Minneapolis 80 Sep 2004
Mounds View, Minneapolis 80 Sep 2004
6105 Trenton Lane, Minneapolis 80 Sep 2004
8575 Monticello Lane, Minneapolis 80 Sep 2004
7401 Cahill Road, Minneapolis 80 Sep 2004
CTC @ Dulles, Northern Virginia 80 Sep 2004
Alexandria, Northern Virginia 80 Sep 2004
Nokes Boulevard, Northern Virginia 80 Sep 2004
Guildford, Northern Virginia 80 Sep 2004
Beaumeade Telecom, Northern Virginia 80 Sep 2004
Orlando Central Park, Orlando 80 Sep 2004
7500 Exchange Drive, Orlando 80 Sep 2004
105–107 South 41st Avenue, Phoenix 80 Sep 2004
1429–1439 South 40th Avenue, Phoenix 80 Sep 2004
10397 West Van Buren Street, Phoenix 80 Sep 2004
844 44th Avenue, Phoenix 80 Sep 2004
220 South 9th Street, Phoenix 80 Sep 2004
431 North 47th Avenue, Phoenix 80 Sep 2004
601 South 55th Avenue, Phoenix 80 Sep 2004
1000 South Priest Drive, Phoenix 80 Sep 2004
1120–1150 West Alameda Drive, Phoenix 80 Sep 2004
1858 East Encanto Drive, Phoenix 80 Sep 2004
3802–3922 East University Drive, Phoenix 80 Sep 2004
Chino, Riverside 80 Sep 2004
Mira Loma, Riverside 80 Sep 2004
Ontario, Riverside 80 Sep 2004
4190 East Santa Ana Street, Riverside 80 Sep 2004
Rancho Cucamonga, Riverside 80 Sep 2004
12000 Jersey Court, Riverside 80 Sep 2004
Airway Road, San Diego 80 Sep 2004
5823 Newton Drive, San Diego 80 Sep 2004
2210 Oak Ridge Way, San Diego 80 Sep 2004
Kent West, Seattle 80 Sep 2004
26507 79th Avenue South, Seattle 80 Sep 2004
8005 South 266th Street, Seattle 80 Sep 2004
West Palm Beach, South Florida 80 Sep 2004
Calvert/Murry’s, Northern Virginia 80 Sep 2004
Turnpike Distribution Center 80 Sep 2005
7700 68th Avenue, Brooklyn Park 100 Nov 2005
7500 West 78th Street, Bloomington 100 Nov 2005
1285 & 1301 Corporate Center Drive, 1230 & 1270 Eagan Industrial Road, Eagan 100 Nov 2005
79–99 St Hilliers Road, Auburn NSW 100 Sep 1997
3 Brookhollow Avenue, Baulkham Hills NSW 100 Dec 2002
1 Garigal Road, Belrose NSW 100 Dec 1998
2 Minna Close, Belrose NSW 100 Dec 1998
114–120 Old Pittwater Road, Brookvale NSW 100 Sep 1997
145–151 Arthur Street, Flemington NSW 100 Sep 1997
notes to the financial statements (continued)
www.global-reports.com
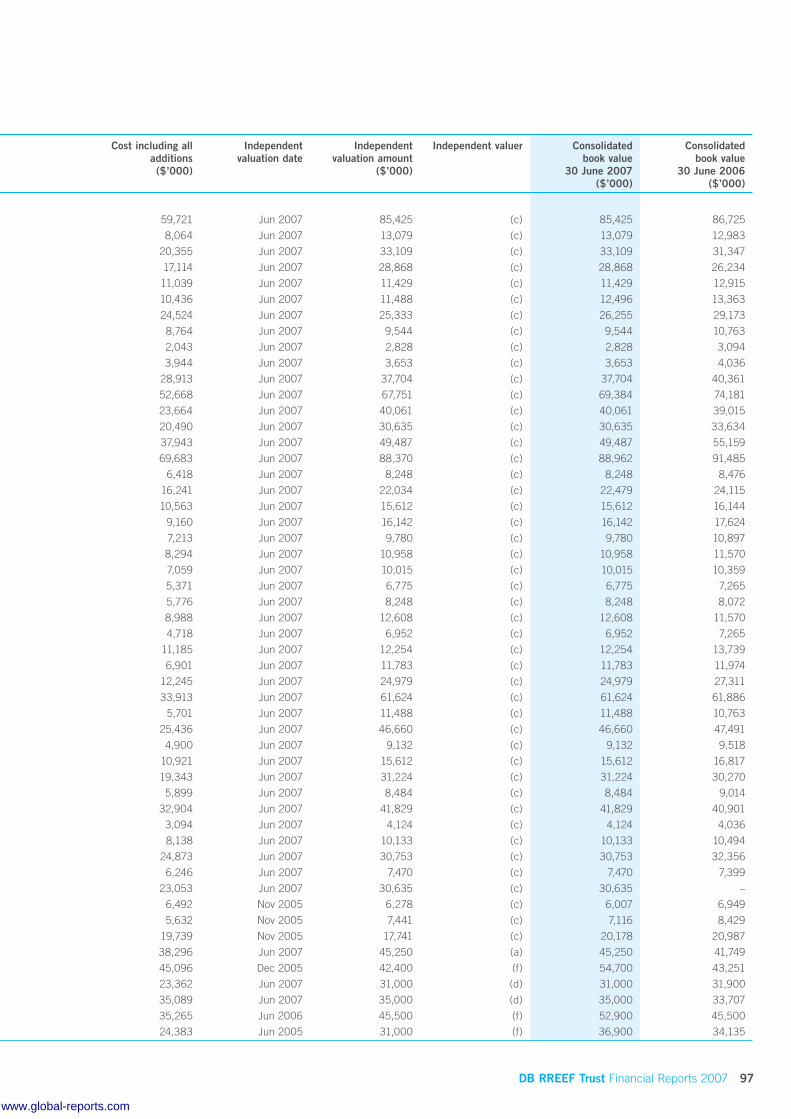
DB RREEF Trust Financial Reports 2007 97
Cost including all additions($’000)
Independent valuation date
Independent valuation amount
($’000)
Independent valuer Consolidated book value
30 June 2007($’000)
Consolidated book value
30 June 2006($’000)
59,721 Jun 2007 85,425 (c) 85,425 86,725
8,064 Jun 2007 13,079 (c) 13,079 12,983
20,355 Jun 2007 33,109 (c) 33,109 31,347
17,114 Jun 2007 28,868 (c) 28,868 26,234
11,039 Jun 2007 11,429 (c) 11,429 12,915
10,436 Jun 2007 11,488 (c) 12,496 13,363
24,524 Jun 2007 25,333 (c) 26,255 29,173
8,764 Jun 2007 9,544 (c) 9,544 10,763
2,043 Jun 2007 2,828 (c) 2,828 3,094
3,944 Jun 2007 3,653 (c) 3,653 4,036
28,913 Jun 2007 37,704 (c) 37,704 40,361
52,668 Jun 2007 67,751 (c) 69,384 74,181
23,664 Jun 2007 40,061 (c) 40,061 39,015
20,490 Jun 2007 30,635 (c) 30,635 33,634
37,943 Jun 2007 49,487 (c) 49,487 55,159
69,683 Jun 2007 88,370 (c) 88,962 91,485
6,418 Jun 2007 8,248 (c) 8,248 8,476
16,241 Jun 2007 22,034 (c) 22,479 24,115
10,563 Jun 2007 15,612 (c) 15,612 16,144
9,160 Jun 2007 16,142 (c) 16,142 17,624
7,213 Jun 2007 9,780 (c) 9,780 10,897
8,294 Jun 2007 10,958 (c) 10,958 11,570
7,059 Jun 2007 10,015 (c) 10,015 10,359
5,371 Jun 2007 6,775 (c) 6,775 7,265
5,776 Jun 2007 8,248 (c) 8,248 8,072
8,988 Jun 2007 12,608 (c) 12,608 11,570
4,718 Jun 2007 6,952 (c) 6,952 7,265
11,185 Jun 2007 12,254 (c) 12,254 13,739
6,901 Jun 2007 11,783 (c) 11,783 11,974
12,245 Jun 2007 24,979 (c) 24,979 27,311
33,913 Jun 2007 61,624 (c) 61,624 61,886
5,701 Jun 2007 11,488 (c) 11,488 10,763
25,436 Jun 2007 46,660 (c) 46,660 47,491
4,900 Jun 2007 9,132 (c) 9,132 9,518
10,921 Jun 2007 15,612 (c) 15,612 16,817
19,343 Jun 2007 31,224 (c) 31,224 30,270
5,899 Jun 2007 8,484 (c) 8,484 9,014
32,904 Jun 2007 41,829 (c) 41,829 40,901
3,094 Jun 2007 4,124 (c) 4,124 4,036
8,138 Jun 2007 10,133 (c) 10,133 10,494
24,873 Jun 2007 30,753 (c) 30,753 32,356
6,246 Jun 2007 7,470 (c) 7,470 7,399
23,053 Jun 2007 30,635 (c) 30,635 –
6,492 Nov 2005 6,278 (c) 6,007 6,949
5,632 Nov 2005 7,441 (c) 7,116 8,429
19,739 Nov 2005 17,741 (c) 20,178 20,987
38,296 Jun 2007 45,250 (a) 45,250 41,749
45,096 Dec 2005 42,400 (f) 54,700 43,251
23,362 Jun 2007 31,000 (d) 31,000 31,900
35,089 Jun 2007 35,000 (d) 35,000 33,707
35,265 Jun 2006 45,500 (f) 52,900 45,500
24,383 Jun 2005 31,000 (f) 36,900 34,135
www.global-reports.com

98 DB RREEF Trust Financial Reports 2007
note 15 (b). non-current assets – investment properties (continued)
Property Ownership(%)
Acquisition date
Other consolidated investment properties – non-current (continued)436–484 Victoria Road, Gladesville NSW 100 Sep 1997
1/ Foundation Place, Greystanes NSW 100 Dec 2002
706 Mowbray Road, Lane Cove NSW 100 Sep 1997
5–13 Rosebery Avenue & 1–55 Rothschild Avenue, Rosebery NSW 100 Apr 1998 + Oct 2001
10–16 South Street, Rydalmere NSW 100 Sep 1997
19 Chifley Street, Smithfield NSW 100 Dec 1998
Pound Road West, Dandenong VIC 100 Jan 2004
352 Macaulay Road, Kensington VIC 100 Oct 1998
DB RREEF Industrial Estate, Boundary Road, Laverton North VIC 100 Jul 2002
250 Forest Road, South Lara VIC 100 Dec 2002
15–23 Whicker Road, Gillman SA 100 Dec 2002
25 Donkin Street South, Brisbane QLD 100 Dec 1998
52 Holbeche Road, Arndell Park NSW 100 Jul 1998
3–7 Bessemer Street, Blacktown NSW 100 Jun 1997
30–32 Bessemer Street, Blacktown NSW 100 May 1997
27–29 Liberty Road, Huntingwood NSW 100 Jul 1998
154 O’Riordan Street, Mascot NSW 100 Jun 1997
11 Talavera Road, North Ryde NSW 100 Jun 2002
DB RREEF Industrial Estate, Egerton Street, Silverwater NSW 100 May 1997
239–251 Woodpark Road, Smithfield NSW 100 May 1997
40 Biloela Street, Villawood NSW 100 Jul 1997
27–33 Frank Street, Wetherill Park NSW 100 Jul 1998
114 Fairbank Road, Clayton VIC 100 Jul 1997
30 Bellrick Street, Acacia Ridge QLD 100 Jun 1997
68 Hasler Road, Herdsman WA 100 Jul 1998
Zone industrielle Epône II, Epône 100 Jul 2006
19 rue de Bretagne, Saint-Quentin Fallavier 100 Jul 2006
21 rue du Chemin Blanc, Champlan 100 Jul 2006
32 avenue de l’Océanie, Villejust 100 Jul 2006
RN 19 ZAC de L’Ormes Rond, Servon (1) 100 Jul 2006
RN 19 ZAC de L’Ormes Rond, Servon (2) 100 Jul 2006
Im Holderbusch 3, Industriestraße, Sulmstraße, Ellhofen-Weinsberg 100 Dec 2006
Schillerstraße 51, Ellhofen 100 Dec 2006
Schillerstraße 42, 42a & Bahnhofstraße 44, 50, Ellhofen 100 Dec 2006
Im Gewerbegebiet 18, Friedewald 100 Dec 2006
Im Steinbruch 4, 6, Knetzgau 100 Dec 2006
Carl-Leverkus-Straße 3–5 & Winkelsweg 182–184, Langenfeld 100 Dec 2006
Schneiderstraße 82, Langenfeld 3 100 Dec 2006
Über der Dingelstelle, Langenweddingen 100 Dec 2006
Nordstraße 1, Löbau 100 Dec 2006
Former Straße 6, Unna 100 Dec 2006
Niedesheimer Straße 24, Worms 100 Dec 2006
Liverpooler/Kopenhagener/Osloer Straße, Duisburg 100 Dec 2006
Bremer Ring, Hansestraße, Berlin-Wustermark 100 Dec 2006
Theodorstraße, Düsseldorf 100 Dec 2006
Orange Street, Orlando FL 100 Jun 2007
Governor Phillip Tower & Governor Macquarie Tower Office Complex, 1 Farrer Place, Sydney NSW 50 Dec 1998
45 Clarence Street, Sydney NSW 100 Dec 1998
309–321 Kent Street, Sydney NSW 50 Dec 1998
1 Margaret Street, Sydney NSW 100 Dec 1998
Victoria Cross, 60 Miller Street, North Sydney NSW 100 Dec 1998
Zenith Centre, 821–843 Pacific Highway, Chatswood NSW 50 Dec 1998
notes to the financial statements (continued)
www.global-reports.com

DB RREEF Trust Financial Reports 2007 99
Cost including all additions($’000)
Independent valuation date
Independent valuation amount
($’000)
Independent valuer Consolidated book value
30 June 2007($’000)
Consolidated book value
30 June 2006($’000)
28,861 Jun 2007 53,000 (e) 53,000 48,500
39,216 Jun 2006 46,000 (e) 48,055 46,000
– n/a – n/a – 26,200
73,831 Dec 2005 92,800 (f) 98,438 93,158
36,601 Dec 2006 47,000 (f) 47,425 44,682
12,072 Dec 2005 17,200 (a) 18,500 17,499
60,968 Jun 2005 56,250 (c) 74,000 58,000
7,616 Dec 2005 8,900 (g) 9,300 8,900
22,614 Jun 2004 23,700 (c) 26,900 17,500
33,757 Jun 2005 34,600 (e) 43,700 40,900
19,783 Dec 2006 25,500 (d) 25,500 24,600
19,345 Jun 2005 20,700 (e) 28,000 23,614
11,335 Dec 2005 12,500 (d) 14,000 12,500
11,139 Sep 2006 10,250 (d) 10,800 10,209
11,946 Jun 2006 17,850 (f) 19,000 17,850
8,199 Jun 2006 9,000 (e) 9,228 9,000
11,038 Dec 2006 16,000 (a) 16,065 14,600
134,359 Jun 2006 145,500 (d) 152,000 145,500
36,600 Dec 2005 42,000 (f) 47,583 43,900
5,102 Jun 2006 6,450 (f) 7,100 6,450
6,849 Jun 2006 8,750 (a) 8,797 8,750
– n/a – n/a – 13,200
11,140 Jun 2006 12,800 (c) 12,800 12,800
13,166 Dec 2005 17,375 (e) 20,650 18,700
9,722 Dec 2006 9,750 (f) 10,800 9,500
12,157 Jun 2007 12,629 (h) 12,629 –
21,954 Jun 2007 19,315 (h) 19,343 –
21,775 Jun 2007 15,845 (h) 15,845 –
16,929 Jun 2007 14,498 (h) 15,160 –
30,602 Jun 2007 33,038 (h) 33,038 –
10,499 Jun 2007 10,918 (h) 10,917 –
25,319 Dec 2006 23,942 (d) 25,319 –
20,972 Dec 2006 19,839 (d) 20,972 –
13,168 Dec 2006 12,455 (d) 13,168 –
8,492 Dec 2006 8,034 (d) 8,492 –
16,654 Dec 2006 15,750 (d) 16,654 –
16,675 Dec 2006 15,639 (d) 16,675 –
9,564 Dec 2006 9,048 (d) 9,564 –
12,112 Dec 2006 11,456 (d) 12,112 –
2,045 Dec 2006 1,933 (d) 2,045 –
27,708 Dec 2006 26,208 (d) 27,708 –
6,582 Dec 2006 6,227 (d) 6,582 –
32,840 Dec 2006 30,803 (d) 32,840 –
17,747 Dec 2006 16,780 (d) 17,747 –
27,152 Dec 2006 25,828 (d) 27,152 –
29,867 n/a – n/a 29,867 –
482,256 Dec 2006 638,750 (f) 646,710 575,000
222,878 Jun 2007 265,000 (e) 265,000 228,000
169,336 Dec 2006 183,500 (a) 194,000 165,000
142,650 Jun 2005 139,000 (c) 181,000 152,000
90,951 Dec 2005 90,000 (f) 103,101 95,000
98,506 Jun 2007 130,000 (a) 130,000 217,000
www.global-reports.com

100 DB RREEF Trust Financial Reports 2007
note 15 (b). non-current assets – investment properties (continued)
Property Ownership(%)
Acquisition date
Other consolidated investment properties – non-current (continued)Woodside Plaza, 240 St George’s Terrace, Perth WA 100 Jan 2001
30 The Bond, 30–34 Hickson Road, Sydney NSW 100 May 2002
Southgate Complex, 3 Southgate Avenue, Southgate VIC 100 Aug 2000
O’Connell House, 15–19 Bent Street, Sydney NSW 100 Aug 2000
201–217 Elizabeth Street, Sydney NSW 50 Aug 2000
Garema Court, 140–180 City Walk, Civic ACT** 100 Aug 2000
Australia Square Complex, 264–278 George Street, Sydney NSW 50 Aug 2000
Lumley Centre, 88 Shortland Street, Auckland, New Zealand1 100 Sep 2005
Total other consolidated investment properties – non-current
Total investment properties – non-current
1 The property was internally valued at NZ$145,000,000 at 30 June 2007. This valuation has been translated into Australian dollars at the spot rate on 30 June 2007.
The title to all properties is freehold, with the exception of the properties marked ** which are leasehold.
(a) Colliers International
(b) Landmark White
(c) CB Richard Ellis
(d) Jones Lang LaSalle
(e) Knight Frank Valuations
(f) FPD Savills
(g) M3 Property
(h) Catella
(i) Weiser Realty Advisors
The basis of valuation of investment properties is fair value, being the amounts for which the assets could be exchanged between knowledgeable willing parties in an arm’s length transaction, based on current prices in an active market for similar properties in the same location and condition and subject to similar leases. Properties independently valued in the last 12 months were based on independent assessments by a member of the Australian Property Institute, the New Zealand Institute of Valuers, the Appraisal Institute in the United States of America, the French Real Estate Valuation Institution or the Society of Property Researchers, Germany.
notes to the financial statements (continued)
www.global-reports.com
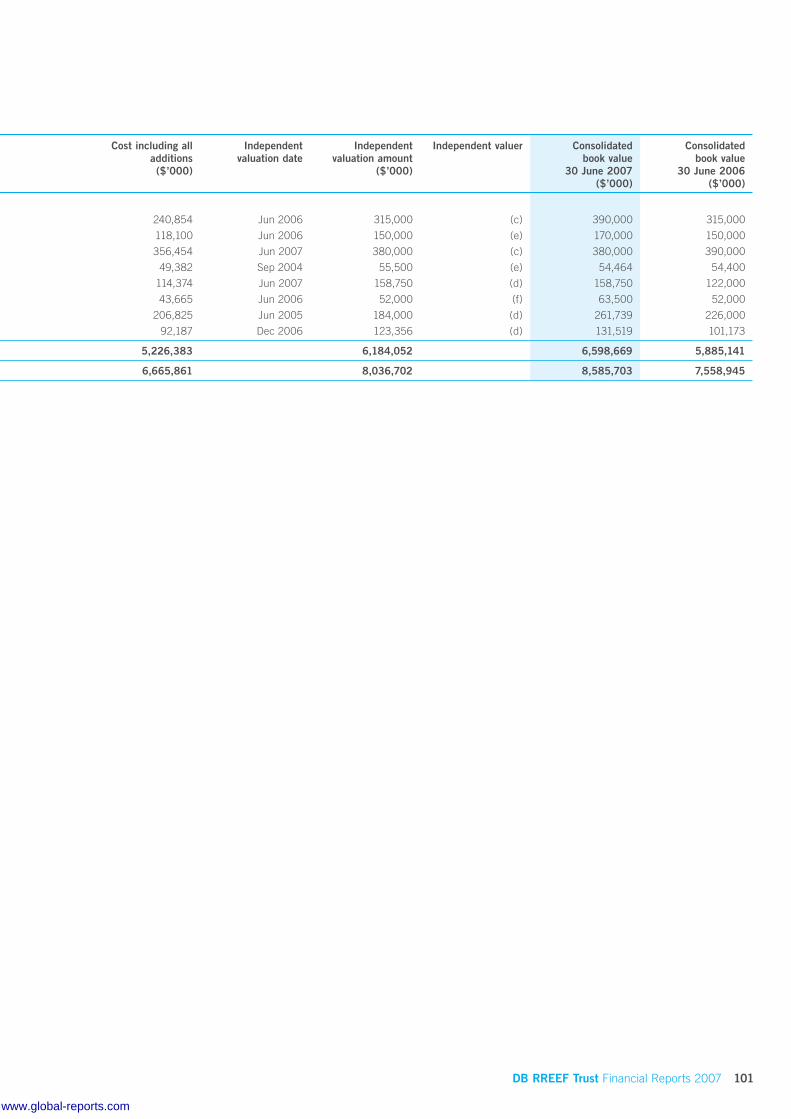
DB RREEF Trust Financial Reports 2007 101
Cost including all additions($’000)
Independent valuation date
Independent valuation amount
($’000)
Independent valuer Consolidated book value
30 June 2007($’000)
Consolidated book value
30 June 2006($’000)
240,854 Jun 2006 315,000 (c) 390,000 315,000
118,100 Jun 2006 150,000 (e) 170,000 150,000
356,454 Jun 2007 380,000 (c) 380,000 390,000
49,382 Sep 2004 55,500 (e) 54,464 54,400
114,374 Jun 2007 158,750 (d) 158,750 122,000
43,665 Jun 2006 52,000 (f) 63,500 52,000
206,825 Jun 2005 184,000 (d) 261,739 226,000
92,187 Dec 2006 123,356 (d) 131,519 101,173
5,226,383 6,184,052 6,598,669 5,885,141
6,665,861 8,036,702 8,585,703 7,558,945
www.global-reports.com

102 DB RREEF Trust Financial Reports 2007
notes to the financial statements (continued)
note 15 (c). non-current assets – investment properties (continued)
developments
105 Phillip St, Parramatta NSW
Approval has been received to construct a thirteen level office tower with approximately 19,400 square metres of floorspace at 105 Phillip Street, Parramatta, a site at the rear of the existing building at 130 George Street, Parramatta. No decision has been made to proceed with the development at this stage, however the manager is marketing the potential development to tenants.
North Lakes Shopping Centre, Mango Hill QLD
In September 2006 construction began on the expansion of North Lakes Shopping Centre with an estimated project cost of $101.3 million (50 percent share). The redevelopment of North Lakes phase 1 is scheduled to be completed by the end of November 2007 with any residual leasing to be completed within the subsequent six months. Phase 2 (Myer) is due for completion in June 2008.
Plenty Valley Town Centre, South Morang VIC
Construction began in November 2006 for the expansion of Plenty Valley Town Centre. Project costs are estimated to be $101.4 million and the project is due to complete in June 2008.
Boundary Road, North Laverton VIC
In February 2006, DIT entered into an agreement to lease and build a warehouse and distribution facility for Wrightson Seeds Australia Limited. Practical completion was achieved on 31 October 2006 with a development cost of $6.1 million.
Turnpike Distribution Center, Medley, Florida
Development of a single 268,119 square foot industrial building was completed as of May 31, 2007, and the property is currently 100 percent leased. This property has been transferred to investment properties from property plant and equipment during the year.
acquisitions
Prologis France I SAS, France
On 11 July 2006, DIT France Logistique, a wholly owned subsidiary of DIT, acquired all the shares in Prologis France I SAS. This company has investment properties with a market value of approximately $73.4 million (€42.9 million) on acquisition: Zone Industrielle Epône II, Epône; 19 rue de Bretagne, Saint-Quentin Fallavier; 21 rue du Chemin Blanc, Champlan; and 32 avenue de l’Océanie, Villejust.
Prologis France XXXII EURL, France
On 11 July 2006, DIT France Logistique, a wholly owned subsidiary of DIT, acquired all the shares in Prologis France XXXII EURL. This company has investment properties with a market value of approximately $42.7 million (€24.9 million) on acquisition: RN 19 ZAC de L’Ormes Rond, Servon (1) and RN 19 ZAC de L’Ormes Rond, Servon (2).
DB RREEF GLOG Trust, Germany
On 31 December 2006, DIT via a newly created sub-trust, DB RREEF GLOG Trust, acquired 13 properties located in Germany for $208.0 million (€125.1 million). On 29 June 2007, the final property in Düsseldorf was acquired for $25.6 million (€16.2 million). Registration of the transfer of title with the Land Registry in Germany has occurred progressively since December with the transfer of the final two properties still to occur at 30 June 2007 although DB RREEF GLOG Trust had possession and beneficial title to the properties from 31 December 2006.
DRT US Whirlpool Trust, Orlando, Florida
On 22 August 2006, DIT, DDF and DB RREEF US Properties, LLC (DRUS, and together with DIT and DDF, collectively, Investor) entered into an investor agreement (Investor Agreement) with Whirlpool Corporation (Whirlpool), the world’s largest maker of home appliances. Under this agreement, the Investor or its affiliate has committed to investing up to $489 million (US$415 million) to acquire certain facilities across the US, Canada and Europe, to be built over the next three years, and leased long-term to Whirlpool or its affiliates for the warehousing and distribution of Whirlpool finished products. Subsequently, Panattoni Development Company, LLC (Developer), and Whirlpool entered into the Development Agreement. Under this agreement, the Developer would acquire real property, develop and construct regional distribution centers (each, an RDC) and sell the completed RDC to the Investor for lease to Whirlpool pursuant to the Investor Agreement. This build-to-suit program is anticipated to comprise the development of approximately 10,000,000 square feet of 10 to 12 Class A, state-of-the-art distribution facilities in the US, Canada and Europe. The acquisition of the first facility in Orlando, Florida was completed in June 2007 with a purchase price of $28.6 million (US$24.3 million). The acquisition of the facility in Toronto, Canada is estimated to be completed in December 2007 with an estimated cost of $76.2 million (US$64.7 million). The acquisition of the additional facilities will occur following construction completion and occupancy by Whirlpool. In connection with the June acquisition of the Orlando property, DDF sold its interest in DRUS to DIT and accordingly, DDF is no longer an Investor in this program.
disposals
121 Evans Road, Salisbury QLD
In June 2006, DIT entered into an agreement for sale of 121 Evans Road, Salisbury for $24.0 million. Settlement occurred on 25 August 2006.
706 Mowbray Road, Lane Cove NSW
On 31 January 2007, DIT sold 706 Mowbray Road, Lane Cove for $29.3 million.
27–33 Frank Street, Wetherill Park NSW
On 20 June 2007, DIT sold 27–33 Frank Street, Wetherill Park for $16.0 million.
The Zenith, 821–843 Pacific Highway, Chatswood NSW
On 31 January 2007, DOT sold 50 percent of The Zenith, 821–843 Pacific Highway, Chatswood NSW for $126.2 million.
www.global-reports.com

DB RREEF Trust Financial Reports 2007 103
reconciliation
Consolidated Parent Entity
2007$’000
2006$’000
2007$’000
2006$’000
Carrying amount at 1 July 2006 7,558,945 6,520,919 1,673,804 1,398,751Additions 132,479 115,038 94,638 84,483Acquisitions 396,178 155,793 – –Transfer from property plant and equipment 30,328 – – –Transfer to held for sale investment properties – (24,000) – –Lease incentives 59,655 87,943 6,965 10,055Amortisation of lease incentives (37,702) (26,443) (6,220) (5,487)Rent straight lining 9,986 14,484 – –Disposals (165,918) (8,277) – –Net gain from fair value adjustments 831,330 695,666 217,847 186,002Foreign exchange difference on foreign currency translation (229,578) 27,822 – –
Carrying amount as at 30 June 2007 8,585,703 7,558,945 1,987,034 1,673,804
note 16. non-current assets – property plant and equipment
(a) property plant and equipment
2007
Consolidated Parent Entity
Construction in progress
$’000
Freehold land and buildings
$’000Total
$’000
Construction in progress
$’000
Freehold land and buildings
$’000Total
$’000
Opening balance as at 1 July 2006 104,190 69,278 173,468 – – –Additions 114,937 65,312 180,249 – – –Foreign exchange differences on foreign currency translation (6,880) – (6,880) – – –Depreciation charge – (2,488) (2,488) – – –Transfer to investment properties (30,328) – (30,328) – – –
Closing balance as at 30 June 2007 181,919 132,102 314,021 – – –Cost 181,919 135,613 317,532 – – –Accumulated depreciation – (3,511) (3,511) – – –
Net book value as at 30 June 2007 181,919 132,102 314,021 – – –
2006
Consolidated Parent Entity
Construction in progress
$’000
Freehold land and buildings
$’000Total
$’000
Construction in progress
$’000
Freehold land and buildings
$’000Total
$’000
Opening balance as at 1 July 2005 15,107 12,806 27,913 – – –Additions 89,083 57,495 146,578 – – –Depreciation charge – (1,023) (1,023) – – –
Closing balance as at 30 June 2006 104,190 69,278 173,468 – – –Cost 104,190 70,301 174,491 – – –Accumulated depreciation – (1,023) (1,023) – – –
Net book value as at 30 June 2006 104,190 69,278 173,468 – – –
(b) basis of valuation
Freehold land and buildings are accounted for using the cost method (refer note 1(n)). Construction in progress is recognised at fair value. As at 30 June 2007, the fair value of construction in progress is equal to cost.
(c) non-current assets pledged as security
Refer to note 22 for information on non-current assets pledged as security by the parent entity and its controlled entities.
www.global-reports.com

104 DB RREEF Trust Financial Reports 2007
note 16. non-current assets – property plant and equipment (continued)
(d) acquisitions and developments
acquisitions
144 Wicks Road, North Ryde NSW
On 20 November 2006, DOT (through its sub-trust Wicks Road Trust), acquired a 50 percent ownership interest in the former Peter Board High School site, 144 Wicks Road, North Ryde NSW for a consideration of $25.9 million.
Dohertys Road, North Laverton VIC
In November 2006, DIT purchased 440 Dohertys Road, North Laverton VIC, a land parcel adjacent to DB RREEF Industrial Estate, Laverton North for $32.0 million.
Summit Oaks, Valencia, California
On December 13, 2006, DB RREEF Industrial Properties Sub A Inc. (DB RREEF Sub A) formed a joint venture (Summit Oaks RP-V2, LLC, Summit Oaks) with Parker Oaks, LLC to acquire a property located in Santa Clarita, California. DB RREEF Sub A is owned 100 percent by US REIT. At closing, Parker Oaks, LLC (Parker) contributed land with an agreed upon value of $1.8 million (US$1.4 million) (net of reimbursement for carrying costs incurred prior to the acquisition) which represents the only scheduled contribution that will be made by Parker to the Joint Venture. US REIT contributed $2.1 million ($US1.7 million) in cash and also funded $3.5 million (US$2.8 million) in the form of a land loan that repaid the existing bank land loan. At closing, the ownership percentage is 54 percent and 46 percent for DB RREEF Sub A and Parker respectively. After funding 100 percent of the remaining equity contributions, the ownership percentage is expected to become 91.6 percent and 8.4 percent for DB RREEF Sub A and Parker respectively.
developments
Boundary Road, North Laverton VIC
In June 2005, DIT entered into agreements to lease and build a major distribution centre for Coles Myer Limited. Practical completion was achieved on 15 February 2007. In August 2006, DIT entered into agreement to lease and build a distribution centre (including external canopy areas) for Fosters Limited. Construction of this building has commenced and completion is expected in July 2007.
Turnpike Distribution Center, Medley, Florida
Development of a single 268,119 square foot industrial building was completed as of May 31, 2007, and the property is currently 100 percent leased. This has been transferred to investment properties at 30 June 2007.
Dulles Town Crossing, Herndon, Virginia
The development of this land parcel consists of two, four storey office buildings comprising 220,000 square feet in a rapidly growing area of Virginia. The total budgeted cost for the project is $56.1 million (US$47.6 million), including the initial cost of the land. The current plan calls for construction completion in early 2008 with stabilisation occurring approximately 12 to 15 months thereafter. Total costs incurred to June 30, 2007 are $12.8 million (US$10.9 million).
Summit Oaks, Valencia, California
The development of this land consists of a five storey office building comprising 139,392 square feet in Santa Clarita, California. The total budgeted cost for the project is $53.3 million (US$45.2 million). The current plan calls for construction completion in August 2008 with stabilisation occurring approximately 12 to 15 months thereafter. Total costs incurred to June 30, 2007 are $12.4 million (US$10.5 million).
notes to the financial statements (continued)
note 17. non-current assets – other financial assets at fair value through profit or lossInvestments are adjusted to their fair value through the Income Statements.
Name of entity Principal activity Ownership interest Parent Entity
2007(%)
2006(%)
2007$’000
2006$’000
Controlled entitiesDB RREEF Hurstville Trust Retail property investment 100 100 294,901 247,172DB RREEF Industrial Trust1 Industrial property investment 100 100 – –DB RREEF Office Trust1 Commercial property investment 100 100 – –DB RREEF Operations Trust1 Financial services 100 100 – –
Total non-current assets – other financial assets at fair value through profit or loss 294,901 247,172
reconciliation
Parent Entity
2007$’000
2006$’000
Opening balance as at 1 July 2006 247,172 233,867Distributions (15,650) (16,800)Fair value gain 63,379 30,105
Closing balance as at 30 June 2007 294,901 247,172
1 In accordance with AASB Interpretation 1002, DDF is the deemed acquirer of DIT, DOT and DRO and therefore they are reflected in the Financial Statements as controlled entities of DDF.
All controlled entities are wholly owned by the Trust. Both the parent entity and the controlled entities were formed in Australia.
www.global-reports.com

DB RREEF Trust Financial Reports 2007 105
note 18. non-current assets – investments accounted for using the equity methodInvestments are accounted for in the consolidated Financial Statements using the equity method of accounting (refer note 1).
Information relating to these entities is set out below.
Name of entity Principal activity Ownership interest Consolidated Parent Entity
2007(%)
2006(%)
2007$’000
2006$’000
2007$’000
2006$’000
Held by parent entityMt Druitt Shopping Centre Trust
Retail property investment 50 50 211,517 182,500 211,517 182,500
DB RREEF Industrial Properties, Inc.1
Asset, property and funds management 50 50 – – 270,195 271,898
Held by controlled entities2 O’Connell Street Trust Commercial
property investment 50 50 8,565 9,702 – –4 O’Connell Street Trust Commercial
property investment 50 50 16,054 15,197 – –Bligh Street Trust Commercial
property investment 50 50 16,133 11,902 – –DB RREEF Holdings Pty Limited (DRH)
Asset, property and funds management 50 50 17,886 15,761 – –
Total 270,155 235,062 481,712 454,398
1 The remaining 50 percent of this entity is owned by DIT. As a result, this entity is classed as controlled on a DDF consolidated basis.
These entities were formed in Australia with the exception of DB RREEF Industrial Properties, Inc. which was formed in the United States.
Consolidated
2007$’000
2006$’000
Movements in carrying amounts of investments accounted for using the equity methodOpening balance as at 1 July 2006 235,062 208,732Interest acquired during the year 2,053 18,335Share of net profits after tax 52,715 26,911Distributions/Dividends received (19,675) (18,916)
Closing balance as at 30 June 2007 270,155 235,062
Results attributable to associatesOperating profits before income tax 55,550 29,187Income tax expense (2,835) (2,276)
Operating profits after income tax 52,715 26,911
Less: Distributions/Dividends received (19,675) (18,916)
33,040 7,995
Undistributed income attributable to associates as at 1 July 2006 13,299 5,304Undistributed income attributable to associates as at 30 June 2007 46,339 13,299
Summary of the performance and financial position of investments accounted for using the equity methodThe Trusts’ share of aggregate profits, assets and liabilities of investments accounted for using the equity method are:Profits from ordinary activities after income tax expense 52,715 26,911Assets 534,997 274,809Liabilities 190,754 66,294
Share of associates’ expenditure commitmentsCapital commitments – –
contingent event of investments accounted for using the equity method
Upon satisfaction of certain conditions, the Trust may elect to exercise a call option granted to it in relation to the purchase of the remaining 50 percent interest in DRH.
Upon satisfaction of certain conditions, FAP may elect to exercise a put option granted to it in relation to the sale of its 50 percent investment in DRH.
www.global-reports.com

106 DB RREEF Trust Financial Reports 2007
note 19. non-current assets – deferred tax assets
Consolidated Parent Entity
2007$’000
2006$’000
2007$’000
2006$’000
The balance comprises temporary differences attributable to:Amounts recognised in profit or loss
Derivative financial instruments 2,140 46 – –Tax losses 1,497 – – –Other 284 70 – –
Net deferred tax assets 3,921 116 – –
MovementsOpening balance at 1 July 2006 116 127 – –Change on adoption of AASB 132 and AASB 139 – 196 – –Credited/(charged) to the Income Statements 3,805 (207) – –
Closing balance at 30 June 2007 3,921 116 – –
note 20. non-current assets – other
Consolidated Parent Entity
2007$’000
2006$’000
2007$’000
2006$’000
Tenant and other bonds 2,631 1,819 803 750Other 7,276 5,193 – –
Total non-current assets – other 9,907 7,012 803 750
note 21. current liabilities – payables
Consolidated Parent Entity
2007$’000
2006$’000
2007$’000
2006$’000
Trade creditors 41,554 51,964 6,423 10,394Accruals 9,646 6,938 879 1,042Amount payable to other minority interest 3,978 3,509 – –Accrued capital expenditure 24,284 2,117 13,204 –Prepaid income 4,944 7,727 690 1,409Responsible Entity fee payable 3,375 2,692 1,342 1,093GST payable 2,797 1,350 – –Accrued interest 33,931 24,095 1,591 1,258Deferred settlement of property acquisition – 475 – 475Other – 34 – –
Total current liabilities – payables 124,509 100,901 24,129 15,671
notes to the financial statements (continued)
www.global-reports.com
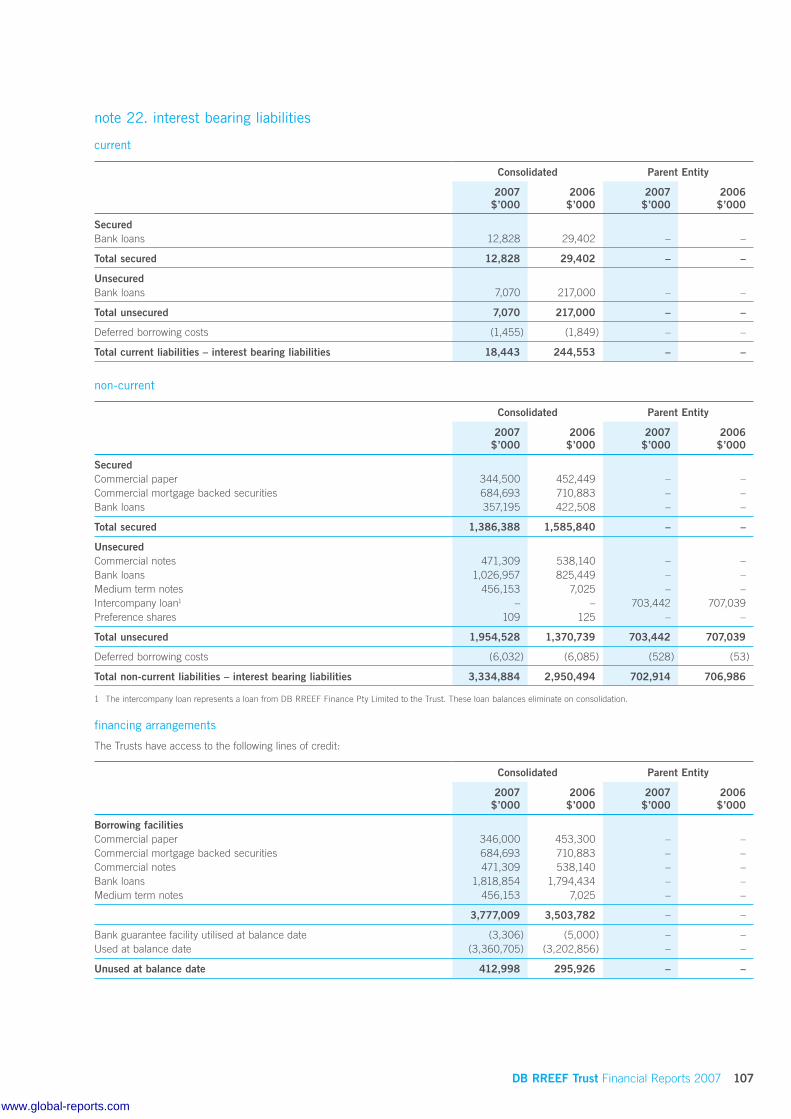
DB RREEF Trust Financial Reports 2007 107
note 22. interest bearing liabilities
current
Consolidated Parent Entity
2007$’000
2006$’000
2007$’000
2006$’000
SecuredBank loans 12,828 29,402 – –
Total secured 12,828 29,402 – –
UnsecuredBank loans 7,070 217,000 – –
Total unsecured 7,070 217,000 – –
Deferred borrowing costs (1,455) (1,849) – –
Total current liabilities – interest bearing liabilities 18,443 244,553 – –
non-current
Consolidated Parent Entity
2007$’000
2006$’000
2007$’000
2006$’000
SecuredCommercial paper 344,500 452,449 – –Commercial mortgage backed securities 684,693 710,883 – –Bank loans 357,195 422,508 – –
Total secured 1,386,388 1,585,840 – –
UnsecuredCommercial notes 471,309 538,140 – –Bank loans 1,026,957 825,449 – –Medium term notes 456,153 7,025 – –Intercompany loan1 – – 703,442 707,039Preference shares 109 125 – –
Total unsecured 1,954,528 1,370,739 703,442 707,039
Deferred borrowing costs (6,032) (6,085) (528) (53)
Total non-current liabilities – interest bearing liabilities 3,334,884 2,950,494 702,914 706,986
1 The intercompany loan represents a loan from DB RREEF Finance Pty Limited to the Trust. These loan balances eliminate on consolidation.
financing arrangements
The Trusts have access to the following lines of credit:
Consolidated Parent Entity
2007$’000
2006$’000
2007$’000
2006$’000
Borrowing facilitiesCommercial paper 346,000 453,300 – –Commercial mortgage backed securities 684,693 710,883 – –Commercial notes 471,309 538,140 – –Bank loans 1,818,854 1,794,434 – –Medium term notes 456,153 7,025 – –
3,777,009 3,503,782 – –
Bank guarantee facility utilised at balance date (3,306) (5,000) – –Used at balance date (3,360,705) (3,202,856) – –
Unused at balance date 412,998 295,926 – –
www.global-reports.com

108 DB RREEF Trust Financial Reports 2007
note 22. interest bearing liabilities (continued)
fair value
Consolidated 2007 Consolidated 2006
Carrying amount$’000
Fair value
$’000
Carrying amount$’000
Fair value
$’000
The carrying amounts and fair values of borrowings at balance date are:Commercial paper 344,500 344,500 452,449 452,449Commercial mortgage backed securities 684,693 683,511 710,883 711,550Commercial notes 471,309 460,740 538,140 514,989Bank loans 1,404,050 1,389,849 1,494,359 1,473,107Medium term notes 456,153 451,185 7,025 7,585
3,360,705 3,329,785 3,202,856 3,159,680
notes to the financial statements (continued)
None of the classes of borrowings is readily traded on organised markets in standardised form.
The fair value of borrowings is based upon market prices where a market exists or by discounting the expected future cash flows by the current interest rates for liabilities with similar risk profiles.
bank loans
DB RREEF Finance Pty Limited, a wholly-owned subsidiary of DRO, has syndicated bank debt facilities which comprises a $300.0 million multi-currency revolving credit facility maturing in September 2008, a $300.0 million multi-currency revolving credit facility maturing in March 2010 and a US$210 million ($247.437 million) multi-currency revolving credit facility maturing in September 2010. In addition, DB RREEF Finance Pty Limited has bilateral bank debt facilities comprising multi-currency revolving credit facilities of $360.0 million, US$120.0 million ($141.393 million) and $100.0 million maturing in December 2010, December 2013 and December 2007 respectively. Of the $100.0 million facility, $1.496 million and US$1.536 million ($1.810 million) is utilised as bank guarantees for developments (refer note 34). These bank debt facilities are supported by the Trusts’ guarantee arrangements. These facilities have negative pledge provisions which limit the amount and type of encumbrances that the Trusts can have over their assets and ensure that all senior unsecured debt ranks pari passu. DB RREEF Industrial Properties, Inc may borrow under the US$210.0 million, $360.0 million, $100.0 million and US$120.0 million multi-currency revolving credit facilities.
The current debt facilities will be refinanced as at/or prior to their maturity.
The consolidated accounts of the Trusts include the debt facilities of the US joint venture. The facilities include a total of US$89.039 million ($104.913 million) of secured bank debt facilities that amortise through monthly principal and interest payments with a weighted average maturity date of March 2009 and a US$225.0 million ($265.111 million) secured interest only bank loan maturing in September 2009. These facilities are secured by mortgages over investment properties of the US joint venture totalling $331.2 million and $696.4 million respectively as at 30 June 2007.
commercial notes – USA private placement
DB RREEF Finance Pty Limited has on issue US$200.0 million ($235.655 million) of notes which were privately placed with investors on terms to maturity ranging from December 2011 to March 2017.
DB RREEF Industrial Properties, Inc has on issue US$200.0 million ($235.654 million) of notes which were privately placed with investors on terms to maturity ranging from February 2011 to February 2016.
These notes are supported by the Trusts’ guarantee arrangements. These notes have negative pledge provisions which limit the amount and type of encumbrances that the Trusts can have over their assets and ensures that all senior unsecured debt ranks pari passu.
commercial paper and commercial mortgage backed securities
DOT has liabilities resulting from the issuance of $344.5 million (facility limit of $346.0 million) asset backed commercial paper (CP) and $500.0 million commercial mortgage backed securities (CMBS). The CMBS has an anticipated maturity date of April 2009. The CP and CMBS are both secured by mortgages over eight investment properties of DOT with a total value of $2,437.5 million as at 30 June 2007.
The US joint venture has liabilities resulting from a US$156.8 million ($184.693 million) CMBS issue, maturing in September 2008 (inclusive of a one year extension option beginning September 2007). This is secured by investment properties of the US joint venture totalling $549.8 million as at 30 June 2007.
medium term notes
The US joint venture has liabilities resulting from US$5.222 million ($6.153 million) unsecured medium term notes maturing in September 2010.
On 4 August 2006, DB RREEF Finance Pty Limited issued $250.0 million of unsecured medium term notes, maturing in February 2010. On 8 February 2007, DB RREEF Finance Pty Limited issued a further $200.0 million of unsecured medium term notes, maturing in February 2011. These notes are supported by the Trusts’ guarantee arrangements. These notes have negative pledge provisions which limit the amount and type of encumbrances that the Trusts can have over their assets and ensure that all senior unsecured debt ranks pari passu.
preferred shares
DB RREEF Industrial Properties, Inc has issued US$92,550 ($109,049) of preferred shares as part of the requirement to be classified as a Real Estate Investment Trust (REIT) under US tax legislation. These preferred shares will remain on issue until such time that the Board decides that it is no longer in the company’s interest to qualify as a REIT.
www.global-reports.com

DB RREEF Trust Financial Reports 2007 109
note 23. current liabilities – provisions
Consolidated Parent Entity
2007$’000
2006$’000
2007$’000
2006$’000
Provision for distributionOpening balance as at 1 July 2006 155,523 144,800 54,178 67,756Additional provisions 324,638 306,259 131,505 106,689Payments and reinvestment of distributions (315,169) (295,536) (117,213) (120,267)
Closing balance as at 30 June 2007 164,992 155,523 68,470 54,178
provision for distribution
Provision is made for distributions to be paid for the period ending 30 June 2007 payable on 29 August 2007.
note 24. current liabilities – other
Consolidated Parent Entity
2007$’000
2006$’000
2007$’000
2006$’000
Tenant bonds 13 20 – –Other borrowing costs 3,137 5,432 – –
Total current liabilities – other 3,150 5,452 – –
note 25. non-current liabilities – deferred tax liabilities
Consolidated Parent Entity
2007$’000
2006$’000
2007$’000
2006$’000
The balance comprises temporary differences attributable to:Amounts recognised in profit or lossInvestment property 73,360 48,652 – –Other 449 74 – –
Total non-current liabilities – deferred tax liabilities 73,809 48,726 – –
movements
Consolidated Parent Entity
2007$’000
2006$’000
2007$’000
2006$’000
Opening balance at 1 July 2006 48,726 23,685 – –Credited/(charged) to income tax benefit/(expense) 378 26 – –Credited/(charged) to withholding tax expense 24,705 25,015 – –
Closing balance at 30 June 2007 73,809 48,726 – –
note 26. non-current liabilities – financial liabilities with minority interestDB RREEF Industrial Properties, Inc. (US REIT) owns 80 percent of DB RREEF Industrial, LLC, a joint venture with Calwest Industrial Properties, LLC (Calwest), the 20 percent owner. The joint venture agreement entitles Calwest to receive 40 percent of certain cashflows arising from the joint venture, rather than the 20 percent that it would be entitled to in terms of its ownership interest, up until 30 June 2014, after which time the rights to the cashflows revert to the ownership percentages. This additional entitlement is known as the “special interest” or “Calwest promote”.
The joint venture agreement entitles US REIT to purchase the special interest from Calwest at any time up until 30 June 2014 at an agreed predetermined price (which increases over time) (the agreed price). Calwest has a right to sell the special interest to the US REIT, from 1 July 2009 to 30 June 2014, at a price not exceeding the agreed price.
The agreed price at 30 June 2007 was $28,305,000 (2006: $29,105,000), which is the value recognised in the Financial Statements.
www.global-reports.com

110 DB RREEF Trust Financial Reports 2007
note 27. non-current liabilities – other
Consolidated Parent Entity
2007$’000
2006$’000
2007$’000
2006$’000
Tenant bonds 7,975 7,982 1,210 1,084Other borrowing costs 2,541 5,634 – –Other 22 22 – –
Total non-current liabilities – other 10,538 13,638 1,210 1,084
note 28. contributed equity
(a) contributed equity of equity holders of the parent entity
Consolidated Parent Entity
2007$’000
2006$’000
2007$’000
2006$’000
Opening balance as at 1 July 2006 1,094,144 1,059,867 1,094,144 1,059,866Distributions reinvested 57,382 34,284 57,382 34,284Cost of distributions reinvested – (7) – (6)
Closing balance as at 30 June 2007 1,151,526 1,094,144 1,151,526 1,094,144
(b) contributed equity of equity holders of other entities stapled to DDF (minority interest)
Consolidated Parent Entity
2007$’000
2006$’000
2007$’000
2006$’000
Opening balance as at 1 July 2006 2,094,887 2,034,388 – –Distributions reinvested 87,946 60,509 – –Cost of distributions reinvested – (10) – –
Closing balance as at 30 June 2007 2,182,833 2,094,887 – –
(c) number of securities on issue
Consolidated Parent Entity
2007 2006 2007 2006Number
of securitiesNumber
of securitiesNumber of units
Number of units
Opening balance as at 1 July 2006 2,802,209,393 2,732,082,389 2,802,209,393 2,732,082,389Distributions reinvested 92,390,613 70,127,004 92,390,613 70,127,004
Closing balance as at 30 June 2007 2,894,600,006 2,802,209,393 2,894,600,006 2,802,209,393
Terms and conditions
Each stapled security ranks equally with all other stapled securities for the purposes of distributions and on termination of the Trust. Each stapled security entitles the holder to one vote, either in person or by proxy, at a meeting of each of the Trusts.
Distribution reinvestment plan
Under the distribution reinvestment plan (DRP), stapled security holders may elect to have all or part of their distribution entitlements satisfied by the issue of new stapled securities, rather than being paid in cash.
On 29 August 2006, 48,611,675 units were issued at a unit price of $1.4746 in relation to the June 2006 distribution period. On 28 February 2007, 43,778,938 units were issued at a unit price of $1.6822 in relation to the December 2006 distribution period.
notes to the financial statements (continued)
www.global-reports.com

DB RREEF Trust Financial Reports 2007 111
note 29. reserves and undistributed income
(a) reserves
Consolidated Parent Entity
2007$’000
2006$’000
2007$’000
2006$’000
Foreign currency translation reserve 2,129 178 – –
Total reserves 2,129 178 – –
Movements: Foreign currency translation reserveOpening balance as at 1 July 2006 178 (1,123) – –Exchange difference arising from the translation of the financial statements of foreign operations 1,951 1,301 – –
Total movement in foreign currency translation reserve 1,951 1,301 – –
Closing balance as at 30 June 2007 2,129 178 – –
(b) nature and purpose of reserves
Foreign currency translation reserve
The foreign currency translation reserve is used to record exchange differences arising from the translation of the Financial Statements of foreign operations.
(c) undistributed income
Consolidated Parent Entity
2007$’000
2006$’000
2007$’000
2006$’000
Undistributed income as at 1 July 2006 1,098,453 407,222 525,810 229,115Net profit attributable to security holders 1,168,819 1,010,342 443,857 401,219Transfer of capital reserve of other minority interest (12,352) (16,014) – –Distributions provided for or paid (324,638) (306,259) (131,505) (106,689)Adjustment on adoption of AASB 132 and 139 – 3,162 – 2,165
Undistributed income as at 30 June 2007 1,930,282 1,098,453 838,162 525,810
note 30. other minority interests
Consolidated Parent Entity
2007$’000
2006$’000
2007$’000
2006$’000
Interest inContributed equity 348,062 343,932 – –Reserves (1,119) 15,616 – –Undistributed income 91,230 68,303 – –
Total other minority interests 438,173 427,851 – –
www.global-reports.com

112 DB RREEF Trust Financial Reports 2007
note 31. distributions paid and payable
(a) distribution to security holders
Consolidated Parent Entity
2007$’000
2006$’000
2007$’000
2006$’000
31 December (paid 28 February 2007) 159,646 150,736 63,035 52,51130 June (payable 29 August 2007) 164,992 155,523 68,470 54,178
Total distributions 324,638 306,259 131,505 106,689
(b) distribution to other minority interests
Consolidated Parent Entity
2007$’000
2006$’000
2007$’000
2006$’000
DB RREEF Industrial Holdings, LLC (paid) 3,599 7,178 – –DB RREEF RENTS Trust (paid 17 October 2006) 3,737 4,223 – –DB RREEF RENTS Trust (paid 17 January 2007) 3,856 3,566 – –DB RREEF RENTS Trust (paid 18 April 2007) 3,876 3,488 – –DB RREEF RENTS Trust (payable 16 July 2007) 3,977 3,509 – –
19,045 21,964 – –
Total distributions 343,683 328,223 131,505 106,689
(c) distribution rate
Consolidated Parent Entity
2007 2006 2007 2006Cents
per securityCents
per securityCents
per unitCents
per unit
31 December (paid 28 February 2007) 5.60 5.45 2.21 1.9330 June (payable 29 August 2007) 5.70 5.55 2.37 1.96
Total distributions 11.30 11.00 4.58 3.89
(d) franked dividendsThe franked portions of the final dividends recommended after 30 June 2007 will be franked out of existing franking credits or out of franking credits arising from the payment of income tax in the year ending 30 June 2007.
Consolidated Parent Entity
2007$’000
2006$’000
2007$’000
2006$’000
Franking creditsOpening balance as at 1 July 2006 744 – – –Franking credits arising during the year on payment of tax at 30 percent 3,261 1,564 – –Franking debits arising from payment of interim dividend (493) (820) – –
Closing balance as at 30 June 2007 3,512 744 – –
notes to the financial statements (continued)
www.global-reports.com

DB RREEF Trust Financial Reports 2007 113
note 32. financial risk managementThe Trust’s activities expose it to a variety of financial risks: credit risk, market risk (including currency risk, fair value interest rate risk and price risk), liquidity risk and cash flow interest rate risk. The Trust’s overall risk management program focuses on the unpredictability of financial markets and seeks to minimise potential adverse effects on the financial performance of the Trust.
Accordingly, the Trust enters into various derivative financial instruments to manage its exposure to the movements in interest rates and foreign exchange rates. There are policies and limits approved by the Board of Directors of the Responsible Entity in respect of the usage of derivatives and other financial instruments to hedge those cash flows and earnings which are subject to interest rate risks and foreign currency risk respectively. In conjunction with its advisers, the Responsible Entity continually reviews the Trust’s exposures and updates its treasury policies and procedures. The Trust does not trade in derivative instruments for speculative purposes.
(a) credit risk
Credit risk represents the loss that would be recognised if counterparties failed to perform as contracted.
Concentrations of credit risk are minimised primarily by:
ensuring tenants, together with the respective credit limits, are approved and ensuring that leases are undertaken with a large number of tenants; and
ensuring derivative counterparties and cash transactions are limited to high credit quality financial institutions. The Trust has policies that limit the amount of credit exposure to any one financial institution. Credit risk is further minimised by spreading transactions amongst approved counterparties.
As such, the Trust does not have a concentration of credit risk that arises from an exposure to a single tenant or financial institution.
Furthermore, the Trust does not have a material exposure to a group of counterparties which are expected to be affected similarly by changes in economic or other conditions.
On-balance sheet financial instruments
The Trust’s exposure to credit risk on its financial assets is the carrying amount of its financial assets, as recognised in the Balance Sheets.
(b) market risk
(i) Foreign exchange risk
Foreign exchange risk is the risk that movements in exchange rates used to convert foreign currency revenues, expenses, assets, or liabilities to the Trust functional currency will have an adverse affect on DRT.
The Trusts operate internationally with investments in the United States, New Zealand, France and Germany and are exposed to foreign exchange risk arising from currency exposures in US dollars, NZ dollars and Euro.
Exposure to foreign exchange risk is minimised by the way the Trust manages its borrowing arrangements. The Trust matches the
n
n
currency of its investment with the currency of its debt where practical. Residual foreign exchange risk is managed by the use of forward foreign exchange contracts.
(ii) Fair value interest rate risk
Fair value interest rate risk is the risk of an adverse change in the net fair (or market) value of an asset or liability due to movements in interest rates. Refer to (d) below.
(iii) Price risk
This is the risk that the value of the Trust’s investment portfolio will fluctuate as a result of changes in valuations. This risk is managed by ensuring that all activities are transacted in accordance with mandates, overall investment strategy and within approved limits. Market risk analysis is conducted regularly on a total portfolio basis.
On-balance sheet financial instruments
The net fair value of cash and non-interest bearing monetary financial assets and liabilities is approximated by the carrying value of that asset or liability, as recognised in the Balance Sheets.
(c) liquidity risk
Liquidity risk is the risk that the Trust will experience difficulty in either realising assets or otherwise raising sufficient funds to satisfy commitments. The risk management guidelines adopted are designed to minimise liquidity risk through maintaining sufficient cash balances and the availability of funding through an adequate amount of committed credit facilities.
(d) cash flow and fair value interest rate risk
Interest rate risk for the Trust arises from its borrowings. Borrowings issued at variable rates expose the Trust to cash flow interest rate risk. Borrowings issued at fixed rates expose the Trust to fair value interest rate risk.
Generally, fair value risk on borrowings issued at fixed rates is mitigated by entering into swaps for equivalent notional amounts and maturity dates that convert the fixed interest rate obligation on the borrowing into a variable rate obligation (i.e. fair value risk is converted to cash flow risk).
Cash flow interest rate risk on borrowings is managed by the use of interest rate swaps. Under the terms of these interest rate swaps, the Trust agrees with other parties to exchange, at specified intervals (mainly quarterly), the difference between fixed contract rates and floating rate interest amounts calculated by reference to the agreed notional principal amounts.
Fixed debt and swaps currently in place cover approximately 97 percent (2006: 95 percent) of the loan principal outstanding, with a further $2.3 billion (2006: $2.7 billion) in swaps that are forward starting.
The Trust’s exposure to interest rate risk is hedged with interest rate swaps and the weighted average effective interest rate (for each class of financial asset and financial liability, and each maturity bracket including floating rate financial assets and liabilities), and is set out in the following table.
www.global-reports.com

114 DB RREEF Trust Financial Reports 2007
note 32. financial risk management (continued)
(d) cash flow and fair value interest rate risk (continued)
30 June 2007
Consolidated
Note(s)
Floating interest
rate $’000
1 year or less
$’000
Fixed interest maturing in:
Over 1 and less than
2 years $’000
Over 2 and less than
3 years $’000
Over 3 and less than
4 years $’000
Over 4 and less than
5 years $’000
More than 5 years
$’000
Total
$’000
Financial assetsCash and cash equivalents 8 59,603 – – – – – – 59,603Loans and receivables 13 – – – – – – 51,936 51,936
Total 59,603 – – – – – 51,936 111,539
Weighted average interest rate 6.21% – – – – – 11.00%
Financial liabilities Interest bearing liabilities 22 1,925,893 12,828 244,786 515,803 329,448 65,251 266,805 3,360,814Interest rate swaps1 (1,826,934) 280,000 326,290 216,412 108,432 225,156 670,644 –Forward start interest rate swaps1 – (212,479) (362,173) (457,170) (294,068) (170,696) (809,136) (2,305,722)Forward start interest rate swaps maturities1 – – 80,000 – 11,086 – 2,214,636 2,305,722
Total 98,959 80,349 288,903 275,045 154,898 119,711 2,342,949 3,360,814
Weighted average interest rate (including swaps)
5.75% 5.58% 5.54% 5.75% 5.84% 5.89% 5.90%
Net financial (liabilities)/assets (39,356) (80,349) (288,903) (275,045) (154,898) (119,711) (2,291,013) (3,249,275)
30 June 2006
Consolidated
Note(s)
Floating interest
rate $’000
1 year or less
$’000
Fixed interest maturing in:
Over 1 and less than
2 years $’000
Over 2 and less than
3 years $’000
Over 3 and less than
4 years $’000
Over 4 and less than
5 years $’000
More than 5 years
$’000
Total
$’000
Financial assetsCash and cash equivalents 8 106,428 – – – – – – 106,428Loans and receivables 13 – – – – – – 45,092 45,092
Total 106,428 – – – – – 45,092 151,520
Weighted average interest rate 6.25% – – – – – 11.00%
Financial liabilities Interest bearing liabilities 22 2,070,961 14,582 21,712 263,290 302,704 146,942 382,790 3,202,981Interest rate swaps1 (1,919,769) 668,349 180,000 214,572 515,533 290,205 51,110 –Forward start interest rate swaps1 – (707,257) (130,000) (445,465) (468,182) (309,029) (642,884) (2,702,817)Forward start interest rate swaps maturities1 – – – 183,814 – 45,533 2,473,470 2,702,817
Total 151,192 (24,326) 71,712 216,211 350,055 173,651 2,264,486 3,202,981
Weighted average interest rate (including swaps) 5.75% 5.66% 5.66% 5.63% 5.85% 5.96% 6.03%
Net financial (liabilities)/assets (44,764) 24,326 (71,712) (216,211) (350,055) (173,651) (2,219,394) (3,051,461)
1 Notional principal amounts.
notes to the financial statements (continued)
www.global-reports.com

DB RREEF Trust Financial Reports 2007 115
(e) foreign exchange rate risk exposures
When hedging its exposures, the Trusts adopt a strategy using both physical and derivative financial instruments. In regard to derivative financial instruments, the Trusts use forward exchange contracts for hedging purposes.
30 June 2007
Weighted average exchange rate Contracts to sell US$ at an agreed exchange rate:
1 year or less Over 1 and less than 2 years
More than 2 years
To pay US$ million 12.8 13.6 19.6To receive A$ million 18.4 19.5 27.3Weighted average exchange rate 0.6957 0.6971 0.7170
Weighted average exchange rate Contracts to sell Euro at an agreed exchange rate:
1 year or less Over 1 and less than 2 years
More than 2 years
To pay € million 2.7 1.7 2.6To receive A$ million 4.8 3.1 4.8Weighted average exchange rate 0.5702 0.5560 0.5370
Weighted average exchange rate Contracts to sell NZ$ at an agreed exchange rate:
1 year or less Over 1 and less than 2 years
More than 2 years
To pay NZ$ million 7.9 – –To receive A$ million 6.9 – –Weighted average exchange rate 1.1417 – –
30 June 2006
Weighted average exchange rate Contracts to sell US$ at an agreed exchange rate:
1 year or less Over 1 and less than 2 years
More than 2 years
To pay US$ million 16.8 15.3 25.7To receive A$ million 23.7 21.8 36.5Weighted average exchange rate 0.7086 0.7015 0.7041
Weighted average exchange rate Contracts to sell Euro at an agreed exchange rate:
1 year or less Over 1 and less than 2 years
More than 2 years
To pay € million 17.7 0.9 2.5To receive A$ million 30.3 1.6 4.6Weighted average exchange rate 0.5839 0.5626 0.5402
Weighted average exchange rate Contracts to sell NZ$ at an agreed exchange rate:
1 year or less Over 1 and less than 2 years
More than 2 years
To pay NZ$ million – – –To receive A$ million – – –Weighted average exchange rate – – –
www.global-reports.com

116 DB RREEF Trust Financial Reports 2007
notes to the financial statements (continued)
note 33. contingent liabilities Details and estimates of maximum amounts of contingent liabilities are as follows:
Consolidated Parent Entity
2007$’000
2006$’000
2007$’000
2006$’000
Bank guarantees by the Trusts in respect of variations and other financial risks associated with the development of:240 St George’s Terrace, Perth WA – 200 – –Coles Myer development at Boundary Road, Laverton VIC 1,000 5,000 – –60 Miller Street, North Sydney NSW 496 – – –Dulles Town Crossing, Virginia 1,810 – – –
Total contingent liabilities 3,306 5,200 – –
The Trusts are also guarantors of a A$600 million and US$210 million syndicated bank debt facility and a total of A$460 million and US$120 million of bank bilateral facilities, a total of $450 million of medium term notes and a total of US$400 million of privately placed notes, which have all been negotiated to finance the Trusts. The guarantees have been given in support of debt outstanding and drawn against these facilities.
The guarantees are issued in respect of the Trusts and do not constitute an additional liability to those already existing in interest bearing liabilities on the Balance Sheets.
The Directors of the Responsible Entity are not aware of any other contingent liabilities in relation to the Trusts, other than those disclosed in the Financial Statements, which should be brought to the attention of security holders as at the date of completion of this report.
www.global-reports.com

DB RREEF Trust Financial Reports 2007 117
note 34. commitments
(a) capital commitments
The following amounts represent capital expenditure on investment properties contracted at the reporting date but not recognised as liabilities payable:
Capital expenditure commitments in relation to development works:
Consolidated Parent Entity
2007$’000
2006$’000
2007$’000
2006$’000
Not longer than one yearAxxess Corporate Park, Mount Waverley VIC – 7,900 – 7,900Plenty Valley Town Centre, 330–464 McDonalds Road, South Morang VIC 81,576 35,000 81,576 35,000North Lakes Shopping Centre, Mango Hill QLD 48,398 50,000 48,398 50,000Boundary Road, Laverton North VIC 3,547 55,820 – –Pound Road West, Dandenong VIC 8,539 1,957 – –114 Fairbank Road, Clayton VIC 3,170 – – –21 rue du Chemin Blanc, Champlan 339 – – –32 avenue de L’Océanie, Villejust 157 – – –1 Margaret Street, Sydney NSW – 264 – –201 Elizabeth Street, Sydney NSW 215 – – –Governor Phillip Tower & Governor Macquarie Tower Office Complex 1 Farrer Place, Sydney NSW 2,446 14,534 – –309–321 Kent Street, Sydney NSW 2,323 5,254 – –Australia Square, 264 George Street, Sydney NSW 3,115 2,248 – –Southgate Complex, 3 Southgate Avenue, Southgate VIC 20 100 – –Williams Drive, Atlanta 124 398 – –West Nursery Road, Baltimore – 235 – –Commerce Park, Charlotte 233 – – –Regency Crest Drive, Dallas 474 – – –NE Baltimore, Baltimore 6 215 – –Kenwood Road, Cincinnati 42 124 – –East Collins Boulevard, Dallas – 180 – –10th Street, Dallas – 530 – –Mechanicsburg, Harrisburg 149 471 – –Glendale, Los Angeles 340 124 – –Memphis Industrial, Memphis 13 221 – –South Priest Drive, Pheonix – 410 – –Kent West, Seattle 571 573 – –Airport Exchange Boulevard, Cincinnati 390 – – –E Plano/Shiloh, Dallas 219 – – –Capital Avenue, Dallas 231 – – –Mounds View, Minneapolis 229 – – –Trenton Lane, Minneapolis 906 – – –Braemar Ridge, Minneapolis 277 – – –Eagandale Business Campus, Minneapolis 2,355 – – –West Alameda Drive, Phoenix 196 – – –44th Avenue, Phoenix 274 – – –Westinghouse Boulevard, Charlotte 471 – – –
161,345 176,558 129,974 92,900
Later than one year but not later than five yearsPlenty Valley Town Centre, 330–464 McDonalds Road, South Morang VIC – 40,000 – 40,000North Lakes Shopping Centre, Mango Hill QLD – 25,000 – 25,000Governor Phillip Tower & Governor Macquarie Tower Office Complex 1 Farrer Place, Sydney NSW 11,037 – – –Australia Square, 264 George Street, Sydney NSW 176 – – –North Lake Drive, Dallas 118 – – –10th Street, Dallas 295 – – –Eq/West/Div, Columbus 353 – – –
11,979 65,000 – 65,000
Later than five yearsAustralia Square, 264 George Street, Sydney NSW 836 – – –
836 – – –
Total capital commitments 174,160 241,558 129,974 157,900
www.global-reports.com

118 DB RREEF Trust Financial Reports 2007
note 34. commitments (continued)
(b) lease payable commitments
Commitments in relation to leases contracted for at the reporting date but not recognised as liabilities payable:
Consolidated Parent Entity
2007$’000
2006$’000
2007$’000
2006$’000
Within one year 290 290 290 290Later than one year but not later than five years 1,162 1,162 1,162 1,162Later than five years 7,260 7,550 7,260 7,550
Total lease payable commitments 8,712 9,002 8,712 9,002
Payments made under operating leases are expensed on a straight line basis over the term of the lease, except where an alternative basis is more representative of the pattern of benefits to be derived from the leased property.
The Trust has a commitment for ground rent payable in respect of a leasehold property included in property investments. An amount of $290,356 was paid in respect of the year ended 30 June 2007 (2006: $290,356). This commitment was reviewed in 2003 and annual lease payments were increased by a CPI factor as per the lease agreement. This commitment is next subject for review in 2012 and expires in 2037.
No provisions have been recognised in respect of non-cancellable operating leases.
(c) lease receivable commitments
The future minimum lease payments receivable by the Trusts are: Consolidated Parent Entity
2007$’000
2006$’000
2007$’000
2006$’000
Within one year 572,632 541,745 173,502 147,352Later than one year but not later than five years 1,677,318 1,531,569 549,873 423,153Later than five years 1,018,754 967,674 435,658 273,761
Total lease receivable commitments 3,268,704 3,040,988 1,159,033 844,266
note 35. related parties
responsible entity
DB RREEF Funds Management Limited is the responsible entity of the Trusts.
responsible entity fees
Under the terms of the Trust Constitutions, the Responsible Entity is entitled to receive fees in relation to the management of the Trust.
In addition, the Responsible Entity is entitled to property management fees and to be reimbursed for expenses incurred on behalf of the Trust.
related party transactions
All related party transactions are conducted on normal commercial terms and conditions unless otherwise stated.
unitholdings
At 30 June 2007 Deutsche Bank AG and its related parties, schemes and portfolios managed by Deutsche Bank AG and its related parties hold 57,302,807 stapled securities (2006: 48,480,053) in DRT.
investments
DB RREEF Funds Management Limited, the Responsible Entity, is a wholly owned subsidiary of DRH. DRH is 50 percent owned by DRO and 50 percent owned by First Australian Property Group Holdings Limited, a subsidiary of Deutsche Bank Group. The Trust is the parent entity and deemed acquirer of DRO.
notes to the financial statements (continued)
www.global-reports.com
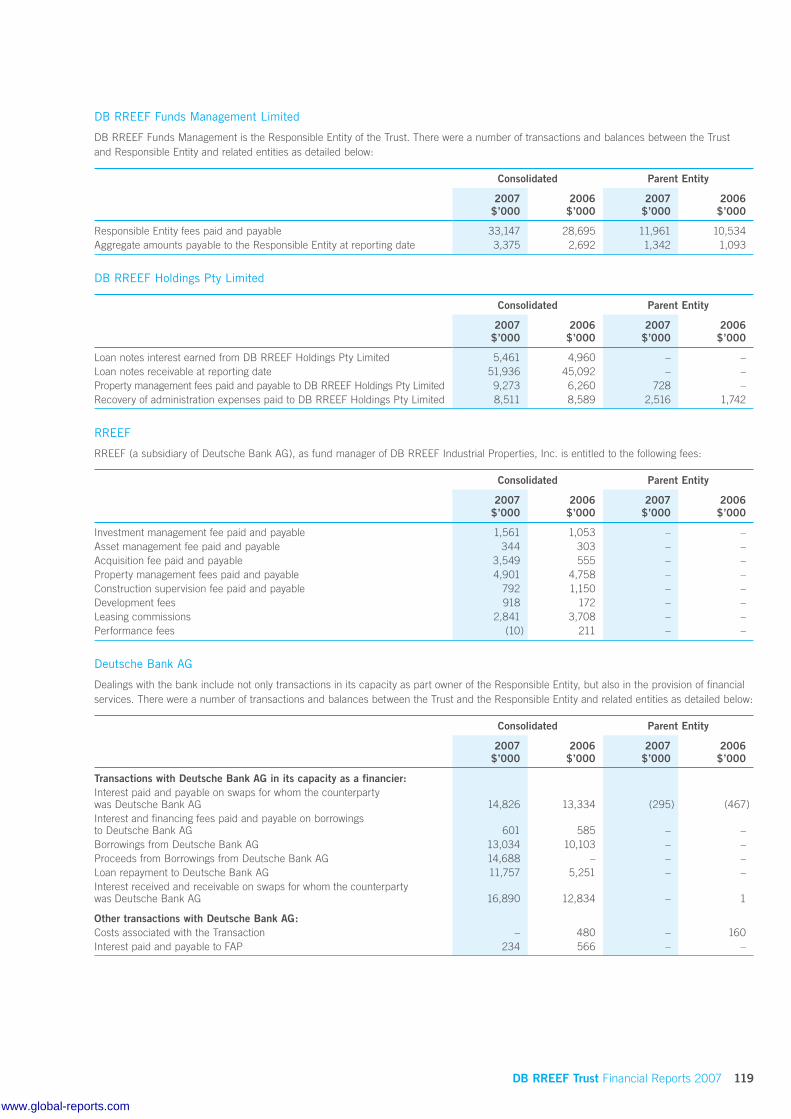
DB RREEF Trust Financial Reports 2007 119
DB RREEF Funds Management Limited
DB RREEF Funds Management is the Responsible Entity of the Trust. There were a number of transactions and balances between the Trust and Responsible Entity and related entities as detailed below:
Consolidated Parent Entity
2007$’000
2006$’000
2007$’000
2006$’000
Responsible Entity fees paid and payable 33,147 28,695 11,961 10,534Aggregate amounts payable to the Responsible Entity at reporting date 3,375 2,692 1,342 1,093
DB RREEF Holdings Pty Limited
Consolidated Parent Entity
2007$’000
2006$’000
2007$’000
2006$’000
Loan notes interest earned from DB RREEF Holdings Pty Limited 5,461 4,960 – –Loan notes receivable at reporting date 51,936 45,092 – –Property management fees paid and payable to DB RREEF Holdings Pty Limited 9,273 6,260 728 –Recovery of administration expenses paid to DB RREEF Holdings Pty Limited 8,511 8,589 2,516 1,742
RREEF
RREEF (a subsidiary of Deutsche Bank AG), as fund manager of DB RREEF Industrial Properties, Inc. is entitled to the following fees:
Consolidated Parent Entity
2007$’000
2006$’000
2007$’000
2006$’000
Investment management fee paid and payable 1,561 1,053 – –Asset management fee paid and payable 344 303 – –Acquisition fee paid and payable 3,549 555 – –Property management fees paid and payable 4,901 4,758 – –Construction supervision fee paid and payable 792 1,150 – –Development fees 918 172 – –Leasing commissions 2,841 3,708 – –Performance fees (10) 211 – –
Deutsche Bank AG
Dealings with the bank include not only transactions in its capacity as part owner of the Responsible Entity, but also in the provision of financial services. There were a number of transactions and balances between the Trust and the Responsible Entity and related entities as detailed below:
Consolidated Parent Entity
2007$’000
2006$’000
2007$’000
2006$’000
Transactions with Deutsche Bank AG in its capacity as a financier:Interest paid and payable on swaps for whom the counterparty was Deutsche Bank AG 14,826 13,334 (295) (467)Interest and financing fees paid and payable on borrowings to Deutsche Bank AG 601 585 – –Borrowings from Deutsche Bank AG 13,034 10,103 – –Proceeds from Borrowings from Deutsche Bank AG 14,688 – – –Loan repayment to Deutsche Bank AG 11,757 5,251 – –Interest received and receivable on swaps for whom the counterparty was Deutsche Bank AG 16,890 12,834 – 1
Other transactions with Deutsche Bank AG:Costs associated with the Transaction – 480 – 160Interest paid and payable to FAP 234 566 – –
www.global-reports.com

120 DB RREEF Trust Financial Reports 2007
note 35. related parties (continued)
directors
The following persons were Directors or Alternate Directors of DRFM during the whole of the financial year and up to the date of this report, unless otherwise stated.
Directors
C T Beare BSc, BE (Hons), MBA, PhD, FAICD1, 4, 5
E A Alexander AM, BComm, FCA, FAICD, FCPA1, 2, 3
B R Brownjohn BComm1, 2, 5
S F Ewen OAM FILE1, 4
V P Hoog Antink BComm, MBA, FCA, FAPI, MAICD5
C B Leitner III BAB E Scullin BEc2, 3, 4
A J Fay BAg Ec (Hons), ASIA (Alternate to C B Leitner)4
1 Independent Director.2 Audit Committee Member.3 Risk and Compliance Committee Member.4 Nomination and Remuneration Committee Member.5 Treasury Policy Committee Member.
No Directors held an interest in the Trust as at 30 June 2007 or at the date of this report.
other key management personnel
In addition to the Directors listed above the following persons were deemed by the Board Nomination and Remuneration Committee to be key management personnel during all or part of the financial year and up to the date of this report:
Name Position Qualification date of other key management personnel during the 12 months ended 30 June 2007
Tanya L Cox Chief Operating OfficerJohn C Easy General CounselBen J Lehmann Fund Manager, DB RREEF TrustPeter C Roberts Chief Financial Officer Qualified until 8 June 2007Paul G Say Head of Corporate Development Qualified from 19 March 2007Mark F Turner Head of Unlisted Funds
No key management personnel or their related parties held an interest in the Trust for the years ended 30 June 2006 and 30 June 2007 or at the date of this report.
There were no loans or other transactions with key management personnel or their related parties during the years ended 30 June 2006 and 30 June 2007 or at the date of this report.
2007 2006
CompensationShort-term employee benefits 4,753,130 4,434,850Post-employment benefits 998,514 418,594Other long-term benefits 1,265,000 650,000
7,016,644 5,503,444
The Trust has taken advantage of the relief provided by ASIC Class Order 06/50 and has transferred the detailed remuneration disclosures to the Directors’ Report. The relevant information can be found in section 3 of the Directors’ Report on pages 70 to 76.
notes to the financial statements (continued)
www.global-reports.com

DB RREEF Trust Financial Reports 2007 121
note 36. events occurring after reporting date
DIT France Logistique SAS
On 13 July 2007, DIT France Logistique SAS, a wholly owned subsidiary of DB RREEF Industrial Trust has been acceded as borrower under the syndicated bank debt facility. The existing EUR 37 million borrowing of DB RREEF Finance Pty Limited under this syndicated bank debt facility was transferred to DIT France Logistique SAS on 31 July 2007.
Sale of Lot 3, Boundary Road, North Laverton VIC
On 23 July 2007, DB RREEF Industrial Trust exchanged contracts to sell 50 percent of Lot 3, Boundary Road, North Laverton (the Coles Group Limited chilled distribution centre) for $58 million. Settlement is conditional upon the registration of plan of subdivision.
The Titan Industrial Portfolio
In July 2007, DB RREEF Industrial Properties, Inc. (US REIT) entered into a contract to acquire and develop certain real property commonly known as The Titan Industrial Portfolio (Titan Portfolio) located in the City of San Antonio, Texas. The Portfolio consists of 1,047,000 square feet of existing assets and 95 acres of land for development of approximately 1,550,000 square feet. The estimated purchase price of the existing assets is US$58,050,000 and the estimated cost to develop the land is US$95,500,000 including the cost of the land. The acquisition of two existing buildings, Interchange Park 8151 and Interchange Park 8161 closed on July 3, 2007, as the first acquisition in the Titan Portfolio. The purchase price of these buildings was US$16,188,730.
The development component will be structured in two phases as a joint venture, 96.5 percent owned by DB RREEF and 3.5 percent owned by Santa Barbara Development Services (SBDS). It will include an initial phase of approximately 660,000 square feet to be developed immediately. The total estimated cost for Phase I is US$44,200,000. The contract includes an eight month option from the initial closing date to purchase the Phase II land, contingent upon achieving a return on cost equal to or above the pro-forma, with mutually agreed upon market rents and developer cost guarantees. It is anticipated that the Phase II option will be exercised and development commences shortly thereafter. The Phase II development consists of approximately 890,000 square feet at an estimated cost of US$51,300,000.
retail portfolio sale to DWPF
DRFM as Responsible Entity of DRT has entered into a conditional contract with DB RREEF Wholesale Property Limited (DWPL) as Responsible Entity of DB RREEF Wholesale Property Fund to sell its 50 percent interest in five shopping centres for an estimated consideration of $927.75 million (Retail Transaction).
Completion of the Retail Transaction is conditional on:
DWPF obtaining FIRB approval; and
DWPF raising equity capital to its satisfaction.
Since 30 June 2007, other than the matters discussed above, the Directors of the Responsible Entity are not aware of any matter or circumstance not otherwise dealt with in their report or the Financial Statements that has significantly or may significantly affect the operations of the Trust, the results of those operations, or state of the Trust’s affairs.
n
n
www.global-reports.com

122 DB RREEF Trust Financial Reports 2007
note 37. segment information
business segments
The Trusts operate in the following segments:
Retail – investment in the retail property sector
Commercial and car park – investment in the commercial and car park property sectors
Industrial – investment in the industrial property sector
2007
Retail
$’000
Commercial and car park
$’000
Industrial
$’000
Eliminations/unallocated
$’000
Consolidated
$’000
Property revenue 66,079 318,122 309,229 – 693,430Interest revenue 264 1,159 2,094 4,589 8,106Share of net profits of associates accounted for using the equity method 40,656 5,717 – 6,342 52,715
106,999 324,998 311,323 10,931 754,251Proceeds from sale of inventory – – 3,959 – 3,959Net gain/(loss) on sale of investment properties – (105) 3,460 – 3,355Net fair value gain of investment properties 184,424 448,406 198,500 – 831,330Net fair value gain of derivatives – – – 52,458 52,458Net foreign exchange gain/(loss) – (166) 1,515 – 1,349Other income – 1,508 – 164 1,672
Total segment income 291,423 774,641 518,757 63,553 1,648,374
Segment result 309,610 625,653 284,482 (50,926) 1,168,819
Segment assets 1,229,217 4,104,675 3,931,679 221,265 9,486,836Segment liabilities 4,006 938,666 2,273,561 565,660 3,781,893Investments accounted for using the equity method 211,517 40,750 – 17,888 270,155Acquisition of investment properties – – 396,178 – 396,178Additions to property plant and equipment – 31,495 148,754 – 180,249Amortisation expense 2,174 24,585 10,902 – 37,661Other non-cash expenses – 2,488 – – 2,488
2006
Retail
$’000
Commercial and car park
$’000
Industrial
$’000
Eliminations/unallocated
$’000
Consolidated
$’000
Property revenue 64,441 304,249 294,652 154 663,496Interest revenue 257 837 1,462 5,597 8,153Share of net profits of associates accounted for using the equity method 19,632 2,434 – 4,845 26,911
84,330 307,520 296,114 10,596 698,560Net gain on sale of investment properties – 131 1,359 – 1,490Net fair value gain of investment properties 76,901 307,526 302,063 – 686,490Net fair value gain of derivatives – – – 73,271 73,271Net foreign exchange gain – 117 2,786 – 2,903Other income – 329 – 190 519
Total segment income 161,231 615,623 602,322 84,057 1,463,233
Segment result 140,857 469,881 338,973 60,631 1,010,342
Segment assets 932,720 3,678,670 3,520,817 155,331 8,287,538Segment liabilities 19,161 1,054,880 1,385,629 1,112,355 3,572,025Investments accounted for using the equity method 182,500 36,801 – 15,761 235,062Acquisition of investment properties – 102,599 53,194 – 155,793Additions to property plant and equipment – 57,495 89,083 – 146,578Amortisation expense 2,157 18,712 5,200 – 26,069Impairment of goodwill – – 3,287 – 3,287Other non-cash expenses – 1,023 – – 1,023
n
n
n
notes to the financial statements (continued)
www.global-reports.com

DB RREEF Trust Financial Reports 2007 123
geographical segments
The Trusts’ investments are located in Australia, New Zealand, the United States of America, France and Germany.
2007
Australia
$’000
New Zealand
$’000
United States of America
$’000
France
$’000
Germany
$’000
Consolidated
$’000
Rental and other property income 515,435 10,041 150,173 9,583 8,198 693,430Segment assets 7,692,110 133,617 1,303,064 112,441 245,604 9,486,836Acquisitions of investment properties – – 29,867 118,856 247,455 396,178Additions to property plant and equipment 148,632 – 31,617 – – 180,249
2006
Australia
$’000
New Zealand
$’000
United States of America
$’000
France
$’000
Germany
$’000
Consolidated
$’000
Rental and other property income 498,281 8,595 156,620 – – 663,496Segment assets 6,292,518 102,125 1,892,895 – – 8,287,538Acquisitions of investment properties – 102,599 53,194 – – 155,793Additions to property plant and equipment 109,932 – 36,646 – – 146,578
note 38. reconciliation of net profit/(loss) to net cash inflow from operating activities
Consolidated Parent Entity
2007$’000
2006$’000
2007$’000
2006$’000
Net profit 1,210,791 1,066,385 443,857 401,219Capitalised interest (14,639) (10,488) (3,746) (5,627)Depreciation 2,488 1,023 – –Net increment on revaluation of investments (831,330) (686,490) (307,406) (285,490)Share of net profits of associates accounted for using the equity method (17,549) (5,036) – –Net fair value gain of derivatives (50,873) (73,271) (8,260) (15,349)Net gain on sale of investment properties (3,809) (1,487) (15) (109)Profit on sale of inventories (481) – – –Net foreign exchange (gain)/loss (1,027) 10,772 (32,301) 3,508Provision for doubtful debts 640 635 408 (11)Impairment of goodwill – 3,287 – –Change in operating assets and liabilities
(Increase)/decrease in receivables (120,872) (1,412) 2,203 (13,205)(Increase)/decrease in prepaid expenses (1,853) 368 (1,212) 845Decrease in other non-current assets – investments 41,229 1,209 21,867 26,828Decrease in other current assets 113 3,098 – –Decrease/(increase) in other non-current assets 30,115 (2,384) (53) 1,776Increase/(decrease) in payables 768 6,267 (4,748) 2,317Decrease/(increase) in other current liabilities 351 (655) – (1,880)Increase in other non-current liabilities 43,620 16,204 24,647 7,622Increase in deferred tax liabilities 32,053 – – –
Net cash inflow from operating activities 319,735 328,025 135,241 122,444
www.global-reports.com

124 DB RREEF Trust Financial Reports 2007
note 39. non-cash financing and investing activities
Note(s)
Consolidated Parent Entity
2007$’000
2006$’000
2007$’000
2006$’000
Distributions reinvested 28 145,328 94,793 57,382 34,284
note 40. earnings per unit
(a) basic earnings per unit on profit attributable to equity holders of the parent entity
Consolidated Parent Entity
2007Cents
2006Cents
2007Cents
2006Cents
15.62 14.39 15.53 14.47
(b) diluted earnings per unit on profit attributable to equity holders of the parent entity
Consolidated Parent Entity
2007Cents
2006Cents
2007Cents
2006Cents
15.62 14.39 15.53 14.47
(c) basic earnings per unit on profit attributable to stapled security holders
Consolidated
2007Cents
2006Cents
40.90 36.44
(d) diluted earnings per unit on profit attributable to stapled security holders
Consolidated
2007Cents
2006Cents
40.90 36.44
(e) reconciliation of earnings used in calculating earnings per unit
Consolidated Parent Entity
2007$’000
2006$’000
2007$’000
2006$’000
Net profit 1,210,791 1,066,385 443,857 401,219Net profit attributable to equity holders of other entities stapled to DDF (minority interests) (722,441) (611,417) – –Net profit attributable to other minority interests (41,972) (56,043) – –
Net profit attributable to the unitholders of the Trust in calculating basic and diluted earnings per unit 446,378 398,925 443,857 401,219
(f) weighted average number of units used as a denominator
Consolidated Parent Entity
2007 2006 2007 2006
Weighted average number of units outstanding used in the calculation of basic and diluted earnings per unit 2,857,716,193 2,772,613,360 2,857,716,193 2,772,613,360
notes to the financial statements (continued)
www.global-reports.com

DB RREEF Trust Financial Reports 2007 125
directors’ declaration
The Directors of DB RREEF Funds Management Limited as Responsible Entity of DB RREEF Diversified Trust (the Trust) declare that the Financial Statements and notes set out on pages 67 to 124:
(i) comply with applicable Australian Equivalents to International Financial Reporting Standards, the Corporations Regulations 2001 and other mandatory professional reporting requirements; and
(ii) give a true and fair view of the Trust’s and consolidated entity’s financial position as at 30 June 2007 and of their performance, as represented by the results of their operations and their cash flows, for the year ended on that date.
In the Directors’ opinion:
(a) the Financial Statements and notes are in accordance with the Corporations Act 2001;
(b) there are reasonable grounds to believe that the Trust and its consolidated entities will be able to pay their debts as and when they become due and payable; and
(c) the Trust has operated in accordance with the provisions of the Constitution dated 15 August 1984 (as amended) during the year ended 30 June 2007.
The Directors have been given the declarations by the Chief Executive Officer and Acting Chief Financial Officer required by section 295A of the Corporations Act 2001.
This declaration is made in accordance with a resolution of the Directors.
Christopher T BeareChair
Sydney27 August 2007
www.global-reports.com

126 DB RREEF Trust Financial Reports 2007
independent auditor’s report
www.global-reports.com

DB RREEF Trust Financial Reports 2007 127
www.global-reports.com
128 DB RREEF Trust Annual Report 2006
investor information
www.global-reports.com

DB RREEF Trust Annual Report 2007 129
DB RREEF Trust informationInvestors and other interested people may obtain information on various aspects of DB RREEF Trust’s activities via our website at www.dbrreef.com/drt
Information available includes:
ASX announcements;
periodic reports and presentations;
distribution and tax information;
corporate governance; and
research.
security registryIf you have administrative enquiries such as change of address or the way in which you wish your distributions paid, you can either contact Link Market Services on the InfoLine 1800 819 675 or update your account details via our website at www.dbrreef.com/drt
enquiries, obtaining information or making a complaintDB RREEF has processes in place to deal with security holder questions and complaints. If you have any questions, complaints, or wish to obtain information regarding the stapled securities, please contact our client service InfoLine on 1800 819 675 or from outside Australia +61 2 8280 7126, or email: [email protected]
DB RREEF is a member of the Financial Industry Complaints Service Limited (FICS). This is an independent dispute resolution service and may be contacted through:
Financial Industry Complaints Service LimitedPO Box 579Collins Street WestMelbourne VIC 8007
Phone: 1300 780 808Fax: +61 3 9621 2291
stock exchange listingThe stapled security (ASX:DRT) is included in the top 200 listed entities in Australia in terms of market capitalisation and currently forms part of the following indices:
All Ordinaries;
All Industrials;
Listed Property Trusts; and
the S&P/ASX200.
n
n
n
n
n
n
n
n
n
taxation information
annual tax statement
After the end of each financial year you will receive a tax statement. This statement summarises the distributions paid to you during the year and includes information required to complete your tax return.
DB RREEF Trust capital gains taxation cost base information
A brochure called “Capital Gains Taxation Information” has been prepared for DB RREEF Trust stapled security holders (updated as at 30 June 2007) that will assist holders to determine the capital gains tax cost base of their DB RREEF Trust securities and any capital gains on the disposal of their securities. Holders may obtain a copy of this brochure by visiting our website at www.dbrreef.com/drt
apportionment percentages of DB RREEF Trust stapled securities
Apportionment percentages for DB RREEF Trust stapled securities can be obtained by visiting the tax information page on our website at www.dbrreef.com/drt
tax file number
You are not required by law to provide your tax file number, Australian Business Number or Exemption. However if you do not provide your TFN, ABN or Exemption, withholding tax at the highest marginal rate, currently 48.5 percent may be deducted from income distributions paid to you. If you have not supplied this information and wish to do so, please advise the registry or your sponsoring broker.
www.global-reports.com
130 DB RREEF Trust Annual Report 2007
investor information (continued)
distribution history and timetableDistribution history schedules for DB RREEF Trust since October 2004 and DDF, DIT, DOT prior to October 2004 can be downloaded by visiting our website at www.dbrreef.com/drt
With respect to your distributions, you can have your distribution paid directly into your nominated Australian bank, building society or credit union account. DB RREEF Trust’s distribution periods end on 30 June and 31 December each year with distributions being paid no later than two months following each period end.
The timetable below shows the anticipated distribution, banking and mailing dates for the next two distributions. Please note that these dates are indicative and may change.
Distribution period date Announcement date Ex-distribution date Record date Anticipated date
1 July 2007 to 31 December 2007 18 December 2007 21 December 2007 31 December 2007 29 February 20081 January 2008 to 30 June 2008 19 June 2008 24 June 2008 30 June 2008 29 August 2008
distribution reinvestment plan (DRP)DB RREEF Trust has a distribution reinvestment plan available to security holders providing them the opportunity to purchase additional stapled securities by reinvesting all or part of their income distributions. The amount to be reinvested will be applied to acquire fully paid stapled securities in DB RREEF Trust. Where the amount to be reinvested does not equal a whole multiple of the DRP issue price the residual money will be carried forward and added to the next reinvestment amount. For further information on the DRP please go to our website at www.dbrreef.com/drt
unpresented cheques and unclaimed fundsDB RREEF Trust has a number of security holders who have unpresented cheques and/or unclaimed funds. If you believe you have unpresented cheques or unclaimed funds please contact our Share Registry, Link Market Services on 1800 819 675. Link Market Services will complete a search for you and assist you in recovering your funds for up to a seven year period. For outstanding monies after that time, you should contact the NSW Office of State Revenue on 1300 366 016 or go to their website at www.osr.nsw.gov.au and use their search facility for unclaimed moneys.
www.global-reports.com

top 20 stapled security holders as at 31 August 2007
Rank Investor Balance Percentage of issued capital (%)
1 HSBC Custody Nominees (Australia) Limited 556,060,803 18.962 J P Morgan Nominees Australia Limited 446,930,448 15.243 National Nominees Limited 296,898,303 10.134 ANZ Nominees Limited <Cash Income A/C> 260,643,370 8.895 Citicorp Nominees Pty Limited 197,042,217 6.726 RBC Dexia Investor Services Australia Nominees Pty Limited <APN A/C> 151,831,426 5.187 Merrill Lynch (Australia) Nominees Pty Limited 138,838,291 4.748 Cogent Nominees Pty Limited 49,734,673 1.709 AMP Life Limited 48,599,261 1.6610 Citicorp Nominees Pty Limited <CFS WSLE Property Secs A/C> 45,044,767 1.5411 Questor Financial Services Limited <TPS RF A/C> 34,808,364 1.1912 Cogent Nominees Pty Limited <SMP Accounts> 34,638,042 1.1813 ANZ Nominees Limited<Income Reinvest Plan A/C> 33,499,046 1.1414 Bond Street Custodians Limited <ENH Property Securities A/C> 22,701,785 0.7715 Citicorp Nominees Pty Limited <CFSIL CFS WS INDX Prop A/C> 14,160,643 0.4816 UBS Nominees Pty Ltd 12,174,116 0.4217 Suncorp Custodian Services Pty Limited<PRT> 10,936,517 0.3718 Queensland Investment Corporation 10,630,515 0.3619 Bond Street Custodians Limited <Property Securities A/C> 10,157,285 0.3520 Australian Executor Trustees Limited <No 1 Account> 10,156,694 0.35
Total for top 20: 2,385,486,566 81.36
Total other holders 546,579,452 18.64
Total all holders 2,932,066,018 100.00
substantial holders as at 31 August 2007The names of substantial holders, who at 31 August 2007, have notified the Responsible Entity in accordance with Section 671B of the Corporations Act 2001 are:
Name Number of stapled securities Percentage voting (%)
CBA Group 144,768,443 5.00ING and related entities 186,156,424 6.43APN Funds Management Limited 138,195,694 5.00Barclays Global Investors and related entities 256,479,590 9.27
class of securitiesDB RREEF Trust has one class of stapled security trading on the ASX with 24,554 investors holding 2,932,066,018 stapled securities at 31 August 2007.
spread of stapled securities at 31 August 2007
Ranges Investors Securities Percentage of issued capital (%)
1 to 1,000 1,423 555,781 0.021,001 to 5,000 4,581 14,808,762 0.515,001 to 10,000 6,250 47,626,331 1.6210,001 to 100,000 11,928 289,471,199 9.87100,001 and over 372 2,579,603,945 87.98
Total 24,554 2,932,066,018 100.00
At 31 August 2007, the number of security investors holding less than a marketable parcel of 249 securities ($2.010) is 622 and they hold 47,628 securities.
voting rightsAt meetings of the security holders of the DB RREEF Diversified Trust, DB RREEF Industrial Trust, DB RREEF Office Trust and DB RREEF Operations Trust, being the Trusts that comprise DB RREEF Trust, on a show of hands, each security holder of each Trust has one vote. On a poll, each security holder of each Trust has one vote for each dollar of the value of the total interests they have in the Trust.
the number and class of securities that are restricted or subject to voluntary escrowThere are no stapled securities that are restricted or subject to voluntary escrow.
on-market buy-backDB RREEF Trust has no on-market buy-back currently in place.
registry information
DB RREEF Trust Annual Report 2007 131
www.global-reports.com

DB RREEF Diversified TrustARSN 089 324 541
DB RREEF Industrial TrustARSN 090 879 137
DB RREEF Office TrustARSN 090 768 531
DB RREEF Operations TrustARSN 110 521 223
responsible entity
DB RREEF Funds Management LimitedABN 24 060 920 783
registered office of responsible entity
Level 9, 343 George StreetSydney NSW 2000
PO Box R1822Royal Exchange NSW 1225
Phone: +61 2 9017 1100Fax: +61 2 9017 1101
directors of the responsible entity
Christopher T Beare, ChairElizabeth A Alexander AM
Barry R BrownjohnStewart F Ewen OAM
Victor P Hoog AntinkCharles B Leitner III (Alternate: Andrew J Fay)Brian E Scullin
secretaries of the responsible entity
Tanya L CoxJohn C Easy
investor enquiries
InfoLine: 1800 819 675
Phone: +61 2 8280 7126
Email: [email protected]
Website: www.dbrreef.com
auditors
PricewaterhouseCoopersChartered Accountants201 Sussex StreetSydney NSW 2000
security registry
Link Market Services LimitedLevel 12, 680 George StreetSydney NSW 2000
Locked Bag A14Sydney South NSW 2000
Phone: +61 2 8280 7126InfoLine: 1800 819 675Fax: +61 2 9261 8489Email: [email protected]: www.linkmarketservices.com.au
directory
For inquiries regarding your holding you can either contact the Security Registry, or access your holding details via the web at www.dbrreef.com and follow the links.
Listed on the Australian Stock Exchange ASX Code: DRT.
InfoLine 1800 819 675 Monday to Friday between 8.30am and 5.30pm (Sydney time).
132 DB RREEF Trust Annual Report 2007
www.global-reports.com

Consistent with DB RREEF’s commitment to sustainability, this report is printed with soy inks on an Australian made paper, manufactured under the highest level of international environmental standards. The paper pulp is Elemental Chlorine Free (ECF) and is sourced from sustainable forests. The principal energy source (92 percent) of the mill is hydroelectric and wind farm and waste from the mill is recycled for compost. The mill is certified under ISO14001 environmental management systems.
www.global-reports.com

www.dbrreef.com
www.global-reports.com