Embed Size (px)
Citation preview


DAYTRADINGOPTIONS

This page intentionally left blank
DAYTRADINGOPTIONS
Profiting from Price Distortions
in Very Brief Time Frames
Jeff Augen

Vice President, Publisher: Tim MooreAssociate Publisher and Director of Marketing: Amy NeidlingerExecutive Editor: Jim BoydEditorial Assistant: Myesha GrahamOperations Manager: Gina KanouseSenior Marketing Manager: Julie PhiferPublicity Manager: Laura CzajaAssistant Marketing Manager: Megan ColvinCover Designer: Chuti PrasertsithManaging Editor: Kristy HartProject Editor: Betsy HarrisCopy Editor: Cheri ClarkProofreader: Kathy RuizSenior Indexer: Cheryl LenserSenior Compositor: Gloria SchurickManufacturing Buyer: Dan Uhrig
© 2010 by Pearson Education, Inc.Publishing as FT PressUpper Saddle River, New Jersey 07458
This book is sold with the understanding that neither the author nor the publisher is engaged inrendering legal, accounting, or other professional services or advice by publishing this book.Each individual situation is unique. Thus, if legal or financial advice or other expert assistanceis required in a specific situation, the services of a competent professional should be sought toensure that the situation has been evaluated carefully and appropriately. The author and thepublisher disclaim any liability, loss, or risk resulting directly or indirectly, from the use orapplication of any of the contents of this book.FT Press offers excellent discounts on this book when ordered in quantity for bulk purchases orspecial sales. For more information, please contact U.S. Corporate and Government Sales, 1-800-382-3419, [email protected]. For sales outside the U.S., please contactInternational Sales at [email protected].
Company and product names mentioned herein are the trademarks or registered trademarks oftheir respective owners.
All rights reserved. No part of this book may be reproduced, in any form or by any means,without permission in writing from the publisher.
Printed in the United States of America
Third Printing: December 2011
ISBN-10: 0-13-702903-9ISBN-13: 978-0-13-702903-7
Pearson Education LTD.Pearson Education Australia PTY, LimitedPearson Education Singapore, Pte. Ltd.Pearson Education North Asia, Ltd.Pearson Education Canada, Ltd.Pearson Educatión de Mexico, S.A. de C.V.Pearson Education—JapanPearson Education Malaysia, Pte. Ltd.
Library of Congress Cataloging-in-Publication Data
Augen, Jeffrey.
Day trading options : profiting from price distortions in very brief time frames / Jeff Augen.
p. cm.
ISBN-13: 978-0-13-702903-7 (hardback : alk. paper)
ISBN-10: 0-13-702903-9
1. Options (Finance)—United States. 2. Options (Finance) 3. Day trading (Securities) 4.Stock price forecasting. 5. Investment analysis. I. Title.
HG6024.A3A9217 2010
332.64—dc22
2009025835
On April 12, 1938, six thousand people crowdedinto Grand Central Station to watch Richard
Whitney, former President of the New York StockExchange, being escorted off to Sing Sing prison
by armed guards…On June 29, 2009, applause rang out in a
Manhattan courtroom as former NASDAQChairman, Bernard Madoff, was sentenced to 150
years in prison for engineering the largest Ponzi scheme in history…
This book is dedicated to the thousands of peoplewho, over the years, have lost all their money to
investment frauds. Serious investing is bothcomplex and time consuming. There are no
shortcuts—including letting others invest for you.

This page intentionally left blank
Contents
Preface..................................................................xiii
Chapter 1: Basic Concepts ....................................1
The Case for Short-Term Trading ........................1Recent Changes in the Options Market Support
Day Trading ......................................................8Unstable Markets Provide Unique Advantages
to Option Traders ............................................10Technical Analysis, Technical Indicators,
and Price Distortions........................................26Endnotes ............................................................33
Chapter 2: New Directions in Automated Trading ..............................................35
Key Concepts......................................................35High-Performance Computing and Market
Efficiency..........................................................36A Simple Illustration ..........................................42Testing the Market’s Efficiency ..........................45Fooled by Randomness ......................................67Insider Trading ..................................................73Summary ............................................................76Further Reading..................................................78Endnotes ............................................................79

Chapter 3: Trading Volatility Distortions ............81
Key Concepts......................................................81Introduction—The Implied Volatility Surface ....82Calculating Fair Volatility ..................................88Parsing Price Changes by Weekday ....................99Trading Volatility Distortions ..........................106Alternate Trade Structures—Backspreads ........117Volatility and Price Spike Distribution..............127Summary ..........................................................128Endnotes ..........................................................129
Chapter 4: Working with Intraday Price Spike Charts ....................................131
Key Concepts....................................................131Introduction—A New Charting Tool................132Basic Calculations ............................................134Price Spikes at the Single-Minute Level ............142Examples of Ultra-Short-Term Volatility
Swings ............................................................147Summary ..........................................................156
Chapter 5: Special Events ..................................157
Key Concepts....................................................157Introduction ....................................................158Unavoidable Volatility Distortions....................160Event Trading ..................................................163Summary ..........................................................167Endnotes ..........................................................168
Index ..................................................................169
viii Day Trading Options
Acknowledgments
I’d like to thank the team that helped pull the booktogether. First and foremost is Jim Boyd who pro-vided the opportunity and was willing to publish a
new topic with an unusual focus.
Writing is easy. Making charts and tables is alsoeasy. Creating a publication-quality book, however, is adifferent matter. Once again it has been my pleasure towork with Betsy Harris who was responsible for creat-ing a final edited production document. In that regard Iwould also like to thank Cheri Clark who read everyword and found many subtle and important mistakes.
Finally, I would like to acknowledge the excellentwork of the Pearson marketing team and especiallyJulie Phifer and Laura Czaja who always seem willingto put real thought behind new book concepts.
Writing this book has been a real privilege because itallowed me to focus on controversial topics during avery unique time in financial history. Working with ateam of focused professionals made the project possible.

This page intentionally left blank

About the Author
Jeff Augen, currently a private investor and writer,has spent more than a decade building a uniqueintellectual property portfolio of databases, algorithms, and associated software for technical
analysis of derivatives prices. His work, which includesmore than a million lines of computer code, is particularly focused on the identification of subtleanomalies and price distortions.
Augen has a 25-year history in information technology. As a cofounding executive of IBM’s LifeSciences Computing business, he defined a growth strategy that resulted in $1.2 billion of new revenue and managed a large portfolio of venture capital investments. From 2002 to 2005, Augen was Presidentand CEO of TurboWorx Inc., a technical computingsoftware company founded by the chairman of theDepartment of Computer Science at Yale University. Hisbooks include Trading Options at Expiration, TheOption Trader’s Workbook, and The Volatility Edge inOptions Trading. He currently teaches option tradingclasses at the New York Institute of Finance.

This page intentionally left blank

xiii
Preface
It is only fitting and proper that I write these wordswith a 1929 Conklin fountain pen—a gift from mywife. Most writers prefer a computer. I suppose that
makes sense since it’s where the words ultimately endup as a string of ones and zeros, but for me it’s theConklin. This pen has seen it all: the crash of ‘29, thegreat depression, World War II, Korea and Vietnam, thefirst Gulf War, another crash in 1987, Long TermCapital, 9/11 and the recession and war that followed,NASDAQ boom, NASDAQ bust, and most recently,the 2008–2009 banking crisis. I have a high level ofrespect for this old pen, and I’m always amazed at howsmoothly it glides across the page as it undoubtedly did80 years ago. Maybe there’s a message in that effortlessglide. Maybe some things never change.
Everyone knows that the market crashed in 1929.Back in those days, the private investor didn’t havemuch of a chance. Big time stock manipulators droveprices into the stratosphere by selling to each other.When the price climbed high enough that the averageinvestor finally jumped in, they dumped their stock, col-lected the profit, and watched the collapse. As always,the little guy took the hit because he was playing a gamethat he didn’t understand.
Eighty years later, the game remains remarkablyunchanged. The recent crash serves as a terrific illustra-tion. Investment banks built high-risk portfolios ofmortgage-backed derivatives, money poured in, bonuses

flowed like water, and when it all collapsed the generalpublic picked up the tab. Smart investors who saw thecollapse coming and shorted the market lost money asthe bubble inflated. Those who stayed in the marketwatched their money evaporate when the bubble burst.But many private investors—including the author of thisbook—did just fine. For the most part, they tended to bestudents of both the economy and the financial mar-kets—active traders armed with a trading platform,charting software, and access to live news feeds.
These investors often believe that they can level theplaying field by working hard and staying one stepahead of the market with a combination of the latestsoftware and news sources. They often follow a combi-nation of fundamental and technical indicators thatinclude analyst statements, earnings reports, companynews, insider transactions, short interest, and a few dif-ferent types of price charts. Unfortunately, even thesmartest and most diligent traders are further back inthe pack than they might think. That is because thepack includes corporate insiders with much better infor-mation and institutional investors/analysts with directaccess to the companies they invest in. Consider, forexample, IBM—a heavily traded blue chip stock fol-lowed closely by many analysts and a large investmentcommunity. Between January 2008 and the end of May2009 when these words were written, the average trans-action price for IBM stock was $103.21. However, IBMinsiders whose trades are publicly disclosed realized anaverage price of $122.65 in the open market—a 19%improvement.1
The difference is surprising because insiders arerestricted with regard to when they can sell stock; in this
xiv Day Trading Options

sense they are disadvantaged and might be expected to realize a lower average selling price. Lifting allrestrictions, therefore, might cause the gap to wideneven further.
In either case the point is clear. A private investorwith some charting software and a few analyst reportsis no match for corporate insiders who know consider-ably more about their own company than the generalpublic. The same private investor must also lose to largeinstitutional analysts who have access to the companiesthey write about. Analysts routinely visit these compa-nies and meet with key executives before writing theirreports. Furthermore, their reports are proprietary andare often made available to a restricted group of sub-scribers or large clients of a particular brokerage. Theplaying field cannot be level when all investors do nothave access to the same information.
Many investors who realize that they are operatingat an information disadvantage avoid strategies thatdepend on fundamental business analysis and, instead,focus on purely technical approaches. Today’s tradingplatforms accommodate this thinking with very sophis-ticated analytical tools. Dozens of technical indicatorsare available in addition to scripting languages thatallow investors to create and test their own. Most plat-forms also allow automatic order entry based on a pre-defined set of rules. Serious traders can chartinformation in a variety of time frames and simultane-ously analyze this information with different indicators.When a signal appears, their software can instantlyplace a trade without asking for confirmation. It wouldseem that such systems might have the potential to levelthe playing field for the private investor.
xvPreface
Unfortunately, the capability gap between institu-tional and private investors is even larger on the techni-cal side than it is on the fundamental side; thatdifference is growing rapidly. During the past few years,computerized algorithmic trading systems have becomethe dominant force in most financial markets, and theirsophistication exceeds anything available to the generalpublic. Technical traders must now compete with super-computers that process millions of data items each sec-ond and make investment decisions at the individual“tick” level. Such systems instantly identify and exploitemerging trends with the effect of extinguishing themalmost as fast as they appear. Unfortunately for the pri-vate investor, this new dynamic has completely invali-dated many approaches to technical analysis thatworked well just a couple of years ago.
These changes are a logical evolution of the randomwalk hypothesis described by Burton Malkiel in his1973 book entitled A Random Walk Down Wall Street.Simply stated, the random walk hypothesis asserts thatthe evolution of market prices cannot be predicted—that is, the recent price history of a stock does not con-tain information that can be used to predict its future.The random walk concept is built on an important setof assertions known as the efficient market hypothesis(EMH). EMH predicts that such inefficiencies cannotpersist. It was first proposed by Eugene Fama in hisPh.D. thesis at the University of Chicago GraduateSchool of Business in the early 1960s. Since that time,there have been many debates between proponents ofthe theory and investors who believe that they can iden-tify chart patterns with predictive power. However, fora chart pattern to have predictive power, it must also be
xvi Day Trading Options

persistent in the sense that the market cannot learn thepattern and eliminate it. Today’s institutional tradingsystems settle any remaining argument by removingmarket inefficiencies at the millisecond level. The ran-dom walk model described by Burton Malkiel in hisbook assumes that stock price changes are tantamountto coin tosses. Our discussion will build on that conceptby “over fitting” a technical indicator to a randomlygenerated stock chart and generating a set of rules thatproduce a surprisingly large return. The discussion ismeant to illustrate the ease with which investors can befooled by randomness.
Despite the disadvantages mentioned above, privateoption traders can profit in today’s environment byentering and exiting the market at very specific timeswith trades that are structured to capitalize on well-characterized pricing anomalies and distortions. Theseopportunities exist, in part, because contemporaryoption pricing models assume continuous trading eventhough markets are closed over the weekend and from4:00 PM to 9:30 AM each evening.
An efficient market can be expected to respond tothese dynamics with price changes that comprehend thedown time. Today’s option market does just that byvarying the implied volatility priced into option con-tracts to compensate for the distortions. These varia-tions represent profit opportunity to an option traderand, as we shall see, the opportunity can become verylarge under certain circumstances. In this regard, wewill review new approaches that separately measureovernight, intraday, and traditional volatility. These dif-ferences make it possible to capitalize on short-termanomalies where volatility is misrepresented in an
xviiPreface

option price. Finally, news events often introduce briefdistortions that take many minutes for the market todigest. During these brief time frames the marketbecomes inefficient and new opportunities arise for theshort-term trader. We will capitalize on these opportu-nities with a new technical indicator that can be used toquantify rising or falling volatility.
Investors who believe they have a trading systemthat consistently beats the market in all circumstancesshould read no further. This book was not written forthem. It was written for investors who are seeking a dif-ferent approach and are willing to work very hard toperfect new trading strategies. My goal was to find away to narrow the performance gap that has plaguedprivate investors since financial markets first opened.
Endnotes1. Volume adjusted prices (VAP) were used to obtain
maximum accuracy. Each transaction price wasmultiplied by the number of shares traded; resultswere summed and ultimately divided by the volumeover the entire time frame. For the public market,each day’s volume adjusted price was calculatedusing the average of the high+low and the day’s vol-ume. Insider trades are those reported on SEC form4 and made available through Edgar Online. Thesetransactions are readily available through manyweb-based sources including Yahoo! Finance.
xviii Day Trading Options
The Case for Short-Term Trading
This book is a product of one of the most challeng-ing times in world financial history. Statedbluntly, the world’s financial markets have
become a gambling casino where equity, bond, com-modity, and currency prices have virtually no pre-dictable direction. Stock prices have becomeparticularly unstable in the sense that they have virtu-ally no relationship to the underlying performance ofthe company they represent. In the very week thesewords were written, the Dow fell 330 points onTuesday, rallied 280 points on Wednesday, and fellanother 250 points just after the open on Thursdaymorning. Worse still, the collapse on Tuesday wascaused by a sell-off in financial stocks—the very stocksthat fueled the rally the following day.
At the time of this writing, trillions of dollars hadbeen lost by both bulls and bears. The markets wereoften described by both the financial press and nationalpoliticians as being in a “meltdown” with no end insight. Investors who have never experienced a crashing
1
Chapter 1
Basic Concepts
market often believe that it is easy to generate profits inthis environment with short positions. The result hasbeen a new generation of exchange traded funds (ETFs)designed to rise when specific classes of investments fall.There are ETFs that short gold, oil, bonds, indexes, andequities in various sectors. Many are labeled “ultra-short” because they are structured to rise at twice therate of decline of the underlying instruments. Theseinvestments are available to anyone with a brokerageaccount or an IRA and, unlike with traditional shortpositions, no margin is required. An investor can read-ily use these vehicles to short homebuilders, retailstores, banks, or just about any group of stocks,indexes, or financial instruments desired.
Many investors take a more precise approach bysimply selling short financial instruments that theyexpect to decline in value. Markets move in both direc-tions, and experienced investors recognize that moneycan be made on both sides. In bull markets they ownstocks, and in bear markets they are often short thesame stocks. Many investors prefer bear marketsbecause the declines are often much steeper than theincreases associated with a traditional bull market.Stated differently, markets can crash down but theyrarely crash up.
These dynamics could easily lead to the mistakenconclusion that it is relatively easy to profit from a bearmarket by simply shorting distressed companies, sec-tors, or broad indexes that were previously overbought.Unfortunately, nothing is ever that simple. The2008–2009 collapse included single-day bear market
2 Day Trading Options

rallies as large as 11%—large enough to destroy virtu-ally any short position. Many investors were fooled intobelieving that these rallies represented a market bottomand the beginning of a long-term recovery. They oftentook losses on their short positions by closing them andgoing long just in time for the next leg down of the market.
The answer lies in reducing market exposure bytrading in very brief time frames. This approach flies inthe face of conventional “buy and hold” wisdom.However, that approach has failed miserably because,as a group, investors have lost all their profits of thepast decade. On January 22, 2009, the S&P 500 tradedat its May 15, 1997, level. Subtracting an additional30% for inflation and dollar devaluation paints an evendarker, but more realistic, picture. Unfortunately, fartoo many investors have taken the wrong approach byremaining in the market with a portfolio of investmentswhether they were winning or losing. This approach hasits own familiar vocabulary built around terms like“value investing,” “diversification,” and the all-too-familiar “buy and hold.” As a group, long-term stockinvestors have suffered the greatest destruction ofwealth in the history of the world.
Commodity traders face similar problems. In thebrief time frame of just one year, both bulls and bearslost significant amounts of money as the price gained50% from January to July 2008 before rapidly falling72% to close the year below $40. Figure 1.1 traces theprice from early January 2007 to early January 2009.
3Basic Concepts

FIGURE 1.1 Weekly Brent Blend spot price (USD) 2007/01/05to 2009/01/05. Price is displayed on the y-axis, date on the x-axis.Source: U.S. Department of Energy, Energy Information Agency—http://www.eia.doe.gov.
As always, timing is everything. But the more impor-tant lesson is that blindly hanging on with a bullish orbearish view is a flawed strategy. Every investment hasa window of opportunity; unless that window can beidentified, leaving the money invested is somewhat likegambling. That said, the window can be relativelylong—sometimes spanning months or years.
Option trading in turbulent times can also be diffi-cult. Implied volatilities rise sharply, making simple longput or call positions unreasonably expensive, and therisks associated with naked short positions are simplytoo large for any conservative investor. Structured posi-tions, such as calendar spreads, ratios, and verticalspreads, are difficult to trade because stocks frequentlycross several strike prices in a single month—sometimesin both directions.
4 Day Trading Options
20
40
60
80
100
120
140
5-Ja
n-07
5-M
ar-0
7
5-M
ay-0
7
5-Ju
l-07
5-Sep
-07
5-Nov
-07
5-Ja
n-08
5-M
ar-0
8
5-M
ay-0
8
5-Ju
l-08
5-Sep
-08
5-Nov
-08
5-Ja
n-09

Investors can avoid all these pitfalls by entering themarket at very specific times and structuring trades thatcapitalize on well-characterized pricing anomalies anddistortions. Option traders can use these distortions tostructure positions that are both statistically advantagedand direction neutral. The most popular example beinglong straddles that have the potential to generate profitfrom a large price change in either direction. Investorswho structure day trades that take advantage of thesechanges can generate more profit in one day than mostexperienced investors realize in an entire month—some-times an entire year.
Unlike other trading strategies that are linked—sometimes in subtle ways—to a specific set of marketconditions, options day trading focuses only on theunderlying mathematics. It does not rely on any finan-cial predictions, company results, or market direction.In this context a day trader manages ticker symbols andstrike prices because the name or business of the under-lying stock is mostly irrelevant. But nothing worthdoing is ever easy. Trading subtle price distortions in theoptions market is a complex affair that requires anunusual blend of pricing knowledge and trading skill.Day trading is a mathematical game distinctly differentfrom stock picking. Its potential gains, however, areenormous—far greater than those of any “long-term”strategy.
That said, short-term trading strategies can also besimple. It is often possible to simply trade the news. Forexample, on March 30, 2009, the president of theUnited States, Barack Obama, bluntly rejected turn-around plans submitted by General Motors Corp. and
5Basic Concepts

Chrysler LLC, and demanded fresh concessions forlong-term federal aid. He also raised the possibility ofbankruptcy for either or both of the ailing auto giants.While the content of the speech could not have beenknown in advance, the fact that the speech was sched-uled was announced before the market close on Friday,March 27. In addition, statements made over the week-end by Treasury Secretary Timothy Geithner furtherunderscored investor fear that the financial industry’stroubles were far from over. He stated that severalbanks would likely need considerably more money tosurvive. Once again the timing of the statement, but notthe content, was widely known before the market closeon Friday.
A short-term trader who anticipated that theseevents would have a large impact on the market couldhave purchased an at-the-money straddle on the Dowusing the Diamonds Trust exchange traded fund (ticker:DIA).1 At the close on Friday, DIA traded for $77.81and the $78 straddle cost $5.12 ($2.49 call/$2.63 put).Following the negative news on Monday, the Dow fellmore than 4% and DIA traded as low as $74.37. At thelow, the $78 straddle traded for $5.77 ($1.08 call/$4.69put)—a 12.7% gain. Had our trader missed the low andheld on until the close, he would still have realized aprofit by selling the straddle for $5.55.
As we have just seen, options provide a distinctadvantage because they allow the construction of direc-tion-neutral positions. This dynamic distinctly changesthe character of short-term trading. Option traders candecide that a position is underpriced because it does notadequately represent the risk of an upcoming news
6 Day Trading Options

event. This view then forms the basis of a structuredposition that can profit from a large swing in eitherdirection. In our March 30 example, if the news had notgenerated a large market swing, we would have riskedonly a very small amount of weekend time decay in theoption premium. This effect is further diminished fortrades placed near the closing bell because option pricestend to shrink near the close on Friday as the marketdiscounts weekend time decay into the price—that is,implied volatility tends to decrease on Friday afternoon.In broad terms, the trade was relatively riskless and verybrief.
Option day traders can also profit from impliedvolatility swings—a distinct advantage unique to theoptions world. An excellent example arose just as thesewords were being written. The April 2009 expirationweek began on Easter Sunday and the market wasclosed on the preceding Friday—Good Friday. The longweekend was very significant because it representedthree of the remaining seven days in the expirationcycle. Option buyers were predictably hesitant to over-pay for contracts that were about to lose a significantamount of value while the market was closed. Theresult was persistently falling implied volatility from theopen to the close on Thursday, April 9. For example,implied volatility for at-the-money options on Researchin Motion (ticker: RIMM) declined steadily from 65%at the open to 50% at the close. This decline wasentirely predictable; it exactly offset the weekend timedecay so that a return to 65% implied volatility onMonday just restored option prices to their closing val-ues on Thursday. As a result, investors who purchased
7Basic Concepts
RIMM call options at the close on Thursday were notpenalized for the three days that the market remainedclosed.
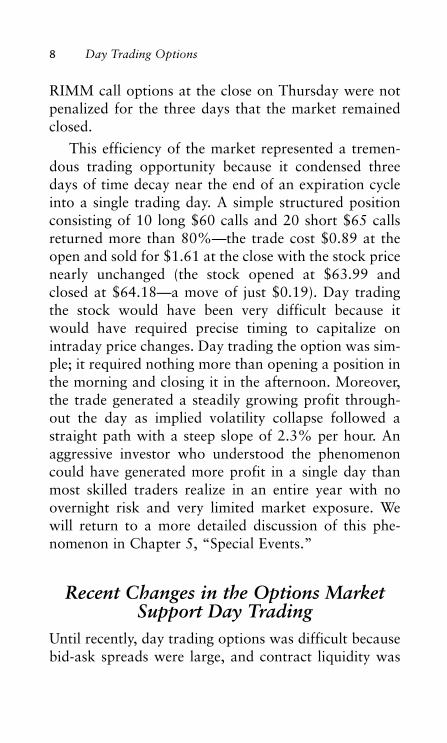
This efficiency of the market represented a tremen-dous trading opportunity because it condensed threedays of time decay near the end of an expiration cycleinto a single trading day. A simple structured positionconsisting of 10 long $60 calls and 20 short $65 callsreturned more than 80%—the trade cost $0.89 at theopen and sold for $1.61 at the close with the stock pricenearly unchanged (the stock opened at $63.99 andclosed at $64.18—a move of just $0.19). Day tradingthe stock would have been very difficult because itwould have required precise timing to capitalize onintraday price changes. Day trading the option was sim-ple; it required nothing more than opening a position inthe morning and closing it in the afternoon. Moreover,the trade generated a steadily growing profit through-out the day as implied volatility collapse followed astraight path with a steep slope of 2.3% per hour. Anaggressive investor who understood the phenomenoncould have generated more profit in a single day thanmost skilled traders realize in an entire year with noovernight risk and very limited market exposure. Wewill return to a more detailed discussion of this phe-nomenon in Chapter 5, “Special Events.”
Recent Changes in the Options MarketSupport Day Trading
Until recently, day trading options was difficult becausebid-ask spreads were large, and contract liquidity was
8 Day Trading Options

often limited. Those dynamics have changed dramati-cally. The markets have deployed penny pricing pro-grams that all but eliminate bid-ask spreads, andoptions volume has soared in recent years. Heavilytraded stocks typically have enough options volume tosupport even the wealthiest private investors creatingmultimillion-dollar positions. Additionally, improve-ments in trading platforms have completely leveled theplaying field between large institutions and private daytraders. An individual sitting at his or her desk at homecan experience the same rapid execution and instantprice updates as the largest institutional investor on thefloor of the exchange. Contemporary trading platformsalso provide access to sophisticated charting tools aswell as the level II trading queue. This level of accessallows a private investor to view the activities of indi-vidual market makers trading on different exchanges,and to take advantage of subtle and fleeting changes inbid-ask spreads. For example, near the end of a briefbut significant rally, buyers often become less aggressiveand lower their bid prices, causing the bid-ask spread towiden. This change is often a better indicator that arally is ending than any identifiable chart pattern. Savvyday traders who watch the level II queue often capital-ize on this opportunity to sell options that quickly losevalue if the stock reverses direction and corrects slightlydownward.
Private investors trading relatively small numbers ofcontracts also have an advantage because their tradesare usually executed using the “best” bid and ask prices.They typically outperform institutional investors whoplace very large trades that cannot be filled from the top
9Basic Concepts

of the queue. The difference affects both pricing andexecution. A private investor sitting in front of a com-puter can open and close small trades consisting of justa few contracts with the simple click of a mouse. Hisinstitutional counterpart trading thousands or tens ofthousands of contracts does not have that luxury.
The distance between strike prices is also importantto option traders. Traditionally the spacing has been setat $2.50 for stocks under $25; $5.00 when the strikeprice is between $25 and $200; and $10.00 for strikesover $200. Each of the exchanges is currently experi-menting with $1.00 spacing for stocks up to $50 and$2.50 spacing for stocks up to $75. Increasing the num-ber of strikes and reducing the spacing makes it easierfor option traders to precisely calibrate their positionstructures. These changes are particularly important today traders as they attempt to structure positions thatprofit from relatively small underlying price changes.Long straddles are an excellent example because theyshould be initiated only with the stock trading close toa strike price where put and call deltas are equal. Daytraders seeking to launch long straddles must often waitfor the right conditions to avoid placing trades with adirectional character. Closer strike price spacing helpssolve this problem by increasing the probability of astock trading at a relatively delta-neutral price.
Unstable Markets Provide UniqueAdvantages to Option Traders
Excessive market turmoil has also changed the dynam-ics of option pricing in three specific ways:
10 Day Trading Options
169
I N D E X
Baxter International Healthcare(BAX), 98
bear markets, short positions in, 2-3
Bear Stearns, 23bid-ask spreads in options day
trading, 8BP, 98break-even point, calculating, 34nbuy-and-hold investment, short-
term trading versus, 3-4
calculatingannualization factor, 94daily volatility, weekday
comparisons, 99-106fair volatility, 88-99historical volatility, 93intraday volatility, 94, 99-106minute-by-minute volatility,
142-147overnight volatility, 94, 99-106ratio trade returns, 120volatility and price instability,
134-142CBOE Volatility Index (VIX), 11,
83, 132charts, distortions in, 42Cognos, 76collateral requirements, 120-122commodity trading, 3currency trading, 59-63
AAAPL (Apple Computer), 39,
46, 63, 102AIG, 24Alcoa Aluminum, 24algorithmic trading systems
entering/exiting trades, randomness and, 67-73
market efficiency and, 26-31,36-42
price distortions and, 31-33public investors versus,
example of, 42, 45Amazon.com (AMZN), 154American Airlines, 74annual volatility, lack of
relationship withminute-by-minutevolatility, 139
annualization factor, 91, 94Apple Computer (AAPL), 39,
46, 63, 102automated trading systems. See
algorithmic trading systems
AutoZone (AZO), 95, 139
B–Cbackspreads, 117-126Bank of America, 23
Page numbers followed by n indicate topics located in endnotes.
170 Index
Ddaily volatility, weekday
comparisons, 99-106day trading options. See options
day tradingDB (Deutsche Bank), 98decreased volatility trends,
example of, 152deep out-of-the-money naked
short options, marginrequirements for, 33n
Deutsche Bank (DB), 98Diamonds Trust, 33ndifferential volatility, 97direction of movement,
predicting, 28-30direction-neutral positions, 6disorderly markets, 133distortions. See also implied
volatility; volatilityin charts, 42exploiting, 31-33high-impact events as, 159news events as, 159predictable distortions, Easter
weekend example, 160-163
timing as, 158
Eearnings announcements, as
distortions, 159Easter weekend example
(predictable distortions),160-163
efficiency. See market efficiencyEnergy Information Agency (EIA)
report, 160, 163-167entering/exiting trades,
randomness and, 67-73
event-based tradingEaster weekend example,
160-163Petroleum Status Report
example, 163-167events, as distortions, 159exiting trades, 67-73
F–G–Hfair volatility, calculating, 88-99foreign exchange markets, market
efficiency and, 59-63forward ratios, 118
Geithner, Timothy, 6Goldman Sachs, 24, 125
options, implied volatility for,12-15
Google, 75
high-impact events, as distortions, 159
high-performance computing. See algorithmic tradingsystems
histograms of price instability,132-134
calculating, 134-142historical volatility
calculating, 93implied volatility versus, 88
IIBM, 75-76implied volatility
advantages to options day trading, 10-25
historical volatility versus, 88implied volatility surfaces, 82-88implied volatility swings, 7-8increased volatility trends,
example of, 150-151
171Index
insider trading, distortions causedby, 73-76
instability. See price instabilityinstitutional investors, private
investors versus, 9intraday volatility
calculating, 94weekday comparisons, 99-106
Intuitive Surgical (ISRG), 109, 147
J–K–LJPMorgan, 23
Lehman Brothers, 23liquidity, market efficiency and, 59lognormal distribution, normal
distribution versus, 135long-term investment, 3-4Lotus Development
Corporation, 75
MMandelbrot, Benoit, 70margin requirements for deep
out-of-the-moneynaked short options,33n. See also collateralrequirements
market efficiencyalgorithmic trading systems
and, 26-31, 36-42foreign exchange markets and,
59-63insider trading distortions,
73-76liquidity and, 59testing, 45-67
markets, orderly versus disorderly, 133
mathematical strategy, optionsday trading as, 5
Merrill Lynch, 23minute-by-minute prices, testing
market efficiency, 45-62minute-by-minute volatility
examples of, 147-152lack of relationship with
annual volatility, 139price instability and, 142-147
The (Mis)behavior of Markets(Mandelbrot), 70
Morgan Stanley, 74movement direction, predicting,
28-30
N–Onews events
as distortions, 159trading on, 5-7
9/11 terrorist attacks, 74normal distribution, lognormal
distribution versus, 135NORMSDIST function (Excel), 33n
Obama, Barack, 5OIH exchange traded fund, 164Options Clearing Corporation
(OCC), 74options day trading
advantages, 1-8direction-neutral positions, 6implied volatility swings, 7-8market support for, 8-10as mathematical strategy, 5structured trades, advantages
in volatile markets, 10-25orderly markets, 133overnight trades, advantages in
volatile markets, 24overnight volatility
calculating, 94weekday comparisons, 99-106

172 Index
PPanera Bread (PNRA), 109Petroleum Status Report example
(event-based trading),163-167
predictable distortions, Easterweekend example, 160-163
predicting direction of movement, 28-30
price distortions. See distortionsprice instability
minute-by-minute volatilityand, 142-147
volatility and, 132-134calculating, 134-142
price spike distribution, volatilityand, 127-128
private investors, institutionalinvestors versus, 9
public investors, algorithmictrading systems versus,42, 45
Q–Rrandomness, technical indicators
and, 67-73ratio trades, calculating returns
for, 120regression toward the mean,
51-55Research in Motion
(RIMM), 161reversal signals, example of,
147-150reversal tendencies, testing
market efficiency, 51-55reversals, 166reverse ratios, 117-126RIMM (Research in Motion), 161rule-based trading systems.
See algorithmic tradingsystems
SS&P 500, 104September 11, 2001 terrorist
attacks, 74short covering rallies, 59short positions in bear
markets, 2-3short squeezes, 167short-term trading, buy-and-hold
investment versus, 3-4.See also options daytrading
short-term volatility. See minute-by-minute volatility;tick-by-tick volatility
skews (implied volatility), 20, 85, 158
smiles (implied volatility), 20, 85, 158
SPDR exchange traded fund, 104SPDR Trust (SPY), 34n, 86standard deviations
1-day price versus 2-day price, 113
as measurement tool, 132statistics, testing market
efficiency, 45-67straddles
backspreads versus, 125profits from, 107-109
stranglesbackspreads versus, 125profits from, 107-109
strike prices, distance between, 10structured trades, advantages in
volatile markets, 10-25surfaces, 82-88

173Index
Ttechnical analysis. See algorith-
mic trading systemstechnical indicators, randomness
and, 67-73term structure (implied volatility
surfaces), 84testing market efficiency, 45-67tick-by-tick volatility, examples
of, 153-154tick-level price changes, market
efficiency and, 63-67time decay, profits from, 106-107timing, as distortion, 158“trade the news,” 5-7trading platforms in options day
trading, 9trading strategies
backspreads, 117-126collateral requirements, 120-122event-based trading, 163-167predictable distortions, Easter
weekend example, 160-163
for volatility distortions, 106-117
trend reversals, 166trends, reasons for persis-
tence, 41
U–VUnited Airlines, 74unstable markets, 10-25
VIX (CBOE Volatility Index), 11,83, 132
volatile markets, advantages ofstructured trades in, 10-25
volatility. See also distortionsannual volatility, lack of
relationship with minute-by-minute volatility, 139
annualization factor, 91calculating, 94
daily volatility, weekday comparisons, 99-106
defining for calculations, 90differential volatility, 97fair volatility, calculating, 88-99historical volatility,
calculating, 93implied volatility surfaces, 82-88intraday volatility
calculating, 94weekday comparisons, 99-106
minute-by-minute volatilityexamples of, 147-152price instability and, 142-147
overnight volatilitycalculating, 94weekday comparisons, 99-106
price instability and, 132-134calculating, 134-142
price spike distribution and,127-128
proportionality to time, 91tick-by-tick volatility, examples
of, 153-154volatility distortions, trading
strategies for, 106-117
W–Zweekday comparisons in
volatility calculations,99-106
Weekly Petroleum Status Report,160, 163-167
Welteke, Ernst, 74
yen carry trade, 31
zero minus ticks, 64zero plus ticks, 64


![TheLATEXGraphics Companion - pearsoncmg.comptgmedia.pearsoncmg.com/images/9780321508928/samplepages/... · The LaTeX Graphics companion / Michel Goossens ... [et al.]. -- 2nd ed](https://img.dokumen.tips/doc/110x75/5b79f3af7f8b9a99718b47c3/thelatexgraphics-companion-the-latex-graphics-companion-michel-goossens.jpg)