Embed Size (px)
Citation preview


1www.10pointer.com 120 DAYS PLANNER IAS 2021 | DAY 43: ECONOMY|
NATIONAL INCOME CONCEPTS AND
METHOD OF CALCULATION
Introduction
Economic growth is an increase in the production of economic goods and services, compared from one period of time to another. It can be measured in nominal or real (adjusted for infl ation) terms. Traditionally, aggregate economic growth is measured in terms of gross national product (GNP) or gross domestic product (GDP), although alternative metrics are sometimes used.
Economic development is the process by which emerging economies become advanced economies. In other words, the process by which countries with low living standards become nations with high living standards. Economic development also refers to the process by which the overall health, well-being, and academic level the general population improves.
National Income
According to Central Statistical Organization, “National income is the sum total of factor incomes earned by normal residents of a country in the form of wages, rent, interest and profi t in an accounting year.”
National Income Accounting (NIA) refers to methods or techniques used to measure the economic activity in the national economy as a whole. As one calculates income at an individual level similar calculation can be done for at the country level as well. NIA is needed for comparing the estimates in the past from those in future and also forecast the growth rates in future. For example, if a country has a GDP of Rs. 103 Lakh which is 3 Lakh rupees higher than the last year, it has a growth rate of 3 per cent.
In economics when a term ‘a growing’ economy is used, it means that the economy is adding up its income in quantitative terms. To fi nd out the level of economic development of a country. It provides useful insight into how well an economy is functioning and where money is being generated and spent. One can compare the standard of living of diff erent nations. It helps to show the rate of growth or development of diff erent nations. It helps in-
Formulate Policies
Eff ective Decision Making
Compare internationally

2 www.10pointer.com120 DAYS PLANNER IAS 2021 | DAY 43: ECONOMY|
Three Measurements of National IncomeNational Income calculated by three ways:
Consider the following while calculating National Income through Value Added Method
Value Added Method (or the Product Method)
The value added or production method is used by economists to calculate GDP at market prices, which is the total values of outputs produced at diff erent stages of production. It needs to be mentioned that caution should be taken to take fi nal Goods and not Intermediate goods, as it will result in Double Counting.
Some of the goods and services included in production are:
Goods and services actually sold in the market.
Goods and services not sold but supplied free of cost. (No Charge/Complementary)
Some of the goods and services not included in production are:
Second hand items and purchase and sale of the same. Sale and purchase of second cars, for example, are not a part of GDP calculation as no new production takes place in the economy.
Production due to unwarranted/ illegal activities.
Non-economic goods or natural goods such as air and water.
Transfer Payments such as scholarships, pensions etc. are excluded as there is income received, but no good or service is produced in return.
> Imputed rental for owner-occupied housing is also excluded.
Income Method This method emphasises on aggregating the payments made by fi rms to households, called factor payments. It is defi ned as total income earned by citizens and businesses of a country.
There are four types of factors of production and four types of factor incomes accordingly i.e. Land, Labour, Capital and Entrepreneur/Organization as Factors of Production and Rent, Wages, Interest and Profi t as Factor Incomes correspondingly.
GDP = Wages+ Interest Income + Rental Income +Profi t +Indirect Taxes-Subsidies+ Depreciation
The term Profi t can be further sub-divided into: profi t tax; dividend to all those shareholders; and retained profi t (or retained earnings).
Such an approach is adopted in India to calculate the contribution of services sector to the economy.
Any income corresponding to which there is no fl ow of goods and services or value added, it should not be included in calculation by Income method.
Expenditure Method
The expenditure method measures the fi nal expenditure on GDP. Amount of Expenditure refers to all spending on currently-produced fi nal goods and services only in an economy. In an economy, there are three main agencies, which buy goods and services. These are: Households, Firms and the Government
This fi nal expenditure is made up of the sum of four expenditure items, namely:
Consumption (C): Personal Consumption made by households, the payment of which is paid by households directly to the fi rms which produced the goods and services desired by the households.
3www.10pointer.com 120 DAYS PLANNER IAS 2021 | DAY 43: ECONOMY|
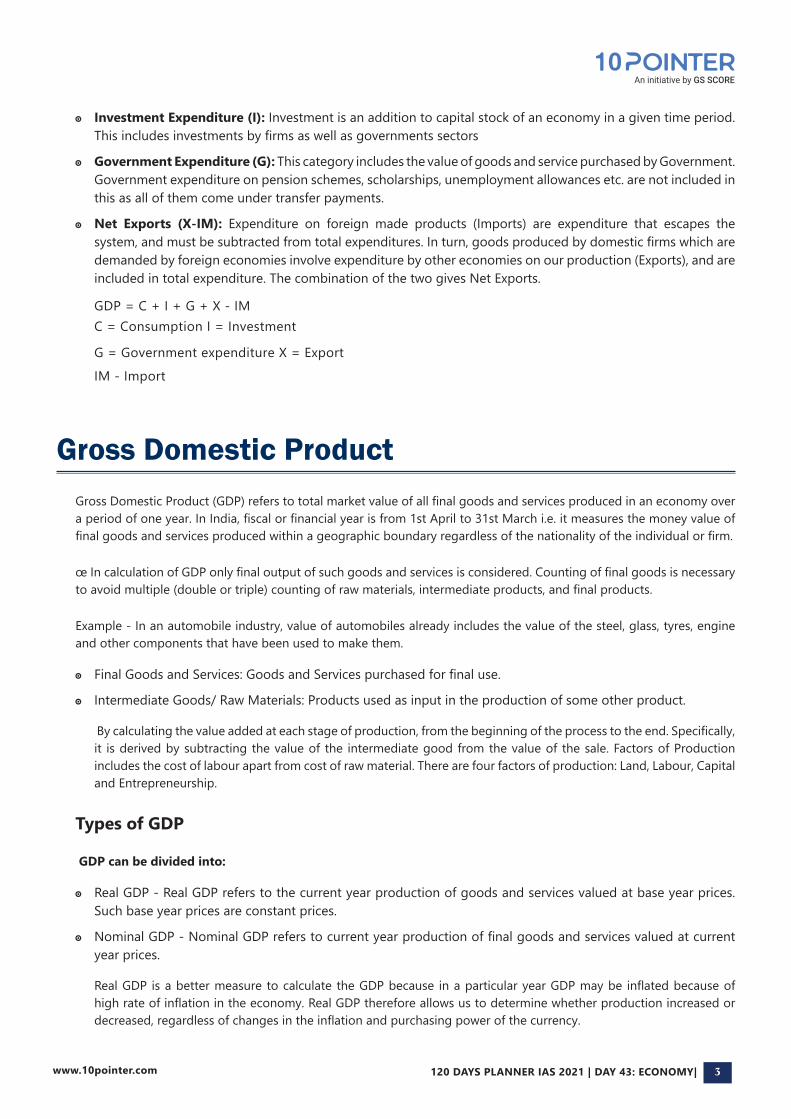
Investment Expenditure (I): Investment is an addition to capital stock of an economy in a given time period. This includes investments by fi rms as well as governments sectors
Government Expenditure (G): This category includes the value of goods and service purchased by Government. Government expenditure on pension schemes, scholarships, unemployment allowances etc. are not included in this as all of them come under transfer payments.
Net Exports (X-IM): Expenditure on foreign made products (Imports) are expenditure that escapes the system, and must be subtracted from total expenditures. In turn, goods produced by domestic fi rms which are demanded by foreign economies involve expenditure by other economies on our production (Exports), and are included in total expenditure. The combination of the two gives Net Exports.
GDP = C + I + G + X - IMC = Consumption I = Investment
G = Government expenditure X = ExportIM - Import
Gross Domestic ProductGross Domestic Product (GDP) refers to total market value of all fi nal goods and services produced in an economy over a period of one year. In India, fi scal or fi nancial year is from 1st April to 31st March i.e. it measures the money value of fi nal goods and services produced within a geographic boundary regardless of the nationality of the individual or fi rm.
œ In calculation of GDP only fi nal output of such goods and services is considered. Counting of fi nal goods is necessary to avoid multiple (double or triple) counting of raw materials, intermediate products, and fi nal products.
Example - In an automobile industry, value of automobiles already includes the value of the steel, glass, tyres, engine and other components that have been used to make them.
Final Goods and Services: Goods and Services purchased for fi nal use.
Intermediate Goods/ Raw Materials: Products used as input in the production of some other product.
By calculating the value added at each stage of production, from the beginning of the process to the end. Specifi cally, it is derived by subtracting the value of the intermediate good from the value of the sale. Factors of Production includes the cost of labour apart from cost of raw material. There are four factors of production: Land, Labour, Capital and Entrepreneurship.
Types of GDP
GDP can be divided into:
Real GDP - Real GDP refers to the current year production of goods and services valued at base year prices. Such base year prices are constant prices.
Nominal GDP - Nominal GDP refers to current year production of fi nal goods and services valued at current year prices.
Real GDP is a better measure to calculate the GDP because in a particular year GDP may be infl ated because of high rate of infl ation in the economy. Real GDP therefore allows us to determine whether production increased or decreased, regardless of changes in the infl ation and purchasing power of the currency.
4 www.10pointer.com120 DAYS PLANNER IAS 2021 | DAY 43: ECONOMY|
Net Domestic Product (NDP)Net Domestic Product (NDP) is the GDP calculated after adjusting the value of ‘depreciation’. This is, basically a net form of the GDP, i.e. GDP minus the total value of the depreciation that happened in the assets while the goods and services were being produced.
NDP = GDP - Depreciation
Because of the above, NDP of an economy is always lower than its GDP, since there depreciation can never be reduced to zero. The concept of NDP and NNP are not used to compare diff erent economies because the method of calculating depreciation vary from country to country
Concept of Depreciation
In the process of production a country uses several capital assets such as machinery, equipment, automobiles, etc.The assets like machines face wear and tear over a period of time. It’s value reduces. This is known as depreciation.When the value completely erodes the capital asset in question has to be either replaced or repaired. Expenses incurred for this are called depreciation expenditure.The sum of these two amounts is called Gross Investment in economics. Gross Investment = Net investment + Depreciation Net investment will increase the production capacity and output of a nation, but not by depreciation expenditure.The governments of the economies decide and announce the rates by which assets depreciate and a list is published, which is used by the diff erent sections of the economy to determine the real levels of depreciations in diff erent assets. When we divide NNP by the total population of nation we get the ‘per capita income’ (PCI) of that nation i.e. ‘income per head per year’.
Gross National Product (GNP)GNP is a measure of the value of output produced by the nationals of a country irrespective of the geographical boundaries of a nation. It refers to the output of Indian citizens both within India and in all the countries of world.
GNP = GDP + (Income from abroad)
Example: Apple Inc. is a US based fi rm. When it opens up a production centre in India, value of output from that centre is added to India’s GDP, but it is not added while calculating GNP of India.Similarly, when Indian companies such as HCL or Reliance provide services in the US, the value of those services are not added in the Indian GDP but they are considered while calculating the Indian GNP.
GDP and GNP are measured on the basis of Market Price and Factor Cost.
Market Price:
It refers to the actual transacted price and it includes indirect taxes such as custom duty, excise duty, sales tax, service tax, etc. (impending Goods and Services Tax).

5www.10pointer.com 120 DAYS PLANNER IAS 2021 | DAY 43: ECONOMY|
These taxes tend to raise the prices of the goods in an economy.
Factor Cost:
It refers to the cost of factors of production.
Factors of Production i.e. rent for land, interest for capital, wages for labour and profi t for entrepreneurship. This is equal to revenue price of the fi nal goods and services sold by the producers.
Revenue price (or factor cost) = Market Price - Net Indirect Taxes.
Net Indirect Taxes (NIT) = Indirect Taxes – Subsidies
Hence, Factor Cost = Market Price- Indirect Taxes + Subsidies
Net National Product (NNP)NNP is the value of the total output of the economy calculated without double counting, this is GNP, less allowance for depreciation (D) of the capital assets used in the production process.
Hence NNP= GNP- Depreciation
NNP = GDP + Income from Abroad - Depreciation
NNP at Market Price - Indirect Taxes = Net National Income at Factor Cost
Net Foreign Factor Income (NFFI)
Net Foreign Factor Income (NFFI) is the diff erence between the aggregate amount that a country’s citizens and companies earn abroad, and the aggregate amount that foreign citizens and overseas companies earn in that country.
Formula
Net Foreign Factor Income = GNP – GDP
Net National Income at Factor CostIt is a measure of the sum of all factor incomes earned by the residents of a country both from within the country as well as abroad.
National Income and Net National Product (NNP) are synonymous. National Income is calculated by deducting indirect taxes from NNP and adding subsidies. The reason for deducting indirect taxes is that they have been added twice - once in the hands of the people who pay them and other in the hands of the governments. Similarly, various subsidies, which are forwarded by the governments, need to be adjusted while calculating national income.
Net National Income at Factor Cost = NNP at Market Price - Indirect Taxes + Subsidies
In India, and many developing countries across the world, National Income (NI) is measured at factor cost instead of market prices. Some of the reasons for the same is lack of uniformity in taxes, goods not being printed with their prices, etc.

6 www.10pointer.com120 DAYS PLANNER IAS 2021 | DAY 43: ECONOMY|
Personal Income (PI) In economics, personal income refers to an individual’s total earnings from wages, investment enterprises, and other ventures. It is the sum of all the incomes actually received by all the individuals or household during a given period. Welfare payments are received by households, but these are not elements of national income because they are transfer payments.
Similarly, in national income accounting, some income is attributed to individuals, which they do not actually receive. For example, undistributed profi ts, employee’s contribution for social security corporate income taxes etc. are, part of national income but are not received by individuals. Therefore, they are to be deducted from national income to estimate the personal income. Personal income thus is:
PI = NI + transfer payments - Corporate retained earnings, income taxes, social security taxes.
Disposable Income (DPI)Disposable personal income refers to the amount, which in actual is at the disposal of individuals to spend as they like. It is the amount which is left with the individuals after paying personal taxes such as income tax, property tax, professional tax etc. Therefore:
DPI = PI -Taxes (Income Tax i.e. Personal Taxes)
Hence, DPI results into Savings and Expenditure i.e (Spend and Save). This concept is very useful for studying and understanding the consumption and saving behaviour of the individuals.
Disposable income = Consumption + Savings
New Methodology for Calculation of GDP in India
Earlier domestic GDP was calculated at factor or basic cost, which took into account prices of products received by producers.
The new formula takes into account market prices paid by consumers. It is calculated by adding GDP at factor price and indirect taxes (minus subsidies). It is in line with international practice and is expected to better capture the changing structure of the Indian economy.
The government has also changed the base year for estimating GDP from 2004-05 to 2011-12. This has been done to incorporate the changing structure of the economy, especially rural India.
Data for the new GDP series will now be collected from 5 lakh companies (against 2,500 companies earlier). Under-represented and informal sectors as well as items such as smartphones and LED television sets will now be taken into account to calculate the gross domestic product.
The revision in GDP does not alter the size of India’s economy ($1.8 trillion) nor will it alter key ratios such as fi scal defi cit, CAD etc. (as percentage of GDP) for 2013-14.
The GDP at the aggregate and sector level has signifi cantly changed. The average share of the industrial sector has moved up by 5.6 percentage points from 26.1 per cent in the old series to 31.7 per cent under the new series, for 2011-12 to 2013-14.

7www.10pointer.com 120 DAYS PLANNER IAS 2021 | DAY 43: ECONOMY|
Concept of GDP Defl atorIt is a tool to measure the infl ation comprehensively. It represents the ratio of GDP at current prices to GDP at constant prices. GDP defl ator is published on a quarterly basis since 1996 with a lag of two months. It is because of this very reason that economists prefer the use of WPI or CPI for defl ating nominal price estimates to derive real price estimates.
Essentially GDP defl ator = (Nominal GDP/Real GDP) * 100.
Unlike the Wholesale Price Index and the Consumer Price Index, GDP defl ator is not based on a fi xed basket of goods and services, it covers the whole economy. One of the other advantages of GDP defl ator is that changes in consumption patterns or the introduction of new goods and services are automatically refl ected in the defl ator, such a feature is missing in WPI/CPI.
Purchasing Power ParityPurchasing Power Parity (PPP) is an economic theory that compares diff erent countries’ through a “basket of goods” approach. According to this concept, two currencies are in equilibrium or at par when a basket of goods is priced the same in both countries.
Some accounts of GDP are adjusted for PPP. This adjustment attempts to convert nominal GDP into a number more easily comparable between countries with diff erent currencies.
One way to think of what GDP with PPP represents is to imagine the total collective purchasing power of Japan if it were used to make the same purchases in U.S. markets. This only works after all yen are exchanged for dollars. Otherwise, the comparison does not make sense.
For example, suppose it costs $10 to buy a shirt in the U.S., and it costs €8.00 to buy the same shirt in Germany. To make an apples-to-apples comparison, the €8.00 in Germany needs to be converted into U.S. dollars. If the exchange rate was such that the shirt in Germany costs $15.00, the PPP would be 15/10, or 1.5. For every $1.00 spent on the shirt in the U.S., it takes $1.50 to obtain the same shirt in Germany.
Green GDPGreen GDP is a term used generally for expressing GDP after adjusting for environmental damage. When information on economy’s use of the natural environment is integrated into the system of national accounts, it becomes green national accounts or environmental accounting.
The process of environmental accounting involves three steps viz. Physical accounting; Monetary valuation; and integration with national Income/wealth Accounts. Physical accounting determines the state of the resources, types, and extent (qualitative and quantitative) in spatial and temporal terms.
Monetary valuation is done to determine its tangible and intangible components. Thereafter, the net change in natural resources in monetary terms is integrated into the Gross Domestic Product in order to reach the value of Green GDP.
**********

8 www.10pointer.com120 DAYS PLANNER IAS 2021 | DAY 43: ECONOMY|
INFLATION
Introduction
Infl ation refers to a gradual rise in the general price level in the economy and a fall in purchasing power of money over a period of time. In simple words, infl ation is nothing but a rise in average price level of all the goods and service in an economy. Infl ation occurs when too much money chases too few goods, that is, even though money supply increases the supply of goods and services does not increase commensurately.
What Causes Infl ation?
Infl ation primarily occurs due to two sets of factors, the demand-pull factors and the cost-push factors. Both of them have been explained below in detail:
Demand Pull factors: These are those set of factors due to which there may be an increase in the demand for goods and services in the economy.
Increase in government expenditure: Increased government expenditure results in increased demand for goods and services and consequent increase in prices. This is because increased government expenditure results in putting large money in the hands of public, thereby putting to eff ect too much money chasing too few goods.
Rising population: Increasing population also acts as an important factor in pushing up prices because of increased demand especially when the supply is unable to meet the demand.
Black Money: A large part of the black money is used in buying and selling of real estate in urban areas, extensive hoarding and black marketing in essential wage goods, such as cereals, pulses, etc. Black money, therefore, fuels demands and leads to rise in prices.
Changing consumption patterns: Reserve Bank of India (RBI) put forword the theory that the infl ation problem in India has its roots in a sharp increase in demand for certain food items that people eat more frequently as incomes rise. One example is protein-rich food. Increased consumption of pulses, eggs, fi sh and poultry were apparently driving up their prices in the economy.

9www.10pointer.com 120 DAYS PLANNER IAS 2021 | DAY 43: ECONOMY|
Cost- Push Factors:
The reasons are: At times rise in wages, if greater than rise in productivity, increases the costs therefore increasing the prices too.
Increase in indirect taxes also leads to cost side infl ation. Taxes such as custom and excise duty raise the cost of production as these taxes are levied on commodities.
Increase in administered prices such as the MSP (Minimum Support Price) for the food grains, petroleum products, etc also leads to infl ation as they have a huge share in budget of common citizens.
Infrastructural bottlenecks such as the lack of proper roads, electricity, water, etc raise per unit cost of production. This is one of the prime reasons for infl ation in the context of Indian economy.
Owing to events such as failed monsoons there is a drop in agricultural productivity, which inevitably results in infl ation at times.
Types of Infl ation
On the basis of rate of infl ation, it is categorized into three types:
Creeping Infl ation occurs when the infl ation rate is in the range of 1% to 5%. Such infl ation erodes the purchasing power of money, but is referred to as manageable and sometimes inevitable in a growing economy.
Walking or Trotting : Infl ation lies in the range of 5% to 10%, which if not controlled properly may lead to “galloping infl ation” at a rate of 10% to 20% annually. This galloping infl ation may worsen into “runaway infl ation” too.
Hyper Infl ation : This form of infl ation is out of control, which might have the annual rate in million or even trillion. In such infl ation not only the range of increase is very large, but the increase takes place in a very short span of time, prices shoot up overnight. One of the most famous examples of hyperinfl ation occurred in Germany between January 1922 and November 1923. Among the recent examples, the one experienced in Zimbabwe in 2008 is a prominent one.
Based on the causes of infl ation, it can be classifi ed into:Demand Pull Infl ation : This type of infl ation is caused by increase in demand and when the demand in the economy outgrows the supply in the economy. This kind of infl ation can be described by “too much money chasing too few goods”. One of the reasons for demand pull infl ation can be the increase in money supply.
Cost-Push Infl ation : It is also referred to as supply shock infl ation. Such infl ation occurs due to reduced supplies because of increased prices of inputs. For example, an increase in price of international crude oil adversely aff ects the inputs of almost all the items in a country like India, which neither has alternatives to oil for energy needs nor has signifi cant amount of domestic oil production.
Structural Infl ation : This type of infl ation is also called as bottleneck infl ation. Such an infl ation is built into the economic system due to government policies. Such infl ation occurs from time to time because of weather and seasonal conditions leading to shortage of supply in goods and services.
Other types of Infl ation
Stagfl ation: Is a combination of stagnant economic growth, high unemployment, and high infl ation. It’s an unnatural situation because infl ation is not supposed to occur in a weak economy. In a normal market economy, slow growth prevents infl ation. As a result, consumer demand drops enough to keep prices from rising.
Core infl ation: Is the change in the costs of goods and services but does not include those from the food and energy sectors. Food and energy prices are exempt from this calculation because their prices can be too volatile or fl uctuate wildly.

10 www.10pointer.com120 DAYS PLANNER IAS 2021 | DAY 43: ECONOMY|
Base Eff ect
It refers to the impact of the rise in price level (i.e., last year’s infl ation) in the previous year over the corresponding rise in price levels in the current year (i.e., current infl ation). If the price index had risen at a high rate in the corresponding period of the previous year, leading to a high infl ation rate, some of the potential rise is already factored in, therefore, a similar absolute increase in the Price index in the current year will lead to a relatively lower infl ation rates.
On the other hand, if the infl ation rate was too low in the corresponding period of the previous year, even a relatively smaller rise in the Price Index will arithmetically give a high rate of current infl ation.
Eff ects of Infl ation
There are multi-dimensional eff ects of infl ation on an economy both at the micro and macro levels. It redistributes income, distorts relative prices, destabilises employment, tax, saving and investment policies, and fi nally it may bring in recession and depression in an economy.
A brief and objective overview of the eff ects of infl ation is given below:
On Creditors and DebtorsInfl ation redistributes wealth from creditors to debtors, i.e., lenders suff er and borrowers benefi t out of infl ation. The opposite eff ect takes place when infl ation falls (i.e., defl ation).
On lending
With the rise in infl ation, lending institutions feel the pressure of higher lending. Institutions don’t revise the nominal rate of interest as the ‘real cost of borrowing’ (i.e., nominal rate of interest minus infl ation) falls by the same percentage with which infl ation rises.
On Aggregate DemandRising infl ation indicates rising aggregate demand and indicates comparatively lower supply and higher purchasing capacity among the consumers. Usually, higher infl ation suggests the producers to increase their production level as it is generally considered as an indication of higher demand in the economy.
On Investment
Investment in the economy is boosted by the infl ation (in the short-run) because of two reasons:
Higher infl ation indicates higher demand and suggests entrepreneurs to expand their production level.
Higher the infl ation, lower the cost of loan.
On IncomeInfl ation aff ects the income of individual and fi rms alike. An increase in infl ation, increases the ‘nominal’ value of income, while the ‘real’ value of income remains the same.
Increased price levels erode the purchasing power of the money in the short-run, but in the long-run the income levels also increase (making the nominal value of income going upward). It means, in a given period of time income may go up due to two reasons, viz., infl ationary situation and increased earning. The concept ‘GDP Defl ator’ (GDP at current prices divided by GDP at constant prices) gives the idea of ‘infl ation eff ect’ on income over a given period.

11www.10pointer.com 120 DAYS PLANNER IAS 2021 | DAY 43: ECONOMY|
On SavingHolding money does not remain an intelligent economic decision because money loses value with every increase in infl ation. It means that saving rate increases. But this happens as a short-term eff ect of infl ation.
In the long-run, higher infl ation depletes the saving rate in an economy. Just the opposite situation arises when infl ation falls or shows falling traits with decreasing saving, in the short-run and increasing saving in the long-run, respectively.
On ExpenditureInfl ation aff ects both the forms of expenditures -consumption as well as investment. Increased prices make our consumption levels fall as goods and services we buy get costlier. We see a tendency among the people to cut their consumption levels aimed at neutralising the impact of price rise making consumption expenditure fall.
Exact opposite happens once prices head downward. On the other hand infl ations makes ‘investment’ expenditure increase as a result of decreased cost of money/fi nance (infl ation brings benefi t to borrower- known as ‘infl ation premium’). In times of price fall just opposite happens.
On Exchange RateWith every infl ation the currency of the economy depreciates (loses its exchange value in front of a foreign currency) provided it follows the fl exible currency regime. Though it is a comparative matter, there might be infl ationary pressure on the foreign currency against which the exchange rate is compared.
On ExportWith infl ation, exportable items of an economy gain competitive prices in the world market. Due to this, the volume of export increases (keep in mind that the value of export decreases here) and thus export income increases in the economy. It means export segment of the economy benefi ts due to infl ation. Importing partners of the economy exert pressure for a stable exchange rate as their imports start increasing and exports start decreasing.
On ImportInfl ation gives an economy the advantage of lower imports and import-substitution as foreign goods become costlier. But in the case of compulsory imports (i.e., oil, technology, drugs, etc.) the economy does not get this benefi t and loses more foreign currency instead of saving it.
On Trade BalanceIn the case of a developed economy, infl ation makes trade balance favourable, while for the developing economies infl ation is un-favourable for their balance of trade. This is because of composition of their foreign trade. The benefi t to export which infl ation brings in to a developing economy is usually lower than the loss it incurs due to its compulsory imports which become costlier due to infl ation.
On EmploymentInfl ation increases employment in the short-run, but becomes neutral or even negative in the long run.
On WagesInfl ation increases the nominal (face) value of wages, while their real value falls. That is why there is a negative impact of infl ation on the purchasing power and living standard of wage employees. To neutralise this negative impact the Indian government provides dearness allowance to its employees twice a year.

12 www.10pointer.com120 DAYS PLANNER IAS 2021 | DAY 43: ECONOMY|
On the Self-employedInfl ation has a neutralising impact on the self-employed people in the short-run. But in the long-run they also get aff ected as the economy as a whole gets aff ected.
How is Infl ation Measured The infl ation rate is calculated as a percentage change in a price index. The price indices widely used for this are the Consumer Price Index (CPI) - adopted by countries such as US, UK, Japan and China, and the Wholesale Price Index (WPI).
Wholesale Price Index (WPI)In the WPI-based infl ation calculation, a set of 697 commodities and their price changes are considered. The selected commodities are supposed to represent various strata of the economy and are supposed to give a comprehensive WPI value for the economy. It is also called as headline infl ation.
The WPI is calculated on a base year. For the base year it is assumed to be 100.
The new WPI index released by the government includes 697 items against the 676 items of previous year. This presented a more comprehensive picture of infl ation in the economy compared to earlier. This new WPI index is based on the recommendations of a working group set up under the guidance of Saumitra Chaudhuri.
WPI continues to constitute three major groups-Primary Articles, Fuel and Power, and Manufactured Products. The number of items has been increased from 676 to 697-in all 199 new items has been added and 146 old items have been dropped.
A new Wholesale Food Price Index (WPFI) has been introduced-combining the Food Articles (belonging to the group Primary Articles) and Food Products (belonging to the group Manufactured Products). Together with the Consumer Food Price Index (CPFI) released by Central Statistics Offi ce, this would help monitor the price situation of food items better.
Problem/limitationOne of the major limitations of WPI is that it does not include services such as the health, IT, Education, transport etc. Another problem with the WPI is that it does not account for the products of the unorganized sector in India, which constitutes about 35% of the manufactured output of the Indian economy.
Weightage in WPIManufacturing products: 64.97%
Primary and food articles: 20.12%
Fuel and electricity: 14.91%
Consumer Price Index
Apart from the WPI, infl ation in India is calculated at the consumer level also by the mean of CPI. Because the wide disparities in the consumption baskets for diff erent segment of consumers, India has not been able to evolve a single and a comprehensive consumer price index. The four CPIs adopted by India are:
CPI (Industrial Workers): The Consumer Price Index for the industrial workers (CPI-IW) has 260 items (plus the services) in its basket with 2001 as the base year (the fi rst base year was 1958-59). The data is collected at 76 centres with one month’s frequency and the index has a time lag of one month. It contains 120-160 commodities in its basket. Basically, this index specifi es the government employees (other than banks’ and

13www.10pointer.com 120 DAYS PLANNER IAS 2021 | DAY 43: ECONOMY|
embassies’ personnel). The wages/salaries of the central government employees are revised on the basis of the changes occurring in this index, the dearness allowance (DA) is announced twice a year. When the Pay Commissions recommend pay revisions, the base is the CPI (IW).
CPI (Urban Non- Manual Employees): The Consumer Price Index for the Urban Non-Manual
Employees (CPI-UNME) has 1984-85 as the base year and 146-365 commodities in the basket for which data is collected monthly with two weeks’ time lag.
This price index has limited use and is basically used for determining dearness allowances (DAs) of employees of some foreign companies operating in India (i.e. airlines, communications, banking, insurance, embassies, and other fi nancial services).
It is also used under the Income Tax Act to determine capital gains and by the CSO (Central Statistical Organisation) for defl ating selected service sector’s contribution to the GDP at factor cost and current prices to calculate the corresponding fi gure at constant prices.
CPI (Agricultural Labour): The Consumer Price Index for Agricultural Labourers (CPI-AL) has 1986-87 as its base year with 260 commodities in its basket. The data is collected in 600 villages with a monthly frequency and has three weeks time lag.
This index is used for revising minimum wages for agricultural labourers in diff erent states.
CPI (Rural Worker): There is yet another Consumer Price Index for the Rural Labourers (CPI-RL) with 1983 as the base year, data is collected at 600 villages on monthly frequency with three weeks’ time lag, and its basket contains 260 commodities.
In 2011 the CSO brought out a revised CPI, which was CPI (Urban), CPI (Rural) and CPI (Urban + Rural) with 2010 as the base price. The combined one would take into account the data from both the indices taking appropriate weights.
When compared to the WPI, CPI has much larger weightage of primary articles which is 57%. What this essentially means is that food infl ation is refl ected much more appropriately in the CPI when compared to the WPI which gives only 20% weightage to primary articles.
To compile the database for CPI-urban , the federal statistics offi ce has been collecting data from retail outlets in more than 100 cities, and for CPI-rural data collection is underway in more than 1,200 villages.
Due to a shortage of staff , the statistics department has roped in offi cials from various departments including the postal department. More than 2,400 postmen were engaged in collection of retail prices from villages across the country.
Currently, the labour ministry and the commerce and industry ministry are involved in compiling and releasing infl ation fi gures. The ministry is also awaiting the cabinet’s approval for a single nodal agency for compiling data.
PPI (Production Price Index): It is constructed at producer level before commodity reaches the market. It captures the price rise at producer level itself.
Changes in methodology of measuring infl ationReserve Bank of India (RBI) had adopted the new Consumer Price Index (CPI) (combined) as the key measure of infl ation. The national CPI is meant to measure retail infl ation. This index will combine urban and rural CPIs, both under preparation and to be released simultaneously.
Unlike many other countries, India does not have a unifi ed CPI and uses the WPI as a benchmark. The unifi ed CPI will usher in a fundamental shift in the way the Reserve Bank of India (RBI) targets infl ation.
How can Infl ation be curbed? Monetary, fi scal and administrative measures are taken to control infl ation to an optimal level in the economy.

14 www.10pointer.com120 DAYS PLANNER IAS 2021 | DAY 43: ECONOMY|
Monetary MeasuresThe governments may take recourse to tighter monetary policy to cool down either the demand-pull or the cost-push infl ation. For example, the RBI may increase the bank rates/repo rates. etc to curb the supply of money in the market. Because of such a step, the public may want to invest more in the banks and lead to a drop in the consumption, thereby driving down the infl ation in the economy.
It may also use qualitative control methods such as raise margins on loans for commodities for which traders have a tendency to speculate and hoard.
Reserve Bank may also resort to other operations such as the Open Market Operations to mop out the liquidity from the market by selling government securities and bonds.
But monetary steps can only be successful if infl ation is due to demand pull factors and not structural in nature. Some of the limitations of raising interest rates to curb infl ation have been discussed below:
It has been observed several times in the past that the increase in bank rate by the RBI may not translate into a commensurate increase in interest rates by the banks. Banks necessarily do not raise their own interest rates at times even if the correct signals have been given by the RBI thereby defeating the entire purpose of the move.
Another issue, which is important in a country like India, is the large presence of unorganized banking.
Because of this RBI is not able to control a large part of the banking sector in the economy.
Fiscal MeasuresAs far as fi scal measures are concerned the government can take two routes to bring down the prices. Firstly, it can cut down its own spending on various schemes, projects, etc and secondly it can increase the taxes (either direct or indirect).
As far as the fi rst option is concerned most of the governments across the world do not employ this method for two simple reasons, fi rst they cannot suddenly reduce the money, which is being spent on several critical projects pertaining to infrastructure, etc as it would not only bring down the image of the country but also create a negative market sentiment.
Secondly, if they cut down spending on several important welfare schemes, etc then it may politically harm them in the next elections. So cutting down government expenditure is not considered feasible because of a mix of reasons.
The second method is raising the taxes to discourage spending. The government may increase the private direct taxes to reduce the incomes and thereby decreasing the consumption tendencies among the public. It may also increase the indirect taxes on commodities raising their prices and thereby discouraging spending on them by the public.
Philip’s CurveIt is a graphic curve which advocates a relationship between infl ation and unemployment in an economy. As per the curve there is a ‘trade of’ between infl ation and unemployment, i.e., an inverse relationship between them. The curve suggests that lower the infl ation, higher the unemployment and higher the infl ation, lower the unemployment.
The trade-off between infl ation and unemployment was only short-term, because once people came to expect higher infl ation they started demanding higher wages and thus unemployment will rise back to its ‘natural rate’ (the unemployment rate that occurs at full employment when the economy is producing at potential output, it is usually called the natural rate of unemployment).
It was advocated that there was no long-term trade-off between infl ation and unemployment.
In the long run, monetary policy can infl uence infl ation. It was suggested that if monetary policy tried to hold unemployment below its natural rate, infl ation will be rising to higher level, which is also known as the non-accelerating infl ation rate of unemployment (NAIRU).
15www.10pointer.com 120 DAYS PLANNER IAS 2021 | DAY 43: ECONOMY|
The NAIRU is that rate of unemployment which is consistent with a constant rate of infl ation. It means at NAIRU, the upward and downward forces on price (infl ation) and wage (unemployment) neutralise each other and there is no tendency of change in the rate of infl ation. We may say that the NAIRU is the lowest unemployment rate that an economy can sustain.
Depression
Depression has visited the world economy only once in 1929, economists have pin-pointed enough number of traits to recognise it.
The major traits of depression could be as given below:
An extremely low aggregate demand in the economy causes activities to decelerate
The infl ation being comparatively lower
The employment avenues start shrinking forcing unemployment rate to grow fast
To keep the business going, production houses go for forced labour-cuts or retrenchment (to cut down production cost and be competitive in the market) etc
Recovery
An economy tries to come out of the low production phase to survive. The low production phase might be depression, recession or slowdown with the former being the worst and rare, governments take many new fi scal and monetary measures to boost demand and production and ultimately a recovery in an economy is managed.
The business cycle of recovery may show the following major economy traits:
An upturn in aggregate (total) demand which has to be accompanied by increase in the level of production
Production process expands and new investments become attractive
As demand goes upward, infl ation also moves upward making borrowing cheaper for investors
With an upturn in production, new employment avenues are created and unemployment rate starts declining etc.
RecessionThis is somewhat similar to the phase of ‘depression’ we may call it a mild form of depression — fatal for economies as this may lead to depression if not handled with care and in time. The fi nancial crises which followed the US ‘sub-prime crisis’ in almost the whole Euro-American economies has basically brought in ‘severe recessionary’ trends there.
Major traits of recession, to a great extent, are similar to that of ‘depression’ [except the point (iv) of the Depression, discussed earlier]—may be summed up as follows:
There is a general fall in demand as economic activities takes a downturn
Infl ation remains lower or/and shows further signs of falling down
Employment rate falls/unemployment rate grows
Industries resort to ‘price cuts’ to sustain their business
Boom
A strong upward fl uctuation in the economic activities is called boom. As economies try to recover out of the phases of slowdown, recession and depression at times the measures taken by the governments as well as the private sector might put economic activities as such which the economic systems fail to digest. This is the phase of the boom.

16 www.10pointer.com120 DAYS PLANNER IAS 2021 | DAY 43: ECONOMY|
The major economic traits of boom may be listed as given below:
An accelerated and prolonged increase in the demand
Demand peaks up to such a high level that it exceeds sustainable output/production levels
The economy heats up and a demand supply lag is visible
The market forces mismatch (i.e., demand and supply disequilibrium) and tend to create a situation where infl ation starts going upward
The economy might face structural problems like shortage of investible capital, lower savings, falling standard of living, creation of a sellers’ market.
**********