Embed Size (px)
Citation preview


Bureau of Agricultural Economics, Canberra
A BAE submission to the IAC
Project 41341
WHEAT MARKETING AND ASSISTANCE
Australian Government Publishing Service Canberra 1987

0 Commonwealth of Australia
This work is copyright. As permitted under the Copyright Act - which allows fair dealings for the purpose of study, research, criticism or review - selected passages, tables or diagrams may be reproduced provided that due acknowledgment is made. However, the entire document or major sections may not be reproduced by any process without written permission. Copyright is the responsibility of the Director Publishing and Marketing, AGPS. Inquiries should be directed to the Manager, AGPS Press, Australian Government Publishing Service, GPO Box 84, Canberra ACT 2601.
ISSN 0814-9445 ISBN 0 644 06805 1

The inquiry into the wheat industry by the Industries Assistance Commission is an initial step in considering the wheat marketing arrangements to apply after June 1989, when the provisions of the current Wheat Marketing Act 1984 expire. The Commission is required to report by 26 February 1988, soon after the reporting date of the Royal Commission into Grain Storage, Handling and Transport to which the Bureau submitted evidence in April 1987.
The Bureau's submission concentrates on aspects of wheat marketing, both domestic and export, and assistance, in particular market support arrangements. Thus, the submission is broad ranging but does not include analysis of the distribution system, which was the subject of the Bureau's recently published Occasional Paper, Institutional Arrangements in the Wheat Distribution System.
The preparation of this submission was carried out under the general direction of Roger Rose by Rhonda Treadwell, Graham Love, Paul Gavel, Peter Gillard, Meng Chang, Mike Hinchy and Peter Sniekers of the Crop Marketing and Outlook Branch.
ROBERT BAIN Director
Bureau of Agricultural Economics Canberra ACT
August 1987
iii

CONTENTS
Summary and Recommendations
1. Introduction
1.1 Background 1.2 Scope and aims of the submission 1.3 Current marketing and payment arrangements 1.4 The distribution system 1.5 Industry outlook 1.6 Farm incomes
2. Wheat Payment Arrangements
2.1 Implications of revenue pooling 2.2 Implications of cost pooling 2.3 Evaluation of current payment system
3. Domestic Wheat Marketing
3.1 Characteristics of the domestic wheat market 3.2 Analysis of current marketing arrangements 3.3 Arguments against competition 3.4 Effects of introducing competition
4. Export Marketing
4.1 The international wheat market 4.2 Arguments for the current arrangements 4.3 Effects of competitive exporting 4.4 Implications of change in wheat marketing and distribution
5. Assistance
5.1 Underwriting 5.2 Research funding 5.3 Alternative policies
Appendix A: Estimation of Permit Wheat Price Range and Savings
References

Figures
1 Australian wheat production, exports and closing stocks
2 Farm income of family farms
3 Real farm business debt
4 Australian Wheat Board domestic wheat sales
5 Sales and price of industrial wheat
Tables
1 Australian wheat production, domestic sales and exports
2 Wheat and other crops industry: financial performance measures, by state and all broadacre industries for Australia
3 Domestic off-farm marketing costs
4 Illustrative financing costs for various wheat categories
5 Advance payments
6 Off-farm liquid assets, wheat and other crops
7 Alternative wheat payment arrangements
8 Domestic and export use of wheat
9 National flour usage
10 Wheat exports as a proportion of world trade
11 Relative unit returns to wheat exports, by market group
A1 Savings to Victorian permit wheat buyers
A2 Savings to New South Wales permit wheat buyers
A3 Savings to Victorian growers from selling permit wheat
A4 Savings to New South Wales growers from selling permit wheat

WHEAT MARKETING AND ASSISTANCE
SUMMARY AND RECOMMENDATIONS
On 30 June 1989 the current (eighth) wheat marketing scheme is scheduled to expire, having been enacted in late October 1984 for the five years commencing with the 1984-85 season. As previously, the Commonwealth Government has instructed the Industries Assistance Commission to inquire into and report on assistance and marketing arrangements as they relate to the Australian wheat industry, as a basis on which to consider whether to extend or change the scheme.
Scrutiny of the current marketing arrangements leads to the conclusion that the current scheme has four primary objectives: equity, efficiency, the provision of price insurance and assistance through government underwriting, and the maintenance of a controlled marketing environment. The aim of this submission is to evaluate the marketing and assistance arrangements in terms of efficiency.
Wheat marketing is controlled by the Australian Wheat Board. The Board is the sole receiver and marketing agent for all wheat exported and for most wheat sold in Australia (that is, for all wheat other than that sold under permit or by authorisation). Concurrent with the Commission inquiry, a Royal Commission is inquiring into the storage, handling and transport of grain with the aim of recommending how to achieve an efficient distribution system. Following a major study, the Bureau has put forward three options for improving the distribution system. Two of these options involve the adoption of a competitive distribution system which would lead to substantial improvements in efficiency in grain distribution. This report addresses the marketing and assistance arrangements not covered in that study .
Industry situation
During the 1980s a decline in wheat import demand, together with US and EC support policies, resulted in falling wheat prices and an accumulation of wheat stocks in the United States and elsewhere. As a result of these falling prices Australian production of wheat has declined from the record 22 Mt in 1983-84 to around 16 Mt in 1985-86 and 1986-87. Despite this fall, the volume of exports reached a peak of 16 Mt in the latter two years due to the sale of large wheat stocks. Over the next few years it is probable that the Australian wheat industry will have an annual output below 14 Mt, exports of 11-12 Mt, a guaranteed minimum price for Australian standard white (ASW) wheat of less than $135/t, and an average net return to growers of around $95/t. In the medium term, as long as world stocks remain high relative to use, low wheat prices are likely to persist, and a further decline in wheat production from the 1987 level will be experienced in Australia. In the longer term a price recovery is possible as unprotected producers voluntarily lower production and the European and US governments restrain production due to the high and rising costs of their support policies.
Incomes of wheat farms have fallen consistently since 1983-84 to an estimated average of zero in 1986-87. While depreciation of the Australian dollar has, in the recent past, shielded growers to some extent from the sharp decline in world wheat prices, rising costs of marketing, inputs and interest have had an adverse effect on incomes. In the short term, wheat and

other crop farmers face great financial pressures due to declining farm incomes and land values coupled with rising debt levels and interest costs.
Payment and charpinp arrangements
The pooling of revenues and costs is a tradition of marketing arrangements for Australian wheat. Pooling is applied over time, location and quality. Pooling of revenues results in wheat growers being paid the average return from the sale of the season's wheat within the category delivered. Pooling over time spreads the risk of price fluctuations over the selling period for the crop. Such pooling will lead to inefficiency only if the selling period is very long - as it is under the current pooling arrangements .
Although different prices have been allowed for six categories of wheat since 1984, payments are still averaged across broad quality ranges within these categories. For example, growers of around 70 per cent of Australia's wheat crop are paid the pooled price for ASW wheat, although a number of selling categories are distinguished within this class. Pooling across such broad quality ranges discourages production of higher quality, higher priced wheat in favour of lower quality, higher yielding wheats. This problem has been recognised by the Australian Wheat Board, which is planning to introduce several payment categories for ASW wheat of differing quality, based on protein content. For the fullest transmission of price signals to growers, the quality categories for payment should be the same as those for sale.
Costs are pooled at the national, state or regional level; costs are pooled across classes of wheat, areas of production, and markets, and over the period of time that marketing costs are incurred on each year's crop. Pooling of costs eliminates incentives to minimise costs, as the charges paid by growers do not correspond to the costs of their own actions. As the Bureau's recent study of wheat distribution concluded, widespread pooling of distribution costs should be discontinued. This conclusion is equally applicable to the national pooling of the Wheat Board's marketing and finance costs. Charges for marketing a grower's wheat should be, as far as is practicable, the actual costs incurred.
The elimination of pooling would improve the signals reaching growers on the actual market returns from their wheat and the costs of distributing and marketing it. This would result in growers adjusting their production decisions in accordance with changes in the market and would give incentives for the minimisation of costs to those who have control over these costs.
A major problem with the current system of advance payments is that it forces on all growers the same borrowing regimen, despite differences in their cash flow requirements and variations in opportunity costs of grower funds. The deferred payment options under the current arrangements offer some flexibility in borrowing, but only in relation to timing. Current arrangements dictate that the grower - who may not in fact need to borrow the amount of the advance payment - must incur the loss of any difference between the Wheat Board's borrowing costs and the return on the grower's own investment of funds. A voluntary advance payment system would give growers more control of their finances by offering choices on both the timing and the amount of the advance payment. (Such a scheme would, however, incur higher administrative costs than the current system.)

Advance payment to growers provides them with a borrowing subsidy. This provision of relatively cheap funds to wheat growers will result in the misallocation of funds in the economy from investments with higher or less risky returns.
When growers deliver wheat to the Wheat Board, that wheat does not assume a value immediately but has some likely future sales value. Accordingly, while growers should be able to use this asset as collateral for borrowings, they should not expect to be paid the sale value of the wheat immediately. A procedure which would overcome the above problems would be to issue, on delivery, negotiable certificates detailing the quality and quantity of the wheat, and subsequently to pay growers after the sales have been made. The certificates should be freely negotiable and usable as collateral for borrowings by the grower.
Domestic marketing
With an average of 2.2 Mt of sales a year, the domestic market is small in relation to exports, which are about 14-15 Mt a year. Since 1939, domestic marketing of wheat has been controlled by the Wheat Board. Domestic wheat prices are set administratively on the basis of the Board's export price quotes. In addition, all buyers of wheat for human consumption are charged $16/t to cover the Board's cost of servicing this market. This flat per-tonne margin leads to cross subsidisation between millers and provides no incentive for an individual miller to minimise the cost of services. A competitive market would overcome these problems by allowing the price mechanism to determine the value of services and wheat prices.
Current legislation allows, under permit, private trade in feed wheat, and around three-quarters of feed wheat is now sold in this way. It has been estimated in the present study that, through permit trading, growers and buyers have gained significant savings, mainly from the avoidance of unnecessary handling, transport and administration costs.
Arguments advanced in favour of monopoly control of domestic marketing appear unjustified. Since production and consumption of wheat are dispersed, it is unlikely that there are significant economies of scale in the domestic marketing of wheat. Long term sales contracts could be used to guarantee to millers the continuity of supply they require; this continuity is not dependent on the existence of a central marketing authority. Grain hygiene could be maintained after the introduction of competition in domestic marketing and distribution through a system of licencing and inspection of country storages , together with the incentives provided by the price mechanism.
The operation of a competitive domestic market would be similar to that of the existing markets for livestock and some other grains, which operate effectively without compulsory acquisition of the products or compulsory centralised marketing. Allowing competition in domestic marketing would result in a better distribution system, capable of adapting to changing market circumstances. Widespread revenue and cost pooling would not survive in a competitive market; growers would receive the correct market signals concerning their wheat and would pay according to the services used, leading to more efficient production decisions.
Competition in domestic marketing offers the prospect of real benefits to wheat growers and users through reduced marketing and distribution costs and improved grower awareness of the market values of wheat qualities. The
distribution of these gains between growers, merchants, manufacturers and consumers will depend on their relative market power and the responsiveness of supply and demand to price. As has been the case in permit trading of feed wheat, growers are likely to appropriate a smaller share of these gains than buyers. Nevertheless, with the option of delivery to the Wheat Board pool, growers would certainly do no worse than under the current arrangements, and would be likely to reap some benefits.
All wheat sold on the domestic market is subject to the Tasmanian freight levy, which is designed to cover the Board's costs in shipping wheat from selected mainland ports to Tasmania. There appears to be little economic justification for this subsidy, or for its being paid by wheat growers and users rather than by all taxpayers.
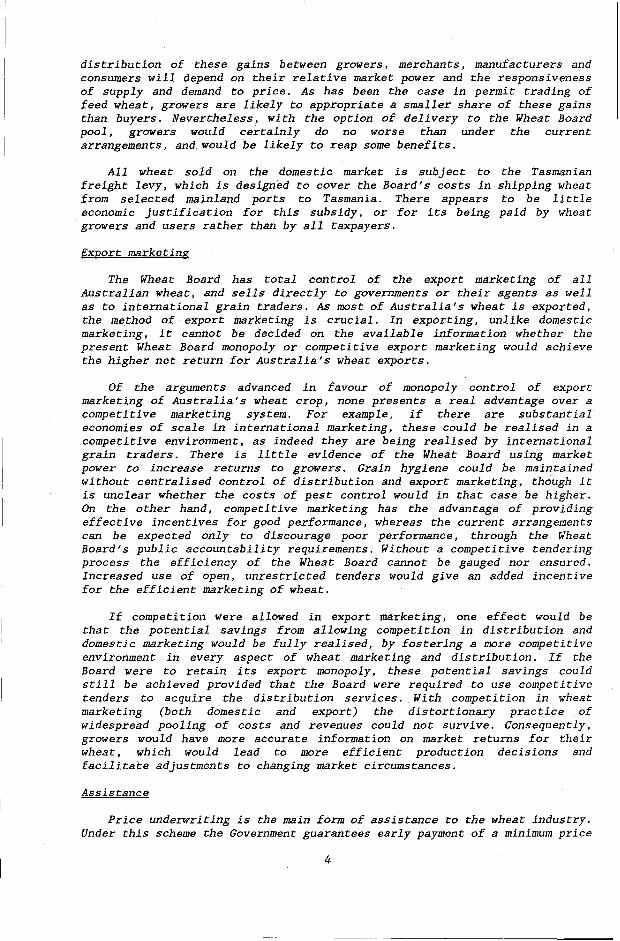
Export marketing
The Wheat Board has total control of the export marketing of all Australian wheat, and sells directly to governments or their agents as well as to international grain traders. As most of Australia's wheat is exported, the method of export marketing is crucial. In exporting, unlike domestic marketing, it cannot be decided on the available information whether the present Wheat Board monopoly or competitive export marketing would achieve the higher net return for Australia's wheat exports.
Of the arguments advanced in favour of monopoly control of export marketing of Australia's wheat crop, none presents a real advantage over a competitive marketing system. For example, if there are substantial economies of scale in international marketing, these could be realised in a competitive environment, as indeed they are being realised by international grain traders. There is little evidence of the Wheat Board using market power to increase returns to growers. Grain hygiene could be maintained without centralised control of distribution and export marketing, though it is unclear whether the costs of pest control would in that case be higher. On the other hand, competitive marketing has the advantage of providing effective incentives for good performance, whereas the current arrangements can be expected only to discourage poor performance, through the Wheat Board's public accountability requirements. Without a competitive tendering process the efficiency of the Wheat Board cannot be gauged nor ensured. Increased use of open, unrestricted tenders would give an added incentive for the efficient marketing of wheat.
If competition were allowed in export marketing, one effect would be that the potential savings from allowing competition in distribution and domestic marketing would be fully realised, by fostering a more competitive environment in every aspect of wheat marketing and distribution. If the Board were to retain its export monopoly, these potential savings could still be achieved provided that the Board were required to use competitive tenders to acquire the distribution services. With competition in wheat marketing (both domestic and export) the distortionary practice of widespread pooling of costs and revenues could not survive. Consequently, growers would have more accurate information on market returns for their wheat, which would lead to more efficient production decisions and facilitate adjustments to changing market circumstances.
Assistance
Price underwriting is the main form of assistance to the wheat industry. Under this scheme the Government guarantees early payment of a minimum price

t o wheat producers. There are several r i s k s tha t are o f concern t o wheat growers, tha t o f income f luc tua t ion being o f prime importance. Underwriting reduces the r i s k o f price var ia t ions over t ime but i s no t e f f e c t i v e i n reducing the r i s k o f income f luc tua t ions from other causes, and can i n f ac t increase such f luc tua t ions . This i s true whether the underwriting scheme i s financed by government o r growers.
The problem i s tha t the underwriting o f wheat prices may cause resources t o be diverted t o wheat growing, espec ia l ly i n times o f low pr ices . There are other measures which curren t ly ac t t o reduce t he r i s k o f income f luc tua t ions t o wheat growers. The Export Finance Insurance Corporation addresses the p o s s i b i l i t y o f imperfections i n t he insurance market by o f f e r i n g addi t ional insurance against de fau l t by overseas c red i t buyers o f wheat. This scheme would s t i l l be avai lable i f marketing o f wheat were open t o competit ion.
The current provisions o f the Rural Adjustment Scheme make assis tance avai lable t o po t en t i a l l y v iab le farmers who would face bankruptcy i f forced t o r e l y on commercial lenders . Such a pol icy a t tacks the most fundamental problem tha t a r i s e s i f (as i s the case) r i s k markets are incomplete. Furthermore, un l ike underwriting, assis tance under the scheme i s avai lable when and where i t i s most needed. Given the l e ve l o f funding, it i s o f b e n e f i t only a t the margin. F ina l ly , s ince the scheme appl ies uniformly across i ndus t r i e s , it w i l l no t d i s t o r t resource a l loca t ion as s e l ec t i v e underwriting can.
Currently the Commonwealth Government funds wheat research t o the same amount as growers contr ibute . Total research funding by growers and the Commonwealth Government a t present amounts t o l e s s than 0.5 per cent o f the wheat indus t ry ' s gross value o f production, which i s l e s s than the l e v e l s f o r the wool and l i ves tock i ndus t r i e s . Funding f o r wheat research could be increased subs tan t ia l ly t o achieve alignment wi th these o ther broadacre i ndus t r i e s .
Recommendations
In t h i s submission i t has been demonstrated tha t there i s scope for i n e f f i c i e n c y i n the current marketing arrangements. Growers may n o t , i n consequence, be receiving the highest returns f o r t h e i r wheat, and the arrangements are no t s u f f i c i e n t l y f l e x i b l e t o f a c i l i t a t e adequate adjustment t o changing market circumstances. Changes t o the current arrangements are necessary t o encourage the highest l e ve l o f e f f i c i e n c y i n wheat marketing, d i s t r i bu t i on and production.
Marketing arrangements
Competition i n the domestic marketing and d i s t r i bu t i on o f wheat should be allowed, as t h i s would o f f e r rea l savings and r e s u l t i n a system be t t e r able t o adapt quickly t o changing market circumstances. The Tasmanian f r e igh t subsidy and l e v y on growers should be stopped, as it d i s t o r t s the pat tern o f wheat use .
The Wheat Board's monopoly control over export marketing should be re ta ined , s ince it i s not proven tha t allowing competit ion would r e s u l t i n ne t b e n e f i t s . To increase the e f f i c i e n c y and f l e x i b i l i t y o f wheat marketing t he Board should, however, be required t o make a number o f changes t o i t s operations. The Board should:

- increase the use of open, unrestricted competitive tenders for wheat designated for resale through international grain traders;
- accept Australian wheat for sale from anyone in the domestic market;
- use an open, competitive tendering process to obtain distribution services;
- restrict pooling of revenues, by closing annual pools at the start of the next season and increasing the number of grades for payment;
- discontinue cost pooling, for both distribution and marketing costs, wherever practicable; and
- replace the current payment system with a scheme whereby growers would be given on delivery a certificate detailing the quality and quantity of their wheat; these certificates should be freely negotiable and acceptable as collateral for borrowings.
Assistance
The level of assistance to the wheat industry should be approximately equal to that for other broadacre industries, to avoid misallocation of resources within the broadacre sector. If underwriting is retained, the underwritten price should be based on gross market returns, so that marketing costs are not underwritten. If competition is allowed in domestic and/or export marketing, a deficiency payment scheme operated by a government agency (not the Wheat Board) should be used.
Underwriting should, however, be discontinued, as it is not effective in reducing income risk and can cause resources to be misallocated, particularly within the broadacre industries. If underwriting is discontinued, assistance through wheat research funding should be increased to a level similar to that provided to other broadacre industries. With competition in domestic marketing, the method of col l ec ting growers ' research levies would need to be changed to either collection by end users in the domestic market and by the Wheat Board on export sales, or collection by all merchants including the Board.

1. INTRODUCTION
The current (eighth) five-year wheat marketing scheme, enacted in late October 1984, is scheduled to expire on 30 June 1989. As was done for earlier plans, the Commonwealth Government has instructed the Industries Assistance Commission to inquire into and report on assistance and marketing arrangements for the Australian wheat industry in preparation for enacting the ninth such scheme.
The terms of reference for the inquiry again call for a report on the nature, extent and duration of any assistance that should be accorded to the wheat industry, for the five years commencing with the 1989-90 season. In particular, the Commission has been instructed to report on the effects that the agricultural support policies of major wheat producing countries have had on international wheat markets and the Australian wheat industry. In doing so, the Commission is to determine whether changes occurring within the industry will be of sufficient magnitude and duration as to warrant adjustment to government policies affecting the Australian wheat industry. If adjustment is deemed necessary, the Commission is to recommend the rate at which it should occur, taking into account the industry's capacity to adjust in the current economic climate.
1.1 Background -
The broad objectives of the wheat marketing arrangements have changed little over the years, but the emphasis placed on each objective has varied. Since the sixth scheme greater effort has been made to relate domestic prices to export market prices. A deliberate shift occurred in the seventh scheme, when greater emphasis was placed on reducing risk through guaranteeing minimum prices rather than maintaining price stability. All modifications to the marketing arrangements have occurred within a centrally controlled marketing system, operated by the Australian Wheat Board. The Board has identified its own main objective as the development of an efficient marketing framework and the maximisation of returns to growers (Australian Wheat Board 1986a).
Miller and White (1980) have referred to a confusion of objectives, and Watson (1984) has noted that this confusion is likely to persist because of the different attitudes of those affected by policy outcomes. The objectives behind each wheat marketing scheme have never been precisely specified. As a result, the nature of the underlying purposes is open to interpretation.
The Bureau of Agricultural Economics (1983) summarised the underlying objectives of previous wheat schemes as equity, stabilisation and the provision of assistance. However, it was noted that these objectives were losing some of their relevance due to increased dependence on the export market, increased variability in export prices and an increasing awareness of the inefficiencies associated with controlled marketing. From an examination of the institutional arrangements specified in the Wheat Marketing Act 1984, the main objectives of the current scheme can be interpreted as equity, the provision of price insurance and government assistance through public underwriting, the efficient marketing of Australian wheat and the maintenance of a controlled marketing environment.
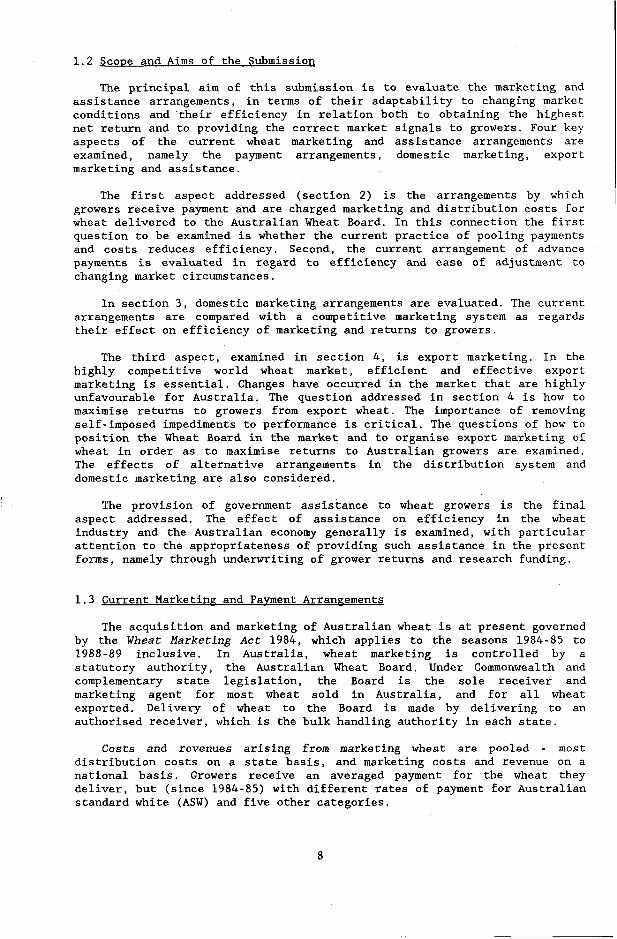
1.2 Scope and Aims of the Submission
The principal aim of this submission is to evaluate the marketing and assistance arrangements, in terms of their adaptability to changing market conditions and their efficiency in relation both to obtaining the highest net return and to providing the correct market signals to growers. Four key aspects of the current wheat marketing and assistance arrangements are examined, namely the payment arrangements, domestic marketing, export marketing and assistance.
The first aspect addressed (section 2) is the arrangements by which growers receive payment and are charged marketing and distribution costs for wheat delivered to the Australian Wheat Board. In this connection the first question to be examined is whether the current practice of pooling payments and costs reduces efficiency. Second, the current arrangement of advance payments is evaluated in regard to efficiency and ease of adjustment to changing market circumstances.
In section 3, domestic marketing arrangements are evaluated. The current arrangements are compared with a competitive marketing system as regards their effect on efficiency of marketing and returns to growers.
The third aspect, examined in section 4, is export marketing. In the highly competitive world wheat market, efficient and effective export marketing is essential. Changes have occurred in the market that are highly unfavourable for Australia. The question addressed in section 4 is how to maximise returns to growers from export wheat. The importance of removing self-imposed impediments to performance is critical. The questions of how to position the Wheat Board in the market and to organise export marketing of wheat in order as to maximise returns to Australian growers are examined. The effects of alternative arrangements in the distribution system and domestic marketing are also considered.
The provision of government assistance to wheat growers is the final aspect addressed. The effect of assistance on efficiency in the wheat industry and the Australian economy generally is examined, with particular attention to the appropriateness of providing such assistance in the present forms, namely through underwriting of grower returns and research funding.
1.3 Current Marketing and Payment Arrangements
The acquisition and marketing of Australian wheat is at present governed by the Wheat Marketing Act 1984, which applies to the seasons 1984-85 to 1988-89 inclusive. In Australia, wheat marketing is controlled by a statutory authority, the Australian Wheat Board. Under Commonwealth and complementary state legislation, the Board is the sole receiver and marketing agent for most wheat sold in Australia, and for all wheat exported. Delivery of wheat to the Board is made by delivering to an authorised receiver, which is the bulk handling authority in each state.
Costs and revenues arising from marketing wheat are pooled - most distribution costs on a state basis, and marketing costs and revenue on a national basis. Growers receive an averaged payment for the wheat they deliver, but (since 1984-85) with different rates of payment for Australian standard white (ASW) and five other categories.

The Commonwealth Government underwrites growers' returns through a guaranteed minimum price. Here again, unlike previous wheat marketing arrangements, the Wheat Marketing Act 1984 provides different minimum payments for ASW and other categories of wheat, whereas previously all wheat was underwritten to ASW value only. The ASW category - into which typically about 70 per cent of national receivals are accepted - is the benchmark from which differentials for other wheats are calculated (Australian Wheat Board 1986b). The ASW guaranteed minimum price is calculated as 95 per cent of the average of the ASW gross pool return for the current season and the two lowest of the previous three seasons, less the Wheat Board's costs. Since the guaranteed minimum price is calculated net of Wheat Board costs, it also tends to underwrite these costs.
For the 1986-87 season, six categories have been identified for payment purposes. They are prime hard (Al), hard (A2), ASW (B), general purpose 1 - lightweight (C), general purpose 2 - weather-damaged (D) and feed wheat (E). Within the A1 and A2 categories, various grades are defined in terms of protein level, between which there are further price differentials. Varietal dockages are applied within the Al, A2 and B categories to discourage the production of certain wheat varieties. Discounts are levied on deliveries that are weather damaged and/or contaminated by foreign materials.
The preliminary guaranteed minimum price for each of the six categories is determined around August. The forecast pool return net of Wheat Board costs is used in this preliminary calculation. Final guaranteed minimum prices are calculated in the following February when better information on likely market returns becomes available.
Growers receive an advance payment, in two instalments. The first (interim) advance is 90 per cent of the preliminary guaranteed minimum price for the category of wheat delivered, less storage, handling and transport costs. This payment is usually made within three weeks of wheat delivery to the bulk handling authority. Most growers receive their second (final) advance payment in March. The sum of the interim and final advance payments is the final guaranteed minimum price. Where the realised net return from wheat sales exceeds the sum of the advance payments the balance is distributed to growers in a series of subsequent payments.
Quality differences among grades within each wheat category are reflected in second, rather than first, payments. That is, every grower who delivers wheat of a certain category receives the same first payment (except for any receival dockages). Second payments, however, include adjustments made to the final guaranteed minimum prices resulting from quality differences among grades within the categories.
Three deferred payment options were also introduced in 1984-85:
. Under the first option, 35 per cent of the interim advance and 100 per cent of the final advance payment are deferred until 21 April, whereupon these amounts are paid with interest at the Australian Savings Bond rate.
. The second option is the same as the first, except that the deferral date is 21 August.
. The third option is for the final advance to be deferred until 21 August, when it is paid with interest at the Australian Savings Bond rate.

A deferred delivery option is also available, whereby growers can obtain interest on the advance payments at the Australian Savings Bond rate for deferring delivery of wheat for a period of 2-14 weeks following a 'prescribed date' for a particular silo. The prescribed date is based on a five-year average opening date for the silo.
As a proportion of total production, domestic sales of wheat produced within Australia have been declining for the past forty years. Australia has thus become more dependent on export markets for the disposal of its wheat crop (table 1). Sales of wheat on both the domestic and export markets are controlled by the Australian Wheat Board. For pricing purposes, current legislation differentiates domestic wheat sold for human consumption from that sold for industrial use and for stock feed. All domestic wheat prices are either set administratively or are at least subject to some degree of administrative oversight and control. The prices of wheat sold for human consumption are determined quarterly on the basis of the Board's export price quotes (see below) plus a fixed margin to cover the costs of services. Prices for industrial and stock feed wheat are set by the Board on the basis of its daily export price quotations, and are subject to the agreement of the Australian Agricultural Council.
Certain arrangements presently exist for growers to sell directly to buyers on the domestic market. The most flexible of these arrangements is the permit scheme for stock feed wheat. This scheme allows private trade in stock feed wheat under permits issued by the Wheat Board. The wheat is subject to only minimal administrative control and does not enter the
Table 1: AUSTRALIAN WHEAT PRODUCTION, DOMESTIC SALES AND EXPORTS(a)
Domestic sales Domestic Total as a proportion
Year Production sales Exports sales of total sales
(a) Domestic sales for 1984-85 and subsequent years include permit sales of stock feed wheat. (b) 1 December to 30 September; previous years ended 30 November, and subsequent years ended 30 September. (p) Provisional. Source: BAE (1986a, 1987a).

Board's pool. Thus, its price is not directly underwritten by the Commonwealth Government.
On the export marketing side, the Board employs a number of selling strategies which include direct sale to governments, sale to government agents or marketing authorities, sale through grain trading companies, and sale to the Commonwealth Government so that it can meet its food aid obligations. The Board sets price quotations for Australian wheat for export on each working day. These price quotes are set according to the commercial judgment of the Board, taking into consideration the world supply-demand situation as reflected in the prices offered by competing exporters, particularly the United States. Essentially, the Board bases its quoted price on that of competing US wheat, and may adjust this price to allow for such factors as exchange rates and ocean freight rates (Perkins, Sniekers and Geldard 1984). Since 1985 the presence on the market of increasingly significant quantities of subsidised wheat has had the result that often the published quote is not indicative of prices realised in many of Australia's markets.
1.4 The Distribution Svstem
Concurrent with the Commission inquiry into marketing and assistance to the wheat industry there is a Royal Commission into Grain Storage, Handling and Transport. The Bureau has recently published a report on the grain distribution system (Spriggs, Geldard, Gerardi and Treadwell 1987). The following is a summary of the main findings of that report.
In Australia the wheat distribution system is characterised by statutory monopolies established and protected from competition by Commonwealth and state legislation. These monopolies comprise the Australian Wheat Board, and bulk handling and rail authorities in each wheat exporting state. The Board receives wheat through the bulk handling authorities, which are its licensed receivers, and growers must deliver to a bulk handling authority all their wheat except that sold directly to a buyer under permit or by authorisation. A grower does not necessarily have to deliver wheat to the bulk handling authority in the same state as the wheat is grown.
The relationship between the licensed receivers and the Board is set out in the Grain Storage and Handling Agreement. This specifies the bulk handling services required by the Board from each bulk handling authority and the payment arrangements for these services. The current agreement differs from previous agreements in being more performance oriented, providing for rewards and penalties for good and poor performance.
Most wheat is transported by the rail authorities. Though rail has a cost advantage over road for long distance haulage of bulk products, in the case of wheat there are other factors which have contributed to the dominant position of rail transport. These include the lack of road receival facilities at ports (in New South Wales, for example) and legislative restrictions (as in Queensland, Victoria and Western Australia, though not interstate). With the exception of Westrail, the rail authorities are protected from competition with other railways. There are no restrictions on road transport of wheat in South Australia, which has the shortest average distance for transporting wheat and the largest proportion of wheat transported to ports by road.

Wheat is shipped from twenty ports. Each port is controlled by a statutory public authority whose role and functions are detailed in state legislation. A considerable number of these ports cannot completely load large ships, with the result that some ships have to load at two or more ports.
The current institutional arrangements governing wheat distribution have given rise to several efficiency problems. Inefficiencies in the wheat distribution system may occur due to the mixing of social (non-commercial) and efficiency goals, the inadequacy of incentives for good economic performance in the current institutional arrangements, and the fact that the organisations providing distributing services have a state rather than a national perspective. The Bureau proposed three basic options for changing the institutional arrangements to overcome these problems (Spriggs et al. 1987).
The first option was to remove non-commercial objectives and to improve incentives for efficiency in the existing statutory monopolies. Additional legislative amendments were proposed to eliminate conflict of interest on authority boards, to increase the accountability of the authorities and to improve co-ordination in the grain distribution system. It was concluded that competition would encourage increased efficiency; thus, the second option was to introduce competition to the existing statutory monopolies as well as making the changes included in the first option. The third option was to privatise the bulk handling authorities, in addition to the changes involved in the first two options.
These three broad policy options represent an ascending order of change to institutional arrangements in the grain distribution industry. In examining the marketing and assistance arrangements in the wheat industry it will be necessary to consider them in relation not only to the current institutional arrangements in the distribution system but also in relation to possible changes in the distribution system following the Royal Commission into Grain Storage, Handling and Transport.
1.5 Industrv Outlook
During the 1980s there has been a persistent imbalance between world wheat production and demand, with a consequent accumulation of stocks, particularly in the United States, the European Community and Canada. This imbalance has resulted from a decline in wheat import demand together with the persistence in the United States and Europe of support policies which have divorced the prices paid to farmers for wheat from the price realised for the same wheat on the world market. As a consequence, world wheat prices have fallen markedly (Love 1987a). The result has been falling real farm incomes in the non-subsidising export countries and, in the case of Australia, the triggering of temporary price support under the government's guaranteed minimum price arrangements. This price support, while assisting growers, has covered only part of the decline in average net returns experienced by growers from 1985-86 to 1986-87.
From the peak of almost 13 million ha in 1983-84, the area planted to wheat in Australia has declined by 13 per cent to just over 11.2 million ha in 1986-87, and is estimated to have declined further to around 9.4 million ha in 1987-88 (BAE 1987a). To date, the effect of this decline in area (and consequently in production) on export sales has been cushioned by sales from the large wheat stocks accumulated from the large 1983-84 and 1984-85

harvests (figure 1). While production has fallen, exports have risen, reaching a record 16 Mt in 1985-86.
The full effect on exports of the production decline will become apparent from the 1987-88 season. Stocks at the end of 1986-87 are expected to be close to minimum carryover levels, and exports in 1987-88 will be almost exclusively of wheat produced in that year. With 1987-88 production forecast at about 13 Kt, 1987-88 exports could be around 11 Mt, or about 28 per cent lower than in 1986-87.
The prospects for the Australian wheat industry over the next few years are for production to remain below 14 Kt, exports to be 11-12 Mt, the ASW guaranteed minimum price to be under $135/t, and average net return to growers to be in the region $90/t to $100/t. This situation will lead to a further swing away from wheat production into livestock enterprises, and a further decline of wheat as a contributor to exports and national income.
While world stock levels remain high relative to use, low wheat prices are likely to persist in the medium term and a further decline in wheat production will be experienced in Australia. In the current low price period, however, some of the adjustments required to bring world wheat supply and demand into balance are occurring. The high and rising costs of US and EC price support policies are encouraging these countries to restrain production. Low prices are gradually building a recovery in world wheat import demand and reducing the incentive of countries to use the export market for the disposal of occasional surpluses as they strive for self- sufficiency (Love 1987b). For a traditional wheat producer such as Australia, survival through the current market recession and ability to take advantage of any future market recovery will depend on removing any self- imposed impediments to efficient wheat production, distribution and marketing.
Figure 1: AUSTRALIAN WHEAT PRODUCTION, EXPORTS AND CLOSING STOCKS 25-
Production
20-
B...
15-
1°-
+c--- .. Exports C---,-----C-- ----_. a... S.
.S* .. ... .. .S.. . S..
S..
. S . . . Closing stocks
5-
Mt
Minimum closing stocks - a . . . . . . . ....... . .... .. . - ----
I I I l 1983 1984 1985 1986 1987 - 84 -85 -86 -87(~) -88(f)
(f) Forecast. (p) Preliminary. Source: BAE (1987a).

1.6 Farm Incomes
The challenge involved in maintaining a viable wheat industry becomes obvious when recent data on wheat farm income and debt are examined. Falling cereal prices and rising farm input prices and off-farm marketing costs have resulted in estimated average incomes of wheat and other crop farms falling to zero in 1986-87 (see figure 2 and revised 1986-87 projections in table 2). Negative farm incomes have become increasingly prevalent over the past few years, with 55 per cent of wheat and other crop farms having negative farm incomes in 1985-86 compared with only 15 per cent in 1979-80. However, a quarter of wheat and other crop farms still had farm incomes in excess of $20 000 in 1985-86 (Hall and Backhouse 1987). The average contribution of wheat and other crop farms fell from 58 per cent in 1983-84 to 48 per cent in 1985-86 (BAE 1987b). Simultaneously the importance of other crops increased substantially, to 26 per cent, with livestock receipts rising slightly to 18 per cent.
While depreciation of the Australian dollar has, in the recent past, shielded growers to some extent from the sharp decline in world wheat prices, rising interest costs have had an adverse effect on incomes. This rise has been due to both rising interest rates and the increased debt of many farms. Interest costs of wheat and other crop farms represented 18 per cent of their total cash costs in 1985-86 - double the 1977-78 share.
The rise in farm debt has been due to an increased demand for working capital, particularly after the 1977-78 and 1982-83 droughts, and the need for capital to expand farm operations by acquiring both new machinery and land. During the late 1970s and early 1980s wheat and other crop farms increased their debt while expanding their operations when land values were relatively high, and rising, and cropping incomes were good. The result is that, since 1977-78, this group of farms has experienced the fastest rate of increase in real average farm debt of any broadacre industry (figure 3). In 1985-86 the average debt of wheat and other crop farms was $127 000, and 12.5 per cent of these farms had debts in excess of $294 000. (However, in the same year, a quarter of wheat and other crop farms had no debt.) The average debt of these farms rose again in 1986-87 to $137 000, whereas the average debt for all broadacre farms remained around the 1985-86 level of $80 000.
In 1986-87, land prices in general were below the long term trend, largely because of high interest rates and the poor prospects of cropping activities. Consequently, farmers in the cropping sector, who have considerable debt and limited cash flow, are experiencing a marked reduction in their ability to service debt and a fall in their level of equity. This is illustrated by the relatively high proportion of wheat and other crop farms which are estimated to be financially 'at risk': 19 per cent, in 1985-86, compared with only 5 per cent of all farms surveyed by the Bureau. (A farm is classified as 'at risk' if its equity ratio is less than 70 per cent and if its cash margin - that is, total cash receipts less cash costs, repayment of one-eighth of outstanding debt and a family living allowance equal to the adult pastoral award wage - is negative.)
Some wheat farmers are responding to their declining level of returns by switching to livestock, and wherever possible by reducing costs and reorganising their financial commitments. In the short term, wheat and other crop farms face great financial pressures due to declining farm incomes and land values coupled with rising debt levels and interest costs.

Figure 2: FARM INCOME OF FAMILY FARMS
601 1988-87 dollars
I Figure 3: REAL FARM BUSINESS DEBT

Table 2: WHEAT AND OTHER CROPS INDUSTRY: FINANCIAL PERFORMANCE MEASURES, BY STATE AND ALL BROADACRE INDUSTRIES FOR AUSTRALIA Average per farm
New South Wales Victoria Queensland Western Australia . Unit 1985-86 (p) 1986-87 (2) 1985-86 (p) 1986-87 (2) 1985-86 (p) 1986-87k) 1985-86 (P) 1986-87 ( 2 ) Item
Components of investment returns Total cash receipts $ 175 240 (15) 170 000 94 580 (16) 115 600 107 350 (9) 91 000 168 570 (12) 208 800 Total cash costs $ 171 690 (21) 180 300 66 380 (11) 70 900 85 610 (12) 97 500 132 400 (11) 142 300 Farm cash operating surplus $ 3 540 (ns) -10 300 28 200 (35) 44 700 21 740 (45) -6 500 36 170 (30) 66 400
Buildup in trading stocks S 3 920 (65) 2 100 3 200 (31) 700 3 050 (51) 2 400 3 450 (34) 1 800 Depreciation $ 31 010 (12) 32 700 25 490 (11) 25 600 20 600 (8) 21 700 35 670 (10) 38 600 Operator and family labour $ 22 230 (10) 23 300 20 110 (13) 21 100 20 560 (7) 21 600 20 990 (8) 22 000 Return to capital and management S -45 180 (37) -64 200 -14 200 (44) -1 300 -16 370 (53) -47 400 -17 050 (62) 7 600
Return adjusted to full equity S Capital appreciation $ Full equity return, incl. capital appreciation S
Rate of return, excl. capital appreciation %
Rate of return, incl. capital appreciation %
Real rate of return, incl. capital appreciation %
Other financial items Farm capital at 30 June Fare business debt (a) Farm liquid assets (a)
Components pf farm income on family farms Total cash receipts $ Total cash costs $ Farm cash operating surplus $
197 210 (14) 191 600 94 580 (16) 115 600 106 570 (9) 192 990 (20) 202 400 66 380 (11) 70 900 83 390 (13) 4 220 (ns) -10 700 28 200 (35) 44 700 23 180 (36)
Buildup in trading stocks Depreciation
Farm income Farm income per work-year of family labour
Off-farm income
-25 810 (75) -44 700 5 910 (ns) 19 800 5 850 (ns)
(continued below)

Table 2 (continued)
south Australia Australia All broadacre 1985-86 (p) 1986-87 ( 2 ) 1985-86 (p) 1986-87(z) 1985-86(p) 1986-87 ( 2 )
Components of investment returns Total cash costs $ 101 420 (14) 118 900 129 420 (6) 138 800 102 590 (3) 111 200 Total cash recelpts $ 65 160 (13) 71 000 105 700 (9 ) 113 900 80 310 (4) 83 300 Farm cash operating surplus $ 36 260 (19) 47 800 23 720 (24) 25 000 22 280 (9) 27 900
Bulldup In tradlng stocks S 780 (ns) 1 l00 2 970 (25) 1 600 4 660 (25) 3 300 Depreczation $ 23 320 (14) 24 500 27 030 (5) 28 400 16 800 ( 3 ) 16 600 Operator and famlly labour $ 18 220 (12) 19 100 20 530 (5) 21 500 18 040 ( 2 ) 18 900 Return to capltal and management $ -4 500 (ns) 5 300 -20 870 (24) -23 300 -7 910 (22) -4 300
Return adjusted to full equity $ 6 100 (ns) 18 000 -1 490 (ns) 2 300 4 4 1 0 (31) 11 000 Capital appreciation $ -86 780 (16) 2 000 -90 650 (13) -22 500 -41 170 (8) 0 Full equlty return, incl. capital appreciation $ -80 690 (18) 19 900 -92 140 (12) -20 200 -36 760 (9) 11 000
Rate of return, excl. capital appreciation % 0.8 (ns) 2.7 -0.2 (ns) 0.3 0.6 (31) 1.6
W Rate of return, 4 incl. capital appreciation % -10.6 (13) 3.0 -12.0 (10) -3.0 -5.1 (9) 1.6
Real rate of return, incl. capital appreciation
Other financial items Farm capital at 30 June Farm business debt (a) Farm liquid assets(a1
Components of farm income on family farms Total cash receipts $ 111 450 (14) 130 500 135 200 (6) 145 600 107 730 (3) 114 600 Total cash costs $ 72 310 (12) 77 100 110 210 ( 9 ) 117 900 83 700 (4) 86 100 Farm cash operating surplus $ 39 140 (20) 53 500 24 990 (23) 27 800 24 030 ( 9 ) 28 500
Buildup in trading stocks Depreciation
Farm income Farm income per work-year of family labour
Off-farm income
(a) At 30 June. (p) Preliminary survey estimates. (2) Projected survey estimates. na Not available. ns Not supplied. Note: Figures in parentheses are relative standard errors, expressed as percentages of the estimates. A guide to interpreting these is included in 'Survey definitions and procedures' (BAE 1987b), as are explanations of other items. Source: BAE farm survey.

2. WHEAT PAYMENT ARRANGEKENTS
It is important not only that the payment system should give a quick and accurate indication of market prices, but also that the actual costs of marketing and distributing wheat should be apparent to growers. It is, after all, the growers who pay these costs and thus have the incentive to minimise them. Marketing and distribution costs have become substantial in relation to wheat growers' returns. In the five years up to and including 1985-86, these costs (from the bulk handling authority silo to port) averaged 25 per cent of total gross returns to wheat growers (table 3).
The interest cost of borrowings by the Wheat Board is the third largest component of domestic off-farm wheat marketing costs, and in the same five- year period averaged 28 per cent of total wheat marketing costs, or 7 per cent of growersf returns (table 3). Over this period, interest costs increased by around 40 per cent, due mainly to rising interest rates and increases in the carryover of wheat by the Wheat Board. The question must be asked whether the payment system can be improved.
In evaluating the current payment system, several aspects need to be addressed. The first aspect examined here is the widespread, traditional practice of pooling revenues and costs - a practice which is considered by many growers as equitable. This pooling occurs over time, location and quality. Cost pooling occurs at the national, state or regional levels and is applied across classes of wheat, among different areas of production, and over the period of time that the costs of marketing each year's crop are incurred. Revenue pooling occurs at the national level and is applied within
Table 3: DOMESTIC OFF-FARM WHEAT MARKETING COSTS
Item 1981-82 1982-83 1983-84(a) 1984-85(a) 1985-86(a)
S/t S/t S/t S/t S/t Handling and storage costs 12.84 12.93 15.17 15.63 14.98
Freight to terminal ports 14.93 14.15 18.08 16.28 13.61
AWB interest and bank charges 12.17 6.84 11.43 15.30 17.00(s)
AWB administration and depreciation 0.87 1.54 0.81 1.38 1.88
Marketing and .promotion 0.18 0.47 0.17 0.17 0.62
Wheat research levy 0.20 0.25 0.40 0.40 0.45
Total 41.19 36.18 46.06 49.16 48.54
Gross pool return 163.14 187.15 166.91 183.20 176.87
(a) Incomplete. Further costs may be incurred until the pool is finalised. (S) Estimated by the BAE. Sources: Australian Wheat Board (1986a); BAE (1986a).

classes of wheat, across markets for wheat, and over the period of disposal of a wheat crop.
Pooling is not always an inefficient practice, and will be present to some extent under any circumstances. When the administrative costs of separating costs or revenues become larger than the benefits of doing so, pooling of these costs or returns is efficient. In a competitive market, the price mechanism will ensure that costs or revenues will be pooled only to the point where the benefits of further disaggregation do not exceed the costs of that disaggregation. It is doubtful whether this is true of the widespread pooling of costs and revenues which is still practiced in Australian wheat marketing and distribution.
Second, the method of payment needs to be evaluated in terms of the accuracy and timeliness of market signals it gives to growers and the flexibility it provides for adjusting to changing market conditions.
It is worth noting that these aspects of the payment arrangements are quite distinct from the issue of underwriting assistance (which will be examined in section 5). Although this assistance is, for convenience, included by the Wheat Board within its payment arrangements, it is not a return from the market and could be paid separately from the Wheat Board returns to growers.
2.1 Im~lications of Revenue Pooling
Pooling of revenues results in all Australian wheat growers being paid the average return from the sale of wheat of the delivered category. In spite of this distinction of categories, these payments are still made across fairly broad quality ranges. These averages are across all markets (local and export) and over the time taken to dispose of a year's deliveries. In this subsection, the distribution of net returns and risk among growers resulting from revenue pooling arrangements under the current wheat marketing plan is discussed.
(a) Quality
If the number of classes of payment provided to growers - termed the degree of payment segregation - is sufficient so that there will be premiums and discounts to growers corresponding to all the premiums and discounts paid for quality differences by the buyers, cross subsidisation among growers on the basis of quality will be minimised. It might be asked whether this degree of segregation would entail additional costs in physically segregating wheat categories. Wheat is physically segregated to a larger extent than the current number of paymetit categories, due to natural segregation by region as well as administered segregation. Thus, further payment segregation would be possible without additional segregation costs.
Under the present Wheat Marketing Act, growers of around 70 per cent of Australia's wheat crop are paid the pooled price for Australian standard white (ASW), although there is a number of selling categories within the ASW category. A considerable degree of payment cross subsidisation therefore occurs among growers of ASW quality wheat. The only quality signals that ASW wheat growers currently receive are from varietal dockages (which discourage the production of certain varieties) and discounts levied on deliveries that are weather-damaged or contaminated by foreign materials. Because the number of ASW selling categories is larger than the number of ASW payment

categories, distorted incentives are being provided to growers. In particular, growers do not receive the correct price incentives for the production of grain with qualities demanded by the market. This can lead to insufficient production of these grains.
If there is inadequate payment segregation, then within a particular pool category, producers of high quality wheats will in effect subsidise producers of lower quality wheats (assuming that there is a premium for quality in the marketplace). The existence of such cross subsidisation may discourage production of higher quality wheats within the ASW category, if producers have control over quality and especially if there is a production tradeoff between quality and yield. This problem has been recognised by the Wheat Board, which announced early in 1987 that payments for ASW quality wheat would be segregated by protein content.
The Australian Wheat Board (1987a) has proposed that the payment variation for ASW wheat should be $3/t for each percentage point of protein between 9.5 per cent and 11.5 per cent protein, and $2/t for each percentage point of protein outside that range. The size of the proposed differentials indicates that significant cross subsidisation has occurred hitherto. It remains to be seen whether the differentials suggested far the Board's pilot scheme will be beneficial.
(b) Time
The full payment to the grower, which may not be completed until several years after delivery, is based on returns from the sale of a wheat crop not at a particular point in time (such as the time of delivery to a bulk handling authority), but over a period of years. Thus, pooled returns to growers do not specifically reflect returns during the year in which the particular grower's wheat was grown or delivered. A peculiarity of the current pooling system is that each year's production (pool) is kept quite separate even though its sale may not be finalised for several years, and sales for more than one season's crop are made concurrently. Revenue within each year's pool is averaged not only across broad quality ranges and across all markets but over the time taken to sell that year's crop.
There seems little difference in principle between pooling revenue from a crop over the time taken to sell that crop, and pooling revenues between crops. Significant distortions and delays to market signals result from pooling over a long selling period; as wheat is an annual crop, if pooling of returns were confined within each crop year there would be a less distortionary effect on production decisions.
A reduction in the time taken for each wheat pool to be finalised could thus reduce distortions of market signals. This could be achieved through a system whereby each pool buys out the previous year's pool at the expected returns. In October 1986 the Wheat Board offered growers an immediate discounted payment ('cash out' option) for their remaining equity in the 1984-85 pool. After seven months, only 23 per cent of the 1984-85 pool had been cashed out under this option. The low proportion of growers accepting this offer indicates some of the problems of such a scheme. For example, growers have little information on which to judge whether the Board's estimate of the remaining equity is a true reflection of expected returns for the wheat remaining in the pool. Also, as discount rates differ between growers, some growers may have lower discount rates than that used by the Wheat Board and hence would not accept the discounted value. A simpler alternative would be to use normal accounting procedures and close the pool

at the end of the year by valuing the stock and transferring the inventory to the next year's pool.
Growers delivering to the Wheat Board have no control over the marketing of their particular crop and are forced to accept the pooling of the risk due to price fluctuations. In contrast, growers in an unregulated market, such as the US market, retain significant choice as to when their wheat is marketed. Growers initially bear the risk of market price fluctuations when they decide to produce wheat. A grower may seek to mitigate this risk, for example by hedging on che futures market. In Australia the risk of market fluctuations over time is spread over all participants in the pool, regardless of their risk preferences.
In summary, the current practice of pooling revenue across broad quality ranges and over a long selling period is distorting and delaying market price signals to growers. Such pooling should be limited, as discussed above, and revenue should be disaggregated where the benefits of doing so exceed the costs. However, under current marketing arrangements, there is little incentive to restrict pooling. For example, in attempting to further disaggregate revenue the Wheat Board could face resistance from growers who would be required to pay any additional administrative cost. On the other hand, the benefits of disaggregating revenue - that is, the improved market signals leading to more efficient production decisions - may not be immediately clear to growers or to the Wheat Board.
2.2 Implications of Cost Poolin9
(a) Pooline of distribution costs
Costs of distribution (storage, handling and transport) are pooled across location, quality and time, and have been pooled on a state basis since 1978-79. These costs are pooled across all categories and grades of wheat regardless of the costs associated with segregating or handling any individual quality of wheat. No account is taken of the differences in efficiency that exist among silos at different locations or in the operating, maintenance and capital costs of the silos.
Spriggs et al. (1987) concluded that the pooling of distribution charges on a state basis necessarily gives rise to cross subsidies which translate into incorrect price signals. Because the charges levied on growers do not vary between delivery points, there is no incentive for growers to deliver to the cheapest point and thus to reduce distribution costs. The end result is a cross subsidy from low cost users to high cost users, and higher total costs than necessary.
Distribution charges are pooled over time, with no adjustments for the timing of wheat deliveries. This, combined with the early returns of the current payment system, results in the rational choice by growers to deliver at harvest, which leads to long queues at receival points, peak load problems, distorted decisions regarding on-farm storage, and possibly overcapitalisation in delivery facilities. To reduce carrying costs and to minimise peak load problems at delivery, the system of cost pooling would have to be altered.
Since the charges paid by growers do not necessarily reflect the costs incurred by each individual, the pooling of distribution charges favours some growers at the expense of others and eliminates the incentive to

minimise costs. If charges were related more closely to costs, growers, bulk handling authorities, rail authorities and the Wheat Board would have more effective incentives to minimise the costs of wheat distribution. As discussed in Spriggs et al. (1987), widespread cost pooling would not occur in a competitive market. Under current arrangements, however, there is little pressure to abandon cost pooling, and indeed growers have in the past exerted pressure to continue it.
(b) pool in^ of marketine costs
The Wheat Board's marketing costs are paid equally (per tonne) by all wheat growers. They include interest costs (of financing advance payments), marketing and promotional expenses, insurance on export credit sales and other finance operations, and general administration fees including labour charges and sundry items. As shown in table 3, interest costs are by far the largest component of the Board's marketing costs.
The Wheat Board's marketing costs are pooled on a national basis and over all wheat delivered - that is, over all qualities of wheat, even though the costs associated with marketing different qualities may vary. For example, although some grades may be sold more quickly than others, the interest cost is averaged over all grades so that growers who supply grades which are sold quickly have to contribute to the financing costs of other, unsold grades. Financing costs will also differ for each quality category, since they earn different advance payments. As is shown in table 4, if all categories were sold at the same time, growers who delivered feed wheat could be subsidising those who delivered higher value wheat such as ASW or prime hard (by helping to finance their higher advance payments). On the other hand, if prime hard wheat were sold more quickly than feed wheat the subsidy could be the other way. The result of such pooling is that generally the grower is given an incorrect signal, which in turn may lead to the distortion of production decisions.
As long as wheat from all growers is supplied equally to all importers of Australian wheat, all growers should contribute equally to the costs of marketing their wheat in all these markets. This pooling of marketing costs across all markets may result in inadequate incentives to minimise costs, particularly if growers are unaware of the cost differences among markets. Finally, because these costs are pooled over the time taken to sell the wheat crop, the risks associated with the costs of marketing wheat during the entire disposal period of a particular year's pool are equally borne by all wheat deliveries in that year.
Like the pooling of distribution costs and that of revenue across wheat qualities, the pooling of marketing costs (particularly across wheat qualities and over long periods of time) leads to incorrect signals to growers, which in turn encourage inappropriate decisions regarding the level of wheat production.
2.3 Evaluation of Current Payment System
The current payment system has been developed in an attempt to improve market signals and the timeliness of payments to wheat growers by increasing the advance payment (table 5). On the other hand, wheat payment arrangements characterised by a high advance payment invariably encourage growers to deliver their wheat to bulk handling authorities as soon as it is harvested. This in itself would not result in inefficient delivery decisions. However,

Table 4: ILLUSTRATIVE FINANCING COSTS FOR VARIOUS WHEAT CATEGORIES
Cost relative Guaranteed Monthly Total to Australian minimum Storage interest financing standard
Category price period rate(a) cost white
$/t months % $/t $/t
1984-85 Prime hard 155.35 6 0.833 7.77 +O .50 ASW(b) 145.35 6 0.833 7.27 Feed 100.35 6 0.833 5.02 -2.25
Prime hard 155.35 3 0.833 3.88 -3.39 ASW 145.35 6 0.833 7.27 Feed 100.35 9 0.833 7.53 +0.26
1985-86 Prime hard 174.87 6 1.042 10.93 +1.56 ASW(b) 149.87 6 1.042 9.37 Feed 114.87 6 1.042 7.18 -2.19
Prime hard 174.87 3 1.042 5.46 -3.91 ASW 149.87 6 1.042 9.37 Feed 114.87 9 1.042 10.77 +l. 40
1986-87 Prime hard 157.62 6 0.833 7.88 ASW(b) 139.83 6 0.833 6.99 Feed 105.77 6 0.833 5.29 -1.70
Prime hard 157.62 3 0.833 3.94 -3.05 ASW 139.83 6 0.833 6.99 Feed 105.77 9 0.833 7.93 +O .94
(a) Based on BAE estimate of average Australian Wheat Board borrowing costs. (b) Australian standard white. Source: Australian Wheat Board (198713).
as the costs incurred by early delivery over a short period are pooled across all growers, there is no incentive for individual growers to minimise these costs. Because storage and handling costs are pooled, growers do not know the full cost consequences of delivery at different times. Also, because interest costs of meeting the advance payments are pooled, all growers pay the average financing cost even though their delivery times differ. The deferred delivery option is an attempt to circumvent this problem by reimbursing the interest. It is repaid at the Australian Savings Bond rate, which in 1985-86 was higher than the Wheat Board's average interest rate and thus more than repaid the growers.
(a) The finance effects
A problem with the current system is that it forces on all growers the same borrowing regimen despite differences in cash flow requirements and variations in opportunity costs of growers' funds. Ideally an efficient

Table 5: ADVANCE PAYMENTS
Borrowings Total Advance Receival Advance by AWB for payment to on total
Season by AWB (a) payment (b) advance (c) grower (d) payment
1969 -70 9 755 40.42 394 43.85 92 1970-71 6 936 40.42 280 46.82 8 6 1971-72 7 666 40.42 310 48.75 83 1972-73 5 439 40.40 220 49.54 82 1973-74 11 200 44.09 494 104.36 42 1974-75 10 705 44.09 472 104.94 42 1975-76 11 258 55.12 621 95.98 5 7 1976-77 10 933 66.00 722 79.45 83 1977 -78 8 540 66.00 564 88.25 7 5 1978-79 17 456 75.00 1 309 129.55 58 1979-80 15 327 114.71 1 758 154.55 74 1980-81 10 059 131.92 1 327 147.42 89 1981-82 15 547 141.55 2 201 149.92 94 1982-83 7 887 141.32 1 115 178.30 79 1983-84(p) 21 111 150.00 3 167 154.50(s) 97 1984-85(p) 17 546 145.35 2 550 166.35 (S) 8 7 1985-86(s) 15 085 149.87 2 261 157.37(s) 95 1986-87(s) 15 140 139.83 2 117 139.83(e) 100
(a) Receival of all wheat. (b) For ASW wheat or equivalent. (c) Receival multiplied by ASW advance (which accounts for about 70 per cent of receival). (d) ASW basis for states other than Western Australia; prior to deductions for distribution services, wheat tax and levies. (e) Estimate based on assumption of no further payments. (p) Preliminary. (S) Estimated by BAE. Source: Australian Wheat Board (1986a); BAE (1986a, 1987a); Australian Wheat Board.
payment system should give a quick indication of market returns and should give growers control over their financing arrangements, so that they can adjust their borrowings to suit their particular circumstances. The deferred payment options offered under the current arrangements do address this need, but only partially. Growers still have very limited options in terms of the timing and the amount of borrowings.
Under current arrangements, growers compulsorily receive an advance payment and pay interest on that payment until the wheat is sold. It must be asked, first, whether all growers require this finance; second, (if so) whether they could obtain it more cheaply than the Wheat Board; and, finally, whether they require only a part of it, or require it for a shorter period. In other words, is any part of the present interest cost unavoidable?
On average, the Wheat Board can obtain finance at a lower rate of interest than can an individual grower. In 1985-86 growers faced an average interest rate of around 18-19 per cent (Reserve Bank of Australia 1987), whereas the average rate on Wheat Board borrowings was about 12.5 per cent. This difference is due to several factors. One of these is only transitory.

In 1985-86 Australian interest rates were well above rates in many other countries. The Board was able to take advantage of this difference, and borrowed largely overseas. However, this difference in rates is now declining; moreover, some individual growers can also borrow overseas. The other main reason for the Board's ability to secure funds at a relatively low rate of interest derives from its very high credit rating, which arises from government underwriting (see section 5).
Although growers may on average face higher borrowing costs than the Wheat Board, some growers may have access to cheaper alternative funds. The off-farm liquid assets of farmers are a readily accessible source of funds that could be used if an advance payment were not available. On average, off-farm liquid assets per wheat farm were lower than the advance payment in 1985, except in Queensland (table 6). Nevertheless, at 30 June in 1985 and 1986 about 24 per cent of wheat growers surveyed by the Bureau had liquid assets in excess of their advance payments. (Allowing for sampling error, there is a 2 in 3 chance that the true value for this figure was between 20 per cent and 28 per cent.) These particular wheat growers, who received up to 20 per cent of the total advance payments, may not have required this advance. In addition, many wheat growers may not need to borrow the full amount of the advance payment.
The Bureau's survey data indicate that, at 30 June in 1985 and 1986, the ratios of the state average amounts of liquid assets to the state average advance payments ranged from 28 per cent in Western Australia to 116 per cent in Queensland (table 6). Cash flow of course varies throughout the year; this comparison, however, was made at a time of generally low liquidity following planting. The rates of return that growers received on
Table 6: OFF-FARM LIQUID ASSETS, WHEAT AND OTHER CROPS, AT 30 JUNE 1985 Average per farm
I tem
New South Queens- Western South Wales Victoria land Australia Australia Australia
Trading bank deposits 4 425 2 949 5 142 2 113 480 3 219 Savings bank deposits 2 177 3 185 1 610 6 633 8 549 3 982 Interest bearing deposits 18 979 6 687 48 971 25 942 8 059 18 960 Debentures, bonds 771 10 582 145 1712 1 511 3 257 Other financial institutional deposits 2 668 1 663 6 275 658 1 847 2 367 Company shares 15 17 128 1 110 2 060 495 Total equalisation deposits 18 244 460 676 0 226 Other 108 1 279 8 2 0 8 366 1 507
Total liquid assets 29 161 26 606 62 813 38 844 30 872 34 013
First advance 46 665 38 402 54 324 138 230 49 777
Source: BAE farm surveys.

most types of liquid assets would have been lower than the Wheat Board interest rate (table 6 and Reserve Bank of Australia 1987). Thus, growers might have been better off if they had used these assets in place of all or part of the advance payment, had those options been available.
The advance payment is a system whereby credit is forced upon the wheat grower. Whether or not growers require the Wheat Board to borrow on their behalf, current arrangements dictate that growers still have to incur the loss of any difference between the Board's interest rate and the return on money they themselves invest. On average, growers may benefit from the Board's borrowing activities, but, as shown above, some may not.
In table 7 a number of alternative payment arrangements are presented with their key features and associated benefits and costs. This list is by no means exhaustive; it includes mainly those options that have been proposed by grower or industry groups.
From the standpoint of giving growers more control over their own finances, a better alternative to the current system would be to offer an advance payment as an option, with a choice as to the timing and amount as well as whether an advance is taken or not. The cost of offering growers more control over their borrowing requirements may well include higher Wheat Board administration costs, which would be passed back to growers. The benefits of offering a more flexible system would need to be weighed against the costs of operating the system.
(b) The subsidv effect
Another aspect of the current payment arrangements which needs to be addressed is the appropriateness, from a national viewpoint, of making funds available to wheat growers at concessional interest rates. As noted above, a major reason why the Wheat Board can offer relatively low interest rates to growers is its high credit rating, due in part to government underwriting. This amounts to a subsidy on funds for wheat growers. The rationale for such a subsidy is questionable, in view of the recent deregulation of the Australian capital market, the availability to eligible farmers of interest rate subsidies through the Rural Adjustment Scheme and the distorting effect that such subsidies have on the allocation of funds in Australia.
Subsidising funds to wheat growers will increase their use of funds at the expense of those investments whose returns are higher or less risky than those of wheat growers but lower or more risky than the Wheat Board can offer. Thus, funds will not be directed to where the highest return is available. On efficiency grounds, provision of this subsidy is undesirable. Whether there are more appropriate methods of assisting the wheat industry is discussed in section 5.
To avoid this misallocation yet provide wheat growers with a quick market signal, the preferred arrangement would be for the Board to issue negotiable certificates to growers on delivery of their wheat. The certificates would detail the quality and quantity of wheat delivered. Certificates would be freely negotiable and usable as collateral for borrowings by the grower. On receipt of returns from sale of the wheat the Board would redeem the certificate. Such a system should not increase the administrative cost of the Board but would allow growers full control over their finances. Also, because the certificates would have a market value, they would give growers a quick indication of the market return on their crops.

Table 7: ALTERNATIVE WHEAT PAYMENT ARRANGEMENTS
Policy option Benefits Costs
1. Current svstem
(a) Advance pavment
. High advance payment . Improved cash flow . Large interest cost
. Cost and revenue to growers . Distortion of market pooling signals
. Cross subsidies
. Resource misallocation
. Peak load problems (b) Deferred delivery option
. Growers paid interest . Reduced peak load . Increased cost of (at Australian Savings . Borrowing less bunched administration Bond rate) on interim advance for delivery after specified date
(c) Deferred pavment option
. Three options; . Growers offered some . Increased cost of deferred payments earn flexibility in payment administration interest at Australian . Lower AWB borrowings Savings Bond rate . Borrowing less bunched
(d) Cash-out option
. AWB purchases growers' . Improved market signals . Lower returns possible equity in a pool prior . Payments finalised . Increases GMP payout to pool being finalised earlier risk
. Equity problems 2. H i g h advance payment
. Same advance as l(a) . Improved cash flows . Large interest cost
. No pooling (costs, to growers quality)
3. Lower advance Davment
. Similar to l(a); advance . Lower AWB borrowing . Reduction of growers' lower proportion of GMP . Reduced effect on cash flows
. No pooling (costs, money supply quality)
4. No advance Davment
. Growers paid as wheat . Much lower AWB . Large fall in growers' is sold borrowing cash flows; increased
. No pooling (costs, . Greatly reduced effect need for borrowings quality) on money supply
(Continued)
27

Table 7 (continued)
Policy option Benefits Costs
5. Early uool closure
. Next crop buys unsold . Quicker final payments . Need for grower fund stock of previous crop . Improved market signal . Problems in estimating at price set by AWB . More certain timing remaining grower's
. No pooling (costs, of future payments equity in a pool quality)
6. Voluntarv advance uavment
. Growers choose amount . Lower AWB borrowing and timing of advance . Greater grower
. No pooling (costs, control of finance quality)
. Increased cost of administration
7. Negotiable certificates
. On delivery, given . Grower control of . Lower grower returns tradable certificate, finance possible if insider detailing wheat . Improved market signals trading occurs delivered and expected . Much lower AWB . Transaction costs re turn borrowing . Higher borrowing
. No pooling (costs, . Early payment available cost quality

3. DOMESTIC WHEAT MARKETING
3.1 Characteristics of the Domestic Wheat Market
Over the past forty years, as wheat production has more than trebled, the domestic market has come to account for a declining proportion of total wheat sales (table 1). Domestic sales have remained reasonably stable over time, averaging 2.2 Mt a year from 1979-80 to 1985-86. The most variable component of domestic demand is that for stock feed wheat (figure 4 and table 8), which depends on seasonal conditions and the price and availability of alternative feed grains.
(a) Wheat for human consum~tion
Wheat for human consumption is sold to millers for manufacture into flour. Annual sales are relatively constant at around 1.1 Mt a year (figure 4). The main domestic use of flour is bread making, which in 1985 accounted for 47 per cent of total domestic flour use (table 9). In recent decades the use of wheat for human consumption per head of population has been falling. Given the low response of demand to price changes (Ryan 1981; Myers, Piggott and MacAuley 1985) a price reduction is unlikely to result in any appreciable increase in demand from millers for human consumption wheat.
The flour milling industry comprises only four major millers and 48 flour mills (Australian Bureau of Statistics 1986). These small numbers have resulted from technological change, integration of flour mills with flour users and declining export markets for flour. Milling is often vertically integrated with other processing activities such as the manufacture of
Figure 4: AUSTRALIAN WHEAT BOARD DOMESTIC WHEAT SALES 1.8-
1.5- Human consumption plus industrial
1.2- Stock feed
0.9-
0.6-
Industrial
0.3- -..-..--.-..-..R..
Mt I I l { I 1
1973 1975 1977 1979 1981 1983 1985 - 74 - 76 - 78 - 80 -82 - 84 -86 Source: BAE (1987b).

Table 8: DOMESTIC AND EXPORT USE OF WHEAT
Domestic sales AWB Stock Domestic stock feed Balance Total use as a
Human feed permit kept domes tic proportion Season consumption Industrial sales sales Total on- farm use Exports of exports
(a) 1 December to 30 September; previous years ended 30 November, and subsequent years ended 30 September. (p) Provisional. Sources: Australian Wheat Board (1986a); BAE (1987a).

Table 9: NATIONAL FLOUR USAGE
Usage Unit 1981-82 1982-83 1983-84 1984-85
Domestic uses
Bread % Pastry % Biscuits % Pasta % Packeted flour and mixes % Food manufacturers and other %
Starch/gluten manufacturers % Other industrial users %
Total domestic use kt 1043.6 1035.7 1123.4 1139.5
Exports
Total kt 1145.2 1126.9 1186.8 1200.1
Source: Bread Research Institute (1986).
bread, starch, gluten, biscuits and pastry. Also, some integration has occurred with stock feed processing because the bran and pollard by-product of the flour mills is an input for processed stock feed.
(b) Industrial wheat
The manufacture of starch, gluten and glucose accounts for most of the sales of wheat for industrial purposes. Wheaten starch is used in the paper manufacturing industry. Glucose is used in the food, confectionery and beverage industries. Wheaten starch and gluten are also exported. Like the flour milling industry, the processing of industrial wheat is in the hands of a small number of firms. In 1985 there were ten establishments manufacturing wheaten starch and gluten products (Australian Bureau of Statistics 1986). Moreover, none of these establishments was independent of flour milling.
Since 1979-80 the industrial use of wheat has increased from 250 kt to 350 kt a year. There is some association between this increase in industrial wheat use and movements in industrial wheat prices, the latter having fallen in real terms since 1980-81 (figure 5). This suggests that reductions in the price of industrial wheat to millers could lead to increased purchases, though the outcome would depend also on the relative export returns.
(c) Stock feed wheat
Stock feed wheat is used predominantly by the intensive livestock industries, although considerable quantities are also fed to sheep and cattle during drought periods. Though wheat is the main cereal grain used, feed grains are readily substitutable, and the relative use of wheat and

other grains depends on their prices, the nutritive value of the different grains and the type of animal being fed.
Figure 5: SALES AND PRICE OF INDUSTRIAL WHEAT 230- -360
- 340
/' Price (1985-86 dollars) -320 210-
-300
200- -280
-260
Stock feed manufacturing is located mainly in New South Wales and Victoria. Production of prepared stock feeds is about 2.6 Mt a year, of which pigs and poultry consume about 85 per cent.The large manufacturing
180-
$/t
firms are often vertically integrated with pig and poultry~production, and in some cases with flour milling. In 1985 there were 132 establishments producing prepared animal and bird feeds (Australian Bureau of Statistics 1986).
The use of wheat as a supplementary feed during drought is responsible for most of the fluctuation in the use of stock feed wheat and in the level
1979 1980 1981 1982 1983 1984 1985 - 80 -81 - 82 -83 - 84 -85 -86 Source: Australian Wheat Board (1986a).
" I I I I I
of domestic wheat sales. For example, 1.5 Mt was sold in the drought year 1982-83, compared with only 0.3 Mt in the following year, which had both a record harvest and record deliveries of weather damaged wheat suitable for stock feed (table 8).
- 240 . c- kt
3.2 Analysis of Current Marketing Arrangements
Previous wheat marketing legislation (covering the seasons from 1948-49 to 1983-84) expressly provided for price discrimination between domestic and export markets. During this period controlled domestic pricing was used as a means of raising and stabilising returns to growers. Transfers from consumers to producers, and vice versa, resulted (Longworth and Knopke 1982). Over the years, however, the effectiveness of this method of assistance diminished with the declining share of domestic to total wheat sales.

The setting of domestic prices above export prices will lead to incorrect price signals to growers which in turn will lead to higher production. The high domestic prices will also depress domestic consumption of wheat, particularly for industrial uses and stock feed, which are highly dependent on relative prices of competing materials and products. Setting domestic prices above export prices is thus an inefficient method of assistance to the industry (Industries Assistance Commission 1978, 1983; BAE 1983).
The Australian Wheat Board remains the sole seller of all domestic wheat, except for stock feed wheat sold under permit. This gives the Board significant market power, and for this reason wheat users have considered the maintenance of administered pricing provisions to be necessary. Under the current legislation domestic prices continue to be set administratively, although they are now based on the Wheat Board's export price quotes and there is no longer any intention to induce transfers between consumer and producer. In fact, there has been some criticism of this linkage of administered domestic prices with Wheat Board export quotes, on the ground that these quotes have recently been above average export returns and that transfers from consumers to producers are therefore likely.
(a) Wheat for human consum~tion
In the current Wheat Marketing Act a distinction is made between the pricing of wheat for human consumption (section 32(2)) and of wheat for industrial use and stock feed (section 32(3)). The price for human consumption wheat is set quarterly by averaging export prices being asked for the forward quarter and corresponding prices for the past quarter, the aim being to calculate a base price reasonably close to export parity. To this base price is added a margin intended to cover additional costs incurred by the Wheat Board in servicing the domestic market, and the Tasmanian freight levy.
This margin, while simple in intent, has proved extremely difficult to quantify in practice. The relationship between the Board and the millers is partly one of formal agreement and partly one of traditional practice, with the Board performing a number of services for the millers not performed for export buyers. For example, millers can reserve stocks of grain on the basis of their own quantity and quality requirements at stations nominated by themselves. They can select the best quality wheat and still only pay the administered price. This wheat remains unavailable for sale to another buyer unless it is later passed in by the miller. Similarly, under an agreement with the Board, millers can receive the equivalent of, on average, 45 days credit on payment. This contrasts with the situation of an export buyer, who must pay on loading, in either cash or commercial credit arranged with the Board.
The task of quantifying the margin was complicated initially by disagreement between the Wheat Board and the Flour Millers' Council of Australia on the appropriate components of the margin and their values; and then, when agreement was reached on this matter, by legal difficulties arising from the inclusion of cost components that were considered to be outside the provisions of the Wheat Marketing Act. Because of these difficulties, the human consumption price margin has remained at the $16/t initially set by the Minister for Primary Industry at the commencement of the current Act in October 1984.

The maintenance of a single per-tonne margin has resulted in. cross subsidisation among millers and between millers and growers. For example, one miller may reserve wheat but not take delivery until much later and then buy on credit; another miller may take delivery and pay immediately. As both millers are charged $16/t, the former will be subsidised by the latter, and even by growers if the total cost of interest and other services was more than $16/t. Also, the charging of a flat fee provides no incentive for individual millers to economise on servfces such as storage and information.
The problem of quantifying the margin to the satisfaction of all parties has revolved around the fact that, in the Act, the definition of the margin leaves open to interpretation the question of whether the 'costs' referred to are accounting or opportunity costs. The margin was intended to provide an adjustment to the administered price which would ensure that the Wheat Board would receive the same net returns from the sale of a parcel of human consumption wheat to a domestic buyer as it would receive from the sale of the same parcel of wheat to an export buyer: that is, to enable the Board to be neutral in its relative treatment of domestic and export buyers. On this interpretation the cost referred to in the Act clearly is an opportunity cost, and the problem becomes the difficult one of quantifying this cost.
The fundamental limitation of the existing administered pricing arrangements resides in the inability of either the Board or any buyer to pass appropriate information about costs and values through prices. For example, under the existing arrangements the Board cannot provide an incentive for millers to economise on storage costs by charging for storage of specific parcels of grain. Similarly, a potential buyer cannot indicate a strong preference for a particular parcel of grain (other than price differentials for specified grades), or for inclusion of extra services, by offering a premium payment. The effect of the flat $16/t margin is, in principle, the same as the pooling of costs to growers discussed in section 2.
In view of the difficulty experienced in the past in setting this margin, it is unlikely that this problem of cross subsidisation can be resolved under the current marketing arrangements. In a competitive market such a problem would be unlikely to persist, because through the price mechanism millers would pay according to services used and cross subsidisation would be minimised.
(b) Industrial wheat
The price of wheat for stock feed and industrial use is at the commercial discretion of the Wheat Board. In general, the Board uses its daily export price quotation for Australian standard white (ASW) wheat as a basis for its domestic price for industrial wheat.
The industrial wheat users have argued that the present wheat marketing system causes them to incur additional costs which affect the ability of their products to compete, both internationally and on the domestic market. In particular, they argue that because they are smaller, more specialised purchasers than the Board they are in a better position to realise transport and handling savings. For example, if processing mills are located in wheat growing areas, an ability to purchase wheat locally could reduce costs by avoiding the double handling of grain to a central location and back to a regional mill. The Board, however, has suggested that industrial wheat users should be able to achieve similar savings by making use of existing grower- to-buyer arrangements.
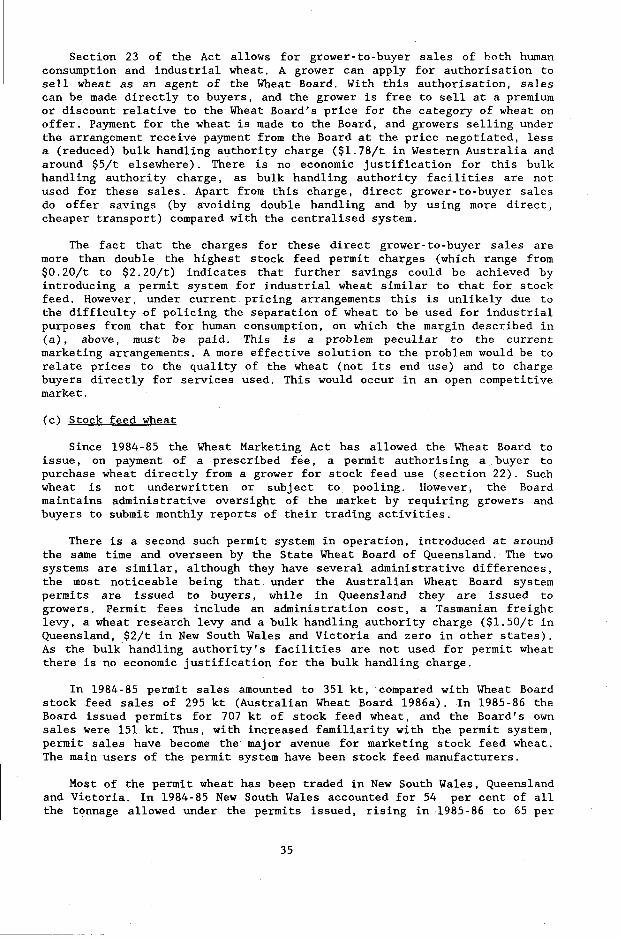
Section 23 of the Act allows for grower-to-buyer sales of both human consumption and industrial wheat. A grower can apply for authorisation to sell wheat as an agent of the Wheat Board. With this authorisation, sales can be made directly to buyers, and the grower is free to sell at a premium or discount relative to the Wheat Board's price for the category of wheat on offer. Payment for the wheat is made to the Board, and growers selling under the arrangement receive payment from the Board at the price negotiated, less a (reduced) bulk handling authority charge ($1.78/t in Western Australia and around $5/t elsewhere). There is no economic justification for this bulk handling authority charge, as bulk handling authority facilities are not used for these sales. Apart from this charge, direct grower-to-buyer sales do offer savings (by avoiding double handling and by using more direct, cheaper transport) compared with the centralised system.
The fact that the charges for these direct grower-to-buyer sales are more than double the highest stock feed permit charges (which range from $0.20/t to $2.20/t) indicates that further savings could be achieved by introducing a permit system for industrial wheat similar to that for stock feed. However, under current pricing arrangements this is unlikely due to the difficulty of policing the separation of wheat to be used for industrial purposes from that for human consumption, on which the margin described in (a), above, must be paid. This is a problem peculiar to the current marketing arrangements. A more effective solution to the problem would be to relate prices to the quality of the wheat (not its end use) and to charge buyers directly for services used. This would occur in an open competitive market.
(c) Stock feed wheat
Since 1984-85 the Wheat Marketing Act has allowed the Wheat Board to issue, on payment of a prescribed fee, a permit authorising a buyer to purchase wheat directly from a grower for stock feed use (section 22). Such wheat is not underwritten or subject to pooling. However, the Board maintains administrative oversight of the market by requiring growers and buyers to submit monthly reports of their trading activities.
There is a second such permit system in operation, introduced at around the same time and overseen by the State Wheat Board of Queensland. The two systems are similar, although they have several administrative differences, the most noticeable being that under the Australian Wheat Board system permits are issued to buyers, while in Queensland they are issued to growers. Permit fees include an administration cost, a Tasmanian freight levy, a wheat research levy and a bulk handling authority charge ($1.50/t in Queensland, $2/t in New South Wales and Victoria and zero in other states). As the bulk handling authority's facilities are not used for permit wheat there is no economic justification for the bulk handling charge.
In 1984-85 permit sales amounted to 351 kt, compared with Wheat Board stock feed sales of 295 kt (Australian Wheat Board 1986a). In 1985-86 the Board issued permits for 707 kt of stock feed wheat, and the Board's own sales were 151 kt. Thus, with increased familiarity with the permit system, permit sales have become the major avenue for marketing stock feed wheat. The main users of the permit system have been stock feed manufacturers.
Most of the permit wheat has been traded in New South Wales, Queensland and Victoria. In 1984-85 New South Wales accounted for 54 per cent of all the tonnage allowed under the permits issued, rising in 1985-86 to 65 per

cent. In all states, harvest time is the main trading period, indicating a preference of most growers to sell wheat around harvest rather than to store for later sale.
1 In assessing the operation and performance of the permit system, three major issues need to be considered:
l
1 - the extent to which the system offers gains in efficiency to wheat growers and buyers, and to the domestic economy in aggregate;
- the distribution of these gains between buyers and sellers, and the sources of these gains; and
- the quality of the information on which growers form their expectations of the ~oard's final pool price (the alternative to the prices on the permit market) and on which buyers assess grain availability.
The specific benefits of the stock feed wheat permit: system have included handling and freight savings for both growers and buyers. The major drawback of the system is that it is subject to certain regulatory constraints, notably the requirement to obtain a permit, limits on quantities for reselling, and Wheat Board reporting requirements. These constraints , together with the levying of charges by the state-owned bulk handling authorities, make the permit system an imperfect substitute for open market selling.
Within a season there is considerable scope for variation in permit sale price. Factors influencing this price include wheat availability and quality, grower expectations of Wheat Board pool returns, the preliminary and final guaranteed minimum price, buyers' maximum purchase prices and the relative market power of buyers and sellers. Buyers' maximum purchase prices will be based on what it would cost them to source their supplies from the Wheat Board at prices based on the Board's export quotations, and on the prices of other feed grains.
Growers considering selling wheat by permit have to assess their selling options - that is, whether to sell directly or deliver to the Wheat Board. In evaluating these options, the key factor has been the determination of their base selling price (appendix A). Under the current system, the lowest return growers can expect to receive is the Wheat Board pool return. This provides the grower with a relatively secure marketing option. However, growers do have difficulty in obtaining the relevant market information, particularly Wheat Board pool prospects and the final guaranteed minimum price. For example, the preliminary guaranteed minimum price is not a good indication of the final guaranteed minimum price. The Board bases the preliminary estimate on the assumption that a large quantity of feed wheat will be delivered (Australian Wheat Board 1987b) - an assumption which has proved to be quite incorrect, with the result that large upward revisions have been made in the final guaranteed minimum price. For feed wheat, in 1985-86, this was $13/t more than the preliminary figure, and in 1986-87 was $20/t higher. The preliminary figures may have led growers to form unduly pessimistic price expectations and hence to accept needlessly low returns.
An alternative basis for estimating pool returns is available. As discussed by Perkins, Sniekers and Geldard (1984), Australian wheat prices are set close to prices for comparable US wheats. Also, in the case of feed wheat, prices for US corn (the dominant feed grain traded internationally) provides a good indication of Australian feed grain prices (Foster and

Geldard 1985). Therefore, growers could form more accurate price expectations by reference to US wheat and corn prices than by relying solely on the preliminary guaranteed minimum price.
The relative market power of buyers and sellers will influence the actual price for a permit wheat sale, which would be negotiated between the buyer's maximum purchase price and the grower's base selling price (see appendix A). There are many potential sellers but comparatively few buyers. Also, in most seasons, potential supplies of feed wheat and other feed grains will exceed domestic demand. As a result, buyers may tend to bargain prices down toward growers' base selling prices, though in seasons when little feed grain is produced growers may be able to appropriate a larger share of the gains.
The availability of permit wheat varies throughout a season, with most supplies at their greatest during the harvest period. However, growers with on-farm storage have the opportunity to sell during the interharvest period. This ability to store will affect their savings, although any apparent increase in savings has to be offset against on-farm storage and carrying costs. The decision to store for later sale involves a harvest-time assessment of future feed grain prices, and there is always the risk that the market price may not rise sufficiently to cover carrying charges (or may indeed fall) after the decision to store has been made. Thus, while storage for later sale may offer the potential for higher returns it involves greater risk. Growers who have decided to store for later sale are particularly vulnerable in a period of falling prices, and risk having to sell their stocks at lower returns prior to the next harvest.
On average it appears that the permit system has resulted in savings to both buyers and sellers (see appendix A). With their greater market power, buyers have appropriated a larger share of these gains than sellers. It is estimated that growers made losses on permit sales in several months, particularly in the interharvest period of June to October 1986 when prices were falling. This is a period when growers are most vulnerable to an incorrect assessment of price trends (see Rose and Sniekers 1986) and risk having to sell stocks at lower returns before the next harvest. However, these estimated losses may not have been significant in practice as there is little permit selling in this period.
Seasonal changes in crop quality have also affected the performance of the permit market. During the 1985-86 harvest in New South Wales and Victoria, rumours that there would be abundant supplies of feed wheat prompted some growers to sell weather-damaged wheat quickly and accept low prices. The main problem was confusion over the classification of sprouted wheat by the Wheat Board. Although knowledge of wheat quality and availability soon improved, there remained an impression that growers were losing from participation in the permit system. In southern New South Wales and areas of Victoria, for example, a group of growers called on the Board to administer a minimum permit price. The majority of growers, however, rightly recognised that this was not the Board's responsibility. Moreover, in 1986-87 the Board moved to accommodate concerns over weather-damaged wheat with the introduction of a second general purpose category, with its own guaranteed minimum price, specifically for sprouted wheat. This has improved the information relating to receival standards, though it does not help growers to estimate the final guaranteed minimum price or future pool returns.

Growers may be able to strengthen their bargaining position by assessing a potential buyer's likely maximum purchase price, which will give an idea of the range within which prices could be negotiated (appendix A). A final point is that, in discussing potential gains and the possibility of losses, it should be noted that growers' base selling prices are affected by the costs of transport to buyer, and that there is therefore no national or state permit price below which all growers selling permit wheat will be disadvantaged.
(d) Tasmanian freight l e w
The price of domestic wheat sales (including permit sales) includes the Tasmanian freight levy. This levy is designed to cover the Wheat Board's costs in shippi-ng wheat (as required under section 33 of the Act) from selected mainland ports to Tasmania. There seems to be little economic justification for this subsidy, which encourages the use of wheat in Tasmania to the detriment of growers1 returns. If the Government decides to continue this subsidy, the question must be asked whether it should be met by wheat growers or by all taxpayers. The resolution of this issue requires consideration of which is the more equitable income transfer and of the relative costs of levy collection.
3.3 Areuments Against Competition
As demonstrated in the previous subsection, cost savings could be achieved by wheat growers and wheat users through the introduction of competition into domestic wheat marketing. However, a number of arguments have been advanced in favour of controlled marketing and against competition. In the context of this study 'competition1 refers to the removal of the regulatory impediments that currently constrain the operation of the domestic wheat market. It is often argued that:
- there are economies of size in domestic marketing, obtainable by having a single authority;
- such an authority provides better control of grain hygiene than would otherwise be possible;
- certainty of supplies is assured through having a single seller;
- any loosening of control would adversely affect the throughput of bulk handling authorities and hence their unit costs; and
- deregulation will lead to marketing malpractices.
(a) Economies of size
Economies of size in domestic wheat marketing have long been alluded to but never substantiated. Significant economies of size in the domestic marketing of wheat appear unlikely: because wheat production is dispersed across regions, and the end users (particularly of stock feed) are scattered throughout Australia, there is little opportunity for physical concentration of marketing functions.
In any case, if there are economies of size in the provision of domestic wheat marketing services, their achievement should not require the restriction of entry to the market. If the Wheat Board and the bulk handling

authorities are operating in an economically efficient manner, they should be well placed to compete with potential suppliers of these services.
(b) Grain hvaiene
It is often contended that private traders and growers may employ inferior pest control procedures, to reduce costs. Inferior grain hygiene practices would affect not only the recipients of grain but also other users of common facilities for handling, storage and transport. That is, there is the possibility that some users might, without penalty, impose extra costs on others. This problem could be addressed by having a system of licencing and inspection of country storage facilities. Such a system could be operated in a competitive market, and would not necessitate a centralised selling authority. However, it is unclear whether the costs of pest control would be higher or lower in a competitive market than under the current centralised system.
The facts that permit and grower-to-buyer marketing arrangements already exist, and that there is also a substantial private trade (both domestic and export) in coarse grains, can be taken as indicating that a monopoly of the domestic market is not essential to enforcing an effective grain pest control program. Information on appropriate pest control measures is readily available from the state departments of agriculture. Merchants and growers would not wish knowingly to ruin their trading reputations by employing inferior grain hygiene standards. End users would continue to demand particular grain hygiene standards, and there would be a natural commercial need to maintain those standards.
(c) Certaintv of supplies
Only through a central marketing authority, it is claimed, can millers and consumers be assured that adequate quantities and qualities of wheat are reserved for domestic needs. Similarly, it is argued that in a time of drought only a central authority can ration sale of scarce supplies. In both instances, however, this function could alternatively be provided by the market, guided by market price signals. Contractual arrangements between millers and either growers, merchants or the Wheat Board (which would still have its export function) could be used to ensure that millers always had adequate supplies. Other possible approaches to minimising the impact of drought on feed availability include importing, storage and forward buying.
(d) Throuahput of bulk handling authorities
Deregulation of the domestic market might reduce the quantity of wheat handled by the bulk handling authorities. This reduction in throughput could, in the short term, increase charges to those growers who use the system regularly. This is considered undesirable because the capital costs of building and maintaining the system flow quickly to the users, and in consequence those using the system irregularly would contribute less than proportionately.
In reality, though a proportion of domestic trade would take place outside the bulk handling authorities' system, wheat would still need to be stored, and there is no reason why the authorities could not undertake this task provided they charged competitively for the services. With their already established facilities, the bulk handling authorities should be well placed to compete against any potential market entrants. Increased

competition in the storage market would probably result in the closure of higher cost storage facilities, leading ultimately to reductions in charges.
Also, interyear variability in Australian wheat production due to seasonal conditions can be expected to remain a far more important determinant of throughput than variations in usage in a deregulated domestic market. The use of storage facilities by private traders, flour millers and growers is likely to be considerably more predictable than production.
(e) Marketing mal~ractices
Finally, one of the more frequent arguments against competition is that it might lead to marketing malpractices made possible by a lack of price and quality information, poor communication and growers' weak selling position. However, in a competitive market growers would not be placed in a weak selling position, since they would still be able to deliver to the Australian Wheat Board. In addition, communication systems are well developed, and information on existing competitive markets (for example, for livestock and coarse grains) is well supplied by public media, state departments of agriculture and stock and station agents. Thus, concern about marketing malpractices in a competitive wheat market seems unjustified.
3.4 Effects of Introducing Com~etition
If competition were allowed in the domestic wheat market, wheat could be bought and sold within Australia by organisations other than the Wheat Board; wheat storage and handling services could be offered other than by the bulk handling authorities; and wheat could be transported other than by the rail authorities. Delivery to the Board would remain a selling option for growers.
Competition would provide growers with a range of marketing options, including selling directly to an end user or trading through a merchant in addition to delivery to the Wheat Board. Similarly, end users would be able to source their supplies directly from a grower, through an agent, from a merchant or from the Board. A range of competitive storage options would very probably come into existence, either on farm, with a merchant or with a storage company.
In a competitive market, grain traders could buy from growers and sell to end users - flour millers, stock feed manufacturers, commercial feed grain users, farmers - or to the Wheat Board. The expanded activities of grain traders could also include the retailing of wheat from the Board. It should be a requirement that the Board, for its part, be indifferent between sale on the domestic and export markets, selling where it gets the best return. At the same time, individual growers, or groups of growers, 'might decide to act as grain traders for the disposal of their wheat, and perhaps to buy grain for resale. Some growers would include forward selling or contracts among their marketing options. Grain merchants and private companies, by specialising in limited ranges of services, would acquire incentives to identify and select less costly marketing channels.
Competition offers potential savings to growers and users through reduced storage, handling and transport costs. The stock feed permit system has demonstrated that these savings are real and can be achieved if domestic buyers and sellers are permitted to bypass the Board's authorised receivers and to use private transport, storage and handling facilities where

appropriate. In a competitive situation, efficiency gains should be obtained by allowing the use of the least cost method of distribution (see Spriggs et al. 1987) including avoidance of double handling and transporting of grain.
A competitive market is also likely to encourage the bulk handling authorities to participate actively in the market for storage services (Spriggs et al. 1987) . Their activities could extend not only to operating as authorised receivers for the Wheat Board, but also to storing wheat, other grains and oilseeds for private traders, millers and even growers- all of whom may at some time have insufficient storage space of their own and may wish to store grain for later use or sale. At the same time, competition from on-farm and privately owned storage would provide the bulk handling authorities with a strong incentive to operate efficiently. This competition would also result in the replacement of the present extensive cost pooling (with its associated inefficiencies) by a fee-for-service charging system, and in the closure of high cost storage facilities.
A competitive domestic market would circumvent the current problems associated with setting an administered price for human consumption wheat described in section 3.2(a). In the absence of the present regulatory procedures, the market would be allowed to achieve the same objectives as the current administrative approach. The administrative approach has proved a costly, cumbersome and not necessarily effective attempt to bring about a result that a market mechanism would accomplish automatically, namely the setting of charges in accordance with the service used. Moreover, the price mechanism in a competitive market will overcome the problems associated with the pooling of domestic marketing costs across all millers caused by the application of a single margin for this purpose to all buyers.
The likelihood of the Wheat Board being unable, given a competitive domestic market, to fulfil any domestic market commitments (because of retention of wheat by growers or merchants) is extremely small. In any case, the existing legislation permits the Board to purchase foreign wheat for transshipment to overseas buyers in the event of wheat being unavailable locally to fulfil contracts, and this would still be the case. In fact, in view of the usually large exportable surplus of wheat and the relatively small needs of the domestic market, it is extremely difficult to envisage a situation in which the Board would need to do this. Even in a normal year the Board 'pre-sells' only a relatively small proportion of the crop before December-January, when the crop is received.
A competitive market would provide growers with a range of selling options, including that of either selling at the time of harvest or storing for sale later. This range of selling alternatives will provide growers with the opportunity to extract a higher price than the Board's pooled return from the market and to realise particular cost savings. Individual growers would be free to take advantage of particular trading opportunities and to use their own individual marketing skills, or to deliver to the Board, which would continue to provide a marketing service. The provision of a range of selling options would allow growers to realise their own preferences as between risk and returns.
In order to operate in a competitive market and successfully to assess their selling options, growers would require access to accurate and up-to- date market information. One likely result of competition in the domestic market would be the initiation of a regular market report service, similar to the livestock sale and wool market reports now provided by country radio

stations and the rural press. In addition, private merchants and their agents could be expected to act as information sources in the same way as wool brokers and stock and station agents currently do for livestock. Competition would also be likely to encourage a demand for wheat testing- an area where storage companies, merchants and even growers would be likely to be able to provide competitive services.
The variety of marketing options available under competition would be likely to provide some growers with higher net returns than at present, principally through cost savings. In particular, growers selling direct to end users would avoid paying Wheat Board administration costs. Some growers may also be able to reduce overall marketing costs by using road transport and delivering directly to the buyer rather than having to use the centralised distribution system. The distribution of these savings between growers, merchants, manufacturers and consumers will depend on their relative market power and the responsiveness of supply and demand to prices. As there are fewer manufacturers than growers it is likely that growers would appropriate a smaller share of the savings. Millers could expect to appropriate a large share of the savings, given their market power and the low price responsiveness of final demand for human consumption wheat products. On the other hand, industrial and stock feed wheat processors face a more responsive demand, and here a larger share of the gain could be appropriated by consumers. Although growers may get a relatively small share of the savings, they are still likely to gain, and cannot be worse off than under the current arrangements as they would still have the option of delivering to the Board. Growers less willing to take the risk of marketing their own crops, or who prefer to have all the marketing services provided for them, could likewise continue to deliver to the Wheat Board. The Board would continue to sell mainly for export (as at present), although there is no reason why it should not also wholesale or retail wheat on the domestic market.
In conclusion, the current marketing arrangements centralise marketing and distribution services; such centralisation is neither appropriate nor necessary in the dispersed domestic market and imposes extra costs compared with a competitive market system.

4. EXPORT MARKETING
The maintenance of a viable wheat industry in Australia will depend in part on marketing services - particularly export marketing services - being provided to growers at competitive rates. The type of marketing service preferred will be influenced by the nature of the market, and may change as market conditions alter. In the next subsection, the nature and future prospects of the international market are reviewed, therefore, before considering the question of the adequacy of current wheat export marketing arrangements.
4.1 The International Wheat Market
(a) The nature of the market
Five sources - the United States, Canada, Australia, Argentina and the European Community - account for around 90 per cent of wheat entering world trade. The market is dominated by the United States, the world's largest wheat exporter and stock holder. On the import side, the USSR routinely imports one-fifth to one-quarter of international traded wheat. Other large wheat importers are China, Egypt and Japan.
Large grain trading companies buy and export wheat from the United States, the grain exporting countries of the European Community and Argentina. Since mid-1985, companies buying US wheat for export have been eligible for assistance in the form of commodity subsidies (under the Export Enhancement Program) when successfully tendering for certain specific US- targeted markets (which include most large wheat importers other than Japan). Companies exporting EC wheat receive subsidies (restitutions) which are intended to bridge the gap between EC prices and (usually lower) world prices. Companies buying Argentinian grain do not receive assistance. The National Grain Board of Argentina may suspend exports if it appears that insufficient grain will be available for domestic use.
Wheat exports from Australia and Canada are controlled by statutory wheat marketing boards. The Australian Wheat Board uses grain trading companies as agents for around 30 per cent of the sales (the Board effectively acting as a wholesaler). For example, the Board may sell fob to grain traders, who may sell on a cif basis and arrange shipping to overseas destinations. This practice in part reflects the market structure: some buyers seeking the lowest price obtain grain from any origin through tenders.
Much of Australia's export wheat is sold to countries - for example, the USSR, China, Egypt, Iran and Iraq - whose wheat imports are controlled by state trading organisations. In Japan the Ministry of Agriculture, Forestry and Fisheries determines overall wheat import requirements, and supplies are obtained through tender. In 1985-86 these six countries took 70 per cent of Australian wheat exports. Many other countries also obtain supplies through state tender.
1 (b) World demand and suoolv develo~ments
Significant changes in world wheat demand have occurred since the beginning of the decade. In some regions that were once large importers, such as China, Europe and India, import demand has been declining, partly because of a move toward self-sufficiency in wheat in those countries. In

addition, import demand by the USSR, having expanded in the early 1980s, peaked in 1984-85 and then fell dramatically in 1985-86. The effect of this particular import decline fell most heavily on the United States; while Soviet imports from other exporters were merely scaled back, those from the United States were severely curtailed. This has led the United States to seek markets aggressively elsewhere, and more recently to re-enter the Soviet market using its Export Enhancement Program.
The decline in import demand has accentuated the international effects of the domestic agricultural policies of wheat exporting countries. In a sellers' market such as that of the late 1970s the effect of these policies largely went unnoticed. In a contracting market, in contrast, the same policies have led to rising stocks and falling prices. Moves by the European Community and the United States to clear unwanted stocks by offering them for export at 'increasingly subsidised prices have had a still further depressing effect on prices. The real unit net return to Australian growers from wheat sales in 1986-87 is expected to be the lowest recorded in recent decades.
(c) Pros~ects for recoverv
The prospects for a recovery in world wheat prices will depend on three main factors (leaving aside the possibilities of widespread crop failures in major producing regions):
- the rate of growth in world import demand; - the rate of adjustment of production in response to low prices; and - the domestic agricultural policies pursued by the European Community and
the United States.
With the pace of economic activity in the developing countries expected to be higher in the late 1980s than at the beginning of the decade, these countries are expected to provide some stimulus to growth in world wheat demand. Wheat imports by developing Asian countries, in particular, are expected to continue to increase. In many other developing countries, however, debt servicing problems will restrain wheat imports.
Trade levels will be influenced greatly also by the magnitude of import demand by the USSR. At present, the USSR is attempting to increase grain production through the use of intensive cultivation methods. This policy, combined with shortages of foreign exchange, may ultimately lead to some reduction in the level of Soviet wheat imports.
In China - another large wheat importer - wheat production appears to have stabilised following the phenomenal increase that occurred in the early 1980s. Though China's wheat imports in the medium term, like those of the USSR, are highly uncertain, they may be boosted by possible accelerated growth in China's domestic food and feed industries toward the end of the decade, since both these industries are potentially large consumers of wheat. On balance, it is expected that China's medium term imports will increase.
Of the world's remaining major wheat importers, both Europe and Japan are anticipated to maintain current levels of imports in the medium term. Overall, world wheat trade is projected to recover to around 105 Mt by 1991- 92, slightly above the record level of 104 Mt in 1984-85.

The market shares of individual exporting countries will depend largely on the policies they pursue, both agricultural and macroeconomic. The present one-sixth market share of the European Community largely results from its policy of maintaining high domestic wheat prices for both producers and consumers, and its willingness to dispose of the surpluses so generated on the world market at a loss. Despite the cost of such policies (BAE 1985), the fact that this cost is financed mainly by consumers means that it is largely hidden. Current proposals for reform are most likely only to refine rather than fundamentally change the EC system. The same also seems true of the United States. Though the cost of US agricultural support (basically through the deficiency payments system) tends to be more visible than that of Europe, the apparent congressional willingness to bear this cost in order to maintain US agriculture in its present form gives little prospect of any fundamental reform.
In summary, prospects for the international wheat market into the 1990s are for some recovery in import demand, but the problem of overproduction and burdensome stocks is not likely to be resolved quickly. As is currently occurring, competing exporters will attempt to maintain market shares wherever possible. As regards Australia's wheat policies, it is vital that the most efficient, effective and flexible marketing system be provided, to ensure the sale of Australian wheat for the best return in what is now a very competitive market.
4.2 Arguments for the Current Arraneements -
Some witnesses at the previous Commission hearing on wheat marketing, in 1983, argued that the centralised selling arrangements were of benefit to the Australian wheat industry because a centralised seller:
- could reduce marketing costs to growers by taking advantage of economies of size;
- had an advantage in selling to countries preferring to trade with government agencies and to those with single import trading organisations;
- could increase sales by contracting forward and by providing credit;
- could increase returns by using monopoly power in nearby markets;
- could co-ordinate the necessary measures to ensure the maintenance of Australian wheat quality and freedom from insect pests, as required by the 1952 International Plant Protection Convention and the federal
1 Export (Grains) Regulations; and
- could promote the longer term interests of the Australian wheat industry and undertake market development (whereas, it was argued, grain traders would be interested only in short term profit maximisation).
These arguments require critical assessment, since (as noted by Spriggs et al. 1987) protecting wheat marketing or distributional organisations from competition by other potential suppliers of the same services may not be in the best interests of growers or of the nation as a whole. For an organisation to receive statutory protection, some overriding public interest should be demonstrated.

(a) Economies of size
Although the international grain market is very competitive, it is dominated by a number of large firms. Nevertheless, small firms can and do operate in the market.
Allowing competition in exporting Australian wheat would not prevent the achievement of economies of size. If the economies of size are such that one or a small number of large firms would be able to provide the cheapest service, smaller firms would not survive and the economies of size would be obtained by those remaining. Alternatively, if the economies of size in grain marketing are very large, then limiting the Board to the marketing of Australian wheat only may prevent it from fully achieving these economies. In that case cosCs to Australian growers could be lowered if the Board were permitted to trade in other grains, including foreign wheat, buying and selling on the international market as an international grain trader. The Board is not at present legally prevented from doing this, but since it is constituted to market Australian wheat, any move to market other grains or wheat of other countries would probably be seen as being in conflict with its primary function of securing the highest returns for Australian wheat growers.
Given the current structure of the international wheat market, it appears very unlikely that, in a competitive environment, a monopoly would emerge in control of Australian wheat.
(b) Sales to state-imvorter countries
The use of a national marketing board could be considered advantageous in dealing with countries with centralised import agencies. However, the United States, which does not have a national board, has made direct government-to-government agreements for the supply of large quantities of grain. Though political and quality problems have arisen in some cases, this example does indicate that supply agreements can be negotiated in the absence of a monopoly marketing board. A government department or agency, such as the Department of Primary Industries and Energy which is responsible for commodity trade negotiations, can negotiate specific sales with importing governments or agencies and then arrange supplies through trading companies. In addition (Industries Assistance Commission 1983, p.14), international grain traders make large sales to state-importer countries, and in some instances have initiated the trade. It is evident that a monopoly marketing organisation neither is necessary nor has a proven advantage over other arrangements.
(c) Increased sales through credit
In a competitive market, provision of credit serves as part of-most overall marketing packages, along with technical advice and other services. There is little doubt that the Wheat Board's ability to offer credit has enabled it to retain some markets which it might otherwise have lost. However, firms in a competitive market can and do provide similar services, as do the private grain traders. An important point is that the provision of government insured credit through the Export Finance Insurance Scheme does not necessitate the existence of a national marketing board - merely that the exporter in question satisfies certain government and commercial requirements, which may equally well be satisfied by a firm in a competitive market .

(d) Increased returns through market Dower
Since 1983-84 (table l), Australian wheat sold for export has averaged 87 per cent of total wheat sales (including domestic wheat sold under permit). This represents 15 per cent of world wheat trade. Canadian and United States' exports have averaged 20 per cent and 34 per cent, respectively, of world wheat trade over the same period (table 10). Thus, the level of Australian production may influence world prices to some extent. However, the Wheat Board does not control the amount of Australian wheat available for export, and is thus unable to influence directly the world price; it is in general a price taker in the world market.
On the other hand, Australia may have some regional advantage in small Pacific and Asian markets which may allow the Board to practice price discrimination in these markets. There is, however, little evidence of such an advantage. The data in table 11 do show an increasing gap between average returns from sales to small and large markets. Unit returns from larger markets have decreased, following discounting of prices in these markets to match the 'targeted' subsidised offers of other exporters. The higher unit returns from smaller markets are not necessarily due to market power; they are more probably due to the higher unit costs of servicing a small market and to the fact that many of these markets (simply because they are small) have not been 'targeted'. There is little difference between average returns from nearby small markets, in which Australia may have a regional advantage, and those from distant small markets. These data thus indicate a response to the highly competitive market conditions of the mid-1980s rather than the use of market power by the Wheat Board in small nearby markets.
Table 10: WHEAT EXPORTS AS A PROPORTION OF WORLD TRADE
Exporters Unit 1983-84 1984-85 1985-86 1986-87 Average
World mt 100.4 104.2 84.4 86.0 93.8 Australia % 11.6 14.5 19.1 16.7 15.5 Canada % 21.1 18.3 19.9 21.5 20.2 United States % 38.1 36.7 29.6 32.6 34.3
Sources: Derived from BAE (1986a) and International Wheat Council (1987)
Table 11: RELATIVE UNIT RETURNS TO WHEAT EXPORTS, BY MARKET GROUP
l
Market 1981-82 1982-83 1983-84 1984-85
'Large distantl(a) 100 100 100 100 'Small nearbyl(b) 98 101 104 108 'Small distantl(c) 101 102 103 108
(a) USSR, Egypt, China, Iran, Iraq, Japan. (b) Indonesia, Malaysia, Singapore, Thailand, New Zealand, Papua New Guinea, Fiji. (c) Bahrain, Kuwait, Oman, Qatar, Saudi Arabia, United Arab Emirates, Yemen Arab Republic, Yemen Democratic Republic. Source: Derived from Australian Bureau of Statistics (1985).

It would be possible to influence world wheat prices to a significant degree only if the Board were able to act collectively with the other exporting countries, In fact, recent meetings of wheat exporters have shown little desire for collective action.
With its monopoly on exporting Australian wheat, the Wheat Board is in a better position to realise any market power than if competition were allowed. However, what data are available suggest that Australia has not been able to realise any price advantage from nearby markets. Those price differences which do exist appear to arise from volume of sales irrespective of location.
(e) Wheat aualitv and nest control
There are two aspects to the topic of wheat quality: first, baking quality; second, foreign matter and pests.
In a very general sense, the qualities desirable in flour used in the baking of European-style breads are obtained from wheat of a particular protein level. Maintenance of wheat quality in this sense requires that sufficient medium to high protein wheat be grown to satisfy traditional markets. It is often argued that it would not be in Australia's best interests to be seen to be exporting wheat of low quality. However, markets can and do set different prices for various qualities. It is important that this price information be transmitted to growers to inform them of the market's valuation of their products. Growers would not be likely to offer low quality wheat (unless it were very cheap to produce) if the market indicated its aversion to such wheat by severe price discounting. In this respect the current marketing arrangements, with the pooling of payments across quality (see section 2), are less likely to encourage the production of higher qualities of wheat than a competitive market.
Quality in the second sense concerns the presence in export wheat of weed seeds, foreign matter, excessive pesticide residues, and insect infestation. Under the centralised selling and distribution arrangements the Wheat Board has been able to maintain pest control and high hygiene standards, and thus to maintain the good reputation of Australian wheat in the international market. However, these objectives could be achieved (Industries Assistance Commission 1983) without a national marketing board, though it is unclear whether the costs of pest control would be higher under a competitive system. The price mechanism would encourage pest control by discounting for infested wheat. As discussed in section 3, the problem of some users imposing costs on others could be addressed in a competitive market by a system of licencing and inspection of country storages. Similarly, the existing export inspection service could be used in a competitive export marketing system to ensure the maintenance of. pest control and hygiene standards for export wheat. The actual task of export inspection is carried out by government inspectors. There is no reason to believe that wheat that does not meet minimum quality requirements, whether sourced from private traders or from the Wheat Board, would be approved for export.
The fact that wheats from marketing-board countries such as Canada and Australia enjoy a good reputation for quality, whereas wheat from the United States (which has competitive marketing) does not, could be invoked as evidence of the benefit of central selling arrangements. However, the quality problems of US export wheat have many causes, few if any of which would be eliminated were the United States to adopt centralised selling. For

example, at the farm level, the system of deficiency payments based on current and past production levels has encouraged production for quantity and not for quality, and hence the use of wheat varieties which, though high yielding, may not yield a uniform product. In short, the quality problems of US export wheat result not from the lack of a centralised marketing board (indeed, the Commodity Credit Corporation in fact performs many 'marketing board' functions such as acquisition, storage and release), but from the incentive structure built into the US farm program arrangements.
(f) Market ~romotion and develo~ment
The Wheat Board has undertaken extensive promotion and market development of Australian wheat overseas. However, in the absence of an evaluation of the relative benefits and costs of these activities, it is questionable whether this level of promotion and development is beneficial. As a central seller, it has been argued, the Board is able to play a more co-ordinated role, whereas competition may produce a conflict of interest between traders. However, it is unclear that market promotion and development would be below the desirable level after the introduction of competition. The centralised sellers of Australia and Canada do not promote wheat more than the United States, which has competitive selling and uses both industry resources and government trade promotion.
If promotion and market development were shown to be most effective under the auspices of a single rather than a number of organisations, an alternative to a single marketer would be the use of a brand name, or registered symbol, as is used for a number of other commodities (such as wool). In this way the costs of promotion and market development could be shared by a number of companies, which could appropriate the benefits from the promotion and market development by using the brand or symbol.
To summarise, the arguments discussed above do not provide conclusive proof that the statutory protection from competition provided to the Australian Wheat Board in the export of wheat is in Australia's best interests. However, this does not automatically imply that competition is preferred.
4.3 Effects of Com~etitive Ex~orting
The suggestion that competition be introduced in the export marketing of wheat is not new. In 1983 the Bureau presented arguments suggesting that the perceived benefits of central selling could be achieved within a competitive framework; in particular, that having one central seller gave Australia little additional marketing power in the highly competitive world wheat market. The Bureau also suggested that growers might be able to gain a better appreciation of the value of their wheat on the export market were the Wheat Board to sell some of its wheat by open tender. The possibility of direct sales between growers and overseas buyers was also discussed (BAE 1983).
During the Industries Assistance Commission's wheat inquiry in 1983, organisations such as the Grains Council of Australia were strongly in favour of instituting competitive marketing arrangements. They also challenged the view that centralised selling necessarily increased marketing efficiency. The Australian Grain Exporters Association endorsed the concept of competition as a longer term goal (Industries Assistance Commission 1983). The Commission concluded that greater competition was desirable, but

was not convinced that the suggested changes to the existing system would achieve better returns to growers.
The introduction of competitive export marketing would most probably reduce marketing costs to growers by improving marketing efficiency. As discussed in Spriggs et al. (1987), statutory monopolies are more likely to have problems of inefficiency than firms in a competitive market. Management inefficiency arises from lack of incentives in the institutional arrangements of the statutory monopoly. Though most firms have the potential to develop management inefficiencies, the extent of such inefficiency is minimised where there is competition from other suppliers of the service. Where such competition is absent, as in a statutory monopoly, accountability procedures can be used to discourage poor performance. However, there can be difficulties in making accountability requirements effective (see Spriggs et al. 1987). The Wheat Board, due to the lack of effective and continual incentives in the institutional arrangements, is likely to have essentially the same efficiency problems as the bulk handling and rail authorities (Spriggs et al. 1987).
A problem which the Wheat Board shares with other authorities in wheat distribution is that its managers may be required to adopt objectives which conflict with the commercial goals of the Board. An example of compliance with a non-commercial objective is the widespread pooling of costs and revenues which has been supported by growers. Such pooling has been shown, in section 2 and in Spriggs et al. (1987), to cause inefficiencies in wheat marketing, distribution and production. Despite attempts by some participants to move away from pooling it is still practised widely by the statutory authorities. Such distortionary pooling could not survive in a competitive market.
There is insufficient information to establish the economic efficiency or otherwise of the current marketing arrangements. One option that would provide much better information and encourage efficiency would be for the Wheat Board to use open and unrestricted tenders to sell grain designated for resale by international grain traders. The use of tenders would be more likely to ensure the highest possible return to wheat growers than the current practice of apportioning wheat between traders for resale to designated markets.
If export marketing were opened to competition, the Wheat Board should be able to continue as an export marketer of wheat. It may be recalled that in the recent deregulation of financial markets, the capital and consumer base built up by the Australian banks during the long period of regulation gave them a considerable advantage over new foreign competitors. In a similar situation, it is likely the Wheat Board would also have a considerable advantage due to its knowledge of the Australian wheat ingustry and infrastructure.
In order for the Board to compete with international grain traders both in the Australian and overseas markets, some changes may need to be made in its internal structure and in the legislation under which it is constituted. The objective of these changes would be to ensure that the Board is placed on the same commercial basis as the international grain traders and is not restricted by the imposition of non-commercial objectives, such as cost and revenue pooling. As discussed in section 2, it is important that price signals from the world market be transmitted correctly to growers. The price signals to growers have been distorted to some degree by averaging returns over wide quality ranges and over long selling periods. This can lead, for

example, to a general reduction in the protein level of wheat in the Australian standard white category.
The pooling of revenue effectively spreads the risks of marketing wheat. However, it is difficult to ensure that the pooling of risks does not introduce significant distortions to the price signals given to growers. A competitive market, while providing more accurate price signals to growers and thus encouraging them to produce wheat of the types and qualities most demanded by the world market and to deliver that wheat when demanded, would result in less pooling of risks across growers. It would be possible to offer growers a less risky marketing alternative than on-the-spot sales, by the Wheat Board establishing a market pool separate from its commercial trading activities. Such a pool should average returns only across markets and over a short selling period such as one year. This pool should be open on a voluntary basis to growers who wished to lessen the risk in marketing their wheat, even with the prospect of lower returns.
4.4 Im~lications of Chanee in Wheat Marketing and Distribution
Because of the interaction between distribution and domestic and export markets, a change in one will have implications for the others.
It may be asked whether the potential benefits of allowing competition in distribution could be fully realised if the current monopoly on wheat exporting were retained. With a statutory monopoly as the customer of distribution services, efficient co-ordination of activities through the price mechanism might not be achieved. It is important that the current monopoly arrangements between the Board, the bulk handling authorities and the rail authorities be reviewed and the price mechanism be allowed to operate effectively. If the Board is to retain its monopoly of export marketing, it should employ a system of open competitive tenders for distribution services.
There are, as was shown in section 3, potentially significant benefits from opening the domestic market to competition. If, however, the monopoly of export marketing were retained while allowing competition in the domestic market, domestic wheat prices could differ from export prices. For example, if domestic traders bought wheat and world prices subsequently rose, domestic prices would remain below world prices, since the domestic traders would not be permitted to export their surplus wheat. This they could do if the export market were open to competition. Alternatively, the Wheat Board could be required to accept Australian wheat from anyone on the domestic market.

5 . ASSISTANCE
The wheat industry receives a relatively low level of assistance compared with other major Australian industries, as measured by the standard calculation of effective rate of protection (see Industries Assistance Commission 1987). However, it is highly assisted relative to other broadacre industries which compete with it in land use. The main forms of specific assistance to the wheat industry are government underwriting of prices and research funding.
There would not seem to be a strong case for reducing assistance,to the relatively little assisted broadacre industries, especially at a time when a number of these industries are facing difficulties. Such action could simply encourage resources to flow into less productive activities. However, there does seem to be scope for increasing efficiency by equalising the levels of assistance among activities within the broadacre sector, so that resource misallocation within the sector is not encouraged. Also, it is important to evaluate the effectiveness of the mechanisms for delivering assistance. In this section, the issue of whether there may be more effective policies for providing assistance than underwriting and research funding is considered.
5.1 Underwritinq
The extent of assistance provided by underwriting is not accurately measured by the amount of cash payouts. Farmers may experience a reduction in risk even if there is no cash payout. Underwriting alters the probability distribution of prices facing farmers, and can be viewed as a form of price insurance. In principle, the extent of assistance provided by underwriting could be measured by the amount that farmers would need to pay to acquire the same price insurance.
A side effect of public underwriting of wheat prices is that it provides a government guarantee for the Wheat Board's borrowings for advance payments to growers. This guarantee reduces the risk of lending to the Board and thereby allows the Board to borrow at a lower interest rate. As discussed in section 2, there appears little justification for providing the wheat industry with this type of borrowing assistance, as it distorts the allocation of funds. If the government guarantee were not provided the Board might need to pay higher borrowing costs and might not be able to give growers high advance payments. As was concluded in section 2, the preferable system would be to provide growers with negotiable certificates, which are not reliant on Wheat Board borrowings and do not include the interest subsidy effect of underwriting.
To evaluate underwriting as an assistance measure, it is necessaxy to consider the policy aims and the effectiveness of underwriting in achieving these aims.
(a) Policv aim
Underwriting reduces the price risks faced by farmers and redistributes these risks to all taxpayers. Thus, underwriting can be viewed as a form of price insurance in which the risks of a payout are not covered by the premiums collected from those insured. Public underwriting may improve economic efficiency if it compensates for an incomplete risk market or a distortion in the market (Quiggin 1983).

The argument based on distortion is that government policies may distort input or output prices from those that would prevail in a competitive market. For example, input prices may be distorted by policies such as tariffs. The 'first best' solution would be to remove the original distortion. The second best alternative is to provide a subsidy to offset the original distortion. If the distortion is of a long term nature, then underwriting is not an appropriate corrective policy. Though it reduces the risk of price falls, it does not provide a constant subsidy, as the value of the price insurance (that is, the implicit insurance premium) will vary with market conditions.
The argument concerning incomplete risk markets is that existing markets for trading risks (insurance, futures and capital markets) do not achieve the most efficient distribution of risks across the economy. Production decisions in an economy with complete risk markets would be identical to those in an economy with no risks. Thus, the decision to produce would not involve a simultaneous decision to bear risks. Since this condition will not be met in any real economy, it is clear that risk markets must be regarded as incomplete. Newbery and Stiglitz (1981), in their major study of commodity stabilisation schemes, consider this the main potentially valid argument for such schemes.
Risk markets are incomplete because the private gains from establishing some risk markets do not exceed the costs. Though there may be scope for government intervention to improve the distribution of risks, it is crucial that the costs of implementing any policy intended to compensate for absent markets do not exceed the potential gains.
If the incomplete risk markets argument is accepted as a case for government intervention to redistribute the risks of farming, it is important to consider whether the assistance is needed to deal with income risks or only with price risks. In a number of industries where underwriting is employed, production variability is a more important source of income variation than price variability (BAE 1983). No comprehensive crop or production insurance scheme exists - though it can be argued that the assistance provided by governments in the event of natural disaster, such as drought or bushfire, is so predictable as almost to amount to a de facto disaster relief scheme (BAE 1986b).
There seems little room for dispute that income risk must be regarded as more important than price risk. It is the level of gross income in relation to costs that ultimately determines whether a farm remains viable. Theories of the economics of risks which take account of the desire to reduce the probability of bankruptcy appear to offer a better explanation of observed behaviour than those which ignore this factor (Allais and Hagen 1979).
(b) Effectiveness of underwritinq
Taking into account the probability distribution of income in industries where underwriting has been applied, it seems likely that underwriting in these areas will have a stabilising effect (Hinchy 1987). Nevertheless, underwriting provides relatively poor protection against bankruptcy. It has been applied to industries where it is believed Australia does not affect world prices. Thus, an underwriting payout will not be triggered in all low income situations - in particular, those when output is low but price is not. It may be triggered in relatively high income situations, when output is high but price is not. Simulations of possible underwriting schemes using

historical wheat price data since 1908 are consistent with these propositions (Hinchy 1987). Hence, underwriting will not always deliver monetary assistance when it is most needed and may deliver assistance when it is not required.
A further weakness of underwriting is that it fails to take account of differences in the needs for assistance among farmers within an industry. Farmers will differ in characteristics such as degree of specialisation in a given crop, attitude toward risk and exposure to production risk. There may be wide differences among farmers in the minimum price required to avert bankruptcy. It is likely that, if a commercial price insurance scheme were available, wide differences in the prices at which farmers sought insurance would be observed as a result of the above factors. In contrast, underwriting provides insurance at a uniform price. Hence underwriting will provide uneven assistance to farmers in a given industry.
Acceptance of the incomplete risk markets argument implies redistributing risks across all risky activities. However, underwriting has been applied selectively to a small number of industries (wheat, apples, dried vine fruit and dairying). Many primary industries to which underwriting is not applied are subject to income variability at least as great as in these industries. It is difficult to find any characteristic of the industries thus assisted (for example, wheat) which would suggest that they are subject to more incomplete risk markets than the non-assisted industries (for example, barley and other coarse grains).
Finally, whatever the aim of underwriting, the problem with selectively underwriting industries is that resource misallocation may be encouraged. Where there is substitutability in land use - as between wheat and coarse grains - resources may tend to be drawn into the assisted industry, especially in times of low prices. Furthermore, there is a potential for resource misallocation even among the underwritten industries. The application of the same underwriting formula to different industries may have markedly different effects in the extent of reduction in price and income risk, depending on the underlying probability distributions (Hinchy 1987).
5.2 Research Funding
The Commonwealth Government currently provides funding for wheat research to the same amount as growers contribute (as is also the case for wool and livestock research). The contribution from wheat growers is obtained by a levy on Wheat Board receivals and permit wheat. The levy was raised from 35c/t to 40c/t for the 1986-87 season. Thus, on 17.9 Mt in 1984- 85 and about 15.8 Mt in 1985-86 and 1986-87 (deliveries to the Wheat Board plus permit wheat: BAE 1987a), the total contribution by growers was between $5.5m and $6.3m a year in these three years. Total research funding by growers and the Commonwealth Government therefore amounted to less thai 0.5 per cent of the wheat industry's gross value of production in these years. This funding is quite small in comparison with that of wool research, which in 1985-86 received equal government and industry funds of $13m, a total of 1 per cent of the gross value of wool production.
Research can be a public good - that is, everyone may benefit from research into, for example, wheat. Government should fund research at least to the extent that this is true, and such funding should not be viewed as assistance. Since changes in Australian wheat production will have only a

small influence on world prices, and most of Australia's wheat crop is exported, it is likely that most of the gains from research will accrue to growers in the form of higher incomes. It would appear, therefore, that such research should be funded by the growers.
However, where net benefits are likely to accrue from undertaking more research than is privately funded there may be a further case for government involvement. This is the case where the full benefits of research cannot be obtained by the research organisation (the problem which in some cases plant variety rights will redress). This situation can arise particularly in an industry such as wheat, in which there is a large -number of small growers and government involvement to co-ordinate research efforts can achieve a net benefit.
In addition, if there is to be government assistance to an industry, the funding of research may produce greater net benefits than other forms of assistance such as underwriting or input subsidies, which distort market signals.
The low level of wheat research funding in relation to the size of the industry suggests that government and the industry could consider increasing their support for research. The allocation of additional research funds should be made in accordance with the criteria formulated by Edwards and Freebairn (1981) for an ex ante assessment of likely benefits of research. Also, demand for wheat research may increase if the Government decides to implement any major changes in wheat marketing or distribution following the Industries Assistance Commission and Royal Commission inquiries. For example, if marketing were opened to competition there might be more incentive for research on specialist varieties and higher protein wheat.
If competition were allowed in wheat marketing the mechanism for collecting the research levy from growers would need to be altered. Currently the Wheat Board - the sole seller - collects the levy. If the Board no longer sold all wheat but remained the sole collector of the levy, some growers could avoid paying the levy, though they would still benefit from the research. It is not necessary, however, to have a sole seller to achieve equitable research funding, as is illustrated by many other primary industries such as livestock and wool. If competition were allowed, the merchants could collect the levy (as do wool brokers) or it could be raised at the point of end use (that is, from the millers, manufacturers and exporters). If only the domestic market were open to competition the latter alternative might be more effective because, while there might be many merchants and direct grower-to-user sales, there would be relatively few millers and manufacturers and only one exporter.
1 5.3 Alternative Policies
1 One advantage of underwriting (and research funding) is that assistance is automatic and is nor subject to annual budgetary and political pressures. This is not the case with some other forms of assistance, such as the Rural Adjustment Scheme, for which funds are allocated annually.
If government underwriting is retained, two changes to the scheme are needed. If competition were allowed in the marketing of wheat, the current system of providing underwriting assistance to growers would need to be altered because not all wheat would be marketed by the Wheat Board. One

alternative is to make underwriting or deficiency payments directly to growers, to cover the difference between their market returns and a guaranteed minimum price. Such a scheme could be operated by a government department or agency (not the Wheat Board) with an opportunity for public scrutiny of the setting of minimum prices. This method of payment has the advantage of removing a potential conflict in the Wheat Board between providing assistance and marketing wheat.
As noted in section 1, under the current scheme the Government underwrites the Wheat Board's marketing and finance costs. This is undesirable because it reduces the incentive for the Board and growers to minimise these costs. This problem is particularly evident when an underwritten cash payout is made to growers, as growers do not then pay marketing costs: To avoid this problem, underwriting should be based on gross market returns. Minimum prices, and hence deficiency payments, should be based on estimated average realised prices from markets for Australian wheat in a specified period following harvest.
As has been pointed out, underwriting has a number of weaknesses. It will not always deliver assistance in low income situations, may provide assistance in high income situations, and takes no account of the differing needs of individual farmers for assistance. Whatever its aim, selective underwriting of some industries and not others may cause resource misallocation. Also, the provision of underwriting reduces the incentive for the Wheat Board to obtain the highest price for Australian wheat, particularly when a cash payout is expected from the scheme.
To avoid these problems it would be preferable to abandon underwriting and allow growers to develop their own risk bearing strategies (for example, selling their own wheat directly on to the domestic market or opting for a pool return from the Wheat Board, or changing their degree of reliance on wheat returns). The level of assistance to the industry could be equated to that of other broadacre industries, after the removal of underwriting, by increasing research funding by government and industry to about $13m each, or a total of 1 per cent of the wheat industry's gross value of production. Other policies act to compensate for incomplete risk markets and provide assistance generally rather than specifically to the wheat industry. For example, the Export Finance Insurance Corporation addresses the possibility of imperfection in the insurance market by offering additional insurance against default by overseas credit buyers for any exporter.
The current provisions of the Rural Adjustment Scheme (Department of Primary Industry 1986) satisfy the main aim of underwriting while avoiding the major problems. The scheme provides for assistance to potentially viable farmers who would otherwise face bankruptcy if forced to rely on commercial lenders. Currently, two types of assistance are provided for all agricultural industries. Under Part A of the scheme, an interest subsidy is provided to applicants in financial difficulty who are assessed as having long term prospects of viability, to enable them to improve their efficiency by debt reconstruction, farm buildup or farm improvement. Part C provides for direct financial support to those whose farms are assessed as not viable while they attempt to move out of farming. Further, the legislation allows for provision of carry-on finance, under Part B, for needy farmers in industries which are experiencing temporary market downturns, though no Part B assistance was provided for in 1985-86 or 1986-87. Since the aim of this provision is to enable resources to be retained in industries during short term recessions so as to be in readiness for the later recovery, it could be viewed as a substitute for public price underwriting.

The Rural Adjustment Scheme attacks the most fundamental problem that arises if risk markets are incomplete - that is, the risk of bankruptcy. However, the scheme is aimed at the margin and the level of funding is small in relation to the increasing number of farms with low incomes. Reliance on the Rural Adjustment scheme alone would not totally replace the assistance that would otherwise be provided by underwriting. Its assistance, unlike underwriting, is available when and where it is most needed, taking account of individual differences among farmers. Finally, since it is available uniformly across industries, it does not have the potentially distortionary effects on resource allocation of selective underwriting.
The question whether the Rural Adjustment Scheme's level of assistance would be adequate to compensate for deficiencies in risk markets needs to be considered. There is scope for varying the level of assistance provided under the scheme by the use of Part B assistance or by modifying the way in which the criteria for eligibility are interpreted. If Part B assistance were to be provided during the current period of depressed world grains markets, it should be available to all grains industries and not just to wheat, to avoid resource misallocation between these industries. For the same reason, any change in the interpretation of eligibility criteria should be uniform across industries.
If wheat growers believed there was a case for further reducing price risks, the possibility of a self-financing price insurance scheme might be explored. The difficulty with such schemes - unlike viable commercial insurance schemes - is that the risks of payout to all those insured are highly correlated. In other words, even though different farmers may opt for insurance at different prices, in a period of very low prices all those insured may be eligible for payouts. The premiums required to make such a scheme self-financing may be too high to encourage widespread use.
A self-financing buffer fund scheme for wheat would have essentially the same problems as the current underwriting scheme, plus those of the previous stabilisation scheme. It is true that a number of buffer stock schemes in other countries may be close to being self-financing, but these countries are able to influence world prices of the commodities concerned, which is not the case for Australian wheat. Problems arise concerning the contributions of farmers who leave the industry and the eligibility of new growers for payouts. A final problem is that without accurate knowledge of the probability distributions of price and output and their correlation, there is the danger that any scheme may tend to either accumulate funds or run at a loss.
If growers believed that such a scheme was worth implementing it could be established under a grower organisation such as the Grains Council of Australia. It would not require the central control of marketing by the Wheat Board, and could be implemented in a competitive market using deficiency payments to cover the difference between a minimum price and the market return of a grower. As farmers differ in their preferences for risk and their exposure to risk of wheat price fluctuations, the scheme should not be compulsory with growers being offered a one-off option.

ESTIMATION OF PERMIT WHEAT PRICE RANGE AND SAVINGS
A.l Grower's Base Permit Wheat sell in^ Price
Delivery to the Australian Wheat Board is the alternative selling option for growers considering direct sale to a buyer under permit, and the grower will gain from permit selling if the price received is more than the net return from selling through the Board. The grower's base permit selling price (at the farm gate) at a particular time can be expressed as:
where Pal is the initial Wheat Board payment (that is, the preliminary or final guaranteed minimum price less charges for storage, handling and transport); P is the present value of any future Wheat Board payments; T is the cost oai! transport from farm to the bulk handling authority's silo? and Tb is the cost of transport to the buyer. In this expression, - Ta) is the Wheat Board return at the farm gate. ('a1 + 'a2
A grower would be indifferent between delivering wheat to the Wheat Board and selling by permit at the base permit selling price. The choice of the discount rate that should be used in calculating the present value P will differ between growers according to their opportunity costs of funas and willingness to accept risk.
A.2 Stock Feed Wheat Buyer's Maximum Purchase Price
The alternative feed wheat source for a permit buyer is, again, the Wheat Board. Thus, buyers would benefit from buying under permit up to a price equal to the Board's price less the permit fee. The Board's price for feed wheat is its export quote plus the Tasmanian freight levy, less 'fobbing' costs and quality discounts.
A.3 Gains from Permit Trading of Feed Wheat
The gains from permit trading of feed wheat are calculated in relation to the marketing of the wheat by the Board, which is the alternative trading option for both buyers and growers. That is, for a buyer the gain (or loss) at any time equals the cost of buying from the Board (as above) less the delivered price of permit wheat and the permit fee. The choice for the grower is between delivering to the Board at harvest, selling under permit then or storing for a later permit sale. In the last case the grower forgoes the initial payment from the Board (plus any income that could be derived from that payment over the period from soon after delivery to the time of sale) and the final advance paid in March.
The following estimates of gains from permit selling are based on the assumption that the wheat is harvested and delivered in December and the initial advance is paid in the same month. In any month, therefore, the gain (or loss) for a grower from selling wheat under permit equals the net permit price (that is, the permit price in the capital city less freight cost to that city and any storage costs) less the present value in that month of the Wheat Board net return. This present value comprises:

- the preliminary guaranteed minimum price less charges for distribution and the cost of transport from farm to the bulk handling authority's silo, compounded from December to the month of permit sale;
- the final advance (paid in March) discounted back for sales before March or compounded forward for sales after March; and
- the present value of any future Wheat Board payments.
The prices used here are monthly average quotes rather than actual prices paid for particular tonnages. It was assumed that the buyers were located in the state capital city. The freight cost was based on the average estimates of road transport costs in Spriggs et al. (1987) for 150-200 km to Melbourne and 200-250 km to Sydney. Transport from farm to the bulk handling authority silo and to the buyer from the bulk handling authority was estimated at $5/t in 1985-86 and $7/t in 1987. Accordingly the estimates of gains will underestimate those of growers located near buyers.
The cost of storage for six months was assumed to be $10.16/t, which is the average charge by private storage companies in New South Wales for six months storage (Spriggs et al. 1987). It is possible that growers could use on-farm storage, for which the marginal cost may be lower.
In estimating the grower's base selling price it was assumed that growers correctly estimated the final advance payment and future pool payments. The general purpose guaranteed minimum price, less $10/t and $9/t dockage for slightly sprouted wheat, was used for 1984-85 and 1985-86, respectively, and for 1986-87 the 'general purpose 2' guaranteed minimum price referred to in section 3.2(c). It was assumed that the net present value of future pool returns was $5/t in November 1985 and November 1986 and that there would be no further returns for the December 1986 crop. The discount rates used to estimate the values of these payments in each month were 13 per cent in 1985 and 15 per cent in 1986-87.
Actual gains (or losses) to growers and buyers from permit trading will differ from the estimates presented here, mainly due to the use of average prices and costs in the calculations. Thus the estimates indicate only the possible direction and magnitude of gains and losses from permit trading.
The results (tables A1 and A2) indicate that buyers have generally benefited from buying their stock feed wheat by permit rather than from the Wheat Board. The estimated savings are substantial, ranging from $18/t to $74/t for Victorian buyers since November 1985 and from $5/t to $76/t for New South Wales buyers since December 1984.
The estimated savings to growers were much smaller. Growers in Victoria (table A3) and New South Wales (table A4) had estimated savings of up to $36.50/t from selling permit wheat to capital city buyers. However, it was estimated that losses would have been incurred by growers selling permit wheat between May-June and November 1986. Such losses could be expected in such a period if growers did not foresee the subsequent decline in prices (see Rose and Sniekers 1986). In fact, the majority of permit sales occur at or within a few months of harvest, so that these estimated losses probably would not have been incurred by most growers selling permit wheat.
These results indicate that both buyers and growers can gain from using the permit system for stock feed wheat, with buyers gaining more than growers. The estimates of losses may not reflect significant actual losses,

both because there is little trading in the interharvest period and because the delivery cost is probably lower than the freight cost to the capital city, many sales being made by growers located near buyers.

Table Al: SAVINGS TO VICTORIAN PERMIT WHEAT BUYERS
Cost of wheat from Wheat Board Cost of permit wheat Cost of transport
Average from bulk Wheat Board handling Total Melbourne Total Saving Permit
Month price (a) authority (A) permit price(b) fee (B) (A - B)
S/t S/t S/t S/t S/t S/t S/t 1985 December 184.28 5.00 189.28 112.00 3.70 115.70 73.58
1986 January February
m March F April
May June July August September October November December
1987 January 133.31 7.00 140.31 102.50 3.90 106.40 33.91 February 137.79 7.00 144.79 96.50 3.90 100.40 44.39 March 143.57 7.00 150.57 107.00 3.90 110.90 39.67 April 137.78 7.00 144.78 112.00 3.90 115.90 28.88 May 142.00 7.00 149.00 113.50 3.90 117.40 31.60 June 130.82 7.00 137.82 116.25 3.90 120.15 17.67
(a) Australian standard white fob export quote, plus Tasmanian freight levy less 'fobbing' costs and quality discount. (b) Price of general purpose lightly sprouted wheat. Sources: Australian Wheat Board; New South Wales Department- of Agriculture; Stock and Land (1987).
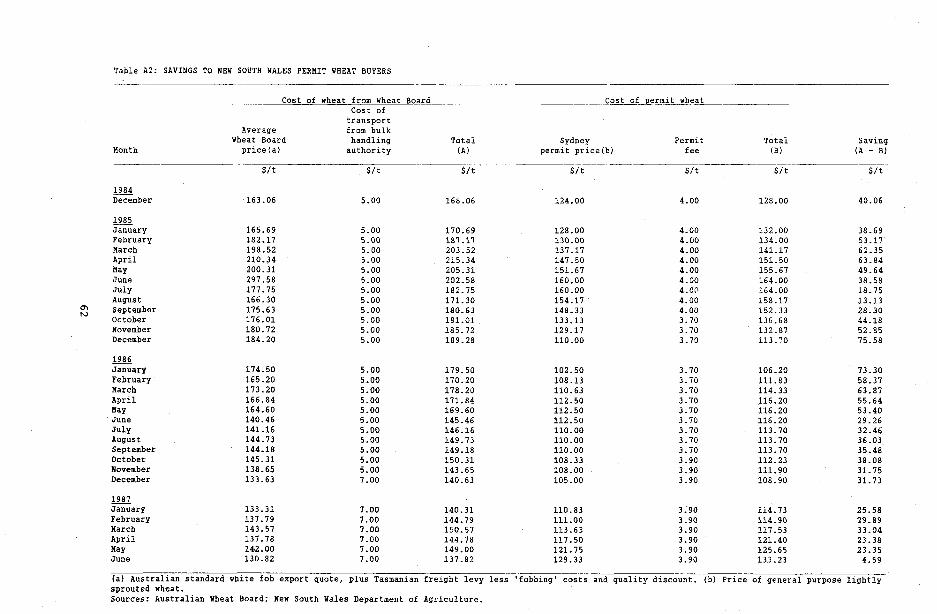
Table A2: SAVINGS TO NEW SOUTH WALES PERMIT WHEAT BUYERS
Cost of wheat from Wheat Board cost of transport
Average from bulk Wheat Board handllng Totai prlce (a) authority (A)
Cost of Eermlt wheat p-.p-
Sydney Permlt permlt prlce(b) fee
Tot ai (B)
Saving (A - B) Month
1984 December
1985 January February March Aprll May June July August September October November December
1986 January February March April May June July August September October November December
1987 January February March April May June
(a) Australian standard whlte fob export quote, plus Tasmanian frelght levy less 'fobbrng' costs and quallty discount. (b) Price of general purpose llghtly sprouted wheat. Sources: Australian Wheat Board; New South Wales Department of Agriculture.
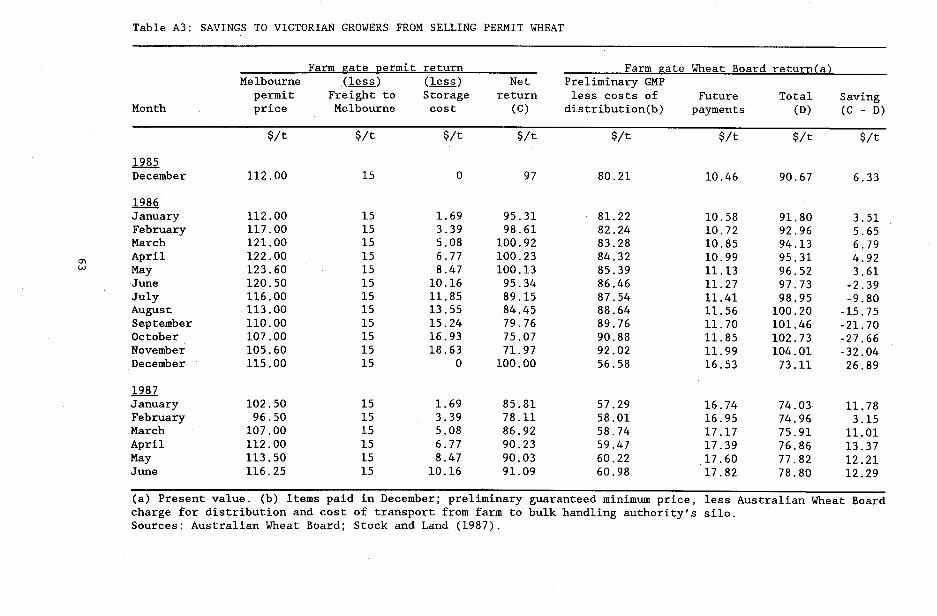
Table A3: SAVINGS TO VICTORIAN GROWERS FROM SELLING PERMIT WHEAT
Farm gate permit return Farm gate Wheat Board return(a) Melbourne (k) (kE) Net Preliminary GMP permit Freightto Storage return less costs of Future Total Saving
Month price Melbourne cost (c) dis tribution(b) payments (D) (C - D)
1985 December
1986 January February March
m April W May
June July August September October November December
1987 January 102.50 15 1.69 85.81 57.29 16.74 74.03 11.78 February 96.50 15 3.39 78.11 58.01 16.95 74.96 3.15 March 107.00 15 5.08 86.92 58.74 17.17 75.91 11.01 April 112.00 15 6.77 90.23 59.47 17.39 76.86 13.37 May 113.50 15 8.47 90.03 60.22 17.60 77.82 12.21 June 116.25 15 10.16 91.09 60.98 17.82 78.80 12.29
(a) Present value. (b) Items paid in December; preliminary guaranteed minimum price, less Australian Wheat Board charge for distribution and cost of transport from farm to bulk handling authority's silo. Sources: Australian Wheat Board; Stock and Land (1987).

Table A4: SAVINGS TO NEW SOUTH WALES GROWERS FROM SELLING PERMIT WHEAT ---p .- p-- - -- - -.
Month
1984 December
1985 January February March April May June July August September October
2 November December
1986 January February March April May June July August September October November December
1987 January February March April May June
Farm gate permit return -- Sydney (U) (&ss) permrt Freight to Storage prlce Sydney cost
- - .. . -- Net
return ( C )
Farmgateheat B-oard return(a1 .- --p--- - -- Preliminary GMP less costs of Future Total Saving
dlstrlbuclon(b) payments (D) ( C - D) -- - -- - - -
S/t S/t S/t S/t
(a) Present value. (b) Items paid in December; preliminary guaranteed minimum price, less Australian Wheat Board charge for distribution and cost of transport from farm to bulk handling authority's silo. Sources: Australian Wheat Board; New South Waies Department of Agriculture.

REFERENCES
Allais, M. and Hagen, 0. (1979), Expected Utility Hypothesis and the Allais Paradox, Reidel Publishing Company, Dordrecht, Holland.
Australian Bureau of Statistics (1985), Foreien Trade. Australia, Part 1: Exports and Imports. 1984-85, Cat.No.5409.0, Canberra.
(1986), Manufacturine Establishments: Summary of Operations by Industry Class. Australia. 1984-85, Cat.No.8202.0, Canberra.
Australian Wheat Board (1986a), Annual Report 1985-86, Melbourne (and previous years).
(1986b), Pool Pavment Mechanisms, Australian Wheat Topics No. 2, Melbourne.
(1987a), The ASW Grade - Payment for Quality, Discussion Paper, Melb
(1987b), Australian Wheat Board Chairman's Letter, No.44, Melbourne (and previous issues).
Bureau of Agricultural Economics (1983), Wheat Marketine: in Australia: An Economic Evaluation, Occasional Paper No.86, AGPS, Canberra.
(1985), Agricultural Policies in the European Communitv: Their Origins, Nature and Effects on Production and Trade, Policy Monograph No.2, AGPS, Canberra.
(1986a), Commodity Statistical Bulletin, AGPS, Canberra.
(1986b), Crop and Rainfall Insurance, A BAE submission to the IAC, March 1986, AGPS, Canberra.
(1987a), Crop Report, No.42, 7 July, Canberra.
(1987b), Farm Surveys Report, March 1987, AGPS, Canberra.
Bread Research Institute (1986), Annual Report 1985-86 (and previous years).
Department of Primary Industry (1986), Rural Adjustment Scheme Annual Report 1985-86, AGPS, Canberra.
Edwards, G.W. and Freebairn, J.W. (1981), Measurine a Countrv's Gains from Research: Theory and A~plication to Rural Research in Australia, Report to the Commonwealth Council for Rural Research and Extension, AGPS, Canberra.
Foster, M. and Geldard, J. (1985), 'US and Australian price interrelationships for coarse grains', Ouarterlv Review of the Rural Economy 7(3), 257-66.
Hall, N. and Backhouse, M. (1987), 'Performance of the farm sector', Farm Surveys Report, AGPS, Canberra.
Hinchy, M. (1987), Evaluating the producer benefits from underwriting. BAE paper delivered to the 31st Annual Conference of the Australian Agricultural Economics Society, Adelaide, 10-12 February.

Industries Assistance Commission (1978), Wheat Stabilisation, Report No.175, AGPS, Canberra.
(1983), The Wheat Industrv, Report No.329, AGPS, Canberra
- (1987), Assistance to Agricultural and Manufacturing Industries, AGPS, Canberra.
International Wheat Council (1987), &&et Re~ort, PMR 155, 26 March.
Longworth, J.W. and Knopke, P. (1982), 'Australian wheat policy 1948-49: a welfare evaluation', American Journal of A~ricultural Economics 64(4), 642 - 54.
Love, G. (1987a), 'Wheat: short term', Ouarterlv Review of the Rural Economv 9(1), 38-9.
, (1987b), 'Wheat: medium term', Ouarterlv Review of the Rural Economy 9(1), 40-1.
Miller, G. and White, G. (1980), The seventh wheat industry stabilisation scheme: evolution and economic effects. BAE paper presented to the 24th Annual Conference of the Australian Agricultural Economics Society, Adelaide, 12-14 February.
Myers, R.J., Piggott, H.R.R. and MacAuley, T.G. (1985), 'Effects of past Australian wheat price policies on key industry variables', Australian Journal of Agricultural Economics 29(1), 1-15.
Newbery, D. and Stiglitz, J. (1981), The Theorv of Commoditv Stabilisation: A Studv in the Economics of Risk, Clarendon Press, Oxford.
Perkins, P., Sniekers, P. and Geldard, J. (1984), 'Commercial link between Australian and US wheat prices', Quarterly Review of the Rural Economy 6(4), 321-9.
Quiggin, J. (1983), 'Underwriting agricultural commodity prices', Australian Journal of Agricultural Economics 27(3), 200-11.
Reserve Bank of Australia (1987), Bulletin, March, Sydney.
Rose, R. and Sniekers, P. (1986), Prospects for the Australian stock feed industry. BAE paper presented at the 4th Biennial Workshop of the Stockfeed Manufacturers Association of Queensland, Gold Coast, 19-21 October.
Ryan, T.J. (1981), The Demand for Wheat for Food Uses in Australia, Department of Agriculture, Victoria.
Spriggs, J., Geldard, J., Gerardi, W. and Treadwell, R. (1987), Institutional Arrangements in the Australian Wheat Distribution System, BAE Occasional Paper 99, AGPS, Canberra.
Stock and Land (1987), 'Suggested selling prices for grain', Stock and Land, 25 June (and previous issues).
Watson, A.S. (1984), 'Wheat in 1984', Review of Marketing and Agricultural Economics 52(2), 107-16.