Embed Size (px)
Citation preview

Using Solar Hot Water to Address Piping Heat Losses in Multifamily Buildings David Springer, Matt Seitzler, Christine Backman, and Elizabeth Weitzel Alliance for Residential Building Innovation
October 2015

i
NOTICE
This report was prepared as an account of work sponsored by an agency of the United States government. Neither the United States government nor any agency thereof, nor any of their employees, subcontractors, or affiliated partners makes any warranty, express or implied, or assumes any legal liability or responsibility for the accuracy, completeness, or usefulness of any information, apparatus, product, or process disclosed, or represents that its use would not infringe privately owned rights. Reference herein to any specific commercial product, process, or service by trade name, trademark, manufacturer, or otherwise does not necessarily constitute or imply its endorsement, recommendation, or favoring by the United States government or any agency thereof. The views and opinions of authors expressed herein do not necessarily state or reflect those of the United States government or any agency thereof.
Available electronically at http://www.osti.gov/bridge
Available for a processing fee to U.S. Department of Energy and its contractors, in paper, from:
U.S. Department of Energy Office of Scientific and Technical Information
P.O. Box 62 Oak Ridge, TN 37831-0062
phone: 865.576.8401 fax: 865.576.5728
email: mailto:[email protected]
Available for sale to the public, in paper, from: U.S. Department of Commerce
National Technical Information Service 5285 Port Royal Road Springfield, VA 22161 phone: 800.553.6847
fax: 703.605.6900 email: [email protected]
online ordering: http://www.ntis.gov/ordering.htm

iii
Using Solar Hot Water To Address Piping Heat Losses in Multifamily Buildings
Prepared for:
The National Renewable Energy Laboratory
On behalf of the U.S. Department of Energy’s Building America Program
Office of Energy Efficiency and Renewable Energy
15013 Denver West Parkway
Golden, CO 80401
NREL Contract No. DE-AC36-08GO28308
Prepared by:
David Springer, Matt Seitzler, Christine Backman, and Elizabeth Weitzel
Alliance for Residential Building Innovation
Davis Energy Group, Team Lead
123 C Street
Davis, CA 95616
NREL Technical Monitor: Stacey Rothgeb
Prepared under Subcontract No. KNDJ-0-40340-05
October 2015

iv
The work presented in this report does not represent performance of any product relative to regulated minimum efficiency requirements. The laboratory and/or field sites used for this work are not certified rating test facilities. The conditions and methods under which products were characterized for this work differ from standard rating conditions, as described. Because the methods and conditions differ, the reported results are not comparable to rated product performance and should only be used to estimate performance under the measured conditions.

v
Contents List of Figures ............................................................................................................................................ vi List of Tables .............................................................................................................................................. vi Definitions .................................................................................................................................................. vii Acknowledgments ................................................................................................................................... viii Executive Summary ................................................................................................................................... ix 1 Introduction ........................................................................................................................................... 1
1.1 Background and Need ..........................................................................................................1 1.2 Strategies for Reducing Recirculation Losses .....................................................................1 1.3 Typical Solar Hot Water System Design and Potential Improvements ...............................2 1.4 Previous and Proposed Research .........................................................................................4
2 Technical Description .......................................................................................................................... 5 2.1 Test Site Selection and Description .....................................................................................5 2.2 Plumbing Modifications.......................................................................................................7 2.3 Control Modifications ..........................................................................................................8 2.4 Tradeoffs ..............................................................................................................................8
3 Field Measurement Methods ............................................................................................................... 9 3.1 Test Plan and Monitoring Strategy ......................................................................................9
3.1.1 Monitoring Approach...............................................................................................9 3.1.2 Test Schedule and Conditions ................................................................................11 3.1.3 Calculation of Water and Heat Flows ....................................................................11 3.1.4 Comparison of Calculated versus Measured Recirculation Loop Heat Loss ........12 3.1.5 Uncertainty Analysis Methods ...............................................................................13
3.2 TRansieNt SYtems Simulation Software Analysis Methods .............................................14 3.2.1 Modeling Assumptions ..........................................................................................14 3.2.2 Parametric Evaluation ............................................................................................16
4 Results ................................................................................................................................................. 17 4.1 Monitoring Results.............................................................................................................17
4.1.1 Site Conditions and Weather .................................................................................17 4.1.2 Frequency of Operation in Recirculation Mode ....................................................19 4.1.3 Measured Solar Fraction ........................................................................................20 4.1.4 Measured Energy Savings......................................................................................21
4.2 Simulation Results .............................................................................................................23 4.3 Implementation Costs and Cost-Effectiveness ..................................................................26 4.4 Conclusions and Recommendations ..................................................................................26
References ................................................................................................................................................. 28 Appendix .................................................................................................................................................... 29
Photos .......................................................................................................................................30 Tabulated Simulation Results ..................................................................................................32

vi
List of Figures Figure 1. Typical water heater and solar storage tank configuration during hot water draw ............. 2 Figure 2.Typical water heater and solar storage tank configuration during standby .......................... 2 Figure 3. Solar recirculation valve and piping configuration shown during standby ......................... 3 Figure 4. Effect of water temperature on the performance of a typical flat-plate collector based on
incident solar radiation of 250 Btu/h-ft2 and ambient air temperature of 80°F............................... 4 Figure 5. Site 1: Belle Terre senior housing, Lafayette ........................................................................... 6 Figure 6. Site 2: Carlow Court mixed-use community, Dublin ............................................................... 6 Figure 7. Piping configuration and modifications used at the two test sites ....................................... 7 Figure 8. System schematic with monitoring sensor locations shown .............................................. 10 Figure 9. Average daily DHW use profile ................................................................................................ 16 Figure 10. Daily DHW use in gpd/person for recirculation modes ....................................................... 17 Figure 11. Recirculation system losses .................................................................................................. 18 Figure 12. Comparison of daily total horizontal insolation for Lafayette and Dublin ........................ 19 Figure 13. Solar recirculation mode duty cycles ................................................................................... 20 Figure 14. Site 1: Lafayette, variation of solar fraction with insolation rate ....................................... 21 Figure 15. Site 2: Dublin, variation of solar fraction with insolation rate ............................................ 21 Figure 16. Site 1: Comparison of loads presented to the water heater in the two modes ................ 22 Figure 17. Site 2: Comparison of loads presented to the water heater in the two modes ................ 23 Figure 18. Parametric analysis results for Concord with 12 gpd/person DHW use ........................... 24 Figure 19. Simulated solar fractions in standard and SWHR modes as a function of solar collector
area and climate for 12 gpd/person DHW use ................................................................................. 24 Figure 20. TRNSYS predicted energy savings for 12 gpd/person DHW use ...................................... 25 Figure 21. TRNSYS predicted energy savings for 21 gpd/person DHW use ...................................... 25 Figure 22. TRNSYS Schematic ................................................................................................................ 31
Unless otherwise noted, all figures were created by the ARBI team.
List of Tables Table 1. Field Test Site Characterization .................................................................................................. 5 Table 2. Monitoring System Data Points and Descriptions .................................................................... 9 Table 3. Test Mode Schedule ................................................................................................................... 11 Table 4. Project Instrument Uncertainties .............................................................................................. 13 Table 5. TRNSYS Input and Operating Assumptions ............................................................................ 15 Table 6. Simulation Results for 12 gpd/Person Hot Water Use ............................................................ 32 Table 7. Simulation Results for 21 gpd/Person Hot Water Use ............................................................ 33
Unless otherwise noted, all tables were created by the ARBI team.

vii
Definitions
ARBI Alliance for Residential Building Innovation
ASHRAE American Society of Heating, Refrigerating and Air Conditioning Engineers
DHW Domestic Hot Water
gpd Gallons per Day
gpm Gallons per Minute
SWHR Solar Water Heating Recirculation (applies to a mode of operation where recirculated hot water from a building is diverted to the solar storage tank instead of the water heater)
TRNSYS TRansieNt SYstem Simulation, a proprietary model for simulating the transient behavior of systems
Note: See page 20 for definitions of variable names used in equations and to report results.

viii
Acknowledgments
In the early stages of this project TRC provided substantial assistance with the identification of sites and provided the noninvasive flow measurement equipment that allowed major modifications to piping and associated costs to be avoided.
The deep involvement of Sun Light & Power in the site selection, owner coordination, installation of valves and controls, and assistance with monitoring made it possible to complete the acquisition of field data within the project schedule.

ix
Executive Summary
Heat is lost from the piping that is used to recirculate hot water to individual units in multifamily buildings. It can constitute a major component of water heating energy use and has been cited to be as high as 40% of the total energy use. Applying controls to limit recirculating pump operation has had limited success, because controls can increase wait times when hot water is used late at night and during the early morning hours.
Solar thermal water heaters are most cost-effective when they are applied to multifamily buildings; some states offer incentives or other inducements to install these water heaters. However, typical solar water heater designs do not allow the solar-generated heat to be applied to recirculation losses; the heaters only reduce the amount of gas or electric energy needed to deliver hot water to the fixtures. Hot water that is recirculated through a building is typically returned to the water heater; returning it to the solar storage tank would effectively heat the water in the storage tank with gas- or electricity-generated heat, which lowers the efficiency of the solar water heater. The U.S. Department of Energy’s Building America research team Alliance for Residential Building Innovation investigated the effectiveness of using automatic valves to divert water (which is normally returned through the recirculation piping to the gas or electric water heater) to the solar storage tank when the returning water is cooler than the water in the solar storage tank.
Two multifamily buildings of approximately 50 units each in the San Francisco Bay area communities of Lafayette and Dublin were equipped with valves to allow the recirculated hot water to be diverted as described; differential thermostats were used to control the valves. These two buildings were monitored between July and October 2014; each mode (standard and solar hot water recirculation) was enabled twice during this period to obtain results under varying weather and load conditions.
To supplement the data from field monitoring, the solar water heating recirculation system was simulated using TRNSYS software to evaluate a full year of performance in the San Francisco Bay area climate, a hot-dry climate (Sacramento), a cold climate (Denver), and a very hot-dry climate (Phoenix).
Data from simulations agreed reasonably well with field data. Over the approximately 3-month monitoring period, energy savings from the Lafayette and Dublin sites were 25% and 41%, respectively, based on a comparison of energy supplied to the water heater from the solar storage tank. (Natural gas use was not monitored.) The full-year energy savings predicted by TRNSYS software for a building-system model with characteristics that were similar to the Lafayette site were 19%. The incremental energy savings were higher in warmer climates with larger solar collector areas and lower hot water loads. Conditions that provide higher water temperatures in the solar storage tank resulted in a higher incidence of return water diversion to storage and higher energy savings. For example, applying the solar water heating recirculation design strategy to a system located in Phoenix with a collector area of 640 ft2 and a hot water use of 480 gallons per day is projected to reduce the load on the gas water heater by 32%.

x
The higher cost of retrofitting existing buildings will likely discourage this measure due to the piping modifications required, but for new buildings the simple payback can be less than 2 years and in some cases less than 1 year.

1
1 Introduction
1.1 Background and Need Energy use for domestic water heating is the second-largest component of a multifamily building energy budget and is surpassed only by heating in cold and mixed climates (Goldner 1999.) A high percentage of multifamily buildings use central hot water systems and recirculate hot water to the individual units to reduce or eliminate wait times. For larger multistory multifamily buildings, installing central water heating is less costly because of the cost of gas piping, venting, and other requirements. Also, individual water heaters consume valuable floor space, and gas water heaters must be vented to the outdoors for combustion air. Central water heating is also typically used in affordable housing projects, many of which were constructed after the 2007 housing market crash when little else was being built.
California’s 2013 Title-24 energy code update made solar water heating a prescriptive requirement for new multifamily buildings that use central water (CEC 2012), which effectively means that if solar water heating is not installed, other measures must be included that save equivalent energy. Title 24 standards requirements for size and performance vary with climate zone; the required minimum 0.20 solar fraction is required in the milder coastal climate and 0.35 is required for inland locations. This code change is expected to cause solar water heating systems to become much more prevalent in new multifamily buildings throughout California. Itron (2011) revealed that solar water heating is much more cost-effective for multifamily applications than for single-family applications due to higher loads and economies of scale.
Loss of heat from recirculation piping in typical multifamily projects can be extensive; if pipes are poorly insulated, thermal losses from piping can exceed the energy used to supply hot water for showers, sinks, dishwashers, clothes washers, and other uses. Dicicco (1988) and Zang (2009) cite recirculation heat losses of 21%–40% of total water heating energy use. Sachs (2012) cites many cases in which less than one third of the site energy is delivered to the fixtures. Based on monitoring results from 28 multifamily buildings in recent California Public Interest Energy Research, 33% of total domestic hot water (DHW) system energy use was attributed to recirculation system heat loss (HMG 2012).
1.2 Strategies for Reducing Recirculation Losses Timers and temperature controls are frequently installed to limit recirculation pump operating times and thereby reduce piping thermal losses; other control products are beginning to emerge that reduce pump operating time. However, many if not most facility managers operate pumps 24 hours per day to avoid complaints from tenants who use hot water outside the scheduled times. Most timers do not have backup power and lose their time settings the first time the power fails, so building managers tend to disable them.
“Demand” recirculation controls are available that activate the pump for each hot water draw and have been shown to produce savings of about 11% (GTI 2014; Zobrist 2012). Davis Energy Group assisted with field monitoring for a project to evaluate demand systems (Wayland 2012) and found that controls had been disabled in some cases, apparently due to tenant complaints. For multifamily systems that include solar water heating, the effect of recirculation pipe losses can be reduced and a reliable supply of hot water maintained.

2
1.3 Typical Solar Hot Water System Design and Potential Improvements Central hot water systems, with or without solar preheating, typically return the recirculated water to the water heater (Figure 1 and Figure 2).1 Figure 1 represents the condition under which a hot water draw occurs and the solar water heater actively collects heat. Figure 2 represents the condition under which little or no hot water is drawn and the solar water heater actively collects heat, which would be typical during midday hours while most tenants are away. As represented by Figure 1 and Figure 2, useful heat is provided by the solar storage tank only when hot water is drawn, and all losses that occur in the recirculation piping must be made up by the water heater.
Figure 1. Typical water heater and solar storage tank configuration during hot water draw
Figure 2.Typical water heater and solar storage tank configuration during standby 1 For simplicity the figure omits valves and piping that are normally included in systems, such as a tempering valve.

3
The piping arrangement shown in these figures is the logical way to connect the solar storage tank and the recirculation loop to the main water heater. If the recirculated water were returned to the solar storage tank, the storage tank would effectively be in series with the gas water heater and would be heated by gas. This configuration would raise the average temperature of the tank and lower the solar collector efficiency.
The U.S. Department of Energy’s Building America research team Alliance for Residential Building Innovation (ARBI) investigated a strategy that selectively returns recirculated hot water to the water heater when hot water stored in the solar tank is relatively cool and to the solar storage tank when the solar heated water is at a higher temperature than the return water. The piping modifications required are represented in Figure 3. This figure represents a condition under which no hot water is drawn and the solar storage tank heats recirculated water. A three-way valve is used to divert water from the water heater to the solar storage tank when solar-heated water is warmer than the water returning from the recirculation loop.
Figure 3. Solar recirculation valve and piping configuration shown during standby
Using this solar recirculation mode to return recirculated water to the storage tank effectively shifts the use of solar-heated water from meeting recovery loads only to offsetting recirculation losses as well. (Recovery load occurs when the water heater delivers hot water to fixtures during a draw.) This approach diminishes the heat that would otherwise be stored for use when hot water is drawn. However, if the solar storage tank temperature is kept lower as it serves the continuous recirculating loop load, the efficiency of the solar collectors improves. This higher efficiency allows more heat to be produced and decreases the amount of heat that must be generated by the gas water heater. Figure 4 illustrates the dependency of collector efficiency and capacity on stored water temperature (or entering water temperature). Colder outdoor temperatures would result in steeper curves. This improvement in solar collector efficiency and the resulting reduction in overall energy use of the system is the principle behind the solar-recirculation strategy.

4
Figure 4. Effect of water temperature on the performance of a typical flat-plate collector based on incident solar radiation of 250 Btu/h-ft2 and ambient air temperature of 80°F
Solar water heaters are typically sized to meet the recovery load only. Increasing the size of the collector array to anticipate both recovery load and the load resulting from recirculation losses would increase the duration that the temperature of the hot water in the solar storage tank would exceed that of the returned recirculated water. Also, systems with longer recirculation loops or poorer insulation would benefit more significantly from this strategy. Recirculation losses are continuous and occur while the sun can replace them during daylight hours; thus, the storage volume would not need to be increased coincident with the collector area.
The primary research questions related to this project are:
If the load imposed by recirculation loss can be shifted from gas heating to solar heating, how can it be best accomplished?
What are the benefits of making this shift?
1.4 Previous and Proposed Research As cited in Section 1.1 and Section 1.2, many studies have identified the problem of thermal losses from hot water recirculation and several have investigated methods to control the pump. However, apparently no research has been done to date on the use of solar-heated water to displace gas or electric heating to deal with this nonuseful hot water recirculation load. The team’s initial hypothesis was that recirculation losses could be offset by two-thirds during the summer months and by one-fifth during the winter months simply by using the controls. ARBI tested this hypothesis using a combination of monitored data from two buildings and computer simulations.
5
2 Technical Description
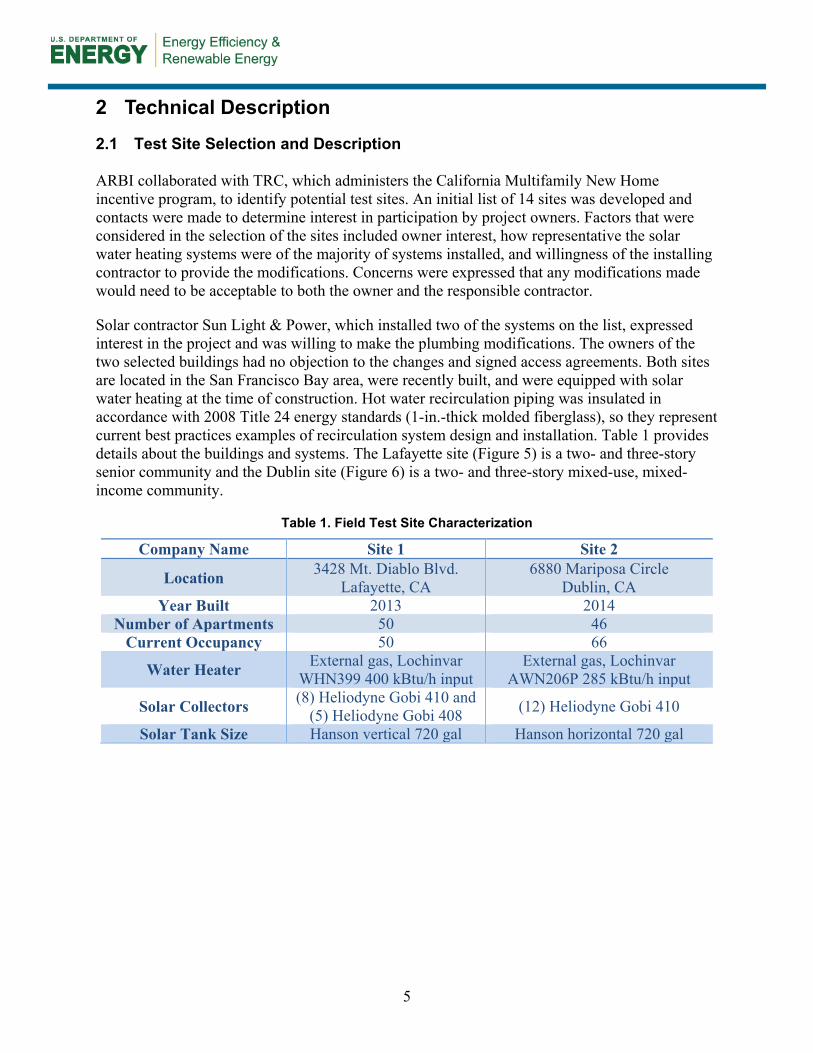
2.1 Test Site Selection and Description ARBI collaborated with TRC, which administers the California Multifamily New Home incentive program, to identify potential test sites. An initial list of 14 sites was developed and contacts were made to determine interest in participation by project owners. Factors that were considered in the selection of the sites included owner interest, how representative the solar water heating systems were of the majority of systems installed, and willingness of the installing contractor to provide the modifications. Concerns were expressed that any modifications made would need to be acceptable to both the owner and the responsible contractor.
Solar contractor Sun Light & Power, which installed two of the systems on the list, expressed interest in the project and was willing to make the plumbing modifications. The owners of the two selected buildings had no objection to the changes and signed access agreements. Both sites are located in the San Francisco Bay area, were recently built, and were equipped with solar water heating at the time of construction. Hot water recirculation piping was insulated in accordance with 2008 Title 24 energy standards (1-in.-thick molded fiberglass), so they represent current best practices examples of recirculation system design and installation. Table 1 provides details about the buildings and systems. The Lafayette site (Figure 5) is a two- and three-story senior community and the Dublin site (Figure 6) is a two- and three-story mixed-use, mixed-income community.
Table 1. Field Test Site Characterization
Company Name Site 1 Site 2
Location 3428 Mt. Diablo Blvd. Lafayette, CA
6880 Mariposa Circle Dublin, CA
Year Built 2013 2014 Number of Apartments 50 46
Current Occupancy 50 66
Water Heater External gas, Lochinvar WHN399 400 kBtu/h input
External gas, Lochinvar AWN206P 285 kBtu/h input
Solar Collectors (8) Heliodyne Gobi 410 and (5) Heliodyne Gobi 408 (12) Heliodyne Gobi 410
Solar Tank Size Hanson vertical 720 gal Hanson horizontal 720 gal

6
Figure 5. Site 1: Belle Terre senior housing, Lafayette
Figure 6. Site 2: Carlow Court mixed-use community, Dublin

7
2.2 Plumbing Modifications Plumbing modifications were made at both locations to allow for switching between the standard recirculation mode and the solar recirculation mode. The standard mode returns circulated water to the water heater as is typically done. The solar recirculation mode returns circulated water to the solar storage tank if the temperature of the return water is cooler than the water at the top of the solar storage tank. These modifications involved adding two automatic valves (one normally open and one normally closed) and a new piping connection to the cold water line entering the solar storage tank. These are shown in Figure 7 as bold lines. The original intent was to use a single three-way valve, but at the time no brass valves could be located that met the “zero lead” content required by the plumbing code.
Figure 7. Piping configuration and modifications used at the two test sites
The purpose of the tempering valve shown in Figure 7 is to prevent scalding water from being delivered by the solar or gas water heaters and is code-required. The purpose of the bypass shown in the figure is to provide a return path for recirculated water when the temperature of water from the water heater exceeds the setting on the tempering valve. According to Sun Light & Power, this is a standard plumbing detail on large recirculation systems. Without the bypass, hot water recirculation flow would be severely restricted by the tempering valve if the entering water temperature exceeds the valve setting. The tempering valve and bypass posed some challenges to flow measurement and energy accounting (Section 2.3 and Section 2.4).
CW HWSHWR
SOLARSTORAGE
WATERHEATER
TEMPERINGVALVE
"3-WAY VALVE"
RECIRC. PUMP
BYPASS
NEW CONNECTION

8
2.3 Control Modifications The Heliodyne Delta T Pro differential thermostats that currently control the solar collector pumps at the two sites can provide two differential functions. Controls at both sites used one function to operate the solar collector pumps using sensors located at the storage tank and solar collectors; this is typical practice. During solar heating cycles the differential thermostat activates the collector pumps when a 20°F differential is reached between temperature sensors located at the collectors and at the bottom of the storage tank. The pump is deactivated when the differential falls to 5°F. The second differential function was previously unused, but a sensor had already been installed to report the temperature at the top of the tank. With the addition of a fourth sensor at the return lines from the recirculation loops, the differential thermostats could be configured to provide a second output to control the new automatic valves.
The controls were wired to power the two automatic valves (one normally open and one normally closed) whenever the temperature returning from the recirculation loop was 10°F cooler than the water at the top of the storage tank and to remove power when this differential fell to 5°F.2 As illustrated in Figure 3 and Figure 7, the piping and control changes allowed recirculated water to be preferentially switched between the solar storage tank and the gas water heater depending on these conditions. The ability to use these controls significantly decreased the cost of the system modifications by eliminating the need for a second differential thermostat.
2.4 Tradeoffs The plumbing and control changes effectively diverted heat that previously was stored only to meet the recovery load to offset recirculation losses as well. This study evaluated the value of this thermal tradeoff. The retrofit of the hot water recirculating return valving and piping added cost and introduced some complexity. The cost would be reduced if it were incorporated as part of the original design in new buildings and systems.
2 The model (see Table 5) used an “on” differential of 5°F and an “off” differential of 0°F to achieve better performance. The control used at the two sites did not allow these settings.

9
3 Field Measurement Methods
3.1 Test Plan and Monitoring Strategy A test plan was developed with the primary goal of determining whether and how much the control changes increased the delivery of solar-generated heat to the system.
ARBI collaborated with Sun Light & Power to identify locations at which sensors, particularly flow meters, could be added without cutting into the piping. Neither the contractor nor the owners wanted more than minor modifications to accommodate the piping changes. Installing large enough gas meters would have been problematic; thus, monitoring focused on measuring water and energy flows and temperatures at various points in the systems as well as the status of the diversion valves. Nonintrusive flow meters and temperature sensors were used to gather the data.
Lacking the opportunity to test conventional and solar recirculation systems side-by-side, the systems were periodically switched between normal and solar recirculation modes with the expectation that there would be sufficient days with similar hot water loads, insolation rates, and temperatures to enable a reasonable comparison of the two modes for the two buildings. As shown in Section 4.1, significant daily variation occurred in hot water use and insolation rates, which are the primary two drivers.
3.1.1 Monitoring Approach Data Electronics Datataker DT50 data loggers were used at each multifamily site to collect, store, and transfer data. Cellular modems were used to transmit the data to the ARBI data collection server. The following measurement points are listed in Table 2 and shown in Figure 8:
Table 2. Monitoring System Data Points and Descriptions
Reference Description T1 Temperature: cold water inlet T2 Temperature: recirculation return T3 Temperature: hot water supply T4 Temperature: hot water return, downstream from bypass T5 Temperature: tempering valve “cold” side input T6 Temperature: water heater return (entering water) T7* Temperature: hot water leaving solar storage tank T8 Temperature: bottom of solar storage tank F1* Flow: cold water inlet F2 Flow: recirculation return F3 Flow: hot water supply F4 Flow: recirculating return downstream of bypass to tempering valve F5* Flow: recirculation return in bypass to tempering valve F6* Flow: cold water delivered to tempering valve before bypass F7* Flow: cold water inlet to storage tank F8* Flow: cold water delivered to tempering valve after bypass SRP Status: recirculating return pump
S3WV Status: 3-way valve

10
Surface-mounted thermocouples on the cold water inlet to the storage tank and to the tempering valve, water heater inlet, hot water outlet from the tempering valve, and recirculation return
Nonintrusive sonic flowmeters on the recirculation return and hot water supply and an immersion VFS flowmeter on the recirculation return line downstream of the bypass
Relays to sense the status of the diversion valves and the recirculation pump.
Figure 8. System schematic with monitoring sensor locations shown
The data loggers were programmed to scan data continuously at 15-second intervals; energy flow calculations were completed at the same intervals. Average temperatures, total water flows, and summed energy flows were logged every 15 minutes. Data were transmitted daily to the ARBI data collection server. Table 2 summarizes the measurement points and reference abbreviations shown on the system schematic in Figure 8.
Flow meters could not be installed in each location to measure water and heat flows in each piping branch; thus, the information the team was able to gather had to be used to calculate some
TEMPERINGVALVE
"3-WAY VALVE"
RECIRC. PUMP
BYPASS
F1*
T1
F2 F3
T3
F5*
T5 F8*
F7*F6*
T7*
T8
T6
T4
F4
T2
CW HWSHWR
SOLARSTORAGE
WATERHEATER

11
of the flows and one of the temperatures. Flow meter locations were limited (1) because the straight length of pipe was insufficient obtain reasonably accurate measurements and (2) by other spatial constraints. The “*” designation indicates that the values were calculated from other flow and temperature measurements rather than being directly measured. Data for T4 and F4 were obtained from in-line sensors that had been installed during construction. All other flow measurements were obtained using ultrasonic nonintrusive flow meters. All other temperatures were obtained using well insulated strap-on thermocouples.
3.1.2 Test Schedule and Conditions Data collection began as soon as systems were installed in mid-July 2014. Per the test plan, a minimum of 4 weeks in each mode was planned; however, conditions allowed for testing to extend beyond 4 weeks in each mode. Both buildings were switched between standard and solar recirculation modes on the same dates, which are listed in Table 3. During the solar recirculation mode tests, diversion of return water flow to the solar storage tank was dependent on temperature conditions and resulting control signals and was not continuous. As the building owners requested, recirculation pumps were operated continuously for both buildings.
Table 3. Test Mode Schedule
Test Mode Date Interval Standard Recirculation 7/12/14–7/19/14
Solar Recirculation 7/20/14–8/19/14 Standard Recirculation 8/20/14–9/17/14
Solar Recirculation 9/18/14–10/17/14 3.1.3 Calculation of Water and Heat Flows As noted in Section 3.1.1, data from the installed flow meters had to be used to calculate flows at five points. To derive F6* (Figure 8) the conservation of energy principle had to be used to introduce measured water temperatures into Equation 3 from the two flow streams that converged on the pipe at T5. It was necessary to derive T7 using a combination of measured and derived flows and measured temperatures3. The following equations were used to calculate water flows (in gpm) and heat flows (in Btu/h). The symbols refer to the measurement points shown in Figure 8. Methods for addressing the uncertainty of results of these calculations are described in the error analysis section of this report.
F1* = F3 – F2 (1)
F5* = F2 – F4 (2)
F6 *= (F5*)(T5 – T2))/(T1 – T5) (3)
F7* = F1* – F6* (4)
F8* = F6* + F5* (5)
T7* = [(F7* + F4)(T6) – F4(T4)] / F7* (6)
3 Derived using the hot water mixing equation (506.1.3) of the Uniform Facilities Code 3-420-01 October 25, 2008.

12
Qrecirc = (F2)((T3 – T2)( c)(60) (7)
Qsolar_Std._Mode = [(F7*)(T7* – T1) + (S3WV)(F4)(T6-T2)( C)](60) (8)
Qsolar_SWHR_Mode = [(F7*)(T6 – + (S3WV)(F4)(T6- C)](60) (9)
Qdhw = (F1*)(T3 – T1)( C)(60) (10)
Qload = Qdhw + Qrecirc (11)
Qwh= Qload – Qsolar (12)
Solar Fraction = Qsolar / Qload (13)
Where:
Qrecirc = losses in hot water piping during recirculation
Qsolar_Std._Mode = solar hot water contribution to both recovery load (hot water draws) and recirculation losses when the three-way valve is in the standard recirculation mode.
Qsolar_SWHR Mode = solar hot water contribution to both recovery load (hot water draws) and recirculation losses when the three-way valve is in the alternative solar water heating recirculation (SWHR) mode.
Qdhw = hot water end use energy resulting from hot water draws only
Qload = total system load without solar contributions
Qwh = the net load presented to the water heater including solar contributions
S3WV = status of the diversion valves where 0 = normal mode and 1 = SWHR mode
C = the product of the density and specific heat of water in Btu/gallon-°F
The key parameter from these equations is Qwh. The extent to which Qsolar can be increased to offset the total water heating load (Qload) by preheating end-use hot water and by reducing the effective heat loss from the recirculation loop is an indication of energy savings. A higher Qsolar should result in a lower load presented to the water heater (Qwh) and lower gas energy use by the water heater.
3.1.4 Comparison of Calculated versus Measured Recirculation Loop Heat Loss For temperatures used in typical residential hot water systems, Title 24 requires 1 in. of R-4 insulation for pipes ranging from 1-½ in. to 4 in. Plumbing drawings for Site 1 were obtained and pipe lengths were measured to estimate what the pipe heat losses and temperature drops should be given measured water temperatures, the estimated temperature of the air surrounding the pipe, and installed pipe insulation R-value.

13
To obtain the “effective” insulation value for the pipe, the water temperature drop that should occur for a range of insulation R-values (from 1 to 4) was calculated by iterating pipe heat transfer equations (ASHRAE 2009) and matching the calculated and measured temperature drops. A curve fit was then applied to the resulting temperature drops to interpolate the effective R-value. Because the exact location and environment temperature of the piping were not known, calculations were repeated using 70°F and 80°F environment temperatures. At these temperatures, effective R-values of 1.9 and 1.5 ft2-h-°F/Btu, respectively, were calculated. Thus, the effective pipe insulation R-value appears to be less than half the listed value. This finding can be explained partly by the uninsulated branch piping that is connected to the main distribution line carrying heat away. However, other research showed a similar result for insulation continuously applied to piping without branches (Hoeschele and Weitzel 2012).
3.1.5 Uncertainty Analysis Methods Uncertainties4 in the measured variables are published in instrument technical specifications and are presented in Table 4. Assuming the uncertainties of the measured variables are not correlated, the total uncertainty (UR) in the system variable can be approximated using the delta method, as shown in Eq. 14.
Where:
is the sensitivity coefficient, or partial derivative of the Performance Metric (in this case R) with respect to measured variable (xi)5, and uXi is the uncertainty of the measured variable.
Table 4. Project Instrument Uncertainties
Instrument Uncertainty (uXi) Surface Mount Thermocouple ±1.0 ºF
Sonic Flowmeter ±1.61 gpm Vortex Flowmeter ±0.07 gpm
Applying Eq. 12 to the determination of a generalized heat flow “Q” results in Eq. 15.
4As used in this analysis, uncertainty is defined as half the width of a confidence interval or a standard deviation around a measurement value. 5 The partial derivatives depend on the values of the lower level variables and so (typically) unlike the uncertainties of the lower level measurements, they will depend on the value of “x.” The resulting sensitivity coefficient can change over the range encountered. This can result in situations in which one of the measured variables is the critical one within part of the operating range, but another becomes more critical in another range.
(14) = 2
14
= ± + + (15)
The variables F, Th, and Tl refer to the instrument uncertainties listed in Table 4 for flow, high-temperature, and low-temperature values, respectively, that are used in the calculation of Q as in Eq. 7 through 10.
Engineering Equation Solver6 was used to determine the uncertainty. This enabled a percentage of error to be determined for the metric of interest over a known range of values. From this range the average percentage of error at the smaller timescale was then applied to larger sums that were accumulated over time and resulted in an average value for the measurement uncertainty.
Realizing that normal DHW events occur across a range of flow rates and inlet and outlet water temperatures, the corresponding uncertainty for a range of temperature conditions and flow rates was determined. As in the example below, the ranges for Qrecirc are presented. Similar methods were employed for Qdhw, Qsolar, and Qload, except that average values during draw events were considered because these values were of greatest concern for the study.
For the determination of Qrecirc, the hot water supply temperature, Th, was 123°–134°F with an average of 127°F; the hot water return temperature, Tl,, was 120°–130°F and averaged 123°F. The hot water supply flow F3 used in Qrecirc was 7.5–8.9 gpm and averaged 7.9 gpm. These ranges of values were used to determine the ranges of percent error, and the average value was selected for reporting the results. In the case of Qrecirc, the range of values yields 36% as the average percent error. For the parameters of Qdhw, Qsolar, and Qload, the low sonic flowmeter accuracy produced uncertainties of 66%, 69%, and 56%, respectively. These errors were greatest at cold water supply flow rates closer to zero; thus, to reduce uncertainty in the measurements a minimum threshold of 1.61 gpm was used to filter data before calculations were completed.
3.2 TRansieNt SYtems Simulation Software Analysis Methods Field monitoring yielded results for only two specific locations, buildings, systems, and load profiles and for only part of the year. The simulation tool TRNSYS7 was employed to obtain full year estimates of energy savings under varying conditions. TRNSYS incorporates all the system components as objects and readily allows control of the valves using built-in differential temperature control functions. A schematic of the TRNSYS model is provided in the appendix.
3.2.1 Modeling Assumptions TRNSYS Version 17.0 was used to model a system similar to what was installed at Site 1, with the following exceptions:
The bypass between the hot water recirculation return and the cold water line entering the tempering valve was not included due to the uncertainty of the flow rate through the bypass.
6http://www.fchart.com/ees/. 7 http://www.trnsys.com/

15
To avoid delivery of water hotter than the water heater set point of 130°F, if the solar storage tank temperature exceeded 130°F the valve that diverted recirculated water return flow would send water to the water heater, not to the solar storage tank.8
These changes should have little or no effect on the system performance; in fact, this control approach could be implemented in actual systems as additional protection against scalding from excessively hot water stored in the solar tank. All input and operating assumptions used in the TRNSYS model are listed in Table 5. Parametric analysis was completed to determine sensitivity to hot water use, pipe insulation R-value, and the four climate locations noted.
Table 5. TRNSYS Input and Operating Assumptions
Parameter Input/Operating Assumption
Hot Water Use 12 gpd/person × 50 residents = 600 gpd 21 gpd/person × 50 residents = 1,050 gpd
How Water Use Profile As shown in Figure 9, no daily or seasonal variation Entering Cold Water
Temperature Water mains temperature9
Pipe Environment Temperature 76°F (yields similar temperature drop as measured for Site 1)
Tank Environment Temperature 80°F (enclosed mechanical room) Supply-Return Pipe Length 1000 ft
Pipe Diameter, Type 2-in. nominal, copper
Pipe Insulation R-2 (consistent with measured effective R-value for Site 1) no-pipe insulation
Diversion Valve Control Setting 5°F on differential, 0°F off differential Temperature Sensor Locations Top of solar storage tank and hot water return line Recirculation Pipe Flow Rate 7.9 gpm fixed
Storage Tank Volume 720 gal fixed (vertically oriented) Solar Collector Area Varied: 400, 480, 560, 640 ft2
Climate Locations Concord, CA; Sacramento, CA; Phoenix, AZ; Denver, CO Simulation Time Step 1 minute
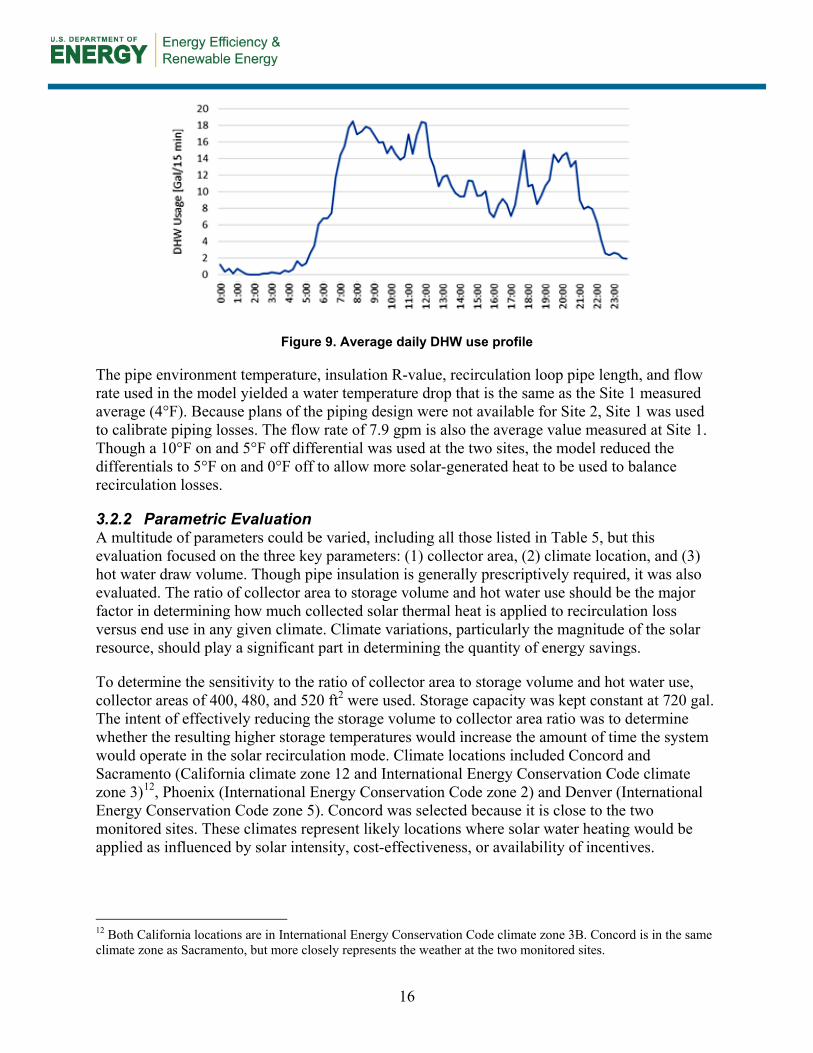
The assumed daily hot water use and use profile are based on averages of measured volumes from Site 1 (Lafayette). For each time step bin of 15 minutes the measured data were averaged to yield the draw profile presented in Figure 9. The 12 gpd/person use is an average of the use volumes measured at Site 1 when data were filtered.10 ENERGY STAR® simulation guidelines for high-rise buildings recommend using 12 and 25 gpd/person for “low” and “medium” hot water use, respectively.11
8 In the solar recirculation mode recirculated water could flow into the solar storage tank, then into the water heater, and back out to the building. The tempering valve was operative only if hot water was drawn. 9 Calculated by Type 15 in TRNSYS using the algorithm developed by Burch and Christensen (2007). 10 To reduce measurement uncertainty, when flow rates fell below the measurement accuracy limit of the sonic flow meters, associated data were filtered out. 11www.energystar.gov/ia/partners/bldrs_lenders_raters/downloads/mfhr/ES_MFHR_Simulation_Guidelines_Rev02_redline.pdf?c3a7-5ec8
16
Figure 9. Average daily DHW use profile
The pipe environment temperature, insulation R-value, recirculation loop pipe length, and flow rate used in the model yielded a water temperature drop that is the same as the Site 1 measured average (4°F). Because plans of the piping design were not available for Site 2, Site 1 was used to calibrate piping losses. The flow rate of 7.9 gpm is also the average value measured at Site 1. Though a 10°F on and 5°F off differential was used at the two sites, the model reduced the differentials to 5°F on and 0°F off to allow more solar-generated heat to be used to balance recirculation losses.
3.2.2 Parametric Evaluation A multitude of parameters could be varied, including all those listed in Table 5, but this evaluation focused on the three key parameters: (1) collector area, (2) climate location, and (3) hot water draw volume. Though pipe insulation is generally prescriptively required, it was also evaluated. The ratio of collector area to storage volume and hot water use should be the major factor in determining how much collected solar thermal heat is applied to recirculation loss versus end use in any given climate. Climate variations, particularly the magnitude of the solar resource, should play a significant part in determining the quantity of energy savings.
To determine the sensitivity to the ratio of collector area to storage volume and hot water use, collector areas of 400, 480, and 520 ft2 were used. Storage capacity was kept constant at 720 gal. The intent of effectively reducing the storage volume to collector area ratio was to determine whether the resulting higher storage temperatures would increase the amount of time the system would operate in the solar recirculation mode. Climate locations included Concord and Sacramento (California climate zone 12 and International Energy Conservation Code climate zone 3)12, Phoenix (International Energy Conservation Code zone 2) and Denver (International Energy Conservation Code zone 5). Concord was selected because it is close to the two monitored sites. These climates represent likely locations where solar water heating would be applied as influenced by solar intensity, cost-effectiveness, or availability of incentives.
12 Both California locations are in International Energy Conservation Code climate zone 3B. Concord is in the same climate zone as Sacramento, but more closely represents the weather at the two monitored sites.

17
4 Results
4.1 Monitoring Results 4.1.1 Site Conditions and Weather Monitoring results are presented in the context of hot water end use, recirculation losses, and solar radiation. These variables can significantly affect the extent to which the solar heating system contributes to the water heating demand. Indoor and outdoor air temperatures play smaller roles in this case, because 1) mechanical rooms are heated by the water heater and piping heat loss and 2) all hot water recirculation piping is inside conditioned space (in the framing between floors).
Figure 10 plots the measured daily DHW use in gallons per person per day for each site. Use averaged 11.9 gpd/person for Site 1 and 8.4 gpd/person for Site 2.13 Differences in the use patterns may be attributed to the type of occupancy. Site 1, Lafayette, is a senior living center, and Site 2, Dublin, is family housing with a mixture of ages.
Figure 10. Daily DHW use in gpd/person for recirculation modes
Figure 11 shows the significant differences in measured recirculation losses (Qrecirc) between the two sites. For Site 1 piping losses were 47% of the combined load from hot water draws and recirculation losses. For Site 2 piping losses of only 20% were measured. This variance of 265% between the sites is the result of differences in the temperature losses between the hot water supply and the recirculation return and differences in flow rates. On average, the Site 1 recirculation supply-return temperature difference was 4°F, and was 212% higher than the Site 2 temperature difference of 1.41°F; the average recirculation system flow was 28% higher at Site 1 (7.93 gpm versus 6.18 gpm). The piping length, diameter, and insulation thickness are known for
13 When values that fell below the measurement accuracy of the sonic flow meters were filtered out.

18
Site 1, but plumbing plans were not available for Site 2, so calculated pipe losses could not be compared.
Figure 11. Recirculation system losses
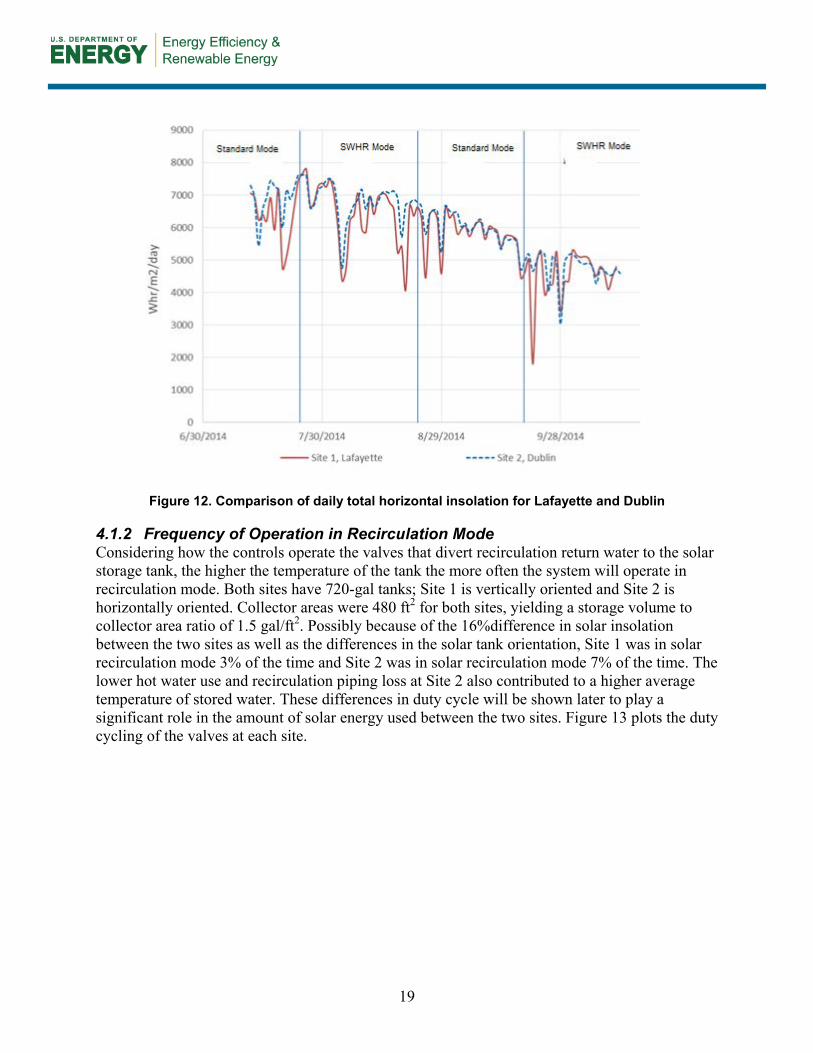
Figure 12 plots the daily total horizontal solar radiation obtained from the California Irrigation Management Information System for locations close to the two sites. Differences in the total insolation were within 16% of one another and were probably due to greater intrusions of coastal fog in Lafayette than in Dublin.
19
Figure 12. Comparison of daily total horizontal insolation for Lafayette and Dublin
4.1.2 Frequency of Operation in Recirculation Mode Considering how the controls operate the valves that divert recirculation return water to the solar storage tank, the higher the temperature of the tank the more often the system will operate in recirculation mode. Both sites have 720-gal tanks; Site 1 is vertically oriented and Site 2 is horizontally oriented. Collector areas were 480 ft2 for both sites, yielding a storage volume to collector area ratio of 1.5 gal/ft2. Possibly because of the 16%difference in solar insolation between the two sites as well as the differences in the solar tank orientation, Site 1 was in solar recirculation mode 3% of the time and Site 2 was in solar recirculation mode 7% of the time. The lower hot water use and recirculation piping loss at Site 2 also contributed to a higher average temperature of stored water. These differences in duty cycle will be shown later to play a significant role in the amount of solar energy used between the two sites. Figure 13 plots the duty cycling of the valves at each site.
20
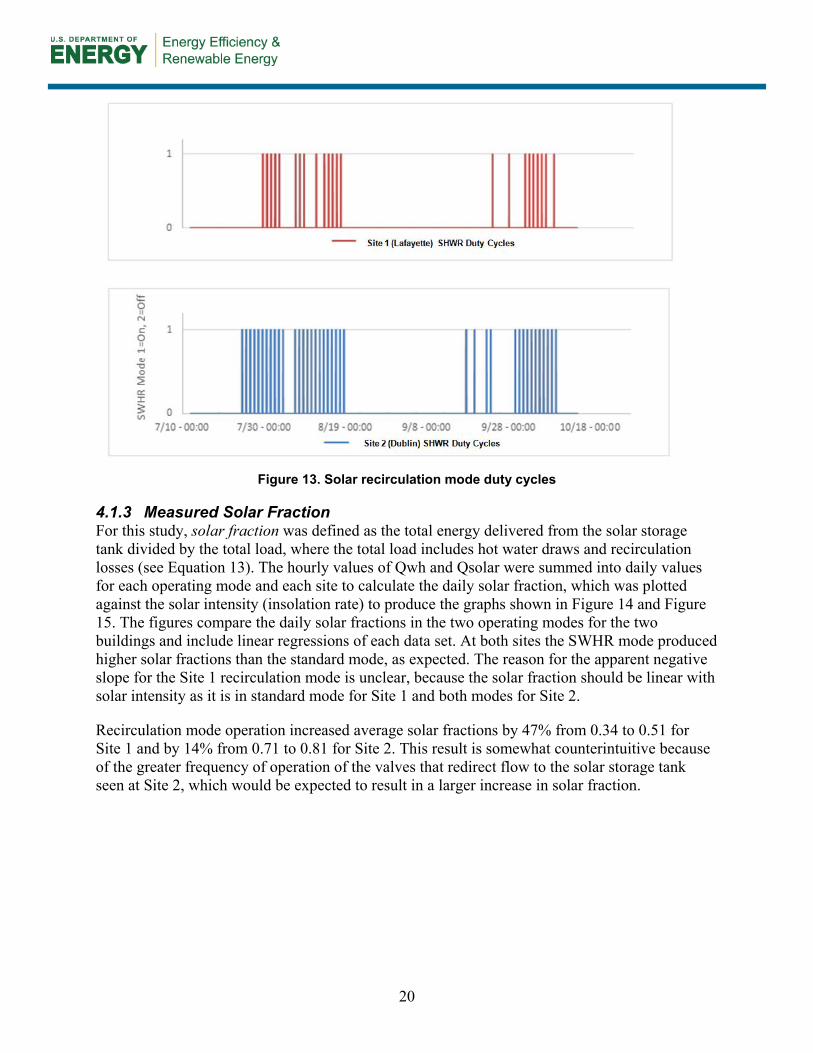
Figure 13. Solar recirculation mode duty cycles
4.1.3 Measured Solar Fraction For this study, solar fraction was defined as the total energy delivered from the solar storage tank divided by the total load, where the total load includes hot water draws and recirculation losses (see Equation 13). The hourly values of Qwh and Qsolar were summed into daily values for each operating mode and each site to calculate the daily solar fraction, which was plotted against the solar intensity (insolation rate) to produce the graphs shown in Figure 14 and Figure 15. The figures compare the daily solar fractions in the two operating modes for the two buildings and include linear regressions of each data set. At both sites the SWHR mode produced higher solar fractions than the standard mode, as expected. The reason for the apparent negative slope for the Site 1 recirculation mode is unclear, because the solar fraction should be linear with solar intensity as it is in standard mode for Site 1 and both modes for Site 2.
Recirculation mode operation increased average solar fractions by 47% from 0.34 to 0.51 for Site 1 and by 14% from 0.71 to 0.81 for Site 2. This result is somewhat counterintuitive because of the greater frequency of operation of the valves that redirect flow to the solar storage tank seen at Site 2, which would be expected to result in a larger increase in solar fraction.

21
Figure 14. Site 1: Lafayette, variation of solar fraction with insolation rate
Figure 15. Site 2: Dublin, variation of solar fraction with insolation rate
4.1.4 Measured Energy Savings The critical determinant of these field measurements is the quantity of energy that is saved by implementing the solar recirculation control strategy. Figure 16 and Figure 17 compare the net

22
loads presented to the gas water heater (Qwh) for the two operating modes at each site as a function of insolation rate. Both sites show a trend toward lower energy use while the systems are in the solar recirculation mode. For Site 1 the average energy use was 25% lower in solar recirculation versus standard mode. For Site 2 the average energy use was 41% lower in solar recirculation versus standard mode. These savings are inferred because they do not include the combustion efficiency and standby loss of the water heaters, but these percentages would be unlikely to change appreciably if energy use were measured at the water heater gas supply.
Figure 16. Site 1: Comparison of loads presented to the water heater in the two modes
These results are promising, but they do not represent full-year performance. The data cannot be considered statistically significant, primarily because the flow meter is inaccurate at low flow rates. When hot water flows lower than 1.6 gpm are removed from the data set, the uncertainty is improved. The results shown in Figure 16 and Figure 17 were developed using data from which the lower flows are filtered out. Section 4.2 presents the energy savings predicted by TRNSYS.

23
Figure 17. Site 2: Comparison of loads presented to the water heater in the two modes
4.2 Simulation Results Yearly simulations using TRNSYS were performed for the four climate locations and for four solar thermal collector areas, including the 480-ft2 areas installed at Sites 1 and 2. The measured hot water use of 12 gpd/person and a higher hot water use of 21 gpd/person were also modeled.
Figure 18 provides the results of the parametric analysis for standard and solar recirculation modes, while varying the solar collector area and pipe insulation. These simulations used Concord, California, weather and 12 gpd/person use data. As expected, solar fractions are higher for the solar recirculating cases and increase with increasing collector area and with the addition of pipe insulation (which reduces the water heating load). For the baseline collector area size of 480 ft2, the increases in the yearly average solar fraction between standard and SWHR modes were 51% for the insulated case and 89% for the uninsulated case. The modeled solar fraction of 0.43 shown in Figure 18 for the 480 ft2 collector area, Concord weather, and 12 gpd/person use compares to the measured average solar fraction of 0.51 for Site 1 (Lafayette). Similarly, the modeled energy savings of 19% for Concord compares to the Site 1 measured savings of 25%. Given the differences in weather data, use profiles, measurement error, and other factors, such variances between modeled and measured results are to be expected.
Complete tabulated simulation results are provided in the Appendix. Additional results are illustrated in Figure 19 through Figure 21.

24
Figure 18. Parametric analysis results for Concord with 12 gpd/person DHW use
Figure 19 displays the projected annual solar fractions for the four climate locations evaluated. In all cases the pipe insulation was maintained at R-2 and the daily use at 12 gpd/person; only the collector area, mode, and locations were varied. Results for the base runs where recirculation mode was not enabled are indicated by the dotted lines. The solar fractions for the recirculation mode cases (shown as bars) increased for all four climate zones from 37% to 53%; the greatest increase occurred at the Phoenix location.
Figure 19. Simulated solar fractions in standard and SWHR modes as a function of solar collector area and climate for 12 gpd/person DHW use
25
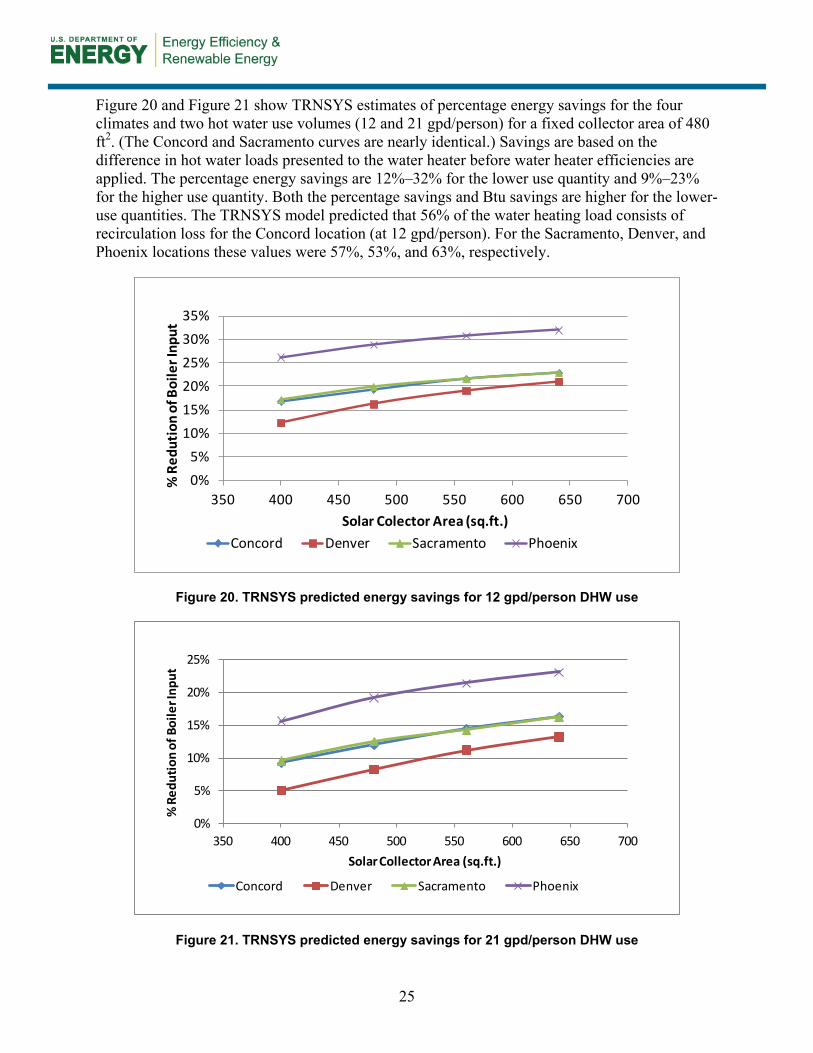
Figure 20 and Figure 21 show TRNSYS estimates of percentage energy savings for the four climates and two hot water use volumes (12 and 21 gpd/person) for a fixed collector area of 480 ft2. (The Concord and Sacramento curves are nearly identical.) Savings are based on the difference in hot water loads presented to the water heater before water heater efficiencies are applied. The percentage energy savings are 12%–32% for the lower use quantity and 9%–23% for the higher use quantity. Both the percentage savings and Btu savings are higher for the lower-use quantities. The TRNSYS model predicted that 56% of the water heating load consists of recirculation loss for the Concord location (at 12 gpd/person). For the Sacramento, Denver, and Phoenix locations these values were 57%, 53%, and 63%, respectively.
Figure 20. TRNSYS predicted energy savings for 12 gpd/person DHW use
Figure 21. TRNSYS predicted energy savings for 21 gpd/person DHW use
0%5%
10%15%20%25%30%35%
350 400 450 500 550 600 650 700
% R
edut
ion
of B
oile
r Inp
ut
Solar Colector Area (sq.ft.)Concord Denver Sacramento Phoenix
0%
5%
10%
15%
20%
25%
350 400 450 500 550 600 650 700
% R
edut
ion
of B
oile
r Inp
ut
Solar Collector Area (sq.ft.)
Concord Denver Sacramento Phoenix

26
As an explanation of these results, when the hot water load is higher relative to the solar heat collected the solar storage tank temperature is less frequently high enough to trigger the valve to redirect return flow to the solar storage tank. Energy savings resulting from solar recirculation mode operation are highest for the Phoenix climate and lowest for the Denver climate, which also has the lowest solar fraction. From these results it could be concluded that the quantity of energy savings for the solar recirculation strategy is proportional to the quantity of energy produced by the solar water heater as a function of water temperature, insolation, and temperature (Figure 4).
4.3 Implementation Costs and Cost-Effectiveness The implementation of the SWHR system testing for this study consisted of installing additional piping and automatic valves and programming and wiring the existing controller to the valves. Installation required that the hot water system, including the recirculation system, be briefly shut down while the new equipment was installed.
Project costs for the installation of the retrofit SWHR systems were $5,000 per site, which included coordination with owners, multiple site visits, and other assistance provided by the contractor. The labor and materials to reconfigure an existing system will be much higher than for a new installation. The cost for a three-way stainless steel valve and actuator is approximately $315 (Belimo B339). For a new installation, the estimated incremental labor to install and wire the three-way valve to a differential thermostat with dual functions (as used at Sites 1 and 2) is estimated as $150, for a total incremental cost of less than $500. Annual utility cost savings estimated from the TRNSYS modeling ranged from $281 (Denver, 400-ft2 collector area) to $868 (Phoenix, 640-ft2 collector area).14 Thus, for the range of systems and locations evaluated, the simple payback for the solar recirculation modification is 1–2 years.
4.4 Conclusions and Recommendations Although the experimental results were not statistically valid, TRNSYS modeling predicted similar and slightly higher savings than those obtained from the measured data (32% simulated for the Concord location versus 25% measured at the Lafayette site). These results suggest that significant energy savings and improved solar fractions result from diverting recirculated hot water to the solar storage tank under the appropriate conditions to mitigate the energy loss in the recirculation loop piping. The savings were due to reduced solar collector temperatures that resulted in greater capacity from the solar heating system and reduced heat loss from the solar storage tank, because its temperature is reduced while it is applying heat to the SWHR system.
For new installations the incremental cost of adding three-way valves and controls appears to be easily justified; direct paybacks of less than 1 year are possible in some climates. The high cost of installing valves and controls to existing systems as experienced in this project does not recommend the procedure as a retrofit measure, though the cost might be justified if buildings have little or no pipe insulation and relatively large collector areas.
In addition to varying by climate, the energy savings that result from this measure are higher when solar collectors are sized to meet the loads that result from hot water use and heat losses
14 At $1.50/therm and 85% gas water heater efficiency.

27
from recirculation piping. The FCHART method, which is commonly used to estimate solar fraction, does not include recirculation losses in its calculation of hot water load.
For designers who wish to apply the solar recirculation approach, piping heat loss calculations (ASHRAE 2009) can be used to estimate recirculation losses, which can then be converted to equivalent gallons of hot water use so collectors are properly sized for the load for use with FCHART. A solar fraction of 40%–60% should be targeted to ensure a high frequency of operation with the valve diverting flow to the solar storage tank. Because recirculation losses occur while the sun is shining, the storage tank need not be sized to include recirculation loop losses. An FCHART analysis that sizes collectors and storage for hot water use (recovery load) only could be used to size the storage tank.

28
References
ASHRAE. 2009. ASHRAE Handbook of Fundamentals. Table 2, p. 4.3. American Society of Heating, Refrigerating and Air Conditioning Engineers. Atlanta, GA.
Burch, J., and Christensen, C. (2007). “Towards Development of an Algorithm for Mains Water Temperature,” Conference paper, Solar 2007 Conference, Cleveland, Ohio, July 2007NREL/CP-550-41614.
CEC. 2012. 2013 Title 24 Building Energy Efficiency Standards. California Energy Commission. CEC-400-2012-004-CMF.
DeCicco, J. 1988. “Modeling, Diagnosis, and Implications for Improving the Energy-Efficiency of Centrally Heated Apartment Buildings.” Center for Energy and Environmental Studies. Princeton University, Princeton, NJ.
Goldner, F.S. “Money Down the Drain: Controlling Hot Water Recirculation Costs.” Home Energy Nov/Dec (1999).
GTI. 2014. On-Demand Controls for Central Hot Water Systems White Paper. GTI Project Number 21263. Gas Technology Institute, Des Plaines, IL.
HMG. 2012. “Multi-family Central Domestic Hot Water (DHW) Distribution Systems.” Prepared for the California Energy Commission by Heschong Mahone Group. Public Interest Energy Research Program. CEC 500-06-029.
Hoeschele, M., and Weitzel, E. 2012. Hot Water Distribution Model Enhancements (Subcontractor Report). Building America report issued by the Alliance for Residential Building Innovation. Davis, CA. http://apps1.eere.energy.gov/buildings/publications/pdfs/building_america/hot_water_dist_model.pdf.
Itron. 2011. California Center for Sustainable Energy Solar Water Heating Pilot Program Final Evaluation Report. Prepared by Itron for the California Center for Sustainable Energy.
Sachs, H., Talbott, J., and Kaufman, N. 2011. Emerging Hot Water Technologies and Practices for Energy Efficiency as of 2011. Report Number A112. American Council for an Energy Efficient Economy.
Wayland, S. 2012. “Savings Estimates and Analysis for the On-Demand Efficiency Program.” Project report for Benningfield Group, Folsom, CA
Zhang, Y. 2009. “Multifamily Recirculating System Study, Controls.” ACEEE Hot Water Forum, Session 2B. http://aceee.org/files/pdf/conferences/hwf/2009/2B-Multifamily2-Zhang.pdf.
Zobrist, D. 2012. “Resolving the Circulation Dilemma in Multifamily Buildings.” Home Energy September/October 2012.

29
Appendix

30
Photos
Solar storage tank, Site 1 Solar storage tank, Site 2 Condensing boilers heat water in insulated tanks
Tempering valve Calibration of four ultrasonic flow meters against turbine
flow meters
Ultrasonic flow meter and thermocouple installed on pipe
for noninvasive monitoring

31
Figure 22. TRNSYS Schematic

32
Tabulated Simulation Results
Table 6. Simulation Results for 12 gpd/Person Hot Water Use
Location Collector
Area (ft2)
Water Heater Input
Standard Mode
(kBtu/yr)
Water Heater Input
SWHR Mode
(kBtu/yr)
Energy Savings
(kBtu/yr)
Energy Savings
(therms/yr*)
Cost Savings at
$1.50/therm
% Savings
Concord, CA 400 211,931 176,134 35,797 421 $632 17% Concord, CA 480 205,494 165,591 39,902 469 $704 19% Concord, CA 560 200,415 157,083 43,332 510 $765 22% Concord, CA 640 196,221 151,253 44,968 529 $794 23%
Denver 400 224,444 196,935 27,509 324 $485 12% Denver 480 218,285 182,798 35,487 417 $626 16% Denver 560 213,093 172,344 40,749 479 $719 19% Denver 640 208,779 164,783 43,996 518 $776 21%
Sacramento 400 206,662 171,220 35,443 417 $625 17% Sacramento 480 199,556 159,869 39,688 467 $700 20% Sacramento 560 194,629 152,548 42,082 495 $743 22% Sacramento 640 190,283 146,578 43,705 514 $771 23%
Phoenix 400 169,994 125,411 44,583 525 $787 26% Phoenix 480 163,412 116,113 47,299 556 $835 29% Phoenix 560 158,056 109,398 48,657 572 $859 31% Phoenix 640 153,697 104,509 49,188 579 $868 32%

33
Table 7. Simulation Results for 21 gpd/Person Hot Water Use
Location Collector
Area (ft2)
Water Heater Input
Standard Mode
(kBtu/yr)
Water Heater Input
SWHR Mode
(kBtu/yr)
Energy Savings
(kBtu/yr)
Energy Savings
(therms/yr*)
Cost Savings at
$1.50/therm
% Savings
Concord, CA 400 286,707 260,196 26,511 312 $468 9% Concord, CA 480 276,481 243,299 33,181 390 $586 12% Concord, CA 560 269,077 229,864 39,214 461 $692 15% Concord, CA 640 262,698 219,643 43,054 507 $760 16%
Denver 400 310,976 295,026 15,950 188 $281 5% Denver 480 301,242 276,102 25,140 296 $444 8% Denver 560 293,428 260,278 33,150 390 $585 11% Denver 640 286,827 248,618 38,210 450 $674 13%
Sacramento 400 277,384 250,683 26,701 314 $471 10% Sacramento 480 267,599 233,906 33,693 396 $595 13% Sacramento 560 258,971 221,873 37,098 436 $655 14% Sacramento 640 252,730 211,514 41,216 485 $727 16%
Phoenix 400 215,007 181,194 33,813 398 $597 16% Phoenix 480 205,892 166,299 39,593 466 $699 19% Phoenix 560 198,223 155,719 42,505 500 $750 21% Phoenix 640 192,627 148,113 44,514 524 $786 23%

buildingamerica.gov
DOE/GO-102015-4716 October 2015