Embed Size (px)
Citation preview

David Schneider and Eric Steig
Isotopic Records in US-ITASE Cores: A preliminary report
WAIS Workshop
September, 2003
University of Washington

Annual mean Accumulation at US-ITASE Sites (cm^3
water-equivalent)
Figure courtesy Dixon, Kaspari, Spikes.

δ18O From 2001-5

Dating of ice core: Based on summer sulphate and isotopic peaks.
2001-5 δ18O

Climatology (1982-1999) of temperature and δ18O at 2001-5
r = .92
δ18O = .19*T - 26‰
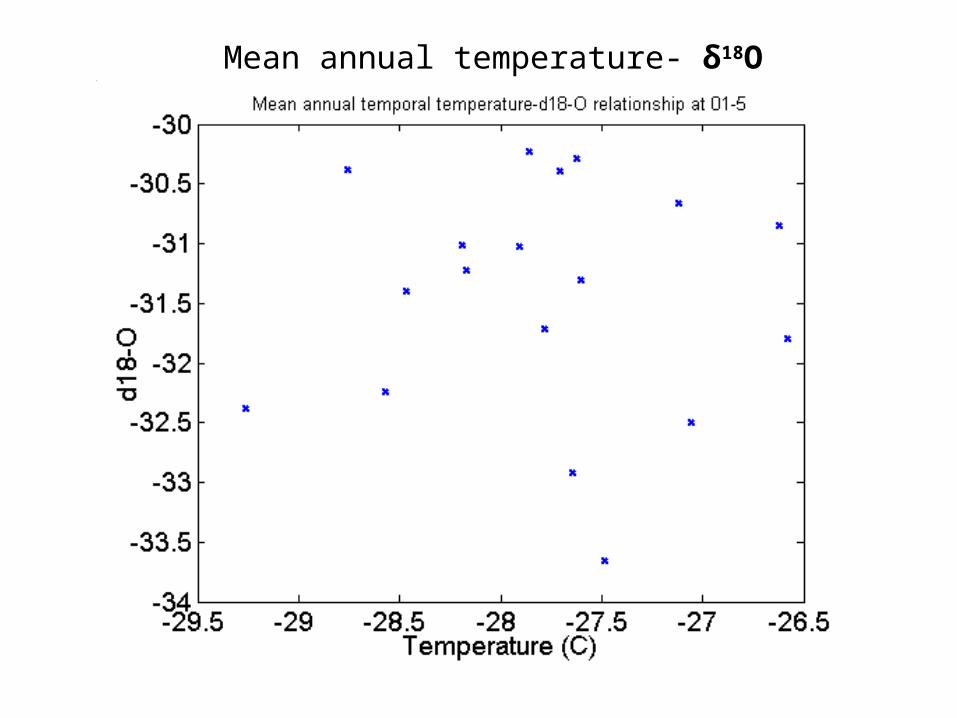
Mean annual temperature- δ18O relationship?

Mean annual temperature- δ18O relationship?
δ18O
T

δ18O record at 2000-1 (near proposed WAIS deep core)
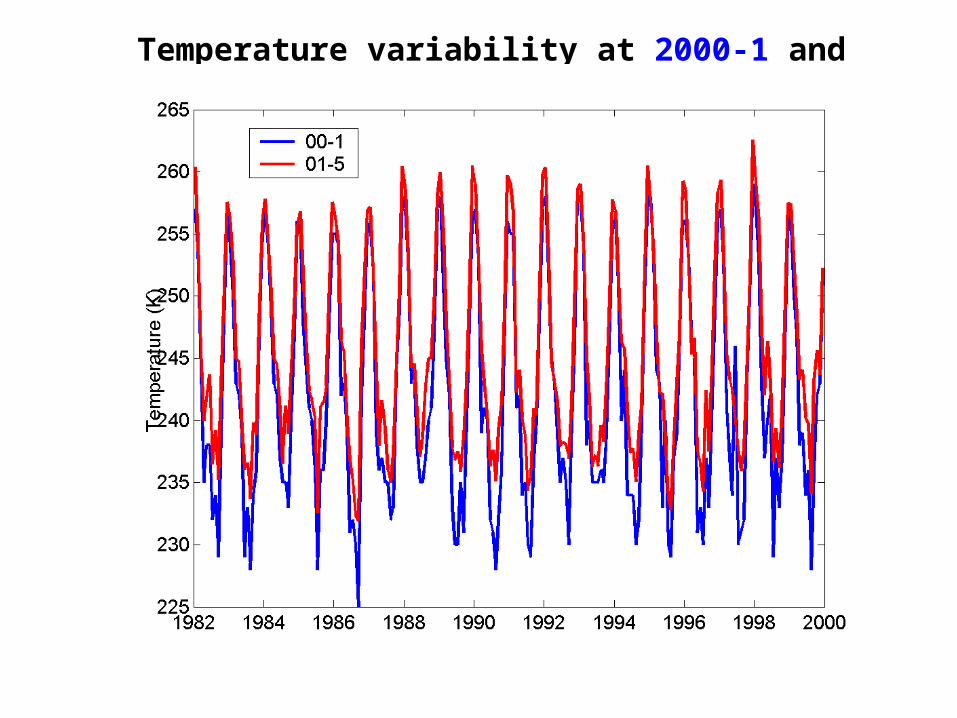
Temperature variability at 2000-1 and 2001-5

Isotopic variability at 2000-1 and 2001-5

Interannual temperature variability in Antarctica

Isotopes from 2000-1 and reconstructed PC’s of Antarctic temperature
r = .40 winter
r = .28 annual

Linear combination of 01-5 and 00-1
R-pc1 annual mean
r = .37 annual; .39 winterTwo cores are better than one

Three cores are better than two
r = .54 annual; .52 winter
Linear combination of 01-5 and 00-1 and Law Dome
R-pc1 annual mean

Summary:•The cores can be well-dated with summer sulphate peaks, corroborated by isotopic annual cycles
•Isotopic records exhibit a robust climatological relationship with the seasonal temperature cycle; a spatial relationship can be obtained once more cores are analyzed.

Summary:
•The cores can be well-dated with summer sulphate peaks, corroborated by isotopic annual cycles
•Isotopic records exhibit a robust climatological relationship with the seasonal temperature cycle; a spatial relationship can be obtained once more cores are analyzed.
•The temporal isotopic-temperature slope appears to be much smaller than the traditional Dansgaard spatial slope (~0.2 vs ~0.64).
•On seasonal to interannual timescales, temperatures at sites 2001-5 and 2000-1 are well correlated
•However, annual mean isotopic values are not well-correlated with annual mean temperatures at the site or between sites but the two cores agree better with Law Dome than with each other.

Summary:
•The cores can be well-dated with summer sulphate peaks, corroborated by isotopic annual cycles
•Isotopic records exhibit a robust climatological relationship with the seasonal temperature cycle; a spatial relationship can be obtained once more cores are analyzed.
•The temporal isotopic-temperature slope appears to be much smaller than the traditional Dansgaard spatial slope (~0.2 vs ~0.64).
•On seasonal to interannual timescales, temperatures at sites 2001-5 and 2000-1 are well correlated
•However, annual mean isotopic values are not well-correlated with annual mean temperatures at the site or between sites.
•Larger-scale measures of temperature variability (i.e. PC’s) show a better correlation with isotopic ratios than local T or circulation patterns alone.
•Preliminary correlations of three ice cores with leading PC’s of Antarctic temperatures suggests ice core-based temperature reconstructions may agree well with station-based temperature reconstructions.
•Rather than having conflicting information, these cores probably have complimentary information.


2002 1992 1982
Multiple parameters in core 2001-5
Figure courtesy Dixon
δ18O
T
SO42-
H2O2

Mean annual accumulation and δ18O at 2000-1
r = .21

Ongoing work:
•Continue isotopic measurements on ITASE cores (21 sites!!)
•More calibration exercises
•Better understanding/interpretation of controls on interannual variability in isotopic ratios
•Reconstruction of last 200-500 years of Antarctic climate variability

Annual mean temperature
°C from AVHRR
-60 -50 -40 -30 -20

Monthly (1982-1999) regression between local temperature and δ18O at 2001-5
r = .59

Climatology of temperature- δ18O at 2000-1
r = .92

Mean annual temperature- δ18O at 2000-1
T
δ18O
r = .30

Power spectra: 2000-1
Annual cycle
Semiannual cycle

Depth-age scales for 01-5

Power spectra: 2001-5
Annual cycle
Semiannual cycle

Significant low-frequency variability?

Something about Hercules Dome (2002-4)
•Could be easier than WAIS to relate to large-scale variability
•But is the accumulation rate too low?

-400
-380
-360
-340
-320
-300
-280
1 2 3 4 5 6 7 8
Depth (top - m)
dD
2002-4

Temperature vs Elevation at ITASE sites
y = -10.465x - 13.279
R2 = 0.9379
-50.000
-45.000
-40.000
-35.000
-30.000
-25.000
1 1.2 1.4 1.6 1.8 2 2.2 2.4 2.6 2.8 3
Elevation (km)
Te
mp
era
ture
(C
)
Spatial temperature-elevation relationship
What determines isotopic ratios in an ice core?•Temperature when precipitation forms
•Traditional to use mean annual surface temperature
•May be better idea to use inversion temperature

What determines isotopic ratios in an ice core?•Temperature when precipitation forms
•Traditional to use mean annual surface temperature
•May be better idea to use inversion temperature
•Timing of accumulation events; amount of precipitation
•Temperature of source (place of evaporation)
•Distance/pathway from source to deposition site

Multiple parameters in core 2001-5
Figure by Dixon