Embed Size (px)
Citation preview

1
REDISTRIBUTION VIA VAT AND CASH TRANSFERS: AN ASSESSMENT IN FOUR LOW AND MIDDLE INCOME COUNTRIES*
David Phillips, Ross Warwick, Maya Goldman, Karolina Goraus, Gabriela Inchauste, Tom Harris and Jon Jellema
Working Paper 78 MARCH 2018

2
The CEQ Working Paper Series
The CEQ Institute at Tulane University works to reduce inequality and poverty through rigorous tax and benefit incidence analysis and active engagement with the policy community. The studies published in the CEQ Working Paper series are pre-publication versions of peer-reviewed or scholarly articles, book chapters, and reports produced by the Institute. The papers mainly include empirical studies based on the CEQ methodology and theor etical analysis of the impact of fiscal policy on poverty and inequality. The content of the papers published in this series is entirely the responsibility of the author or authors. Although all the results of empirical studies are reviewed according to the protocol of quality control established by the CEQ Institute, the papers are not subject to a formal arbitration process. Moreover, national and international agencies often update their data series, the information included here may be subject to change. For updates, the reader is referred to the CEQ Standard Indicators available online in the CEQ Institute’s website www.commitmentoequity.org/datacenter. The CEQ Working Paper series is possible thanks to the generous support of the Bill & Melinda Gates Foundation. For more information, visit www.commitmentoequity.org.
The CEQ logo is a stylized graphical representation of a Lorenz curve for a fairly unequal distribution of income (the bottom part of the C, below the diagonal) and a concentration curve for a very progressive transfer (the top part of the C).

3
REDISTRIBUTION VIA VAT AND CASH TRANSFERS: AN ASSESSMENT IN FOUR LOW AND MIDDLE INCOME COUNTRIES*
David Phillips, Ross Warwick, Maya Goldman, Karolina Goraus, Gabriela Inchauste, Tom Harris and Jon Jellema
CEQ Working Paper 78
MARCH 2018
ABSTRACT
As in high-income countries, reduced rates of vat and vat exemptions (“preferential vat rates”) are a common feature of indirect tax systems in lmics. Many of the goods and services that are granted preferential rates – such as foodstuffs and kerosene – seem likely to receive such treatment on the grounds that they provide a means for the government to indirectly target poorer households, for whom such expenditures may take up a large proportion of their total budget. We use microsimulation methods to estimate the impact of preferential vat rates in four lmic countries, considering their effect on revenues, poverty, inequality, and across the consumption distribution. We consider whether other policy tools might be better suited for the pursuit of distributional objectives by estimating the impact of existing cash transfer schemes and a hypothetical scenario where the revenue raised from broadening the vat base is used to fund a universal basic income (ubi) in each country. We find that although preferential vat rates reduce poverty, they are not well targeted towards poor households overall. Existing cash transfer schemes are better targeted but would not provide a suitable means of compensation for a broader vat base given issues related to coverage and targeting mechanisms. Despite being completely untargeted, a ubi funded by the revenue gains from a broader vat base would create large net gains for poor households and reduce inequality and most measures of extreme poverty in each of the countries studied – even if only 75% of the additional vat revenue was disbursed as ubi payments.
JEL Classification: D31, H22, H53, I38 Keywords: fiscal incidence, poverty, inequality, value-added tax reform, universal benefit, Ghana, Ethiopia, Zambia, Senegal*
* Author affiliations: David Phillips is an Associate Director working in the Pensions and Public Finances sector and the Centre of the
Evaluation of Development Policies (EDePo) at the Institute of Fiscal Studies. Ross Warwick is a Research Economist at the Institute of Fiscal Studies. Maya Goldman is the Coordinator of Projects, Advisory Services and Training at CEQ Institute. Karolina Goraus is an Assistant Professor at Faculty of Economic Sciences, University of Warsaw and a consultant at the World Bank. Gabriela Inchauste is Lead Economist in the Poverty and Equity Global Practice of the World Bank. Tom Harris is a Project Research Officer at the Institute of Fiscal Studies. Jon Jellema is CEQ Institute’s Director of Projects, Advisory Services and Training and Associate Director for Africa, Asia and Europe.

4
The authors thank David Coady, Peter Levell and Stephen Younger for helpful comments on methodological issues. They also gratefully
acknowledge funding from the UK’s Department for International Development through the Centre for Tax Analysis in Developing Countries, the Commitment to Equity Institute and the World Bank Group. The opinions expressed and arguments employed are those of the authors alone. They are not the opinions of the Institute for Fiscal Studies (which has no corporate opinion). The findings, interpretations, and conclusions expressed in this paper are entirely those of the authors. They do not necessarily represent the views of the World Bank and its affiliated organizations, or those of the Executive Directors of the World Bank or the governments they represent. Launched in 2008, the CEQ project is an initiative of the Center for Inter-American Policy and Research (CIPR) and the department of Economics, Tulane University, the Center for Global Development and the Inter-American Dialogue. The CEQ project is housed in the Commitment to Equity Institute at Tulane. For more details visit http://www.commitmentoequity.org

I. Introduction
Since the 1980s, increasing numbers of low- and middle-income countries (LMICs) have introduced value added tax (VAT), often as a replacement for pre-existing sales or turnover taxes, and they now contribute around one-third of tax revenues, on average.1 In implementing their VAT systems, LMICs have tended to have fewer different rates of VAT than the European countries which pioneered VAT in the 1960s and 1970s (Ebrill et al, 2001). However, in nearly all instances, some goods and services are subject to either a reduced rate of VAT or are exempted from VAT (which means vendors do not need to charge VAT on their outputs but cannot reclaim VAT paid on their inputs).
Abramovsky et al (2017) reviews the various rationales for reduced rates and exemptions. Exemptions for small firms may make sense as compliance and administration costs for such firms are likely to be high relative to the revenues that would be raised from them. A case can also be made for exempting services for which an obvious market price is often not observed such as public services (which are often free to users but paid for by taxation or social security contributions) and financial services (which are often paid for by interest rate differentials rather than explicit fees), although there are ways to bring these into the VAT net.2 More generally though, exemptions are anathema to the whole logic of VAT (Mirrlees et al, 2011). In particular, the fact that firms selling exempt goods and services cannot reclaim the VAT paid on their inputs can create both significant administration and compliance costs and impact the efficiency of production. For instance, such firms have an incentive to self-supply their inputs because they do not have to pay VAT on inputs they produce themselves. However, they may be less efficient at producing these inputs than other firms who specialise in producing them, but who have to charge VAT on their sales. Increases in input costs – whether due to unrecoverable VAT or less efficient self-supply –, if passed on in higher output prices, can also cascade through production chains, raising the prices of other goods or services.
Application of reduced rates of VAT rather than exemptions avoids these problems: firms charging a reduced rate of VAT on their output can still reclaim the VAT paid on their inputs. However, there are still implications for administration and compliance costs, not least due to the need to police boundaries between categories of goods and services subject to different VAT rates. This may be particularly challenging for LMICs due to typically lower administrative capacity and weaker legal systems. VAT systems with a reduced (or conversely a ‘higher’) rate also change the relative prices of different goods and services, which can distort consumers’ spending decisions.
While policymakers should avoid distorting consumers’ spending decisions without good reason, there may be both efficiency and equity reasons for application of lower or higher rates of VAT on
1 ICTD/UNU-WIDER (2017). 2 Hoffman et al (1987), for instance, outline a cash flow VAT based on deposits into and withdrawals out of, and loans from and repayments to financial institutions. Aujean et al (1999) describe how public services can be brought into the scope of VAT

6
some goods and services. For instance, if consumers respond more to tax on some goods and services, either by working less or producing more at home to avoid market purchases, and/or by shifting to informal traders who do not comply with their tax obligations, then one may want lower rates of tax on these items.3 However, when justifying exemptions or reduced rates equity is more often invoked than efficiency. It is the equity case that is the focus of this paper.
For instance, largely with equity in mind, many low-, middle- and high-income countries have exemptions or reduced or zero rates of VAT on goods like basic foods, to which the poor allocate a relatively large fraction of their expenditure. In this way, the relative burden of VAT on poorer households is reduced by more than for richer households. However, given the fact that richer households tend to spend more on food and other ‘necessities’ in absolute terms, such redistribution is often not particularly well targeted.
This brings us to the central question addressed in this paper: are there better ways available to channel resources to poorer households in LMICs than generally poorly targeted VAT tax expenditures?
In high-income countries, the answer is almost certainly ‘Yes’. Well-developed social protection systems with targeted cash transfer schemes for poor households mean one can redistribute much more effectively than via VAT.4 LMICs have traditionally lacked such targeted transfer systems, however. This has led a number of influential public finance and development economists to argue that reduced rates and exemptions have an important role to play in LMICs’ VAT policies.5 In contrast, other authors emphasise the role a broad single-rate VAT can have in increasing the administrative and economic efficiency of tax collection, and in raising the revenues that allow the development of social protection programmes that can better redistribute.6
114 LMICs now have at least one unconditional cash transfer programme in place, while 57 have at least one conditional cash transfer programme (usually in addition to, but sometimes instead of unconditional programmes).7 The scale of these programmes varies considerably though, sometimes covering only a few percent of the population and in other cases covering well over 20% of the population. This suggests there may already be an opportunity to raise more revenues and more effectively transfer resources to poor households by levying a broader-based VAT and using the proceeds to expand the scale and scope of such transfers. While traditionally there has been
3 See Atkinson and Stiglitz (1976), Cremer and Gahvari (1993) and Kleven et al (2000). 4 Mirlees et al (2011) show how poorer households can be compensated for the abolition of reduced rates of VAT in the UK by changes to cash transfers and direct taxes that also maintain financial work incentives (measured by effective marginal tax rates and participation tax rates).
5 Bird and Gendron (2007).
6 Ahmad and Best (2012) consider the issue conceptually, Anton et al (2013) from a Mexican perspective, in particular, and Ebrill et al (2001) from a cross-country perspective. Boccanfuso et al (2011) examine the structure of VAT in Niger using a linked macro-microsimulation model but do not consider the expansion of cash transfers to compensate for VAT base broadening. 7 Honorati et al (2015).

7
significant focus on the targeting of these programmes,8 their scale and breadth of coverage can sometimes matter much more for their redistributive effectiveness and poverty-reducing potential.
This paper uses a consistent methodology to consider this issue in four LMICs: Ethiopia, Ghana, Senegal and Zambia. It is a first draft of a more in-depth paper that will ultimately include additional countries and more detailed analysis of the impacts of VAT exemptions and reduced rates and cash transfers. It is being shared to elicit feedback and encourage discussion of the issues raised by the analysis presented.
The paper makes use of tax and transfer microsimulation models developed by researchers working in the IFS’s TAXDEV programme, the Commitment to Equity (CEQ) Institute and the World Bank for the countries in question.9 These models are used to:
x Estimate the distributional impact of existing VAT exemptions and reduced rates. In doing this we use the input-output relationships between sectors in these countries to estimate the impact of embedded VAT on the pre-VAT price of goods and services as a result of VAT exemptions. We also scale down statutory tax rates to account for the fact that VAT evasion means that the overall effective tax rate on VATable sectors is generally lower than if there was no VAT evasion.
x Estimate the distributional impact of the main non-contributory cash and/or near-cash transfer scheme in place in each country (and compare this to the impact of VAT exemptions and reduced rates). In some cases receipt of these transfers is reported in the household surveys underlying our microsimulation models, while in other cases we must simulate eligibility and transfer amounts given the rules of the scheme.
x Simulate the distributional impact of abolishing VAT exemptions and reduced rates but at the same time introducing a demogrant/universal basic income (UBI) using 100% or 75% of the additional VAT revenue.10 In doing this we keep any exemptions on financial services, public services (and
8 See Alatas et al (2012), for example. 9 The analysis for Ghana and Ethiopia makes use of the GHATAX and ETHTAX models developed by IFS TAXDEV researchers for use by themselves and by civil servants in the governments and revenue authorities of these countries. Modelling for Senegal and Zambia makes use of models and datasets constructed by the CEQ Institute and World Bank for assessing the overall distributional impact of personal tax and social spending in these countries. 10 We considered two approaches to modelling this reform. The first approach, and the approach adopted for the distributional analysis in this paper, involves three steps. (1) Calculate the additional VAT that each household would pay following the abolition of VAT exemptions and reduced rates, holding the quantity of goods and services consumed fixed. This is a first order approximation of the compensating variation of the policy change simulated: it measures the amount of income that would need to be transferred to the household to allow them to consume the same bundle of goods and services as prior to the change in policy. (2) We sum this additional VAT across households and calculate the UBI that could be paid to each individual in the country if 100% or 75% of these revenues were used. These UBI payments are summed across individuals in a household. (3) We then subtract the additional VAT paid as a result of the abolition of VAT exemptions and reduced rates (calculated in step 1) from the value of the UBI for each household (calculated in step 2). If it is positive, the UBI is greater than the amount of income the household would need to consume the same bundle of goods and services as before the reform (i.e. they are better off). If it is negative, the UBI is less than the amount of income the household would need to consume the same bundle of goods and services as before the reform (i.e. they are worse off). The second approach considered holds the level of expenditure fixed when simulating the abolition of VAT exemptions and reduced rates. This leads to a lower revenue yield, and hence would initially fund a lower UBI. However, if one were to assume a marginal propensity to consume of 100%, the UBI would lead to higher expenditure, which would generate higher VAT revenues (and other indirect tax revenues). This would, in turn, allow a higher UBI to be funded. An iterative procedure could be used to estimate the final revenue-neutral level for the UBI.

8
the associated health and education sectors), residential property rents and small traders: this is both for data reasons and because, as discussed, there are administrative reasons that make bringing these sectors into the VAT system difficult.
It is important to note that the results obtained are ultimately based on household survey data that can be subject to sampling and misreporting errors; models of the input-output linkages that are not as detailed as the VAT systems we are modelling, and are at least several years old; and relatively simple assumptions about how VAT evasion affects average effective VAT rates. This means that the precise quantitative results presented come with what are likely to be fairly sizeable margins of error.
However, the results are stark enough for us to be confident that the qualitative findings are robust. In particular, the conclusion that VAT exemptions and reduced rates, taken together, are not particularly well targeted at redistributing resources towards poorer households. And our result that if it could be successfully delivered, a demogrant/UBI that utilised 75% of the revenues from broadening the VAT base would be more progressive and of benefit to approximately the poorest 50% of the population, on average, than existing VAT exemptions and reduced rates.
Our results also clearly show that the extent to which progressivity would be increased and poverty potentially reduced depends not only upon the progressivity of existing VAT exemptions and reduced rates but also their scale. Put simply, the greater the revenue that would be raised from abolishing these, the larger the demogrant/UBI could be, and hence the larger its impact on the income distribution and poverty.
The rest of the paper proceeds as follows. In section II we provide an overview of the VAT structure and direct cash transfer schemes in the 4 countries included in this initial analysis. Appendix A provides additional detail.11 Section III shows estimates of the distributional effects of VAT reduced rates and exemptions, while section IV shows estimates of the effects of the main direct cash (or near cash) transfers. Section V is the heart of our analysis. It shows the results of simulating the abolition of most VAT reduced rates and exemptions and compensating households via the introduction of a demogrant/UBI. A discussion of the findings from Sections III to V and tentative conclusions for policymakers are provided in Section VI. This section also sets out the next steps in our analysis.
In subsequent versions of this paper we will consider the characteristics of these two approaches in more detail. 11 Appendix B provides details on the data used in our analysis.

9
II. An overview of VAT structures and direct cash transfers in our four countries
This section sets out key features of the VAT rate structures and cash transfers that we model in Ghana, Ethiopia, Senegal and Zambia. More detailed information on the system in each country can be found in Appendix A. We also provide an overview of how we model both VAT and cash transfers. Further information on this can be found in Appendix B.
II.A The VAT structure
The standard VAT rate varies from 15% in Ethiopia to 18% in Senegal and Zambia, with Ghana’s rate of 17.5% in between.12 There are significant differences in the coverage of the standard rate of VAT, however: for instance, the household surveys underlying our microsimulation models imply that in Ghana 53% of household monetary expenditure is on goods and services that are, in principle, subject to VAT, while in Ethiopia the equivalent figure is 70%.
To some extent this reflects the fact that the scope of exemptions varies significantly across countries. Certain goods and services are exempted in all four countries: financial services; public services, including health and education services; water; and some foodstuffs. However, the range of foodstuffs that are exempt is relatively narrow in Ethiopia compared to the other three countries. And exemptions can extend to goods such as electricity (Ghana and Senegal), Transport Services (Ghana and Zambia), Oil and Petroleum (Ghana), Books and Newspapers (Zambia) and Textbooks (Ghana). In Ghana, Ethiopia and Zambia, firms with small turnovers are exempt from registering for VAT, while in Senegal firms of any size could, in principle, be required to register.
With the exception of exports, Ghana, Ethiopia and Senegal do not apply zero rates of VAT to any goods or services.13 Zambia does apply a zero rate to a range of goods, including building supplies, mosquito nets, medical supplies, educational materials, energy saving equipment, and wheat flour and bread. Senegal has a reduced rate of 10% for accommodation and catering services owned by a licensed tourist accommodation provider.
It is clear that not all of these exemptions and reduced rates exist for equity reasons, or equity reasons alone. For instance, Zambia’s zero rate for energy saving equipment is likely there for environmental reasons (although, as discussed in Abramovsky et al (2017) preferential VAT rates are typically poor at correcting for externalities, including environmental externalities). Senegal’s reduced rate of 10% for accommodation and catering services seems aimed at increasing the competitiveness of its tourism industry. And others, including those for financial services and small firms, reflect administration and compliance issues with VAT.
12 Ghana’s overall 17.5% rate consists of a 15% VAT and a 2.5% tax known as the National Health Insurance Levy (NHIL) which is effectively a second VAT that applies to the same tax base as the general 15% rate. 13 Although zero rates are sometimes applied to firms that operate in special economic zones or have certificates entitling them to apply a zero rate.
10
II.A Cash transfer programmes
Each of the countries considered operates at least one non-contributory cash transfer scheme targeted at reducing poverty and supporting individuals and households deemed vulnerable. In each case, eligibility is based on a combination of geographic targeting to select which communities the scheme operates in, and proxy means-tests and other defined criteria to assess which households in these communities should receive the transfer. In addition, in Ethiopia, Senegal, and Zambia, communities themselves help decide which households should receive a transfer: the aim is to improve targeting using local knowledge but this can also lead to misallocation of transfers.
Ghana and Zambia’s schemes – Livelihood Empowerment Against Poverty (LEAP) and the Social Cash Transfer Scheme (SCTS), respectively – are unconditional. Ethiopia’s Productive Safety Net Programme (PSNP) consists of a conditional transfer for households with able-bodied adults, who must take part in public work schemes, and an unconditional transfer for households where no adult is able to work. Senegal’s Programme National de Bourses de Sécurité Familiale (PNBSF) is a conditional cash transfer scheme which requires families to ensure their children are enrolled in school and properly vaccinated.
Recent years have seen significant expansions of the schemes. For instance, while there were 150,000 beneficiaries of Zambia’s Social Cash Transfer Scheme (SCTS) in 2015, the Government of Zambia was aiming to extend coverage to 500,000 beneficiaries in 2017. However, the criteria used to determine eligibility can mean significant fractions of poorer households are excluded from the programmes. For instance, Ghana’s LEAP requires that a household must contain someone who is aged 65 or over, severely disabled, an orphaned or vulnerable child, pregnant or an infant, as well as being extremely poor according to the proxy means test. Senegal’s PSBSF applies only to households with children. The geographical targeting also means that poor residents in certain parts of the country are not eligible for payments. Thus even where the schemes are well targeted at poorer households, they do not provide a comprehensive social safety net for all households in or at risk of poverty. This is important when considering the potential for using these existing schemes to compensate poorer households for the abolition of most VAT exemptions and reduced rates
III. The impact of VAT reduced rates and exemptions
As discussed in Section I, VAT exemptions and reduced rates are often granted in LMICs for goods and services thought to make up a greater proportion of the budgets of poorer households. They are intended to fulfil a redistributive goal and to reduce the incidence and severity of poverty by reducing the tax burden on such households. However, empirical evidence as to whether such policies are well targeted towards their intended beneficiaries is sparse. In this section, we examine the issue by considering the counterfactual policy scenario in four LMICs. In particular, by simulating a policy environment whereby the majority of expenditure is subject to the standard rate of VAT in each country, we estimate the average per capita tax expenditure from exemptions and reduced rates for each decile of the consumption distribution.
In the results that follow, VAT exemptions are maintained on a few specific sectors where the administrative case for exemptions is strong: public services (including health and education), financial services and residential accommodation costs. Traders below the VAT registration
11
threshold (where one exists) are assumed to stay effectively exempt. All other existing VAT exemptions and any preferential rates are removed, with those expenditures now made subject to the standard statutory rate. Results account for an aggregate rate of non-compliance for VAT which is uniform across sectors and across the population. Details of how this was calculated for each country can be found in Appendix B.
It is worth noting a few limitations of the models used that might influence the direction and scale of results shown. Firstly, all of these models are static – they do not account for behavioural change. Thus, they may be interpreted as a lower bound to the welfare gain that individuals enjoy from reduced VAT rates since the induced price changes may allow them to alter consumption choices in a welfare-improving way.
However, other empirical considerations might also affect the benefits individuals enjoy from these reduced rates. Even when not legislated as VAT exempt, some groups of goods and services may be more likely than others to be “de facto” exempt, either because of higher rates of tax evasion or more activity amongst small traders who are not required to register for VAT. If goods and services that are currently subject to preferential VAT treatment fall into this category, then these results would actually be over-estimating the impact of exemptions and reduced rates. This is plausible given that food products are prominent amongst the exemptions included in this analysis and one might expect food products to be disproportionately purchased from small or informal traders.
Furthermore, the distributional impact of existing exemptions and reduced rates might be different in practice if different types of households are more likely to purchase from traders who would remain de facto exempt. In particular, if poorer households are more likely to purchase from small, unregistered traders, the results below would overstate the progressivity of existing preferential VAT treatment. Given these caveats, these results provide an indication of the targeting of VAT exemptions and reduced rates in principle.
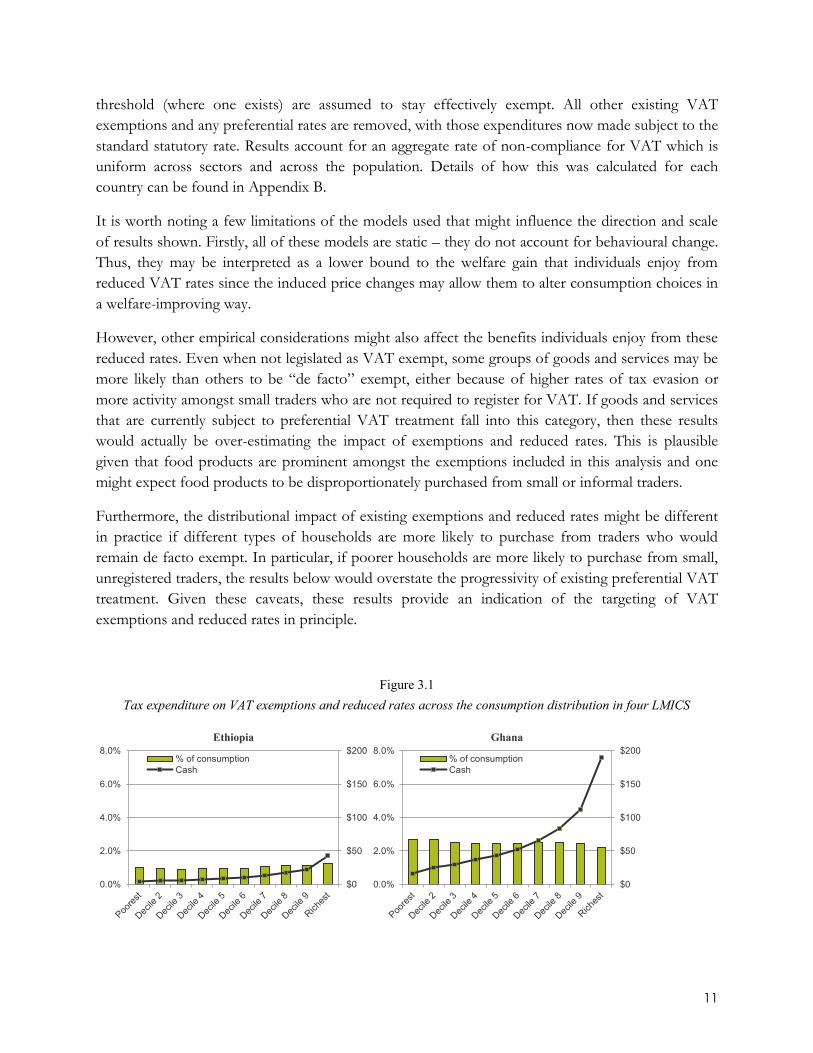
Figure 3.1 Tax expenditure on VAT exemptions and reduced rates across the consumption distribution in four LMICS
$0
$50
$100
$150
$200
0.0%
2.0%
4.0%
6.0%
8.0%Ethiopia
% of consumptionCash
$0
$50
$100
$150
$200
0.0%
2.0%
4.0%
6.0%
8.0%Ghana
% of consumptionCash

12
Note: Population deciles ranked by per capita consumption; cash amounts are annual USD 2011 PPP.
Source: Author’s calculations using GHATAX, ETHTAX and CEQ/World Bank fiscal incidence analysis.
The pattern of results displayed in Figure 3.1 provides a mixed picture with regards to the redistributive efficacy of these VAT exemptions and reduced rates. In Ghana, preferential VAT rates are broadly progressive when assessed as a proportion of consumption. This reflects the fact that many goods and services which make up a relatively larger fraction of the consumption of poorer households – such as raw foodstuffs – are exempt from VAT. However, in Senegal there is no clear trend across the consumption distribution and in Ethiopia and Zambia VAT exemptions actually appear to be slightly regressive. This is driven by considerable heterogeneity in the relative contribution to total consumption of monetary expenditure compared to subsistence production and barter across the consumption distribution. In particular, the poorest deciles attribute more of total consumption to subsistence and barter – which is untaxed – than monetary expenditure. This means that exemptions directly benefit the bottom deciles less.
When one considers the per capita benefit received from preferential rates in cash terms the pattern is consistent across the four countries. Even when poorer households benefit more in proportional terms, the fact that richer households spend significantly more on food and other basic goods in absolute terms means that they obtain a much larger implicit cash subsidy from the preferential rates. Taking the case of Ghana – where existing exemptions appear the most progressive in the sample – an individual in the poorest consumption decile of the population can, on average, attribute 2.67% of the value of their consumption to VAT exemptions on the goods that they buy, compared to 2.22% for those in the top consumption decile. However, the average estimated benefit received in cash terms is $16 per capita in the lowest consumption decile compared to $190 per capita at the top of the distribution. This pattern suggests that even if VAT exemptions and reduced rates can be described as progressive in some cases, they are not “pro-poor”. In other cases, such exemptions are not even well targeted enough to be progressive in proportional terms. If governments were to remove the exemptions and raise additional tax revenue, other, more targeted forms of government spending might be able to achieve an outcome which is more beneficial to poorer households.
Despite the fact that richer individuals benefit substantially from VAT exemptions and reduced rates, it is important to note that they do reduce the incidence of poverty at every poverty line in each of our countries by increasing the real spending power of the population. Table 3.1 indicates the marginal contributions to poverty reduction of preferential VAT treatments at the poverty lines
$0
$50
$100
$150
$200
0.0%
2.0%
4.0%
6.0%
8.0%Senegal
% of consumptionCash
$0
$50
$100
$150
$200
0.0%
2.0%
4.0%
6.0%
8.0%Zambia
% of consumptionCash

13
defined by the World Bank for Low Income, Lower-Middle Income and Upper-Middle Income countries. Results are displayed for the poverty headcount ratio (which measure the proportion of the population that falls below a poverty line) and the poverty gap index (which in this case measures the proportion of national consumption that would be required to lift all of those below the poverty line out of poverty).14 Once again, the size of these effects differs greatly depending on the total size of the exemptions granted, but they can be substantial. In Senegal, the poverty headcount ratio is reduced by 3.5 percentage points at the lowest poverty line as a result of VAT exemptions and reduced rates. This does not preclude there being more effective alternatives available, however.
Table 3.1 Estimates of the marginal contributions to poverty reduction from current VAT exemptions and reduced rates
Poverty line $1.90 per day $3.20 per day $5.50 per day
Measure Headcount Gap Headcount Gap Headcount Gap Ethiopia 0.0055 0.0017 0.0047 0.0041 0.0025 0.0047 Ghana 0.0084 0.0024 0.0156 0.0059 0.0156 0.0101
Senegal 0.0348 0.0136 0.0159 0.0189 0.0059 0.0175 Zambia 0.0093 0.0071 0.0077 0.0082 0.0039 0.0076
Note: A positive number indicates a reduction in poverty. Poverty figures are calculated based on consumable income per capita pre- and post-reform.
Source: Author’s calculations using GHATAX, ETHTAX and CEQ/World Bank fiscal incidence analysis.
A second conclusion from the results in Figure 3.1 is that the scale of the tax expenditure provided in the form of preferential VAT rates varies significantly across the sample. In Ethiopia, their value is estimated at 1.09% of consumption on average whereas in Senegal this figure is 4.15%. This implies significant variation in the potential revenue foregone and the opportunity to redistribute more effectively through other means. This is driven by a combination of factors: Senegal exempts a wider range of goods (and food products in particular), it has no minimum turnover threshold and thus all firms are supposed to register for VAT, and non-market consumption is proportionally higher in Ethiopia. Such factors drive variation across the countries in our sample. Table 3.2 provides estimates of the revenue foregone through the provision of VAT rates and exemptions. The first column displays the percentage of actual VAT revenues modelled by the microsimulation and fiscal incidence models utilised in this paper, which is important for understanding how the scale of our results in cash terms – though not the proportional impacts or the distributional patterns – might correspond to reality. Estimates of the VAT revenue foregone through preferential VAT treatments, displayed to the right, show that although there is variation, in every country the implementation of a uniform VAT has the potential to provide a significant increase in tax revenues.
14 These measures are also known as FGT0 and FGT1 in the class of Foster-Greer-Thorbecke indices.
14
Table 3.2 Estimated revenue cost of VAT exemptions and reduced rates in four LMICS
Country % actual VAT revenues
captured Cost of exemptions (2011
PPP USD, millions) Cost of exemptions (%
modelled VAT revenue) Ethiopia 93% 1,329.9 22.83% Ghana 106% 1,842.6 34.48%
Senegal 50% 664.3 55.57% Zambia 55% 335.7 33.51%
Source: Author’s calculations using GHATAX, ETHTAX and CEQ/World Bank fiscal incidence analysis. Revenue data comes from Ethiopian Ministry of Finance and Economic Cooperation, the Ghanaian Ministry of Finance, the Senegalese Ministry of Economy, Finance and Planning, and the Zambian Ministry of Finance. GDP data comes from the World Bank.
IV. The impact of cash transfers
As discussed in Section I, cash transfer programmes are likely to be better targeted towards poorer parts of the population and thus a scale-up of these – in terms of the number of eligible participants and the generosity of payments – might provide a more effective way of reducing inequality and poverty compared to the VAT structure. This requires empirical consideration, however, given the difficulties faced by policymakers in LMICs in ensuring that the coverage and targeting of cash transfer programmes is effective.
Each of our sample countries has either a conditional or an unconditional cash transfer scheme. These vary in scale and the specific groups of the population that they target but all have in common that they aim to reach some of the poorest and most vulnerable members of society. Specific details on the coverage, eligibility and payment schedules for each programme can be found in Appendix A.
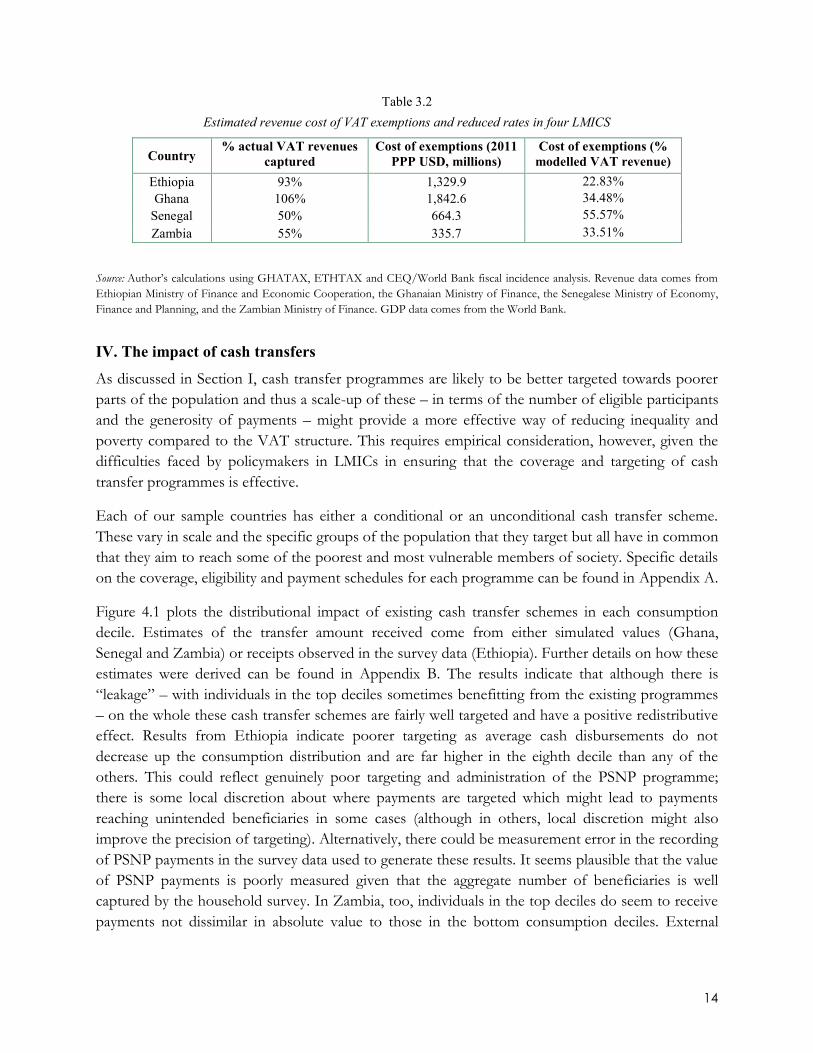
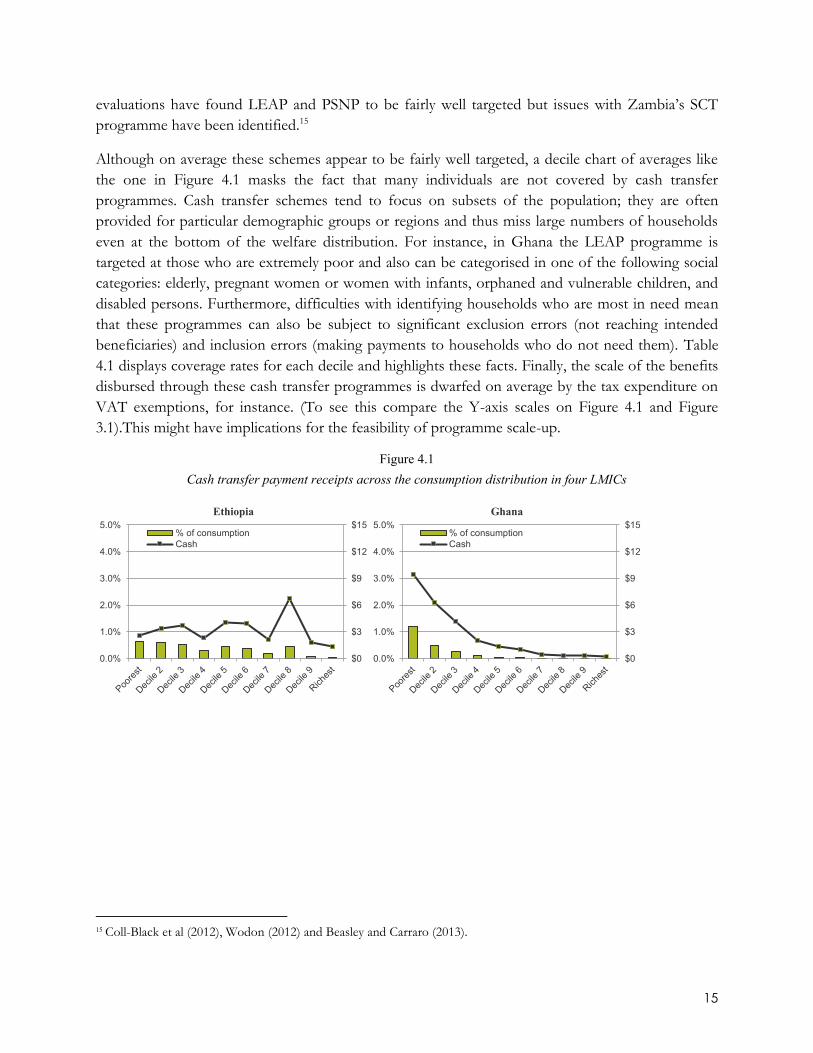
Figure 4.1 plots the distributional impact of existing cash transfer schemes in each consumption decile. Estimates of the transfer amount received come from either simulated values (Ghana, Senegal and Zambia) or receipts observed in the survey data (Ethiopia). Further details on how these estimates were derived can be found in Appendix B. The results indicate that although there is “leakage” – with individuals in the top deciles sometimes benefitting from the existing programmes – on the whole these cash transfer schemes are fairly well targeted and have a positive redistributive effect. Results from Ethiopia indicate poorer targeting as average cash disbursements do not decrease up the consumption distribution and are far higher in the eighth decile than any of the others. This could reflect genuinely poor targeting and administration of the PSNP programme; there is some local discretion about where payments are targeted which might lead to payments reaching unintended beneficiaries in some cases (although in others, local discretion might also improve the precision of targeting). Alternatively, there could be measurement error in the recording of PSNP payments in the survey data used to generate these results. It seems plausible that the value of PSNP payments is poorly measured given that the aggregate number of beneficiaries is well captured by the household survey. In Zambia, too, individuals in the top deciles do seem to receive payments not dissimilar in absolute value to those in the bottom consumption deciles. External
15
evaluations have found LEAP and PSNP to be fairly well targeted but issues with Zambia’s SCT programme have been identified.15
Although on average these schemes appear to be fairly well targeted, a decile chart of averages like the one in Figure 4.1 masks the fact that many individuals are not covered by cash transfer programmes. Cash transfer schemes tend to focus on subsets of the population; they are often provided for particular demographic groups or regions and thus miss large numbers of households even at the bottom of the welfare distribution. For instance, in Ghana the LEAP programme is targeted at those who are extremely poor and also can be categorised in one of the following social categories: elderly, pregnant women or women with infants, orphaned and vulnerable children, and disabled persons. Furthermore, difficulties with identifying households who are most in need mean that these programmes can also be subject to significant exclusion errors (not reaching intended beneficiaries) and inclusion errors (making payments to households who do not need them). Table 4.1 displays coverage rates for each decile and highlights these facts. Finally, the scale of the benefits disbursed through these cash transfer programmes is dwarfed on average by the tax expenditure on VAT exemptions, for instance. (To see this compare the Y-axis scales on Figure 4.1 and Figure 3.1).This might have implications for the feasibility of programme scale-up.
Figure 4.1 Cash transfer payment receipts across the consumption distribution in four LMICs
15 Coll-Black et al (2012), Wodon (2012) and Beasley and Carraro (2013).
$0
$3
$6
$9
$12
$15
0.0%
1.0%
2.0%
3.0%
4.0%
5.0%Ethiopia
% of consumptionCash
$0
$3
$6
$9
$12
$15
0.0%
1.0%
2.0%
3.0%
4.0%
5.0%Ghana
% of consumptionCash

16
Note: Population deciles ranked by per capita consumption; cash amounts are annual USD 2011 PPP. Estimates for Ethiopia based on reported transfer receipts. Estimates for other countries based on simulated transfer receipts.
Source: Author’s calculations using GHATAX, ETHTAX and CEQ/World Bank fiscal incidence analysis.
Table 4.1 Coverage rates of existing cash transfer programmes across the consumption distribution in four LMICs
Country Consumption Decile
1 2 3 4 5 6 7 8 9 10 Ethiopia 9.6% 9.7% 11.9% 6.8% 11.3% 10.1% 8.6% 10.5% 3.4% 2.4% Ghana 20.9% 14.3% 10.2% 5.1% 3.5% 2.3% 1.1% 0.9% 0.6% 0.6%
Senegal 43.5% 39.3% 30.8% 24.0% 17.4% 18.6% 6.8% 6.2% 4.0% 0.0% Zambia 10.4% 8.4% 9.1% 8.4% 5.1% 4.5% 2.4% 3.8% 3.0% 3.1%
Note: Population deciles ranked by per capita consumption; an individual is counted as covered by a cash transfer scheme if any member of their household receives a positive cash amount in that year. Details of calculation can be found in Appendix B.
Source: Author’s calculations using GHATAX, ETHTAX and CEQ/World Bank fiscal incidence analysis.
V. Compensating for VAT base broadening with a demogrant/UBI
Combined, results from sections III and IV suggest that if governments in these LMICs were to increase fiscal space by broadening the VAT base, the scale up of existing cash transfer programmes could provide one means through which the additional revenue could be reinvested to compensate the poorest for their reduced purchasing power. However, such a policy proposal would likely be undesirable and politically unpalatable given that large groups of the population would lose out unless eligibility was expanded and targeting was perfect. Eligibility is often contingent on regional or demographic characteristics and thus as well as individuals above some welfare threshold losing out, the majority of the population in or close to poverty would suffer too. Furthermore, the size of the scale-up of existing cash transfers needed to adequately compensate individuals might be unsuitable for the administration of existing cash transfer programmes, which tend to be small and targeted.
$0
$3
$6
$9
$12
$15
0.0%
1.0%
2.0%
3.0%
4.0%
5.0%Senegal
% of consumptionCash
$0
$3
$6
$9
$12
$15
0.0%
1.0%
2.0%
3.0%
4.0%
5.0%Zambia
% of consumptionCash

17
An alternative means of compensation that has received substantial interest from policymakers is a UBI/demogrant. Such a scheme involves every member of the population receiving the same unconditional cash payment from the government, regardless of their level of income or wealth. Clearly this is a completely untargeted policy; this has the advantage of ensuring that no poor households are left behind but also reduces the total redistributive effect in all likelihood. The lack of precise targeting required for a UBI, combined with the fact that every member of the population receives some compensation, may make it an appealing way to compensate a population for a policy reform that imposes costs on the entire distribution, such as in the case of the removal of VAT exemptions. But would such a reform provide a better way to support the welfare of poorer individuals than through preferential VAT treatment? To consider this, we simulate the impact of implementing a uniform VAT – again leaving out public services, financial services and accommodation costs – and using this additional revenue to fund a UBI which is disbursed on an individual basis. In one scenario, we consider the impact of using all of the additional revenue raised to fund these cash disbursements. However, in practice the government may wish to retain some of the additional revenue for other expenditures and there may be programme costs to be accounted for with such a large scale scheme. For this reason, we also consider a second scenario where 75% of the extra revenue raised from the uniform VAT goes to the population in the form of a UBI.16
Figure 5.1 and Figure 5.2 plot the estimated distributional impact of implementing a uniform VAT to fund a UBI in each of our countries, using 100% and 75% of the extra VAT revenue to fund the UBI, respectively. In either case, it is clear that such a reform easily compensates the poorest deciles of the consumption distribution on average. The size of the net benefit to poor households from this policy scenario is of course directly related to the estimated scale and inequity of tax expenditures on preferential VAT rates in each country: contrast the 2.56% gain in consumption value for the bottom decile in Ethiopia to the 18.52% gain in Zambia in the full revenue reinvestment scenario.
16 See footnote 10, above, for a more detailed discussion of the methodology used for this analysis.

18
Figure 5.1 The distributional impact of a implementing a uniform VAT and using 100% of the revenue gain to fund a UBI in
four LMICs
Note: Population deciles ranked by per capita consumption; UBI is funded from the full revenue gain from implementing a uniform VAT at the standard rate in each country (excluding public services, financial services and accommodation costs) and is distributed per capita.
Source: Author’s calculations using GHATAX, ETHTAX and CEQ/World Bank fiscal incidence analysis.
-5.0%
0.0%
5.0%
10.0%
15.0%
20.0%
Poorest
Decile 2
Decile 3
Decile 4
Decile 5
Decile 6
Decile 7
Decile 8
Decile 9
Richest
Gai
n as
a %
of c
onsu
mpt
ion
Ethiopia Ghana
Senegal Zambia

19
Figure 5.2 The distributional impact of implementing a uniform VAT and using 75% of the revenue gain to fund a UBI in four
LMICs
Note: Population deciles ranked by per capita consumption; UBI is funded from 75% of the revenue gain from implementing a uniform VAT at the standard rate in each country (excluding public services, financial services and accommodation costs) and is distributed per capita.
Source: Author’s calculations using GHATAX, ETHTAX, and CEQ/World Bank fiscal incidence analysis.
Individuals towards the top of the distribution lose out from this reform because although they receive the same UBI payment, the benefit they currently enjoy in cash terms from VAT exemptions and reduced rates is so much bigger than poorer households. Thus, they contribute much more to the funding of the UBI in these simulations. In the revenue-neutral scenario, on average individuals in the bottom six deciles of the consumption distribution are fully compensated for price rises induced by VAT rises by the introduction of the UBI.
As one would expect, in the second scenario, the consumption gain enjoyed by poorer individuals is smaller and the cost imposed at the top of the distribution is larger. While in the first scenario the “turning point” in the consumption distribution where households on average start to be net losers from the reform occurs in decile seven (Ghana) or eight (Ethiopia, Senegal, Zambia), this is shifted down to the fifth (Senegal), sixth (Ghana) or seventh (Ethiopia, Zambia) in the second scenario.
Given that the reforms would redistribute resources from richer to poorer households, they would seem to have the potential to be both poverty- and inequality-reducing. Table 5.1 provides estimates of the marginal contribution of the proposed reforms to the poverty headcount and poverty gap measures at three different international poverty lines. Positive estimates indicate a reduction in that measure of poverty. Considering first the poverty headcount, the revenue neutral reform reduces poverty at the lowest poverty line in all cases. These effects are potentially large: for Ghana there is a reduction in poverty of 1.11 percentage points, or over 310,000 individuals; for Ethiopia the corresponding figures are 0.39 percentage points or almost 400,000 individuals. At the $3.20 poverty line, the picture becomes less clear and varies across the sample, while at the top poverty line there is an increase in poverty. This reflects the
-5.0%
0.0%
5.0%
10.0%
15.0%
20.0%
Poorest
Decile 2
Decile 3
Decile 4
Decile 5
Decile 6
Decile 7
Decile 8
Decile 9
Richest
Gai
n as
a %
of c
onsu
mpt
ion
Ethiopia Ghana
Senegal Zambia

20
fact that the many of the relatively middle class individuals around this line in our sample actually lose out more from the uniform VAT than they gain from the UBI. For the poverty gap – which measures the fraction of national consumption needed to pull everybody up to that poverty line – the reform reduces poverty in all countries at each poverty line. When the second scenario is considered, with a smaller UBI, naturally the poverty-reducing potential of the reform is dampened. In fact, in Senegal the headcount ratio is estimated to increase slightly in this scenario.
Table 5.1 Estimates of the marginal contributions to poverty reduction from a uniform VAT funding a UBI
Poverty line $1.90 per day $3.20 per day $5.50 per day
100% UBI Headcount Gap Headcount Gap Headcount Gap Ethiopia 0.0039 0.0023 -0.0013 0.0024 -0.0018 0.0007 Ghana 0.0111 0.0049 0.0099 0.0078 -0.0012 0.0065
Senegal 0.0090 0.0124 -0.0021 0.0074 -0.0035 0.0018 Zambia 0.0053 0.0140 -0.0033 0.0082 -0.0018 0.0034
75% UBI Headcount Gap Headcount Gap Headcount Gap Ethiopia 0.0024 0.0013 -0.0026 0.0008 -0.0020 -0.0007 Ghana 0.0067 0.0033 0.0044 0.0045 -0.0052 0.0024
Senegal -0.0015 0.0062 -0.0048 0.0009 -0.0039 -0.0030 Zambia 0.0019 0.0088 -0.0041 0.0041 -0.0023 0.0007
Note: A positive number indicates a reduction in poverty. Poverty figures are calculated based on consumable income per capita pre- and post-reform.
Source: Author’s calculations using GHATAX, ETHTAX and CEQ/World Bank fiscal incidence analysis.
The pattern of results displayed for metrics of inequality in Table 5.2 are much more consistent. The proposal to implement a UBI funded by a uniform VAT reduces both our measures of inequality, regardless of whether all the additional revenue is invested in this UBI or just 75%.
Table 5.2 Estimates of the impact on inequality from a uniform VAT funding a UBI
Measure Gini Coefficient 90/10 Ratio Scenario Baseline 100% UBI 75% UBI Baseline 100% UBI 75% UBI Ethiopia 0.3798 0.3766 0.3773 5.21 5.12 5.15 Ghana 0.4501 0.4416 0.4440 8.50 7.92 8.07
Senegal 0.3983 0.3835 0.3873 5.71 5.23 5.35 Zambia 0.6067 0.5983 0.6007 18.56 17.09 17.09
Note: Inequality measures are calculated based on consumable income per capita pre- and post-reform.
Source: Author’s calculations using GHATAX, ETHTAX and CEQ/World Bank fiscal incidence analysis.
Headline measures of average distributional impacts and the effects on key poverty and inequality metrics are important but again mask heterogeneity at the individual level. In this case, the heterogeneity

21
amongst individuals of comparable levels of consumption is driven by the extent to which those individuals make market purchases of goods and services which are currently subject to preferential VAT treatment. This may differ due to preferences over types of goods and services and/or the extent to which consumption comes from monetary expenditures as compared to home production and barter. Table 5.3 provides estimates of the percentage of individuals in each consumption decile that would be net winners after accounting for increased VAT on the goods and services they purchase and increased income from the UBI, separately for the 100% and 75% revenue reinvestment cases. The results are as one would expect: at the bottom of the distribution almost all individuals are “winners”; fewer and fewer can be classified as such as one moves up the consumption distribution.
Table 5.3 The proportion of winners across the consumption distribution from a uniform VAT funding a UBI
Country Consumption Decile 100% UBI 1 2 3 4 5 6 7 8 9 10
Ethiopia 97.1% 97.4% 94.5% 89.8% 84.2% 77.2% 50.8% 30.9% 18.5% 8.3% Ghana 99.2% 98.5% 97.0% 94.5% 86.2% 72.8% 54.5% 37.7% 19.7% 14.8%
Senegal 100% 100% 99.7% 97.2% 85.5% 76.2% 58.6% 27.8% 10.4% 0.9% Zambia 100% 100% 100% 97.2% 87.5% 74.0% 50.9% 32.5% 21.2% 17.2%
75% UBI 1 2 3 4 5 6 7 8 9 10 Ethiopia 94.8% 93.0% 86.3% 69.2% 56.2% 45.1% 24.7% 18.6% 10.4% 6.2% Ghana 98.9% 95.7% 91.5% 80.6% 64.0% 49.2% 30.9% 22.0% 11.6% 9.9%
Senegal 100% 97.6% 92.1% 79.3% 48.6% 27.4% 23.1% 8.0% 4.7% 0.6% Zambia 100% 100% 97.0% 86.6% 71.7% 55.5% 37.2% 22.7% 17.9% 15.8%
Note: Population deciles ranked by per capita consumption; an individual is counted as a “winner” from the reform if the increase in consumption from the UBI exceeds the increase in VAT from removing exemptions and reduced rates.
Source: Author’s calculations using GHATAX, ETHTAX and CEQ/World Bank fiscal incidence analysis.
VI. Discussion and Conclusions. This paper has used microsimulation models to estimate the impact of VAT exemptions and reduced rates17 on revenues, poverty and consumption across the distribution in four LMICs (Ghana, Ethiopia, Senegal and Zambia), and compared these impacts to existing and hypothetical cash transfer programmes. Our baseline measure of welfare is consumption net of indirect taxes (“consumable income”) per capita, allowing us to capture the impact of indirect tax rates on individuals in a simple framework. The estimates presented are preliminary but are being shared to elicit feedback and generate discussion. Findings are striking so while refinements may change quantitative estimates, we would expect qualitative results to be robust. We find that preferential VAT treatments are a poor way of channelling resources towards low-consumption households. Although these preferential rates do reduce poverty, and sometimes by a significant amount, they are expensive and much of their benefit accrues to better off individuals. This is partly driven by the fact that monetary expenditure is a smaller fraction of overall consumption for low-consumption individuals (who themselves produce more of what they
17 Excluding exemptions generally justified on administrative grounds, including public services, financial services, residential accommodation costs and small businesses.

22
consume) than high-consumption individuals in the LMICs we study.18 Thus exemptions have less of an impact for such households compared to a case where all consumption was monetary expenditure. However, much more important is the rather banal fact that high consumption households spend more in absolute terms on exempt and reduced rate goods and services. This means that the implicit cash subsidy afforded to high-consumption individuals is far greater. As a result, preferential rates are an expensive way of attaining a given level of poverty reduction. The consistency of this conclusion in the four countries studied leads us to believe that similar results should be expected in other LMICs, unless the exemptions/reduced rates are targeted narrowly on goods and services consumed in greater absolute quantities by the poor.
Existing cash transfer schemes are targeted more at households towards the bottom of the consumption distribution (e.g. those that are in poverty). However, they may not provide a suitable means of compensating households for the reduction in purchasing power they would face if the VAT base was broadened. The schemes remain relatively small-scale and tend to target subsets of the poorest parts of the population, often based on specific demographic or geographic eligibility criteria. Furthermore, the difficulty of implementing an effective targeting mechanism means that such programmes are generally subject to large inclusion and exclusion errors. Significant increases in the scale and coverage of such schemes would be required to offset the negative impact of VAT base broadening on households with low and middling levels of consumption. In these countries that is those below or close to the $1.90 and $3.20 international poverty lines.
A UBI/demogrant may provide an alternative means of compensating for a VAT rise. Our results indicate that broadening the VAT base and using the revenue to fund a UBI would boost the consumption of the least well off households and reduce extreme poverty and inequality – even if only 75% of the additional revenue was used for this purpose.19 There is of course a question of practicality with regards to the ability of LMIC governments to administer a nationwide cash transfer programme given administrative and information constraints. However, crucially such a programme would not require any targeting – only good registries of the population and reliable mechanisms for ensuring money reached intended beneficiaries. The fact that LMIC governments are increasingly
18 In fact, one might expect that the cash-terms benefits are even more skewed towards higher consumption households than our estimates suggest. This is because our estimates are based on the share of monetary expenditure that is untaxed because of tax evasion or firms falling below the VAT threshold being the same for all households. If instead, a higher share was untaxed for low-consumption households than high-consumption households, then the benefit of the VAT exemptions and reduced rates we consider would be lower for low-consumption households, and higher for high-consumption households, than under the assumption that the share of untaxed purchases was the same for the two groups. A related issue is that we assume the share of monetary expenditure that is untaxed because of tax evasion or firms falling below the VAT threshold is the same across goods and services. If instead, the share were higher for those goods and services currently subject to exemptions or reduced rates (such as foods), our estimates of the revenue cost of these VAT preferences may be overstated. We aim to investigate this issue further in subsequent versions of this analysis. 19 The issues discussed in footnote 18 suggest that such a UBI/demogrant might be even more progressive than our estimations suggest, but may not as large as modelled.

23
able to manage more complex schemes that do require targeting suggests that this might not be an insurmountable challenge.
However, these findings do not make a UBI funded by a uniform VAT an immediate policy prescription. Although there has been extensive policy debate about the potential pros and cons of a UBI, there is great uncertainty about what the economic and social implications would be. What would be the impact on work incentives and labour supply for instance? Given that our results have considered a reform where the average and marginal tax rates faced by individuals have been increased (because the tax rates on goods and services they buy have increased), and the income that would be obtained when not working is increased (because of the UBI), these labour supply impacts could be an important consideration. In a high income country context, reductions in labour supply would generally be seen as a drawback of such a scheme. But in a LMIC context, some reductions might be viewed favourably: reductions in child labour or dangerous work.
In addition, further research is needed to understand the economic impacts of VAT in LMIC contexts. This research has made an assumption of 100% incidence of VAT on consumer prices, a standard assumption that has been found to be somewhat reasonable in high-income countries (at least for tax rises).20 However, the presence of large (untaxed) informal markets may mean that this assumption is less realistic, depending on the nature of competition between formal and informal markets. The large informal sector may also have implications for the efficiency case for a uniform VAT: for sectors where it is relatively easy for traders or consumers to switch between the formal and informal markets, there may be a strong case for imposing lower VAT rates in order to discourage this switch. As an example, if raw foodstuffs can be easily sold in the informal sector and in order to avoid VAT, removing preferential VAT treatment would be expected to increase revenues to a lesser degree and could also stymie the growth of a more productive formal sector by reducing its price competitiveness. Both of these considerations could have important implications for the scale of redistribution that could be achieved by the implementation of a uniform VAT funding a UBI.
Nonetheless, the overall narrative is unlikely to be changed by the refinement of these assumptions and the results presented here are striking. This analysis represents the first set of results from a larger research project and the countries in the analysis will soon be expanded to include Indonesia, Sri Lanka, Tanzania and Vietnam. This will provide broader regional coverage and a more varied range of economic and fiscal structures, allowing us to further corroborate the robustness of the patterns uncovered so far. In addition, we plan to further refine our method for modelling VAT on intermediate goods and services and update results with the latest data and fiscal systems where possible. The results produced by in-country teams should also facilitate more detailed and bespoke analysis to enable focused policy dialogue with country governments.
20 Benzarti et al (2017).

24
References
Abramovsky, L., D. Phillips and R. Warwick (2017), ‘Redistribution, efficiency and the design of VAT: A review of the theory and literature’, IFS Briefing Note No. 212, available at: https://www.ifs.org.uk/publications/9350. Ahmad E. and M. Best (2012), ‘Financing Social Policy in the Presence of Informality’, LSE Asia Research Centre Working Paper, No. 54. Ahmad, E., and N. Stern (1984), “Theory of Reform and Indian Indirect Taxes.” Journal of Public Economics. 25 (3): 259–98. ———. 1991. The Theory and Practice of Tax Reform in Developing Countries. Cambridge: Cambridge University Press. Alatas, V., Banerjee, A., Hanna, R., Olken, B.A. and Tobias, J., 2012. Targeting the poor: evidence from a field experiment in Indonesia. American Economic Review, 102(4), pp.1206-40. Anton, A.S., F. Hernandez and S. Levy (2013), ‘The End of Informality in Mexico? Fiscal Reform for Universal Social Insurance’, Washington, D.C.: Inter-American Development Bank Atkinson, A. and J. Stiglitz (1976), ‘The Design of Tax Structure: Direct versus Indirect Taxation’, Journal of Public Economics, No. 6, pp. 55–75.
Aujean, M., P. Jenkins, and S. Poddar (1999), ‘A New Approach to Public Sector Bodies’, International VAT Monitor, Vol. 10, pp. 144–9
Beazley, R. and Carraro, L., 2013. ‘Assessment of the Zambia Social Protection Expansion Programme Targeting Mechanisms’. Oxford policy management.
Benzarti, Y., D. Carloni., J. Harju and T. Kosonen (2017). ‘What goes up may not come down: asymmetric incidence of value-added taxes’ (No. w23849). National Bureau of Economic Research.
Bird, R.M. and P.P. Gendron (2007), ‘The VAT in Developing and Transitional Countries’ Cambridge University Press, Cambridge.
Coady, D. (2008), ‘The Distributional Impacts of Indirect Tax and Public Pricing Reforms: A Review of Methods and Empirical Evidence,’ in Poverty and Social Impact Analysis by the IMF: Review of Methodology and Selected Evidence, edited by Robert Gillingham (International Monetary Fund), pp. 33-68.
Coll-Black, Sarah; Gilligan, Daniel O.; Hoddinott, John F.; Kumar, Neha; Taffesse, Alemayehu Seyoum; Wiseman, William. 2012. Targeting food security interventions in Ethiopia: The productive safety net programme. In Food and Agriculture in Ethiopia: Progress and Policy Challenges, ed. Paul A. Dorosh and Shahidur Rashid. Chapter 10 pp. 280-317. Philadelphia, PA: University of Pennsylvania Press.
Cremer, H. and F. Gahvari (1993), ‘Tax evasion and optimal commodity taxation’, Journal of Public Economics, Vol. 50, pp. 261–275.
Ebrill, L., M. Keen and V. Perry (2001), ‘The Modern VAT’, Washington D.C.: IMF.
Hoffman, L., S. Poddar, and J. Whalley (1987), ‘Taxation of Banking Services under a Consumption Type, Destination Basis VAT’, National Tax Journal, Vol. 40, Pp. 547-54
Honorati, Maddalena; Gentilini, Ugo; Yemtsov, Ruslan G.. 2015. The state of social safety nets 2015 (English). Washington, D.C. : World Bank Group.

25
Hughes, G. 1986. “A New Method for Estimating the Effects of Fuel Taxes: An Application to Thailand.” World Bank Economic Review 1 (1): 65–101.
ICTD/UNU-WIDER (2017), ‘Government Revenue Dataset: 2017’, available at: https://www.wider.unu.edu/project/government-revenue-dataset (accessed March 2018).
Inchauste, G., and J. Jellema (forthcoming), ‘Constructing Consumable Income: Including the Direct and Indirect Effects of Indirect Taxes and Subsidies.’ Chapter 6 in Commitment to Equity Handbook. Estimating the Impact of Fiscal Policy on Inequality and Poverty, edited by Nora Lustig (Brookings Institution Press and CEQ Institute, Tulane University). Advance online version available at http://www.commitmentoequity.org/publications/handbook.php.
Kleven, H., W. Richter and P. Sørensen (2000), ‘Optimal taxation with household production’, Oxford Economic Papers, 62, 584–594.
Mirrlees, J., S. Adam, T. Besley, R. Blundell, S. Bond, R. Chote, M. Gammie, P. Johnson, G. Myles and J. Poterba (2011), ‘Tax by Design: The Mirrlees Review’. Oxford University Press for Institute for Fiscal Studies, available at: https://www.ifs.org.uk/MirrleesReview.
Wodon, Q. ed., 2012. Improving the Targeting of Social Programs in Ghana. World Bank Publications.

26
Appendix A. Descriptions of VAT and cash transfer systems
Ghana – Policy Year 2016
VAT system
In essence, Ghana’s rate of VAT is 17.5%. However, 2.5% of this is labelled as a National Health Insurance Levy (NHIL). In general, zero-rating is reserved for exports; exemptions, however, are widespread and apply, for example, to many basic foodstuffs (if raw or simply prepared and domestically produced), health, education, domestic passenger transport, water, electricity, kerosene, petrol, diesel, pharmaceuticals, agricultural inputs, and textbooks. There are no “luxury” rates. Businesses whose annual turnover falls below GHC 200,000 are not required to register for VAT but may do so voluntarily.
Household survey estimates suggest that 53.4% of household expenditure is on goods and services that are in principle subject to VAT. Together, VAT and NHIL account for over 28% of tax revenue, after accounting for refunds.
Cash transfer scheme(s)
The Livelihood Empowerment Against Poverty (LEAP) programme is the main cash transfer programme in Ghana and is what has been modelled in this paper. LEAP began in 2008 and is a cash transfer programme providing both monetary disbursements and free national health insurance enrolment to recipient households. In 2016, 212,848 households were enrolled in the scheme; the goal is for this to increase to 350,000 in the first half of 2018.
Eligibility for the programme depends on a household being both extremely poor and having one or more member in one of the following social categories: aged 65 or above, severely disabled, orphaned or vulnerable child, or pregnant women and mothers with infants. In practice, selection for the programme depends on a community in a region being selected based on poverty data from a household survey. Individual eligible households are then identified via the use of a Proxy Means Test (PMT) to determine whether they qualify as extremely poor, as well as verification of household members in the aforementioned social categories.
The cash payments depend on the number of eligible beneficiaries in the households and is paid every second month. A household with one eligible member receives GHC 64.00 on each occasion; for two beneficiaries the payment is GHC 76.00; for three it is GHC 88.00 and a household with four or more beneficiaries receives GHC 106.00.
Ethiopia – Policy Year 2015/16
VAT system

27
Legislated VAT policy has a relatively wide base subject to the standard rate of 15%. Exemptions are granted on the following goods: raw cereals, soya beans, oil seeds, coffee, raw cotton, wheat flour, bread, leather products, kerosene, water purifying chemicals, mosquito nets, electricity, water, financial services, public administration services and donations, charity fees and gifts. Most exports are subject to zero-rates, except for a few for which exemptions have replaced the zero-rating classification (e.g. sesame, haricot and mung beans). There are no luxury rates, and the VAT registration threshold is 500,000 Birr in annual revenues.
60% of household consumption takes the form of monetary expenditure, while 30% of household monetary expenditure is exempt from VAT. VAT revenue in Ethiopia in 2015/16 is estimated at 54.7 Billion Birr (based on pre-actual revenue data from MOFEC). VAT revenues contribute approximately 35% of total tax revenues collections for general government.
Cash transfer scheme(s)
The Productive Safety Net Programme (PSNP) is Ethiopia’s rural safety net for food insecure households, and targets households that are chronically and transitorily food insecure and provides them with cash and/or food transfers. As of June 2016, the PSNP had almost 8 million direct project beneficiaries (individuals). There are two types of transfers: conditional transfers (households that have able-bodied adult labour engage in public works and receive transfers for 6 months of the year) and unconditional transfers (households without labour capacity, permanent direct support clients, and receive 12 months of unconditional transfers while also being linked with social protection services).21
The basic PSNP eligibility criteria are the following: 1) Households should be members of an eligible community (which in turns should belong to the Woreda-
selected Kebeles). 2) Food insecure households or households without adequate social protection/support.
Four modes of payment are possible: 1) cash payments made using the traditional approach of WOFED cashiers; 2) Cash payments made electronically through third party payment service providers; 3) Food transfers; and 4) Food vouchers. The daily wage rate of the cash transfer is calculated on the basis of the cost of buying 3kg of cereal and 0.8 kg of pulses per day (15 kg of cereal and 4 kg of pulses per person per month) in the market. These values vary at the Woreda-level. In practice, 61% of clients claim to receive payments within the agreed time fare, while 55% claim to receive a transfer at least equal to the value of 15 kg of cereal and 4 kg of pulses per month.
Senegal – Policy Year 2015
VAT system
21 While an urban version of the PSNP, the Urban PSNP (UPSNP) was also recently implemented, no observational data yet exists for this programme.

28
The standard rate of VAT in Senegal is 18%. Although there are no “luxury rates” above this, a reduced rate of 10% exists for accommodation and catering services owned by a licensed tourist accommodation. In addition, a wide range of goods and services are exempt from VAT including healthcare and pharmaceuticals, education, water, electricity, financial services, real estate and a list of unprocessed foods which includes cereals, vegetables, plants, roots and tubers, peanut, meat, fish and milk. There is no minimum turnover threshold for firm registration. In addition, a large list of ad hoc exemptions exists, particularly at customs, with specific firms exempt on the basis of locating in special economic zones, for instance.
In 2015, CFA 617 million was collected in revenue from VAT. This accounted for 30% of total government tax revenue.
Cash transfer scheme(s)
The Programme National de Bourses de Sécurité Familiale (PNBSF) is the main cash transfer programme in Senegal, constituting 93% of direct transfers provided in the country. The programme was launched in 2014 and provides vulnerable families with 100,000 FCFA per year (close to 170 USD) to strengthen their livelihoods. It is a conditional cash transfer programme, with the conditionality intended to provide an incentive to keep children in school, hence strengthening households’ human capital, while parallel specific, productivity enhancing activities aim at increasing the earning capacity of the poor.
Eligibility for the programme is determined by a combination of geographic targeting, a proxy means test, and community-based targeting. In total, 19.05% of individuals are covered by the scheme; a recent baseline survey sampled among the Unique Registry (the universe of the CCT program) shows that more than 90% of people are poor, although only 55% are extreme poor.
Zambia – Policy Year 2015 VAT system
The statutory VAT rate for standard-rated goods and services is 18%. There are no rates above the statutory rate but a zero rate does apply to a range of goods, including building supplies, mosquito nets, medical supplies, educational materials, energy saving equipment, and wheat flour and bread. Most other food products, health, education and housing are exempt. Firms whose turnover exceeds K800,000 in any twelve consecutive months or K200,000 in any consecutive three months are required to register for VAT; below this threshold registration is voluntary. In 2015, K6.58 billion of revenue was collected from VAT – 21% of total tax revenues collected by the government.
Cash transfer scheme(s)

29
The main cash transfer programme is the Social Cash Transfer Scheme (SCTS), which started in 2003. By 2015 over 150,000 SCTS beneficiaries could be found in approximately 50 percent of the country’s 103 districts. It is an unconditional cash transfer programme involving monthly transfers of K70 for households without disabled members, and K140 for households with disabled members (approximately $US7–14, respectively).
The eligibility criteria targets poor households that include one or more disabled members and poor and vulnerable individuals. To identify eligible households, SCTS employs both a proxy means test and categorical targeting as well as community-level advice concerning potential beneficiaries. In 2017 the government was hoping to expand to cover 500,000 beneficiaries in all 103 districts as well as increasing the monthly transfer amounts.

30
Appendix B. Key data sources and methodologies
Data Sources
Ethiopia
Ethiopian Socioeconomic Survey 2015/16 Household Consumption Expenditure Survey 2010/11 Ethiopia Social Accounting Matrix 2005/06 Ethiopian Ministry of Finance Accounts
Ghana Ghana Living Standards Survey Round 6 2012/13 Ghana Social Accounting Matrix 2005 Ghana Customs Management System records 2016 Ghanaian Ministry of Finance Accounts LEAP PMT score data for GLSS6
Senegal
Enquête de Suivi de la Pauvreté au Sénégal 2011 Senegal Social Accounting Matrix 2011 Senegal Ministry of Economy, Finance and Planning Accounts
Zambia Zambian Living Conditions Monitoring Survey 2015 Zambia Social Accounting Matrix 2007 Zambian Ministry of Finance Accounts
Methodology
Model used Microsimulation models – ETHTAX and GHATAX – were used for Ethiopia and Ghana, respectively. Both of these have been built as part of a partnership between IFS and the Ministry of Finance in each country under the DfID-funded TAXDEV centre.22 Small edits were necessary to some calculative steps and variable definitions in each of these to align with the approaches of the CEQ and World Bank.
Results for Senegal and Zambia come from fiscal incidence analyses led from the CEQ Institute and the World Bank.23
Accounting for VAT non-compliance
22 Contact Tom Harris ([email protected]) and Ross Warwick ([email protected]) for further information on ETHTAX and GHATAX, respectively. 23 For More information see Commitment to Equity Institute (http://www.commitmentoequity.org/) and World Bank (http://blogs.worldbank.org/developmenttalk/how-do-taxes-and-transfers-impact-poverty-and-inequality-developing-countries) publications.

31
Non-compliance with VAT is widespread in all countries included in this analysis due to large informal sectors, small and unregistered business, and tax evasion. Clearly, accounting for such considerations is key for understanding the full impact of preferential VAT treatments. However, a lack of sector- or household-specific data regarding VAT non-compliance means that these results are only able to account for non-compliance at the aggregate level.
In order to do so, we adopt the following procedure in each country. First, all household consumption expenditure in the household survey is scaled up by a single factor such that the total recorded matches that in national accounts. Next, VAT revenue is estimated from this scaled up survey data under an assumption of a perfect enforcement using our microsimulation models. The ratio of actual VAT revenues – as recorded in government accounts – to this estimate provides an average rate of compliance which is then applied to all VAT rates in subsequent analysis using the original, unscaled household survey data. Thus informality and evasion on monetary expenditures is assumed to be constant across commodities and households.
Calculating indirect price effects of VAT exemptions
In a perfectly functioning VAT system with no exemptions, it would be possible to estimate the VAT liability of individuals and households using only data on consumption expenditure (under some incidence assumptions). However, exemptions make this much more complicated. A VAT exemption means that although the seller of the exempt good or service is not required to charge VAT on their output, they are not able to reclaim any VAT paid on inputs used in the production of the exempt good or service. This means that there may be “embedded” VAT in the price of exempt goods and services. In other words, the consumer of an exempt item may still face the burden of VAT on the inputs of that good. Therefore, to fully incorporate the impact of exemptions on households, it is necessary to take into account the production side of the economy.
To do this, we use input-output tables for each country – which allow us to map the production linkages between different sectors – and a method developed by Ahmad and Stern (1984) to estimate how the various VAT rates and exemptions in an economy interact to affect the final prices faced by consumers. We invoke assumptions of full pass-through onto prices and fixed technologies in production in order to make these estimations. A formal exposition of the method can be found in Ahmad and Stern (1991), Hughes (1986), Coady (2008) or, in an amended form, Inchauste and Jellema (forthcoming).
In cases where sectors in our input-output tables contain goods or services that are both VATable and VAT exempt, we construct “augmented” input-output tables by doubling the dimensions of such sectors. We assume the newly created sectors (one subject to VAT and one exempt) have identical production technologies and determine the relative size of each (in terms of their use as inputs into other sectors) using weights based on national consumption expenditure data from household surveys.
Measure of consumption

32
The default measure of welfare is consumption per capita minus indirect taxes plus indirect subsidies. This is equivalent to consumable income in a CEQ analysis if consumption assumed equal to disposable income. In general, consumption comprises purchased consumption goods, the value of home production, imputed rents and user values from durable goods. In Ethiopia, user values were not available and thus all expenditure is included in consumption.
The concept of consumable income as compared to consumption is an important distinction in the context of this paper because without the adjustment that takes into account indirect tax payments, simulations which change indirect tax rates will not have a material impact on measured welfare.
Modelling cash transfers
In Ghana and Senegal, cash transfer payments are simulated using actual PMT scores calculated for the household survey data being used. As well as PMT scores, in Ghana observed demographics of households were used and in Senegal geographic targeting was used to select eligible districts. In Zambia, SCT payments are simulated: first households eligible in principle are identified using household characteristics and regional targeting, before a mixed poverty-targeted rule and random allocation rule are used by region such that SCT beneficiaries and payments are matched to reality in aggregate. In Ethiopia, payments from PSNP are observed in the survey data. Calculation of VAT burden on households
Results from all models used in this paper utilise an assumption of 100% incidence of VAT on consumer prices and do not account for any behavioural change. Both these assumptions have implications for the welfare impact of VAT changes and in particular, mean that the impact of indirect tax changes reported in this paper should be interpreted as an upper bound of the welfare effect on individuals. Consider an increase in the VAT rate. The assumption of full pass-through onto prices will lead us to overestimate the effect of this on consumer prices if sellers bear some of the burden of the tax increase in the form of thinner profit margins. In addition, households may be able to improve their welfare by changing their consumption basket and in this case will not pay the full increase in VAT.