Embed Size (px)
Citation preview
Data Visualization Best Practices
Tim Vlamis
Friday, March 10, 2017
NCOAUG Winter Training Day
@VlamisSoftware
Copyright © 2017, Vlamis Software Solutions, Inc.
Vlamis Software Solutions
▪ Vlamis Software founded in 1992 in Kansas City, Missouri
▪ Developed 200+ Oracle BI and analytics systems
▪ Specializes in Oracle-based:▪ Enterprise Business Intelligence▪ Data Warehousing▪ Data Mining and Predictive Analytics▪ Data Visualization
▪ Multiple Oracle ACEs, consultants average 15+ years
▪ www.vlamis.com (blog, papers, newsletters, services)
▪ Co-authors of book “Data Visualization for OBI 11g”
▪ Co-author of book “Oracle Essbase & Oracle OLAP”
▪ Oracle University Partner
▪ Oracle Gold Partner
Copyright © 2017, Vlamis Software Solutions, Inc.
Tim Vlamis
Tim Vlamis – Vice President & Analytics Strategist
▪ 30+ years in business modeling and valuation, forecasting, and scenario analyses
▪ Oracle ACE
▪ Instructor for Oracle University’s Data Mining Techniques and Oracle R Enterprise Essentials Courses
▪ Professional Certified Marketer (PCM) from AMA
▪ MBA Kellogg School of Management (Northwestern University)
▪ BA Economics Yale University
Copyright © 2017, Vlamis Software Solutions, Inc.
Agenda
▪BI Exploring vs Explanation
▪Understanding the foundations of data discovery
▪Discovery scenarios
▪Discovery frameworks
▪Using Visual Analyzer to discover data insights
Copyright © 2017, Vlamis Software Solutions, Inc.
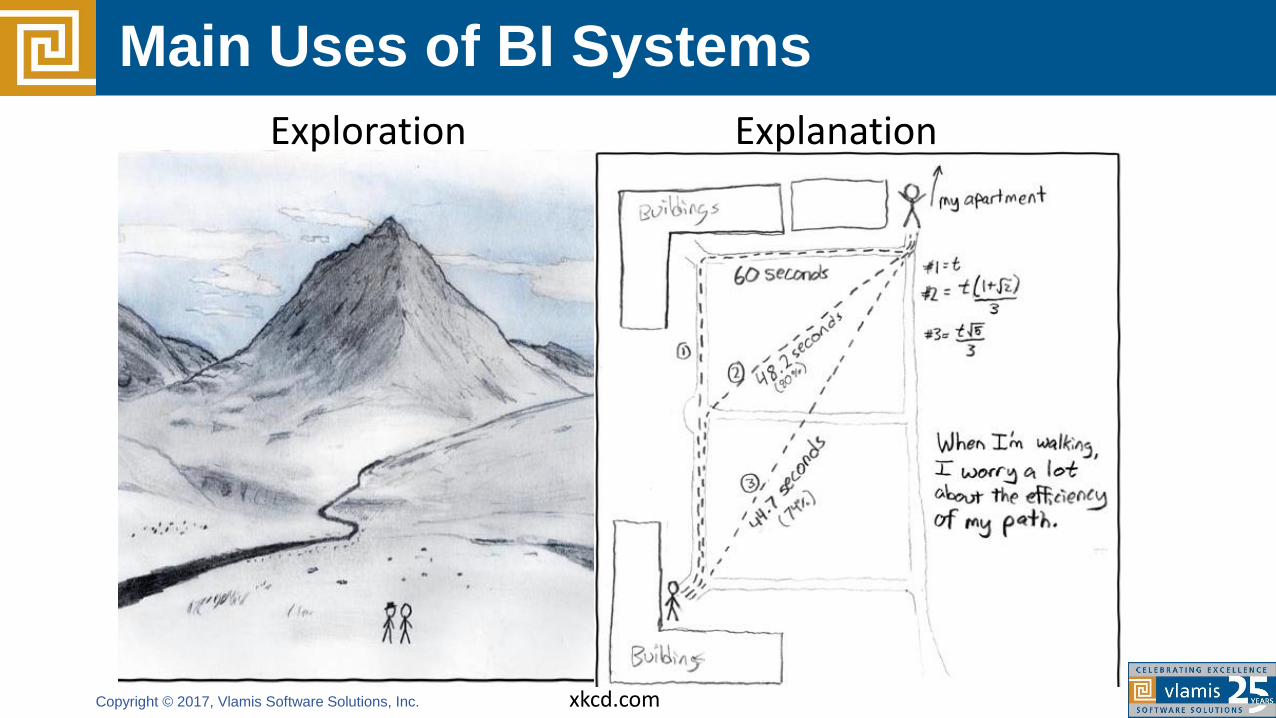
Main Uses of BI Systems
Exploration Explanation
xkcd.com
Copyright © 2017, Vlamis Software Solutions, Inc.
Many BI Tools Can Make Beautiful Results
Copyright © 2015, Vlamis Software Solutions,
Many BI Systems Can Create Beautiful Results

Copyright © 2017, Vlamis Software Solutions, Inc.
OBIEE Operates at a Different ScaleOBI Operates at a Different Scale
Copyright © 2017, Vlamis Software Solutions, Inc.
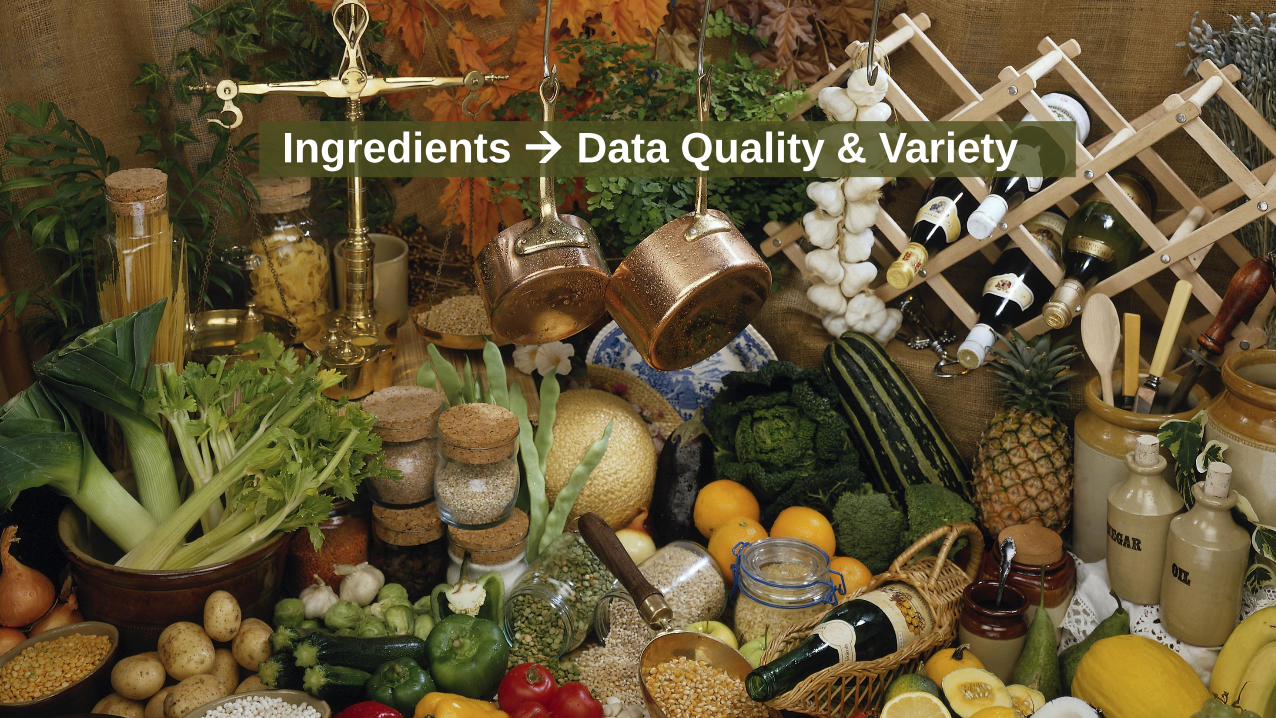
Ingredients Data Quality & Variety
Copyright © 2017, Vlamis Software Solutions, Inc.
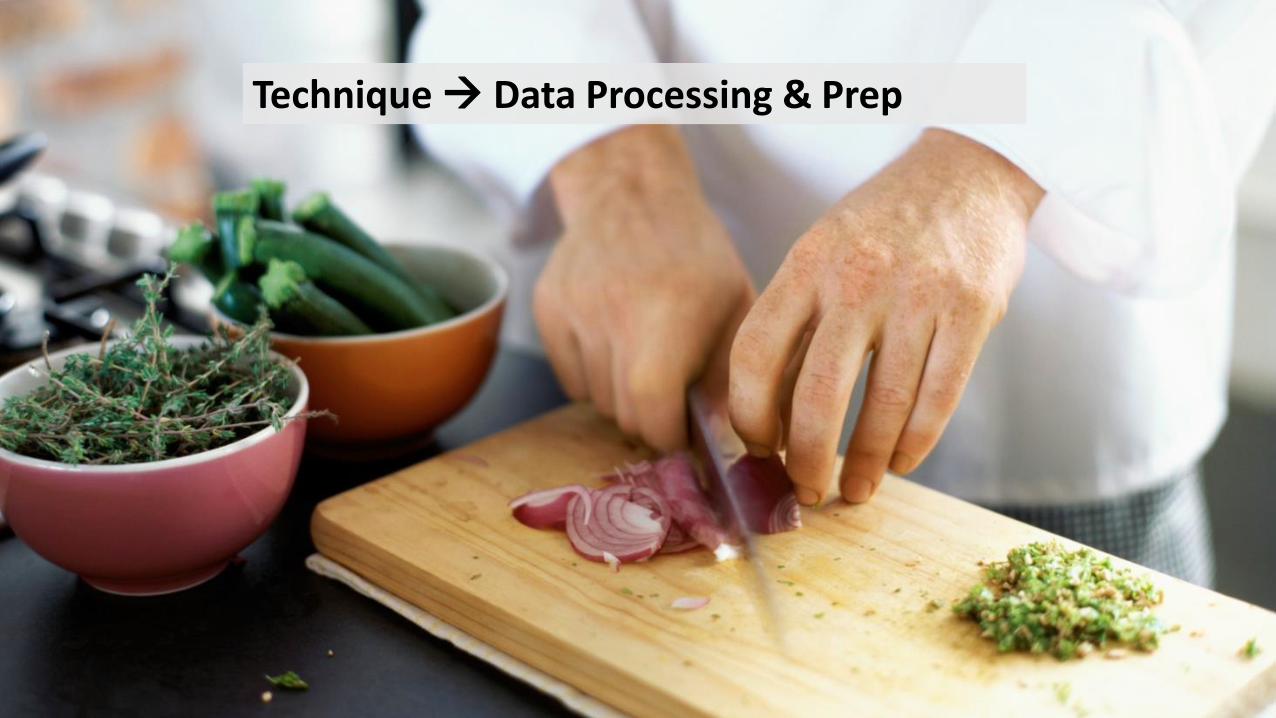
Technique Data Processing & Prep

Copyright © 2017, Vlamis Software Solutions, Inc.
Presentation Data Visualization
Copyright © 2017, Vlamis Software Solutions, Inc.
Copyright © 2016, Vlamis Software Solutions, Inc.
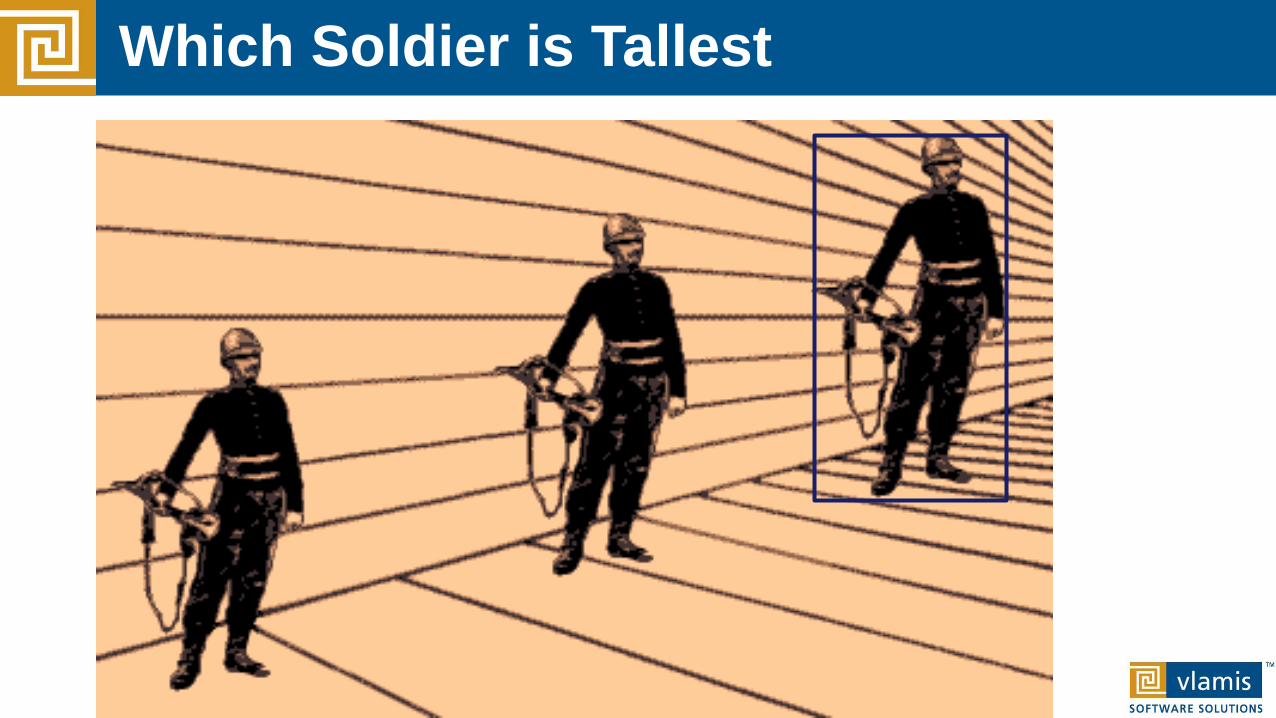
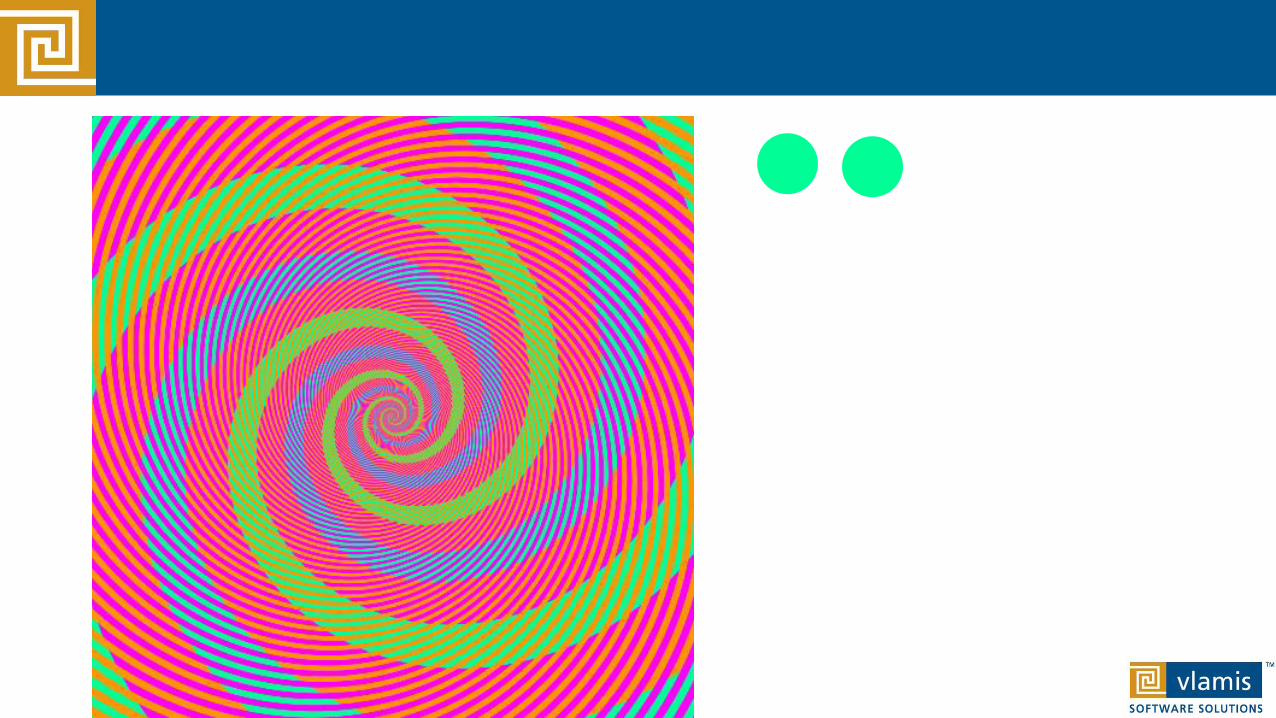
The Principles of Human Cognition Should Guide BI Visualization Design
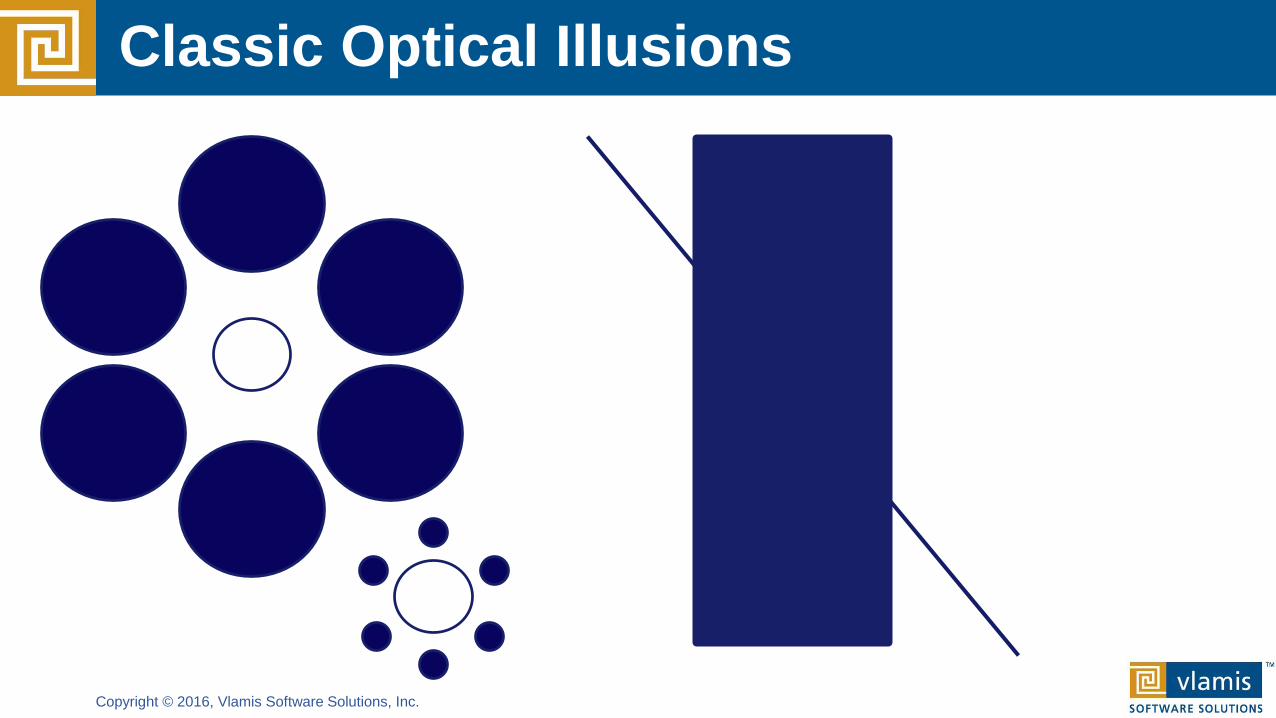
Copyright © 2016, Vlamis Software Solutions, Inc.
Classic Optical Illusions
Copyright © 2016, Vlamis Software Solutions, Inc.
Which Soldier is Tallest
Copyright © 2016, Vlamis Software Solutions, Inc.
Copyright © 2016, Vlamis Software Solutions, Inc.
Copyright © 2016, Vlamis Software Solutions, Inc.
Copyright © 2016, Vlamis Software Solutions, Inc.
Copyright © 2016, Vlamis Software Solutions, Inc.
Copyright © 2016, Vlamis Software Solutions, Inc.
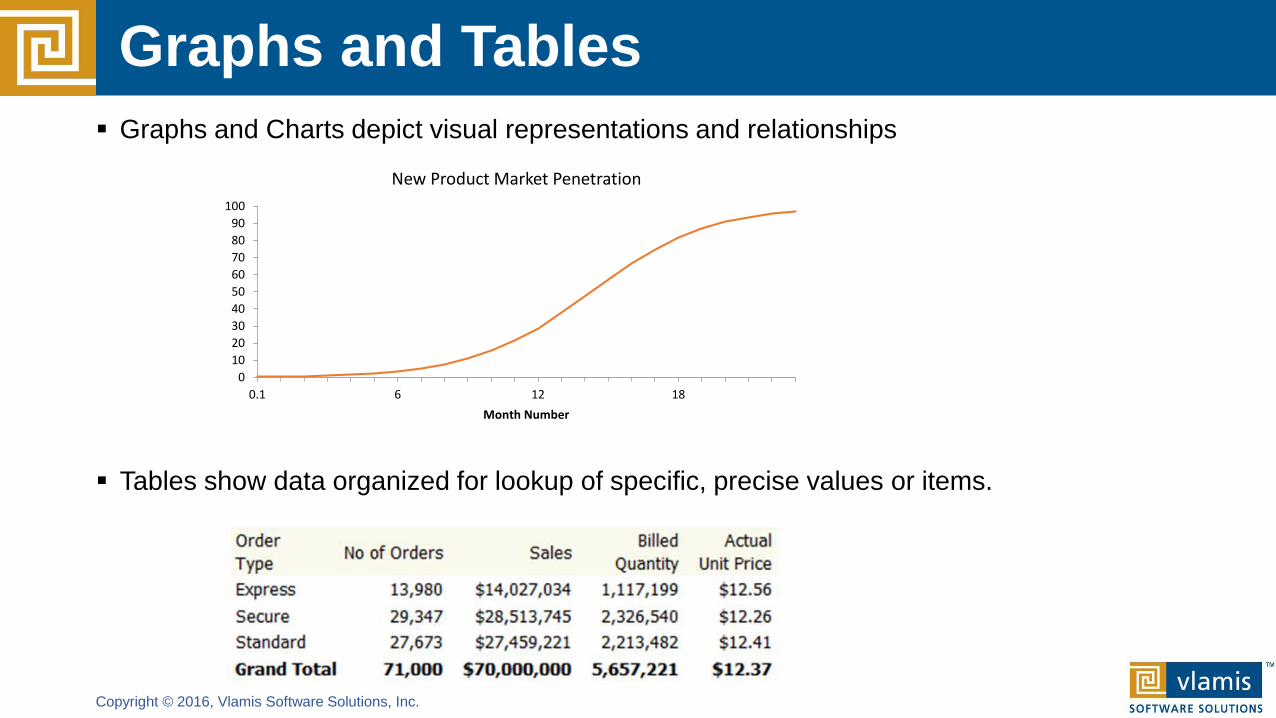
Graphs and Tables
▪ Graphs and Charts depict visual representations and relationships
▪ Tables show data organized for lookup of specific, precise values or items.
0
10
20
30
40
50
60
70
80
90
100
0.1 6 12 18
Month Number
New Product Market Penetration
Copyright © 2016, Vlamis Software Solutions, Inc.
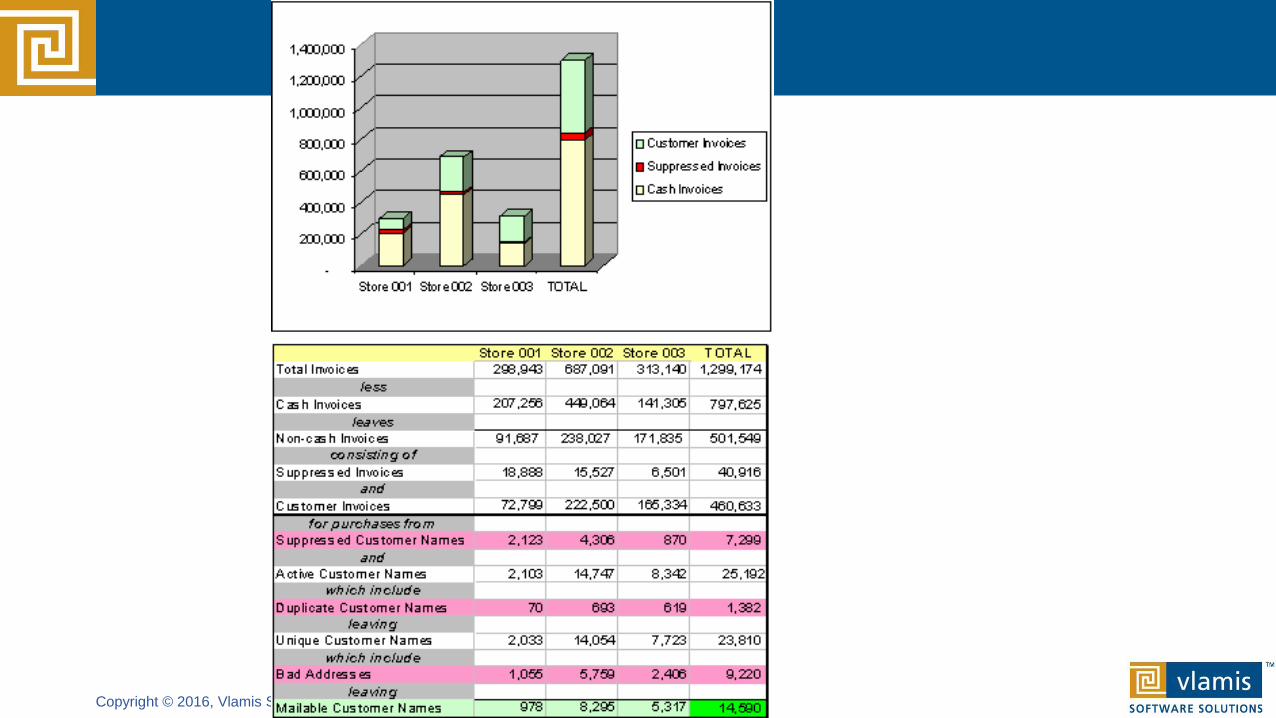
Characteristics of Tables
▪Can present data at drastically different scales.
▪Can present very different data types simultaneously.
▪Can repeat and include multiple sets of the same data values.
▪Are extraordinarily dense and include numerous data relationships without direct distortion of the data itself.
▪ Tables can present “federated” data from different sources in a single simultaneous view.
Copyright © 2016, Vlamis Software Solutions, Inc.
Keys to Effective Tables
▪ Prefer smaller tables
▪ Words are important▪ Enable roll overs for meta data for commonly used tables▪ Write informative titles for tables and column head descriptions
▪ Make tables clean and easy to read▪ Eliminate unnecessary gridlines▪ Use space (padding) to create groups of data▪ Left justify text cells and Right justify numerical cells
▪ Make numbers easy to read and understand▪ Judiciously use conditional formatting▪ Avoid putting text in color▪ Align the decimal point for numerical cells▪ Use symbols to denote units of measure (%, $, etc.)
▪ Enable column and row sorting
▪ Avoid scrolling (if possible)
▪ Be transparent about data selection
Copyright © 2016, Vlamis Software Solutions, Inc.
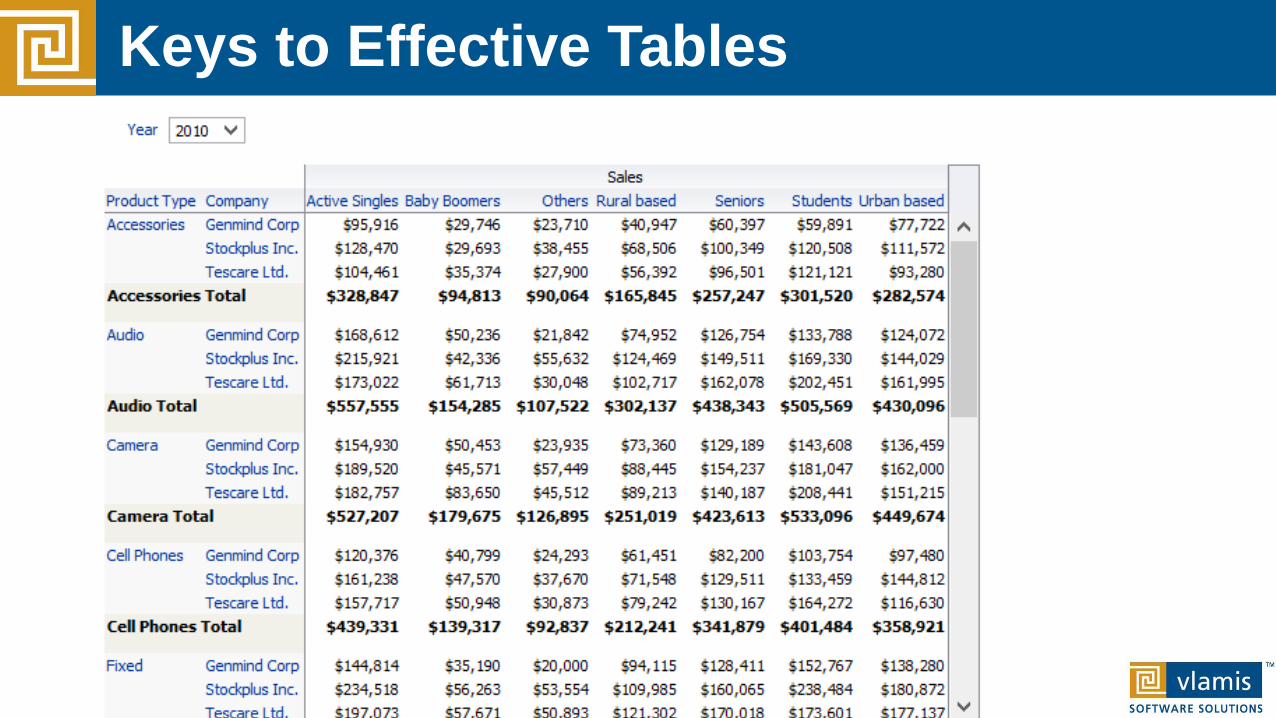
Keys to Effective Tables
Copyright © 2016, Vlamis Software Solutions, Inc.
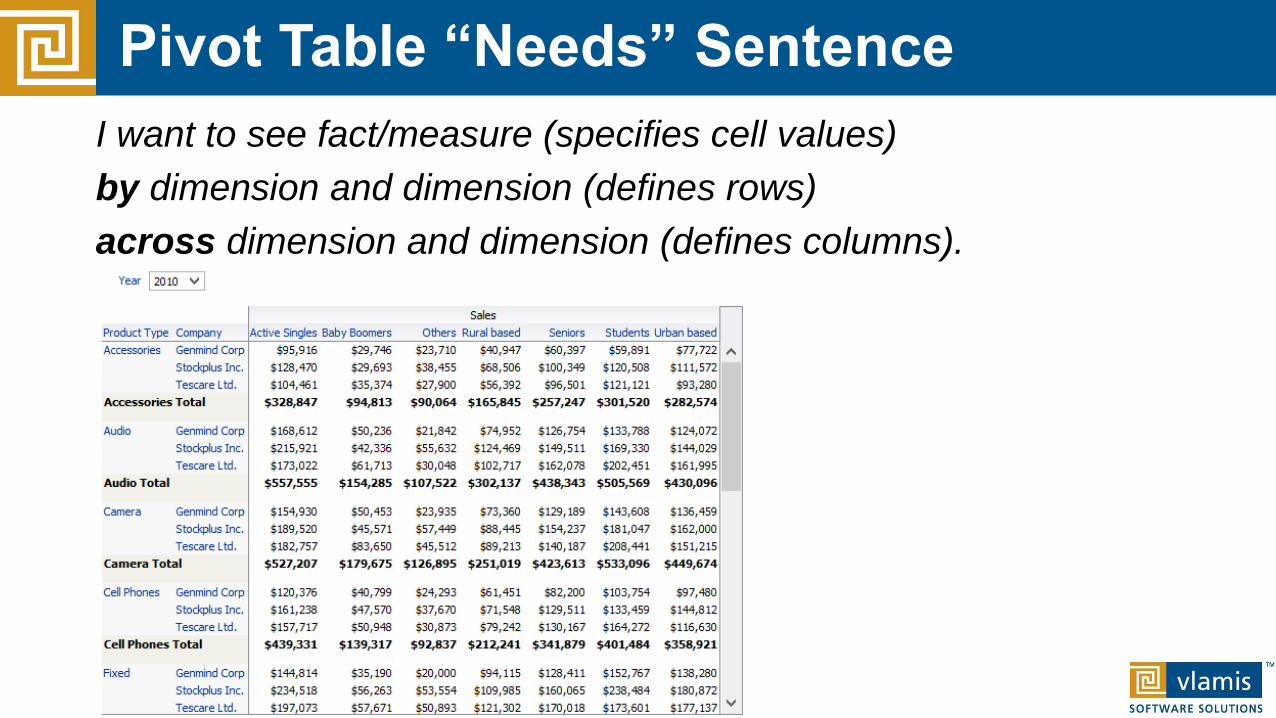
Pivot Table “Needs” Sentence
I want to see fact/measure (specifies cell values)
by dimension and dimension (defines rows)
across dimension and dimension (defines columns).
Copyright © 2016, Vlamis Software Solutions, Inc.
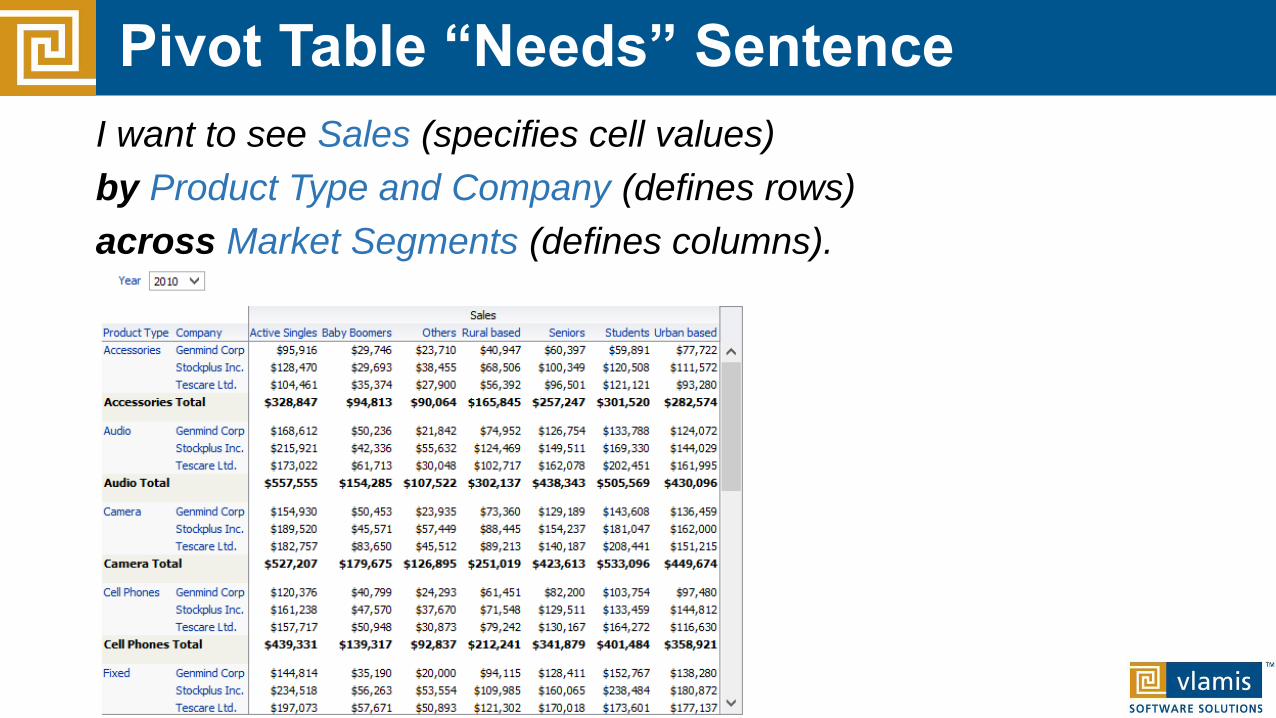
Pivot Table “Needs” Sentence
I want to see Sales (specifies cell values)
by Product Type and Company (defines rows)
across Market Segments (defines columns).
Copyright © 2016, Vlamis Software Solutions, Inc.
7 Keys to Effective Graphs
▪Do not use 3-D effects.
▪Avoid “stop light” color palette.
▪Prefer pastel color palettes and avoid bright colors.
▪Eliminate gridlines, drop shadows, and other graphics.
▪Enable interaction for “exploration” graphs.
▪Prioritize a single message for “explanation” graphs.
▪Above all else, show the data!
Copyright © 2016, Vlamis Software Solutions, Inc.
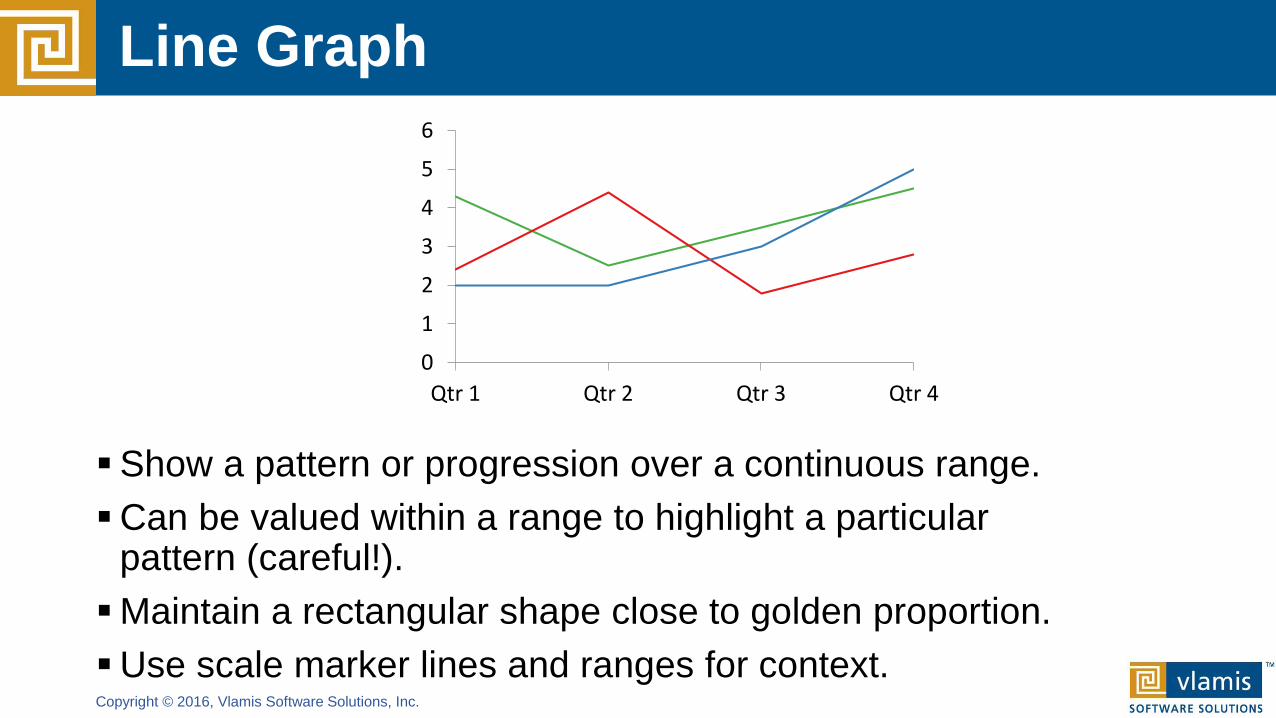
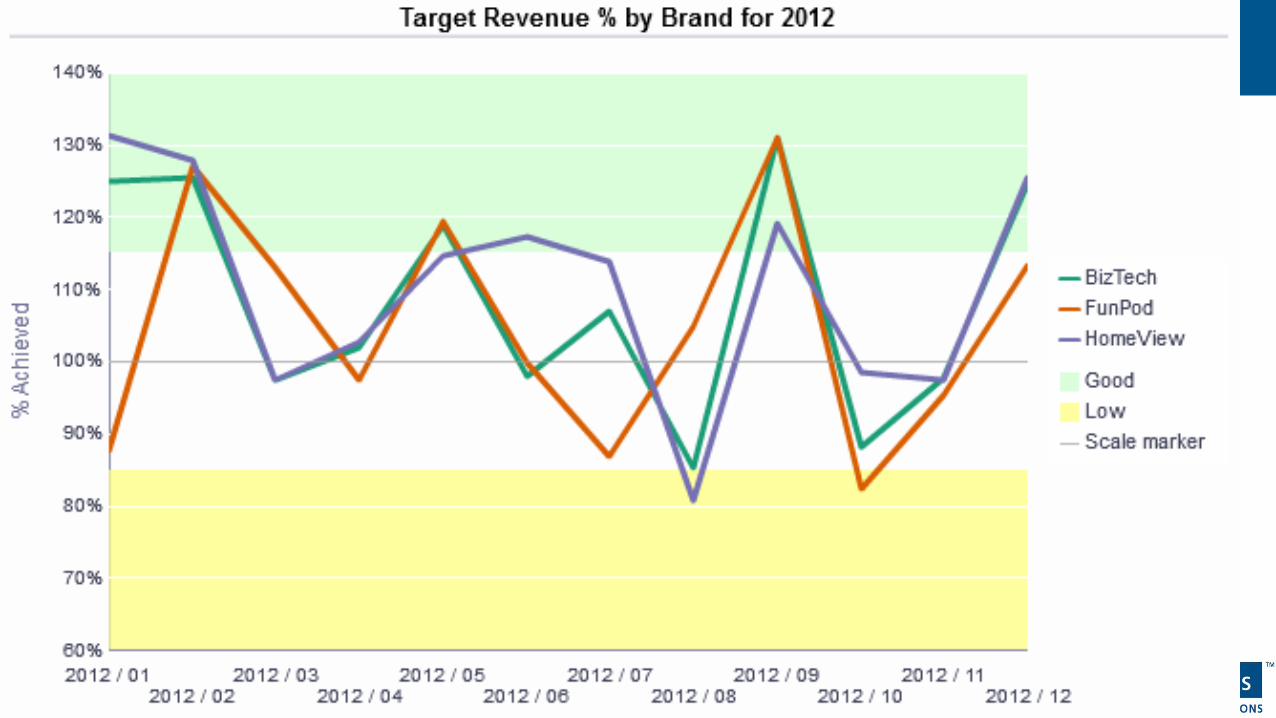
Line Graph
▪Show a pattern or progression over a continuous range.
▪Can be valued within a range to highlight a particular pattern (careful!).
▪Maintain a rectangular shape close to golden proportion.
▪Use scale marker lines and ranges for context.
0
1
2
3
4
5
6
Qtr 1 Qtr 2 Qtr 3 Qtr 4
Copyright © 2016, Vlamis Software Solutions, Inc.
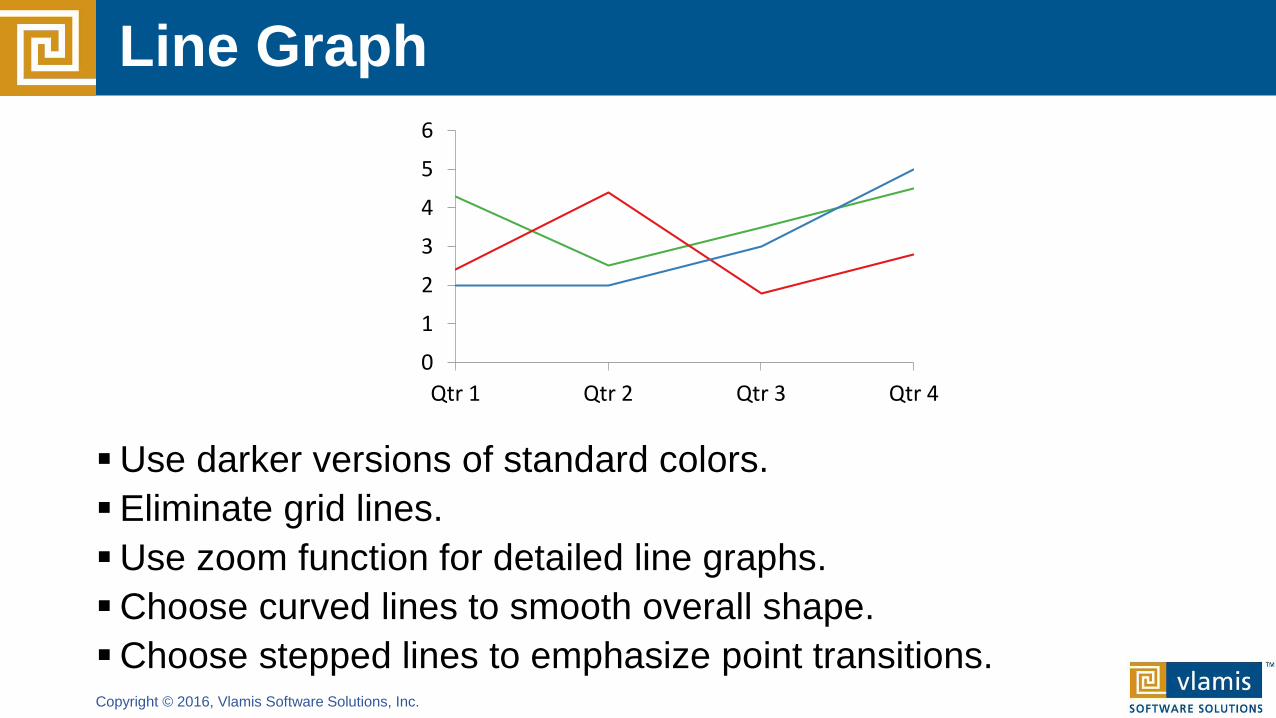
Line Graph
▪Use darker versions of standard colors.
▪Eliminate grid lines.
▪Use zoom function for detailed line graphs.
▪Choose curved lines to smooth overall shape.
▪Choose stepped lines to emphasize point transitions.
0
1
2
3
4
5
6
Qtr 1 Qtr 2 Qtr 3 Qtr 4
Copyright © 2016, Vlamis Software Solutions, Inc.
Copyright © 2016, Vlamis Software Solutions, Inc.
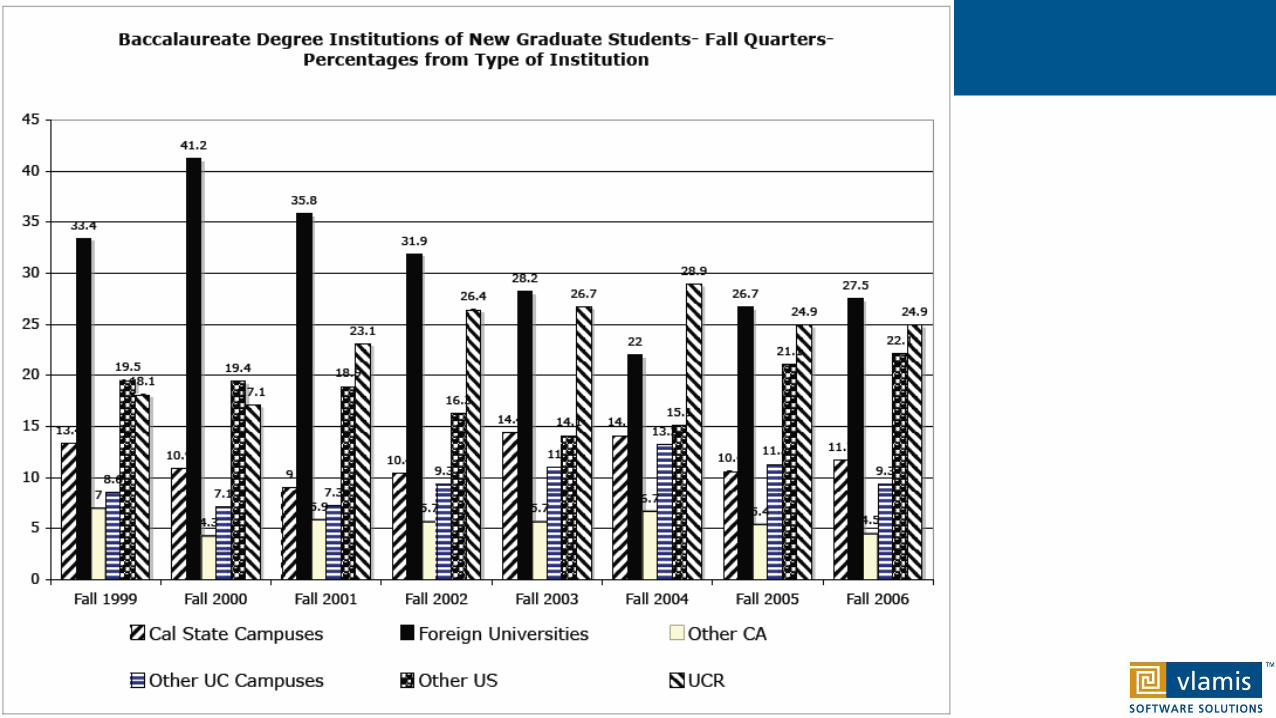
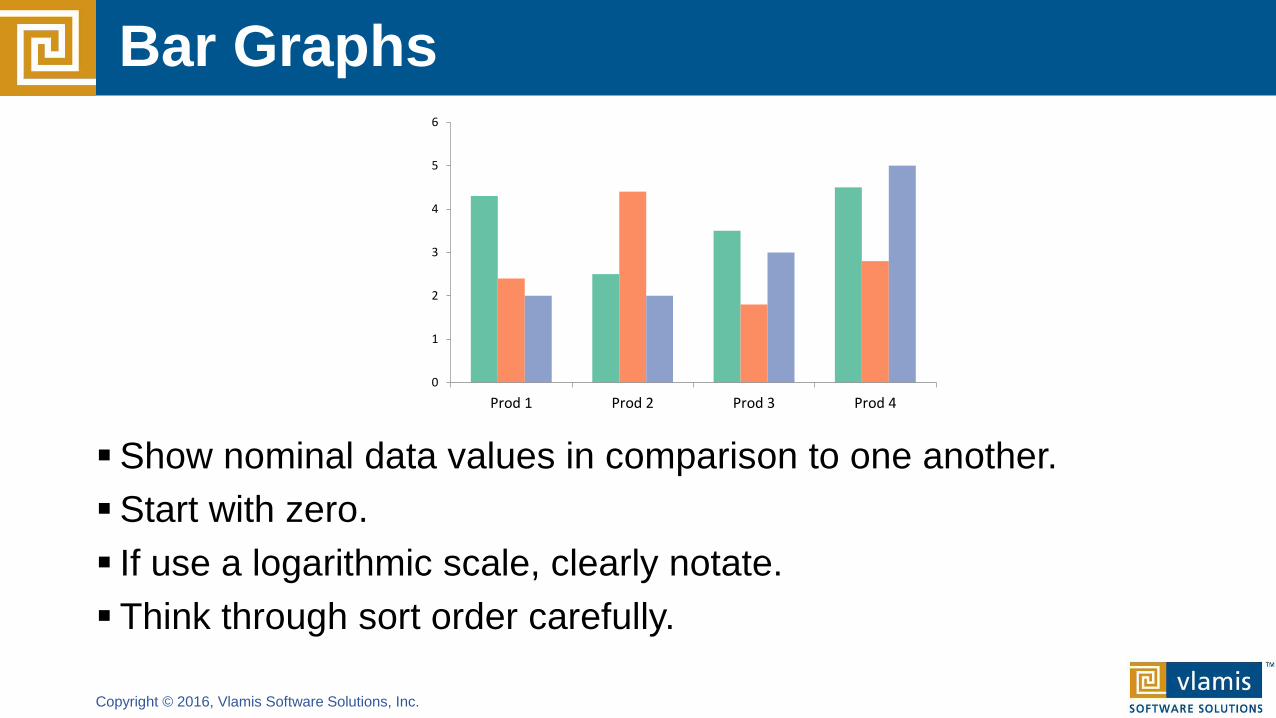
Bar Graphs
▪Show nominal data values in comparison to one another.
▪Start with zero.
▪ If use a logarithmic scale, clearly notate.
▪ Think through sort order carefully.
0
1
2
3
4
5
6
Prod 1 Prod 2 Prod 3 Prod 4
Copyright © 2016, Vlamis Software Solutions, Inc.
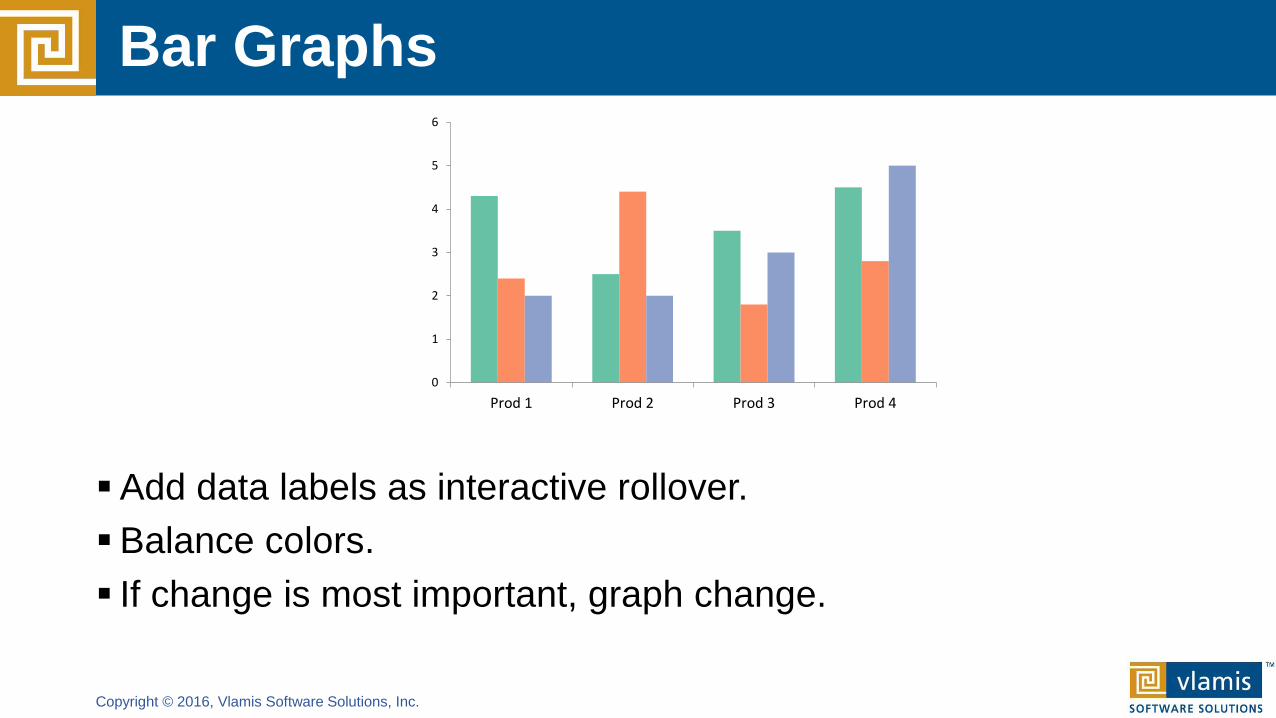
Bar Graphs
▪Add data labels as interactive rollover.
▪Balance colors.
▪ If change is most important, graph change.
0
1
2
3
4
5
6
Prod 1 Prod 2 Prod 3 Prod 4
Copyright © 2016, Vlamis Software Solutions, Inc.
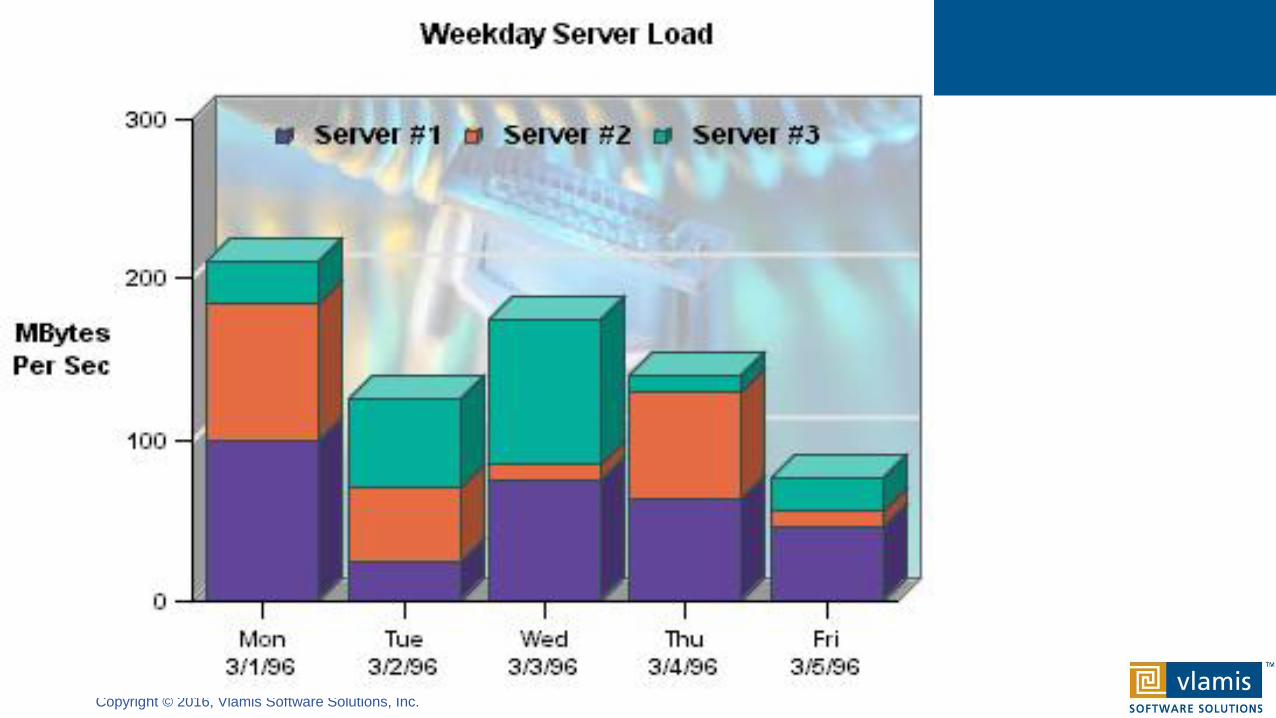
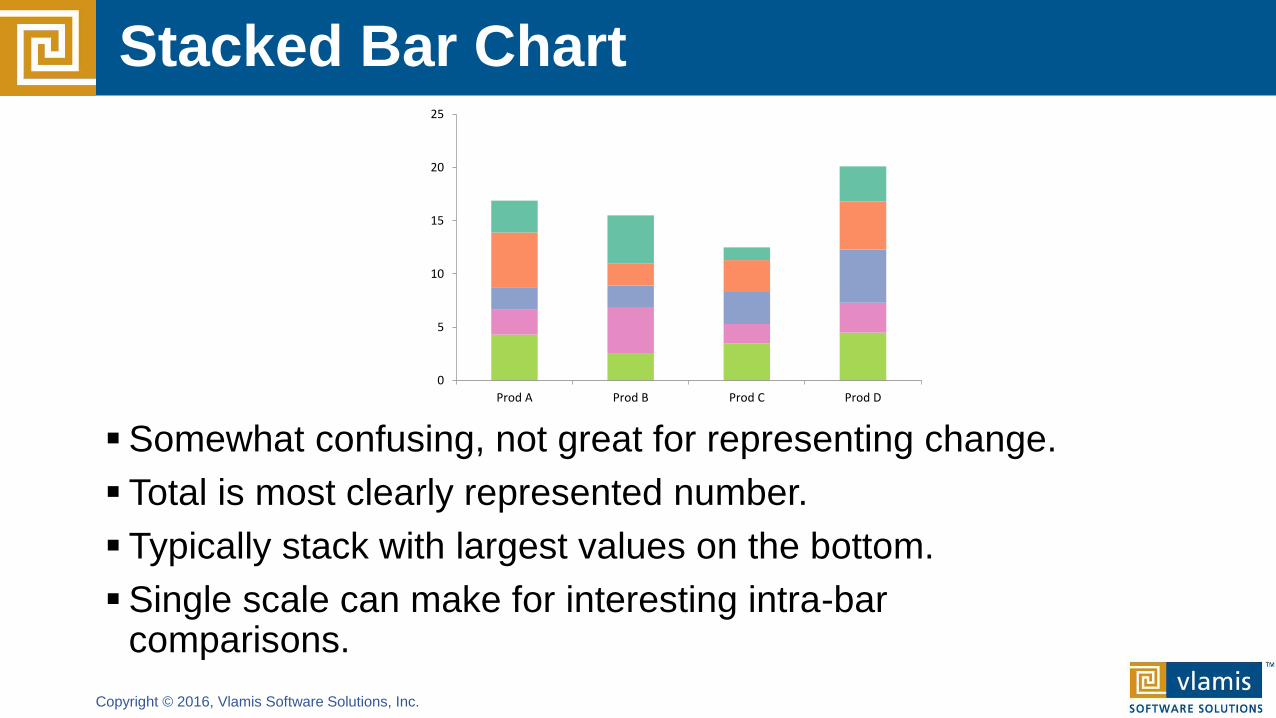
Stacked Bar Chart
▪Somewhat confusing, not great for representing change.
▪ Total is most clearly represented number.
▪ Typically stack with largest values on the bottom.
▪Single scale can make for interesting intra-bar comparisons.
0
5
10
15
20
25
Prod A Prod B Prod C Prod D
Copyright © 2016, Vlamis Software Solutions, Inc.
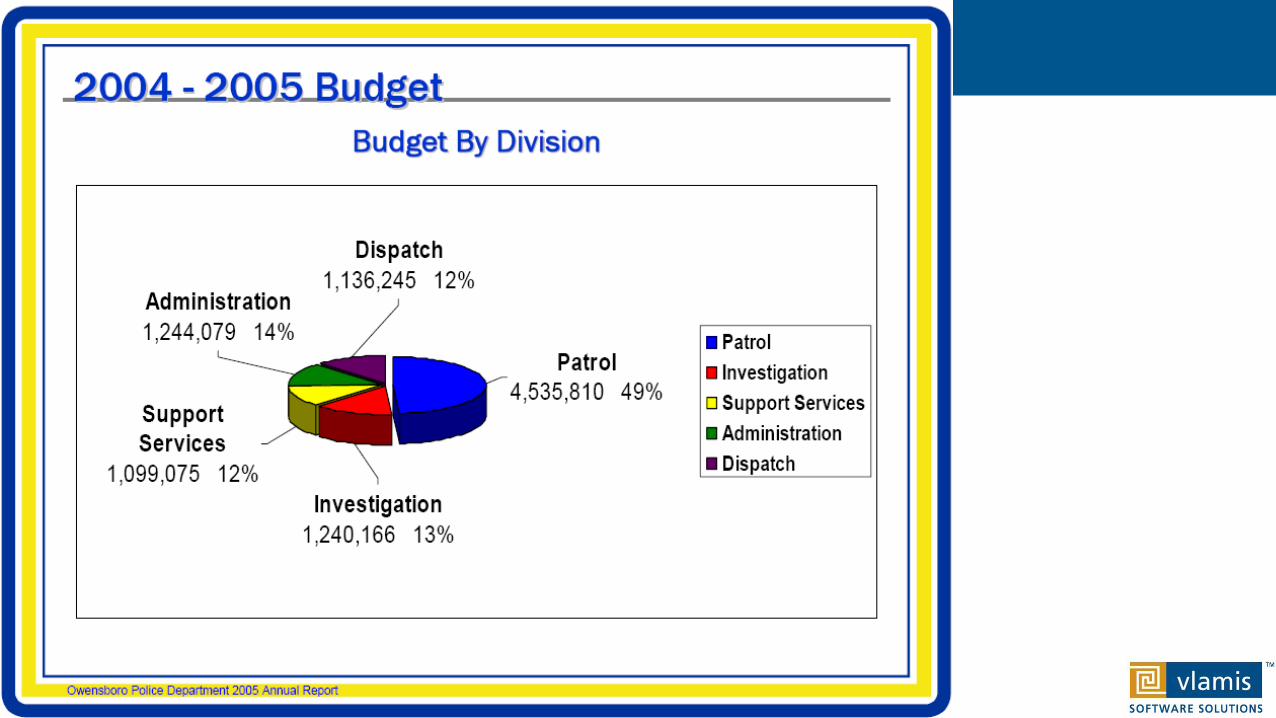
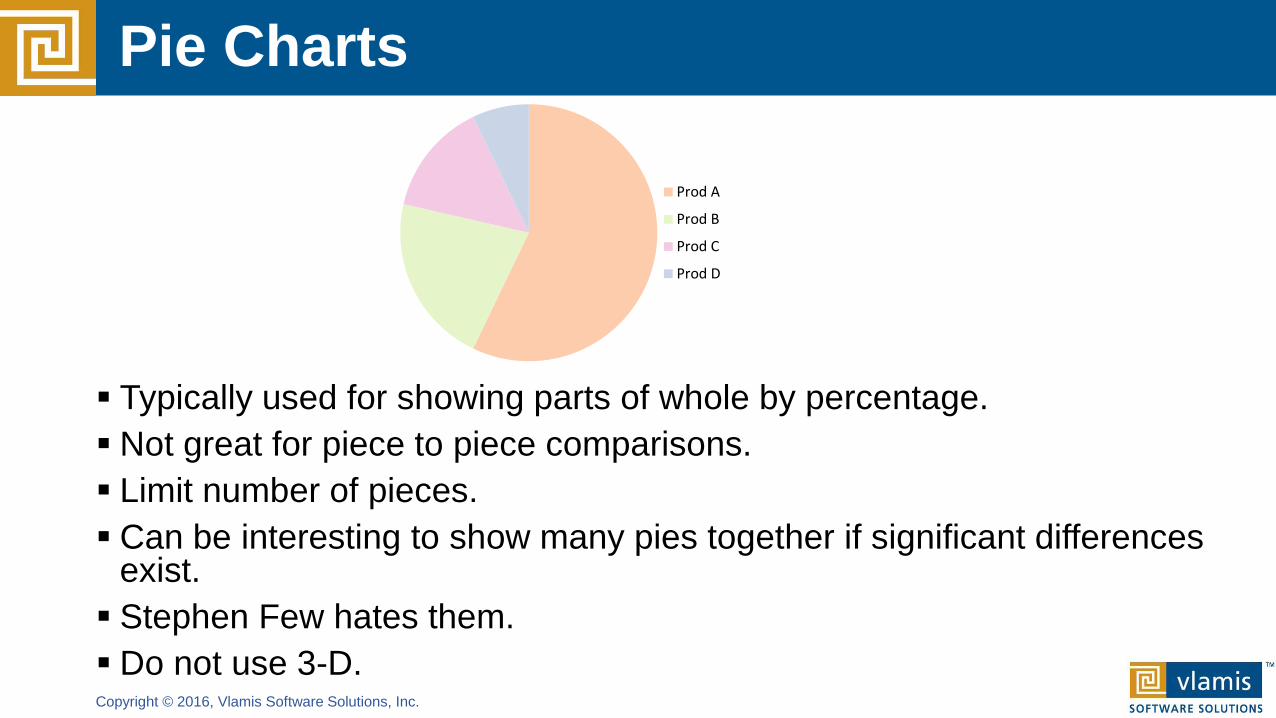
Pie Charts
▪ Typically used for showing parts of whole by percentage.
▪ Not great for piece to piece comparisons.
▪ Limit number of pieces.
▪ Can be interesting to show many pies together if significant differences exist.
▪ Stephen Few hates them.
▪ Do not use 3-D.
Prod A
Prod B
Prod C
Prod D
Copyright © 2016, Vlamis Software Solutions, Inc.
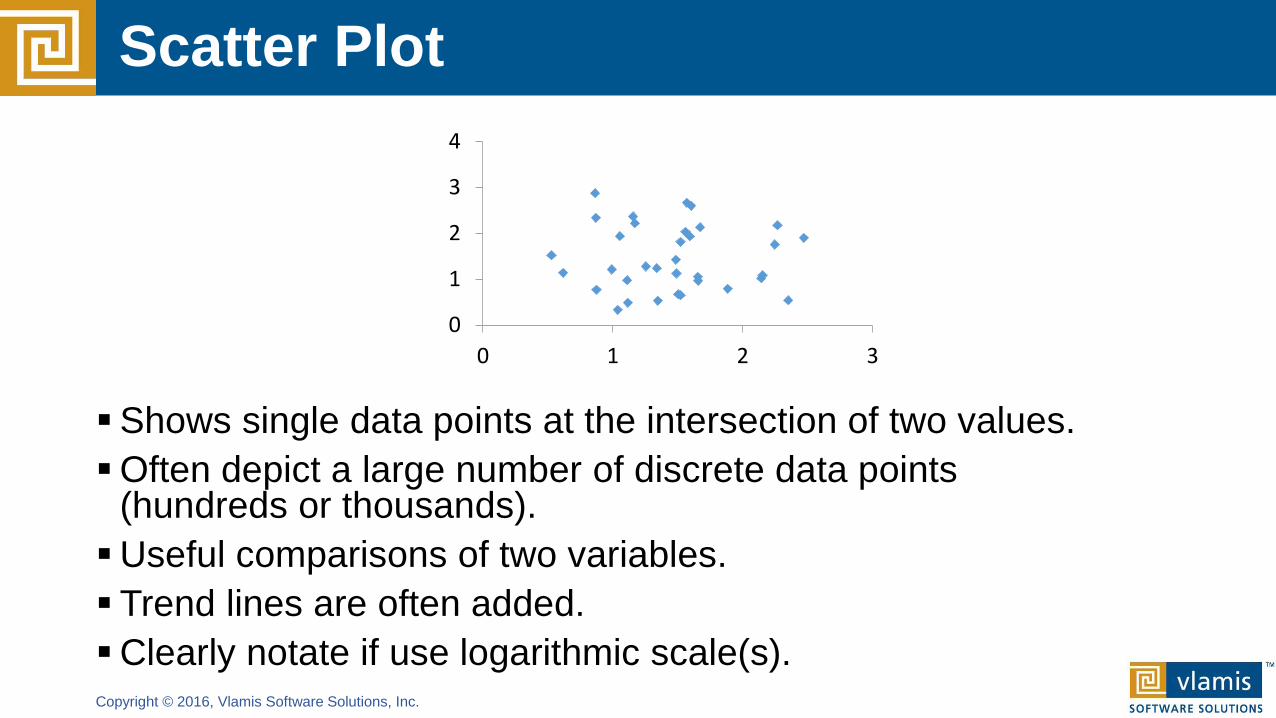
Scatter Plot
▪Shows single data points at the intersection of two values.
▪Often depict a large number of discrete data points (hundreds or thousands).
▪Useful comparisons of two variables.
▪ Trend lines are often added.
▪Clearly notate if use logarithmic scale(s).
0
1
2
3
4
0 1 2 3
Copyright © 2016, Vlamis Software Solutions, Inc.
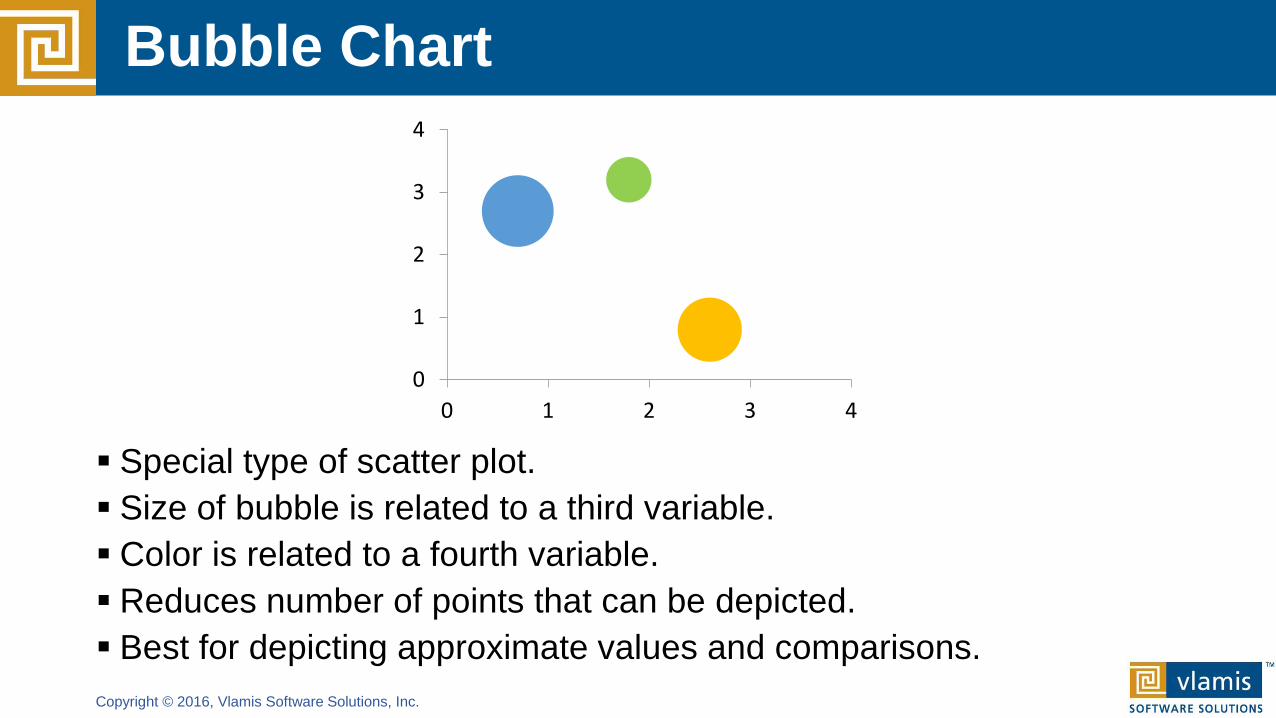
Bubble Chart
▪ Special type of scatter plot.
▪ Size of bubble is related to a third variable.
▪ Color is related to a fourth variable.
▪ Reduces number of points that can be depicted.
▪ Best for depicting approximate values and comparisons.
0
1
2
3
4
0 1 2 3 4
Copyright © 2016, Vlamis Software Solutions, Inc.
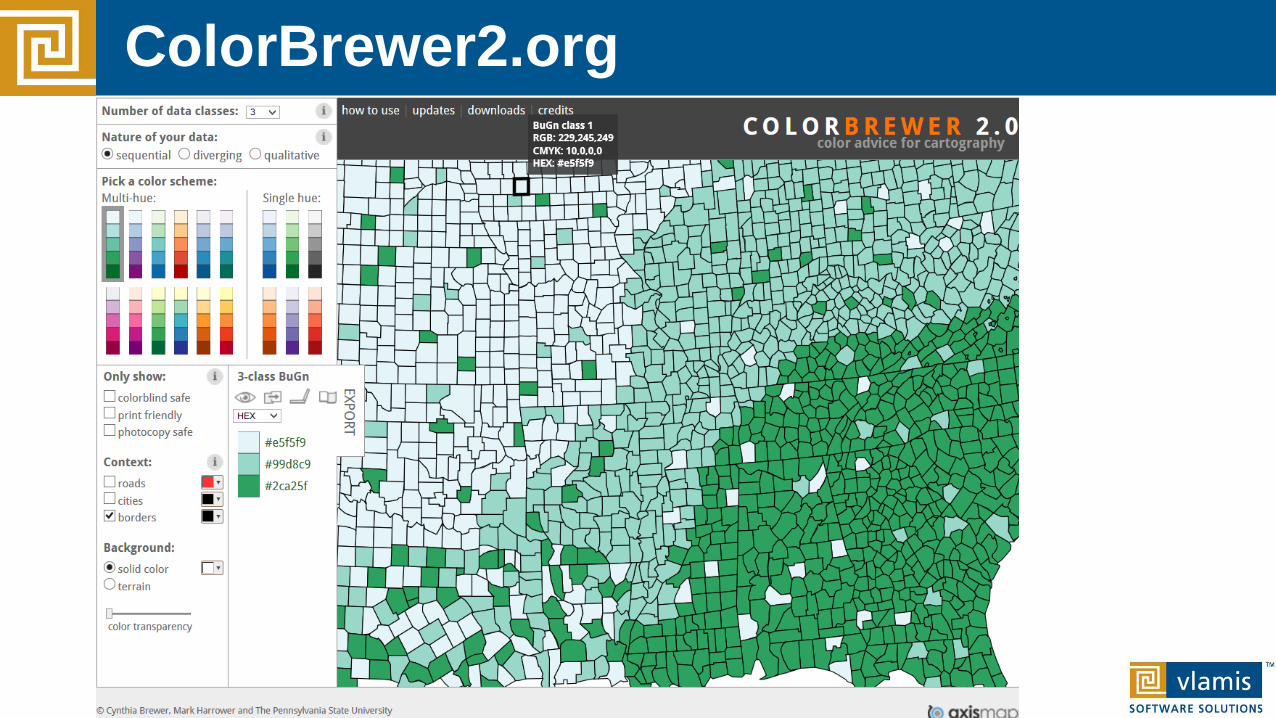
ColorBrewer2.org
Copyright © 2016, Vlamis Software Solutions, Inc.
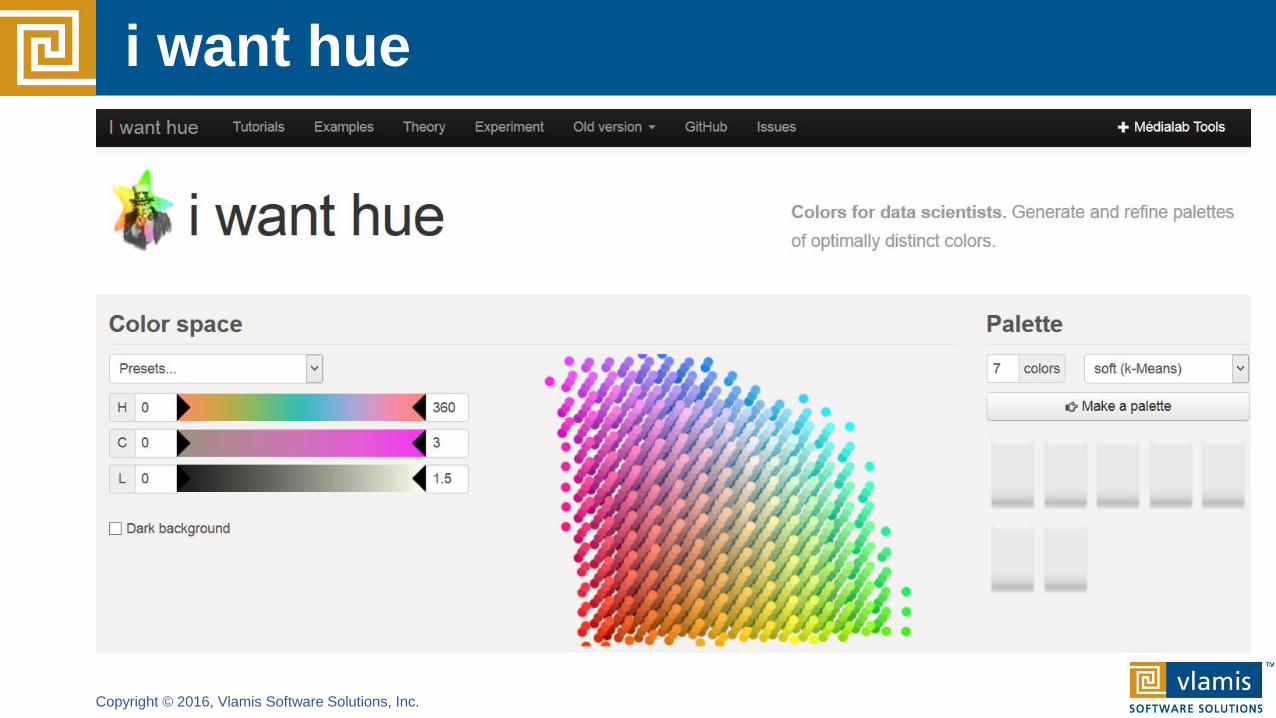
i want hue
Copyright © 2016, Vlamis Software Solutions, Inc.
Dashboard Definition
A Dashboard is a visual presentation of current summary information needed to manage and guide an organization or activity.
Copyright © 2016, Vlamis Software Solutions, Inc.
BI Dashboards are Different
▪No mechanical systems needed to move indicators.
▪Decisions are not typically made on a second-to-second basis.
▪BI dashboards are not primarily single situation or single person devices.
Copyright © 2016, Vlamis Software Solutions, Inc.
BI Dashboards
▪Role-based.
▪Data selection and filtering are extremely important.
▪Dashboards support evidenced-based decision making.
▪Shared understanding of business situation is a key benefit.
▪Content may be individualized.
▪Design should be standardized.
Copyright © 2016, Vlamis Software Solutions, Inc.
OBIEE Dashboard Overview
▪Designed with columns and sections (containers).
▪Presentation server is often separate from BI server.
▪Dashboards are web-based and are viewed with browsers.
▪HTML, XML, and Java coding skills are useful, but not required.
Copyright © 2016, Vlamis Software Solutions, Inc.
Dashboard Principles
▪Promote user interactivity▪ Prompts▪ View and column selectors▪ Hierarchical column drills▪ Column sorts▪ Guided navigation and action links
▪Promote data transparency▪ Prompts▪ Filter views▪ Narrative views▪ Master detail linking
▪Establish design guidelines for consistency
Copyright © 2017, Vlamis Software Solutions, Inc.
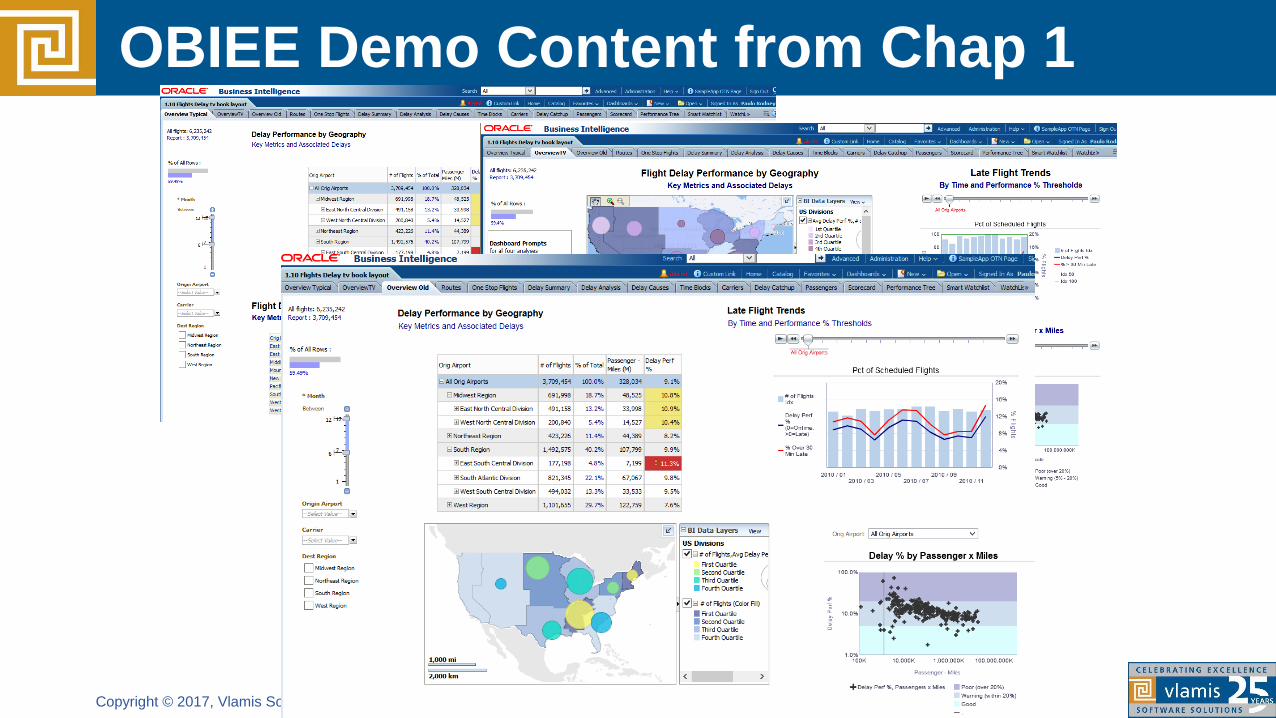
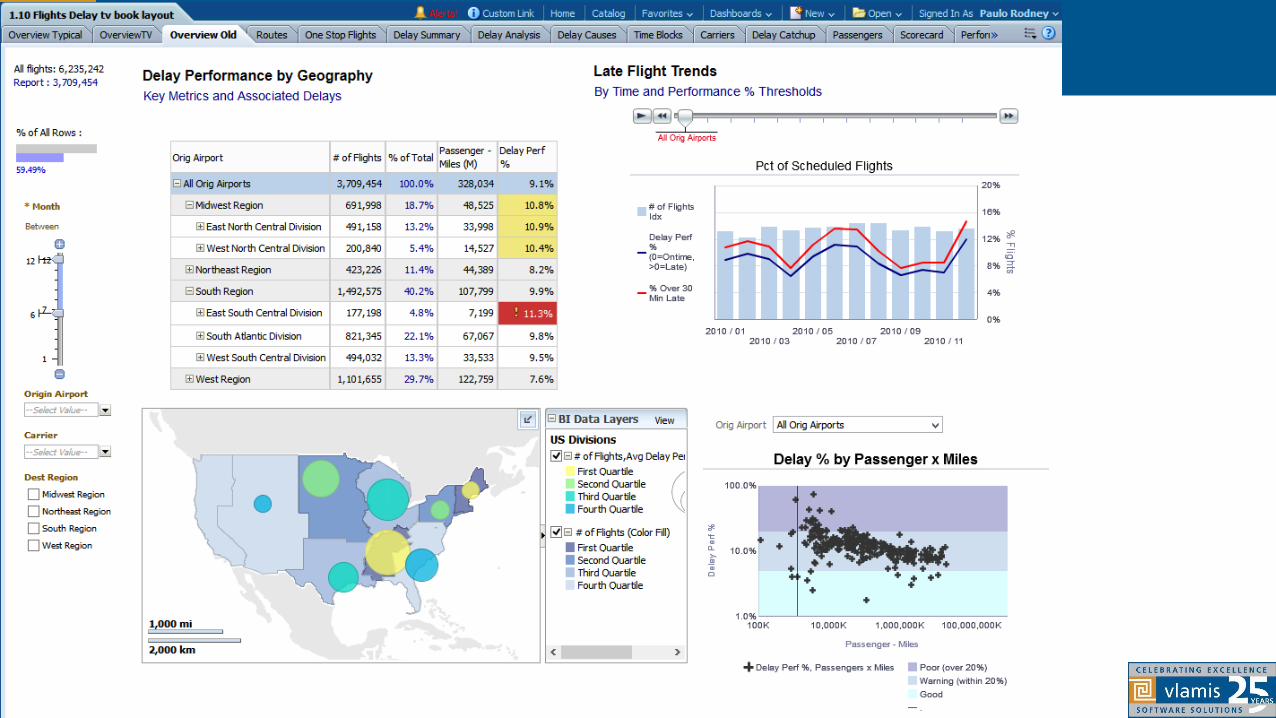
OBIEE Demo Content from Chap 1
Copyright © 2017, Vlamis Software Solutions, Inc.
Copyright © 2017, Vlamis Software Solutions, Inc.
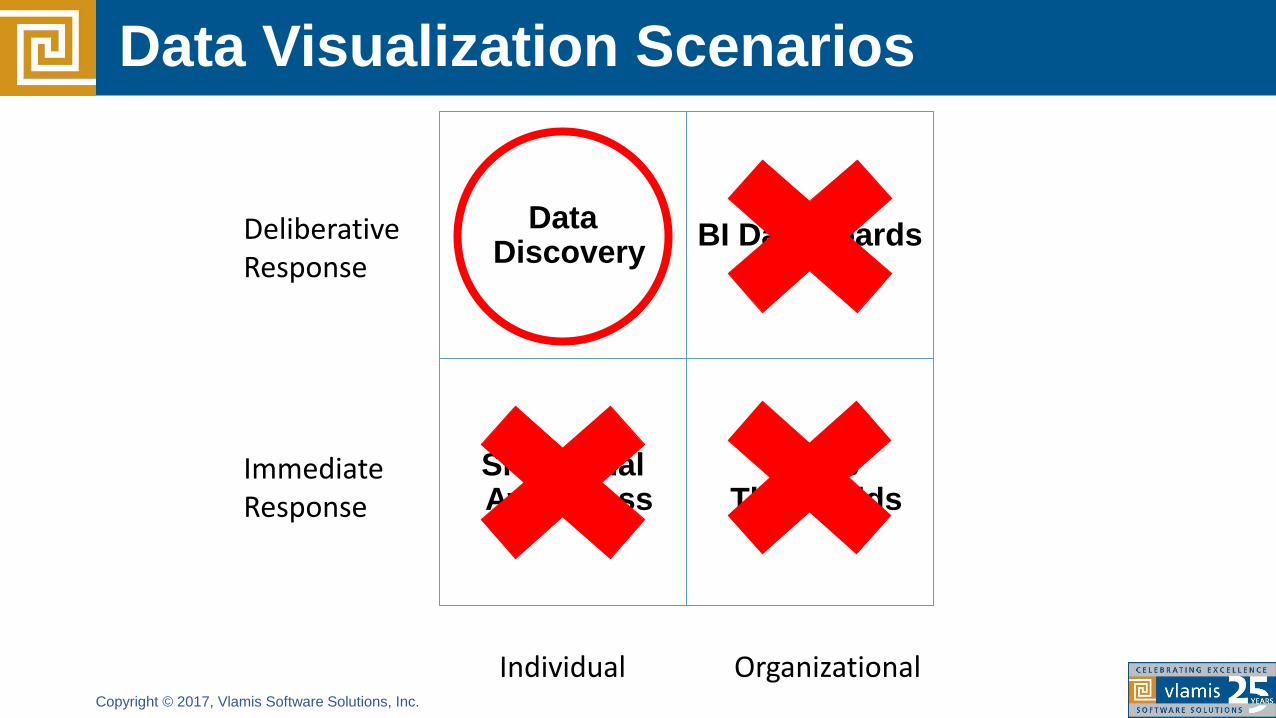
Data Visualization Scenarios
Data Discovery
BI Dashboards
Situational Awareness
Alerts Thresholds
Individual Organizational
Immediate Response
Deliberative Response
Copyright © 2017, Vlamis Software Solutions, Inc.
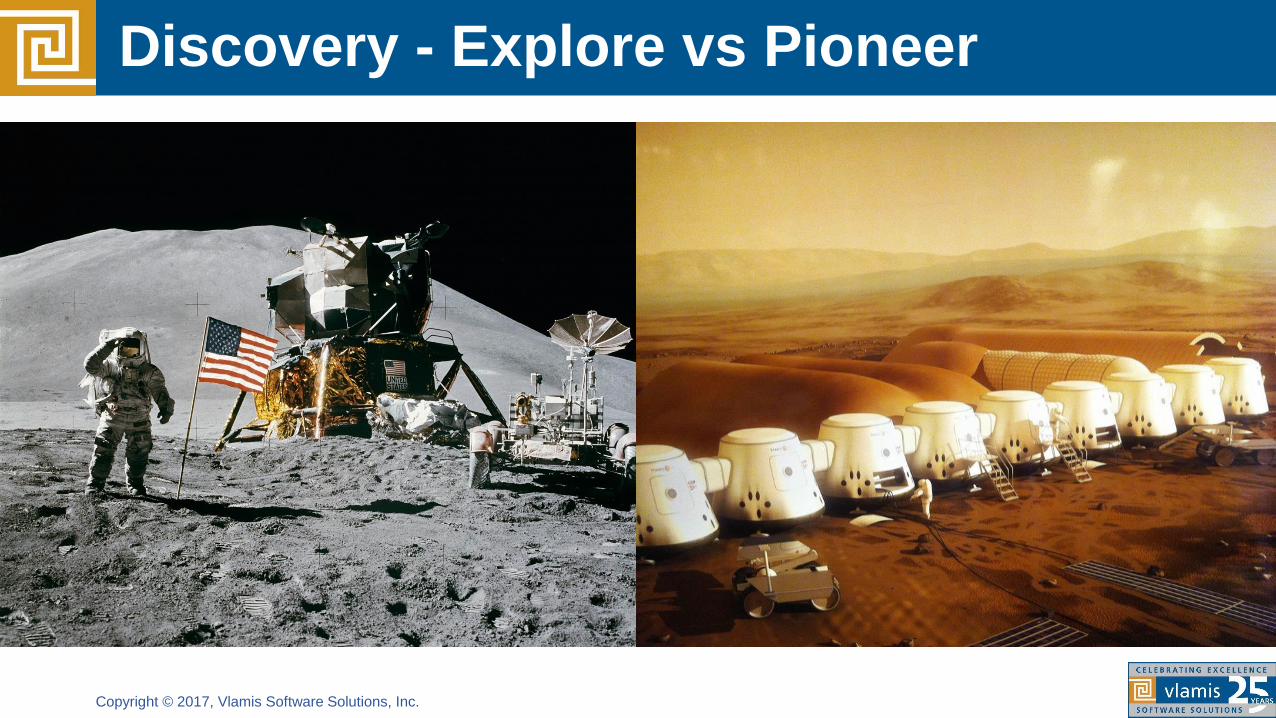
Discovery - Explore vs Pioneer
Copyright © 2017, Vlamis Software Solutions, Inc.
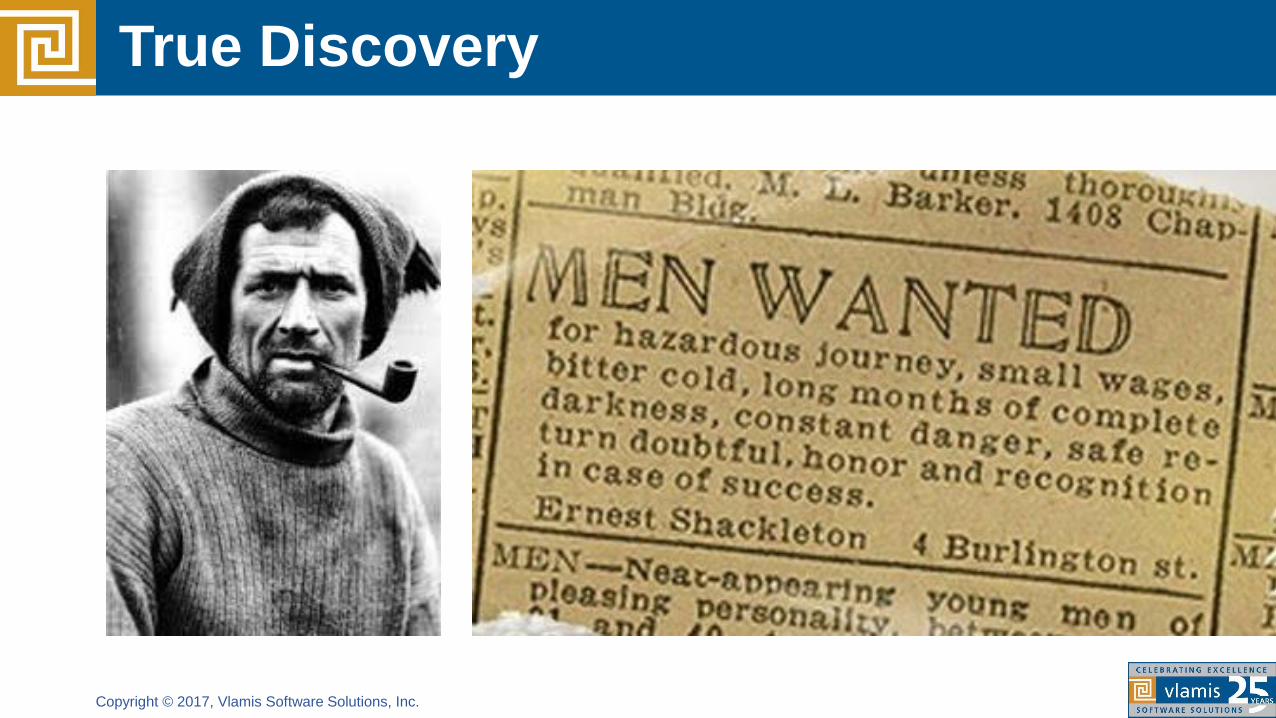
True Discovery
Copyright © 2017, Vlamis Software Solutions, Inc.
Data Discovery Sequence
▪ “Skim” the entire data set to get a sense of its size and scope
▪ “Read” the data set a second time more carefully▪ Identify facts/measures▪ Transaction/event records included?▪ Identify major dimensions
▪Make a list of potentially important or interesting business issues/implications
▪Compare your original business issues with your new list
▪Apply useful frameworks
▪ Transform data and add new data
▪Apply useful frameworks
Copyright © 2017, Vlamis Software Solutions, Inc.
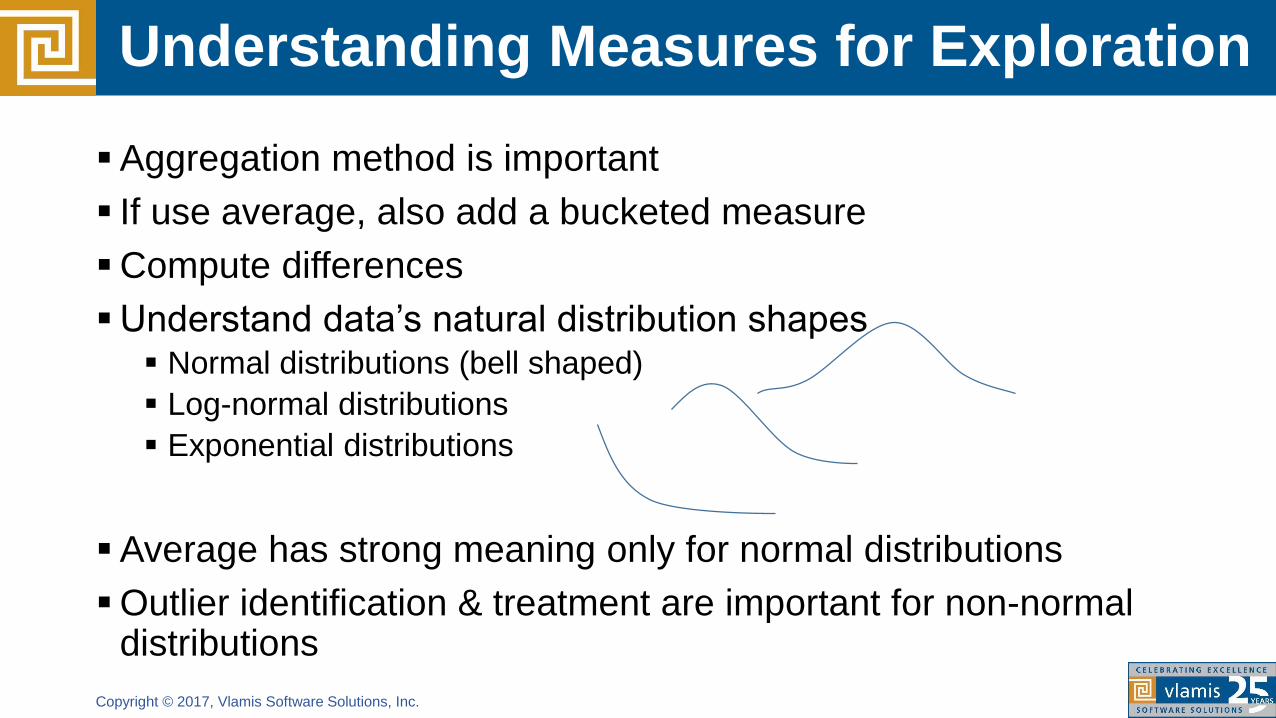
Understanding Measures for Exploration
▪Aggregation method is important
▪ If use average, also add a bucketed measure
▪Compute differences
▪Understand data’s natural distribution shapes▪ Normal distributions (bell shaped)
▪ Log-normal distributions
▪ Exponential distributions
▪Average has strong meaning only for normal distributions
▪Outlier identification & treatment are important for non-normal distributions

Copyright © 2017, Vlamis Software Solutions, Inc.
Demo
Copyright © 2017, Vlamis Software Solutions, Inc.
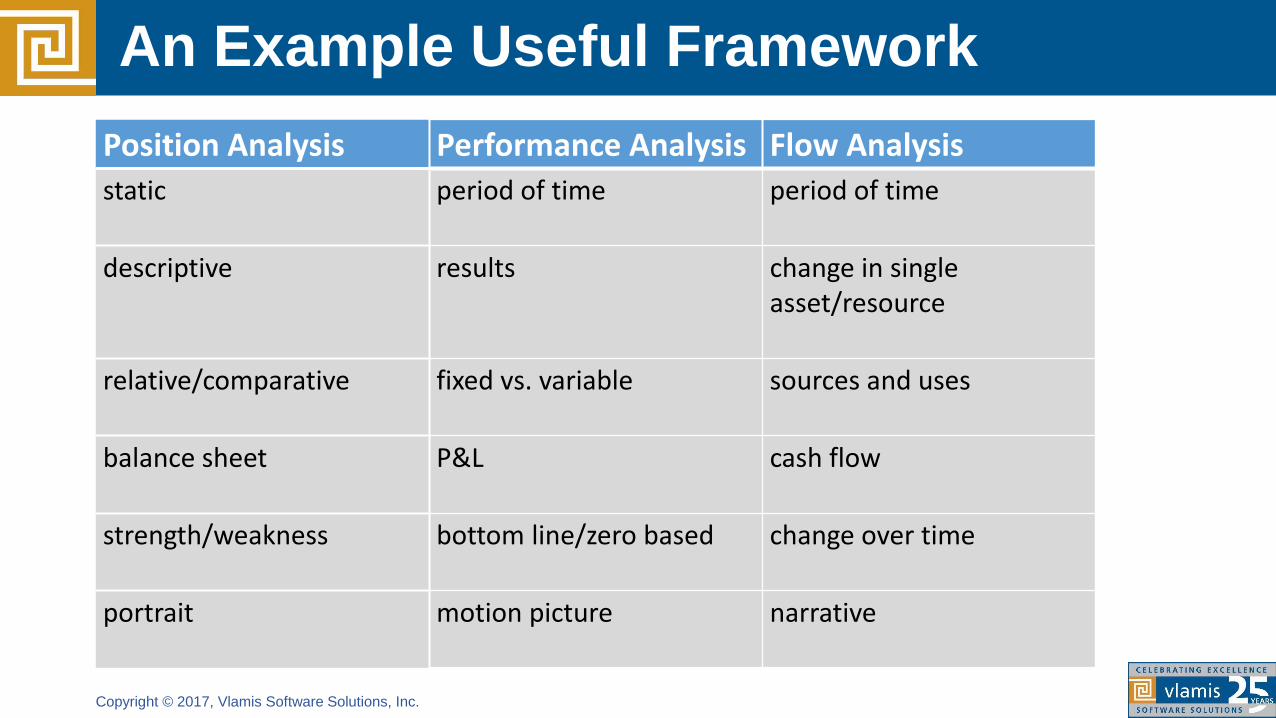
An Example Useful Framework
Position Analysis Performance Analysis Flow Analysis
static period of time period of time
descriptive results change in single asset/resource
relative/comparative fixed vs. variable sources and uses
balance sheet P&L cash flow
strength/weakness bottom line/zero based change over time
portrait motion picture narrative
Copyright © 2017, Vlamis Software Solutions, Inc.
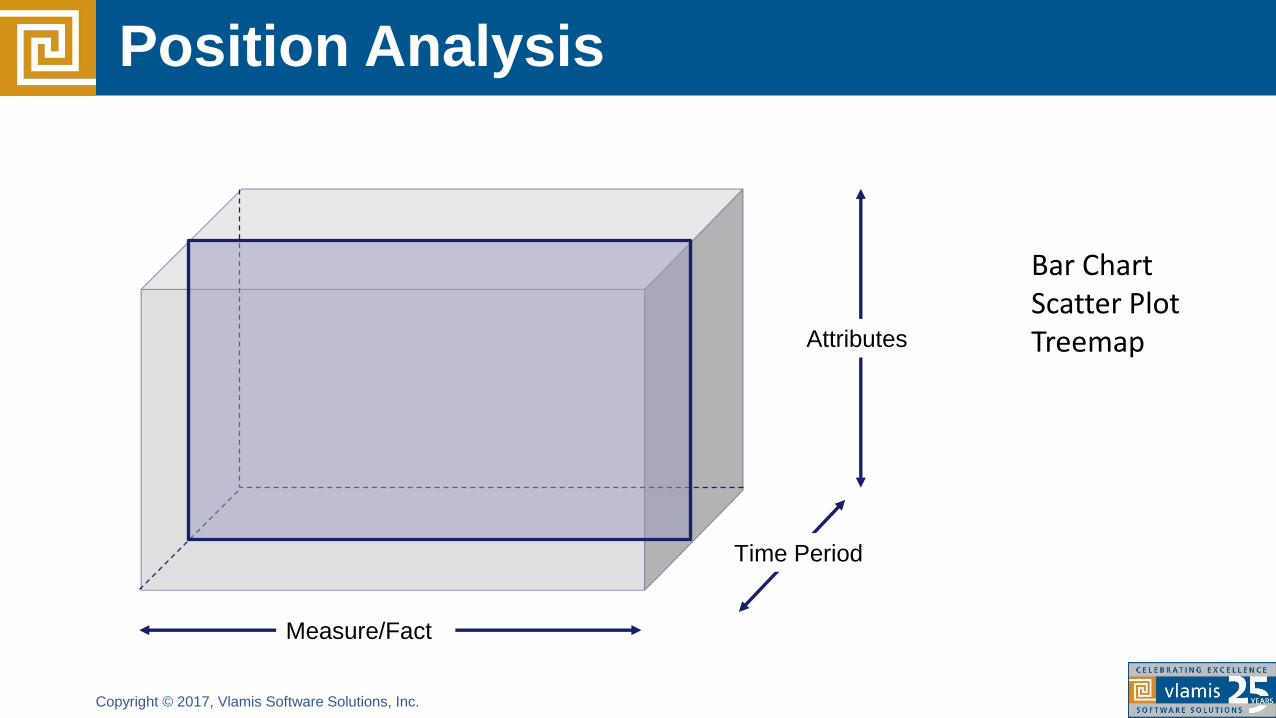
Position Analysis
Measure/Fact
Attributes
Time Period
Bar ChartScatter PlotTreemap
Copyright © 2017, Vlamis Software Solutions, Inc.
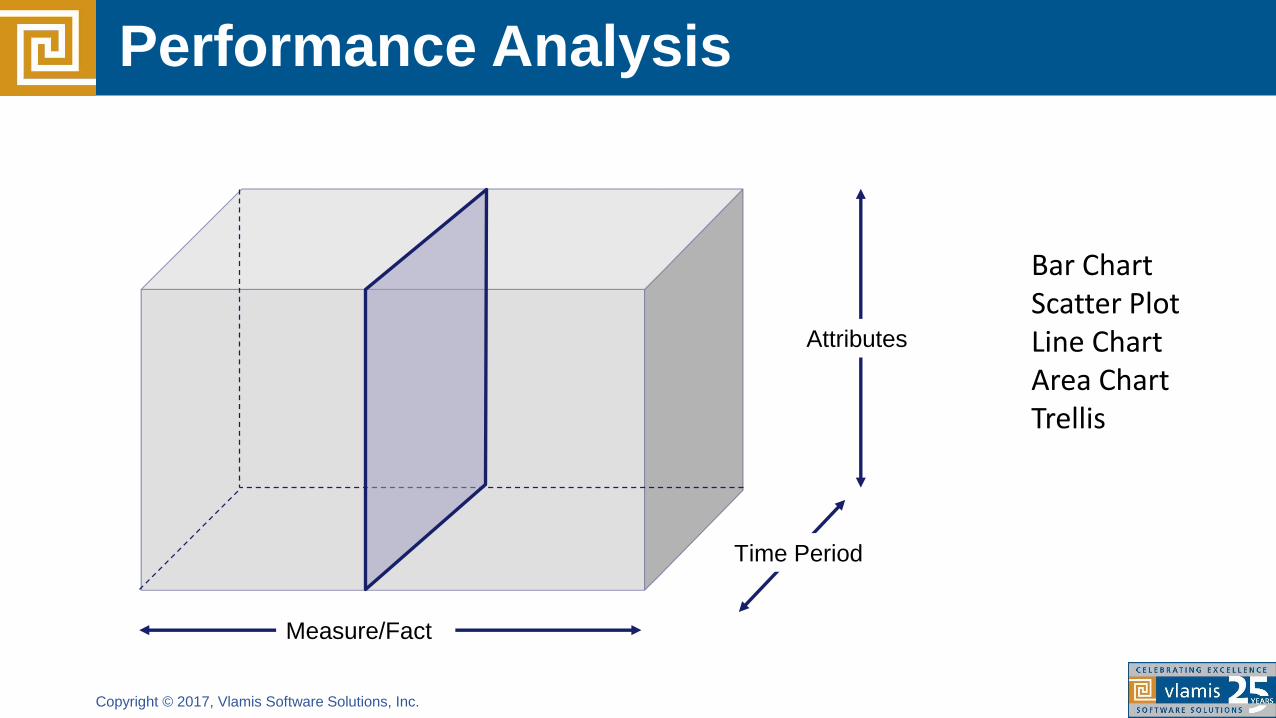
Performance Analysis
Measure/Fact
Attributes
Time Period
Bar ChartScatter PlotLine ChartArea ChartTrellis
Copyright © 2017, Vlamis Software Solutions, Inc.
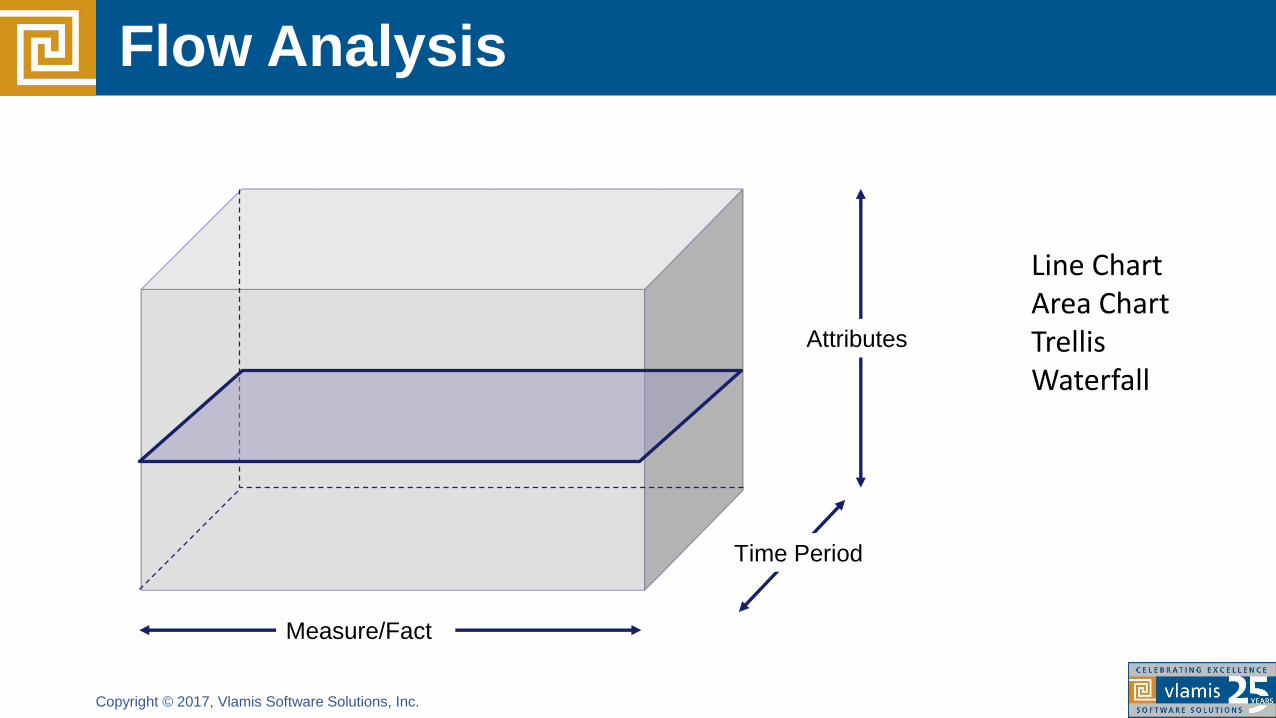
Flow Analysis
Measure/Fact
Attributes
Time Period
Line ChartArea ChartTrellisWaterfall
Copyright © 2017, Vlamis Software Solutions, Inc.
Well Established Frameworks
▪Key Performance Indicator (KPI) Development (business)
▪Root cause analysis (science)
▪Diagnostic analytics (science)
Copyright © 2017, Vlamis Software Solutions, Inc.
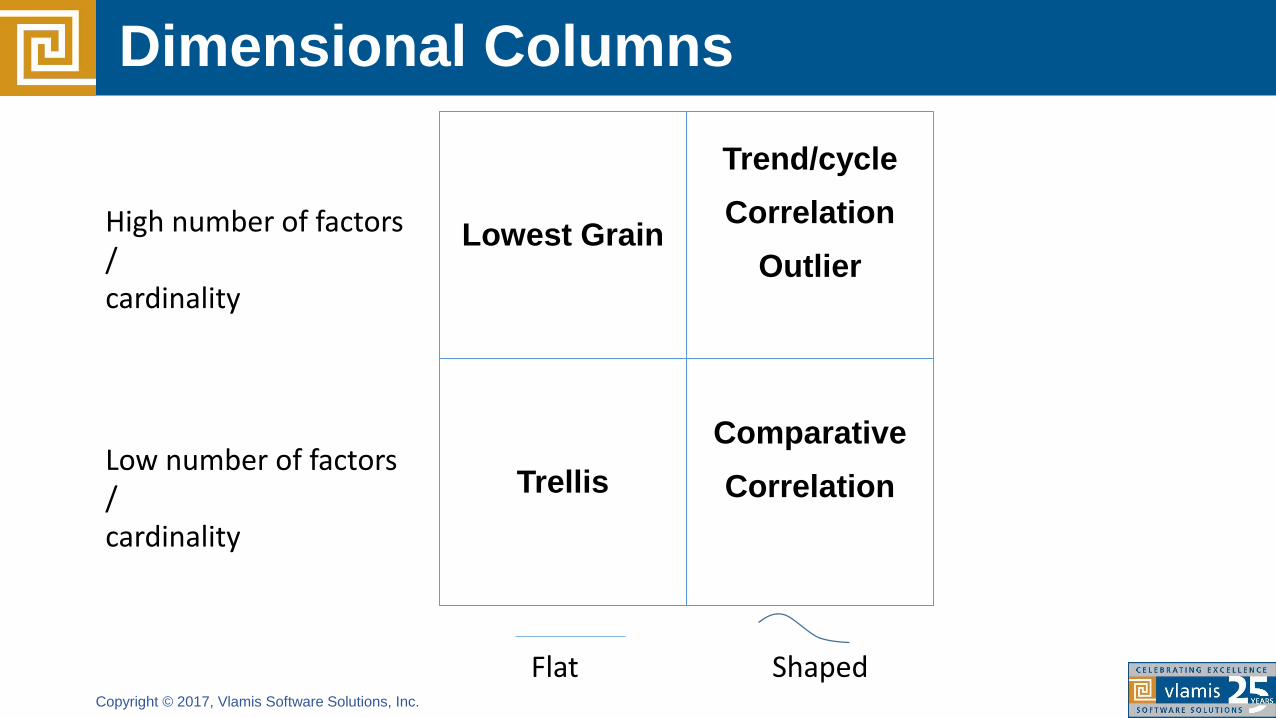
Dimensional Columns
Lowest Grain
Trend/cycle
Correlation
Outlier
Trellis
Comparative
Correlation
Flat Shaped
Low number of factors/cardinality
High number of factors/cardinality
Copyright © 2017, Vlamis Software Solutions, Inc.
Demo
Copyright © 2017, Vlamis Software Solutions, Inc.
Keys to Data Discovery
▪ Identify your main topic of interest with a performance tile
▪Summary
▪Evaluating a fact or a dimension?▪ Sales analysis▪ Customer or product analysis
▪ Fact analysis▪ Find lowest grain▪ Flat low distribution▪ Event or transaction
▪ Look for clustered distribution▪ Scatter with points as event in fact table
▪ Set fact on X axis and response variable on Y axis
Copyright © 2017, Vlamis Software Solutions, Inc.
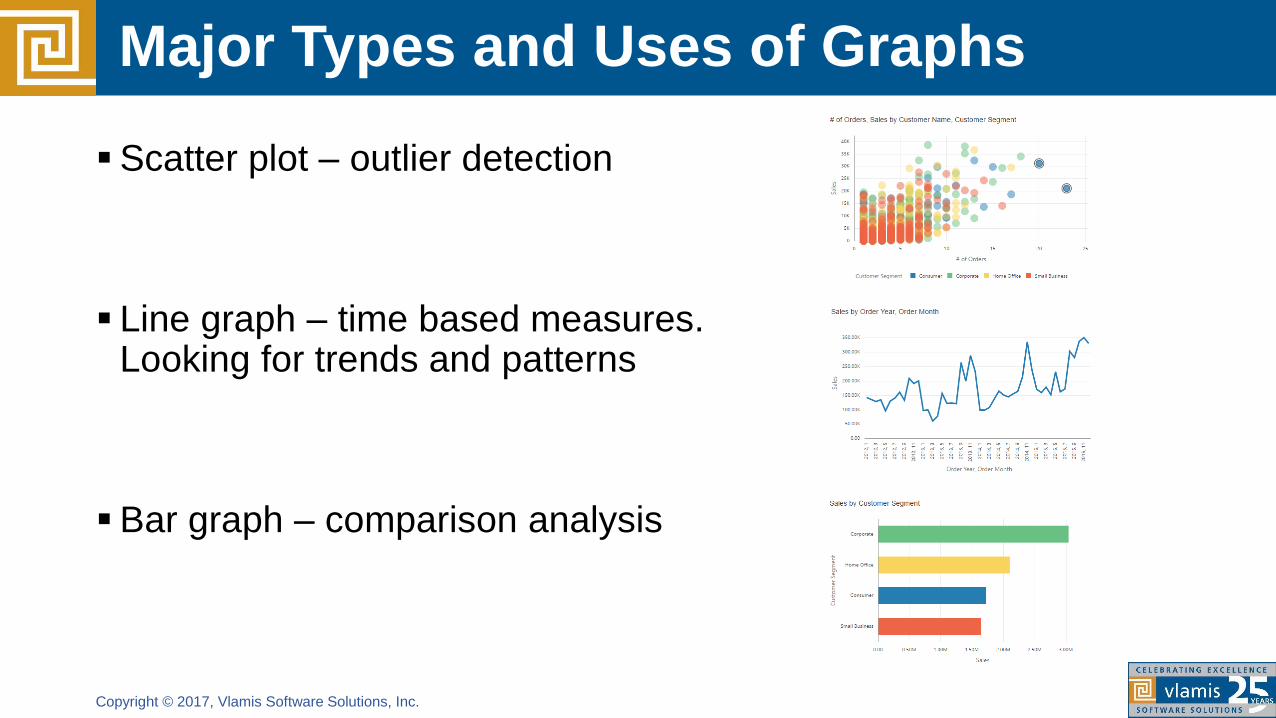
Major Types and Uses of Graphs
▪Scatter plot – outlier detection
▪ Line graph – time based measures. Looking for trends and patterns
▪Bar graph – comparison analysis
Copyright © 2017, Vlamis Software Solutions, Inc.
Starting with Data Discovery
▪Begin either with a specific question or a framework
▪Avoid “wandering around”
▪Most of your visualizations will not produce new insights
▪Move quickly through visualizations
▪Be prepared to open a lot of browser tabs
Copyright © 2017, Vlamis Software Solutions, Inc.
Finding is not Explaining
▪Process of interaction has a huge impact on the contextual
understanding of an insight
▪When someone discovers something, they believe it more
▪Human Cognition Biases
Copyright © 2017, Vlamis Software Solutions, Inc.
Oracle Test Drive
▪ Free to try Oracle BICS, Oracle Advanced Analytics
▪Go to www.vlamis.com/td
▪Runs on Oracle Cloud
▪ Test Drives for:▪ Oracle BICS
▪ Oracle Advanced Analytics (initially Oracle Data Mining)
▪Once sign up, you can access for 24 hours
▪Click by click script included, but can go “off road”
▪ Faster and easier than official Oracle “trial web account”
Copyright © 2017, Vlamis Software Solutions, Inc.
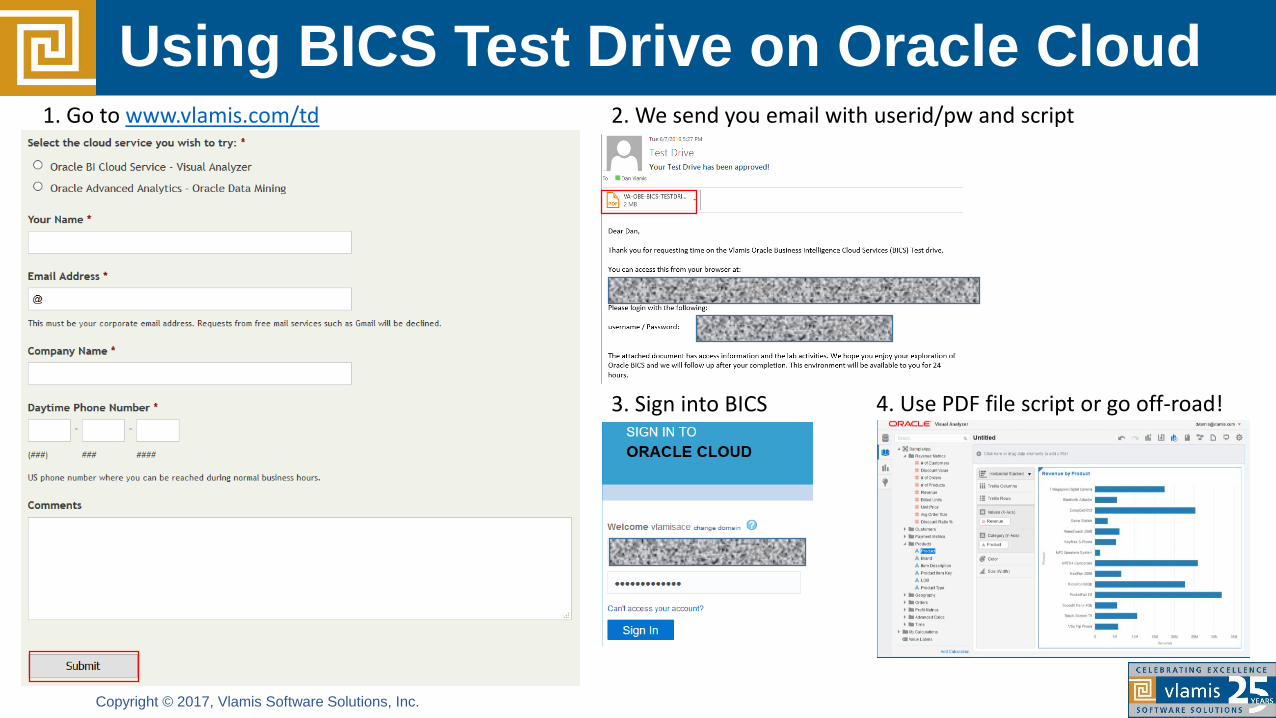
Using BICS Test Drive on Oracle Cloud1. Go to www.vlamis.com/td 2. We send you email with userid/pw and script
3. Sign into BICS 4. Use PDF file script or go off-road!
Copyright © 2017, Vlamis Software Solutions, Inc.
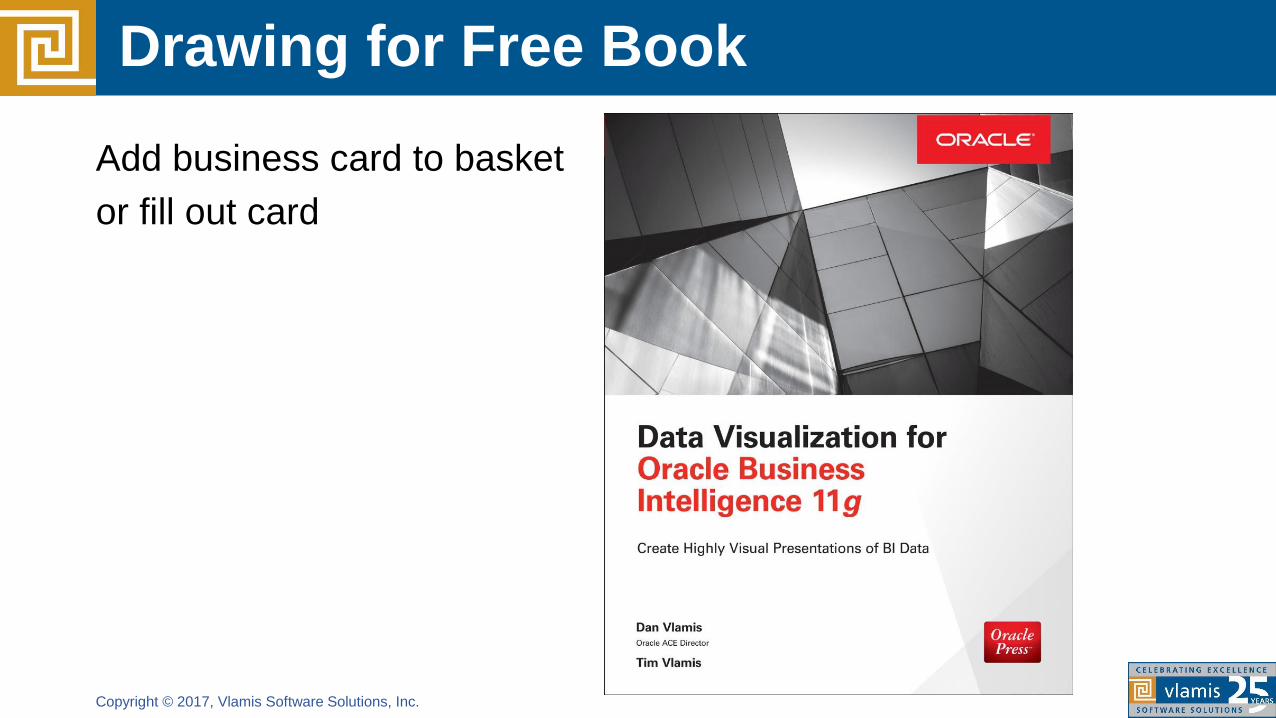
Drawing for Free Book
Add business card to basket
or fill out card
Copyright © 2017, Vlamis Software Solutions, Inc.
Questions?
Copyright © 2017, Vlamis Software Solutions, Inc.
Thank You!
Data Visualization Best Practices
Tim Vlamis
www.vlamis.com
@timvlamis
@VlamisSoftware