Embed Size (px)
Citation preview

DATA UPDATE AND ON-SITE FEASIBILITY REPORT SALTESE FLATS WETLAND RESTORATION INVESTIGATION Spokane County, Washington Prepared for: SPOKANE COUNTY DIVISION OF UTILITIES PUBLIC WORKS BUILDING 1026 W. BROADWAY AVE. SPOKANE WA 99260 Prepared by:
1120 Cedar Street Missoula, MT 5802 15320 East Marietta Ave, Suite 9A Spokane Valley, WA 99216-1870 January 2010 Project No. 100002604
Data Update and On-Site Feasibility Report Saltese Flats Wetland Restoration Investigation
CONTENTS Page
1.0 INTRODUCTION ............................................................................................................................... 1
1.1 Purpose and Scope ...................................................................................................................... 1 1.2 Additional Data Sources .............................................................................................................. 5
2.0 ADDITIONAL DATA SUMMARY .................................................................................................. 6
2.1 Topographic Surveys................................................................................................................... 8 2.2 Photographic Documentation ...................................................................................................... 9 2.3 Meteorological Data Compilation ............................................................................................. 10 2.4 Soil Borings and Well Installations ........................................................................................... 12 2.5 Wetland Delineation .................................................................................................................. 12 2.6 Surface Water Stage and Discharge .......................................................................................... 16 2.7 Water Management at Saltese Flats .......................................................................................... 22 2.8 Groundwater Levels .................................................................................................................. 24 2.9 Water Quality ............................................................................................................................ 27
3.0 WATER BUDGET ........................................................................................................................... 32
3.1 Methodology ............................................................................................................................. 32 3.2 Water Budget Scenarios ............................................................................................................ 34 3.3 Shelley Lake and Gravel Pit Infiltration .................................................................................... 41
4.0 RESTORATION FEASIBILITY SCREENING ............................................................................... 44
4.1 Restoration Scenario Alternatives ............................................................................................. 44 4.2 Screening Criteria ...................................................................................................................... 44 4.3 Option A Alternatives ............................................................................................................... 44 4.4 Option B Alternatives ................................................................................................................ 45 4.5 Option C Alternatives ................................................................................................................ 46 4.6 Preferred Restoration Alternatives ............................................................................................ 46 4.7 Review of Washington State Reclaimed Water Use Standards ................................................ 46
5.0 CONCLUSIONS AND RECOMMENDATIONS ............................................................................ 48
6.0 REFERENCES .................................................................................................................................. 50
APPENDICES APPENDIX A Topographic Maps APPENDIX B Example Photographic Documentation APPENDIX C Soil Boring Logs APPENDIX D Analytical Data and Laboratory Reports APPENDIX E Wetland Delineation Maps, Forma, and Photos APPENDIX F Surface Water Levels and Discharge Data and Groundwater Elevation Data APPENDIX G Water Budget Scenarios
January 2010 ii .00

Data Update and On-Site Feasibility Report Saltese Flats Wetland Restoration Investigation
January 2010 iii .00
TABLES Table 2-1. Annual Precipitation at Liberty Lake ....................................................................................... 10 Table 2-2. Monthly Precipitation at Pine Terrace, Spokane, and Coeur d’Alene ...................................... 10 Table 2-3. Cowardin Vegetation Types Within Routine Mapping Areas .................................................. 13 Table 2-4. Cowardin Vegetation Types Within Reconnaissance Mapping Areas ..................................... 14 Table 2-5. Surface Water Monitoring Locations ....................................................................................... 17 Table 2-6. Discharge Comparison Between Saltese Flats and Liberty Creek............................................ 18 Table 2-7. Saltese Flats Flow Estimates .................................................................................................... 22 Table 2-8. Preliminary Annual Groundwater Level Fluctuation Estimates ............................................... 26 Table 2-9. Offsite Well Summary .............................................................................................................. 27 Table 2-10. Synoptic Nutrient Sampling Results for Saltese Flats ............................................................ 29 Table 3-1. Average Outflow (cfs) from Saltese Flats by Modeling Scenario ............................................ 35 Table 3-2. Average Outflow (Ac-Ft) from Saltese Flats by Modeling Scenario ....................................... 35 Table 3-3. Summary of Shelley Lake Infiltration Rate Calculations ......................................................... 42
FIGURES Figure 1-1. Saltese Flats Location................................................................................................................ 2 Figure 1-2. Saltese Flats Watershed Delineation ......................................................................................... 3 Figure 1-3. Saltese Flats Restoration Options .............................................................................................. 4 Figure 2-1. Regional Monitoring and Data Source Locations ..................................................................... 6 Figure 2-2. Saltese Flats Monitoring and Data Source Locations ............................................................... 7 Figure 2-3. Saltese Flats Photo-Point Locations .......................................................................................... 9 Figure 2-4. Average Monthly Precipitation at Stations Surrounding Saltese Flats ................................... 11 Figure 2-5. Precipitation Cumulative Departure Plots ............................................................................... 11 Figure 2-6. Watershed and Surface Water Related to Saltese Flats ........................................................... 16 Figure 2-7. Liberty Creek Discharge Data ................................................................................................. 18 Figure 2-8. Liberty Creek Discharge Data ................................................................................................. 19 Figure 2-9. Water Levels for Liberty Creek and Saltese Flats Inlets ......................................................... 19 Figure 2-10. Water Levels for Shelley Lake and Saltese Flats Outlets...................................................... 20 Figure 2-11. Water Levels for Shelley Lake and Saltese Flats Outlets...................................................... 21 Figure 2-12. Saltese Flats Water Management Features ............................................................................ 23 Figure 2-13a. Shallow Groundwater Elevations-May 2009 ...................................................................... 25 Figure 2-13b. Shallow Groundwater Elevations-June 2009 ...................................................................... 25 Figure 2-14. Depth to Groundwater-May 2009 ......................................................................................... 26 Figure 2-15. Piper Diagram of Water Quality Sampling Results .............................................................. 28 Figure 3-1. Water Budget Components for Average Year, Baseline Condition ........................................ 36 Figure 3-2. Water Budget Components for Average Year With 8MGD Reclaimed Water....................... 38 Figure 3-3. Plot of Data for Shelley Lake Infiltration Rate Estimates ....................................................... 41

1.0 INTRODUCTION This document summarizes new data and evaluates feasibility for restoration options at Saltese Flats. Sal-tese Flats is located in Spokane County southeast of the city of Spokane Valley (Figure 1-1). The area known as Saltese Flats occupies roughly 1,200 acres of land that lies within a watershed of approximately 14,000 acres (Figure 1-2). The Flats includes land that functions as wetland today, and also land that historically was a lake/wetland system but has been drained and used for agriculture for over one hundred years. Three wetland restoration options are under evaluation at Saltese Flats (Figure 1-3). Option A is 342 acres, Option B is 512 acres and Option C is approximately 1200 acres. The Saltese Flats Wetland Restoration Investigation has been initiated to evaluate the feasibility of restor-ing the Flats, or portions thereof, to wetlands. Benefits of the restoration are expected to include an im-provement of flow conditions in Saltese Creek and summer lake levels in Shelley Lake, water releases later in the summer to help increase flow in the Spokane River, improved wildlife habitat, educational and recreation opportunities, and a potential location for the beneficial use of reclaimed water. This document represents the completion of the third phase of the Saltese Flats investigation completed by PBS&J under contract with the Spokane County Division of Utilities (Spokane County Utilities) in coordination with the WRIA 55/57 Watershed Implementation Team (WRIA 55/57 WIT), and with fund-ing from the Washington State Department of Ecology (Ecology). Previous phases include:
1. Development of a Scope of Work (PBS&J, 2008a) with subsequent update upon the completion of initial tasks (PBS&J, 2008e);
2. Development of Goals and Objectives for the project (PBS&J, 2008b); 3. A public meeting held on October 15, 2008 to introduce the project to interested parties, and a se-
ries of meetings with the WRIA 55/57 WIT and a group known as the Wetland Panel, which was formed from a collection of stakeholders for this investigation;
4. Development of a Quality Assurance Program Plan, or QAPP (PBS&J, 2008c) and a Monitoring Program Plan (PBS&J, 2008d);
5. Completion of an evaluation and summary of existing information, including a preliminary site characterization and documentation in an Existing Data Review report (PBS&J, 2009); and
6. Initiation of the Monitoring Program. 1.1 Purpose and Scope The purpose of this report is to provide a summary of additional data and potential restoration options for Saltese Flats. It describes a screening process used to evaluate these options and identifies alternatives to be used in developing detailed conceptual designs. Specifically, this phase of the project included the following tasks which are further described in this document:
• Presentation of additional data collected under the Monitoring Program, as part of recommenda-tions in the Existing Data Review report (PBS&J, 2009), or discovered as work on this investiga-tion has progressed;
• An update of the preliminary site characterization presented in the Existing Data Review report; • A description of the selected restoration scenarios with detail provided on water budgets and
management alternatives; • A screening of the selected restoration alternatives with a description of the screening process,
criteria used in the screening, and a summary of where each of the alternatives rank; • Selection of preferred restoration alternatives to be used in developing conceptual designs, and • A summary and recommendations.
January 2010 1 .00
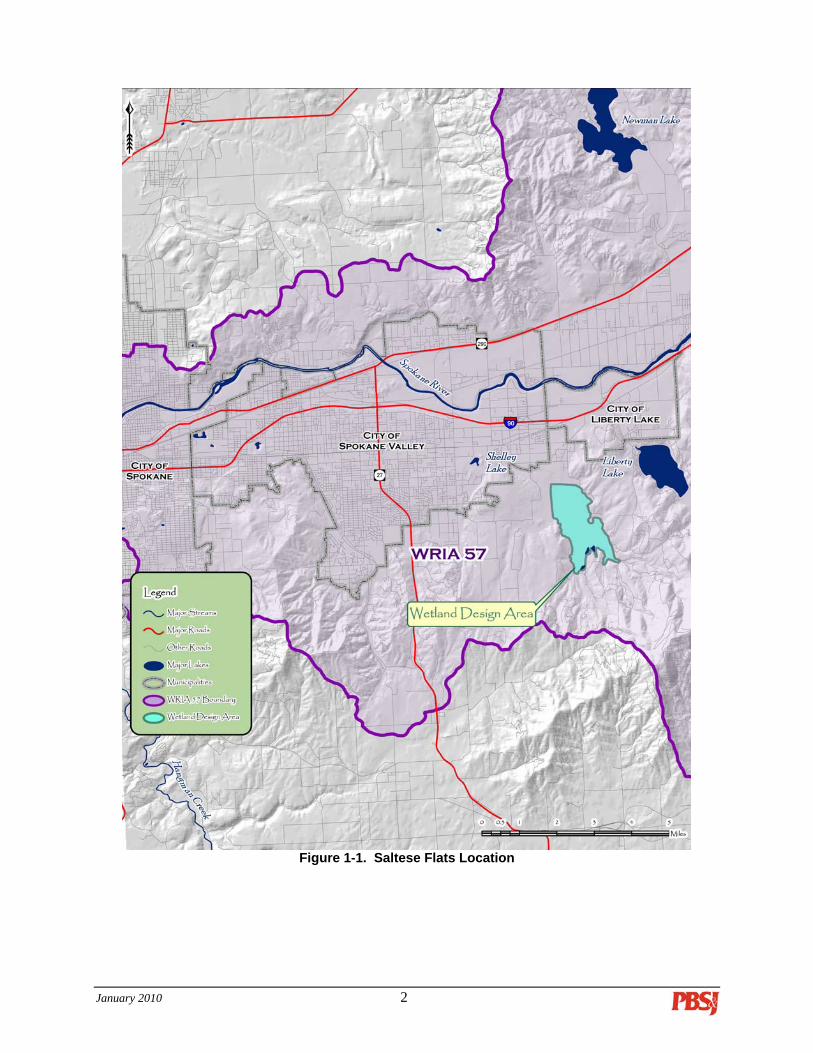
Figure 1-1. Saltese Flats Location
January 2010 2 .00

Figure 1-2. Saltese Flats Watershed Delineation
January 2010 3 .00

Figure 1-3. Saltese Flats Restoration Options
January 2010 4 .00

January 2010 5 .00
1.2 Additional Data Sources As this investigation has proceeded, additional data has been collected to improve the characterization of the site and to facilitate this feasibility study of restoration alternatives. Some of the data have been de-veloped into additional GIS layers or modifications of existing layers, others have been compiled into spreadsheets. Additional data collected for this investigation are summarized in Section 2 and includes:
• Topographic Survey: Ducks Unlimited survey and Spokane County Utilities survey. • Photographic Documentation: Photographs from established photo-points taken under various
seasonal conditions. • Meteorological Data: Updates of data from weather stations at Spokane and Coeur d’Alene, and
data from stations near Liberty Lake provided by Liberty Lake Sewer and Water District. • Soil Data: Descriptions from soil boring program, soil sample collection and lab analyses. • Wetland Delineation: Detailed site survey of wetland conditions. • Surface Water Data: On-site water level monitoring, discharge measurements, and water quality
sampling; Shelley Lake level data from Shelley Lake Homeowners Association; data from Liber-ty Lake Sewer and Water District for Liberty Lake area.
• Groundwater Data: On-site groundwater level monitoring and water quality sampling; downgra-dient SVRP aquifer water quality data from Spokane County Utilities.
Note: The horizontal datum used in this report is NAD83 HARN (High Accuracy Reference Network) unless specified differently. The coordinate system is Washington State Plane. The vertical datum used in this report is NAVD88 unless specified differently.
Data Update and On-Site Feasibility Report Saltese Flats Wetland Restoration Investigation
January 2010 6 .00
2.0 ADDITIONAL DATA SUMMARY This section presents a summary of additional data as noted in Section 1.2. These data have been used to develop an updated interpretation of site conditions. The data and information gathered are of both a site-specific (Saltese Flats) and regional nature. Due to the large volume of information available, not all of the data gathered are presented in detail. Monitoring program data source locations discussed in this sec-tion are shown on Figure 2-1 and Figure 2-2.
Figure 2-1. Regional Monitoring and Data Source Locations

Data Update and On-Site Feasibility Report Saltese Flats Wetland Restoration Investigation
January 2010 7 .00
Figure 2-2. Saltese Flats Monitoring and Data Source Locations

Data Update and On-Site Feasibility Report Saltese Flats Wetland Restoration Investigation
January 2010 8 .00
2.1 Topographic Surveys Topographic information available for Saltese Flats identified in the Existing Data Review report included primarily USGS topographic data, the resolution of which is limited to 20 feet. It was noted that the min-imum resolution to evaluate wetland restoration feasibility at the Flats is 2 feet for the wetland design area and 5 feet for the entire Flats. Additional topographic information was assembled from two survey efforts at the site. The first was con-ducted by Ducks Unlimited in 2006 and resulted in a 1 foot contour map for Saltese Flats north of the east-west drain ditch. This effort also covers adjacent uplands east and west of the Flats. This new topo-graphic map is presented as Figure A-1 in Appendix A. It reveals that the lowest portion of the flat is along the northern border and in the northeast portion of the Flats. The topographic survey and additional site investigation also revealed that portions of the northern end of the Flats are lower than the outlet which drains into Saltese Creek. Historically a high-volume, low-head pump was used to discharge water from this area into the Saltese Creek channel. The second survey effort was conducted by Spokane Coun-ty in the winter of 2009 and the survey determined the location and elevation of shallow monitoring wells, staff gauges and other features of interest. Figure A-2 in Appendix A illustrates the locations and elevations of the shallow monitoring wells in relation to the Ducks Unlimited survey data. These two surveys appear to correlate well. These data will be used for wetland conceptual design in the next phase of this project. New FEMA floodplain maps were issued this spring for the Saltese Flats area. Figure A-3 in Appendix A illustrates the new floodplain map for the Flats and extending to Shelly Lake. This new map appears to have several flaws with implications for this project. First, the flood elevation indicated for the Flats is 2042 ft MSL which does not correlate at all with the flood boundaries on the map. Usually when the flood boundary on a FEMA map does not correlate with the indicated boundary, the elevation is used as the determining factor. This discrepancy may present challenges during permitting and require additional analysis. The second flaw in the new FEMA map is the omission of the Steen Road gravel pit and over-flow channel linking it to Saltese Creek. This omission may have been due to the quality of topographic maps used by FEMA and a lack of ground-verification of surface features in this area. Historic expe-rience has demonstrated the value of the gravel pit for reducing flood impacts at Shelly Lake and this is reinforced by the water budget analysis presented in this report. Without floodplain designation for the pit and channel, it is difficult to prevent development which could compromise these features for flood control. Development activities have already been proposed. A map showing Shelley Lake, Saltese Creek, and the channel to the gravel pit is presented on Figure A-4 in Appendix A. The map also includes topographic contours from two sources, the DEM contours have a resolution of five feet and cover the majority of the area shown, while contours in the gravel pit and channel from Saltese Creek are from the Spokane County survey completed in the winter of 2009. The topographic contours shown on Figure A-4 suggest that Shelley Lake levels could rise to elevations of approximately 2020 ft MSL without impact to existing structures, although the contours at the lake should not be considered precise. Lake level monitoring for the Saltese Flats study have documented lake levels up to 2017 ft MSL (discussed below in Section 2.6) with no known adverse impacts. As restora-tion plans are further developed maximum lake levels will need to be better defined, which may necessi-tate additional surveying along the lake shore and coordination with local homeowners. The approximate location of the overflow channel from Saltese Creek to the gravel pit is also shown on Figure A-4. The detailed survey along the channel and in the pit provide an accurate view of the topo-graphy and have allowed the development of channel cross-sections, shown on Figure A-5 in Appendix A. The nature of the topography at the diversion from Saltese Creek, and along Saltese Creek itself is less precise, relying on the DEM contours. The exact elevation at which water would flow into the channel leading to the gravel pit is not known with great precision, but appears to be between 2020 and 2025ft MSL. Extending the detailed survey to the diversion location and along portions of the Saltese Creek
Data Update and On-Site Feasibility Report Saltese Flats Wetland Restoration Investigation
January 2010 9 .00
channel will likely be necessary as design plans move forward and the nature of a control structure at the diversion is evaluated along with any needs for revising the overflow channel.
2.2 Photographic Documentation A series of photo-points were established around Saltese Flats at locations shown on Figure 2-3. Photo-graphs were taken from these locations to illustrate various seasonal conditions in and around the site and to establish baseline conditions prior to restoration activities. A large number of photographs have been taken and some examples of these photographs are included as Appendix B. The two photos in Appen-dix B depict views proposed for use in creating visualizations for conceptual designs during the next phase of this project. One photo (Figure B-1 taken from location 14) is taken from the roadway on the east side of the Flats and one (Figure B-2 taken from location 16) is from a roadway on the west side of the Flats with a more elevated perspective. A library of photographs will be provided on a CD at the completion of this study.
Figure 2-3. Saltese Flats Photo-Point Locations

Data Update and On-Site Feasibility Report Saltese Flats Wetland Restoration Investigation
January 2010 10 .00
2.3 Meteorological Data Compilation As was noted in the Existing Data Review report, weather data is available from stations located at the Spokane Airport (1890-2008), Coeur d’Alene (1895-2008), and at the three locations near Liberty Lake as shown on Figure 2-1. Data from the three Liberty Lake stations cover a shorter period of time (2001 to present) than the Spo-kane and Coeur d’Alene stations, but they are located in close proximity to Saltese Flats and can be con-sidered representative. The stations are part of an ongoing monitoring program conducted by Liberty Lake Sewer and Water who have made the data available for this investigation. A summary of the aver-age annual precipitation from the three Liberty Lake stations is presented in Table 2-1.
Table 2-1. Annual Precipitation at Liberty Lake Year Pine Terrace Valleyway Office
2001 11.882002 20.512003 17.82 7.562004 17.60 15.602005 19.97 15.84 14.502006 27.80 20.50 20.802007 16.63 12.90 13.372008 19.69 19.08 19.502009 9.70 7.95 8.35
Avg: 20.00 16.78 17.04
Precipitation numbers in inches per yearShaded values are for incomplete yearsAverage is mean for complete years
The Pine Terrace station is located on the south end of Liberty Lake next to a seasonal 155-acre marsh and wetlands in a setting similar to Saltese Flats, and is considered to be the most representative of condi-tions at Saltese Flats. A summary of the average monthly precipitation for the Pine Terrace station is shown in Table 2-2, along with the average monthly values for the Spokane and Coeur d’Alene stations. These data are shown graphically on Figure 2-4. The Pine Terrace data shows a similar seasonal pattern to the Spokane and Coeur d’Alene data, with precipitation roughly midway between those two stations.
Table 2-2. Monthly Precipitation at Pine Terrace, Spokane, and Coeur d’Alene Spokane Coeur
2001 2002 2003 2004 2005 2006 2007 2008 2009 Avg Airport d'Alene
Jan 0.60 2.80 0.75 1.45 7.60 1.83 2.74 0.80 2.3 1.99 3.41Feb 1.80 1.30 2.50 1.15 2.40 1.85 1.05 1.7 1.54 2.43Mar 0.50 5.30 3.10 0.90 2.75 2.60 1.55 2.40 4.25 2.6 1.39 2.27Apr 1.50 1.10 1.53 1.10 1.05 2.25 0.85 1.80 2.05 1.5 1.11 1.72May 2.00 0.78 2.70 3.05 1.80 1.20 1.45 1.30 1.8 1.42 1.98Jun 1.53 0.60 1.20 1.65 1.92 3.20 0.70 2.10 1.6 1.21 1.8Jul 0.25 0.55 0.01 1.20 0.10 0.90 0.80 0.5 0.55 0.71Aug 0.23 0.45 1.45 0.50 0.10 0.35 1.35 0.6 0.63 0.9Sep 0.30 1.25 1.30 0.65 0.35 0.25 0.50 0.7 0.79 1.26Oct 1.65 0.20 0.50 1.25 1.90 0.75 1.60 0.15 1.0 1.17 1.95Nov 3.20 2.18 1.35 1.95 2.95 4.40 1.75 2.00 2.5 2.1 3.15Dec 3.25 5.65 3.55 2.05 2.55 3.50 3.25 2.55 3.3 2.21 3.65
Precipitation numbers in inches per month
Pine Terrace
An update was made to the Cumulative Departure curve for the Spokane and Coeur d’Alene stations that was previously presented in the Existing Data Review report. The updated plot is shown on Figure 2-5. As previously noted, five distinct periods are evident in the data. These consist of two below normal pe-riods (1915-1939 and 1999-2004), one of roughly normal precipitation (1940-1944), and two periods in-cluding the most recent with above normal precipitation (1945-1998 and 2005-2008).

Data Update and On-Site Feasibility Report Saltese Flats Wetland Restoration Investigation
January 2010 11 .00
0.0
0.5
1.0
1.5
2.0
2.5
3.0
3.5
4.0
Jan Feb Mar Apr May Jun Jul Aug Sep Oct Nov Dec
Mon
thly
Ave
rage
Pre
cipi
tatio
n (in
ches
)
Coeur d'Alene
Spokane Airport
Pine Terrace
Figure 2-4. Average Monthly Precipitation at Stations Surrounding Saltese Flats
-64
-60
-56
-52
-48
-44
-40
-36
-32
-28
-24
-20
-16
-12
-8
-4
0
4
8
12
16
20
1910 1915 1920 1925 1930 1935 1940 1945 1950 1955 1960 1965 1970 1975 1980 1985 1990 1995 2000 2005 2010
Dep
artu
re F
rom
Ave
rage
(inc
hes)
Averages
Coeur d'Alene Spokane Airport
Overall: 25.2 inches Overall: 15.9 inches1915-1930: 22.6 inches 1915-1939: 13.4 inches1931-1944: 24.9 inches 1940-1944: 16.1 inches1945-1998: 26.7 inches 1945-1998: 17.1 inches1999-2005: 22.2 inches 1999-2004: 14.3 inches2006-2008: 26.3 inches 2005-2008: 16.8 inches
Spokane Airport
Coeur d'Alene
Figure 2-5. Precipitation Cumulative Departure Plots

Data Update and On-Site Feasibility Report Saltese Flats Wetland Restoration Investigation
January 2010 12 .00
2.4 Soil Borings and Well Installations Soil borings were completed at the site in November 2008 using truck mounted push-drilling (Geoprobe) drilling equipment. The drilling included 14 shallow (5-foot) borings that were completed as monitoring wells at the locations shown on Figure 2-2 (SFW-1 through SFW-14), four deeper borings (21 to 33 feet) at the locations shown on Figure 2-2 (B-1 through B-4), and one attempt to identify depth to bedrock by pushing a solid drill rod until refusal was encountered. Logs for the deeper borings with descriptions of the materials encountered are included as Appendix C. All of the borings encountered a layer of fine-grained organic material described as “organic muck” in the upper several feet. The deeper borings indicated the surficial organic layer ranges in thickness from five to 11 feet. Below the surficial organic material are alternating layers dominated by fine to medium sand and additional organic layers. This description is consistent with a log for a boring drilled previously in the middle of the Flats (Ecology ID 155203, included in Appendix C) which describes a similar pattern of alternating sand and fine-grained layers to a depth of at least 242 feet (bedrock was not encountered). The attempt to push a solid drill rod to bedrock met refusal at 125 feet. It is assumed that this depth is at or near bedrock but the nature of this method cannot be regarded as conclusive. This depth does not seem unreasonable since bedrock outcrops are common around the perimeter of the Flats. Monitoring well completion at the fourteen locations noted above consisted of 2-inch diameter PVC pipe with 3 feet of slotted screen. Surface completion included locking well caps with cemented flush-mount seals and flagging installed next to the wells to help locate them during the growing season. Ground sur-face and top of casings elevations were surveyed by Spokane County Utilities during the topographic sur-vey. Water level data and groundwater sampling results are described below. Soil samples were collected from upper (0-1 feet) and lower (4-5 feet) intervals of each of the shallow borings. The purpose of these samples was to evaluate the range of properties observed in surface soil materials that would be used in wetland construction. Ten of these samples were submitted to an analyti-cal laboratory for analysis of common soil properties including pH, texture, organic matter content, phos-phorus, nitrate, potassium and sulphate. Laboratory reports are included in Appendix D. These analyses provide baseline information useful conceptual designs. Results showed mostly acidic to neutral pH and silty or organic textures. Organic contents were low in the mineral soil layers (mostly <15%) and high in the organic soil layers (50-60%). 2.5 Wetland Delineation PBS&J delineated wetlands at Saltese Flats during September 2008 to evaluate wetland status, wetland characteristics and the potential for wetland restoration. Routine wetland determination methods were used to evaluate the area including Options A and B (Figure 1-3) at the northern portion of the Flats. These methods included the latest Army Corps of Engineers guidance based on the Interim Regional Sup-plement: Arid West Regions and the 1987 Wetland Delineation Manual. Wetland boundaries, sampling points, and photo point locations were captured using a resource-grade, hand-held GPS unit for the wet-land delineation. Reconnaissance-level wetland determination methods were used across the remainder of the area within Option C. These methods used air-photo interpretation and views from public roads combined with expe-rience on the adjacent Option A & B areas to complete a reconnaissance level map of wetland distribu-tion. Wetland boundaries in this area were delineated on air photos and wetland characteristics were estimated and summarized in the following text.

Data Update and On-Site Feasibility Report Saltese Flats Wetland Restoration Investigation
January 2010 13 .00
Routine Wetland Mapping Data gathered during wetland delineation is included in Appendix E. Figure E-1 illustrates the Routine and Reconnaissance Wetland Mapping Areas. Figure E-2 illustrates the distribution of wetlands within the Reconnaissance Wetland Mapping Area. Data illustrated on these figures include wetland boundaries, transect location, sampling points, and photo point locations. Also included in Appendix E are Army Corps of Engineers Routine Data forms for sampling points that describe the vegetation, hydrology, and soils in more detail. A selection of routine data forms are included in this report that represent the range of wetland types observed within the routine mapping areas. These forms include Sampling Points 2, 4, 6, 7, 8, 9, 10, 16, 17, and 18. Also included in Appendix E are photographs illustrating the range of wet-land types observed. Approximately 76 acres of wetlands were identified within Options A and B (Table 2-3). Most of this area probably met wetland criteria before artificial drainage in the late 1800s. Certain areas do not cur-rently meet wetland criteria within Options and B due to a lack of wetland vegetation and wetland hy-drology. Vegetation has been converted to hay crop species, especially orchardgrass and timothy. Groundwater levels have been lowered by drainage.
Table 2-3. Cowardin Vegetation Types Within Routine Mapping Areas
Vegetation Type Acres Aquatic Bed/Emergent 19.7 Emergent 48.1 Scrub-shrub 5.1 Forested 0.9
Total 76.2 Most wetlands within the routine mapping area are located in the northern portion of Saltese Flats. A few small wetland areas and other Waters of the United States (WOUS) exist between the northern and the southern wetland complexes within the farmed areas of Option A. A transect was established running from west to east across the northern portion of the flat to document changes in wetland characteristics and types. Sampling points along this transect document changes in wetland vegetation types and domi-nant vegetation. Additional sampling points located in wetland areas apart from this transect document other wetlands within the routine mapping area (Options A and B). Wetland vegetation types within the routine wetland mapping area are based on the Cowardin System and are illustrated on Figure E-2. Cowardin wetland vegetation types recorded at the site included palustrine aquatic bed, emergent, scrub-shrub and forested vegetation types. Wetland areas were dominated by the following vegetation:
• Bidens cernua – nodding beggartick • Eleocharis ovata – ovoid spikerush • Echinochloa crus-galli – barnyard grass • Phalaris arundinacea – reed canarygrass • Populus sp. - poplar • Scirpus acutus – hardstem bulrush • Scirpus validus – softstem bulrush • Sparganium emersum var. emersum – bur-reed • Typha latifolia – common cattails

Data Update and On-Site Feasibility Report Saltese Flats Wetland Restoration Investigation
January 2010 14 .00
Reconnaissance Wetland Mapping Figure E-3 illustrates the distribution of wetlands within the Reconnaissance Wetland Mapping Area (Option C outside of the Option A and B areas). The Cowardin wetland types identified across the 236 acres of wetlands identified in this area are summarized in Table 2-4.
Table 2-4. Cowardin Vegetation Types Within Reconnaissance Mapping Areas
Vegetation Type Acres Aquatic Bed/Emergent1 82.7 Emergent 105.1 Scrub-shrub 0 Forested 24.2
Total 236.3 1 – Areas of shallow standing water that were discernable on the aerial photography were mapped as a combined type of aquatic bed and emergent.
HGM Wetland Classes The HGM classes recorded for the wetland areas included depressions, sloped, and riverine. The HGM class for depressions consisted of the Graham pond (see Figure 1-3) and other low-lying areas that were inundated during the time of the investigation and have topography that hold standing water. The sloped classes consisted of areas dominated by herbaceous vegetation that surrounded the pond and had topogra-phy that rose in elevation away from the existing standing water of the pond. These areas receive annual inundation from the fluctuating water levels of the pond. The riverine classes included several channels that function as irrigation ditches to either convey surface waters across the Flats for irrigation or to drain standing water upstream of the Morrison Diversion (see Figure 1-3). These areas are described as Water of the US (WOUS) on the figures due to presence of existing bed and bank feature. These channels con-vey water across the Flats toward the Graham pond or around the Flats toward the outlet on the northwest corner of the project area. Vegetation Types The four Cowardin vegetation classes identified at Saltese Flats are described below and include aquatic bed, emergent, scrub-shrub, and forested. Aquatic Bed The aquatic bed type consists of the shallow-water areas dominated by aquatic vegetation at the Graham Pond within the routine wetland mapping area. The aquatic bed type also occurs south of Options A and B where it is intermixed with emergent types dominated by common cattail (Typha latifolia) and softstem bulrush (Scirpus validus). Emergent The emergent vegetation type dominates wetlands within both the routine and reconnaissance areas with several distinct community types includes reed canarygrass (Phalaris arundinacea), common cattail (Ty-pha latifolia), cattail / hard and soft bulrush (Scirpus acutus and validus), and barnyard grass (Echinoch-loa crus-galli). The reed canarygrass type includes emergent vegetation dominated by a mono-culture of reed canary-grass with minor inclusion of bedstraw (Galium sp.). These types were primarily located within the northwest corner of Saltese Flats, west of the Graham Pond, and are inundated throughout the season or consist of a fringe along the extensive ditch system with the Flats.

Data Update and On-Site Feasibility Report Saltese Flats Wetland Restoration Investigation
January 2010 15 .00
The Cattail / Hard and Soft Bulrush type includes emergent vegetation located within the shallow waters of the Graham Pond and other inundated areas of the Flats. These types are adapted to the fluctuating water table throughout the season with the majority of the area inundated with standing water. Areas consist of emergent vegetation dominated by cattails and both hardstem and softstem bulrush with minor inclusion of nodding beggartick (Bidens cernua), barnyard grass, willowherb (Epilobium ciliatum), bur-reed (Sparganium emersum var. emersum), and reed canarygrass. The barnyard grass type includes areas of saturated to slightly inundated areas located away from the main wetland complexes within the farmed areas. These sites are dominated by barnyard grass, toad rush (Juncus bufonius), sedge (Carex sp.) and smartweed (Polygonum sp.). Scrub-Shrub Scrub-shrub vegetation type was located within one area of the detail mapping boundary along an irriga-tion channel of the historic Saltese Creek along on the east side of the Morrison property on the southern end consisting of Hawthorn. The hawthorn type includes scrub-shrub vegetation that lines an existing irrigation ditch and is dominated by Hawthorn (Crataegus sp.). The thick shrub layer has an emergent understory consisting of mostly reed canarygrass. Forested The forested type within the project boundary consists of a small stand of poplar planted near the Graham pond and a native poplar area along a wetland / riparian area within the recon area. Two distinct types were observed including poplar (Populus sp.) and quaking aspen (Populus tremuloides). The planted poplar type is located near the Graham pond and is inundated throughout the season during high water periods caused by spring runoff or operation of the drainage system. This area was planted to evaluate the potential for poplar cultivation and has an even distribution pattern. The type is dominated by an overstory of poplar and understory of emergent vegetation including beggars-tick, reed canarygrass, toad rush, and barnyard grass. Former Wetland Areas Most of the area of Saltese Flats was wetland until it was artificially drained in the late 1800s. These areas have been farmed since, mainly for hay crops that were sub-irrigated by manipulating the ground-water level using a series of ditches. Water levels would be raised to within the root zone of crop plants to increase production. Water levels would be lowered to allow tillage, seeding and harvest. These areas do have soils that meet hydric criteria due to the high organic matter surface layer (histosols or histic epipedon). These areas do not have wetland vegetation due to the conversion to crop plants, mainly orchardgrass, timothy and Kentucky bluegrass. These areas do not have wetland hydrology due to manipulation of groundwater levels using the drainage system. Groundwater monitoring data is discussed in Section 2.7 below. Figure 2-11 illustrates groundwater depths below ground level in May 2009 when maximum groundwater elevations would be expected. This figure indicates that depths across the Option A and B areas ranged from approximately 1-3 feet (too deep to qualify as wetland hydrology). Table F-2 in Appendix F lists depths to water below ground surface for each sampling date. These values show higher water levels in April than in May which is contrary to expectations. Our experience in monitoring numerous wetlands suggests that groundwater levels usually peak after surface water flows by 2-6 weeks which would be in May at this site. Discussions with the landowner who controls the drainage system revealed that it was his manipulation of the drainage system that resulted in lower water levels during May than April. This confirms that wetland hydrology is not currently present across most of the Option A and B areas due to drainage.
Data Update and On-Site Feasibility Report Saltese Flats Wetland Restoration Investigation
January 2010 16 .00
2.6 Surface Water Stage and Discharge As a review, the Saltese Flats drainage basin covers about 14,000 acres as shown on Figure 2-6. The drainage basin shown for the Flats was drawn using topographic highs that define drainage divides sepa-rating those that drain into Shelley Lake and Saltese Flats and those that do not. Although a number of small drainages route water into Saltese Flats at times during the year, water pri-marily enters the area through three main creek systems consisting of Saltese Creek, Quinnamose Creek, and an unnamed tributary as shown on Figure 2-6. The Saltese Creek outlet occurs at the northern end of the site and the creek flows northwest, ultimately discharging into Shelley Lake. The outlet is dry during summer months. Shelley Lake has no outlet and water in the lake infiltrates into the groundwater system and eventually recharges the Spokane Valley Rathdrum Prairie (SVRP) aquifer. A series of ditches were developed beginning over one hundred years ago to drain the Flats for agricul-ture. The original outlet was enlarged and lowered as much as 15 feet to prevent the Flats from flooding. Prior to these changes and the addition of artificial drainages, the Flats area was a seasonal lake.
Figure 2-6. Watershed and Surface Water Related to Saltese Flats
Water level and discharge data gathered for this investigation include data collected as part of the ongoing monitoring program for this study and data for the Liberty Lake area provided by Liberty Lake Sewer and Water District staff.

Data Update and On-Site Feasibility Report Saltese Flats Wetland Restoration Investigation
January 2010 17 .00
Twelve locations were identified as surface water monitoring locations in and around Saltese Flats. These locations are on Figure 2-1 and Figure 2-2, and are summarized in Table 2-5. Staff gages were installed at ten of the locations, and water levels and discharge were measured periodically beginning in November 2008. In addition to these locations, four intermittent inlets to the Flats were identified (C-1 through C-4 on Figure 2-2) and were observed periodically to evaluate whether or not these inlets provided any sig-nificant contribution to the Flats. Water level and discharge data collected at these stations are included in Appendix F. Discharge was measured during low, average, and high flow conditions in order to de-velop “rating curves” which allow the translation of water level or stage readings into discharge values. There are sufficient data to develop rating curves for four of the sites (SC-7, MP-1, UT-1, and QC-1) and the rating curves are included in Appendix F. Additional discharge measurements will be needed to im-prove the accuracy of these rating curves and to have adequate data to develop curves for SC-1 and SC-6. Sites SC-2 and SC-3 are regularly affected by manipulation of discharge from Saltese Flats and it has not been possible to get reliable flow measurements at those locations.
Table 2-5. Surface Water Monitoring Locations
In addition to the monitoring program locations, data were obtained from the Liberty Lake Sewer and Water District for Liberty Creek (water level and flow) and for Liberty Lake (water level). The Liberty Creek watershed is similar to that of Saltese Flats and was chosen to be a reference basin. The data from Liberty Creek is more detailed and covers a longer period than what has been collected so far for Saltese Flats, and is useful to interpret short-term fluctuations and long-term conditions at the Flats. Liberty Creek discharge data are illustrated on Figure 2-7, with instantaneous readings shown on the graph and average monthly discharge values in the table. The maximum average monthly discharge of 16.7 cfs occurs in April, although the maximum instantaneous discharge is as high as 93 cfs. Low flows occur during late summer-early fall. The annual average discharge for Liberty Creek is 6.6 cfs. There are gaps in the discharge data for the creek for late 2008/early 2009 because the station needed to be relo-cated and discharge has not yet been calculated for all stages during that time.

Data Update and On-Site Feasibility Report Saltese Flats Wetland Restoration Investigation
January 2010 18 .00
0
10
20
30
40
50
60
70
80
90
100
Jul-03 Jan-04 Jul-04 Jan-05 Jul-05 Jan-06 Jul-06 Jan-07 Jul-07 Jan-08 Jul-08 Jan-09 Jul-09
Dis
char
ge (c
fs)
Figure 2-7. Liberty Creek Discharge Data
A comparison of discharge data from the two basins on nine dates where discharge data are available for Saltese Flats is provided in Table 2-6. For a few of these dates some of the flow components into Saltese Flats were estimated but the numbers are believed to be reasonable. In addition, a plot of Liberty Creek discharge data along with combined discharge flowing into Saltese Flats is shown on Figure 2-8. The graph and table suggest that discharge into Saltese Flats may be only about half of that of Liberty Creek. A more thorough comparison of the two basins will require additional stage readings at Saltese Flats and development or improvement of rating curves for the gage stations. Water elevation data for Liberty Creek and the three Saltese Flats inlets are shown on Figure 2-9 to help compare water level trends between the two basins . The Saltese Flats gages show a similar pattern to that of Liberty Creek with levels peaking in late April. Quinnamose Creek and the Unnamed tributary both exhibit a fluctuation of about 0.5 feet or less, similar to that of Liberty Creek. Saltese Creek, howev-er, shows a seasonal fluctuation of over one foot. As noted above, these data will be converted into dis-charge data in the future.
Table 2-6. Discharge Comparison Between Saltese Flats and Liberty Creek Ratio Saltese
Date Saltese-In Saltese-Out Liberty Creek to Liberty Creek
11/03/08 0.23 0 4.09 5.6%11/18/08 0.88 0 4.09 21.5%01/12/09 3.17 7.9 6.97 45.5%04/21/09 14.62 11.8 34.1 42.9%04/26/09 12.3 9.6 28.7 42.9%04/29/09 10.5 6.68 23.9 43.9%05/05/09 11.37 2.64 31.1 36.6%06/06/09 6.37 0.45 7.1 89.7%06/10/09 4.54 0.07 8.4 54.0%
Average: 42.5%
Discharge (cfs)
2003 2004 2005 2006 2007 2008 2009 Avg
Jan 3.6 4.2 27.2 6.8 6.8 9.7Feb 7.0 3.5 16.1 9.9 8.5 9.0Mar 9.1 5.9 19.5 21.8 16.1 14.5Apr 8.4 16.1 25.2 16.3 17.2 16.7May 5.9 8.3 16.7 6.0 27.5 20.7 11.5Jun 3.9 6.9 10.2 0.6 7.7 5.4Jul 1.1 4.6 1.5 0.6 1.1
Aug 1.0 2.2 0.5 1.2 1.2Sep 0.5 0.9 2.8 1.0 0.6 1.2Oct 0.7 1.4 0.8 0.4 0.8Nov 1.3 2.7 2.6 0.5 1.8Dec 2.7 4.5 12.2 6.8 6.6
Numbers in cubic feet per secondShaded values are incomplete months
Data Update and On-Site Feasibility Report Saltese Flats Wetland Restoration Investigation
January 2010 19 .00
0
5
10
15
20
25
30
35
40
Jul-08 Aug-08 Sep-08 Oct-08 Nov-08 Dec-08 Jan-09 Feb-09 Mar-09 Apr-09 May-09 Jun-09 Jul-09
Dis
char
ge (c
fs)
Combined Inlets toSaltese Flats
Liberty Creek
Figure 2-8. Liberty Creek Discharge Data
2151.5
2152.0
2152.5
2153.0
2153.5
2154.0
2154.5
Jul-08 Aug-08 Sep-08 Oct-08 Nov-08 Dec-08 Jan-09 Feb-09 Mar-09 Apr-09 May-09 Jun-09 Jul-09
Elev
atio
n (ft
MSL
)
Quinnamose Crk
Unnamed trib
Saltese Crk
Liberty Creek
Note: Elevations approximate, some adjusted to combine on plot
Figure 2-9. Water Levels for Liberty Creek and Saltese Flats Inlets
Data Update and On-Site Feasibility Report Saltese Flats Wetland Restoration Investigation
January 2010 20 .00
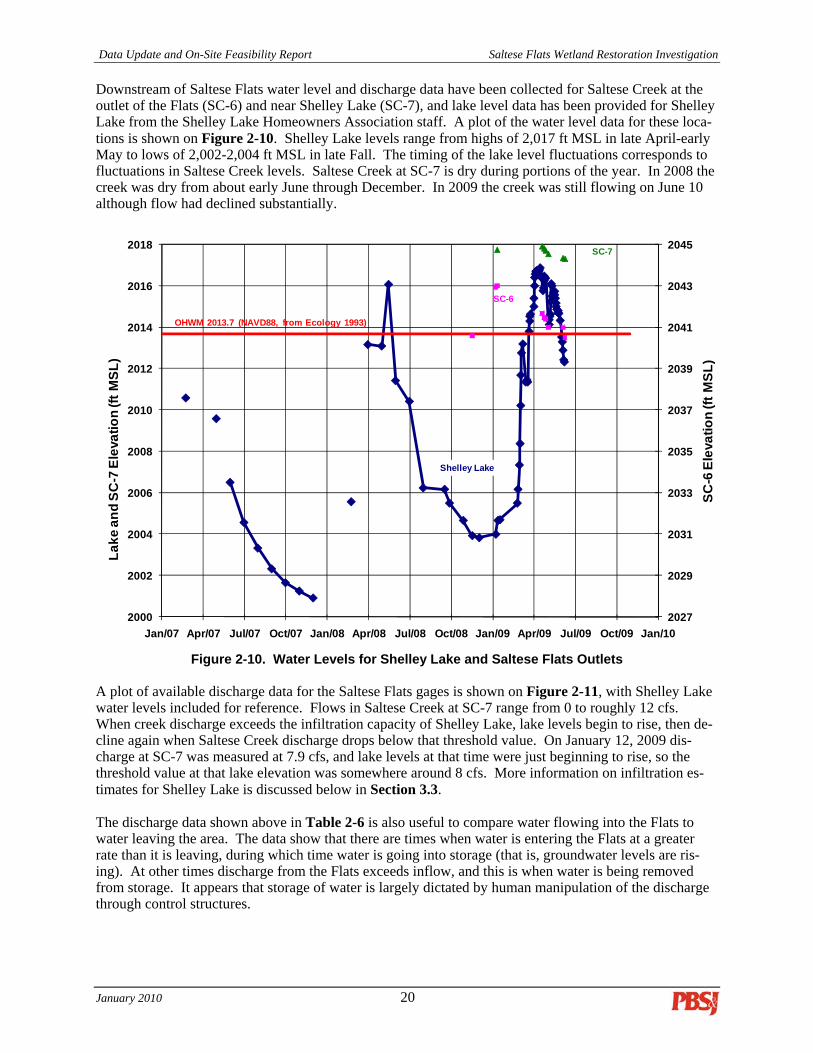
Downstream of Saltese Flats water level and discharge data have been collected for Saltese Creek at the outlet of the Flats (SC-6) and near Shelley Lake (SC-7), and lake level data has been provided for Shelley Lake from the Shelley Lake Homeowners Association staff. A plot of the water level data for these loca-tions is shown on Figure 2-10. Shelley Lake levels range from highs of 2,017 ft MSL in late April-early May to lows of 2,002-2,004 ft MSL in late Fall. The timing of the lake level fluctuations corresponds to fluctuations in Saltese Creek levels. Saltese Creek at SC-7 is dry during portions of the year. In 2008 the creek was dry from about early June through December. In 2009 the creek was still flowing on June 10 although flow had declined substantially.
2027
2029
2031
2033
2035
2037
2039
2041
2043
2045
2000
2002
2004
2006
2008
2010
2012
2014
2016
2018
Jan/07 Apr/07 Jul/07 Oct/07 Jan/08 Apr/08 Jul/08 Oct/08 Jan/09 Apr/09 Jul/09 Oct/09 Jan/10
SC-6
Ele
vatio
n (ft
MSL
)
Lake
and
SC
-7 E
leva
tion
(ft M
SL)
OHWM 2013.7 (NAVD88, from Ecology 1993)
SC-6
SC-7
Shelley Lake
Figure 2-10. Water Levels for Shelley Lake and Saltese Flats Outlets
A plot of available discharge data for the Saltese Flats gages is shown on Figure 2-11, with Shelley Lake water levels included for reference. Flows in Saltese Creek at SC-7 range from 0 to roughly 12 cfs. When creek discharge exceeds the infiltration capacity of Shelley Lake, lake levels begin to rise, then de-cline again when Saltese Creek discharge drops below that threshold value. On January 12, 2009 dis-charge at SC-7 was measured at 7.9 cfs, and lake levels at that time were just beginning to rise, so the threshold value at that lake elevation was somewhere around 8 cfs. More information on infiltration es-timates for Shelley Lake is discussed below in Section 3.3. The discharge data shown above in Table 2-6 is also useful to compare water flowing into the Flats to water leaving the area. The data show that there are times when water is entering the Flats at a greater rate than it is leaving, during which time water is going into storage (that is, groundwater levels are ris-ing). At other times discharge from the Flats exceeds inflow, and this is when water is being removed from storage. It appears that storage of water is largely dictated by human manipulation of the discharge through control structures.

Data Update and On-Site Feasibility Report Saltese Flats Wetland Restoration Investigation
January 2010 21 .00
1994
1996
1998
2000
2002
2004
2006
2008
2010
2012
2014
2016
2018
Apr/08 Jun/08 Aug/08 Oct/08 Dec/08 Jan/09 Apr/09 Jun/09 Aug/09
Lake
Ele
vatio
n (ft
MSL
)
0
1
2
3
4
5
6
7
8
9
10
11
12
Dis
char
ge (c
fs)
SC-1
SC-7
Shelley Lake
MP-1
UT-1
QC-1
Figure 2-11. Water Levels for Shelley Lake and Saltese Flats Outlets
Surface water level data from gages on Saltese Flats is less informative at this time. Data from the two channels on the west side of the Flats (SC-2 and SC-3) are impacted by landowner water management activities (i.e. holding or releasing water from the Flats) and the infrequent measurements don’t provide much insight on surface water patterns at that location. The gage at Graham Pond showed an elevation change from roughly 2,041 ft MSL on November 18, 2008 to 2,043 ft MSL on January 12, 2009. After that time the pond level rose above the top of the gage and accurate levels could not be discerned. This gage will need to be modified to allow readings at high pond levels. To the west of the site the location referred to as Morrison Pond (MP-1) exhibited fluctuations of only about 0.5 feet during the monitoring period. This location is recharged by intermittent drainages to the south and west which appear to flow between November and June. Water leaving the pond bypasses the Flats and joins into Saltese Creek near gage SC-6. At times some of this discharge is backed up into the Flats through use of a control structure which causes water to flow back towards gages SC-2 and SC-3. Discharge leaving the pond ranges from 0 to about 2 cfs. Monitoring data collected to date is not sufficient in itself to estimate water flow through the Flats. How-ever by comparing the data to nearby Liberty Creek an approximation can be made. As noted above, spot discharge measurements suggest water enters Saltese Flats at roughly half the amount carried by Liberty Creek (Flats values are less than half but it can be assumed that smaller tributaries provide some water during the year). Annual average discharge for Liberty Creek (2003-2009) is 6.6 cfs, so a preliminary estimate for water entering the Flats is about 3.3 cfs. For comparison, previous estimates of flow in Sal-tese Flats, shown in Table 2-7, show the estimate of 3.3 cfs is well below the majority of the previous estimates but does fall on the lower part of the range for modeled annual flow to Shelley Lake.

Data Update and On-Site Feasibility Report Saltese Flats Wetland Restoration Investigation
January 2010 22 .00
Table 2-7. Saltese Flats Flow Estimates Flow Description Reference
20,000 AFY (27.6 cfs) Average water rights flow into Flats Golder, 2004 17,400 AFY (24 cfs) Annual Flats contribution to SVRP USGS, 1981
18,015 AFY (24.9 cfs) Annual Flats contribution to SVRP Buchanan and Olness, 1993 8,700-15,700 AFY (12-21.7 cfs) Wet/dry year flow into Flats Golder, 2004
17,375 AFY (24 cfs) 1959 Flats contribution to SVRP Drost and Seitz, 1978 17,375 AFY (24 cfs) Annual Flats contribution to SVRP Thomas, 1963
2,613-4,090 AFY (3.61-5.65 cfs) Modeled annual flow to Shelley Lake Kahle and Bartolino, 2007 2.7 Water Management at Saltese Flats Water flows into and out of Saltese Flats have been artificially managed since the lake was originally drained. This management has allowed the area to be used for crop production and grazing. A court de-cision in 1947 confirmed the owner’s right to manipulate water levels across Saltese Flats. Figure 2-12 illustrates important components of the Saltese Flats water management system. Water en-ters the southern portion of the Flats from several creeks and groundwater sources. The southern portion of the Flats is a wetland area dominated by cattail and bulrush. A berm has been constructed running east-west across the Flats at the boundary of the wetland area and the agricultural fields to the north. Construction of this berm was begun in the 1940s which stimulated the lawsuit and court decision. This berm allows water to be backed up on the south side of the berm so that it can be routed into the bypass ditch which runs from south to north along the western edge of the Flats (Figure 2-12). This bypass ditch allows water to be moved from south of the berm to the entrance of Saltese Creek at the northwest corner of the Flats. Water moving through this bypass ditch can leave the Flats by gravity and flow down Sal-tese Creek. Several additional ditches are also present at Saltese Flats (Figure 2-12). These ditches are not regularly used in current management but can be useful for moving water around the Flats. All of these ditches move water toward the northwest portion of the Flats and terminate at a pump site (Figure 2-12). The elevation of the ditch at the pump site is lower than the entrance to Saltese Creek so this pump site is used to raise water from the ditch system to the creek so it can exit the Flats. Although the pump has not been used in recent time, it remains at the site as does electric power. This is a high-volume/low-head pump and is reported to be very effective at lowering water levels across the entire Flats. It was used in the past to lower the water table and facilitate peat harvest in the northeast portion of the Flats. The berm, ditch and pump have historically been manipulated throughout the year to provide conditions suitable for crop production and harvest. The goal of this effort has been to provide sufficient water for crops without having too much water during the growing season and harvest periods. Throughout the winter, inflows to the Flats are monitored by the landowner. If it appears to be a “wet year” with lots of water, the landowner lets more water flow through the bypass ditch and exit to Saltese Creek. If it ap-pears to be a “dry year” with limited runoff, the landowner does not bypass the water but holds more wa-ter on the Flats and keeps flows into Saltese Creek to a minimum. During the growing season, water is allowed to flow onto the Flats and groundwater levels are allowed to rise within the rooting depth of the crop (mainly grass hay) to increase production. During harvest, water can be routed around the Flats us-ing the bypass ditch if necessary to dry out the surface enough to allow harvest equipment access. In addition to the water management practices discussed above, nutrient management has also been an on-going part of farming practices at the site. Fertilizer is added each year to improve crop yield across

Data Update and On-Site Feasibility Report Saltese Flats Wetland Restoration Investigation
January 2010 23 .00
Figure 2-12. Saltese Flats Water Management Features

Data Update and On-Site Feasibility Report Saltese Flats Wetland Restoration Investigation
January 2010 24 .00
the 342 acres Morrison property on Saltese Flats. Approximate annual average fertilizer additions to this acreage are: Nitrogen 170 pounds per acre 58,140 pounds per 342 acres Phosphorus 40 pounds per acre 13,680 pounds per 342 acres Potassium 60 pounds per acre 20,520 pounds per 342 acres The majority of this added fertilizer is removed with the crop during harvest but some remains on site and may contribute to high nutrient levels in surface and groundwater as discussed elsewhere in this report. This fertilizer input would cease with conversion of the site to a restored wetland. 2.8 Groundwater Levels Depth to groundwater has been measured in the shallow onsite wells periodically since their installation in November 2008. The top of casing for each well and adjacent ground surface have been surveyed and groundwater depths converted to elevation. The shallow well groundwater level data collected to date are included in Appendix F. A contour map of groundwater elevations measured in the shallow on-site wells on May 2, 2009 is shown on Figure 2-13a. The May contours, which represent slightly post-high water conditions, show a general pattern of northerly flow from the east-west ditch changing to northwesterly flow near the outlet of the Flats at SC-6. Groundwater at the site appears to be heavily influenced by surface water levels and control strategies. At the time the May measurements were recorded, ground on the Morrison property was relatively dry, per-haps due to water management in the ditches, while the ground surface was saturated and standing water was present in areas to the east. This is reflected by elevated groundwater elevations at SFW-9 and SFW-10 which result in a westerly gradient at those locations, while low elevations occur at SFW-4 and at SFW-1 due to water being drained from the system by the ditch system. For comparison, a contour map of groundwater elevations measured in the shallow on-site wells on June 23, 2009 is shown on Figure 2-13b. The June elevations are close to low-water conditions. Some wells at the time were inaccessible so the dataset is slightly different from the May measurements, but a general comparison can be made between the two conditions. In June the groundwater gradient is flatter than dur-ing the higher water conditions in May, largely because water levels declined more in upgradient wells to the east than in the wells on the Morrison property. As previously noted water levels in the wells on the Morrison property appear to reflect managed groundwater conditions which mean levels under high water conditions are artificially low, whereas wells to the east presumably reflect more natural seasonal fluctua-tions. Depth to groundwater from ground surface on May 5, 2009 is shown on Figure 2-14. The data show that groundwater was present at the surface in some areas, and as deep as 3.3 feet in others. The shallowest groundwater occurred in the northeast area of the Flats and to the south near the East-West Ditch. Aside from one deep groundwater area near well SFW-13, the deeper groundwater occurred to the northwest, likely a reflection of water being drained out of the Flats through the surface water channels.

Data Update and On-Site Feasibility Report Saltese Flats Wetland Restoration Investigation
January 2010 25 .00
Figure 2-13a. Shallow Groundwater Elevations-May 2009
Figure 2-13b. Shallow Groundwater Elevations-June 2009

Data Update and On-Site Feasibility Report Saltese Flats Wetland Restoration Investigation
January 2010 26 .00
Figure 2-14. Depth to Groundwater-May 2009
It will be difficult to know the nature of the true natural seasonal groundwater fluctuations across the Flats as long as water management procedures using the ditch systems are maintained. The nature of current seasonal patterns in the wells cannot be fully evaluated until additional measurements are recorded, but data collected so far suggests groundwater depths are greatest in the fall and are closest to ground surface in late April, matching the pattern of surface water levels described in Section 2.6. Depth to groundwater below ground surface in the wells has ranged from about 0.5 feet to over 5 feet, although some of the wells had groundwater at the surface during the April 21, 2009 field visit. High groundwater conditions during the spring made several of the wells inaccessible. Some preliminary estimates of current seasonal fluctuations are shown in Table 2-8, which is based on assumed low groundwater levels. Seasonal groundwater fluctuations range from 1.2 to 5.1 ft, with an average value of about 3.3 ft.
Table 2-8. Preliminary Annual Groundwater Level Fluctuation Estimates Annual Annual
Groundwater GroundwaterWell Fluctuation (ft) Well Fluctuation (ft)
SFW-1 3.5 SFW-9 3.7SFW-2 1.9 SFW-10 4.0SFW-3 2.5 SFW-11 3.9SFW-4 4.7 SFW-12 2.8SFW-5 3.7 SFW-13 1.9SFW-6 4.3 SFW-14 2.7SFW-7 1.2SFW-8 5.1 Average: 3.3

Data Update and On-Site Feasibility Report Saltese Flats Wetland Restoration Investigation
January 2010 27 .00
2.9 Water Quality Water quality data have been gathered for both surface water and groundwater at on-site and off-site loca-tions. Water quality samples were collected on April 21, 2009 and again on July 16, 2009 from seven surface water and six groundwater locations. In addition, water quality data were provided by Spokane County Utilities for four wells in the SVRP aquifer north of the site that are sampled quarterly as part of a separate ongoing monitoring program. A summary of the analysis results and laboratory reports are in-cluded in Appendix D. Well locations are shown on Figure 2-1. The On-site shallow wells were described in Section 2.4. The Off-site well locations are shown on Figure 2-1 and Figure 2-2, and are summarized below in Table 2-9. Off-site wells include DW-1, sampled as part of the monitoring program for this study, and wells DW-2 through DW-5, sampled as part of the ongoing SVRP aquifer monitoring by Spokane County Utilities.
Table 2-9. Offsite Well Summary ID Ecol ID Sp Co ID Location Type Owner Depth Unit Log? Mon. Data
DW-1 308587 ----- Upgrad of Flats Domestic McGowan 400 Granite Yes WQDW-2 ----- 5426L01 West of Flats PWS Vera Water & Power Well 4 NA SVRP Yes WQ*DW-3 ----- 5518R01 Downgrad of Flats PWS Consolidated Irrig Dist 19, Site 2A 190 SVRP Yes WQ*DW-4 ----- 5517D05 Downgrad of Flats MW Near Cons Irrig Dist 4 112.5 SVRP Yes Levels, WQ*DW-5 ----- 5515C01 Downgrad Liberty Lake PWS Lib Lake Sewer Dist-Mission Well 179 SVRP Yes WQ*
* Data collected as part of quarterly program conducted by Spokane County Results of the water quality sampling and analyses are discussed below in term of overall water quality conditions and how the different sample locations and types compare, along with a focused discussion on nutrient constituents. Seasonal variations in constituent concentrations are also discussed because the two sampling rounds represent high water and low water conditions. General Water Type and Condition The anion and cation data from the April sampling analyses were used to develop the Piper Diagram shown on Figure 2-15. Piper diagrams are used to classify the general type of water and to identify sam-ples that are similar in nature (those that group together) and to evaluate transitions in water quality (those that plot in a sequence) that indicate changes in chemistry due to mixing with different water or some oth-er alteration mechanism. For groundwater samples, the SVRP aquifer samples all cluster tightly together illustrating those waters are very similar. The single upgradient bedrock sample plots close to those from the SVRP aquifer, but is in a different area of the plot because of higher sodium and potassium and lower calcium levels. The on-site shallow wells appear to show a transitional sequence beginning with the southernmost sample (SFW-7) and moving northwest toward the outlet of the Flats (SFW-1). This sequential change in the shallow groundwater is characterized by a combined lowering of bicarbonate and increase in chloride concentra-tions, along with a clear increase in TDS concentrations (illustrated by circles on Figure 2-15). For the surface water samples, the sample from the Saltese Creek inlet (SC-1) shows a similar composi-tion to that of the outlet (SC-6) and Shelley Lake (SL-1) indicating the surface water does not change sig-nificantly in composition as it moves through the Flats. The sample from Quinnamose Creek (QC-1) plots far away from the other samples due to a much lower bicarbonate content. The reason for that is unclear. The sample from Graham Pond (GP-1) is generally similar to the other surface water samples with the exception of sulfate which is elevated and more in line with the groundwater samples.

Data Update and On-Site Feasibility Report Saltese Flats Wetland Restoration Investigation
January 2010 28 .00
The summary water quality data tables in Appendix D (Table D-1, Table D-2, and Table D-3) show that the SVRP aquifer samples are all generally similar, with the only exceedance of standards noted being for well DW-2 which had a couple of minor exceedances of the secondary standard for iron. The upgradient bedrock well (DW-1) had no exceedances of standards, and as previously noted had water quality similar to that of the SVRP aquifer samples. The shallow groundwater samples from the Flats on the other hand had elevated concentrations for a number of constituents, compared to those from the SVRP aquifer (Appendix D, Table D-4). Iron con-centrations were high, ranging from 14-23 ppm and exceeded the secondary standard of 0.3 ppm in all samples. Sulfate concentrations were also high, exceeding the secondary standard of 500 ppm at well SFW-1 at the northern end of the Flats. Similarly TDS was elevated, exceeding the secondary standard of 500 ppm at well SFW-1. Surface water samples all had generally low concentrations for the constituents analyzed (Appendix D, Table D-5). As noted before, these samples showed similar water quality concentrations with the excep-tion of the Quinnamose Creek sample which had an anomalously low bicarbonate concentration.
Figure 2-15. Piper Diagram of Water Quality Sampling Results

Data Update and On-Site Feasibility Report Saltese Flats Wetland Restoration Investigation
January 2010 29 .00
Nutrient Constituents Saltese Flats Surface Water Surface water sampling results showed that nutrients, summarized in Table 2-10, generally increased from the upstream monitoring sites to the downstream monitoring sites on Saltese Flats. On the Flats concentrations were higher for all constituents at GP-1 than at SC-3, reflecting the fact that water at GP-1 has flowed through the northern portion of the Flats while SC-3 represents more of a bypass. Seasonal variations shown in the table are discussed below.
Table 2-10. Synoptic Nutrient Sampling Results for Saltese Flats Surface Water Quality Data
General Location: PracticalProject ID: Quantitation QC-1 UT-1 SC-1 SC-3 GP-1 SC-6 SL-1
Site Name: Limit (PQL)Quinnamose
CreekUnnamed Tributary
Saltese Creek
Saltese Creek
Graham Pond
Saltese Creek
Shelley Lake
April 2009 (High Water/High Flow Conditions)Ammonia as N mg/L 0.05 <0.05 <0.05 <0.05 0.075 0.430 <0.05 <0.05
Total Kjeldahl Nitrogen (TKN) mg/L 0.1 0.530 0.285 0.260 1.46 3.13 0.622 0.653Total Phosphorous (P) mg/L 0.005 0.0380 0.0488 0.0646 0.0555 0.0807 0.0803 0.0684
Nitrate (NO3) mg/L 0.1 <0.1 <0.1 <0.1 <0.1 0.100 0.449 0.149Nitrite (NO2) mg/L 0.1 <0.1 <0.1 <0.1 <0.1 <0.1 <0.1 <0.1
Total Persulfate Nitrogen (TPN) mg/L 0.1 0.148 0.158 0.260 1.13 3.56 0.747 0.952Orthophosphate (OPO4) mg/L 0.01 0.00971 0.0149 0.0241 0.0112 0.0462 0.0419 0.0114
July 2009 (Low Water/Low Flow Conditions)Ammonia as N mg/L 0.01 0.028 0.026 0.039 0.047 0.099 0.209 0.047
Total Kjeldahl Nitrogen (TKN) mg/L 0.1 0.158 0.199 0.168 1.55 2.85 1.59 0.629Total Phosphorous (P) mg/L 0.005 0.0224 0.0496 0.540 0.0695 0.217 0.198 0.0392
Nitrate (NO3) mg/L 0.1 <0.1 <0.1 <0.1 <0.1 <0.1 <0.1 <0.1Nitrite (NO2) mg/L 0.1 <0.1 <0.1 <0.1 <0.1 <0.1 <0.1 <0.1
Total Persulfate Nitrogen (TPN) mg/L 0.1 0.152 0.187 0.184 1.12 2.78 1.09 0.477Orthophosphate (OPO4) mg/L 0.005 0.0345 0.0502 0.0703 0.0320 0.133 0.0643 0.0228
Change between April and July
Ammonia as N ---- ---- ---- ↓ ↓↓ ↑↑ ----Total Kjeldahl Nitrogen (TKN) ↓ ↓ ↓ NC ↓ ↑ NC
Total Phosphorous (P) ↓ NC ↑↑ ↑ ↑↑ ↑↑ ↓Nitrate (NO3) NC NC NC NC ↓ ↓↓ ↓Nitrite (NO2) NC NC NC NC NC NC NC
Total Persulfate Nitrogen (TPN) NC NC ↓ NC ↓ ↑ ↓Orthophosphate (OPO4) ↑↑ ↑↑ ↑↑ ↑↑ ↑↑ ↑ ↑
↓ ↑ Decrease or Increase
↓↓ ↑↑ Decrease or Increase greater than 100%NC Very little or no change---- Unable to determine
Above Flats On Flats Below Flats
In April ammonia was below the detection limit (<0.05 mg/l) at upgradient surface water locations (QC-1, UT-1, and SC-1). Locations on the Flats (SC-3, GP-1) showed ammonia values of 0.075 and 0.430 mg/l. Ammonia was below the detection limit (<0.05 mg/l) at downgradient surface water locations (SC-6, and SL-1). In July ammonia was detected at all sites but the detection limit was lower. Some seasonal varia-tion in ammonia is evident by decreases at SC-3 and GP-1 and an increase at SC-6 between April and Ju-ly. Total Kjeldahl Nitrogen (TKN) in April ranged from 0.26 to 0.53 mg/l at upgradient surface water loca-tions (QC-1, UT-1, and SC-1). Locations on the Flats (SC-3, GP-1) showed TKN values of 1.46 mg/l and 3.13 mg/l. Location GP-1 is more reflective of changes as water moves through the Flats and this sample shows elevated TKN values, indicative of nitrogen enrichment. TKN was (0.62 mg/l and 0.65 mg/l) at

Data Update and On-Site Feasibility Report Saltese Flats Wetland Restoration Investigation
January 2010 30 .00
downgradient surface water locations (SC-6, and SL-1). Between April and July TKN levels decreased at four locations (QC-1, UT-1, SC-1, and GP-1), remained unchanged at two locations (SC-3 and SL-1), and decreased at SC-6. Nitrogen components nitrate and total persulfate nitrogen also showed similar trends to that of TKN. Be-tween April and July concentrations of these constituents remained mostly unchanged at locations above the Flats and at SC-3. Nitrate showed a seasonal decrease at GP-1, SC-6, and SL-1. TPN also decreased at GP-1 and SL-1 but increased at SC-6. Like nitrogen components, downstream increases in total phosphorus and orthophosphate were also ap-parent but less distinct. Upgradient sites were 0.038, 0.048 mg/l and 0.064 mg/l. Flat locations were 0.055 and 0.081 mg/l. Below Flats sites were 0.08 and 0.068 mg/l. A similar pattern of variability was observed for orthophosphate, with some indication of increase of orthophosphate from 0.024 to 0.042 mg/l from the uppermost site in Saltese (SC-1) to the lowermost site (SC-6). Between April and July total phosphorous showed a significant increase at three locations (SC-1, GP-1, and SC-6) and an increase as well at SC-3, while concentrations decreased at QC-1 and SL-1 and were unchanged at UT-1. Ortho-phosphate levels increased at all locations between April and July, with significant increases at QC-1, UT-1, SC-1, SC-3, and GP-1. Nutrient results suggest a distinct increase in nitrogen components through Saltese Flats. Increases in phosphorus may also be occurring. It is worthwhile to note that these values tend to decline once surface water leaves the Flats, but still remain elevated relative to the uppermost sites. The cause of nutrient enrichment through the Flats is undocumented, but is commonly associated with application of fertilizers or septic systems. Wetland systems are also known to generate nitrogen (and to a lesser extent phosphorus), especially if water tables are manipulated or periodically drained. The espe-cially elevated values of nutrients observed in Graham Pond would appear to be a function of applied fer-tilizer rather than naturally occurring. It is worthwhile to note that Graham Pond also has elevated values for many other anion and cation constituents (Appendix D, Table D-5). Finally, these conclusions should be interpreted with caution because two synoptic events are not suffi-cient to draw definitive conclusions about the source and fate of nutrients. Shelley Lake Shelley Lake field monitoring was performed on two dates in July and August of 2007 and that data was provided by the Spokane County Conservation District (Appendix D, Table D-6). Readings for pH, conductivity, temperature, and dissolved oxygen were taken at discrete sampling depths every meter to a maximum depth of 6 meters. Results on July 3 showed the lake was weakly stratified, with temperatures decreasing from 22.5 C to 17 C at the 6 meter depth. Conductivity increased slightly from 191 to 213 umhos/cm. pH decreased from 9.2 to 7.4, and dissolved oxygen decreased from 8.8 to 1.3 ppm. Results on August 14 showed the lake was weakly stratified, with temperatures decreasing from 22.8 C to 20 C at the 6 meter depth. Conductivity increased slightly from 202 to 252 umhos/cm. pH decreased from 8.8 to 7.2, and dissolved oxygen decreased from 9.2 to 1.4 ppm. Results from both sampling dates indicate that strong oxygen depletion is occurring at depth in Shelley Lake during the summer. Thermal stratification contributes to depletion, however, the main cause is like-ly to be nutrient enrichment and elevated oxygen demand created by decomposing organic matter in the lake bottom. Note that stratification was especially weak in the August event, and Shelley Lake contin-ued to show a distinct oxygen sag. Observed oxygen levels are generally unsuitable for maintaining a fishery. Probable nutrient enrichment is supported by the Secchi Disk observation of 1.8-2 meters. Shel-ley lake would be considered a eutrophic system.

Data Update and On-Site Feasibility Report Saltese Flats Wetland Restoration Investigation
January 2010 31 .00
Primary productivity in Shelley Lake is likely to be phosphorus limited since large amounts of nitrogen are available via inflows from Saltese Flats. The possible contribution of nutrients from lakeshore devel-opment is unknown, but may also contribute to poor water quality with respect to trophic status. Groundwater Nutrients Overall, groundwater data showed much higher nutrient concentrations than surface water sites (Appen-dix D, Table D-4). Ammonia ranged from 0.489 to 7.39 mg/l. Five of the six shallow wells (SFW-1, SFW-2, SFW-4, SFW-7, and SFW-12) had ammonia concentrations greater than 2 mg/l. TKN ranged from 7.1 to 15.5 mg/l in these same wells. Total phosphorus ranged from 0.25 to 1.41 mg/l, and ortho-phosphate ranged from 0.034 to 0.056 mg/l. A single deep well (DW-1) did not show comparably ele-vated nitrogen levels. These nutrient values observed in shallow wells are greatly elevated relative to typically occurring background levels, and in particular the elevated nitrogen results strongly suggest con-tribution from fertilizer sources. Because nitrates were not observed at detectable levels (<0.1 mg/l), oxidation of ammonia does not ap-pear to be occurring at a significant rate in shallow wells. This suggests a strongly reducing/anoxic (i.e. oxygen deprived) groundwater system. This is consistent with perennially saturated conditions and low groundwater flow conditions.

Data Update and On-Site Feasibility Report Saltese Flats Wetland Restoration Investigation
January 2010 32 .00
3.0 WATER BUDGET Water budgets for the Saltese Flats basin were developed to quantify water flow through the system and to assist in evaluating the feasibility of restoration scenarios. Several assumptions used in the develop-ment of the water budgets are based on limited data and therefore the water budget scenarios presented should be considered preliminary estimates of system behavior that may be refined as additional data be-come available. 3.1 Methodology Water budgets for the Saltese basin were estimated by quantifying water inputs, outputs and storage. In-puts included monthly precipitation, surface water inflow, and groundwater inflow. Outputs included evapotranspiration (ET), vertical groundwater leakage to underlying consolidated sediments and bedrock, horizontal groundwater outflow towards the Spokane aquifer, and surface water outflow in Saltese Creek. Water budgets were developed for average conditions, a wet year (10th percentile), and a dry year (90th percentile). Water budgets were also developed to represent anticipated conditions for several manage-ment scenarios including application of reclaimed water. Water budget input/output parameters are de-scribed below. Inputs 1) Precipitation: Precipitation estimates were derived using meteorological data from the Spokane airport, and a short term record at Liberty Lake. Monthly values for Saltese Flats were estimated by correlating the Liberty Lake record to the Airport record, and adjusting precipitation values for the airport data to reflect probable conditions. Average precipitation for the Saltese basin was estimated to be 19 inches, “dry” year precipitation was estimated to 13 inches, and “wet” year precipitation was estimated to be 27 inches. 2) Surface Water: Monthly surface water inflows were estimated using a methodology developed by the USGS for ungaged basins in western Montana (Parrett and Cartier 1990). This method was developed using gaged records from 59 watersheds in western Montana, and correlated monthly flows to physical characteristics including drainage area, basin relief, basin slope, mean annual precipitation, mean basin elevation, percentage of basin above 6000 ft, and basin perimeter. This multiple regression technique enables prediction of mean monthly flows, and also the 90th or 10th percentile flow values. No comparable technique for estimating monthly flows has been developed for Eastern Washington. The Montana equations should be applicable to the Saltese basin because they were developed for watersheds with comparable physical characteristics (area, elevation, precipitation, vegetation, relief, meteorology, etc). The area of Saltese Flats which contributes to surface and groundwater inputs amount to 21.9 square miles. Monitoring in 2009 was considered representative of an average year, and no surface water runoff was observed from discrete drainages serving nearly 12 sq. mi. of the basin. These areas are primarily located in the western half of the watershed, with some additional contributing area located at drier, low elevation locations along the Flats on the eastern boundary. The fate of precipitation in these dry areas and why surface water flow was not observed is unclear at this time. For purposes of modeling, a drai-nage area of 10 sq. mi. was used to develop monthly surface water flow estimates for “average” and “dry” scenarios. An area of 21 sq. mi. was used to represent anticipated contributing area for the “wet” year scenario.

Data Update and On-Site Feasibility Report Saltese Flats Wetland Restoration Investigation
January 2010 33 .00
3) Groundwater Inflow: Groundwater flux to the Saltese Flats area from the surrounding hillsides and small alluvial systems is difficult to quantify. No data exist to reliably estimate these values, however, they are likely to be relatively small compared to surface water inflows. The water budget makes the fol-lowing assumptions to arrive at this value:
• A total cross sectional area for aquifers is 5000 feet2; • Average aquifer depth is 10 feet; • Gradient is 0.01; and • Hydraulic conductivity is 20 ft/day.
Outputs 1) Evapotranspiration (ET): Monthly evapotranspiration estimates were derived using meteorological data from the Spokane airport. The published pan evaporation rates were adjusted by a coefficient of 0.8 to represent evapotranspiration values for Saltese. Evapotranspiration for the Flats is estimated to be 38.7 inches/year. 2) Surface Water Outflow: The surface water output is a value that is calculated and can also serve as a calibration value. The calculation involves summing water inputs and accounting for storage plus outputs (ET, vertical leakage, groundwater outflow). The remainder is surface water flow. This value also served as a calibration metric by comparison of modeled results to field measurements in Saltese Creek. 3) Groundwater Outflow: Monthly groundwater flux leaving the Saltese Flats area is difficult to quantify due to limited data on aquifer characteristics. Water leaves the Flats via both surface and groundwater. Few data exist to reliably estimate these values, however, groundwater outflow is likely to be compara-tively small relative to surface water outflows. Groundwater flow leaving nearby Liberty Lake has been estimated to be 3 cfs, but at Saltese Flats the geology is interpreted to be essentially a bowl of sediment with a narrow lip in the northwest which limits groundwater flow. The water budget makes the following assumptions to arrive at this value:
• A total cross sectional area for the aquifer is 80,000 feet2; • Average aquifer depth is 40 feet; • Gradient is 0.005; and • Hydraulic conductivity is 100 ft/day. Conductivity values and aquifer transmissivity (i.e. aquifer
depth x conductivity) may vary from these assumptions, and may have a significant influence on modeled results if they differ greatly.
Storage Storage of water in the Saltese Flats is a dynamic and significant factor influencing surface water out-flows throughout much of the year. Water levels in the Flats rise and fall 3-4 feet over the course of the year. Surface water inflows go into storage during the spring as water levels rise, and water is lost in summer due to ET, and surface or groundwater outflows. Storage is also manipulated by human activities including drainage ditches, irrigation, and operation of stopboards placed in structures to retain or release water from the study area. The storage component was estimated by using monthly changes in water level to determine storage (or release) by month. For purposes of creating the water budget, the majority of the Flats (720 acres) was assumed to respond uniformly. This is the area of the Flats with wet conditions created by excess surface and groundwater. The porosity of the soils and aquifer in the Flats was assumed to be 0.4. The monthly change in storage was estimated by multiplying the change in water level x area x porosity. This results in an ac-ft/mo estimate of storage. For example, a change in groundwater level of 1 ft corresponds to a change in storage of 720 ac x 1 ft x 0.4, or 288 ac-ft. Changes in water level of 4 ft over the season would result in 1152 ac-ft of storage.

Data Update and On-Site Feasibility Report Saltese Flats Wetland Restoration Investigation
January 2010 34 .00
Water released from storage is lost to a combination of ET, groundwater, and surface water. Partitioning this water into the various outflow components is a dynamic physical process that requires various as-sumptions to be made in the water budget. ET and surface water values can be most reliably estimated or measured. After adjusting for ET, the remaining outflow is partitioned between surface water and groundwater. Surface water flows entering and leaving the Flats have been measured though data are li-mited. The groundwater flux is estimated from slope x hydraulic conductivity x cross-sectional area and is assumed to be steady state. For purposes of the model, groundwater outflows were assumed to be con-stant. Although they are likely to vary seasonally, no physical data were available to reliably quantify groundwater outflows. Shelley Lake Modeled surface water output for water budget scenarios below is assumed to be delivered to Shelley lake. A variety of factors may influence actual delivery of water to the lake: 1) Modeled results for surface water output from the Flats (i.e. timing, flow rate, and volume) may differ significantly from conditions observed on the ground; 2) Infiltration of surface water in the reach of Saltese Creek between the Flats and Shelley Lake is not well documented, particularly for high flow conditions. A pair of readings from one point in time indi-cated a loss of 0.68 cfs between the outlet and Shelley Lake when water was leaving the Flats at 3.32 cfs. It is unknown how much that loss would increase during higher flows. It also appears that infiltration rates vary along the creek channel. Immediately below the Flats water has been observed in the channel year round but with no visible flow, while further downstream the channel is dry suggesting higher infil-tration rates in the lower portion of the channel; 3) Groundwater outflows are likely to vary seasonally, and the assumed outflow rates may not be repre-sentative. Water leaving the Flats is largely assumed to be surface water, but may in fact leave the Flats as groundwater. Groundwater outflows are unlikely to reach Shelley Lake because of the high conductiv-ity nature of the SVRP aquifer materials. Very little information is available to reliably quantify ground-water/surface water interaction at the transition from the Flats to the SVRP aquifer; and 4) Average and maximum infiltration rates for Shelley Lake are not well understood, particularly for sce-narios where applied reclaimed water may increase inflow to Shelley Lake beyond baseline conditions. Infiltration rates are unlikely to be constant at 10-12 cfs, but may increase or decrease depending on the magnitude and timing of inflow conditions and the lake surface elevation. Considerations Finally, the Saltese project envisions a variety of wetland restoration/creation strategies that may ultimate-ly influence the water budget calculations. However, these changes are likely to be relatively small for the following reasons. Potential changes in ET due to wetland creation are likely to have a minor influ-ence on existing site ET and the overall water budget. Potential changes in storage may result from crea-tion of wetland cells, but these too are likely to be minor unless additional storage is created on a large scale. 3.2 Water Budget Scenarios Scenarios modeled using the water budget included the existing site under average year, dry year, and wet year conditions. The “dry” or “wet” years would each be infrequent conditions expected 10 in 100 years. Individual storm events were not modeled for purposes of developing overall water budgets. These mod-eling scenarios formed the baseline for additional scenarios involving the application of reclaimed water. Reclaimed water application rates of 7 mo/year (April 1-October 30) were considered for 8, 12, and 14 million gallons per day (MGD) in an average year, and 14 MGD in a wet year. These 7 scenarios are numbered below.

Data Update and On-Site Feasibility Report Saltese Flats Wetland Restoration Investigation
January 2010 35 .00
1) Existing condition, average year 2) Existing condition, dry year 3) Existing condition, wet year 4) 8 MGD, 7 months, average year 5) 12 MGD, 7 months, average year 6) 14 MGD, 7 months, average year 7) 14 MGD, 7 months, wet year
Results of these modeling scenarios are summarized in Table 3-1 and Table 3-2, and individual scenarios are found in Appendix G. Results presented in Table 3-1 and Table 3-2 represent surface water outputs that are potentially expected to reach Shelley Lake. Individual components of water budget inputs and outputs are found in Appendix G.
Table 3-1. Average Outflow (cfs) from Saltese Flats by Modeling Scenario
Existing Condition Applied Reclaimed Water Scenarios Infiltration Avg.
Year Dry Year
Wet year
8mgd/ 7mo/avg
12mgd/ 7mo/avg
14mgd/ 7mo/avg
14mgd/ 7 mo wet
Shelly Lake
Scenario 1 2 3 4 5 6 7 Month January 2.45 1.30 5.19 2.4 2.4 2.4 5.37 12 February 1.77 0.96 3.86 1.8 1.8 1.8 3.99 12 March -0.47 -1.42 4.76 -0.5 -0.5 -0.5 4.92 12 April 3.99 -5.37 36.70 21.3 27.5 30.6 71.27 12 May 3.26 -9.06 43.99 22.9 29.1 32.2 84.74 12 June -2.28 -6.60 11.28 12.4 18.6 21.7 39.22 12 July -1.02 -3.34 18.04 6.5 12.7 15.8 28.15 12 August -1.41 -2.78 12.85 6.1 12.3 15.4 22.83 12 September 0.14 -0.96 10.83 8.9 15.1 18.2 23.76 12 October 5.02 3.54 13.46 15.1 21.3 24.4 29.46 12 November 4.07 2.97 8.55 4.1 4.1 4.1 5.76 12 December 2.73 1,67 5.17 2.7 2.7 2.7 5.30 12 *note: negative numbers indicate no surface flow.
Table 3-2. Average Outflow (Ac-Ft) from Saltese Flats by Modeling Scenario
Existing Condition Applied Reclaimed Water Scenarios Infiltration Avg. Dry Wet 8mgd/
7mo/avg 12mgd/ 7mo/avg
14mgd/ 7mo/avg
14mgd/ 7 mo wet
Shelly Lake
Scenario 1 2 3 4 5 6 7 Month January 151 80 319.3 147 147 147 322 720 February 109 59 237.3 106 106 106 239 720 March -29 -87 292.7 -28 -28 -28 295 720 April 245 -330 2256.7 1276 1647 1833 4276 720 May 200 -557 2704.5 1375 1746 1932 5084 720 June -140 -406 693.4 747 1118 1304 2353 720 July -63 -205 1109.1 392 763 949 1689 720 August -87 -171 790.1 368 739 925 1370 720 September 9 -59 665.8 535 907 1092 1426 720 October 309 217 827.6 907 1279 1464 1767 720 November 250 183 525.7 244 244 244 346 720 December 130 102 318 164 164 164 318 720
Total 1122 -1174 10740 6233 8832 10132 19486 8640 * note: negative numbers indicate no surface flow.

Data Update and On-Site Feasibility Report Saltese Flats Wetland Restoration Investigation
January 2010 36 .00
Scenario 1: Baseline Conditions (Average Year) Inputs Scenario 1 represents baseline conditions in an average year. The runoff modeling suggested that com-bined peakflows for tributary streams entering Saltese Flats would be expected to approach 15 cfs, with baseflows of about 1 cfs (Appendix G, Table G-1). This corresponds to approximately 2720 ac-ft of surface water input. Precipitation amounts to approximately 1140 ac-ft over 720 acres of the Saltese Flats area. Precipitation over the remainder of the drainage is accounted for in the surface water runoff and groundwater inflow estimates. Annual groundwater input to the Flats amounts to 8.3 ac-ft. The total input to the Flats (sur-face water, direct precipitation, and incoming groundwater) is 3870 ac-ft annually (Figure 3-1).
0
500
1000
1500
2000
2500
3000
PPT_input GW_input SW_input Storage ET_output GW Leakage GW to SVRP SW_output
Source
Volu
me
(Ac-
Ft)
Figure 3-1. Water Budget Components for Average Year, Baseline Condition
Outputs Evapotranspiration (ET) is estimated to be 2324 ac-ft annually. Vertical groundwater leakage from be-neath Saltese Flats was estimated to be 130 ac-ft, and groundwater flux leaving the Flats to the northwest was estimated to be 330 ac-ft. The total outputs amount to 2784 ac-ft. These results suggest that there is a net water yield from the Flats of 1085 ac-ft in an average year. This corresponds to flows ranging from 0 to 5 cfs over the year. Water storage in the Flats is a dynamic process and is an important factor in the timing of surface and groundwater outflows from the Flats. Water goes into storage in the spring as water tables rise, and is released from storage as the water table falls. This dynamic attenuates spring peak flows leaving the Flats, and potentially sustains flow as the spring peak subsides. This attenuation of flows may alter mod-eled surface and groundwater outputs from those presented in the water budget. As discussed previously,

Data Update and On-Site Feasibility Report Saltese Flats Wetland Restoration Investigation
January 2010 37 .00
storage in the Flats can be expected to result in a positive or negative 1152 ac-ft component in the water budget as the water table rises or falls 4 ft over the year. Limitations Existing flow and water yield information clearly present several contradictory findings, as well as va-riance with respect to the modeling effort. The predicted inflow values to Saltese Flats for the baseline scenario are significantly higher than inflows observed by PBSJ in 2009 monitoring events. A maximum instantaneous value of 14.6 cfs was observed in the field on 4/21/09 (Section 2.6). The model suggests that inflows should average from 12-15 cfs over two months in the spring. Thus inflows appear to be overestimated by the present modeling effort. Note that the contributing drainage area was reduced to 10 sq. mi. and nevertheless results in an apparent overestimate of inflows. The modeled average annual water yield for inflows for the baseline condition totals 3870 ac-ft, and the outflow was estimated to be 1085 ac-ft. Note that this value is significantly lower than estimates devel-oped by nearly all previous studies (Table 2-7). These previous estimates ranged from 17,000 to 20,000 ac-ft for inflow to the Flats, with the exception of the 2007 study. The present modeling results are more in line with the 2007 study and the observed flows in 2009, but conflict with earlier efforts. Monitoring data in 2009 suggested that measured Saltese Flats inflows and water yields are actually lower than modeled results. Conversely, the Liberty watershed is about 7.6 sq. mi. and produces more than twice as much water as the adjoining 10 sq. mi Saltese drainage area. The same modeling technique ap-plied to Liberty would underestimate observed flows, and overestimate Saltese flows. This would appear to be an unusual result given that the basins are physically similar. Overall, the modeled values for Saltese surface water input appear appropriate, though the discrepancy with the adjoining Liberty Creek watershed is difficult to rationalize. Nevertheless, observed flows in the combined Saltese drainages had approximately 40% of the corresponding Liberty values on average. Thus calibration of modeling towards the observed Saltese values would seem to be appropriate. Because modeled values do appear to be high when compared to 2009 Saltese monitoring data, the baseline condi-tion may be overly conservative for average runoff years. While this conservative approach does suggest limitations for potential reclaimed water application in the following scenarios, it also provides some as-surance that modeled results will not be overly optimistic. Scenario 2 (Dry Year) The second scenario modeled expected results for a dry year, i.e. a series of monthly flows that would be expected only once in ten years on average. No field data is available as a calibration or benchmark. This water budget relies in large part on the validity of assumptions made in the baseline scenario, and also the inherent statistical validity and applicability of the equations for the monthly surface water flow measurements. The modeled annual water yield for inflows for the dry condition totals 1585 ac-ft, the losses amounted to 2784 ac-ft, and the outflow to Shelley Lake was estimated to be -1174 ac-ft. This suggests a no-recharge condition for Shelley Lake, and implies a corresponding decline in the water level in the Flats of perhaps 4 feet. Scenario 3 (Wet Year) The third scenario modeled expected results for a wet year, i.e. a series of monthly flows that would be expected only once in ten years on average. Like the dry year scenario, no field data is available as a ca-libration or benchmark. This water budget relies in large part on the validity of assumptions made in the

Data Update and On-Site Feasibility Report Saltese Flats Wetland Restoration Investigation
January 2010 38 .00
baseline scenario, and also the inherent statistical validity and applicability of the equations for the monthly surface water flow measurements. The modeled annual water yield for inflows for the wet condition totals 13064 ac-ft, the losses amounted to 2784 ac-ft, and the outflow to Shelley Lake was estimated to be 10,740 ac-ft. This suggests a recharge condition for Shelley Lake, and a corresponding inflow ranging from 5 to 44 cfs. The high values of 37 to 44 cfs exceed the documented infiltration rates for Shelley Lake, and imply that once in 10 years, flows exceeding the capacity of Shelley Lake are anticipated. Note that the “wet” scenario assumes 21 sq. mi. of contributing area, as opposed to 10 sq. mi. in the preceding scenarios. This modeled contributing area for wet year/high flow may be greater than actual area, and may over estimate surface water flow rates. Scenario 4 (Average Year, 8 MGD) Scenario 4 modeled expected results for an average year assuming the application of 8 MGD (i.e. 12.4 cfs) of reclaimed water over 7 months. No field data are available as a calibration or benchmark to verify potential outputs from the Flats with the addition of reclaimed water. The modeled results, shown on Figure 3-2, rely on the representativeness of the baseline scenario and assumptions about response of the system to applied water.
0
1000
2000
3000
4000
5000
6000
7000
PPT_input GW_input SW_input RW_input Storage ET_output GWLeakage
GW toSVRP
SW_output
Source
Volu
me
(Ac-
Ft)
Figure 3-2. Water Budget Components for Average Year With 8MGD Reclaimed Water
The modeled annual water yield for inflows for the wet condition totals 3869 ac-ft, the losses amounted to 2784 ac-ft, and the outflow to Shelley Lake was estimated to be 6233 ac-ft. This suggests a recharge condition for Shelley Lake, and a corresponding inflow ranging from 0 to 23 cfs. Four months exceed 12 cfs, the expected upper limit of infiltration capacity for the lake. Two of the months are near the infiltra-tion capacity of the lake, and two are greater than 20 cfs. This suggests that during two months in April and May, the applied reclaimed water scenario may exceed the infiltration capacity of the lake.

Data Update and On-Site Feasibility Report Saltese Flats Wetland Restoration Investigation
January 2010 39 .00
Scenario 5 (Average Year, 12 MGD) Scenario 5 modeled expected results for an average year assuming the application of 12 MGD (i.e. 18.6 cfs) of reclaimed water over 7 months. Like the previous scenario, no field data are available as a calibra-tion or benchmark to verify potential outputs from the Flats with the addition of reclaimed water. The modeled results rely on the baseline scenario and assumptions about response of the system to applied water. The modeled annual water yield for inflows for the wet condition totals 3869 ac-ft, the losses amounted to 2784 ac-ft, and the outflow to Shelley Lake was estimated to be 8832 ac-ft. This suggests a recharge condition for Shelley Lake, and a corresponding inflow ranging from 0 to 23 cfs. Seven months exceed 12 cfs, the expected upper limit of infiltration capacity for the lake. Two of the months are near the infil-tration capacity of the lake, and 5 are greater than 14 cfs. This suggests that during five months in April-June and Sept-Oct, the applied reclaimed water scenario may exceed the infiltration capacity of the lake. Scenario 6 (Average Year, 14 MGD) Scenario 6 modeled expected results for an average year assuming the application of 14 MGD (i.e. 21.7 cfs) of reclaimed water over 7 months. Like the previous scenarios, no field data are available to verify potential outputs from the Flats with the addition of reclaimed water and the modeled results rely on the baseline scenario and assumptions about response of the system to applied water. The modeled annual water yield for inflows for the wet condition totals 3869 ac-ft, the losses amounted to 2784 ac-ft, and the outflow to Shelley Lake was estimated to be 10,132 ac-ft. This suggests a recharge condition for Shelley Lake, and a corresponding inflow ranging from 0 to 32 cfs. Seven months exceed 12 cfs, the expected upper limit of infiltration capacity for the lake. All 7 months during the reclaimed water application period are greater than 15 cfs. This suggests that throughout the reclaimed water appli-cation period, the applied reclaimed water scenario may exceed the infiltration capacity of the lake. Scenario 7 (Wet Year, 14 MGD) Scenario 7 modeled expected results for a wet year assuming the application of 14 MGD (i.e. 21.7 cfs) of reclaimed water over 7 months. This scenario is intended to represent a worst case, i.e. the application of the maximum reclaimed water in the wettest year. The modeled annual water yield for inflows for the wet condition totals 10,380 ac-ft, the losses amounted to 2784 ac-ft, and the outflow to Shelley Lake was estimated to be 19,486 ac-ft. This suggests a recharge condition for Shelley Lake, and a corresponding inflow ranging from 4 to 85 cfs. Seven months exceed 12 cfs, the expected upper limit of infiltration capacity for the lake. All 7 months during the reclaimed water application period are greater than 22 cfs. This suggests that throughout the reclaimed water appli-cation period, the applied reclaimed water scenario will exceed the infiltration capacity of the lake. Applied Reclaimed Water Scenarios 4-7 The applied reclaimed water scenarios suggest that the infiltration capacity of Shelley Lake may be ex-ceeded from 2 to 7 months of the year. In average runoff years with 8 MGD of applied reclaimed water, the modeling results would indicate that flows must be diverted to the gravel pit at least a portion of the time, generally in spring (April-May). These predictions of flow to the gravel pit may overestimate the actual time flow reaches the gravel pit for several reasons. These have been discussed above, and are summarized below.
1) Modeling results for the average year suggest average peak surface water flows entering Saltese Flats that are greater than the field measurements made during this study. Thus the model may

Data Update and On-Site Feasibility Report Saltese Flats Wetland Restoration Investigation
January 2010 40 .00
also over-estimate the baseline inputs, and therefore overestimate outflows with reclaimed water application.
2) Groundwater flows leaving the Flats and lost to the SVRP are assumed to be constant under the baseline condition, and also the applied reclaimed water condition. This is unlikely to be the case as increased reclaimed water inputs are likely to result in increased groundwater outputs. At this time, data are unavailable to quantify the physical subsurface flow conditions at the north end of the Flats or how they may vary under applied reclaimed water scenarios
3) Surface water losses between the Flats and Shelley Lake are poorly understood, particularly at high flow conditions when losses to the SVRP are likely to increase significantly.
4) Irrigation withdrawal/consumptive use exists within the basin, and these have not been fully quantified. Golder reported a volume of 1875 ac-ft annually for existing surface water rights. Withdrawals of this amount are sufficient to influence conclusions about the length of time that outflows from applied reclaimed water scenarios may exceed the infiltration capacity of Shelley Lake.
5) The storage component in Saltese Flats is based on a maximum groundwater storage of 4 feet (i.e. the baseline condition). Data and field observations suggest that at least some areas of the Flat have the capacity to accommodate additional water as subsurface storage, and also as surface sto-rage (i.e. ponded water, or natural wetland areas). Constructed wetland areas may also provide additional capacity.
Assuming that these unquantified additional losses which are not fully incorporated into the baseline sce-nario amount to 1500 ac-ft, and that storage may account for an additional 500 ac-ft, the 8 MGD scenario may not exceed the infiltration capacity of Shelley Lake in an average year. Dry years would also not be expected to exceed the capacity of Shelley Lake at 8 MGD. Because the water budget relies on numerous assumptions, many of which have not been verified with sufficient data, results presented in the above scenarios should be interpreted with caution. Data Needs 1) Inflows to Saltese Flats, and the contributing drainage area in average or wet years is poorly unders-tood at this time. The watershed area contributing to surface water flows within Saltese Flats was as-sumed to be 14,000 acres based on topography. The active watershed area for average conditions appeared to be much smaller in 2009 due to the absence of any measurable surface water input from the western half of the basin. This needs to be reviewed in more detail, and additional surface water flow observations are needed to better understand inflows. Inflows predicted by the model are higher than the actual flows measured during the one year of data collection for this study. 2) Groundwater measurements within the Flats have provided important information about storage ca-pacity, but relatively little insight into how much water is leaving the Flats as groundwater underflow. Water leaving the Flats as groundwater is lost to the SVRP aquifer, and surface water leaving the Flats is largely delivered to Shelley Lake. Understanding groundwater losses from the Flats to the SVRP aquifer is important because for applied reclaimed water scenarios the groundwater component may be the decid-ing factor in determining the feasibility of implementing applied reclaimed water strategies. 3) Improving our understanding of losses along Saltese Creek on the way to Shelley Lake is important because losses along the Saltese creek channel may be significant. At present, we have few data to charac-terize this variable. In addition, manipulation of water within the Flats has complicated this analysis. 4) In addition to data needs above, the most robust approach to evaluate transient effects of storage, or simulate applied reclaimed water scenarios, is with a calibrated physical model. This requires additional data and relies on assumptions whenever no data are available. In this way it is similar to the water budg-et approach adopted for the present effort. However, the physical model offers many advantages in that it integrates all the assumptions and rigorously balances the inputs and outputs. The model can partition
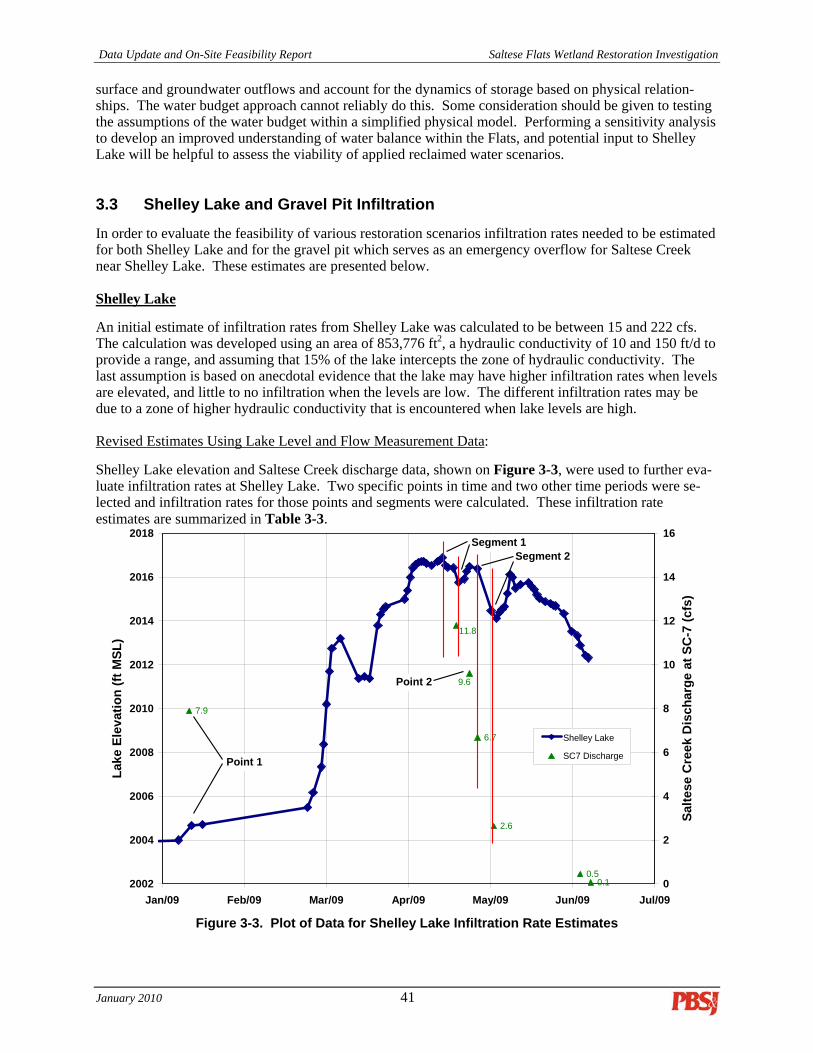
Data Update and On-Site Feasibility Report Saltese Flats Wetland Restoration Investigation
January 2010 41 .00
surface and groundwater outflows and account for the dynamics of storage based on physical relation-ships. The water budget approach cannot reliably do this. Some consideration should be given to testing the assumptions of the water budget within a simplified physical model. Performing a sensitivity analysis to develop an improved understanding of water balance within the Flats, and potential input to Shelley Lake will be helpful to assess the viability of applied reclaimed water scenarios. 3.3 Shelley Lake and Gravel Pit Infiltration In order to evaluate the feasibility of various restoration scenarios infiltration rates needed to be estimated for both Shelley Lake and for the gravel pit which serves as an emergency overflow for Saltese Creek near Shelley Lake. These estimates are presented below. Shelley Lake An initial estimate of infiltration rates from Shelley Lake was calculated to be between 15 and 222 cfs. The calculation was developed using an area of 853,776 ft2, a hydraulic conductivity of 10 and 150 ft/d to provide a range, and assuming that 15% of the lake intercepts the zone of hydraulic conductivity. The last assumption is based on anecdotal evidence that the lake may have higher infiltration rates when levels are elevated, and little to no infiltration when the levels are low. The different infiltration rates may be due to a zone of higher hydraulic conductivity that is encountered when lake levels are high. Revised Estimates Using Lake Level and Flow Measurement Data: Shelley Lake elevation and Saltese Creek discharge data, shown on Figure 3-3, were used to further eva-luate infiltration rates at Shelley Lake. Two specific points in time and two other time periods were se-lected and infiltration rates for those points and segments were calculated. These infiltration rate estimates are summarized in Table 3-3.
7.9
6.7
2.6
0.50.1
9.6
11.8
2002
2004
2006
2008
2010
2012
2014
2016
2018
Jan/09 Feb/09 Mar/09 Apr/09 May/09 Jun/09 Jul/09
Lake
Ele
vatio
n (ft
MSL
)
0
2
4
6
8
10
12
14
16
Salte
se C
reek
Dis
char
ge a
t SC
-7 (c
fs)
Shelley Lake
SC7 DischargePoint 1
Segment 2Segment 1
Point 2
Figure 3-3. Plot of Data for Shelley Lake Infiltration Rate Estimates

Data Update and On-Site Feasibility Report Saltese Flats Wetland Restoration Investigation
January 2010 42 .00
Table 3-3. Summary of Shelley Lake Infiltration Rate Calculations
Max Elev Min Elev Decline Period Flow Meas Avg Inflow Vol Loss Infilt RateSegment (ft) (ft) (ft) (d) (cfs) (cfs) (cfs) (cfs)
1 2016.88 2015.77 1.11 6 11.8 (4/21) 11.8 1.8 13.604/16/09 04/22/09
2 2016.38 2014.46 1.92 5 6.7 (4/29) 4.7 3.8 8.504/29/09 05/04/09 2.6 (5/5)
InflowPoint Date (cfs)
1 01/12/08 7.9
2 04/26/09 9.6
Lake Level
Stable
Slight Decline
• Line Segments 1: Lake levels were at their highest point and were dropping during this interval resulting in a volume loss rate of 1.8 cfs at the lake. However, Saltese Creek discharge near the end of the interval was estimated at 11.8 cfs and may have been higher previous to that time. Adding an assumed discharge rate of 11.8 cfs to the volume loss rate at the lake results in an es-timated infiltration rate of 13.6 cfs.
• Line Segment 2: Lake levels were also near maximum during this interval and dropping. Saltese Creek discharge measured at the beginning and end of the interval were 6.7 and 2.6 cfs, respec-tively. Average discharge is estimated at 4.7 cfs, but based on the discharge trend may have been higher. The estimated infiltration rate for this time interval is 8.5 cfs.
• Points 1 and 2: Lake levels at these two points in time were relatively stable, suggesting the infil-tration rate out the bottom of the lake and the inflow from Saltese Creek were in equilibrium. Saltese Creek discharge at these two times were 7.9 and 9.6 cfs.
In summary, the revised infiltration estimates for Shelley Lake range from 7.9 to 13.6 cfs, with an average value of about 10 cfs. This matches the lower end of the range for the preliminary infiltration calculations suggesting the hydraulic conductivity of the lake bed is much lower than that of the SVRP aquifer, likely as a result of sediment deposition in the lake. These estimates should be refined in the future with more frequent discharge measurements that would allow more accurate calculation of average inflow to the lake during declining lake level periods. Gravel Pit Initial estimates of potential infiltration rates for the overflow gravel pit were calculated to be between 91 and 272 cfs. The calculations are based on an area of 156,816 ft2 and assumed hydraulic conductivity values of 50 and 150 ft/d to provide a range. Water has not been routed to the gravel pit from Saltese Creek for a considerable time, possibly not since the overflow channel was excavated in the 1950’s. Anecdotal information from that time indicates that the gravel pit was able to accommodate all of the flow routed during the flood event. Flow measurements were not taken at that time but based on the past years maximum flows in Saltese Creek the volume routed to the pit was likely well over 12 cfs. For comparison, information was obtained from Ecology regarding infiltration rates in a borrow pit used for the Dishman-Mica road construction project. Infiltration rates for the pit were determined to be 280 and 660 inches per hour. Using the pit area noted above, this equates to infiltration rates greater than 1,000 cfs. These high rates of infiltration for gravel pits above the SVRP aquifer are supported by obser-vations of rapid infiltration in pits near Chester Creek and Newman Lake, although no measured data are available for these locations.

Data Update and On-Site Feasibility Report Saltese Flats Wetland Restoration Investigation
January 2010 43 .00
Infiltration rates would likely be much lower than these estimates if the pit were to be used as in its cur-rent condition due to the presence of debris and compacted soils. In addition, it is likely that repeated use of the pit for overflow would result in sediment deposition and a lowering of the infiltration rate. Howev-er, if properly maintained, it appears based on these preliminary estimates that the pit would be capable of handling high rates of overflow.

Data Update and On-Site Feasibility Report Saltese Flats Wetland Restoration Investigation
January 2010 44 .00
4.0 RESTORATION FEASIBILITY SCREENING This section presents a screening of the feasibility of the various restoration alternatives that have been identified. Each alternative was evaluated using a set of criteria to determine which alternatives are likely to be feasible and which ones are not. The alternatives that are determined to be feasible will be carried through into the next phase of this project which is to develop conceptual designs for those restoration scenarios. 4.1 Restoration Scenario Alternatives The restoration feasibility has been evaluated for three main options that include restoring all of Saltese Flats or smaller portions (Figure 1-3). Each of these three restoration options were evaluated considering natural conditions and using reclaimed water. Reclaimed water use was considered both seasonally (April-October) and year-round. Alternatives evaluated include:
1. Alternative A1: Option A area (342 acres), Natural Hydrology 2. Alternative A2: Option A area (342 acres), Reclaimed Water added year-round (8-14 mgd) 3. Alternative A3: Option A area (342 acres), Reclaimed Water added seasonally (8-14 mgd) 4. Alternative B1: Option B area (342+170 acres), Natural Hydrology 5. Alternative B2: Option B area (342+170 acres), Reclaimed Water added year-round (8-14 mgd) 6. Alternative B3: Option B area (342+170 acres), Reclaimed Water added seasonally (8-14 mgd) 7. Alternative C1: Option C area (1,200 acres), Natural Hydrology and Reclaimed Water
4.2 Screening Criteria Alternatives were screened for feasibility using the following information:
• Results from water budgets – is there enough water for wetland restoration and is there too much water resulting in excessive flow to Saltese Creek?
• Results from surface and groundwater monitoring – does monitoring support water budget predic-tions?
• Land ownership and landowner issues – how many landowners, landowner attitudes toward wet-land restoration?
• Recreation, education and wildlife issues – are there potential opportunities for establishing or enhancing these resources?
4.3 Option A Alternatives Alternative A1: Option A area (342 acres), Natural Hydrology. Under this option, Area A would be restored to wetland conditions under a natural hydrologic regime. Water budget projections presented in Section 3.0 suggest that restoration under this alternative is feasi-ble and there is sufficient water available for wetland maintenance. Surface and groundwater monitoring results were somewhat compromised by manipulation of the Morrison ditches during the monitoring pe-riod, however these results still suggest sufficient water available for wetland restoration. The property where this alternative is located is held by a single landowner. The current land owner has expressed a willingness to consider a wetland restoration project at this site. This alternative could also allow for sig-nificant recreation, education and wildlife opportunities.

Data Update and On-Site Feasibility Report Saltese Flats Wetland Restoration Investigation
January 2010 45 .00
Alternative A2: Option A area (342 acres), Reclaimed water added year-round. Under this option, Area A would be restored to wetland conditions with the addition of reclaimed water year-round. The year-round option for reclaimed water use has been eliminated from further considera-tion at this time due to the potential for ice formation and flooding impacts during winter months. It would be possible to extend reclaimed water discharge at Saltese Flats into the winter period if on-going monitoring for icing conditions were used to determine discharge feasibility. It would also be possible to discharge reclaimed water during winter months if infiltration areas, ponds or other methods were used to reduce surface water discharge downstream of the Flats during icing periods. Alternative A3: Option A area (342 acres), Reclaimed water added seasonally. Under this option, Area A would be restored to wetland conditions with the addition of reclaimed water year-round. Water budget projections presented in Section 3.0 suggest that restoration under this alterna-tive is feasible. Current water budget projections suggest that the addition of reclaimed water may result in significant surface flow to the gravel pit. However, uncertainty concerning several components of the water budget suggests that these flow estimates are high and that actual flows to the gravel pit are likely to be much lower and occur less often. Further refinement of the water budget needs to focus on surface water inputs, groundwater loss at the north end of Saltese Flats and groundwater loss from Saltese Creek. The property where this alternative is located is held by a single landowner. The current land owner has expressed a willingness to consider a wetland restoration project at this site. This alternative could also allow for significant recreation, education and wildlife opportunities. 4.4 Option B Alternatives Alternative B1: Option B area (342+170 acres), Natural Hydrology. Under this option, Area B would be restored to wetland conditions under a natural hydrologic regime. Water budget projections presented in Section 3.0 suggest that restoration under this alternative is feasible and there is sufficient water available for wetland maintenance. Surface and groundwater monitoring re-sults were somewhat compromised by manipulation of the Morrison ditches during the monitoring period, however these results still suggest sufficient water available for wetland restoration. The property where this alternative is located is held by two landowners. Both current land owners have expressed a willing-ness to discuss a wetland restoration project at this site. This alternative could also allow for significant recreation, education and wildlife opportunities. Alternative B2: Option B area (342+170 acres), Reclaimed water added year-round. Under this option, Area B would be restored to wetland conditions with the addition of reclaimed water year-round. The year-round option for reclaimed water use has been eliminated from further considera-tion at this time due to the potential for ice formation and flooding impacts during winter months. It would be possible to extend reclaimed water discharge at Saltese Flats into the winter period if on-going monitoring for icing conditions were used to determine discharge feasibility. It would also be possible to discharge reclaimed water during winter months if infiltration areas, ponds or other methods were used to reduce surface water discharge downstream of the Flats during icing conditions. Alternative B3: Option B area (342+170 acres), Reclaimed water added seasonally. Under this option, Area B would be restored to wetland conditions with the addition of reclaimed water year-round. Water budget projections presented in Section 3.0 suggest that restoration under this alterna-tive is feasible. Current water budget projections suggest that the addition of reclaimed water may result in significant surface flow to the gravel pit. However, uncertainty concerning several components of the water budget suggests that these flow estimates are high and that actual flows to the gravel pit are likely to be much lower. Further refinement of the water budget needs to focus on surface water inputs,
Data Update and On-Site Feasibility Report Saltese Flats Wetland Restoration Investigation
January 2010 46 .00
groundwater loss at the north end of Saltese Flats and groundwater loss from Saltese Creek. The proper-ty where this alternative is located is held by two landowners. Both current land owners have expressed a willingness to discuss a wetland restoration project at this site. This alternative could also allow for sig-nificant recreation, education and wildlife opportunities. 4.5 Option C Alternatives Water budgets and other data suggest that there is the potential for wetland restoration, enhancement and creation projects within the Option C area outside of the Option A and B areas. These potential projects appear to be feasible under both natural hydrology and with the addition of reclaimed water. Further evaluation of these options will not be continued in this study due to the positive feasibility for complet-ing a project on the smaller Option A and B lands and due to the much greater complexity of completing wetland projects outside the Option A and B lands. Wetland projects would be much more complex due to the large number of small landowners and the challenge of coordinating projects. Expressed interest in wetland projects among these landowners have varied from very positive to very negative. This does not preclude individual landowners or groups of landowners from developing wetland projects in the future. Further work on the Option A and B lands would provide additional data on which to base wetland resto-ration decisions for the Option C lands. 4.6 Preferred Restoration Alternatives The preferred restoration alternatives that will be evaluated for conceptual designs during the next step of this project include:
1. Alternative A1: Option A area (342 acres), Natural Hydrology 2. Alternative A3: Option A area (342 acres), Reclaimed Water added seasonally (8-14 mgd) 3. Alternative B1: Option B area (342+170 acres), Natural Hydrology 4. Alternative B3: Option B area (342+170 acres), Reclaimed Water added seasonally (8-14 mgd)
4.7 Review of Washington State Reclaimed Water Use Standards Scenarios modeled in the feasibility study using reclaimed water will be subject to provisions outlined in “Water Reclamation and Reuse Standards,” Washington DOE Publication 97-23. This document outlines standards and practices for a variety of water reuse scenarios including discharge to wetlands, direct re-charge of groundwater, surface water, and a variety of other uses. Potential wetland enhancement and reclaimed water strategies for the Saltese Flats area will likely com-bine elements of several reuse practices. These include 1) application of reclaimed water to constructed and natural wetlands, 2) delivery of reclaimed and native surface water/groundwater to Shelley Lake, and in some circumstances, 3) recharge of potable aquifer via surface percolation at the gravel pit. Overall, the regulations are written for each of these components individually. A strategy employing a combina-tion of these approaches could be expected to require additional Agency review. A brief summary of se-lected criteria are summarized below. Key physical criteria include hydraulic loading rates and alteration of baseline water levels. Average an-nual rates vary from 2 cm/day to 5 cm/day unless net ecological benefits are maintained at higher loading rates. Average monthly water levels are not to increase by more than 10cm relative to pre-augmentation base-line. Peaks may be limited to 15cm/6 times/yr with no excursion lasting more than 72 hours. Criteria may be more stringent in high quality bog or fen settings. These criteria may be modified if unacceptable changes to biological criteria will not occur, or net environmental benefits are obtained.

Data Update and On-Site Feasibility Report Saltese Flats Wetland Restoration Investigation
January 2010 47 .00
Reclaimed water applied to wetlands with human contact/recreational use must meet class A standards. For wetlands contiguous with a P-limited lake, mass loading rates of phosphorus may be an additional consideration for Shelly Lake. Additional requirements include meeting biological criteria and long term monitoring. Aquifer recharge by surface percolation requires meeting groundwater recharge criteria. Parameter con-centrations in reclaimed water higher than 50% of natural groundwater require a site specific hydrogeo-logic investigation in wetland settings to determine that groundwater is not degraded, and that quality of groundwater is fully protective of public health. Sampling and monitoring may be necessary to demon-strate compliance. The minimum pre-treatment standard for reclaimed water is Class A. Water budget results suggest that application of reclaimed water will be partially retained in restored wet-lands during low flow periods. Some outflow to the SVRP aquifer is anticipated via subsurface discharge to the north of the Flats, along Saltese Creek, and potentially to Shelley Lake. During elevated flow months, reclaimed water will comingle with Saltese Flats surface water and groundwater and be dis-charged to Shelly Lake and the SVRP along Saltese Creek. The water budget further suggests that higher peak flow conditions may result in co-mingled native water and reclaimed water being delivered to the SVRP aquifer via Saltese Creek, Shelley Lake and also the gravel pit. Depending on flow rates, reclaimed water co-mingled with native water may be expected to be regulated under both wetland and surface percolation standards. It is unclear whether Shelly Lake could be consi-dered a lake subject to phosphorus mass loading standards, or if it would be considered a surface percola-tion recharge scenario. Because reclaimed water is expected to improve water quality in Shelly Lake, phosphorus mass loading may not be a limiting factor. The gravel pit might be treated as a surface perco-lation groundwater recharge scenario by DOE. However, comprehensive review of the project by DOE may consider Saltese Flats to be the project area and point of compliance. It is possible that both the gra-vel pit and Shelly Lake would not be directly subject to reclaimed water standards. The proposed project would require evaluation by DOE to determine the applicability of the statutes. Several numerical criteria may be difficult to achieve if strictly applied. For example, depending on the modeled scenario, water level variance may periodically exceed numerical criteria for wetlands. Project scenarios include a mix of constructed and enhanced natural wetland areas. The entirety of the project will need to be evaluated by DOE to assess design water levels and operating parameters. Because rec-laimed water would also be comingled with native water prior to delivery to the SVRP, Shelley Lake, or gravel pit, some modification to criteria might be anticipated. For example, the Class A reclaimed water is likely to be of higher quality than native water for some or perhaps many parameters. It may be rea-sonable for water quality standards or monitoring approaches to be modified to reflect the inherently dif-ferent characteristics of native water. Probably the most important guiding principal is that in general the standards make provisions for modifi-cation of most criteria on a case-by-case basis provided that no unacceptable changes to biological criteria occur, or that net environmental benefits are obtained, potable water supplies are maintained, etc. A comprehensive analysis will be required to demonstrate that application of reclaimed water results in no degradation of water quality and results in net environmental benefits.

Data Update and On-Site Feasibility Report Saltese Flats Wetland Restoration Investigation
January 2010 48 .00
5.0 CONCLUSIONS AND RECOMMENDATIONS Data has been gathered over the past year to supplement previously documented existing information. These new data are of both a site-specific (Saltese Flats) and regional nature and were collected under the Monitoring Program, as part of recommendations in the Existing Data Review report (PBS&J, 2009), or discovered as work on this investigation has progressed. The data collection has been completed to de-velop an understanding of current, or baseline conditions, and to assist in the evaluation of potential resto-ration alternatives. The feasibility of potential wetland restoration alternatives, including options using only natural condi-tions and ones including the use of reclaimed water, has been evaluated. Restoration scenarios have been described, with detail provided on water budgets and management alternatives, and screened for feasibili-ty. Four wetland restoration alternatives have been identified for further evaluation in the conceptual design phase of this project. Our current level of understanding of site conditions indicate that each of these four alternatives are feasible. However, some additional work has been identified as necessary to refine the water budgets developed and further define the hydrologic feasibility of these alternatives. Most impor-tant is evaluation of surface water inputs, groundwater losses at the north end of Saltese Flats and groundwater losses from Saltese Creek between the Flats and Shelly Lake. Despite the need for addition-al data collection, all restoration alternatives identified at this time appear to have a high confidence of feasibility. Additional work identified as being necessary to further refine the restoration alternatives include:
1. Extension/Modification of the Monitoring Program: Continuing the Monitoring Program for an additional year, with modifications to some of the locations, is essential for a sufficient under-standing of baseline conditions and for improvements to the developed water budgets. As noted, additional discharge measurements will be needed to improve the accuracy of rating curves and some sites may need to be abandoned or relocated because flow measurements have been difficult (Section 2.6). The additional flow measurements will also be necessary to refine the estimated watershed area (Section 3.2) and to improve the comparison with the nearby Liberty Creek drai-nage (Section 2.6), refine water budget estimates (Section 3.0), and enhance understanding of in-filtration rates out of Shelley Lake (Section 3.3). Additional groundwater level measurements will better define high and low water conditions and the nature of seasonal groundwater fluctua-tions at the site (Section 2.8);
2. Gravel Pit Infiltration: As noted in Section 3.3, potential infiltration rates for the gravel pit near
Shelley Lake have been estimated based on field tests from other locations. Infiltration testing at the gravel pit will help verify the ability of the pit to handle the volume of water from the Flats predicted under some of the restoration scenarios;
3. Groundwater Conditions at Flats Outlet. Uncertainty remains regarding the nature of groundwa-ter flow out the northern portion of the Flats. Improved knowledge of the geology and ground-water conditions in that area will allow better estimates of the volume of groundwater discharge from the Flats and its interaction with the SVRP aquifer. It is recommended that additional stu-dies be conducted in two phases. The first phase would involve field verification and location of existing wells along with a geophysical survey to delineate the geology. The second phase, if deemed necessary, would include drilling and installing monitoring wells at and near the outlet and conducting pumping tests to determine aquifer parameters for groundwater flow estimates;
4. Saltese Creek Infiltration. The amount of water loss through the bed of Saltese Creek between the Flats and Shelley Lake is not well quantified as noted in Section 3.2, with estimates based on

Data Update and On-Site Feasibility Report Saltese Flats Wetland Restoration Investigation
January 2010 49 .00
a single pair of flow measurements. Additional flow measurements from the extended Monitor-ing Program may improve those estimates. Alternatively, infiltration testing would be able to give more reliable estimates of stream bed loss. Testing would involve sealing off portions of the creek, introducing water, and recording the rate of infiltration through the creek bed;
5. Additional Survey Work. As indicated in Section 2.1, additional surveying will likely be neces-sary along Saltese Creek in particular where the overflow channel splits off to the gravel pit near Shelley Lake. Better definition of the maximum Shelley Lake level will also be necessary which may also include surveying along the lake shore.
6. No Degradation Analysis. A comprehensive analysis will be required to demonstrate that appli-cation of reclaimed water results in no degradation of water quality and results in net environ-mental benefits (Section 4.7); and
7. FEMA Map Discrepancy. Several flaws have been identified in the recent FEMA floodplain map that may impact the permitting process. These flaws include a discrepancy in the flood elevation and the omission of the Steen Road gravel pit and over-flow channel linking it to Saltese Creek (Section 2.1). A review and correction of these flaws is recommended.

6.0 REFERENCES Buchanan, J.P., and I.A. Olness, 1993. Ground Water Flow Model of the Spokane Valley Portion of the
Spokane Valley – Rathdrum Prairie Aquifer System. Eastern Washington University. Drost, B.W., and Seitz, H.R., 1978, Spokane Valley−Rathdrum Prairie aquifer, Washington and Idaho:
U.S. Geological Survey Open-File Report 77-829, 79 p. Golder, 2004. Final Storage Assessment, Little and Middle Spokane Watersheds. Prepared by Golder
Associates Inc. for Spokane County and WRIA 55 and 57 Planning Unit. December 2004. 77p. Kahle, S.C., Caldwell, R.R., and J.R. Bartolino, 2007. Hydrogeologic Framework and Ground-Water
Budget of the Spokane Valley-Rathdrum Prairie Aquifer, Spokane County, Washington, and Bonner and Kootenai Counties, Idaho. USGS Sci Invest Report 2007-5041.
Parrett, C and K. Cartier (1990). Methods for estimating monthly streamflow characteristics at ungaged
sites in western Montana. USGS Water Supply Paper 2365, 30p. PBS&J, 2008a. Scope of Work, Schedule and Budget, Saltese Flats Wetland Restoration Investigation.
Prepared by PBS&J for Spokane County Division of Utilities. June. PBS&J, 2008b. Goals and Objectives, Saltese Flats Wetland Restoration Investigation. Prepared by
PBS&J for Spokane County Division of Utilities. August. PBS&J, 2008c. Quality Assurance Project Plan for Saltese Flats Wetland Restoration Investigation. Pre-
pared by PBS&J for Spokane County Division of Utilities. October. PBS&J, 2008d. Monitoring Program Plan, Saltese Flats Wetland Restoration Investigation. Prepared by
PBS&J for Spokane County Division of Utilities. October. PBS&J, 2008e. Task 3 and Task 4 Revised Scope of Work, Saltese Flats Wetland Restoration Investiga-
tion. Prepared by PBS&J for Spokane County Division of Utilities. November. PBS&J, 2009. Existing Data Review, Saltese Flats Wetland Restoration Investigation. Prepared by
PBS&J for Spokane County Division of Utilities. January. Thomas, C.A., 1963. Investigation of the inflow to the Rathdrum Prairie−Spokane Valley Aquifer: U.S.
Geological Survey Open-File Report 63-121, 46 p., 7 pls. USGS, 1981. Digital Model Simulation of the Hydrologic Flow System, With Emphasis on Ground Wa-
ter, in the Spokane Valley Washington and Idaho. Open File Report 80-1300.
January 2010 50 .00

Data Update and On-Site Feasibility Report Saltese Flats Wetland Restoration Investigation
January 2010 .00
Appendix A Topographic Maps

Data Update and On-Site Feasibility Report Saltese Flats Wetland Restoration Investigation
January 2010 A-1
Figure A-1. Topographic Map of the Northern Saltese Flats Using Ducks Unlimited Survey Data

Data Update and On-Site Feasibility Report Saltese Flats Wetland Restoration Investigation
January 2010 A-2
Figure A-2. Shallow Monitoring Well Locations and Elevations Based on Spokane County Survey
Data and Topographic Contours Based on Ducks Unlimited Survey Data
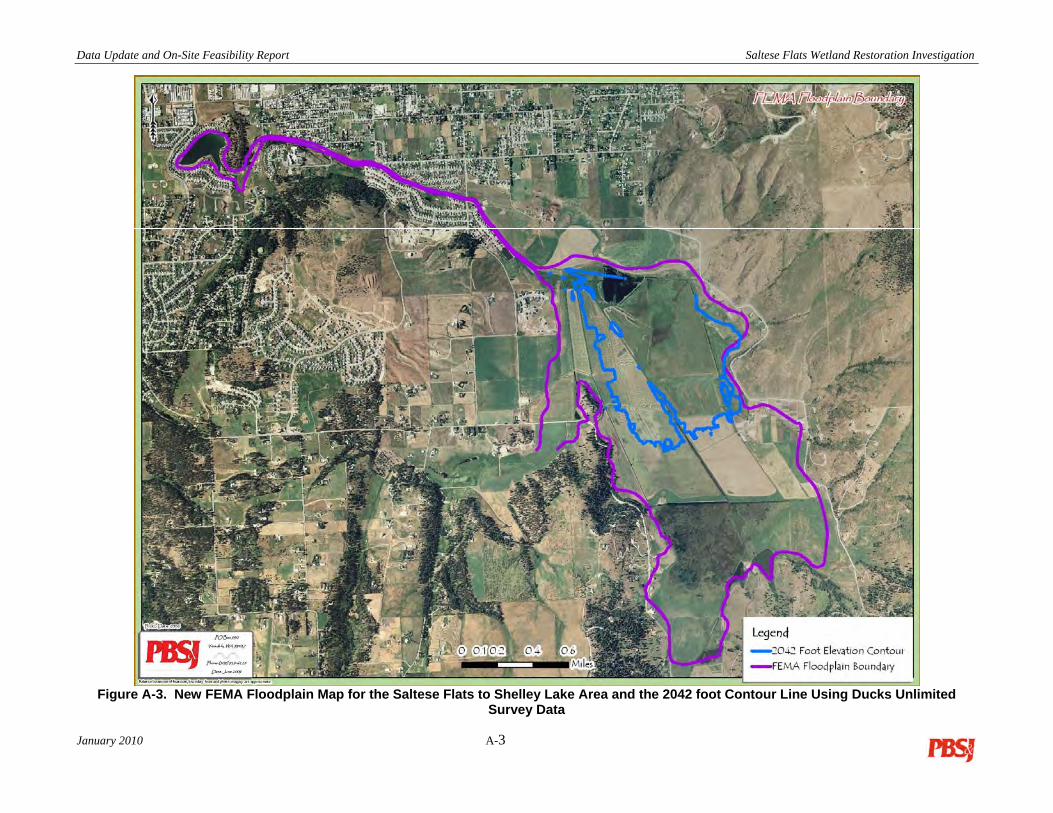
Data Update and On-Site Feasibility Report Saltese Flats Wetland Restoration Investigation
January 2010 A-3
Figure A-3. New FEMA Floodplain Map for the Saltese Flats to Shelley Lake Area and the 2042 foot Contour Line Using Ducks Unlimited
Survey Data

Data Update and On-Site Feasibility Report Saltese Flats Wetland Restoration Investigation
January 2010 A-4
Figure A-4. Shelley Lake, Saltese Creek, and Gravel Pit Topographic Contours

Data Update and On-Site Feasibility Report Saltese Flats Wetland Restoration Investigation
January 2010 A-5
Figure A-5. Overflow Channel and Gravel Pit Topography

Data Update and On-Site Feasibility Report Saltese Flats Wetland Restoration Investigation
January 2010 A-6
Figure A-6. Overflow Channel Cross-Sections

Data Update and On-Site Feasibility Report Saltese Flats Wetland Restoration Investigation
January 2010 .00
Appendix B Example Photographic Documentation

Data Update and On-Site Feasibility Report Saltese Flats Wetland Restoration Investigation
Figure B-1. Proposed East Side Visualization View: View from Location 14 of the Potential Project Area from the East Side of the Flats
Figure B-2. Proposed West Side Visualization View: View from Location 16 of the Potential Project Area from the West Side of the Flats
January 2010 B-1

Data Update and On-Site Feasibility Report Saltese Flats Wetland Restoration Investigation
January 2010 .00
Appendix C Soil Boring Logs


Data Update and On-Site Feasibility Report Saltese Flats Wetland Restoration Investigation
January 2010 .00
Appendix D Analytical Data and Laboratory Reports
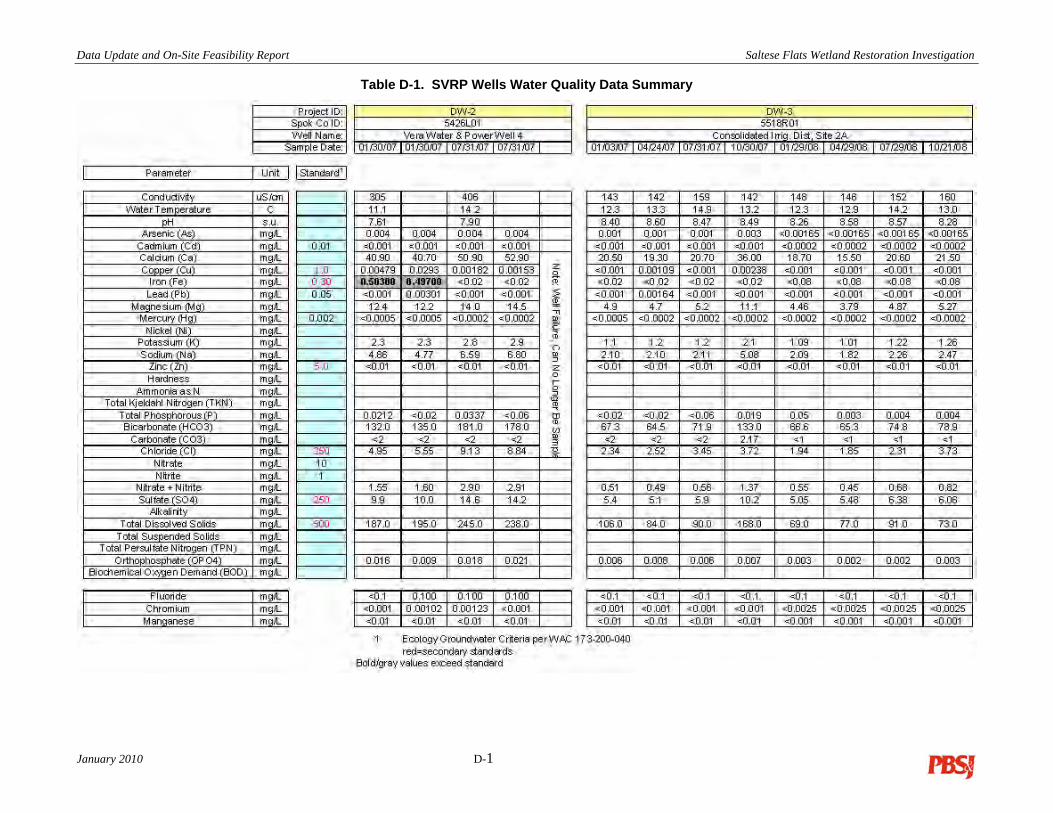
Data Update and On-Site Feasibility Report Saltese Flats Wetland Restoration Investigation
Table D-1. SVRP Wells Water Quality Data Summary
January 2010 D-1

Data Update and On-Site Feasibility Report Saltese Flats Wetland Restoration Investigation
Table D-2. SVRP Wells Water Quality Data Summary (Contd)
January 2010 D-2

Data Update and On-Site Feasibility Report Saltese Flats Wetland Restoration Investigation
Table D-3. SVRP Wells Water Quality Data Summary (Contd)
January 2010 D-3

Data Update and On-Site Feasibility Report Saltese Flats Wetland Restoration Investigation
Table D-4. Saltese Flats Shallow Groundwater Wells and Bedrock Well Water Quality Data Summary
January 2010 D-4

Data Update and On-Site Feasibility Report Saltese Flats Wetland Restoration Investigation
Table D-5. Surface Water Quality Data Summary
January 2010 D-5

Data Update and On-Site Feasibility Report Saltese Flats Wetland Restoration Investigation
January 2010 D-6
Table D-6. Shelley Lake Historical Water Quality Monitoring Summary

Client: PBS & J
Attn: RICHARD ALLINGER
Address: PO BOX 990VERADALE, WA 99037-0990
Batch #: 090422025
Analytical Results Report
Project Name: SALTESE FLATS 10002604.03
Anatek Labs, Inc.1282 Alturas Drive • Moscow, ID 83843 • (208) 883-2839 • Fax (208) 882-9246 • email [email protected]
504 E Sprague Ste. D • Spokane WA 99202 • (509) 838-3999 • Fax (509) 838-4433 • email [email protected]
090422025-001Sample Number
Matrix Water
Parameter Result Units Analysis Date Analyst Method QualifierPQL
Client Sample IDSampling Date 4/21/2009Sampling Time 9:30 AM
Date/Time Received 4/22/2009
Sample LocationExtraction Date042109-QC1
12:04 PM
Comments
mg/L EMB4/28/2009Alkalinity SM2320BND 10mg/L JTT4/30/2009NH3-N SM4500NH3GND 0.05mg/L ETL4/27/2009Arsenic EPA 200.8ND 0.001mg/L EMB4/28/2009Bicarbonate SM2320BND 10mg/L ETL4/27/2009Cadmium EPA 200.8ND 0.001mg/L EMB4/28/2009Carbonate SM2320BND 10mg/L JTT4/23/2009Chloride EPA 300.01.37 0.1mg/L ETL4/27/2009Copper EPA 200.80.00207 0.001mg/L ETL4/24/2009Calcium EPA 200.72.70 0.1mg/L ETL4/24/2009Hardness EPA 200.710.6 1mg/L ETL4/24/2009Magnesium EPA 200.70.942 0.1mg/L ETL4/24/2009Iron EPA 200.71.63 0.05mg/L ETL4/27/2009Lead EPA 200.8ND 0.001mg/L ETL5/5/2009Mercury-CV EPA 245.2ND 0.0001mg/L ETL4/27/2009Nickel EPA 200.80.00116 0.001mg/L JTT4/23/2009NO3/N EPA 300.0ND 0.1mg/L JTT4/23/2009NO2/N EPA 300.0ND 0.1mg/L JTT4/30/2009PO4/P SM4500PF0.00971 0.01mg/L ETL4/24/2009Potassium EPA 200.70.818 0.05mg/L ETL4/24/2009Sodium EPA 200.72.64 0.05mg/L EMB4/27/2009TDS EPA 160.118 10mg/L EMB4/23/2009TSS EPA 160.218 1mg/L JTT4/23/2009Sulfate EPA 300.02.21 0.1mg/L JTT4/30/2009TKN SM4500NORGC0.530 0.1mg/L JTT4/27/2009Total P SM4500PF0.0380 0.005mg/L JTT5/4/2009TPN SM4500N-C0.148 0.1mg/L ETL4/27/2009Zinc EPA 200.80.00436 0.001
Page 1 of 15Thursday, May 07, 2009
Certifications held by Anatek Labs ID: EPA:ID00013; AZ:0701; CO:ID00013; FL(NELAP):E87893; ID:ID00013; IN:C-ID-01; KY:90142; MT:CERT0028; NM: ID00013; OR:ID200001-002; WA:C1320Certifications held by Anatek Labs WA: EPA:WA00169; CA:Cert2632; ID:WA00169; WA:C1287

Client: PBS & J
Attn: RICHARD ALLINGER
Address: PO BOX 990VERADALE, WA 99037-0990
Batch #: 090422025
Analytical Results Report
Project Name: SALTESE FLATS 10002604.03
Anatek Labs, Inc.1282 Alturas Drive • Moscow, ID 83843 • (208) 883-2839 • Fax (208) 882-9246 • email [email protected]
504 E Sprague Ste. D • Spokane WA 99202 • (509) 838-3999 • Fax (509) 838-4433 • email [email protected]
090422025-002Sample Number
Matrix Water
Parameter Result Units Analysis Date Analyst Method QualifierPQL
Client Sample IDSampling Date 4/21/2009Sampling Time 9:50 AM
Date/Time Received 4/22/2009
Sample LocationExtraction Date042109-UTI
12:04 PM
Comments
mg/L EMB4/28/2009Alkalinity SM2320B10 10mg/L JTT4/30/2009NH3-N SM4500NH3GND 0.05mg/L ETL4/27/2009Arsenic EPA 200.8ND 0.001mg/L EMB4/28/2009Bicarbonate SM2320B10 10mg/L ETL4/27/2009Cadmium EPA 200.8ND 0.001mg/L EMB4/28/2009Carbonate SM2320BND 10mg/L JTT4/23/2009Chloride EPA 300.01.46 0.1mg/L ETL4/27/2009Copper EPA 200.80.00204 0.001mg/L ETL4/24/2009Calcium EPA 200.72.28 0.1mg/L ETL4/24/2009Hardness EPA 200.78.96 1mg/L ETL4/24/2009Magnesium EPA 200.70.792 0.1mg/L ETL4/24/2009Iron EPA 200.71.62 0.05mg/L ETL4/27/2009Lead EPA 200.8ND 0.001mg/L ETL5/5/2009Mercury-CV EPA 245.2ND 0.0001mg/L ETL4/27/2009Nickel EPA 200.80.00122 0.001mg/L JTT4/23/2009NO3/N EPA 300.0ND 0.1mg/L JTT4/23/2009NO2/N EPA 300.0ND 0.1mg/L JTT4/30/2009PO4/P SM4500PF0.0149 0.01mg/L ETL4/24/2009Potassium EPA 200.70.841 0.05mg/L ETL4/24/2009Sodium EPA 200.72.77 0.05mg/L EMB4/27/2009TDS EPA 160.132 10mg/L EMB4/23/2009TSS EPA 160.216 1mg/L JTT4/23/2009Sulfate EPA 300.01.88 0.1mg/L JTT4/30/2009TKN SM4500NORGC0.285 0.1mg/L JTT4/27/2009Total P SM4500PF0.0488 0.005mg/L JTT5/4/2009TPN SM4500N-C0.158 0.1mg/L ETL4/27/2009Zinc EPA 200.80.00341 0.001
Page 2 of 15Thursday, May 07, 2009
Certifications held by Anatek Labs ID: EPA:ID00013; AZ:0701; CO:ID00013; FL(NELAP):E87893; ID:ID00013; IN:C-ID-01; KY:90142; MT:CERT0028; NM: ID00013; OR:ID200001-002; WA:C1320Certifications held by Anatek Labs WA: EPA:WA00169; CA:Cert2632; ID:WA00169; WA:C1287

Client: PBS & J
Attn: RICHARD ALLINGER
Address: PO BOX 990VERADALE, WA 99037-0990
Batch #: 090422025
Analytical Results Report
Project Name: SALTESE FLATS 10002604.03
Anatek Labs, Inc.1282 Alturas Drive • Moscow, ID 83843 • (208) 883-2839 • Fax (208) 882-9246 • email [email protected]
504 E Sprague Ste. D • Spokane WA 99202 • (509) 838-3999 • Fax (509) 838-4433 • email [email protected]
090422025-003Sample Number
Matrix Water
Parameter Result Units Analysis Date Analyst Method QualifierPQL
Client Sample IDSampling Date 4/21/2009Sampling Time 10:05 AM
Date/Time Received 4/22/2009
Sample LocationExtraction Date042109-SCI
12:04 PM
Comments
mg/L EMB4/28/2009Alkalinity SM2320B12 10mg/L JTT4/30/2009NH3-N SM4500NH3GND 0.05mg/L ETL4/27/2009Arsenic EPA 200.8ND 0.001mg/L EMB4/28/2009Bicarbonate SM2320B12 10mg/L ETL4/27/2009Cadmium EPA 200.8ND 0.001mg/L EMB4/28/2009Carbonate SM2320BND 10mg/L JTT4/23/2009Chloride EPA 300.01.86 0.1mg/L ETL4/27/2009Copper EPA 200.80.00229 0.001mg/L ETL4/24/2009Calcium EPA 200.72.97 0.1mg/L ETL4/24/2009Hardness EPA 200.711.5 1mg/L ETL4/24/2009Magnesium EPA 200.70.983 0.1mg/L ETL4/24/2009Iron EPA 200.71.75 0.05mg/L ETL4/27/2009Lead EPA 200.8ND 0.001mg/L ETL5/5/2009Mercury-CV EPA 245.2ND 0.0001mg/L ETL4/27/2009Nickel EPA 200.80.00138 0.001mg/L JTT4/23/2009NO3/N EPA 300.0ND 0.1mg/L JTT4/23/2009NO2/N EPA 300.0ND 0.1mg/L JTT4/30/2009PO4/P SM4500PF0.0241 0.01mg/L ETL4/24/2009Potassium EPA 200.71.08 0.05mg/L ETL4/24/2009Sodium EPA 200.73.07 0.05mg/L EMB4/27/2009TDS EPA 160.126 10mg/L EMB4/23/2009TSS EPA 160.222 1mg/L JTT4/23/2009Sulfate EPA 300.02.20 0.1mg/L JTT4/30/2009TKN SM4500NORGC0.260 0.1mg/L JTT4/27/2009Total P SM4500PF0.0646 0.005mg/L JTT5/4/2009TPN SM4500N-C0.260 0.1mg/L ETL4/27/2009Zinc EPA 200.80.00481 0.001
Page 3 of 15Thursday, May 07, 2009
Certifications held by Anatek Labs ID: EPA:ID00013; AZ:0701; CO:ID00013; FL(NELAP):E87893; ID:ID00013; IN:C-ID-01; KY:90142; MT:CERT0028; NM: ID00013; OR:ID200001-002; WA:C1320Certifications held by Anatek Labs WA: EPA:WA00169; CA:Cert2632; ID:WA00169; WA:C1287

Client: PBS & J
Attn: RICHARD ALLINGER
Address: PO BOX 990VERADALE, WA 99037-0990
Batch #: 090422025
Analytical Results Report
Project Name: SALTESE FLATS 10002604.03
Anatek Labs, Inc.1282 Alturas Drive • Moscow, ID 83843 • (208) 883-2839 • Fax (208) 882-9246 • email [email protected]
504 E Sprague Ste. D • Spokane WA 99202 • (509) 838-3999 • Fax (509) 838-4433 • email [email protected]
090422025-004Sample Number
Matrix Water
Parameter Result Units Analysis Date Analyst Method QualifierPQL
Client Sample IDSampling Date 4/21/2009Sampling Time 10:20 AM
Date/Time Received 4/22/2009
Sample LocationExtraction Date042109-SC3
12:04 PM
Comments
mg/L EMB4/28/2009Alkalinity SM2320B21 10mg/L JTT4/30/2009NH3-N SM4500NH3G0.075 0.05mg/L ETL4/27/2009Arsenic EPA 200.80.00113 0.001mg/L EMB4/28/2009Bicarbonate SM2320B21 10mg/L ETL4/27/2009Cadmium EPA 200.8ND 0.001mg/L EMB4/28/2009Carbonate SM2320BND 10mg/L JTT4/23/2009Chloride EPA 300.05.41 0.1mg/L ETL4/27/2009Copper EPA 200.80.00163 0.001mg/L ETL4/24/2009Calcium EPA 200.78.83 0.1mg/L ETL4/24/2009Hardness EPA 200.732.9 1mg/L ETL4/24/2009Magnesium EPA 200.72.63 0.1mg/L ETL4/24/2009Iron EPA 200.71.79 0.05mg/L ETL4/27/2009Lead EPA 200.8ND 0.001mg/L ETL5/5/2009Mercury-CV EPA 245.2ND 0.0001mg/L ETL4/27/2009Nickel EPA 200.80.00200 0.001mg/L JTT4/23/2009NO3/N EPA 300.0ND 0.1mg/L JTT4/23/2009NO2/N EPA 300.0ND 0.1mg/L JTT4/30/2009PO4/P SM4500PF0.0112 0.01mg/L ETL4/24/2009Potassium EPA 200.71.29 0.05mg/L ETL4/24/2009Sodium EPA 200.75.46 0.05mg/L EMB4/27/2009TDS EPA 160.156 10mg/L EMB4/23/2009TSS EPA 160.28 1mg/L JTT4/23/2009Sulfate EPA 300.09.68 0.1mg/L JTT4/30/2009TKN SM4500NORGC1.46 0.1mg/L JTT4/27/2009Total P SM4500PF0.0555 0.005mg/L JTT5/4/2009TPN SM4500N-C1.13 0.1mg/L ETL4/27/2009Zinc EPA 200.80.00241 0.001
Page 4 of 15Thursday, May 07, 2009
Certifications held by Anatek Labs ID: EPA:ID00013; AZ:0701; CO:ID00013; FL(NELAP):E87893; ID:ID00013; IN:C-ID-01; KY:90142; MT:CERT0028; NM: ID00013; OR:ID200001-002; WA:C1320Certifications held by Anatek Labs WA: EPA:WA00169; CA:Cert2632; ID:WA00169; WA:C1287

Client: PBS & J
Attn: RICHARD ALLINGER
Address: PO BOX 990VERADALE, WA 99037-0990
Batch #: 090422025
Analytical Results Report
Project Name: SALTESE FLATS 10002604.03
Anatek Labs, Inc.1282 Alturas Drive • Moscow, ID 83843 • (208) 883-2839 • Fax (208) 882-9246 • email [email protected]
504 E Sprague Ste. D • Spokane WA 99202 • (509) 838-3999 • Fax (509) 838-4433 • email [email protected]
090422025-005Sample Number
Matrix Water
Parameter Result Units Analysis Date Analyst Method QualifierPQL
Client Sample IDSampling Date 4/21/2009Sampling Time 12:35 PM
Date/Time Received 4/22/2009
Sample LocationExtraction Date042109-GP1
12:04 PM
Comments
mg/L EMB4/28/2009Alkalinity SM2320B86 10mg/L JTT4/30/2009NH3-N SM4500NH3G0.430 0.05mg/L ETL4/27/2009Arsenic EPA 200.80.00194 0.001mg/L EMB4/28/2009Bicarbonate SM2320B86 10mg/L ETL4/27/2009Cadmium EPA 200.8ND 0.001mg/L EMB4/28/2009Carbonate SM2320BND 10mg/L JTT4/23/2009Chloride EPA 300.08.65 0.1mg/L ETL4/27/2009Copper EPA 200.8ND 0.001mg/L ETL4/24/2009Calcium EPA 200.738.9 0.1mg/L ETL4/24/2009Hardness EPA 200.7145 1mg/L ETL4/24/2009Magnesium EPA 200.711.7 0.1mg/L ETL4/24/2009Iron EPA 200.70.374 0.05mg/L ETL4/27/2009Lead EPA 200.8ND 0.001mg/L ETL5/5/2009Mercury-CV EPA 245.2ND 0.0001mg/L ETL4/27/2009Nickel EPA 200.80.00107 0.001mg/L JTT4/23/2009NO3/N EPA 300.00.100 0.1mg/L JTT4/23/2009NO2/N EPA 300.0ND 0.1mg/L JTT4/30/2009PO4/P SM4500PF0.0462 0.01mg/L ETL4/24/2009Potassium EPA 200.73.48 0.05mg/L ETL4/24/2009Sodium EPA 200.716.3 0.05mg/L EMB4/27/2009TDS EPA 160.1170 10mg/L EMB4/23/2009TSS EPA 160.2ND 1mg/LSulfate EPA 300.073.7 0.1mg/L JTT4/30/2009TKN SM4500NORGC3.13 0.1mg/L JTT4/27/2009Total P SM4500PF0.0807 0.005mg/L JTT5/4/2009TPN SM4500N-C3.56 0.1mg/L ETL4/27/2009Zinc EPA 200.80.00226 0.001
Page 5 of 15Thursday, May 07, 2009
Certifications held by Anatek Labs ID: EPA:ID00013; AZ:0701; CO:ID00013; FL(NELAP):E87893; ID:ID00013; IN:C-ID-01; KY:90142; MT:CERT0028; NM: ID00013; OR:ID200001-002; WA:C1320Certifications held by Anatek Labs WA: EPA:WA00169; CA:Cert2632; ID:WA00169; WA:C1287
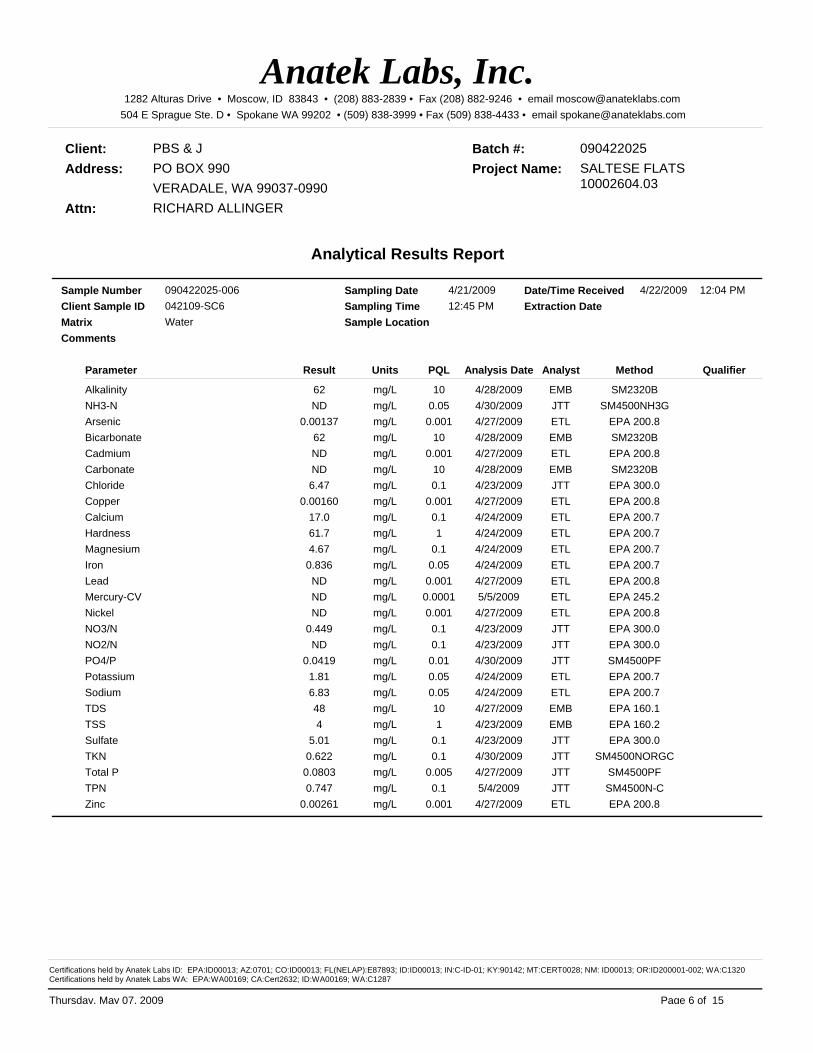
Client: PBS & J
Attn: RICHARD ALLINGER
Address: PO BOX 990VERADALE, WA 99037-0990
Batch #: 090422025
Analytical Results Report
Project Name: SALTESE FLATS 10002604.03
Anatek Labs, Inc.1282 Alturas Drive • Moscow, ID 83843 • (208) 883-2839 • Fax (208) 882-9246 • email [email protected]
504 E Sprague Ste. D • Spokane WA 99202 • (509) 838-3999 • Fax (509) 838-4433 • email [email protected]
090422025-006Sample Number
Matrix Water
Parameter Result Units Analysis Date Analyst Method QualifierPQL
Client Sample IDSampling Date 4/21/2009Sampling Time 12:45 PM
Date/Time Received 4/22/2009
Sample LocationExtraction Date042109-SC6
12:04 PM
Comments
mg/L EMB4/28/2009Alkalinity SM2320B62 10mg/L JTT4/30/2009NH3-N SM4500NH3GND 0.05mg/L ETL4/27/2009Arsenic EPA 200.80.00137 0.001mg/L EMB4/28/2009Bicarbonate SM2320B62 10mg/L ETL4/27/2009Cadmium EPA 200.8ND 0.001mg/L EMB4/28/2009Carbonate SM2320BND 10mg/L JTT4/23/2009Chloride EPA 300.06.47 0.1mg/L ETL4/27/2009Copper EPA 200.80.00160 0.001mg/L ETL4/24/2009Calcium EPA 200.717.0 0.1mg/L ETL4/24/2009Hardness EPA 200.761.7 1mg/L ETL4/24/2009Magnesium EPA 200.74.67 0.1mg/L ETL4/24/2009Iron EPA 200.70.836 0.05mg/L ETL4/27/2009Lead EPA 200.8ND 0.001mg/L ETL5/5/2009Mercury-CV EPA 245.2ND 0.0001mg/L ETL4/27/2009Nickel EPA 200.8ND 0.001mg/L JTT4/23/2009NO3/N EPA 300.00.449 0.1mg/L JTT4/23/2009NO2/N EPA 300.0ND 0.1mg/L JTT4/30/2009PO4/P SM4500PF0.0419 0.01mg/L ETL4/24/2009Potassium EPA 200.71.81 0.05mg/L ETL4/24/2009Sodium EPA 200.76.83 0.05mg/L EMB4/27/2009TDS EPA 160.148 10mg/L EMB4/23/2009TSS EPA 160.24 1mg/L JTT4/23/2009Sulfate EPA 300.05.01 0.1mg/L JTT4/30/2009TKN SM4500NORGC0.622 0.1mg/L JTT4/27/2009Total P SM4500PF0.0803 0.005mg/L JTT5/4/2009TPN SM4500N-C0.747 0.1mg/L ETL4/27/2009Zinc EPA 200.80.00261 0.001
Page 6 of 15Thursday, May 07, 2009
Certifications held by Anatek Labs ID: EPA:ID00013; AZ:0701; CO:ID00013; FL(NELAP):E87893; ID:ID00013; IN:C-ID-01; KY:90142; MT:CERT0028; NM: ID00013; OR:ID200001-002; WA:C1320Certifications held by Anatek Labs WA: EPA:WA00169; CA:Cert2632; ID:WA00169; WA:C1287

Client: PBS & J
Attn: RICHARD ALLINGER
Address: PO BOX 990VERADALE, WA 99037-0990
Batch #: 090422025
Analytical Results Report
Project Name: SALTESE FLATS 10002604.03
Anatek Labs, Inc.1282 Alturas Drive • Moscow, ID 83843 • (208) 883-2839 • Fax (208) 882-9246 • email [email protected]
504 E Sprague Ste. D • Spokane WA 99202 • (509) 838-3999 • Fax (509) 838-4433 • email [email protected]
090422025-007Sample Number
Matrix Water
Parameter Result Units Analysis Date Analyst Method QualifierPQL
Client Sample IDSampling Date 4/21/2009Sampling Time 1:10 PM
Date/Time Received 4/22/2009
Sample LocationExtraction Date042109-SC9
12:04 PM
Comments
mg/L EMB4/28/2009Alkalinity SM2320B62 10mg/L JTT4/30/2009NH3-N SM4500NH3G0.058 0.05mg/L ETL4/27/2009Arsenic EPA 200.80.00121 0.001mg/L EMB4/28/2009Bicarbonate SM2320B62 10mg/L ETL4/27/2009Cadmium EPA 200.8ND 0.001mg/L EMB4/28/2009Carbonate SM2320BND 10mg/L JTT4/23/2009Chloride EPA 300.06.38 0.1mg/L ETL4/27/2009Copper EPA 200.80.00161 0.001mg/L ETL4/24/2009Calcium EPA 200.717.2 0.1mg/L ETL4/24/2009Hardness EPA 200.762.4 1mg/L ETL4/24/2009Magnesium EPA 200.74.70 0.1mg/L ETL4/24/2009Iron EPA 200.70.859 0.05mg/L ETL4/27/2009Lead EPA 200.8ND 0.001mg/L ETL5/5/2009Mercury-CV EPA 245.2ND 0.0001mg/L ETL4/27/2009Nickel EPA 200.8ND 0.001mg/L JTT4/23/2009NO3/N EPA 300.00.443 0.1mg/L JTT4/23/2009NO2/N EPA 300.0ND 0.1mg/L JTT4/30/2009PO4/P SM4500PF0.0395 0.01mg/L ETL4/24/2009Potassium EPA 200.71.83 0.05mg/L ETL4/24/2009Sodium EPA 200.76.92 0.05mg/L EMB4/27/2009TDS EPA 160.164 10mg/L EMB4/23/2009TSS EPA 160.24 1mg/L JTT4/23/2009Sulfate EPA 300.04.97 0.1mg/L JTT4/30/2009TKN SM4500NORGC0.624 0.1mg/L JTT4/27/2009Total P SM4500PF0.0787 0.005mg/L JTT5/4/2009TPN SM4500N-C0.875 0.1mg/L ETL4/27/2009Zinc EPA 200.80.00274 0.001
Page 7 of 15Thursday, May 07, 2009
Certifications held by Anatek Labs ID: EPA:ID00013; AZ:0701; CO:ID00013; FL(NELAP):E87893; ID:ID00013; IN:C-ID-01; KY:90142; MT:CERT0028; NM: ID00013; OR:ID200001-002; WA:C1320Certifications held by Anatek Labs WA: EPA:WA00169; CA:Cert2632; ID:WA00169; WA:C1287

Client: PBS & J
Attn: RICHARD ALLINGER
Address: PO BOX 990VERADALE, WA 99037-0990
Batch #: 090422025
Analytical Results Report
Project Name: SALTESE FLATS 10002604.03
Anatek Labs, Inc.1282 Alturas Drive • Moscow, ID 83843 • (208) 883-2839 • Fax (208) 882-9246 • email [email protected]
504 E Sprague Ste. D • Spokane WA 99202 • (509) 838-3999 • Fax (509) 838-4433 • email [email protected]
090422025-008Sample Number
Matrix Water
Parameter Result Units Analysis Date Analyst Method QualifierPQL
Client Sample IDSampling Date 4/21/2009Sampling Time 4:30 PM
Date/Time Received 4/22/2009
Sample LocationExtraction Date042109-SL
12:04 PM
Comments
mg/L EMB4/28/2009Alkalinity SM2320B56 10mg/L JTT4/30/2009NH3-N SM4500NH3GND 0.05mg/L ETL4/27/2009Arsenic EPA 200.8ND 0.001mg/L EMB4/28/2009Bicarbonate SM2320B56 10mg/L ETL4/27/2009Cadmium EPA 200.8ND 0.001mg/L EMB4/28/2009Carbonate SM2320BND 10mg/L JTT4/24/2009Chloride EPA 300.06.55 0.1mg/L ETL4/27/2009Copper EPA 200.80.00151 0.001mg/L ETL4/24/2009Calcium EPA 200.714.9 0.1mg/L ETL4/24/2009Hardness EPA 200.754.3 1mg/L ETL4/24/2009Magnesium EPA 200.74.15 0.1mg/L ETL4/24/2009Iron EPA 200.70.699 0.05mg/L ETL4/27/2009Lead EPA 200.8ND 0.001mg/L ETL5/5/2009Mercury-CV EPA 245.2ND 0.0001mg/L ETL4/27/2009Nickel EPA 200.8ND 0.001mg/L JTT4/24/2009NO3/N EPA 300.00.149 0.1mg/L JTT4/24/2009NO2/N EPA 300.0ND 0.1mg/L JTT4/30/2009PO4/P SM4500PF0.0114 0.01mg/L ETL4/24/2009Potassium EPA 200.71.85 0.05mg/L ETL4/24/2009Sodium EPA 200.76.67 0.05mg/L EMB4/27/2009TDS EPA 160.170 10mg/L EMB4/23/2009TSS EPA 160.24 1mg/L JTT4/24/2009Sulfate EPA 300.04.68 0.1mg/L JTT4/30/2009TKN SM4500NORGC0.653 0.1mg/L JTT4/29/2009Total P SM4500PF0.0684 0.005mg/L JTT5/4/2009TPN SM4500N-C0.952 0.1mg/L ETL4/27/2009Zinc EPA 200.80.00287 0.001
Page 8 of 15Thursday, May 07, 2009
Certifications held by Anatek Labs ID: EPA:ID00013; AZ:0701; CO:ID00013; FL(NELAP):E87893; ID:ID00013; IN:C-ID-01; KY:90142; MT:CERT0028; NM: ID00013; OR:ID200001-002; WA:C1320Certifications held by Anatek Labs WA: EPA:WA00169; CA:Cert2632; ID:WA00169; WA:C1287

Client: PBS & J
Attn: RICHARD ALLINGER
Address: PO BOX 990VERADALE, WA 99037-0990
Batch #: 090422025
Analytical Results Report
Project Name: SALTESE FLATS 10002604.03
Anatek Labs, Inc.1282 Alturas Drive • Moscow, ID 83843 • (208) 883-2839 • Fax (208) 882-9246 • email [email protected]
504 E Sprague Ste. D • Spokane WA 99202 • (509) 838-3999 • Fax (509) 838-4433 • email [email protected]
090422025-009Sample Number
Matrix Water
Parameter Result Units Analysis Date Analyst Method QualifierPQL
Client Sample IDSampling Date 4/21/2009Sampling Time 10:30 AM
Date/Time Received 4/22/2009
Sample LocationExtraction Date042109-SFW3
12:04 PM
Comments
mg/L EMB4/28/2009Alkalinity SM2320B137 10mg/L JTT4/30/2009NH3-N SM4500NH3G0.489 0.05mg/L ETL4/27/2009Arsenic EPA 200.80.00543 0.001mg/L EMB4/28/2009Bicarbonate SM2320B137 10mg/L ETL4/27/2009Cadmium EPA 200.8ND 0.001mg/L EMB4/28/2009Carbonate SM2320BND 10mg/L JTT4/24/2009Chloride EPA 300.06.96 0.1mg/L ETL4/27/2009Copper EPA 200.80.0207 0.001mg/L ETL4/24/2009Calcium EPA 200.724.2 0.1mg/L ETL4/24/2009Hardness EPA 200.786.1 1mg/L ETL4/24/2009Magnesium EPA 200.76.21 0.1mg/L ETL4/24/2009Iron EPA 200.714.4 0.05mg/L ETL4/27/2009Lead EPA 200.80.00411 0.001mg/L ETL5/5/2009Mercury-CV EPA 245.2ND 0.0001mg/L ETL4/27/2009Nickel EPA 200.80.0126 0.001mg/L JTT4/24/2009NO3/N EPA 300.00.323 0.1mg/L JTT4/24/2009NO2/N EPA 300.0ND 0.1mg/L JTT4/30/2009PO4/P SM4500PF0.0566 0.01mg/L ETL4/24/2009Potassium EPA 200.74.03 0.05mg/L ETL4/24/2009Sodium EPA 200.760.1 0.05mg/L EMB4/27/2009TDS EPA 160.1312 10mg/L EMB4/23/2009TSS EPA 160.2300 1mg/LSulfate EPA 300.079.180 0.1mg/L JTT4/30/2009TKN SM4500NORGC2.93 0.2mg/L JTT4/29/2009Total P SM4500PF0.247 0.005mg/L ETL4/27/2009Zinc EPA 200.80.0901 0.001
Page 9 of 15Thursday, May 07, 2009
Certifications held by Anatek Labs ID: EPA:ID00013; AZ:0701; CO:ID00013; FL(NELAP):E87893; ID:ID00013; IN:C-ID-01; KY:90142; MT:CERT0028; NM: ID00013; OR:ID200001-002; WA:C1320Certifications held by Anatek Labs WA: EPA:WA00169; CA:Cert2632; ID:WA00169; WA:C1287

Client: PBS & J
Attn: RICHARD ALLINGER
Address: PO BOX 990VERADALE, WA 99037-0990
Batch #: 090422025
Analytical Results Report
Project Name: SALTESE FLATS 10002604.03
Anatek Labs, Inc.1282 Alturas Drive • Moscow, ID 83843 • (208) 883-2839 • Fax (208) 882-9246 • email [email protected]
504 E Sprague Ste. D • Spokane WA 99202 • (509) 838-3999 • Fax (509) 838-4433 • email [email protected]
090422025-010Sample Number
Matrix Water
Parameter Result Units Analysis Date Analyst Method QualifierPQL
Client Sample IDSampling Date 4/21/2009Sampling Time 10:55 AM
Date/Time Received 4/22/2009
Sample LocationExtraction Date042109-SFW12
12:04 PM
Comments
mg/L EMB4/28/2009Alkalinity SM2320B101 10mg/L JTT4/30/2009NH3-N SM4500NH3G7.39 0.1mg/L ETL4/27/2009Arsenic EPA 200.8ND 0.01mg/L EMB4/28/2009Bicarbonate SM2320B101 10mg/L ETL4/27/2009Cadmium EPA 200.8ND 0.01mg/L EMB4/28/2009Carbonate SM2320BND 10mg/L JTT4/24/2009Chloride EPA 300.011.3 0.1mg/L ETL4/27/2009Copper EPA 200.80.0197 0.01mg/L ETL4/24/2009Calcium EPA 200.725.3 0.5mg/L ETL4/24/2009Hardness EPA 200.786.7 1mg/L ETL4/24/2009Magnesium EPA 200.75.68 0.5mg/L ETL4/24/2009Iron EPA 200.722.5 0.5mg/L ETL4/27/2009Lead EPA 200.80.0121 0.01mg/L ETL5/5/2009Mercury-CV EPA 245.2ND 0.0001mg/L ETL4/27/2009Nickel EPA 200.80.0143 0.01mg/L JTT4/24/2009NO3/N EPA 300.0ND 0.1mg/L JTT4/24/2009NO2/N EPA 300.0ND 0.1mg/L JTT4/30/2009PO4/P SM4500PF0.0457 0.01mg/L ETL4/24/2009Potassium EPA 200.74.56 0.5mg/L ETL4/24/2009Sodium EPA 200.775.7 0.5mg/L EMB4/27/2009TDS EPA 160.1308 10mg/L EMB4/23/2009TSS EPA 160.2700 1mg/LSulfate EPA 300.0130 0.1mg/L JTT4/30/2009TKN SM4500NORGC13.6 0.2mg/L JTT4/29/2009Total P SM4500PF0.604 0.005mg/L ETL4/27/2009Zinc EPA 200.80.196 0.01
Page 10 of 15Thursday, May 07, 2009
Certifications held by Anatek Labs ID: EPA:ID00013; AZ:0701; CO:ID00013; FL(NELAP):E87893; ID:ID00013; IN:C-ID-01; KY:90142; MT:CERT0028; NM: ID00013; OR:ID200001-002; WA:C1320Certifications held by Anatek Labs WA: EPA:WA00169; CA:Cert2632; ID:WA00169; WA:C1287

Client: PBS & J
Attn: RICHARD ALLINGER
Address: PO BOX 990VERADALE, WA 99037-0990
Batch #: 090422025
Analytical Results Report
Project Name: SALTESE FLATS 10002604.03
Anatek Labs, Inc.1282 Alturas Drive • Moscow, ID 83843 • (208) 883-2839 • Fax (208) 882-9246 • email [email protected]
504 E Sprague Ste. D • Spokane WA 99202 • (509) 838-3999 • Fax (509) 838-4433 • email [email protected]
090422025-011Sample Number
Matrix Water
Parameter Result Units Analysis Date Analyst Method QualifierPQL
Client Sample IDSampling Date 4/21/2009Sampling Time 11:20 AM
Date/Time Received 4/22/2009
Sample LocationExtraction Date042109-SFW7
12:04 PM
Comments
mg/L EMB4/28/2009Alkalinity SM2320B178 10mg/L JTT4/30/2009NH3-N SM4500NH3G5.32 0.1mg/L ETL4/27/2009Arsenic EPA 200.8ND 0.01mg/L EMB4/28/2009Bicarbonate SM2320B178 10mg/L ETL4/27/2009Cadmium EPA 200.8ND 0.01mg/L EMB4/28/2009Carbonate SM2320BND 10mg/L JTT4/24/2009Chloride EPA 300.09.18 0.1mg/L ETL4/27/2009Copper EPA 200.8ND 0.01mg/L ETL4/24/2009Calcium EPA 200.732.8 0.5mg/L ETL4/24/2009Hardness EPA 200.7110 1mg/L ETL4/24/2009Magnesium EPA 200.76.82 0.5mg/L ETL4/24/2009Iron EPA 200.718.8 0.5mg/L ETL4/27/2009Lead EPA 200.8ND 0.01mg/L ETL5/5/2009Mercury-CV EPA 245.2ND 0.0001mg/L ETL4/27/2009Nickel EPA 200.8ND 0.01mg/L JTT4/24/2009NO3/N EPA 300.0ND 0.1mg/L JTT4/24/2009NO2/N EPA 300.0ND 0.1mg/L JTT4/30/2009PO4/P SM4500PF0.0486 0.01mg/L ETL4/24/2009Potassium EPA 200.74.94 0.5mg/L ETL4/24/2009Sodium EPA 200.771.5 0.5mg/L EMB4/27/2009TDS EPA 160.1322 10mg/L EMB4/23/2009TSS EPA 160.2350 1mg/LSulfate EPA 300.097.7 0.1mg/L JTT4/30/2009TKN SM4500NORGC7.10 0.2mg/L JTT4/29/2009Total P SM4500PF0.307 0.005mg/L ETL4/27/2009Zinc EPA 200.80.240 0.01
Page 11 of 15Thursday, May 07, 2009
Certifications held by Anatek Labs ID: EPA:ID00013; AZ:0701; CO:ID00013; FL(NELAP):E87893; ID:ID00013; IN:C-ID-01; KY:90142; MT:CERT0028; NM: ID00013; OR:ID200001-002; WA:C1320Certifications held by Anatek Labs WA: EPA:WA00169; CA:Cert2632; ID:WA00169; WA:C1287

Client: PBS & J
Attn: RICHARD ALLINGER
Address: PO BOX 990VERADALE, WA 99037-0990
Batch #: 090422025
Analytical Results Report
Project Name: SALTESE FLATS 10002604.03
Anatek Labs, Inc.1282 Alturas Drive • Moscow, ID 83843 • (208) 883-2839 • Fax (208) 882-9246 • email [email protected]
504 E Sprague Ste. D • Spokane WA 99202 • (509) 838-3999 • Fax (509) 838-4433 • email [email protected]
090422025-012Sample Number
Matrix Water
Parameter Result Units Analysis Date Analyst Method QualifierPQL
Client Sample IDSampling Date 4/21/2009Sampling Time 12:28 PM
Date/Time Received 4/22/2009
Sample LocationExtraction Date042109-SFW4
12:04 PM
Comments
mg/L EMB4/28/2009Alkalinity SM2320B118 10mg/L JTT4/30/2009NH3-N SM4500NH3G2.17 0.1mg/L ETL4/27/2009Arsenic EPA 200.80.0132 0.01mg/L EMB4/28/2009Bicarbonate SM2320B118 10mg/L ETL4/27/2009Cadmium EPA 200.8ND 0.01mg/L EMB4/28/2009Carbonate SM2320BND 10mg/L JTT4/24/2009Chloride EPA 300.019.8 0.1mg/L ETL4/27/2009Copper EPA 200.80.0231 0.01mg/L ETL4/24/2009Calcium EPA 200.738.5 0.5mg/L ETL4/24/2009Hardness EPA 200.7132 1mg/L ETL4/24/2009Magnesium EPA 200.78.59 0.5mg/L ETL4/24/2009Iron EPA 200.721.4 0.5mg/L ETL4/27/2009Lead EPA 200.80.0152 0.01mg/L ETL5/5/2009Mercury-CV EPA 245.2ND 0.0001mg/L ETL4/27/2009Nickel EPA 200.80.0184 0.01mg/L JTT4/24/2009NO3/N EPA 300.0ND 0.1mg/L JTT4/24/2009NO2/N EPA 300.0ND 0.1mg/L JTT4/30/2009PO4/P SM4500PF0.0347 0.005mg/L ETL4/24/2009Potassium EPA 200.75.88 0.5mg/L ETL4/24/2009Sodium EPA 200.7113 0.5mg/L EMB4/27/2009TDS EPA 160.1468 10mg/L EMB4/23/2009TSS EPA 160.2428 1mg/LSulfate EPA 300.0245 0.1mg/L JTT4/30/2009TKN SM4500NORGC15.5 0.2mg/L JTT4/29/2009Total P SM4500PF1.41 0.005mg/L ETL4/27/2009Zinc EPA 200.80.192 0.01
Page 12 of 15Thursday, May 07, 2009
Certifications held by Anatek Labs ID: EPA:ID00013; AZ:0701; CO:ID00013; FL(NELAP):E87893; ID:ID00013; IN:C-ID-01; KY:90142; MT:CERT0028; NM: ID00013; OR:ID200001-002; WA:C1320Certifications held by Anatek Labs WA: EPA:WA00169; CA:Cert2632; ID:WA00169; WA:C1287

Client: PBS & J
Attn: RICHARD ALLINGER
Address: PO BOX 990VERADALE, WA 99037-0990
Batch #: 090422025
Analytical Results Report
Project Name: SALTESE FLATS 10002604.03
Anatek Labs, Inc.1282 Alturas Drive • Moscow, ID 83843 • (208) 883-2839 • Fax (208) 882-9246 • email [email protected]
504 E Sprague Ste. D • Spokane WA 99202 • (509) 838-3999 • Fax (509) 838-4433 • email [email protected]
090422025-013Sample Number
Matrix Water
Parameter Result Units Analysis Date Analyst Method QualifierPQL
Client Sample IDSampling Date 4/21/2009Sampling Time 12:45 PM
Date/Time Received 4/22/2009
Sample LocationExtraction Date042109-SFW1
12:04 PM
Comments
mg/L EMB4/28/2009Alkalinity SM2320B121 10mg/L JTT4/30/2009NH3-N SM4500NH3G0.580 0.1mg/L ETL4/27/2009Arsenic EPA 200.80.0188 0.01mg/L EMB4/28/2009Bicarbonate SM2320B121 10mg/L ETL4/27/2009Cadmium EPA 200.8ND 0.01mg/L EMB4/28/2009Carbonate SM2320BND 10mg/L JTT4/24/2009Chloride EPA 300.017.6 0.1mg/L ETL4/27/2009Copper EPA 200.80.0156 0.01mg/L ETL4/24/2009Calcium EPA 200.762.3 0.5mg/L ETL4/24/2009Hardness EPA 200.7206 1mg/L ETL4/24/2009Magnesium EPA 200.712.2 0.5mg/L ETL4/24/2009Iron EPA 200.720.7 0.5mg/L ETL4/27/2009Lead EPA 200.80.0116 0.01mg/L ETL5/5/2009Mercury-CV EPA 245.2ND 0.0001mg/L ETL4/27/2009Nickel EPA 200.80.0230 0.01mg/L JTT4/24/2009NO3/N EPA 300.0ND 0.1mg/L JTT4/24/2009NO2/N EPA 300.0ND 0.1mg/L JTT4/30/2009PO4/P SM4500PF0.0344 0.01mg/L ETL4/24/2009Potassium EPA 200.75.42 0.5mg/L ETL4/24/2009Sodium EPA 200.7140 0.5mg/L EMB4/27/2009TDS EPA 160.1656 10mg/L EMB4/23/2009TSS EPA 160.2278 1mg/LSulfate EPA 300.0381 0.1mg/L JTT4/30/2009TKN SM4500NORGC6.58 0.2mg/L JTT4/29/2009Total P SM4500PF0.576 0.005mg/L ETL4/27/2009Zinc EPA 200.80.0840 0.01
Page 13 of 15Thursday, May 07, 2009
Certifications held by Anatek Labs ID: EPA:ID00013; AZ:0701; CO:ID00013; FL(NELAP):E87893; ID:ID00013; IN:C-ID-01; KY:90142; MT:CERT0028; NM: ID00013; OR:ID200001-002; WA:C1320Certifications held by Anatek Labs WA: EPA:WA00169; CA:Cert2632; ID:WA00169; WA:C1287
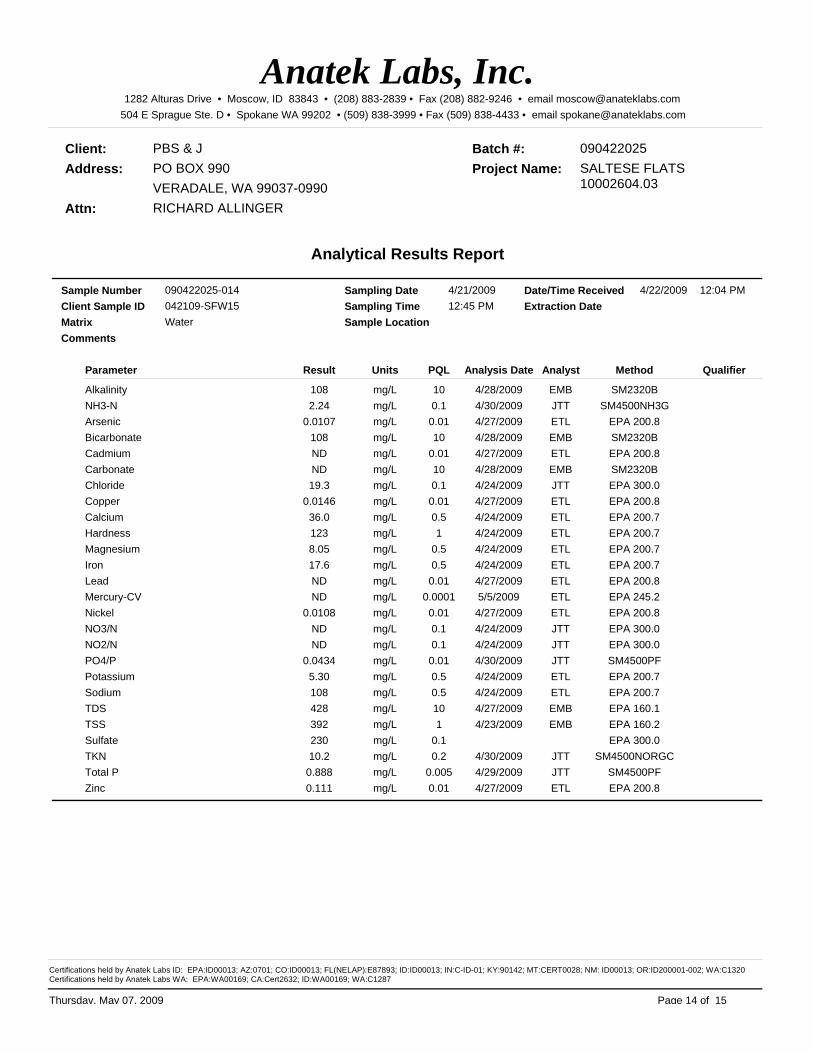
Client: PBS & J
Attn: RICHARD ALLINGER
Address: PO BOX 990VERADALE, WA 99037-0990
Batch #: 090422025
Analytical Results Report
Project Name: SALTESE FLATS 10002604.03
Anatek Labs, Inc.1282 Alturas Drive • Moscow, ID 83843 • (208) 883-2839 • Fax (208) 882-9246 • email [email protected]
504 E Sprague Ste. D • Spokane WA 99202 • (509) 838-3999 • Fax (509) 838-4433 • email [email protected]
090422025-014Sample Number
Matrix Water
Parameter Result Units Analysis Date Analyst Method QualifierPQL
Client Sample IDSampling Date 4/21/2009Sampling Time 12:45 PM
Date/Time Received 4/22/2009
Sample LocationExtraction Date042109-SFW15
12:04 PM
Comments
mg/L EMB4/28/2009Alkalinity SM2320B108 10mg/L JTT4/30/2009NH3-N SM4500NH3G2.24 0.1mg/L ETL4/27/2009Arsenic EPA 200.80.0107 0.01mg/L EMB4/28/2009Bicarbonate SM2320B108 10mg/L ETL4/27/2009Cadmium EPA 200.8ND 0.01mg/L EMB4/28/2009Carbonate SM2320BND 10mg/L JTT4/24/2009Chloride EPA 300.019.3 0.1mg/L ETL4/27/2009Copper EPA 200.80.0146 0.01mg/L ETL4/24/2009Calcium EPA 200.736.0 0.5mg/L ETL4/24/2009Hardness EPA 200.7123 1mg/L ETL4/24/2009Magnesium EPA 200.78.05 0.5mg/L ETL4/24/2009Iron EPA 200.717.6 0.5mg/L ETL4/27/2009Lead EPA 200.8ND 0.01mg/L ETL5/5/2009Mercury-CV EPA 245.2ND 0.0001mg/L ETL4/27/2009Nickel EPA 200.80.0108 0.01mg/L JTT4/24/2009NO3/N EPA 300.0ND 0.1mg/L JTT4/24/2009NO2/N EPA 300.0ND 0.1mg/L JTT4/30/2009PO4/P SM4500PF0.0434 0.01mg/L ETL4/24/2009Potassium EPA 200.75.30 0.5mg/L ETL4/24/2009Sodium EPA 200.7108 0.5mg/L EMB4/27/2009TDS EPA 160.1428 10mg/L EMB4/23/2009TSS EPA 160.2392 1mg/LSulfate EPA 300.0230 0.1mg/L JTT4/30/2009TKN SM4500NORGC10.2 0.2mg/L JTT4/29/2009Total P SM4500PF0.888 0.005mg/L ETL4/27/2009Zinc EPA 200.80.111 0.01
Page 14 of 15Thursday, May 07, 2009
Certifications held by Anatek Labs ID: EPA:ID00013; AZ:0701; CO:ID00013; FL(NELAP):E87893; ID:ID00013; IN:C-ID-01; KY:90142; MT:CERT0028; NM: ID00013; OR:ID200001-002; WA:C1320Certifications held by Anatek Labs WA: EPA:WA00169; CA:Cert2632; ID:WA00169; WA:C1287

Client: PBS & J
Attn: RICHARD ALLINGER
Address: PO BOX 990VERADALE, WA 99037-0990
Batch #: 090422025
Analytical Results Report
Project Name: SALTESE FLATS 10002604.03
Anatek Labs, Inc.1282 Alturas Drive • Moscow, ID 83843 • (208) 883-2839 • Fax (208) 882-9246 • email [email protected]
504 E Sprague Ste. D • Spokane WA 99202 • (509) 838-3999 • Fax (509) 838-4433 • email [email protected]
090422025-015Sample Number
Matrix Water
Parameter Result Units Analysis Date Analyst Method QualifierPQL
Client Sample IDSampling Date 4/21/2009Sampling Time 5:48 PM
Date/Time Received 4/22/2009
Sample LocationExtraction Date042109-McGOWAN
12:04 PM
Comments
mg/L EMB4/28/2009Alkalinity SM2320B88 10mg/L JTT4/30/2009NH3-N SM4500NH3G0.050 0.05mg/L ETL4/27/2009Arsenic EPA 200.8ND 0.001mg/L EMB4/28/2009Bicarbonate SM2320B88 10mg/L ETL4/27/2009Cadmium EPA 200.8ND 0.001mg/L EMB4/28/2009Carbonate SM2320BND 10mg/L JTT4/24/2009Chloride EPA 300.00.709 0.1mg/L ETL4/27/2009Copper EPA 200.80.0111 0.001mg/L ETL4/24/2009Calcium EPA 200.717.6 0.1mg/L ETL4/24/2009Hardness EPA 200.761.2 1mg/L ETL4/24/2009Magnesium EPA 200.74.17 0.1mg/L ETL4/24/2009Iron EPA 200.70.279 0.05mg/L ETL4/27/2009Lead EPA 200.80.00400 0.001mg/L ETL5/5/2009Mercury-CV EPA 245.2ND 0.0001mg/L ETL4/27/2009Nickel EPA 200.80.00143 0.001mg/L JTT4/24/2009NO3/N EPA 300.0ND 0.1mg/L JTT4/24/2009NO2/N EPA 300.0ND 0.1mg/L JTT4/30/2009PO4/P SM4500PF0.0144 0.01mg/L ETL4/24/2009Potassium EPA 200.72.47 0.05mg/L ETL4/24/2009Sodium EPA 200.713.7 0.05mg/L EMB4/27/2009TDS EPA 160.138 10mg/L EMB4/23/2009TSS EPA 160.2ND 1mg/L JTT4/24/2009Sulfate EPA 300.06.14 0.1mg/L JTT4/30/2009TKN SM4500NORGC0.124 0.1mg/L JTT4/29/2009Total P SM4500PF0.0201 0.005mg/L ETL4/27/2009Zinc EPA 200.80.0919 0.001
Authorized Signature
MCL EPA's Maximum Contaminant LevelND Not DetectedPQL Practical Quantitation Limit
Page 15 of 15Thursday, May 07, 2009
Certifications held by Anatek Labs ID: EPA:ID00013; AZ:0701; CO:ID00013; FL(NELAP):E87893; ID:ID00013; IN:C-ID-01; KY:90142; MT:CERT0028; NM: ID00013; OR:ID200001-002; WA:C1320Certifications held by Anatek Labs WA: EPA:WA00169; CA:Cert2632; ID:WA00169; WA:C1287

Login Report
Anatek Labs, Inc.1282 Alturas Drive • Moscow, ID 83843 • (208) 883-2839 • Fax (208) 882-9246 • email [email protected]
504 E Sprague Ste. D • Spokane WA 99202 • (509) 838-3999 • Fax (509) 838-4433 • email [email protected]
Order ID: 090422025Customer Name: PBS & J
PO BOX 990
Contact Name: RICHARD ALLINGER
Comment:
Order Date: 4/22/2009
Project Name: SALTESE FLATS 10002604.03
VERADALE WA 99037-0990
Sample #: 090422025-001
Date Collected: 4/21/2009
Date Received: 4/22/2009 12:04:00 P
Customer Sample #: 042109-QC1
Comment:
Collector: RICH ALLINGER
Matrix: WaterQuantity: 1
Recv'd:
Test Test Group Method Due Date Priority
ALKALINITY 4/24/2009SM2320B Normal (6-10 Days)AMMONIA-NITROGEN 5/4/2009SM4500NH3G Normal (6-10 Days)ARSENIC 5/4/2009EPA 200.8 Normal (6-10 Days)BICARBONATE 4/24/2009SM2320B Normal (6-10 Days)CADMIUM 5/4/2009EPA 200.8 Normal (6-10 Days)CARBONATE 4/24/2009SM2320B Normal (6-10 Days)CHLORIDE 5/4/2009EPA 300.0 Normal (6-10 Days)COPPER 5/4/2009EPA 200.8 Normal (6-10 Days)HARDNESS by EPA 200.7 5/4/2009EPA 200.7 Normal (6-10 Days)IRON ICP 5/4/2009EPA 200.7 Normal (6-10 Days)LEAD 5/4/2009EPA 200.8 Normal (6-10 Days)MERCURY-CV 5/4/2009EPA 245.2 Normal (6-10 Days)NICKEL 5/4/2009EPA 200.8 Normal (6-10 Days)NITRATE/N 5/4/2009EPA 300.0 Normal (6-10 Days)NITRITE/N 5/4/2009EPA 300.0 Normal (6-10 Days)PHOSPHATE/P FIA 5/4/2009SM4500PF Normal (6-10 Days)POTASSIUM ICP 5/4/2009EPA 200.7 Normal (6-10 Days)SODIUM ICP 5/4/2009EPA 200.7 Normal (6-10 Days)SOLIDS - TDS 4/29/2009EPA 160.1 Normal (6-10 Days)SOLIDS - TSS 4/29/2009EPA 160.2 Normal (6-10 Days)SULFATE 5/4/2009EPA 300.0 Normal (6-10 Days)TKN 5/4/2009SM4500NORGC Normal (6-10 Days)TOTAL P FIA 5/4/2009SM4500PF Normal (6-10 Days)

Order ID: 090422025Customer Name: PBS & J
PO BOX 990
Contact Name: RICHARD ALLINGER
Comment:
Order Date: 4/22/2009
Project Name: SALTESE FLATS 10002604.03
VERADALE WA 99037-0990
TPN 5/4/2009SM4500N-C Normal (6-10 Days)ZINC 5/4/2009EPA 200.8 Normal (6-10 Days)
Sample #: 090422025-002
Date Collected: 4/21/2009
Date Received: 4/22/2009 12:04:00 P
Customer Sample #: 042109-UTI
Comment:
Collector: RICH ALLINGER
Matrix: WaterQuantity: 1
Recv'd:
Test Test Group Method Due Date Priority
ALKALINITY 4/24/2009SM2320B Normal (6-10 Days)AMMONIA-NITROGEN 5/4/2009SM4500NH3G Normal (6-10 Days)ARSENIC 5/4/2009EPA 200.8 Normal (6-10 Days)BICARBONATE 4/24/2009SM2320B Normal (6-10 Days)CADMIUM 5/4/2009EPA 200.8 Normal (6-10 Days)CARBONATE 4/24/2009SM2320B Normal (6-10 Days)CHLORIDE 5/4/2009EPA 300.0 Normal (6-10 Days)COPPER 5/4/2009EPA 200.8 Normal (6-10 Days)HARDNESS by EPA 200.7 5/4/2009EPA 200.7 Normal (6-10 Days)IRON ICP 5/4/2009EPA 200.7 Normal (6-10 Days)LEAD 5/4/2009EPA 200.8 Normal (6-10 Days)MERCURY-CV 5/4/2009EPA 245.2 Normal (6-10 Days)NICKEL 5/4/2009EPA 200.8 Normal (6-10 Days)NITRATE/N 5/4/2009EPA 300.0 Normal (6-10 Days)NITRITE/N 5/4/2009EPA 300.0 Normal (6-10 Days)PHOSPHATE/P FIA 5/4/2009SM4500PF Normal (6-10 Days)POTASSIUM ICP 5/4/2009EPA 200.7 Normal (6-10 Days)SODIUM ICP 5/4/2009EPA 200.7 Normal (6-10 Days)SOLIDS - TDS 4/29/2009EPA 160.1 Normal (6-10 Days)SOLIDS - TSS 4/29/2009EPA 160.2 Normal (6-10 Days)SULFATE 5/4/2009EPA 300.0 Normal (6-10 Days)TKN 5/4/2009SM4500NORGC Normal (6-10 Days)TOTAL P FIA 5/4/2009SM4500PF Normal (6-10 Days)TPN 5/4/2009SM4500N-C Normal (6-10 Days)ZINC 5/4/2009EPA 200.8 Normal (6-10 Days)

Order ID: 090422025Customer Name: PBS & J
PO BOX 990
Contact Name: RICHARD ALLINGER
Comment:
Order Date: 4/22/2009
Project Name: SALTESE FLATS 10002604.03
VERADALE WA 99037-0990
Sample #: 090422025-003
Date Collected: 4/21/2009
Date Received: 4/22/2009 12:04:00 P
Customer Sample #: 042109-SCI
Comment:
Collector: RICH ALLINGER
Matrix: WaterQuantity: 1
Recv'd:
Test Test Group Method Due Date Priority
ALKALINITY 4/24/2009SM2320B Normal (6-10 Days)AMMONIA-NITROGEN 5/4/2009SM4500NH3G Normal (6-10 Days)ARSENIC 5/4/2009EPA 200.8 Normal (6-10 Days)BICARBONATE 4/24/2009SM2320B Normal (6-10 Days)CADMIUM 5/4/2009EPA 200.8 Normal (6-10 Days)CARBONATE 4/24/2009SM2320B Normal (6-10 Days)CHLORIDE 5/4/2009EPA 300.0 Normal (6-10 Days)COPPER 5/4/2009EPA 200.8 Normal (6-10 Days)HARDNESS by EPA 200.7 5/4/2009EPA 200.7 Normal (6-10 Days)IRON ICP 5/4/2009EPA 200.7 Normal (6-10 Days)LEAD 5/4/2009EPA 200.8 Normal (6-10 Days)MERCURY-CV 5/4/2009EPA 245.2 Normal (6-10 Days)NICKEL 5/4/2009EPA 200.8 Normal (6-10 Days)NITRATE/N 5/4/2009EPA 300.0 Normal (6-10 Days)NITRITE/N 5/4/2009EPA 300.0 Normal (6-10 Days)PHOSPHATE/P FIA 5/4/2009SM4500PF Normal (6-10 Days)POTASSIUM ICP 5/4/2009EPA 200.7 Normal (6-10 Days)SODIUM ICP 5/4/2009EPA 200.7 Normal (6-10 Days)SOLIDS - TDS 4/29/2009EPA 160.1 Normal (6-10 Days)SOLIDS - TSS 4/29/2009EPA 160.2 Normal (6-10 Days)SULFATE 5/4/2009EPA 300.0 Normal (6-10 Days)TKN 5/4/2009SM4500NORGC Normal (6-10 Days)TOTAL P FIA 5/4/2009SM4500PF Normal (6-10 Days)TPN 5/4/2009SM4500N-C Normal (6-10 Days)ZINC 5/4/2009EPA 200.8 Normal (6-10 Days)

Order ID: 090422025Customer Name: PBS & J
PO BOX 990
Contact Name: RICHARD ALLINGER
Comment:
Order Date: 4/22/2009
Project Name: SALTESE FLATS 10002604.03
VERADALE WA 99037-0990
Sample #: 090422025-004
Date Collected: 4/21/2009
Date Received: 4/22/2009 12:04:00 P
Customer Sample #: 042109-SC3
Comment:
Collector: RICH ALLINGER
Matrix: WaterQuantity: 1
Recv'd:
Test Test Group Method Due Date Priority
ALKALINITY 4/24/2009SM2320B Normal (6-10 Days)AMMONIA-NITROGEN 5/4/2009SM4500NH3G Normal (6-10 Days)ARSENIC 5/4/2009EPA 200.8 Normal (6-10 Days)BICARBONATE 4/24/2009SM2320B Normal (6-10 Days)CADMIUM 5/4/2009EPA 200.8 Normal (6-10 Days)CARBONATE 4/24/2009SM2320B Normal (6-10 Days)CHLORIDE 5/4/2009EPA 300.0 Normal (6-10 Days)COPPER 5/4/2009EPA 200.8 Normal (6-10 Days)HARDNESS by EPA 200.7 5/4/2009EPA 200.7 Normal (6-10 Days)IRON ICP 5/4/2009EPA 200.7 Normal (6-10 Days)LEAD 5/4/2009EPA 200.8 Normal (6-10 Days)MERCURY-CV 5/4/2009EPA 245.2 Normal (6-10 Days)NICKEL 5/4/2009EPA 200.8 Normal (6-10 Days)NITRATE/N 5/4/2009EPA 300.0 Normal (6-10 Days)NITRITE/N 5/4/2009EPA 300.0 Normal (6-10 Days)PHOSPHATE/P FIA 5/4/2009SM4500PF Normal (6-10 Days)POTASSIUM ICP 5/4/2009EPA 200.7 Normal (6-10 Days)SODIUM ICP 5/4/2009EPA 200.7 Normal (6-10 Days)SOLIDS - TDS 4/29/2009EPA 160.1 Normal (6-10 Days)SOLIDS - TSS 4/29/2009EPA 160.2 Normal (6-10 Days)SULFATE 5/4/2009EPA 300.0 Normal (6-10 Days)TKN 5/4/2009SM4500NORGC Normal (6-10 Days)TOTAL P FIA 5/4/2009SM4500PF Normal (6-10 Days)TPN 5/4/2009SM4500N-C Normal (6-10 Days)ZINC 5/4/2009EPA 200.8 Normal (6-10 Days)

Order ID: 090422025Customer Name: PBS & J
PO BOX 990
Contact Name: RICHARD ALLINGER
Comment:
Order Date: 4/22/2009
Project Name: SALTESE FLATS 10002604.03
VERADALE WA 99037-0990
Sample #: 090422025-005
Date Collected: 4/21/2009
Date Received: 4/22/2009 12:04:00 P
Customer Sample #: 042109-GP1
Comment:
Collector: RICH ALLINGER
Matrix: WaterQuantity: 1
Recv'd:
Test Test Group Method Due Date Priority
ALKALINITY 4/24/2009SM2320B Normal (6-10 Days)AMMONIA-NITROGEN 5/4/2009SM4500NH3G Normal (6-10 Days)ARSENIC 5/4/2009EPA 200.8 Normal (6-10 Days)BICARBONATE 4/24/2009SM2320B Normal (6-10 Days)CADMIUM 5/4/2009EPA 200.8 Normal (6-10 Days)CARBONATE 4/24/2009SM2320B Normal (6-10 Days)CHLORIDE 5/4/2009EPA 300.0 Normal (6-10 Days)COPPER 5/4/2009EPA 200.8 Normal (6-10 Days)HARDNESS by EPA 200.7 5/4/2009EPA 200.7 Normal (6-10 Days)IRON ICP 5/4/2009EPA 200.7 Normal (6-10 Days)LEAD 5/4/2009EPA 200.8 Normal (6-10 Days)MERCURY-CV 5/4/2009EPA 245.2 Normal (6-10 Days)NICKEL 5/4/2009EPA 200.8 Normal (6-10 Days)NITRATE/N 5/4/2009EPA 300.0 Normal (6-10 Days)NITRITE/N 5/4/2009EPA 300.0 Normal (6-10 Days)PHOSPHATE/P FIA 5/4/2009SM4500PF Normal (6-10 Days)POTASSIUM ICP 5/4/2009EPA 200.7 Normal (6-10 Days)SODIUM ICP 5/4/2009EPA 200.7 Normal (6-10 Days)SOLIDS - TDS 4/29/2009EPA 160.1 Normal (6-10 Days)SOLIDS - TSS 4/29/2009EPA 160.2 Normal (6-10 Days)SULFATE 5/4/2009EPA 300.0 Normal (6-10 Days)TKN 5/4/2009SM4500NORGC Normal (6-10 Days)TOTAL P FIA 5/4/2009SM4500PF Normal (6-10 Days)TPN 5/4/2009SM4500N-C Normal (6-10 Days)ZINC 5/4/2009EPA 200.8 Normal (6-10 Days)

Order ID: 090422025Customer Name: PBS & J
PO BOX 990
Contact Name: RICHARD ALLINGER
Comment:
Order Date: 4/22/2009
Project Name: SALTESE FLATS 10002604.03
VERADALE WA 99037-0990
Sample #: 090422025-006
Date Collected: 4/21/2009
Date Received: 4/22/2009 12:04:00 P
Customer Sample #: 042109-SC6
Comment:
Collector: RICH ALLINGER
Matrix: WaterQuantity: 1
Recv'd:
Test Test Group Method Due Date Priority
ALKALINITY 4/24/2009SM2320B Normal (6-10 Days)AMMONIA-NITROGEN 5/4/2009SM4500NH3G Normal (6-10 Days)ARSENIC 5/4/2009EPA 200.8 Normal (6-10 Days)BICARBONATE 4/24/2009SM2320B Normal (6-10 Days)CADMIUM 5/4/2009EPA 200.8 Normal (6-10 Days)CARBONATE 4/24/2009SM2320B Normal (6-10 Days)CHLORIDE 5/4/2009EPA 300.0 Normal (6-10 Days)COPPER 5/4/2009EPA 200.8 Normal (6-10 Days)HARDNESS by EPA 200.7 5/4/2009EPA 200.7 Normal (6-10 Days)IRON ICP 5/4/2009EPA 200.7 Normal (6-10 Days)LEAD 5/4/2009EPA 200.8 Normal (6-10 Days)MERCURY-CV 5/4/2009EPA 245.2 Normal (6-10 Days)NICKEL 5/4/2009EPA 200.8 Normal (6-10 Days)NITRATE/N 5/4/2009EPA 300.0 Normal (6-10 Days)NITRITE/N 5/4/2009EPA 300.0 Normal (6-10 Days)PHOSPHATE/P FIA 5/4/2009SM4500PF Normal (6-10 Days)POTASSIUM ICP 5/4/2009EPA 200.7 Normal (6-10 Days)SODIUM ICP 5/4/2009EPA 200.7 Normal (6-10 Days)SOLIDS - TDS 4/29/2009EPA 160.1 Normal (6-10 Days)SOLIDS - TSS 4/29/2009EPA 160.2 Normal (6-10 Days)SULFATE 5/4/2009EPA 300.0 Normal (6-10 Days)TKN 5/4/2009SM4500NORGC Normal (6-10 Days)TOTAL P FIA 5/4/2009SM4500PF Normal (6-10 Days)TPN 5/4/2009SM4500N-C Normal (6-10 Days)ZINC 5/4/2009EPA 200.8 Normal (6-10 Days)

Order ID: 090422025Customer Name: PBS & J
PO BOX 990
Contact Name: RICHARD ALLINGER
Comment:
Order Date: 4/22/2009
Project Name: SALTESE FLATS 10002604.03
VERADALE WA 99037-0990
Sample #: 090422025-007
Date Collected: 4/21/2009
Date Received: 4/22/2009 12:04:00 P
Customer Sample #: 042109-SC9
Comment:
Collector: RICH ALLINGER
Matrix: WaterQuantity: 1
Recv'd:
Test Test Group Method Due Date Priority
ALKALINITY 4/24/2009SM2320B Normal (6-10 Days)AMMONIA-NITROGEN 5/4/2009SM4500NH3G Normal (6-10 Days)ARSENIC 5/4/2009EPA 200.8 Normal (6-10 Days)BICARBONATE 4/24/2009SM2320B Normal (6-10 Days)CADMIUM 5/4/2009EPA 200.8 Normal (6-10 Days)CARBONATE 4/24/2009SM2320B Normal (6-10 Days)CHLORIDE 5/4/2009EPA 300.0 Normal (6-10 Days)COPPER 5/4/2009EPA 200.8 Normal (6-10 Days)HARDNESS by EPA 200.7 5/4/2009EPA 200.7 Normal (6-10 Days)IRON ICP 5/4/2009EPA 200.7 Normal (6-10 Days)LEAD 5/4/2009EPA 200.8 Normal (6-10 Days)MERCURY-CV 5/4/2009EPA 245.2 Normal (6-10 Days)NICKEL 5/4/2009EPA 200.8 Normal (6-10 Days)NITRATE/N 5/4/2009EPA 300.0 Normal (6-10 Days)NITRITE/N 5/4/2009EPA 300.0 Normal (6-10 Days)PHOSPHATE/P FIA 5/4/2009SM4500PF Normal (6-10 Days)POTASSIUM ICP 5/4/2009EPA 200.7 Normal (6-10 Days)SODIUM ICP 5/4/2009EPA 200.7 Normal (6-10 Days)SOLIDS - TDS 4/29/2009EPA 160.1 Normal (6-10 Days)SOLIDS - TSS 4/29/2009EPA 160.2 Normal (6-10 Days)SULFATE 5/4/2009EPA 300.0 Normal (6-10 Days)TKN 5/4/2009SM4500NORGC Normal (6-10 Days)TOTAL P FIA 5/4/2009SM4500PF Normal (6-10 Days)TPN 5/4/2009SM4500N-C Normal (6-10 Days)ZINC 5/4/2009EPA 200.8 Normal (6-10 Days)

Order ID: 090422025Customer Name: PBS & J
PO BOX 990
Contact Name: RICHARD ALLINGER
Comment:
Order Date: 4/22/2009
Project Name: SALTESE FLATS 10002604.03
VERADALE WA 99037-0990
Sample #: 090422025-008
Date Collected: 4/21/2009
Date Received: 4/22/2009 12:04:00 P
Customer Sample #: 042109-SL
Comment:
Collector: RICH ALLINGER
Matrix: WaterQuantity: 1
Recv'd:
Test Test Group Method Due Date Priority
ALKALINITY 4/24/2009SM2320B Normal (6-10 Days)AMMONIA-NITROGEN 5/4/2009SM4500NH3G Normal (6-10 Days)ARSENIC 5/4/2009EPA 200.8 Normal (6-10 Days)BICARBONATE 4/24/2009SM2320B Normal (6-10 Days)CADMIUM 5/4/2009EPA 200.8 Normal (6-10 Days)CARBONATE 4/24/2009SM2320B Normal (6-10 Days)CHLORIDE 5/4/2009EPA 300.0 Normal (6-10 Days)COPPER 5/4/2009EPA 200.8 Normal (6-10 Days)HARDNESS by EPA 200.7 5/4/2009EPA 200.7 Normal (6-10 Days)IRON ICP 5/4/2009EPA 200.7 Normal (6-10 Days)LEAD 5/4/2009EPA 200.8 Normal (6-10 Days)MERCURY-CV 5/4/2009EPA 245.2 Normal (6-10 Days)NICKEL 5/4/2009EPA 200.8 Normal (6-10 Days)NITRATE/N 5/4/2009EPA 300.0 Normal (6-10 Days)NITRITE/N 5/4/2009EPA 300.0 Normal (6-10 Days)PHOSPHATE/P FIA 5/4/2009SM4500PF Normal (6-10 Days)POTASSIUM ICP 5/4/2009EPA 200.7 Normal (6-10 Days)SODIUM ICP 5/4/2009EPA 200.7 Normal (6-10 Days)SOLIDS - TDS 4/29/2009EPA 160.1 Normal (6-10 Days)SOLIDS - TSS 4/29/2009EPA 160.2 Normal (6-10 Days)SULFATE 5/4/2009EPA 300.0 Normal (6-10 Days)TKN 5/4/2009SM4500NORGC Normal (6-10 Days)TOTAL P FIA 5/4/2009SM4500PF Normal (6-10 Days)TPN 5/4/2009SM4500N-C Normal (6-10 Days)ZINC 5/4/2009EPA 200.8 Normal (6-10 Days)
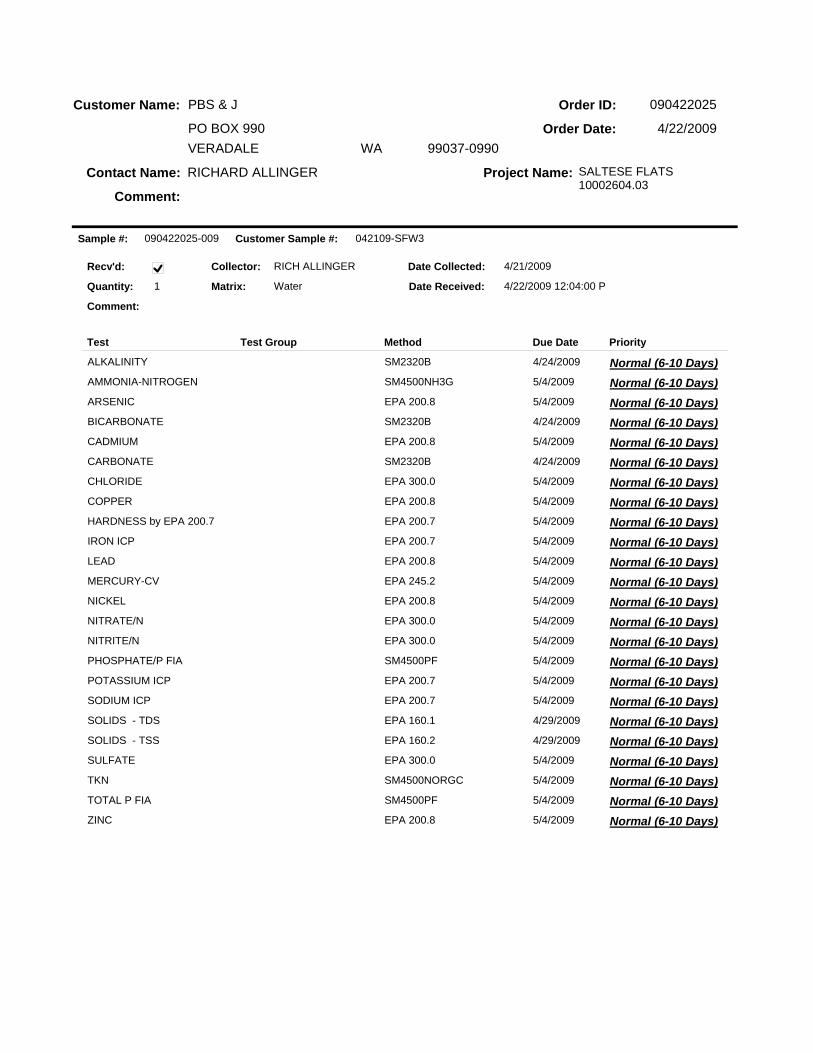
Order ID: 090422025Customer Name: PBS & J
PO BOX 990
Contact Name: RICHARD ALLINGER
Comment:
Order Date: 4/22/2009
Project Name: SALTESE FLATS 10002604.03
VERADALE WA 99037-0990
Sample #: 090422025-009
Date Collected: 4/21/2009
Date Received: 4/22/2009 12:04:00 P
Customer Sample #: 042109-SFW3
Comment:
Collector: RICH ALLINGER
Matrix: WaterQuantity: 1
Recv'd:
Test Test Group Method Due Date Priority
ALKALINITY 4/24/2009SM2320B Normal (6-10 Days)AMMONIA-NITROGEN 5/4/2009SM4500NH3G Normal (6-10 Days)ARSENIC 5/4/2009EPA 200.8 Normal (6-10 Days)BICARBONATE 4/24/2009SM2320B Normal (6-10 Days)CADMIUM 5/4/2009EPA 200.8 Normal (6-10 Days)CARBONATE 4/24/2009SM2320B Normal (6-10 Days)CHLORIDE 5/4/2009EPA 300.0 Normal (6-10 Days)COPPER 5/4/2009EPA 200.8 Normal (6-10 Days)HARDNESS by EPA 200.7 5/4/2009EPA 200.7 Normal (6-10 Days)IRON ICP 5/4/2009EPA 200.7 Normal (6-10 Days)LEAD 5/4/2009EPA 200.8 Normal (6-10 Days)MERCURY-CV 5/4/2009EPA 245.2 Normal (6-10 Days)NICKEL 5/4/2009EPA 200.8 Normal (6-10 Days)NITRATE/N 5/4/2009EPA 300.0 Normal (6-10 Days)NITRITE/N 5/4/2009EPA 300.0 Normal (6-10 Days)PHOSPHATE/P FIA 5/4/2009SM4500PF Normal (6-10 Days)POTASSIUM ICP 5/4/2009EPA 200.7 Normal (6-10 Days)SODIUM ICP 5/4/2009EPA 200.7 Normal (6-10 Days)SOLIDS - TDS 4/29/2009EPA 160.1 Normal (6-10 Days)SOLIDS - TSS 4/29/2009EPA 160.2 Normal (6-10 Days)SULFATE 5/4/2009EPA 300.0 Normal (6-10 Days)TKN 5/4/2009SM4500NORGC Normal (6-10 Days)TOTAL P FIA 5/4/2009SM4500PF Normal (6-10 Days)ZINC 5/4/2009EPA 200.8 Normal (6-10 Days)

Order ID: 090422025Customer Name: PBS & J
PO BOX 990
Contact Name: RICHARD ALLINGER
Comment:
Order Date: 4/22/2009
Project Name: SALTESE FLATS 10002604.03
VERADALE WA 99037-0990
Sample #: 090422025-010
Date Collected: 4/21/2009
Date Received: 4/22/2009 12:04:00 P
Customer Sample #: 042109-SFW12
Comment:
Collector: RICH ALLINGER
Matrix: WaterQuantity: 1
Recv'd:
Test Test Group Method Due Date Priority
ALKALINITY 4/24/2009SM2320B Normal (6-10 Days)AMMONIA-NITROGEN 5/4/2009SM4500NH3G Normal (6-10 Days)ARSENIC 5/4/2009EPA 200.8 Normal (6-10 Days)BICARBONATE 4/24/2009SM2320B Normal (6-10 Days)CADMIUM 5/4/2009EPA 200.8 Normal (6-10 Days)CARBONATE 4/24/2009SM2320B Normal (6-10 Days)CHLORIDE 5/4/2009EPA 300.0 Normal (6-10 Days)COPPER 5/4/2009EPA 200.8 Normal (6-10 Days)HARDNESS by EPA 200.7 5/4/2009EPA 200.7 Normal (6-10 Days)IRON ICP 5/4/2009EPA 200.7 Normal (6-10 Days)LEAD 5/4/2009EPA 200.8 Normal (6-10 Days)MERCURY-CV 5/4/2009EPA 245.2 Normal (6-10 Days)NICKEL 5/4/2009EPA 200.8 Normal (6-10 Days)NITRATE/N 5/4/2009EPA 300.0 Normal (6-10 Days)NITRITE/N 5/4/2009EPA 300.0 Normal (6-10 Days)PHOSPHATE/P FIA 5/4/2009SM4500PF Normal (6-10 Days)POTASSIUM ICP 5/4/2009EPA 200.7 Normal (6-10 Days)SODIUM ICP 5/4/2009EPA 200.7 Normal (6-10 Days)SOLIDS - TDS 4/29/2009EPA 160.1 Normal (6-10 Days)SOLIDS - TSS 4/29/2009EPA 160.2 Normal (6-10 Days)SULFATE 5/4/2009EPA 300.0 Normal (6-10 Days)TKN 5/4/2009SM4500NORGC Normal (6-10 Days)TOTAL P FIA 5/4/2009SM4500PF Normal (6-10 Days)ZINC 5/4/2009EPA 200.8 Normal (6-10 Days)

Order ID: 090422025Customer Name: PBS & J
PO BOX 990
Contact Name: RICHARD ALLINGER
Comment:
Order Date: 4/22/2009
Project Name: SALTESE FLATS 10002604.03
VERADALE WA 99037-0990
Sample #: 090422025-011
Date Collected: 4/21/2009
Date Received: 4/22/2009 12:04:00 P
Customer Sample #: 042109-SFW7
Comment:
Collector: RICH ALLINGER
Matrix: WaterQuantity: 1
Recv'd:
Test Test Group Method Due Date Priority
ALKALINITY 4/24/2009SM2320B Normal (6-10 Days)AMMONIA-NITROGEN 5/4/2009SM4500NH3G Normal (6-10 Days)ARSENIC 5/4/2009EPA 200.8 Normal (6-10 Days)BICARBONATE 4/24/2009SM2320B Normal (6-10 Days)CADMIUM 5/4/2009EPA 200.8 Normal (6-10 Days)CARBONATE 4/24/2009SM2320B Normal (6-10 Days)CHLORIDE 5/4/2009EPA 300.0 Normal (6-10 Days)COPPER 5/4/2009EPA 200.8 Normal (6-10 Days)HARDNESS by EPA 200.7 5/4/2009EPA 200.7 Normal (6-10 Days)IRON ICP 5/4/2009EPA 200.7 Normal (6-10 Days)LEAD 5/4/2009EPA 200.8 Normal (6-10 Days)MERCURY-CV 5/4/2009EPA 245.2 Normal (6-10 Days)NICKEL 5/4/2009EPA 200.8 Normal (6-10 Days)NITRATE/N 5/4/2009EPA 300.0 Normal (6-10 Days)NITRITE/N 5/4/2009EPA 300.0 Normal (6-10 Days)PHOSPHATE/P FIA 5/4/2009SM4500PF Normal (6-10 Days)POTASSIUM ICP 5/4/2009EPA 200.7 Normal (6-10 Days)SODIUM ICP 5/4/2009EPA 200.7 Normal (6-10 Days)SOLIDS - TDS 4/29/2009EPA 160.1 Normal (6-10 Days)SOLIDS - TSS 4/29/2009EPA 160.2 Normal (6-10 Days)SULFATE 5/4/2009EPA 300.0 Normal (6-10 Days)TKN 5/4/2009SM4500NORGC Normal (6-10 Days)TOTAL P FIA 5/4/2009SM4500PF Normal (6-10 Days)ZINC 5/4/2009EPA 200.8 Normal (6-10 Days)

Order ID: 090422025Customer Name: PBS & J
PO BOX 990
Contact Name: RICHARD ALLINGER
Comment:
Order Date: 4/22/2009
Project Name: SALTESE FLATS 10002604.03
VERADALE WA 99037-0990
Sample #: 090422025-012
Date Collected: 4/21/2009
Date Received: 4/22/2009 12:04:00 P
Customer Sample #: 042109-SFW4
Comment:
Collector: RICH ALLINGER
Matrix: WaterQuantity: 1
Recv'd:
Test Test Group Method Due Date Priority
ALKALINITY 4/24/2009SM2320B Normal (6-10 Days)AMMONIA-NITROGEN 5/4/2009SM4500NH3G Normal (6-10 Days)ARSENIC 5/4/2009EPA 200.8 Normal (6-10 Days)BICARBONATE 4/24/2009SM2320B Normal (6-10 Days)CADMIUM 5/4/2009EPA 200.8 Normal (6-10 Days)CARBONATE 4/24/2009SM2320B Normal (6-10 Days)CHLORIDE 5/4/2009EPA 300.0 Normal (6-10 Days)COPPER 5/4/2009EPA 200.8 Normal (6-10 Days)HARDNESS by EPA 200.7 5/4/2009EPA 200.7 Normal (6-10 Days)IRON ICP 5/4/2009EPA 200.7 Normal (6-10 Days)LEAD 5/4/2009EPA 200.8 Normal (6-10 Days)MERCURY-CV 5/4/2009EPA 245.2 Normal (6-10 Days)NICKEL 5/4/2009EPA 200.8 Normal (6-10 Days)NITRATE/N 5/4/2009EPA 300.0 Normal (6-10 Days)NITRITE/N 5/4/2009EPA 300.0 Normal (6-10 Days)PHOSPHATE/P FIA 5/4/2009SM4500PF Normal (6-10 Days)POTASSIUM ICP 5/4/2009EPA 200.7 Normal (6-10 Days)SODIUM ICP 5/4/2009EPA 200.7 Normal (6-10 Days)SOLIDS - TDS 4/29/2009EPA 160.1 Normal (6-10 Days)SOLIDS - TSS 4/29/2009EPA 160.2 Normal (6-10 Days)SULFATE 5/4/2009EPA 300.0 Normal (6-10 Days)TKN 5/4/2009SM4500NORGC Normal (6-10 Days)TOTAL P FIA 5/4/2009SM4500PF Normal (6-10 Days)ZINC 5/4/2009EPA 200.8 Normal (6-10 Days)

Order ID: 090422025Customer Name: PBS & J
PO BOX 990
Contact Name: RICHARD ALLINGER
Comment:
Order Date: 4/22/2009
Project Name: SALTESE FLATS 10002604.03
VERADALE WA 99037-0990
Sample #: 090422025-013
Date Collected: 4/21/2009
Date Received: 4/22/2009 12:04:00 P
Customer Sample #: 042109-SFW1
Comment:
Collector: RICH ALLINGER
Matrix: WaterQuantity: 1
Recv'd:
Test Test Group Method Due Date Priority
ALKALINITY 4/24/2009SM2320B Normal (6-10 Days)AMMONIA-NITROGEN 5/4/2009SM4500NH3G Normal (6-10 Days)ARSENIC 5/4/2009EPA 200.8 Normal (6-10 Days)BICARBONATE 4/24/2009SM2320B Normal (6-10 Days)CADMIUM 5/4/2009EPA 200.8 Normal (6-10 Days)CARBONATE 4/24/2009SM2320B Normal (6-10 Days)CHLORIDE 5/4/2009EPA 300.0 Normal (6-10 Days)COPPER 5/4/2009EPA 200.8 Normal (6-10 Days)HARDNESS by EPA 200.7 5/4/2009EPA 200.7 Normal (6-10 Days)IRON ICP 5/4/2009EPA 200.7 Normal (6-10 Days)LEAD 5/4/2009EPA 200.8 Normal (6-10 Days)MERCURY-CV 5/4/2009EPA 245.2 Normal (6-10 Days)NICKEL 5/4/2009EPA 200.8 Normal (6-10 Days)NITRATE/N 5/4/2009EPA 300.0 Normal (6-10 Days)NITRITE/N 5/4/2009EPA 300.0 Normal (6-10 Days)PHOSPHATE/P FIA 5/4/2009SM4500PF Normal (6-10 Days)POTASSIUM ICP 5/4/2009EPA 200.7 Normal (6-10 Days)SODIUM ICP 5/4/2009EPA 200.7 Normal (6-10 Days)SOLIDS - TDS 4/29/2009EPA 160.1 Normal (6-10 Days)SOLIDS - TSS 4/29/2009EPA 160.2 Normal (6-10 Days)SULFATE 5/4/2009EPA 300.0 Normal (6-10 Days)TKN 5/4/2009SM4500NORGC Normal (6-10 Days)TOTAL P FIA 5/4/2009SM4500PF Normal (6-10 Days)ZINC 5/4/2009EPA 200.8 Normal (6-10 Days)

Order ID: 090422025Customer Name: PBS & J
PO BOX 990
Contact Name: RICHARD ALLINGER
Comment:
Order Date: 4/22/2009
Project Name: SALTESE FLATS 10002604.03
VERADALE WA 99037-0990
Sample #: 090422025-014
Date Collected: 4/21/2009
Date Received: 4/22/2009 12:04:00 P
Customer Sample #: 042109-SFW15
Comment:
Collector: RICH ALLINGER
Matrix: WaterQuantity: 1
Recv'd:
Test Test Group Method Due Date Priority
ALKALINITY 4/24/2009SM2320B Normal (6-10 Days)AMMONIA-NITROGEN 5/4/2009SM4500NH3G Normal (6-10 Days)ARSENIC 5/4/2009EPA 200.8 Normal (6-10 Days)BICARBONATE 4/24/2009SM2320B Normal (6-10 Days)CADMIUM 5/4/2009EPA 200.8 Normal (6-10 Days)CARBONATE 4/24/2009SM2320B Normal (6-10 Days)CHLORIDE 5/4/2009EPA 300.0 Normal (6-10 Days)COPPER 5/4/2009EPA 200.8 Normal (6-10 Days)HARDNESS by EPA 200.7 5/4/2009EPA 200.7 Normal (6-10 Days)IRON ICP 5/4/2009EPA 200.7 Normal (6-10 Days)LEAD 5/4/2009EPA 200.8 Normal (6-10 Days)MERCURY-CV 5/4/2009EPA 245.2 Normal (6-10 Days)NICKEL 5/4/2009EPA 200.8 Normal (6-10 Days)NITRATE/N 5/4/2009EPA 300.0 Normal (6-10 Days)NITRITE/N 5/4/2009EPA 300.0 Normal (6-10 Days)PHOSPHATE/P FIA 5/4/2009SM4500PF Normal (6-10 Days)POTASSIUM ICP 5/4/2009EPA 200.7 Normal (6-10 Days)SODIUM ICP 5/4/2009EPA 200.7 Normal (6-10 Days)SOLIDS - TDS 4/29/2009EPA 160.1 Normal (6-10 Days)SOLIDS - TSS 4/29/2009EPA 160.2 Normal (6-10 Days)SULFATE 5/4/2009EPA 300.0 Normal (6-10 Days)TKN 5/4/2009SM4500NORGC Normal (6-10 Days)TOTAL P FIA 5/4/2009SM4500PF Normal (6-10 Days)ZINC 5/4/2009EPA 200.8 Normal (6-10 Days)

Order ID: 090422025Customer Name: PBS & J
PO BOX 990
Contact Name: RICHARD ALLINGER
Comment:
Order Date: 4/22/2009
Project Name: SALTESE FLATS 10002604.03
VERADALE WA 99037-0990
Sample #: 090422025-015
Date Collected: 4/21/2009
Date Received: 4/22/2009 12:04:00 P
Customer Sample #: 042109-McGOWAN
Comment:
Collector: RICH ALLINGER
Matrix: WaterQuantity: 1
Recv'd:
Test Test Group Method Due Date Priority
ALKALINITY 4/24/2009SM2320B Normal (6-10 Days)AMMONIA-NITROGEN 5/4/2009SM4500NH3G Normal (6-10 Days)ARSENIC 5/4/2009EPA 200.8 Normal (6-10 Days)BICARBONATE 4/24/2009SM2320B Normal (6-10 Days)CADMIUM 5/4/2009EPA 200.8 Normal (6-10 Days)CARBONATE 4/24/2009SM2320B Normal (6-10 Days)CHLORIDE 5/4/2009EPA 300.0 Normal (6-10 Days)COPPER 5/4/2009EPA 200.8 Normal (6-10 Days)HARDNESS by EPA 200.7 5/4/2009EPA 200.7 Normal (6-10 Days)IRON ICP 5/4/2009EPA 200.7 Normal (6-10 Days)LEAD 5/4/2009EPA 200.8 Normal (6-10 Days)MERCURY-CV 5/4/2009EPA 245.2 Normal (6-10 Days)NICKEL 5/4/2009EPA 200.8 Normal (6-10 Days)NITRATE/N 5/4/2009EPA 300.0 Normal (6-10 Days)NITRITE/N 5/4/2009EPA 300.0 Normal (6-10 Days)PHOSPHATE/P FIA 5/4/2009SM4500PF Normal (6-10 Days)POTASSIUM ICP 5/4/2009EPA 200.7 Normal (6-10 Days)SODIUM ICP 5/4/2009EPA 200.7 Normal (6-10 Days)SOLIDS - TDS 4/29/2009EPA 160.1 Normal (6-10 Days)SOLIDS - TSS 4/29/2009EPA 160.2 Normal (6-10 Days)SULFATE 5/4/2009EPA 300.0 Normal (6-10 Days)TKN 5/4/2009SM4500NORGC Normal (6-10 Days)TOTAL P FIA 5/4/2009SM4500PF Normal (6-10 Days)ZINC 5/4/2009EPA 200.8 Normal (6-10 Days)

Order ID: 090422025Customer Name: PBS & J
PO BOX 990
Contact Name: RICHARD ALLINGER
Comment:
Order Date: 4/22/2009
Project Name: SALTESE FLATS 10002604.03
VERADALE WA 99037-0990
SAMPLE CONDITION RECORDSamples received in a cooler? Yes
Samples received intact? Yes
What is the temperature inside the cooler? 2.8
Samples received with a COC? Yes
Samples received within holding time? Yes
Are all sample bottles properly preserved? Yes
Are VOC samples free of headspace? N/A
Is there a trip blank to accompany VOC samples? N/A
Labels and chain agree? Yes


Client: PBS & J
Attn: RICHARD ALLINGER
Address: PO BOX 990VERADALE, WA 99037-0990
Batch #: 090717004
Analytical Results Report
Project Name: SALTESE FLATS 100002604 03.02
Anatek Labs, Inc.1282 Alturas Drive • Moscow, ID 83843 • (208) 883-2839 • Fax (208) 882-9246 • email [email protected]
504 E Sprague Ste. D • Spokane WA 99202 • (509) 838-3999 • Fax (509) 838-4433 • email [email protected]
090717004-001Sample Number
Matrix Water
Parameter Result Units Analysis Date Analyst Method QualifierPQL
Client Sample IDSampling Date 7/16/2009Sampling Time 11:15 AM
Date/Time Received 7/17/2009
Sample LocationExtraction Date071609-SC1
10:08 AM
Comments
mg/L KEA7/20/2009Alkalinity SM2320B14 10mg/L KME7/22/2009NH3-N SM4500NH3G0.039 0.05mg/L ETL7/22/2009Arsenic EPA 200.8ND 0.001mg/L KEA7/20/2009Bicarbonate SM2320B14 10mg/L ETL7/22/2009Cadmium EPA 200.8ND 0.001mg/L KEA7/20/2009Carbonate SM2320BND 10mg/L EMB7/17/2009Chloride EPA 300.00.863 0.1mg/L ETL7/22/2009Copper EPA 200.80.00176 0.001mg/L ETL7/22/2009Calcium EPA 200.73.60 0.1mg/L ETL7/22/2009Hardness EPA 200.712.8 1mg/L ETL7/22/2009Magnesium EPA 200.70.923 0.1mg/L ETL7/22/2009Iron EPA 200.70.751 0.01 M3mg/L ETL7/22/2009Lead EPA 200.8ND 0.001ug/L ETL7/29/2009Mercury-CVAFS EPA 245.7ND 0.05mg/L ETL7/22/2009Nickel EPA 200.8ND 0.001mg/L EMB7/17/2009NO3/N EPA 300.0ND 0.1mg/L EMB7/17/2009NO2/N EPA 300.0ND 0.1mg/L KAS7/17/2009PO4/P SM4500PF0.0703 0.005mg/L ETL7/22/2009Potassium EPA 200.71.02 0.01mg/L ETL7/22/2009Sodium EPA 200.73.10 0.01mg/L KEA7/24/2009TDS EPA 160.163 10mg/L JLU7/20/2009TSS EPA 160.2ND 2mg/L EMB7/17/2009Sulfate EPA 300.00.997 0.1mg/L KME7/24/2009TKN SM4500NORGC0.168 0.1mg/L JTT7/23/2009Total P SM4500PF0.540 0.005mg/L KME7/24/2009TPN SM4500N-C0.184 0.1mg/L ETL7/22/2009Zinc EPA 200.80.0123 0.001
Page 1 of 15Tuesday, August 11, 2009
Certifications held by Anatek Labs ID: EPA:ID00013; AZ:0701; CO:ID00013; FL(NELAP):E87893; ID:ID00013; IN:C-ID-01; KY:90142; MT:CERT0028; NM: ID00013; OR:ID200001-002; WA:C1320Certifications held by Anatek Labs WA: EPA:WA00169; CA:Cert2632; ID:WA00169; WA:C1287

Client: PBS & J
Attn: RICHARD ALLINGER
Address: PO BOX 990VERADALE, WA 99037-0990
Batch #: 090717004
Analytical Results Report
Project Name: SALTESE FLATS 100002604 03.02
Anatek Labs, Inc.1282 Alturas Drive • Moscow, ID 83843 • (208) 883-2839 • Fax (208) 882-9246 • email [email protected]
504 E Sprague Ste. D • Spokane WA 99202 • (509) 838-3999 • Fax (509) 838-4433 • email [email protected]
090717004-002Sample Number
Matrix Water
Parameter Result Units Analysis Date Analyst Method QualifierPQL
Client Sample IDSampling Date 7/16/2009Sampling Time 8:40 AM
Date/Time Received 7/17/2009
Sample LocationExtraction Date071609-SC3
10:08 AM
Comments
mg/L KEA7/20/2009Alkalinity SM2320B53 10mg/L KME7/22/2009NH3-N SM4500NH3G0.047 0.05mg/L ETL7/22/2009Arsenic EPA 200.80.00200 0.001mg/L KEA7/20/2009Bicarbonate SM2320B53 10mg/L ETL7/22/2009Cadmium EPA 200.8ND 0.001mg/L KEA7/20/2009Carbonate SM2320BND 10mg/L EMB7/17/2009Chloride EPA 300.01.88 0.1mg/L ETL7/22/2009Copper EPA 200.80.00130 0.001mg/L ETL7/22/2009Calcium EPA 200.711.5 0.1mg/L ETL7/22/2009Hardness EPA 200.742.8 1mg/L ETL7/22/2009Magnesium EPA 200.73.40 0.1mg/L ETL7/22/2009Iron EPA 200.73.46 0.01 M3mg/L ETL7/22/2009Lead EPA 200.8ND 0.001ug/L ETL7/29/2009Mercury-CVAFS EPA 245.7ND 0.05mg/L ETL7/22/2009Nickel EPA 200.80.00280 0.001mg/L EMB7/17/2009NO3/N EPA 300.0ND 0.1mg/L EMB7/17/2009NO2/N EPA 300.0ND 0.1mg/L KAS7/17/2009PO4/P SM4500PF0.0320 0.005mg/L ETL7/22/2009Potassium EPA 200.71.79 0.01mg/L ETL7/22/2009Sodium EPA 200.75.32 0.01mg/L KEA7/24/2009TDS EPA 160.1111 10mg/L JLU7/20/2009TSS EPA 160.26 2mg/L EMB7/17/2009Sulfate EPA 300.0ND 0.1mg/L KME7/24/2009TKN SM4500NORGC1.55 0.1mg/L JTT7/23/2009Total P SM4500PF0.0695 0.01mg/L KME7/24/2009TPN SM4500N-C1.12 0.1mg/L ETL7/22/2009Zinc EPA 200.80.0115 0.001
Page 2 of 15Tuesday, August 11, 2009
Certifications held by Anatek Labs ID: EPA:ID00013; AZ:0701; CO:ID00013; FL(NELAP):E87893; ID:ID00013; IN:C-ID-01; KY:90142; MT:CERT0028; NM: ID00013; OR:ID200001-002; WA:C1320Certifications held by Anatek Labs WA: EPA:WA00169; CA:Cert2632; ID:WA00169; WA:C1287

Client: PBS & J
Attn: RICHARD ALLINGER
Address: PO BOX 990VERADALE, WA 99037-0990
Batch #: 090717004
Analytical Results Report
Project Name: SALTESE FLATS 100002604 03.02
Anatek Labs, Inc.1282 Alturas Drive • Moscow, ID 83843 • (208) 883-2839 • Fax (208) 882-9246 • email [email protected]
504 E Sprague Ste. D • Spokane WA 99202 • (509) 838-3999 • Fax (509) 838-4433 • email [email protected]
090717004-003Sample Number
Matrix Water
Parameter Result Units Analysis Date Analyst Method QualifierPQL
Client Sample IDSampling Date 7/16/2009Sampling Time 9:20 AM
Date/Time Received 7/17/2009
Sample LocationExtraction Date071609-SC6
10:08 AM
Comments
mg/L KEA7/20/2009Alkalinity SM2320B60 10mg/L KME7/22/2009NH3-N SM4500NH3G0.209 0.05mg/L ETL7/22/2009Arsenic EPA 200.80.00217 0.001mg/L KEA7/20/2009Bicarbonate SM2320B60 10mg/L ETL7/22/2009Cadmium EPA 200.8ND 0.001mg/L KEA7/20/2009Carbonate SM2320BND 10mg/L EMB7/17/2009Chloride EPA 300.03.49 0.1mg/L ETL7/22/2009Copper EPA 200.80.00372 0.001mg/L ETL7/22/2009Calcium EPA 200.714.0 0.1mg/L ETL7/22/2009Hardness EPA 200.754.8 1mg/L ETL7/22/2009Magnesium EPA 200.74.81 0.1mg/L ETL7/22/2009Iron EPA 200.71.77 0.01 M3mg/L ETL7/22/2009Lead EPA 200.8ND 0.001mg/L ETL7/22/2009Magnesium EPA 200.74.81 0.01ug/L ETL7/29/2009Mercury-CVAFS EPA 245.7ND 0.05mg/L ETL7/22/2009Nickel EPA 200.8ND 0.001mg/L EMB7/17/2009NO3/N EPA 300.0ND 0.1mg/L EMB7/17/2009NO2/N EPA 300.0ND 0.1mg/L KAS7/17/2009PO4/P SM4500PF0.0643 0.005mg/L ETL7/22/2009Potassium EPA 200.72.61 0.01mg/L ETL7/22/2009Sodium EPA 200.76.01 0.01mg/L KEA7/24/2009TDS EPA 160.175 10mg/L JLU7/20/2009TSS EPA 160.2366 2mg/L EMB7/17/2009Sulfate EPA 300.02.98 0.1mg/L KME7/24/2009TKN SM4500NORGC1.59 0.1mg/L JTT7/23/2009Total P SM4500PF0.198 0.01mg/L KME7/24/2009TPN SM4500N-C1.09 0.1mg/L ETL7/22/2009Zinc EPA 200.80.0143 0.001
Page 3 of 15Tuesday, August 11, 2009
Certifications held by Anatek Labs ID: EPA:ID00013; AZ:0701; CO:ID00013; FL(NELAP):E87893; ID:ID00013; IN:C-ID-01; KY:90142; MT:CERT0028; NM: ID00013; OR:ID200001-002; WA:C1320Certifications held by Anatek Labs WA: EPA:WA00169; CA:Cert2632; ID:WA00169; WA:C1287
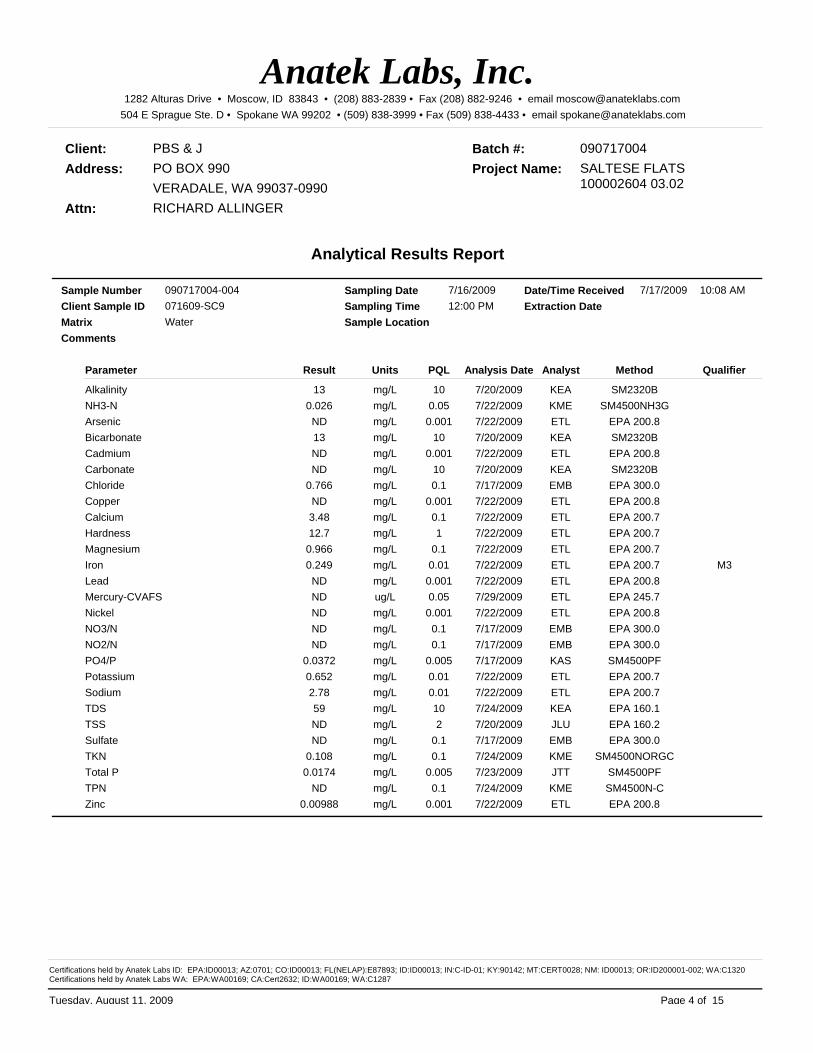
Client: PBS & J
Attn: RICHARD ALLINGER
Address: PO BOX 990VERADALE, WA 99037-0990
Batch #: 090717004
Analytical Results Report
Project Name: SALTESE FLATS 100002604 03.02
Anatek Labs, Inc.1282 Alturas Drive • Moscow, ID 83843 • (208) 883-2839 • Fax (208) 882-9246 • email [email protected]
504 E Sprague Ste. D • Spokane WA 99202 • (509) 838-3999 • Fax (509) 838-4433 • email [email protected]
090717004-004Sample Number
Matrix Water
Parameter Result Units Analysis Date Analyst Method QualifierPQL
Client Sample IDSampling Date 7/16/2009Sampling Time 12:00 PM
Date/Time Received 7/17/2009
Sample LocationExtraction Date071609-SC9
10:08 AM
Comments
mg/L KEA7/20/2009Alkalinity SM2320B13 10mg/L KME7/22/2009NH3-N SM4500NH3G0.026 0.05mg/L ETL7/22/2009Arsenic EPA 200.8ND 0.001mg/L KEA7/20/2009Bicarbonate SM2320B13 10mg/L ETL7/22/2009Cadmium EPA 200.8ND 0.001mg/L KEA7/20/2009Carbonate SM2320BND 10mg/L EMB7/17/2009Chloride EPA 300.00.766 0.1mg/L ETL7/22/2009Copper EPA 200.8ND 0.001mg/L ETL7/22/2009Calcium EPA 200.73.48 0.1mg/L ETL7/22/2009Hardness EPA 200.712.7 1mg/L ETL7/22/2009Magnesium EPA 200.70.966 0.1mg/L ETL7/22/2009Iron EPA 200.70.249 0.01 M3mg/L ETL7/22/2009Lead EPA 200.8ND 0.001ug/L ETL7/29/2009Mercury-CVAFS EPA 245.7ND 0.05mg/L ETL7/22/2009Nickel EPA 200.8ND 0.001mg/L EMB7/17/2009NO3/N EPA 300.0ND 0.1mg/L EMB7/17/2009NO2/N EPA 300.0ND 0.1mg/L KAS7/17/2009PO4/P SM4500PF0.0372 0.005mg/L ETL7/22/2009Potassium EPA 200.70.652 0.01mg/L ETL7/22/2009Sodium EPA 200.72.78 0.01mg/L KEA7/24/2009TDS EPA 160.159 10mg/L JLU7/20/2009TSS EPA 160.2ND 2mg/L EMB7/17/2009Sulfate EPA 300.0ND 0.1mg/L KME7/24/2009TKN SM4500NORGC0.108 0.1mg/L JTT7/23/2009Total P SM4500PF0.0174 0.005mg/L KME7/24/2009TPN SM4500N-CND 0.1mg/L ETL7/22/2009Zinc EPA 200.80.00988 0.001
Page 4 of 15Tuesday, August 11, 2009
Certifications held by Anatek Labs ID: EPA:ID00013; AZ:0701; CO:ID00013; FL(NELAP):E87893; ID:ID00013; IN:C-ID-01; KY:90142; MT:CERT0028; NM: ID00013; OR:ID200001-002; WA:C1320Certifications held by Anatek Labs WA: EPA:WA00169; CA:Cert2632; ID:WA00169; WA:C1287

Client: PBS & J
Attn: RICHARD ALLINGER
Address: PO BOX 990VERADALE, WA 99037-0990
Batch #: 090717004
Analytical Results Report
Project Name: SALTESE FLATS 100002604 03.02
Anatek Labs, Inc.1282 Alturas Drive • Moscow, ID 83843 • (208) 883-2839 • Fax (208) 882-9246 • email [email protected]
504 E Sprague Ste. D • Spokane WA 99202 • (509) 838-3999 • Fax (509) 838-4433 • email [email protected]
090717004-005Sample Number
Matrix Water
Parameter Result Units Analysis Date Analyst Method QualifierPQL
Client Sample IDSampling Date 7/16/2009Sampling Time 11:30 AM
Date/Time Received 7/17/2009
Sample LocationExtraction Date071609-GP1
10:08 AM
Comments
mg/L KEA7/20/2009Alkalinity SM2320B115 10mg/L KME7/22/2009NH3-N SM4500NH3G0.099 0.05mg/L ETL7/22/2009Arsenic EPA 200.80.00362 0.001mg/L KEA7/20/2009Bicarbonate SM2320B113 10mg/L ETL7/22/2009Cadmium EPA 200.8ND 0.001mg/L KEA7/20/2009Carbonate SM2320BND 10mg/L EMB7/17/2009Chloride EPA 300.08.34 0.5mg/L ETL7/22/2009Copper EPA 200.80.00105 0.001mg/L ETL7/22/2009Calcium EPA 200.741.3 0.1mg/L ETL7/22/2009Hardness EPA 200.7156 1mg/L ETL7/22/2009Magnesium EPA 200.712.8 0.1mg/L ETL7/22/2009Iron EPA 200.70.500 0.01 M3mg/L ETL7/22/2009Lead EPA 200.8ND 0.001ug/L ETL7/29/2009Mercury-CVAFS EPA 245.7ND 0.05mg/L ETL7/22/2009Nickel EPA 200.80.00136 0.001mg/L EMB7/17/2009NO3/N EPA 300.0ND 0.5mg/L EMB7/17/2009NO2/N EPA 300.0ND 0.5mg/L KAS7/17/2009PO4/P SM4500PF0.133 0.005mg/L ETL7/22/2009Potassium EPA 200.72.42 0.01mg/L ETL7/22/2009Sodium EPA 200.721.3 0.01mg/L KEA7/24/2009TDS EPA 160.1266 10mg/L JLU7/20/2009TSS EPA 160.221 2mg/L EMB7/17/2009Sulfate EPA 300.057.4 0.5mg/L KME7/24/2009TKN SM4500NORGC2.85 0.1mg/L JTT7/23/2009Total P SM4500PF0.217 0.01mg/L KME7/24/2009TPN SM4500N-C2.78 0.1mg/L ETL7/22/2009Zinc EPA 200.80.0129 0.001
Page 5 of 15Tuesday, August 11, 2009
Certifications held by Anatek Labs ID: EPA:ID00013; AZ:0701; CO:ID00013; FL(NELAP):E87893; ID:ID00013; IN:C-ID-01; KY:90142; MT:CERT0028; NM: ID00013; OR:ID200001-002; WA:C1320Certifications held by Anatek Labs WA: EPA:WA00169; CA:Cert2632; ID:WA00169; WA:C1287

Client: PBS & J
Attn: RICHARD ALLINGER
Address: PO BOX 990VERADALE, WA 99037-0990
Batch #: 090717004
Analytical Results Report
Project Name: SALTESE FLATS 100002604 03.02
Anatek Labs, Inc.1282 Alturas Drive • Moscow, ID 83843 • (208) 883-2839 • Fax (208) 882-9246 • email [email protected]
504 E Sprague Ste. D • Spokane WA 99202 • (509) 838-3999 • Fax (509) 838-4433 • email [email protected]
090717004-006Sample Number
Matrix Water
Parameter Result Units Analysis Date Analyst Method QualifierPQL
Client Sample IDSampling Date 7/16/2009Sampling Time 10:15 AM
Date/Time Received 7/17/2009
Sample LocationExtraction Date071609-QC1
10:08 AM
Comments
mg/L KEA7/20/2009Alkalinity SM2320B16 10mg/L KME7/22/2009NH3-N SM4500NH3G0.028 0.05mg/L ETL7/22/2009Arsenic EPA 200.8ND 0.001mg/L KEA7/20/2009Bicarbonate SM2320B16 10mg/L ETL7/22/2009Cadmium EPA 200.8ND 0.001mg/L KEA7/20/2009Carbonate SM2320BND 10mg/L EMB7/17/2009Chloride EPA 300.00.776 0.1mg/L ETL7/22/2009Copper EPA 200.8ND 0.001mg/L ETL7/22/2009Calcium EPA 200.73.53 0.1mg/L ETL7/22/2009Hardness EPA 200.712.9 1mg/L ETL7/22/2009Magnesium EPA 200.70.979 0.1mg/L ETL7/22/2009Iron EPA 200.70.253 0.01 M3mg/L ETL7/22/2009Lead EPA 200.8ND 0.001ug/L ETL7/29/2009Mercury-CVAFS EPA 245.7ND 0.05mg/L ETL7/22/2009Nickel EPA 200.8ND 0.001mg/L EMB7/17/2009NO3/N EPA 300.0ND 0.1mg/L EMB7/17/2009NO2/N EPA 300.0ND 0.1mg/L KAS7/17/2009PO4/P SM4500PF0.0345 0.005mg/L ETL7/22/2009Potassium EPA 200.70.670 0.01mg/L ETL7/22/2009Sodium EPA 200.72.87 0.01mg/L KEA7/24/2009TDS EPA 160.150 10mg/L JLU7/20/2009TSS EPA 160.2ND 2mg/L EMB7/17/2009Sulfate EPA 300.01.420 0.1mg/L KME7/24/2009TKN SM4500NORGC0.158 0.1mg/L JTT7/23/2009Total P SM4500PF0.0224 0.005mg/L KME7/24/2009TPN SM4500N-C0.152 0.1mg/L ETL7/22/2009Zinc EPA 200.80.0103 0.001
Page 6 of 15Tuesday, August 11, 2009
Certifications held by Anatek Labs ID: EPA:ID00013; AZ:0701; CO:ID00013; FL(NELAP):E87893; ID:ID00013; IN:C-ID-01; KY:90142; MT:CERT0028; NM: ID00013; OR:ID200001-002; WA:C1320Certifications held by Anatek Labs WA: EPA:WA00169; CA:Cert2632; ID:WA00169; WA:C1287

Client: PBS & J
Attn: RICHARD ALLINGER
Address: PO BOX 990VERADALE, WA 99037-0990
Batch #: 090717004
Analytical Results Report
Project Name: SALTESE FLATS 100002604 03.02
Anatek Labs, Inc.1282 Alturas Drive • Moscow, ID 83843 • (208) 883-2839 • Fax (208) 882-9246 • email [email protected]
504 E Sprague Ste. D • Spokane WA 99202 • (509) 838-3999 • Fax (509) 838-4433 • email [email protected]
090717004-007Sample Number
Matrix Water
Parameter Result Units Analysis Date Analyst Method QualifierPQL
Client Sample IDSampling Date 7/16/2009Sampling Time 10:30 AM
Date/Time Received 7/17/2009
Sample LocationExtraction Date071609-UT1
10:08 AM
Comments
mg/L KEA7/20/2009Alkalinity SM2320B15 10mg/L KME7/22/2009NH3-N SM4500NH3G0.026 0.05mg/L ETL7/22/2009Arsenic EPA 200.8ND 0.001mg/L KEA7/20/2009Bicarbonate SM2320B15 10mg/L ETL7/22/2009Cadmium EPA 200.8ND 0.001mg/L KEA7/20/2009Carbonate SM2320BND 10mg/L EMB7/17/2009Chloride EPA 300.01.19 0.1mg/L ETL7/22/2009Copper EPA 200.80.00100 0.001mg/L ETL7/22/2009Calcium EPA 200.73.22 0.1mg/L ETL7/22/2009Hardness EPA 200.711.7 1mg/L ETL7/22/2009Magnesium EPA 200.70.877 0.1mg/L ETL7/22/2009Iron EPA 200.70.676 0.01 M3mg/L ETL7/22/2009Lead EPA 200.8ND 0.001ug/L ETL7/29/2009Mercury-CVAFS EPA 245.7ND 0.05mg/L ETL7/22/2009Nickel EPA 200.8ND 0.001mg/L EMB7/17/2009NO3/N EPA 300.0ND 0.1mg/L EMB7/17/2009NO2/N EPA 300.0ND 0.1mg/L KAS7/17/2009PO4/P SM4500PF0.0502 0.005mg/L ETL7/22/2009Potassium EPA 200.70.865 0.01mg/L ETL7/22/2009Sodium EPA 200.73.44 0.01mg/L KEA7/24/2009TDS EPA 160.152 10mg/L JLU7/20/2009TSS EPA 160.25 2mg/L EMB7/17/2009Sulfate EPA 300.01.20 0.1mg/L KME7/24/2009TKN SM4500NORGC0.199 0.1mg/L JTT7/23/2009Total P SM4500PF0.0496 0.005mg/L KME7/24/2009TPN SM4500N-C0.187 0.1mg/L ETL7/22/2009Zinc EPA 200.80.0126 0.001
Page 7 of 15Tuesday, August 11, 2009
Certifications held by Anatek Labs ID: EPA:ID00013; AZ:0701; CO:ID00013; FL(NELAP):E87893; ID:ID00013; IN:C-ID-01; KY:90142; MT:CERT0028; NM: ID00013; OR:ID200001-002; WA:C1320Certifications held by Anatek Labs WA: EPA:WA00169; CA:Cert2632; ID:WA00169; WA:C1287

Client: PBS & J
Attn: RICHARD ALLINGER
Address: PO BOX 990VERADALE, WA 99037-0990
Batch #: 090717004
Analytical Results Report
Project Name: SALTESE FLATS 100002604 03.02
Anatek Labs, Inc.1282 Alturas Drive • Moscow, ID 83843 • (208) 883-2839 • Fax (208) 882-9246 • email [email protected]
504 E Sprague Ste. D • Spokane WA 99202 • (509) 838-3999 • Fax (509) 838-4433 • email [email protected]
090717004-008Sample Number
Matrix Water
Parameter Result Units Analysis Date Analyst Method QualifierPQL
Client Sample IDSampling Date 7/16/2009Sampling Time 11:50 AM
Date/Time Received 7/17/2009
Sample LocationExtraction Date071609-SL
10:08 AM
Comments
mg/L KEA7/20/2009Alkalinity SM2320B63 10mg/L KME7/22/2009NH3-N SM4500NH3G0.047 0.05mg/L ETL7/22/2009Arsenic EPA 200.80.00119 0.001mg/L KEA7/20/2009Bicarbonate SM2320B55 10mg/L ETL7/22/2009Cadmium EPA 200.8ND 0.001mg/L KEA7/20/2009Carbonate SM2320BND 10mg/L EMB7/17/2009Chloride EPA 300.05.74 0.1mg/L ETL7/22/2009Copper EPA 200.80.00143 0.001mg/L ETL7/22/2009Calcium EPA 200.717.0 0.1mg/L ETL7/22/2009Hardness EPA 200.761.8 1mg/L ETL7/22/2009Magnesium EPA 200.74.68 0.1mg/L ETL7/22/2009Iron EPA 200.70.220 0.01 M3mg/L ETL7/22/2009Lead EPA 200.8ND 0.001ug/L ETL7/30/2009Mercury-CVAFS EPA 245.7ND 0.05mg/L ETL7/22/2009Nickel EPA 200.8ND 0.001mg/L EMB7/17/2009NO3/N EPA 300.0ND 0.1mg/L EMB7/17/2009NO2/N EPA 300.0ND 0.1mg/L KAS7/17/2009PO4/P SM4500PF0.0228 0.005mg/L ETL7/22/2009Potassium EPA 200.72.10 0.01mg/L ETL7/22/2009Sodium EPA 200.77.68 0.01mg/L KEA7/24/2009TDS EPA 160.1117 10mg/L JLU7/20/2009TSS EPA 160.213 2mg/L EMB7/17/2009Sulfate EPA 300.04.30 0.1mg/L KME7/24/2009TKN SM4500NORGC0.629 0.1mg/L JTT7/23/2009Total P SM4500PF0.0392 0.005mg/L KME7/24/2009TPN SM4500N-C0.477 0.1mg/L ETL7/22/2009Zinc EPA 200.80.0149 0.001
Page 8 of 15Tuesday, August 11, 2009
Certifications held by Anatek Labs ID: EPA:ID00013; AZ:0701; CO:ID00013; FL(NELAP):E87893; ID:ID00013; IN:C-ID-01; KY:90142; MT:CERT0028; NM: ID00013; OR:ID200001-002; WA:C1320Certifications held by Anatek Labs WA: EPA:WA00169; CA:Cert2632; ID:WA00169; WA:C1287

Client: PBS & J
Attn: RICHARD ALLINGER
Address: PO BOX 990VERADALE, WA 99037-0990
Batch #: 090717004
Analytical Results Report
Project Name: SALTESE FLATS 100002604 03.02
Anatek Labs, Inc.1282 Alturas Drive • Moscow, ID 83843 • (208) 883-2839 • Fax (208) 882-9246 • email [email protected]
504 E Sprague Ste. D • Spokane WA 99202 • (509) 838-3999 • Fax (509) 838-4433 • email [email protected]
090717004-009Sample Number
Matrix Water
Parameter Result Units Analysis Date Analyst Method QualifierPQL
Client Sample IDSampling Date 7/16/2009Sampling Time 10:45 AM
Date/Time Received 7/17/2009
Sample LocationExtraction Date071609-DW1
10:08 AM
Comments
mg/L KEA7/20/2009Alkalinity SM2320B90 10mg/L KME7/22/2009NH3-N SM4500NH3G0.020 0.05mg/L ETL7/22/2009Arsenic EPA 200.8ND 0.001mg/L KEA7/20/2009Bicarbonate SM2320B90 10mg/L ETL7/22/2009Cadmium EPA 200.8ND 0.001mg/L KEA7/20/2009Carbonate SM2320BND 10mg/L EMB7/17/2009Chloride EPA 300.00.608 0.1mg/L ETL7/22/2009Copper EPA 200.80.0152 0.001mg/L ETL7/22/2009Calcium EPA 200.719.9 0.1mg/L ETL7/22/2009Hardness EPA 200.767.2 1mg/L ETL7/22/2009Magnesium EPA 200.74.23 0.1mg/L ETL7/22/2009Iron EPA 200.70.130 0.01 M3mg/L ETL7/22/2009Lead EPA 200.80.00416 0.001ug/L ETL7/30/2009Mercury-CVAFS EPA 245.7ND 0.05mg/L ETL7/22/2009Nickel EPA 200.80.00100 0.001mg/L EMB7/17/2009NO3/N EPA 300.0ND 0.1mg/L EMB7/17/2009NO2/N EPA 300.0ND 0.1mg/L KAS7/17/2009PO4/P SM4500PF0.0468 0.005mg/L ETL7/22/2009Potassium EPA 200.71.36 0.01mg/L ETL7/22/2009Sodium EPA 200.715.5 0.01mg/L KEA7/24/2009TDS EPA 160.1109 10mg/L JLU7/20/2009TSS EPA 160.2ND 2mg/L EMB7/17/2009Sulfate EPA 300.05.82 0.1mg/L KME7/27/2009TKN SM4500NORGCND 0.1mg/L JTT7/23/2009Total P SM4500PF0.0188 0.005mg/L KME7/24/2009TPN SM4500N-CND 0.1mg/L ETL7/22/2009Zinc EPA 200.80.0669 0.001
Page 9 of 15Tuesday, August 11, 2009
Certifications held by Anatek Labs ID: EPA:ID00013; AZ:0701; CO:ID00013; FL(NELAP):E87893; ID:ID00013; IN:C-ID-01; KY:90142; MT:CERT0028; NM: ID00013; OR:ID200001-002; WA:C1320Certifications held by Anatek Labs WA: EPA:WA00169; CA:Cert2632; ID:WA00169; WA:C1287

Client: PBS & J
Attn: RICHARD ALLINGER
Address: PO BOX 990VERADALE, WA 99037-0990
Batch #: 090717004
Analytical Results Report
Project Name: SALTESE FLATS 100002604 03.02
Anatek Labs, Inc.1282 Alturas Drive • Moscow, ID 83843 • (208) 883-2839 • Fax (208) 882-9246 • email [email protected]
504 E Sprague Ste. D • Spokane WA 99202 • (509) 838-3999 • Fax (509) 838-4433 • email [email protected]
090717004-010Sample Number
Matrix Water
Parameter Result Units Analysis Date Analyst Method QualifierPQL
Client Sample IDSampling Date 7/16/2009Sampling Time 8:40 AM
Date/Time Received 7/17/2009
Sample LocationExtraction Date071609-SFW3
10:08 AM
Comments
mg/L KEA7/20/2009Alkalinity SM2320B134 10mg/L KME7/22/2009NH3-N SM4500NH3G0.726 0.5mg/L ETL7/22/2009Arsenic EPA 200.80.00948 0.001mg/L KEA7/20/2009Bicarbonate SM2320B134 10mg/L ETL7/22/2009Cadmium EPA 200.8ND 0.001mg/L KEA7/20/2009Carbonate SM2320BND 10mg/L EMB7/17/2009Chloride EPA 300.03.32 0.5mg/L ETL7/22/2009Copper EPA 200.80.0374 0.001mg/L ETL7/22/2009Calcium EPA 200.726.8 0.1mg/L ETL7/22/2009Hardness EPA 200.7105 1mg/L ETL7/22/2009Magnesium EPA 200.79.16 0.1mg/L ETL7/22/2009Iron EPA 200.723.1 0.01 M3mg/L ETL7/22/2009Lead EPA 200.80.0100 0.001ug/L ETL7/30/2009Mercury-CVAFS EPA 245.7ND 0.05mg/L ETL7/22/2009Nickel EPA 200.80.0206 0.001mg/L EMB7/17/2009NO3/N EPA 300.0ND 0.5mg/L EMB7/17/2009NO2/N EPA 300.0ND 0.5mg/L KAS7/17/2009PO4/P SM4500PF0.159 0.005mg/L ETL7/22/2009Potassium EPA 200.710.8 0.01mg/L ETL7/22/2009Sodium EPA 200.740.1 0.01mg/L KEA7/24/2009TDS EPA 160.1293 10mg/L JLU7/20/2009TSS EPA 160.21150 2mg/L EMB7/17/2009Sulfate EPA 300.021.42 0.5mg/L KME7/27/2009TKN SM4500NORGC4.74 0.5mg/L JTT7/23/2009Total P SM4500PF0.913 0.01mg/L KME7/24/2009TPN SM4500N-C4.25 0.2mg/L ETL7/22/2009Zinc EPA 200.80.159 0.001
Page 10 of 15Tuesday, August 11, 2009
Certifications held by Anatek Labs ID: EPA:ID00013; AZ:0701; CO:ID00013; FL(NELAP):E87893; ID:ID00013; IN:C-ID-01; KY:90142; MT:CERT0028; NM: ID00013; OR:ID200001-002; WA:C1320Certifications held by Anatek Labs WA: EPA:WA00169; CA:Cert2632; ID:WA00169; WA:C1287

Client: PBS & J
Attn: RICHARD ALLINGER
Address: PO BOX 990VERADALE, WA 99037-0990
Batch #: 090717004
Analytical Results Report
Project Name: SALTESE FLATS 100002604 03.02
Anatek Labs, Inc.1282 Alturas Drive • Moscow, ID 83843 • (208) 883-2839 • Fax (208) 882-9246 • email [email protected]
504 E Sprague Ste. D • Spokane WA 99202 • (509) 838-3999 • Fax (509) 838-4433 • email [email protected]
090717004-011Sample Number
Matrix Water
Parameter Result Units Analysis Date Analyst Method QualifierPQL
Client Sample IDSampling Date 7/16/2009Sampling Time 10:30 AM
Date/Time Received 7/17/2009
Sample LocationExtraction Date071609-SFW20
10:08 AM
Comments
mg/L KEA7/20/2009Alkalinity SM2320B168 10mg/L KME7/27/2009NH3-N SM4500NH3G5.38 0.25mg/L ETL7/22/2009Arsenic EPA 200.80.00622 0.001mg/L KEA7/20/2009Bicarbonate SM2320B168 10mg/L ETL7/22/2009Cadmium EPA 200.8ND 0.001mg/L KEA7/20/2009Carbonate SM2320BND 10mg/L EMB7/17/2009Chloride EPA 300.09.14 0.5mg/L ETL7/22/2009Copper EPA 200.80.00945 0.001mg/L ETL7/22/2009Calcium EPA 200.739.6 0.1mg/L ETL7/22/2009Hardness EPA 200.7127 1mg/L ETL7/22/2009Magnesium EPA 200.76.69 0.1mg/L ETL7/22/2009Iron EPA 200.714.7 0.01 M3mg/L ETL7/22/2009Lead EPA 200.80.00667 0.001ug/L ETL7/30/2009Mercury-CVAFS EPA 245.7ND 0.05mg/L ETL7/22/2009Nickel EPA 200.80.00618 0.001mg/L EMB7/17/2009NO3/N EPA 300.0ND 0.5mg/L EMB7/17/2009NO2/N EPA 300.0ND 0.5mg/L KAS7/17/2009PO4/P SM4500PF0.121 0.005mg/L ETL7/22/2009Potassium EPA 200.76.10 0.01mg/L ETL7/22/2009Sodium EPA 200.780.8 0.01mg/L KEA7/24/2009TDS EPA 160.1504 10mg/L JLU7/20/2009TSS EPA 160.2468 2mg/L EMB7/17/2009Sulfate EPA 300.0131 0.5mg/L KME7/27/2009TKN SM4500NORGC9.27 0.5mg/L JTT7/23/2009Total P SM4500PF0.386 0.01mg/L KME7/24/2009TPN SM4500N-C7.65 0.2mg/L ETL7/22/2009Zinc EPA 200.80.0910 0.001
Page 11 of 15Tuesday, August 11, 2009
Certifications held by Anatek Labs ID: EPA:ID00013; AZ:0701; CO:ID00013; FL(NELAP):E87893; ID:ID00013; IN:C-ID-01; KY:90142; MT:CERT0028; NM: ID00013; OR:ID200001-002; WA:C1320Certifications held by Anatek Labs WA: EPA:WA00169; CA:Cert2632; ID:WA00169; WA:C1287

Client: PBS & J
Attn: RICHARD ALLINGER
Address: PO BOX 990VERADALE, WA 99037-0990
Batch #: 090717004
Analytical Results Report
Project Name: SALTESE FLATS 100002604 03.02
Anatek Labs, Inc.1282 Alturas Drive • Moscow, ID 83843 • (208) 883-2839 • Fax (208) 882-9246 • email [email protected]
504 E Sprague Ste. D • Spokane WA 99202 • (509) 838-3999 • Fax (509) 838-4433 • email [email protected]
090717004-012Sample Number
Matrix Water
Parameter Result Units Analysis Date Analyst Method QualifierPQL
Client Sample IDSampling Date 7/16/2009Sampling Time 10:02 AM
Date/Time Received 7/17/2009
Sample LocationExtraction Date071609-SFW7
10:08 AM
Comments
mg/L KEA7/20/2009Alkalinity SM2320B178 10mg/L KME7/27/2009NH3-N SM4500NH3G4.63 0.25mg/L ETL7/22/2009Arsenic EPA 200.80.00703 0.001mg/L KEA7/20/2009Bicarbonate SM2320B178 10mg/L ETL7/22/2009Cadmium EPA 200.8ND 0.001mg/L KEA7/20/2009Carbonate SM2320BND 10mg/L EMB7/17/2009Chloride EPA 300.09.66 0.5mg/L ETL7/22/2009Copper EPA 200.80.00846 0.001mg/L ETL7/22/2009Calcium EPA 200.742.0 0.1mg/L ETL7/22/2009Hardness EPA 200.7134 1mg/L ETL7/22/2009Magnesium EPA 200.76.94 0.1mg/L ETL7/22/2009Iron EPA 200.714.7 0.01 M3mg/L ETL7/22/2009Lead EPA 200.80.00643 0.001ug/L ETL7/30/2009Mercury-CVAFS EPA 245.7ND 0.05mg/L ETL7/22/2009Nickel EPA 200.80.00632 0.001mg/L EMB7/17/2009NO3/N EPA 300.0ND 0.5mg/L EMB7/17/2009NO2/N EPA 300.0ND 0.5mg/L KAS7/17/2009PO4/P SM4500PF0.124 0.005mg/L ETL7/22/2009Potassium EPA 200.76.54 0.01mg/L ETL7/22/2009Sodium EPA 200.788.8 0.01mg/L KEA7/24/2009TDS EPA 160.1413 10mg/L JLU7/20/2009TSS EPA 160.2316 2mg/L EMB7/21/2009Sulfate EPA 300.0145 0.1mg/L KME7/27/2009TKN SM4500NORGC8.44 0.5mg/L JTT7/23/2009Total P SM4500PF0.409 0.01mg/L KME7/24/2009TPN SM4500N-C7.06 0.2mg/L ETL7/22/2009Zinc EPA 200.80.201 0.001
Page 12 of 15Tuesday, August 11, 2009
Certifications held by Anatek Labs ID: EPA:ID00013; AZ:0701; CO:ID00013; FL(NELAP):E87893; ID:ID00013; IN:C-ID-01; KY:90142; MT:CERT0028; NM: ID00013; OR:ID200001-002; WA:C1320Certifications held by Anatek Labs WA: EPA:WA00169; CA:Cert2632; ID:WA00169; WA:C1287

Client: PBS & J
Attn: RICHARD ALLINGER
Address: PO BOX 990VERADALE, WA 99037-0990
Batch #: 090717004
Analytical Results Report
Project Name: SALTESE FLATS 100002604 03.02
Anatek Labs, Inc.1282 Alturas Drive • Moscow, ID 83843 • (208) 883-2839 • Fax (208) 882-9246 • email [email protected]
504 E Sprague Ste. D • Spokane WA 99202 • (509) 838-3999 • Fax (509) 838-4433 • email [email protected]
090717004-013Sample Number
Matrix Water
Parameter Result Units Analysis Date Analyst Method QualifierPQL
Client Sample IDSampling Date 7/16/2009Sampling Time 9:35 AM
Date/Time Received 7/17/2009
Sample LocationExtraction Date071609-SFW1
10:08 AM
Comments
mg/L KEA7/20/2009Alkalinity SM2320B116 10mg/L KME7/27/2009NH3-N SM4500NH3G0.592 0.25mg/L ETL7/22/2009Arsenic EPA 200.80.0183 0.001mg/L KEA7/20/2009Bicarbonate SM2320B116 10mg/L ETL7/22/2009Cadmium EPA 200.8ND 0.001mg/L KEA7/20/2009Carbonate SM2320BND 10mg/L EMB7/17/2009Chloride EPA 300.012.8 2mg/L ETL7/22/2009Copper EPA 200.80.0120 0.001mg/L ETL7/22/2009Calcium EPA 200.773.0 0.1mg/L ETL7/22/2009Hardness EPA 200.7234 1mg/L ETL7/22/2009Magnesium EPA 200.712.7 0.1mg/L ETL7/22/2009Iron EPA 200.720.9 0.01 M3mg/L ETL7/22/2009Lead EPA 200.80.00971 0.001ug/L ETL7/30/2009Mercury-CVAFS EPA 245.7ND 0.05mg/L ETL7/22/2009Nickel EPA 200.80.0176 0.001mg/L EMB7/17/2009NO3/N EPA 300.0ND 2mg/L EMB7/17/2009NO2/N EPA 300.0ND 2mg/L KAS7/17/2009PO4/P SM4500PF0.143 0.005mg/L ETL7/22/2009Potassium EPA 200.76.48 0.01mg/L ETL7/28/2009Sodium EPA 200.7139 0.1mg/L KEA7/24/2009TDS EPA 160.1828 10mg/L JLU7/20/2009TSS EPA 160.2104 2mg/L EMB7/17/2009Sulfate EPA 300.0375 2mg/L KME7/27/2009TKN SM4500NORGC5.45 0.4mg/L JTT7/23/2009Total P SM4500PF0.402 0.01mg/L KME7/24/2009TPN SM4500N-C4.93 0.2mg/L ETL7/22/2009Zinc EPA 200.80.0477 0.001
Page 13 of 15Tuesday, August 11, 2009
Certifications held by Anatek Labs ID: EPA:ID00013; AZ:0701; CO:ID00013; FL(NELAP):E87893; ID:ID00013; IN:C-ID-01; KY:90142; MT:CERT0028; NM: ID00013; OR:ID200001-002; WA:C1320Certifications held by Anatek Labs WA: EPA:WA00169; CA:Cert2632; ID:WA00169; WA:C1287

Client: PBS & J
Attn: RICHARD ALLINGER
Address: PO BOX 990VERADALE, WA 99037-0990
Batch #: 090717004
Analytical Results Report
Project Name: SALTESE FLATS 100002604 03.02
Anatek Labs, Inc.1282 Alturas Drive • Moscow, ID 83843 • (208) 883-2839 • Fax (208) 882-9246 • email [email protected]
504 E Sprague Ste. D • Spokane WA 99202 • (509) 838-3999 • Fax (509) 838-4433 • email [email protected]
090717004-014Sample Number
Matrix Water
Parameter Result Units Analysis Date Analyst Method QualifierPQL
Client Sample IDSampling Date 7/16/2009Sampling Time 10:50 AM
Date/Time Received 7/17/2009
Sample LocationExtraction Date071609-SFW12
10:08 AM
Comments
mg/L KEA7/20/2009Alkalinity SM2320B164 10mg/L KME7/27/2009NH3-N SM4500NH3G9.13 0.25mg/L ETL7/22/2009Arsenic EPA 200.80.0150 0.001mg/L KEA7/20/2009Bicarbonate SM2320B164 10mg/L ETL7/22/2009Cadmium EPA 200.8ND 0.001mg/L KEA7/20/2009Carbonate SM2320BND 10mg/L EMB7/17/2009Chloride EPA 300.06.93 0.5mg/L ETL7/22/2009Copper EPA 200.80.0410 0.001mg/L ETL7/22/2009Calcium EPA 200.729.0 0.1mg/L ETL7/22/2009Hardness EPA 200.797.7 1mg/L ETL7/22/2009Magnesium EPA 200.76.12 0.1mg/L ETL7/22/2009Iron EPA 200.732.2 0.01 M3mg/L ETL7/22/2009Lead EPA 200.80.0262 0.001ug/L ETL7/30/2009Mercury-CVAFS EPA 245.70.126 0.05mg/L ETL7/22/2009Nickel EPA 200.80.0300 0.001mg/L EMB7/17/2009NO3/N EPA 300.0ND 0.5mg/L EMB7/17/2009NO2/N EPA 300.0ND 0.5mg/L KAS7/17/2009PO4/P SM4500PF0.190 0.005mg/L ETL7/22/2009Potassium EPA 200.75.18 0.01mg/L ETL7/22/2009Sodium EPA 200.768.0 0.01mg/L KEA7/24/2009TDS EPA 160.1440 10mg/L JLU7/20/2009TSS EPA 160.21380 2mg/L EMB7/17/2009Sulfate EPA 300.072.5 0.5mg/L KME7/27/2009TKN SM4500NORGC37.2 0.5mg/L JTT7/23/2009Total P SM4500PF1.71 0.01mg/L KME7/24/2009TPN SM4500N-CND 0.1mg/L ETL7/22/2009Zinc EPA 200.80.203 0.001
Page 14 of 15Tuesday, August 11, 2009
Certifications held by Anatek Labs ID: EPA:ID00013; AZ:0701; CO:ID00013; FL(NELAP):E87893; ID:ID00013; IN:C-ID-01; KY:90142; MT:CERT0028; NM: ID00013; OR:ID200001-002; WA:C1320Certifications held by Anatek Labs WA: EPA:WA00169; CA:Cert2632; ID:WA00169; WA:C1287

Client: PBS & J
Attn: RICHARD ALLINGER
Address: PO BOX 990VERADALE, WA 99037-0990
Batch #: 090717004
Analytical Results Report
Project Name: SALTESE FLATS 100002604 03.02
Anatek Labs, Inc.1282 Alturas Drive • Moscow, ID 83843 • (208) 883-2839 • Fax (208) 882-9246 • email [email protected]
504 E Sprague Ste. D • Spokane WA 99202 • (509) 838-3999 • Fax (509) 838-4433 • email [email protected]
090717004-015Sample Number
Matrix Water
Parameter Result Units Analysis Date Analyst Method QualifierPQL
Client Sample IDSampling Date 7/16/2009Sampling Time 11:20 AM
Date/Time Received 7/17/2009
Sample LocationExtraction Date071609-SFW4
10:08 AM
Comments
mg/L KEA7/20/2009Alkalinity SM2320B157 10mg/L KME7/27/2009NH3-N SM4500NH3G2.66 0.25mg/L ETL7/22/2009Arsenic EPA 200.80.0156 0.001mg/L KEA7/20/2009Bicarbonate SM2320B157 10mg/L ETL7/22/2009Cadmium EPA 200.8ND 0.001mg/L KEA7/20/2009Carbonate SM2320BND 10mg/L EMB7/17/2009Chloride EPA 300.011.1 1mg/L ETL7/22/2009Copper EPA 200.80.0219 0.001mg/L ETL7/22/2009Calcium EPA 200.741.1 0.1mg/L ETL7/22/2009Hardness EPA 200.7137 1mg/L ETL7/22/2009Magnesium EPA 200.78.25 0.1mg/L ETL7/22/2009Iron EPA 200.725.4 0.01 M3mg/L ETL7/22/2009Lead EPA 200.80.0126 0.001ug/L ETL7/30/2009Mercury-CVAFS EPA 245.7ND 0.05mg/L ETL7/22/2009Nickel EPA 200.80.0183 0.001mg/L EMB7/17/2009NO3/N EPA 300.0ND 1mg/L EMB7/17/2009NO2/N EPA 300.0ND 1mg/L KAS7/17/2009PO4/P SM4500PF0.126 0.005mg/L ETL7/22/2009Potassium EPA 200.76.74 0.01mg/L ETL7/28/2009Sodium EPA 200.797.6 0.1mg/L KEA7/24/2009TDS EPA 160.1588 10mg/L JLU7/20/2009TSS EPA 160.2804 1mg/L EMB7/17/2009Sulfate EPA 300.0136 0.1mg/L KME7/27/2009TKN SM4500NORGC16.0 0.5mg/L JTT7/23/2009Total P SM4500PF1.01 0.01mg/L KME7/24/2009TPN SM4500N-C9.83 1mg/L ETL7/22/2009Zinc EPA 200.80.101 0.001
Authorized Signature
MCL EPA's Maximum Contaminant LevelND Not DetectedPQL Practical Quantitation Limit
Page 15 of 15Tuesday, August 11, 2009
Certifications held by Anatek Labs ID: EPA:ID00013; AZ:0701; CO:ID00013; FL(NELAP):E87893; ID:ID00013; IN:C-ID-01; KY:90142; MT:CERT0028; NM: ID00013; OR:ID200001-002; WA:C1320Certifications held by Anatek Labs WA: EPA:WA00169; CA:Cert2632; ID:WA00169; WA:C1287

Login Report
Anatek Labs, Inc.1282 Alturas Drive • Moscow, ID 83843 • (208) 883-2839 • Fax (208) 882-9246 • email [email protected]
504 E Sprague Ste. D • Spokane WA 99202 • (509) 838-3999 • Fax (509) 838-4433 • email [email protected]
Order ID: 090717004Customer Name: PBS & J
PO BOX 990
Contact Name: RICHARD ALLINGER
Comment:
Order Date: 7/17/2009
Project Name: SALTESE FLATS 100002604 03.02
VERADALE WA 99037-0990
Sample #: 090717004-001
Date Collected: 7/16/2009
Date Received: 7/17/2009 10:08:00 A
Customer Sample #: 071609-SC1
Comment:
Collector: RICH ALLINGER
Matrix: WaterQuantity: 1
Recv'd:
Test Test Group Method Due Date Priority
ALKALINITY 7/19/2009SM2320B Normal (6-10 Days)AMMONIA-NITROGEN 7/27/2009SM4500NH3G Normal (6-10 Days)ARSENIC 7/27/2009EPA 200.8 Normal (6-10 Days)BICARBONATE 7/19/2009SM2320B Normal (6-10 Days)CADMIUM 7/27/2009EPA 200.8 Normal (6-10 Days)CALCIUM ICP 7/27/2009EPA 200.7 Normal (6-10 Days)CARBONATE 7/19/2009SM2320B Normal (6-10 Days)CHLORIDE 7/27/2009EPA 300.0 Normal (6-10 Days)COPPER 7/27/2009EPA 200.8 Normal (6-10 Days)HARDNESS by EPA 200.7 7/27/2009EPA 200.7 Normal (6-10 Days)IRON ICP 7/27/2009EPA 200.7 Normal (6-10 Days)LEAD 7/27/2009EPA 200.8 Normal (6-10 Days)MAGNESIUM ICP 7/27/2009EPA 200.7 Normal (6-10 Days)MERCURY-CVAFS 7/27/2009EPA 245.7 Normal (6-10 Days)NICKEL 7/27/2009EPA 200.8 Normal (6-10 Days)NITRATE/N 7/19/2009EPA 300.0 Normal (6-10 Days)NITRITE/N 7/19/2009EPA 300.0 Normal (6-10 Days)PHOSPHATE/P FIA 7/27/2009SM4500PF Normal (6-10 Days)POTASSIUM ICP 7/27/2009EPA 200.7 Normal (6-10 Days)SODIUM ICP 7/27/2009EPA 200.7 Normal (6-10 Days)SOLIDS - TDS 7/24/2009EPA 160.1 Normal (6-10 Days)SOLIDS - TSS 7/24/2009EPA 160.2 Normal (6-10 Days)SULFATE 7/27/2009EPA 300.0 Normal (6-10 Days)

Order ID: 090717004Customer Name: PBS & J
PO BOX 990
Contact Name: RICHARD ALLINGER
Comment:
Order Date: 7/17/2009
Project Name: SALTESE FLATS 100002604 03.02
VERADALE WA 99037-0990
TKN 7/27/2009SM4500NORGC Normal (6-10 Days)TOTAL P FIA 7/27/2009SM4500PF Normal (6-10 Days)TPN 7/17/2009SM4500N-C Normal (6-10 Days)ZINC 7/27/2009EPA 200.8 Normal (6-10 Days)
Sample #: 090717004-002
Date Collected: 7/16/2009
Date Received: 7/17/2009 10:08:00 A
Customer Sample #: 071609-SC3
Comment:
Collector: RICH ALLINGER
Matrix: WaterQuantity: 1
Recv'd:
Test Test Group Method Due Date Priority
ALKALINITY 7/19/2009SM2320B Normal (6-10 Days)AMMONIA-NITROGEN 7/27/2009SM4500NH3G Normal (6-10 Days)ARSENIC 7/27/2009EPA 200.8 Normal (6-10 Days)BICARBONATE 7/19/2009SM2320B Normal (6-10 Days)CADMIUM 7/27/2009EPA 200.8 Normal (6-10 Days)CALCIUM ICP 7/27/2009EPA 200.7 Normal (6-10 Days)CARBONATE 7/19/2009SM2320B Normal (6-10 Days)CHLORIDE 7/27/2009EPA 300.0 Normal (6-10 Days)COPPER 7/27/2009EPA 200.8 Normal (6-10 Days)HARDNESS by EPA 200.7 7/27/2009EPA 200.7 Normal (6-10 Days)IRON ICP 7/27/2009EPA 200.7 Normal (6-10 Days)LEAD 7/27/2009EPA 200.8 Normal (6-10 Days)MAGNESIUM ICP 7/27/2009EPA 200.7 Normal (6-10 Days)MERCURY-CVAFS 7/27/2009EPA 245.7 Normal (6-10 Days)NICKEL 7/27/2009EPA 200.8 Normal (6-10 Days)NITRATE/N 7/19/2009EPA 300.0 Normal (6-10 Days)NITRITE/N 7/19/2009EPA 300.0 Normal (6-10 Days)PHOSPHATE/P FIA 7/27/2009SM4500PF Normal (6-10 Days)POTASSIUM ICP 7/27/2009EPA 200.7 Normal (6-10 Days)SODIUM ICP 7/27/2009EPA 200.7 Normal (6-10 Days)SOLIDS - TDS 7/24/2009EPA 160.1 Normal (6-10 Days)SOLIDS - TSS 7/24/2009EPA 160.2 Normal (6-10 Days)SULFATE 7/27/2009EPA 300.0 Normal (6-10 Days)TKN 7/27/2009SM4500NORGC Normal (6-10 Days)TOTAL P FIA 7/27/2009SM4500PF Normal (6-10 Days)TPN 7/17/2009SM4500N-C Normal (6-10 Days)

Order ID: 090717004Customer Name: PBS & J
PO BOX 990
Contact Name: RICHARD ALLINGER
Comment:
Order Date: 7/17/2009
Project Name: SALTESE FLATS 100002604 03.02
VERADALE WA 99037-0990
ZINC 7/27/2009EPA 200.8 Normal (6-10 Days)
Sample #: 090717004-003
Date Collected: 7/16/2009
Date Received: 7/17/2009 10:08:00 A
Customer Sample #: 071609-SC6
Comment:
Collector: RICH ALLINGER
Matrix: WaterQuantity: 1
Recv'd:
Test Test Group Method Due Date Priority
ALKALINITY 7/19/2009SM2320B Normal (6-10 Days)AMMONIA-NITROGEN 7/27/2009SM4500NH3G Normal (6-10 Days)ARSENIC 7/27/2009EPA 200.8 Normal (6-10 Days)BICARBONATE 7/19/2009SM2320B Normal (6-10 Days)CADMIUM 7/27/2009EPA 200.8 Normal (6-10 Days)CALCIUM ICP 7/27/2009EPA 200.7 Normal (6-10 Days)CARBONATE 7/19/2009SM2320B Normal (6-10 Days)CHLORIDE 7/27/2009EPA 300.0 Normal (6-10 Days)COPPER 7/27/2009EPA 200.8 Normal (6-10 Days)HARDNESS by EPA 200.7 7/27/2009EPA 200.7 Normal (6-10 Days)IRON ICP 7/27/2009EPA 200.7 Normal (6-10 Days)LEAD 7/27/2009EPA 200.8 Normal (6-10 Days)MAGNESIUM ICP 7/27/2009EPA 200.7 Normal (6-10 Days)MERCURY-CVAFS 7/27/2009EPA 245.7 Normal (6-10 Days)NICKEL 7/27/2009EPA 200.8 Normal (6-10 Days)NITRATE/N 7/19/2009EPA 300.0 Normal (6-10 Days)NITRITE/N 7/19/2009EPA 300.0 Normal (6-10 Days)PHOSPHATE/P FIA 7/27/2009SM4500PF Normal (6-10 Days)POTASSIUM ICP 7/27/2009EPA 200.7 Normal (6-10 Days)SODIUM ICP 7/27/2009EPA 200.7 Normal (6-10 Days)SOLIDS - TDS 7/24/2009EPA 160.1 Normal (6-10 Days)SOLIDS - TSS 7/24/2009EPA 160.2 Normal (6-10 Days)SULFATE 7/27/2009EPA 300.0 Normal (6-10 Days)TKN 7/27/2009SM4500NORGC Normal (6-10 Days)TOTAL P FIA 7/27/2009SM4500PF Normal (6-10 Days)TPN 7/17/2009SM4500N-C Normal (6-10 Days)ZINC 7/27/2009EPA 200.8 Normal (6-10 Days)

Order ID: 090717004Customer Name: PBS & J
PO BOX 990
Contact Name: RICHARD ALLINGER
Comment:
Order Date: 7/17/2009
Project Name: SALTESE FLATS 100002604 03.02
VERADALE WA 99037-0990
Sample #: 090717004-004
Date Collected: 7/16/2009
Date Received: 7/17/2009 10:08:00 A
Customer Sample #: 071609-SC9
Comment:
Collector: RICH ALLINGER
Matrix: WaterQuantity: 1
Recv'd:
Test Test Group Method Due Date Priority
ALKALINITY 7/19/2009SM2320B Normal (6-10 Days)AMMONIA-NITROGEN 7/27/2009SM4500NH3G Normal (6-10 Days)ARSENIC 7/27/2009EPA 200.8 Normal (6-10 Days)BICARBONATE 7/19/2009SM2320B Normal (6-10 Days)CADMIUM 7/27/2009EPA 200.8 Normal (6-10 Days)CALCIUM ICP 7/27/2009EPA 200.7 Normal (6-10 Days)CARBONATE 7/19/2009SM2320B Normal (6-10 Days)CHLORIDE 7/27/2009EPA 300.0 Normal (6-10 Days)COPPER 7/27/2009EPA 200.8 Normal (6-10 Days)HARDNESS by EPA 200.7 7/27/2009EPA 200.7 Normal (6-10 Days)IRON ICP 7/27/2009EPA 200.7 Normal (6-10 Days)LEAD 7/27/2009EPA 200.8 Normal (6-10 Days)MAGNESIUM ICP 7/27/2009EPA 200.7 Normal (6-10 Days)MERCURY-CVAFS 7/27/2009EPA 245.7 Normal (6-10 Days)NICKEL 7/27/2009EPA 200.8 Normal (6-10 Days)NITRATE/N 7/19/2009EPA 300.0 Normal (6-10 Days)NITRITE/N 7/19/2009EPA 300.0 Normal (6-10 Days)PHOSPHATE/P FIA 7/27/2009SM4500PF Normal (6-10 Days)POTASSIUM ICP 7/27/2009EPA 200.7 Normal (6-10 Days)SODIUM ICP 7/27/2009EPA 200.7 Normal (6-10 Days)SOLIDS - TDS 7/24/2009EPA 160.1 Normal (6-10 Days)SOLIDS - TSS 7/24/2009EPA 160.2 Normal (6-10 Days)SULFATE 7/27/2009EPA 300.0 Normal (6-10 Days)TKN 7/27/2009SM4500NORGC Normal (6-10 Days)TOTAL P FIA 7/27/2009SM4500PF Normal (6-10 Days)TPN 7/17/2009SM4500N-C Normal (6-10 Days)ZINC 7/27/2009EPA 200.8 Normal (6-10 Days)

Order ID: 090717004Customer Name: PBS & J
PO BOX 990
Contact Name: RICHARD ALLINGER
Comment:
Order Date: 7/17/2009
Project Name: SALTESE FLATS 100002604 03.02
VERADALE WA 99037-0990
Sample #: 090717004-005
Date Collected: 7/16/2009
Date Received: 7/17/2009 10:08:00 A
Customer Sample #: 071609-GP1
Comment:
Collector: RICH ALLINGER
Matrix: WaterQuantity: 1
Recv'd:
Test Test Group Method Due Date Priority
ALKALINITY 7/19/2009SM2320B Normal (6-10 Days)AMMONIA-NITROGEN 7/27/2009SM4500NH3G Normal (6-10 Days)ARSENIC 7/27/2009EPA 200.8 Normal (6-10 Days)BICARBONATE 7/19/2009SM2320B Normal (6-10 Days)CADMIUM 7/27/2009EPA 200.8 Normal (6-10 Days)CALCIUM ICP 7/27/2009EPA 200.7 Normal (6-10 Days)CARBONATE 7/19/2009SM2320B Normal (6-10 Days)CHLORIDE 7/27/2009EPA 300.0 Normal (6-10 Days)COPPER 7/27/2009EPA 200.8 Normal (6-10 Days)HARDNESS by EPA 200.7 7/27/2009EPA 200.7 Normal (6-10 Days)IRON ICP 7/27/2009EPA 200.7 Normal (6-10 Days)LEAD 7/27/2009EPA 200.8 Normal (6-10 Days)MAGNESIUM ICP 7/27/2009EPA 200.7 Normal (6-10 Days)MERCURY-CVAFS 7/27/2009EPA 245.7 Normal (6-10 Days)NICKEL 7/27/2009EPA 200.8 Normal (6-10 Days)NITRATE/N 7/19/2009EPA 300.0 Normal (6-10 Days)NITRITE/N 7/19/2009EPA 300.0 Normal (6-10 Days)PHOSPHATE/P FIA 7/27/2009SM4500PF Normal (6-10 Days)POTASSIUM ICP 7/27/2009EPA 200.7 Normal (6-10 Days)SODIUM ICP 7/27/2009EPA 200.7 Normal (6-10 Days)SOLIDS - TDS 7/24/2009EPA 160.1 Normal (6-10 Days)SOLIDS - TSS 7/24/2009EPA 160.2 Normal (6-10 Days)SULFATE 7/27/2009EPA 300.0 Normal (6-10 Days)TKN 7/27/2009SM4500NORGC Normal (6-10 Days)TOTAL P FIA 7/27/2009SM4500PF Normal (6-10 Days)TPN 7/17/2009SM4500N-C Normal (6-10 Days)ZINC 7/27/2009EPA 200.8 Normal (6-10 Days)

Order ID: 090717004Customer Name: PBS & J
PO BOX 990
Contact Name: RICHARD ALLINGER
Comment:
Order Date: 7/17/2009
Project Name: SALTESE FLATS 100002604 03.02
VERADALE WA 99037-0990
Sample #: 090717004-006
Date Collected: 7/16/2009
Date Received: 7/17/2009 10:08:00 A
Customer Sample #: 071609-QC1
Comment:
Collector: RICH ALLINGER
Matrix: WaterQuantity: 1
Recv'd:
Test Test Group Method Due Date Priority
ALKALINITY 7/19/2009SM2320B Normal (6-10 Days)AMMONIA-NITROGEN 7/27/2009SM4500NH3G Normal (6-10 Days)ARSENIC 7/27/2009EPA 200.8 Normal (6-10 Days)BICARBONATE 7/19/2009SM2320B Normal (6-10 Days)CADMIUM 7/27/2009EPA 200.8 Normal (6-10 Days)CALCIUM ICP 7/27/2009EPA 200.7 Normal (6-10 Days)CARBONATE 7/19/2009SM2320B Normal (6-10 Days)CHLORIDE 7/27/2009EPA 300.0 Normal (6-10 Days)COPPER 7/27/2009EPA 200.8 Normal (6-10 Days)HARDNESS by EPA 200.7 7/27/2009EPA 200.7 Normal (6-10 Days)IRON ICP 7/27/2009EPA 200.7 Normal (6-10 Days)LEAD 7/27/2009EPA 200.8 Normal (6-10 Days)MAGNESIUM ICP 7/27/2009EPA 200.7 Normal (6-10 Days)MERCURY-CVAFS 7/27/2009EPA 245.7 Normal (6-10 Days)NICKEL 7/27/2009EPA 200.8 Normal (6-10 Days)NITRATE/N 7/19/2009EPA 300.0 Normal (6-10 Days)NITRITE/N 7/19/2009EPA 300.0 Normal (6-10 Days)PHOSPHATE/P FIA 7/27/2009SM4500PF Normal (6-10 Days)POTASSIUM ICP 7/27/2009EPA 200.7 Normal (6-10 Days)SODIUM ICP 7/27/2009EPA 200.7 Normal (6-10 Days)SOLIDS - TDS 7/24/2009EPA 160.1 Normal (6-10 Days)SOLIDS - TSS 7/24/2009EPA 160.2 Normal (6-10 Days)SULFATE 7/27/2009EPA 300.0 Normal (6-10 Days)TKN 7/27/2009SM4500NORGC Normal (6-10 Days)TOTAL P FIA 7/27/2009SM4500PF Normal (6-10 Days)TPN 7/17/2009SM4500N-C Normal (6-10 Days)ZINC 7/27/2009EPA 200.8 Normal (6-10 Days)

Order ID: 090717004Customer Name: PBS & J
PO BOX 990
Contact Name: RICHARD ALLINGER
Comment:
Order Date: 7/17/2009
Project Name: SALTESE FLATS 100002604 03.02
VERADALE WA 99037-0990
Sample #: 090717004-007
Date Collected: 7/16/2009
Date Received: 7/17/2009 10:08:00 A
Customer Sample #: 071609-UT1
Comment:
Collector: RICH ALLINGER
Matrix: WaterQuantity: 1
Recv'd:
Test Test Group Method Due Date Priority
ALKALINITY 7/19/2009SM2320B Normal (6-10 Days)AMMONIA-NITROGEN 7/27/2009SM4500NH3G Normal (6-10 Days)ARSENIC 7/27/2009EPA 200.8 Normal (6-10 Days)BICARBONATE 7/19/2009SM2320B Normal (6-10 Days)CADMIUM 7/27/2009EPA 200.8 Normal (6-10 Days)CALCIUM ICP 7/27/2009EPA 200.7 Normal (6-10 Days)CARBONATE 7/19/2009SM2320B Normal (6-10 Days)CHLORIDE 7/27/2009EPA 300.0 Normal (6-10 Days)COPPER 7/27/2009EPA 200.8 Normal (6-10 Days)HARDNESS by EPA 200.7 7/27/2009EPA 200.7 Normal (6-10 Days)IRON ICP 7/27/2009EPA 200.7 Normal (6-10 Days)LEAD 7/27/2009EPA 200.8 Normal (6-10 Days)MAGNESIUM ICP 7/27/2009EPA 200.7 Normal (6-10 Days)MERCURY-CVAFS 7/27/2009EPA 245.7 Normal (6-10 Days)NICKEL 7/27/2009EPA 200.8 Normal (6-10 Days)NITRATE/N 7/19/2009EPA 300.0 Normal (6-10 Days)NITRITE/N 7/19/2009EPA 300.0 Normal (6-10 Days)PHOSPHATE/P FIA 7/27/2009SM4500PF Normal (6-10 Days)POTASSIUM ICP 7/27/2009EPA 200.7 Normal (6-10 Days)SODIUM ICP 7/27/2009EPA 200.7 Normal (6-10 Days)SOLIDS - TDS 7/24/2009EPA 160.1 Normal (6-10 Days)SOLIDS - TSS 7/24/2009EPA 160.2 Normal (6-10 Days)SULFATE 7/27/2009EPA 300.0 Normal (6-10 Days)TKN 7/27/2009SM4500NORGC Normal (6-10 Days)TOTAL P FIA 7/27/2009SM4500PF Normal (6-10 Days)TPN 7/17/2009SM4500N-C Normal (6-10 Days)ZINC 7/27/2009EPA 200.8 Normal (6-10 Days)

Order ID: 090717004Customer Name: PBS & J
PO BOX 990
Contact Name: RICHARD ALLINGER
Comment:
Order Date: 7/17/2009
Project Name: SALTESE FLATS 100002604 03.02
VERADALE WA 99037-0990
Sample #: 090717004-008
Date Collected: 7/16/2009
Date Received: 7/17/2009 10:08:00 A
Customer Sample #: 071609-SL
Comment:
Collector: RICH ALLINGER
Matrix: WaterQuantity: 1
Recv'd:
Test Test Group Method Due Date Priority
ALKALINITY 7/19/2009SM2320B Normal (6-10 Days)AMMONIA-NITROGEN 7/27/2009SM4500NH3G Normal (6-10 Days)ARSENIC 7/27/2009EPA 200.8 Normal (6-10 Days)BICARBONATE 7/19/2009SM2320B Normal (6-10 Days)CADMIUM 7/27/2009EPA 200.8 Normal (6-10 Days)CALCIUM ICP 7/27/2009EPA 200.7 Normal (6-10 Days)CARBONATE 7/19/2009SM2320B Normal (6-10 Days)CHLORIDE 7/27/2009EPA 300.0 Normal (6-10 Days)COPPER 7/27/2009EPA 200.8 Normal (6-10 Days)HARDNESS by EPA 200.7 7/27/2009EPA 200.7 Normal (6-10 Days)IRON ICP 7/27/2009EPA 200.7 Normal (6-10 Days)LEAD 7/27/2009EPA 200.8 Normal (6-10 Days)MAGNESIUM ICP 7/27/2009EPA 200.7 Normal (6-10 Days)MERCURY-CVAFS 7/27/2009EPA 245.7 Normal (6-10 Days)NICKEL 7/27/2009EPA 200.8 Normal (6-10 Days)NITRATE/N 7/19/2009EPA 300.0 Normal (6-10 Days)NITRITE/N 7/19/2009EPA 300.0 Normal (6-10 Days)PHOSPHATE/P FIA 7/27/2009SM4500PF Normal (6-10 Days)POTASSIUM ICP 7/27/2009EPA 200.7 Normal (6-10 Days)SODIUM ICP 7/27/2009EPA 200.7 Normal (6-10 Days)SOLIDS - TDS 7/24/2009EPA 160.1 Normal (6-10 Days)SOLIDS - TSS 7/24/2009EPA 160.2 Normal (6-10 Days)SULFATE 7/27/2009EPA 300.0 Normal (6-10 Days)TKN 7/27/2009SM4500NORGC Normal (6-10 Days)TOTAL P FIA 7/27/2009SM4500PF Normal (6-10 Days)TPN 7/17/2009SM4500N-C Normal (6-10 Days)ZINC 7/27/2009EPA 200.8 Normal (6-10 Days)

Order ID: 090717004Customer Name: PBS & J
PO BOX 990
Contact Name: RICHARD ALLINGER
Comment:
Order Date: 7/17/2009
Project Name: SALTESE FLATS 100002604 03.02
VERADALE WA 99037-0990
Sample #: 090717004-009
Date Collected: 7/16/2009
Date Received: 7/17/2009 10:08:00 A
Customer Sample #: 071609-DW1
Comment:
Collector: RICH ALLINGER
Matrix: WaterQuantity: 1
Recv'd:
Test Test Group Method Due Date Priority
ALKALINITY 7/19/2009SM2320B Normal (6-10 Days)AMMONIA-NITROGEN 7/27/2009SM4500NH3G Normal (6-10 Days)ARSENIC 7/27/2009EPA 200.8 Normal (6-10 Days)BICARBONATE 7/19/2009SM2320B Normal (6-10 Days)CADMIUM 7/27/2009EPA 200.8 Normal (6-10 Days)CALCIUM ICP 7/27/2009EPA 200.7 Normal (6-10 Days)CARBONATE 7/19/2009SM2320B Normal (6-10 Days)CHLORIDE 7/27/2009EPA 300.0 Normal (6-10 Days)COPPER 7/27/2009EPA 200.8 Normal (6-10 Days)HARDNESS by EPA 200.7 7/27/2009EPA 200.7 Normal (6-10 Days)IRON ICP 7/27/2009EPA 200.7 Normal (6-10 Days)LEAD 7/27/2009EPA 200.8 Normal (6-10 Days)MAGNESIUM ICP 7/27/2009EPA 200.7 Normal (6-10 Days)MERCURY-CVAFS 7/27/2009EPA 245.7 Normal (6-10 Days)NICKEL 7/27/2009EPA 200.8 Normal (6-10 Days)NITRATE/N 7/19/2009EPA 300.0 Normal (6-10 Days)NITRITE/N 7/19/2009EPA 300.0 Normal (6-10 Days)PHOSPHATE/P FIA 7/27/2009SM4500PF Normal (6-10 Days)POTASSIUM ICP 7/27/2009EPA 200.7 Normal (6-10 Days)SODIUM ICP 7/27/2009EPA 200.7 Normal (6-10 Days)SOLIDS - TDS 7/24/2009EPA 160.1 Normal (6-10 Days)SOLIDS - TSS 7/24/2009EPA 160.2 Normal (6-10 Days)SULFATE 7/27/2009EPA 300.0 Normal (6-10 Days)TKN 7/27/2009SM4500NORGC Normal (6-10 Days)TOTAL P FIA 7/27/2009SM4500PF Normal (6-10 Days)TPN 7/17/2009SM4500N-C Normal (6-10 Days)ZINC 7/27/2009EPA 200.8 Normal (6-10 Days)

Order ID: 090717004Customer Name: PBS & J
PO BOX 990
Contact Name: RICHARD ALLINGER
Comment:
Order Date: 7/17/2009
Project Name: SALTESE FLATS 100002604 03.02
VERADALE WA 99037-0990
Sample #: 090717004-010
Date Collected: 7/16/2009
Date Received: 7/17/2009 10:08:00 A
Customer Sample #: 071609-SFW3
Comment:
Collector: RICH ALLINGER
Matrix: WaterQuantity: 1
Recv'd:
Test Test Group Method Due Date Priority
ALKALINITY 7/19/2009SM2320B Normal (6-10 Days)AMMONIA-NITROGEN 7/27/2009SM4500NH3G Normal (6-10 Days)ARSENIC 7/27/2009EPA 200.8 Normal (6-10 Days)BICARBONATE 7/19/2009SM2320B Normal (6-10 Days)CADMIUM 7/27/2009EPA 200.8 Normal (6-10 Days)CALCIUM ICP 7/27/2009EPA 200.7 Normal (6-10 Days)CARBONATE 7/19/2009SM2320B Normal (6-10 Days)CHLORIDE 7/27/2009EPA 300.0 Normal (6-10 Days)COPPER 7/27/2009EPA 200.8 Normal (6-10 Days)HARDNESS by EPA 200.7 7/27/2009EPA 200.7 Normal (6-10 Days)IRON ICP 7/27/2009EPA 200.7 Normal (6-10 Days)LEAD 7/27/2009EPA 200.8 Normal (6-10 Days)MAGNESIUM ICP 7/27/2009EPA 200.7 Normal (6-10 Days)MERCURY-CVAFS 7/27/2009EPA 245.7 Normal (6-10 Days)NICKEL 7/27/2009EPA 200.8 Normal (6-10 Days)NITRATE/N 7/19/2009EPA 300.0 Normal (6-10 Days)NITRITE/N 7/19/2009EPA 300.0 Normal (6-10 Days)PHOSPHATE/P FIA 7/27/2009SM4500PF Normal (6-10 Days)POTASSIUM ICP 7/27/2009EPA 200.7 Normal (6-10 Days)SODIUM ICP 7/27/2009EPA 200.7 Normal (6-10 Days)SOLIDS - TDS 7/24/2009EPA 160.1 Normal (6-10 Days)SOLIDS - TSS 7/24/2009EPA 160.2 Normal (6-10 Days)SULFATE 7/27/2009EPA 300.0 Normal (6-10 Days)TKN 7/27/2009SM4500NORGC Normal (6-10 Days)TOTAL P FIA 7/27/2009SM4500PF Normal (6-10 Days)TPN 7/17/2009SM4500N-C Normal (6-10 Days)ZINC 7/27/2009EPA 200.8 Normal (6-10 Days)

Order ID: 090717004Customer Name: PBS & J
PO BOX 990
Contact Name: RICHARD ALLINGER
Comment:
Order Date: 7/17/2009
Project Name: SALTESE FLATS 100002604 03.02
VERADALE WA 99037-0990
Sample #: 090717004-011
Date Collected: 7/16/2009
Date Received: 7/17/2009 10:08:00 A
Customer Sample #: 071609-SFW20
Comment:
Collector: RICH ALLINGER
Matrix: WaterQuantity: 1
Recv'd:
Test Test Group Method Due Date Priority
ALKALINITY 7/19/2009SM2320B Normal (6-10 Days)AMMONIA-NITROGEN 7/27/2009SM4500NH3G Normal (6-10 Days)ARSENIC 7/27/2009EPA 200.8 Normal (6-10 Days)BICARBONATE 7/19/2009SM2320B Normal (6-10 Days)CADMIUM 7/27/2009EPA 200.8 Normal (6-10 Days)CALCIUM ICP 7/27/2009EPA 200.7 Normal (6-10 Days)CARBONATE 7/19/2009SM2320B Normal (6-10 Days)CHLORIDE 7/27/2009EPA 300.0 Normal (6-10 Days)COPPER 7/27/2009EPA 200.8 Normal (6-10 Days)HARDNESS by EPA 200.7 7/27/2009EPA 200.7 Normal (6-10 Days)IRON ICP 7/27/2009EPA 200.7 Normal (6-10 Days)LEAD 7/27/2009EPA 200.8 Normal (6-10 Days)MAGNESIUM ICP 7/27/2009EPA 200.7 Normal (6-10 Days)MERCURY-CVAFS 7/27/2009EPA 245.7 Normal (6-10 Days)NICKEL 7/27/2009EPA 200.8 Normal (6-10 Days)NITRATE/N 7/19/2009EPA 300.0 Normal (6-10 Days)NITRITE/N 7/19/2009EPA 300.0 Normal (6-10 Days)PHOSPHATE/P FIA 7/27/2009SM4500PF Normal (6-10 Days)POTASSIUM ICP 7/27/2009EPA 200.7 Normal (6-10 Days)SODIUM ICP 7/27/2009EPA 200.7 Normal (6-10 Days)SOLIDS - TDS 7/24/2009EPA 160.1 Normal (6-10 Days)SOLIDS - TSS 7/24/2009EPA 160.2 Normal (6-10 Days)SULFATE 7/27/2009EPA 300.0 Normal (6-10 Days)TKN 7/27/2009SM4500NORGC Normal (6-10 Days)TOTAL P FIA 7/27/2009SM4500PF Normal (6-10 Days)TPN 7/17/2009SM4500N-C Normal (6-10 Days)ZINC 7/27/2009EPA 200.8 Normal (6-10 Days)

Order ID: 090717004Customer Name: PBS & J
PO BOX 990
Contact Name: RICHARD ALLINGER
Comment:
Order Date: 7/17/2009
Project Name: SALTESE FLATS 100002604 03.02
VERADALE WA 99037-0990
Sample #: 090717004-012
Date Collected: 7/16/2009
Date Received: 7/17/2009 10:08:00 A
Customer Sample #: 071609-SFW7
Comment:
Collector: RICH ALLINGER
Matrix: WaterQuantity: 1
Recv'd:
Test Test Group Method Due Date Priority
ALKALINITY 7/19/2009SM2320B Normal (6-10 Days)AMMONIA-NITROGEN 7/27/2009SM4500NH3G Normal (6-10 Days)ARSENIC 7/27/2009EPA 200.8 Normal (6-10 Days)BICARBONATE 7/19/2009SM2320B Normal (6-10 Days)CADMIUM 7/27/2009EPA 200.8 Normal (6-10 Days)CALCIUM ICP 7/27/2009EPA 200.7 Normal (6-10 Days)CARBONATE 7/19/2009SM2320B Normal (6-10 Days)CHLORIDE 7/27/2009EPA 300.0 Normal (6-10 Days)COPPER 7/27/2009EPA 200.8 Normal (6-10 Days)HARDNESS by EPA 200.7 7/27/2009EPA 200.7 Normal (6-10 Days)IRON ICP 7/27/2009EPA 200.7 Normal (6-10 Days)LEAD 7/27/2009EPA 200.8 Normal (6-10 Days)MAGNESIUM ICP 7/27/2009EPA 200.7 Normal (6-10 Days)MERCURY-CVAFS 7/27/2009EPA 245.7 Normal (6-10 Days)NICKEL 7/27/2009EPA 200.8 Normal (6-10 Days)NITRATE/N 7/19/2009EPA 300.0 Normal (6-10 Days)NITRITE/N 7/19/2009EPA 300.0 Normal (6-10 Days)PHOSPHATE/P FIA 7/27/2009SM4500PF Normal (6-10 Days)POTASSIUM ICP 7/27/2009EPA 200.7 Normal (6-10 Days)SODIUM ICP 7/27/2009EPA 200.7 Normal (6-10 Days)SOLIDS - TDS 7/24/2009EPA 160.1 Normal (6-10 Days)SOLIDS - TSS 7/24/2009EPA 160.2 Normal (6-10 Days)SULFATE 7/27/2009EPA 300.0 Normal (6-10 Days)TKN 7/27/2009SM4500NORGC Normal (6-10 Days)TOTAL P FIA 7/27/2009SM4500PF Normal (6-10 Days)TPN 7/17/2009SM4500N-C Normal (6-10 Days)ZINC 7/27/2009EPA 200.8 Normal (6-10 Days)
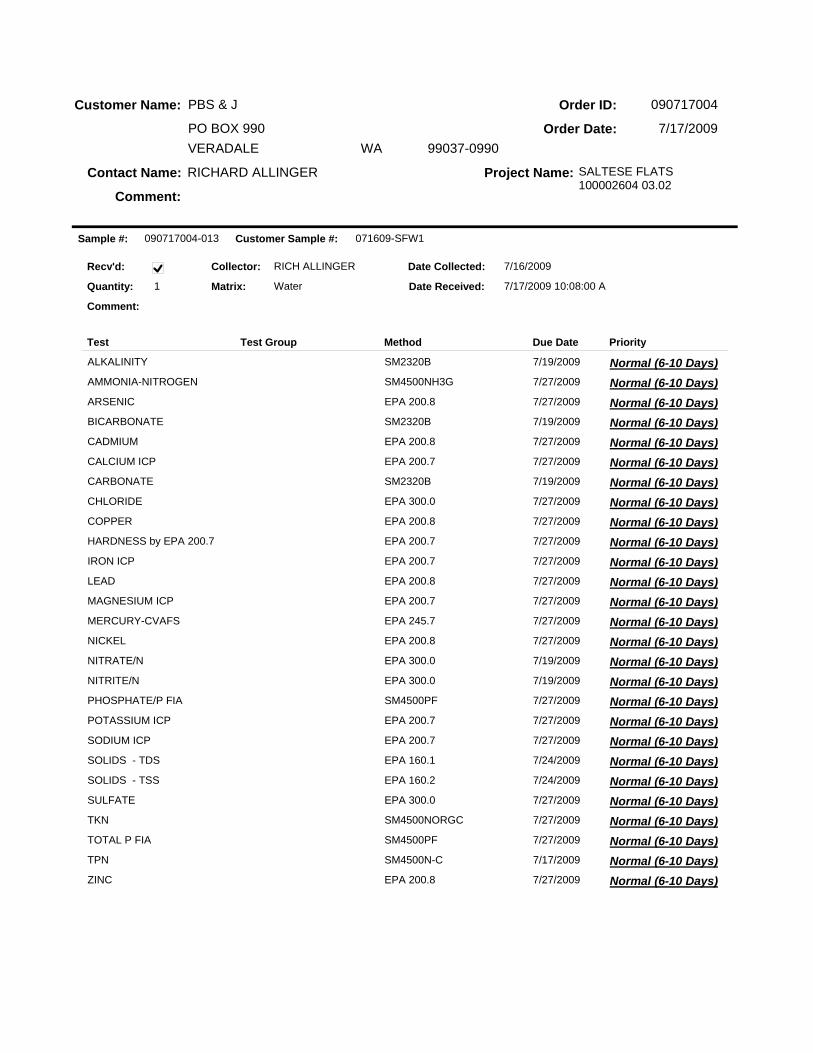
Order ID: 090717004Customer Name: PBS & J
PO BOX 990
Contact Name: RICHARD ALLINGER
Comment:
Order Date: 7/17/2009
Project Name: SALTESE FLATS 100002604 03.02
VERADALE WA 99037-0990
Sample #: 090717004-013
Date Collected: 7/16/2009
Date Received: 7/17/2009 10:08:00 A
Customer Sample #: 071609-SFW1
Comment:
Collector: RICH ALLINGER
Matrix: WaterQuantity: 1
Recv'd:
Test Test Group Method Due Date Priority
ALKALINITY 7/19/2009SM2320B Normal (6-10 Days)AMMONIA-NITROGEN 7/27/2009SM4500NH3G Normal (6-10 Days)ARSENIC 7/27/2009EPA 200.8 Normal (6-10 Days)BICARBONATE 7/19/2009SM2320B Normal (6-10 Days)CADMIUM 7/27/2009EPA 200.8 Normal (6-10 Days)CALCIUM ICP 7/27/2009EPA 200.7 Normal (6-10 Days)CARBONATE 7/19/2009SM2320B Normal (6-10 Days)CHLORIDE 7/27/2009EPA 300.0 Normal (6-10 Days)COPPER 7/27/2009EPA 200.8 Normal (6-10 Days)HARDNESS by EPA 200.7 7/27/2009EPA 200.7 Normal (6-10 Days)IRON ICP 7/27/2009EPA 200.7 Normal (6-10 Days)LEAD 7/27/2009EPA 200.8 Normal (6-10 Days)MAGNESIUM ICP 7/27/2009EPA 200.7 Normal (6-10 Days)MERCURY-CVAFS 7/27/2009EPA 245.7 Normal (6-10 Days)NICKEL 7/27/2009EPA 200.8 Normal (6-10 Days)NITRATE/N 7/19/2009EPA 300.0 Normal (6-10 Days)NITRITE/N 7/19/2009EPA 300.0 Normal (6-10 Days)PHOSPHATE/P FIA 7/27/2009SM4500PF Normal (6-10 Days)POTASSIUM ICP 7/27/2009EPA 200.7 Normal (6-10 Days)SODIUM ICP 7/27/2009EPA 200.7 Normal (6-10 Days)SOLIDS - TDS 7/24/2009EPA 160.1 Normal (6-10 Days)SOLIDS - TSS 7/24/2009EPA 160.2 Normal (6-10 Days)SULFATE 7/27/2009EPA 300.0 Normal (6-10 Days)TKN 7/27/2009SM4500NORGC Normal (6-10 Days)TOTAL P FIA 7/27/2009SM4500PF Normal (6-10 Days)TPN 7/17/2009SM4500N-C Normal (6-10 Days)ZINC 7/27/2009EPA 200.8 Normal (6-10 Days)

Order ID: 090717004Customer Name: PBS & J
PO BOX 990
Contact Name: RICHARD ALLINGER
Comment:
Order Date: 7/17/2009
Project Name: SALTESE FLATS 100002604 03.02
VERADALE WA 99037-0990
Sample #: 090717004-014
Date Collected: 7/16/2009
Date Received: 7/17/2009 10:08:00 A
Customer Sample #: 071609-SFW12
Comment:
Collector: RICH ALLINGER
Matrix: WaterQuantity: 1
Recv'd:
Test Test Group Method Due Date Priority
ALKALINITY 7/19/2009SM2320B Normal (6-10 Days)AMMONIA-NITROGEN 7/27/2009SM4500NH3G Normal (6-10 Days)ARSENIC 7/27/2009EPA 200.8 Normal (6-10 Days)BICARBONATE 7/19/2009SM2320B Normal (6-10 Days)CADMIUM 7/27/2009EPA 200.8 Normal (6-10 Days)CALCIUM ICP 7/27/2009EPA 200.7 Normal (6-10 Days)CARBONATE 7/19/2009SM2320B Normal (6-10 Days)CHLORIDE 7/27/2009EPA 300.0 Normal (6-10 Days)COPPER 7/27/2009EPA 200.8 Normal (6-10 Days)HARDNESS by EPA 200.7 7/27/2009EPA 200.7 Normal (6-10 Days)IRON ICP 7/27/2009EPA 200.7 Normal (6-10 Days)LEAD 7/27/2009EPA 200.8 Normal (6-10 Days)MAGNESIUM ICP 7/27/2009EPA 200.7 Normal (6-10 Days)MERCURY-CVAFS 7/27/2009EPA 245.7 Normal (6-10 Days)NICKEL 7/27/2009EPA 200.8 Normal (6-10 Days)NITRATE/N 7/19/2009EPA 300.0 Normal (6-10 Days)NITRITE/N 7/19/2009EPA 300.0 Normal (6-10 Days)PHOSPHATE/P FIA 7/27/2009SM4500PF Normal (6-10 Days)POTASSIUM ICP 7/27/2009EPA 200.7 Normal (6-10 Days)SODIUM ICP 7/27/2009EPA 200.7 Normal (6-10 Days)SOLIDS - TDS 7/24/2009EPA 160.1 Normal (6-10 Days)SOLIDS - TSS 7/24/2009EPA 160.2 Normal (6-10 Days)SULFATE 7/27/2009EPA 300.0 Normal (6-10 Days)TKN 7/27/2009SM4500NORGC Normal (6-10 Days)TOTAL P FIA 7/27/2009SM4500PF Normal (6-10 Days)TPN 7/17/2009SM4500N-C Normal (6-10 Days)ZINC 7/27/2009EPA 200.8 Normal (6-10 Days)

Order ID: 090717004Customer Name: PBS & J
PO BOX 990
Contact Name: RICHARD ALLINGER
Comment:
Order Date: 7/17/2009
Project Name: SALTESE FLATS 100002604 03.02
VERADALE WA 99037-0990
Sample #: 090717004-015
Date Collected: 7/16/2009
Date Received: 7/17/2009 10:08:00 A
Customer Sample #: 071609-SFW4
Comment:
Collector: RICH ALLINGER
Matrix: WaterQuantity: 1
Recv'd:
Test Test Group Method Due Date Priority
ALKALINITY 7/19/2009SM2320B Normal (6-10 Days)AMMONIA-NITROGEN 7/27/2009SM4500NH3G Normal (6-10 Days)ARSENIC 7/27/2009EPA 200.8 Normal (6-10 Days)BICARBONATE 7/19/2009SM2320B Normal (6-10 Days)CADMIUM 7/27/2009EPA 200.8 Normal (6-10 Days)CALCIUM ICP 7/27/2009EPA 200.7 Normal (6-10 Days)CARBONATE 7/19/2009SM2320B Normal (6-10 Days)CHLORIDE 7/27/2009EPA 300.0 Normal (6-10 Days)COPPER 7/27/2009EPA 200.8 Normal (6-10 Days)HARDNESS by EPA 200.7 7/27/2009EPA 200.7 Normal (6-10 Days)IRON ICP 7/27/2009EPA 200.7 Normal (6-10 Days)LEAD 7/27/2009EPA 200.8 Normal (6-10 Days)MAGNESIUM ICP 7/27/2009EPA 200.7 Normal (6-10 Days)MERCURY-CVAFS 7/27/2009EPA 245.7 Normal (6-10 Days)NICKEL 7/27/2009EPA 200.8 Normal (6-10 Days)NITRATE/N 7/19/2009EPA 300.0 Normal (6-10 Days)NITRITE/N 7/19/2009EPA 300.0 Normal (6-10 Days)PHOSPHATE/P FIA 7/27/2009SM4500PF Normal (6-10 Days)POTASSIUM ICP 7/27/2009EPA 200.7 Normal (6-10 Days)SODIUM ICP 7/27/2009EPA 200.7 Normal (6-10 Days)SOLIDS - TDS 7/24/2009EPA 160.1 Normal (6-10 Days)SOLIDS - TSS 7/24/2009EPA 160.2 Normal (6-10 Days)SULFATE 7/27/2009EPA 300.0 Normal (6-10 Days)TKN 7/27/2009SM4500NORGC Normal (6-10 Days)TOTAL P FIA 7/27/2009SM4500PF Normal (6-10 Days)TPN 7/17/2009SM4500N-C Normal (6-10 Days)ZINC 7/27/2009EPA 200.8 Normal (6-10 Days)

Order ID: 090717004Customer Name: PBS & J
PO BOX 990
Contact Name: RICHARD ALLINGER
Comment:
Order Date: 7/17/2009
Project Name: SALTESE FLATS 100002604 03.02
VERADALE WA 99037-0990
SAMPLE CONDITION RECORDSamples received in a cooler? Yes
Samples received intact? Yes
What is the temperature inside the cooler? 9.0
Samples received with a COC? Yes
Samples received within holding time? Yes
Are all sample bottles properly preserved? Yes
Are VOC samples free of headspace? N/A
Is there a trip blank to accompany VOC samples? N/A
Labels and chain agree? Yes


ENERGY L4BORATOR/ES, /NO • PO. Box 30916 • 1120 South 27th Street • Billings, MT 59107-0916800-735-4489 • 406-252-6325 • 406-252-6069 fax • eli@energy/ab.com
TO: PBS & J
LAB NO.: B09030591-001-010ADDRESS: Attn: Greg Howard
DATE: 4/6/09
1120 Cedar St.Missoula, Montana 59802
Saltese Flats Wetland Feasability StudyFERTILIZER RECOMMENDATIONSFertilizer Suggested in Actual Pounds per Acre
FIELD S1-1 S1-2 S2-1 S2-2 S4-1 S4-2
CROP Plants Plants Plants Plants Plants Plants
PROJECTED YIELD 21 2T 2T 2T 2T 2T
NitrogenTotal 20 35 0 30 0 20Preplant/SpringAfter 1st Cutting
Phosphrus (P2O5)Broadcast 30 0 0 0 50 50Banded
Potassium (K20)Broadcast 100 100 120 120 100 100Banded
Sulphur (S)Zinc (Zn)Iron (Fe)Lime OT 10T OT OT 31 51Gypsum OT OT OT 41 OT OT
COMMENTS: All soils are quite low in potassium. S6-1 and S6-2 are very low in phosphorus. Sites that have lime recommended have a low pH which can cause aluminum toxicity. S2-2 has a pH of 7.4 and is deficient in calcium. Gyspum has to be applied here to increase soil calcium. Lime does not work when pH is above 6.5.
PREPARED BY: Neal Fehringer, Certified Professional Agronomist, C.C.A., (406) 860-3647.

FMr PT ENERGY LABORATORIES, /NC. • Pa Box 30916 • 1120 South 27th Street • Billings, MT 59107-0916eilf 800-735-4489 • 406-252-6325 • 406-252-6069 fax [email protected]
LABORATOR/E.S
Saltese Flats Wetland Feasability StudyFERTILIZER RECOMMENDATIONSFertilizer Suggested in Actual Pounds per Acre
FIELD S5-1 S5-2 S6-1 S6-2
CROP Plants Plants Plants Plants
PROJECTED YIELD 2T 2T 2T 2T
NitrogenTotal 0 0 0 30Preplant/SpringAfter 1st Cutting
Phosphrus (P205)Broadcast 50 50 75 75Banded
Potassium (K20)Broadcast 100 100 120 100Banded
Sulphur (S)Zinc (Zn)Iron (Fe)Copper (Cu)Lime 7T 7T 5T 6TGypsum OT OT OT OT
COMMENTS:
PREPARED BY: Neal Fehringer, Certified Professional Agronomist, C.C.A., (406) 860-3647.

ENERGY LABORATORIES, INC. * 1120 S 27th St * PO Box 30916 * Billings, MT 59107-0916Toll Free 800.735.4489 * 406.252.6325 * FAX 406.252.6069 * [email protected]
LABORATORY ANALYTICAL REPORT
Client: PBS and JSite Name: Saltese Flats - Wetlands Feasibility Study Report Date: 04/09/09
Lab ID: B09030591-001 Collection Date: 11/20/08Client Sample ID: Saltese S1-1 (0-1) DateReceived: 03/09/09Matrix: Soil
MCUAnalyses Result Units Qualifiers RL QCL Method Analysis Date / By
PHYSICAL CHARACTERISTICSTexture S L ASA15-5 03/18/09 16:38 / srm
- C = Clay, S = Sand(y). Si = Silt(y), L = Loam(y)
CHEMICAL CHARACTERISTICSLime, Semi-Quantitative None Visual 03/17/09 09:03 / srm
Phosphorus, Olsen 6 mg/kg 1 ASA24-5 03/18/09 09:56 / srm
Nitrate as N, KCL Extract 10 mg/kg 1 ASA33-8 03/18/09 13:01 / srm
Organic Matter 8.43 `)/0 0.02 ASA29-3 03/18/09 11:03 / srm
METALS, AMMONIUM ACETATE EXTRACTABLEPotassium 74 mg/kg 10 SW6010B 03/17/09 02:27 / tao
WATER EXTRACTABLE CONSTITUENTS (1:10)Conductivity, 1:10 0.13 mmhos/cm 0.010 ASA10-3 03/17/09 09:03 / srm
pH, 1:10 6.1 s.u. 0.1 ASA10-3 03/17/09 09:03 / srm
Calcium Equivalents 0.7 meq/100g 0.2 SW6010B 03/17/09 04:08 / tao
Sodium Equivalents 0.3 meq/100g 0.2 SW6010B 03/17/09 04:08 / tao
Sulfate as S 128 mg/kg 0.3 ASA10-3 03/17/09 00:35 / kh
Report RL - Analyte reporting limit. MCL - Maximum contaminant level.
Definitions: QCL - Quality control limit. ND - Not detected at the reporting limit.

ENERGY LABORATORIES, INC. " 1120 S 27th St * PO Box 30916 * Billings, MT 59107-0916Toll Free 800.735.4489 * 406.252.6325 * FAX 406.252.6069 * [email protected]
LABORATORY ANALYTICAL REPORT
Client: PBS and JSite Name: Saltese Flats - Wetlands Feasibility Study Report Date: 04/09/09
Lab ID: B09030591-002 Collection Date: 11/20/08Client Sample ID: Saltese S1-2 (4-5) DateReceived: 03/09/09Matrix: Soil
MCUAnalyses Result Units Qualifiers RL QCL Method Analysis Date! By
PHYSICAL CHARACTERISTICSTexture S L ASA15-5 03/18/09 16:38 / srm
- C = Clay, S = Sand(y), Si = Silt(y), L = Loam(y)
CHEMICAL CHARACTERISTICSLime, Semi-Quantitative None Visual 03/17/09 09:03 / srm
Phosphorus, Olsen 15 mg/kg 1 ASA24-5 03/18/09 10:00 / srm
Nitrate as N, KCL Extract 2 mg/kg 1 ASA33-8 03/18/09 13:28/ srm
Organic Matter 0.84 `)/0 0.02 ASA29-3 03/18/09 11:03/ srm
METALS, AMMONIUM ACETATE EXTRACTABLEPotassium 89 mg/kg 1C) SW6010B 03/17/09 02:35 / tao
WATER EXTRACTABLE CONSTITUENTS (1:10)Conductivity, 1:10 0.43 mmhos/cm 0.010 ASA10-3 03/17/09 09:03 / srm
pH, 1:10 3.7 s.u. 0.1 ASA10-3 03/17/09 09:03 / srm
Calcium Equivalents 2.0 meq/100g 0.2 SW6010B 03/17/09 04:12 / tao
Sodium Equivalents 0.2 meq/100g 0.2 SW6010B 03/17/09 04:12 / tao
Sulfate as S 653 mg/kg 0.3 ASA10-3 03/17/09 00:47 / kh
Report RL - Analyte reporting limit. MCL - Maximum contaminant level.Definitions: QCL - Quality control limit. ND - Not detected at the reporting limit.

ENERGY LABORATORIES, INC. * 1120 S 27th St * PO Box 30916 " Billings, MT 59107-0916Toll Free 800.735.4489 * 406.252.6325 * FAX 406.252.6069 " [email protected]
LABORATORY ANALYTICAL REPORT
Client: PBS and JSite Name: Saltese Flats - Wetlands Feasibility Study Report Date: 04/09/09
Lab ID: B09030591-003 Collection Date: 11/20/08Client Sample ID: Saltese S2-1 (0-1) DateReceived: 03/09/09Matrix: Soil
MCUAnalyses Result Units Qualifiers RL QCL Method Analysis Date / By
PHYSICAL CHARACTERISTICSTexture SiCL ASA15-5 03/18/09 16:38 / srm
- C = Clay, S = Sand(y), Si = Silt(y), L Loam(y)
CHEMICAL CHARACTERISTICSLime, Semi-Quantitative None Visual 03/17/09 09:03 / srm
Phosphorus, Olsen 10 mg/kg 1 ASA24-5 03/18/09 10:01 / srm
Nitrate as N, KCL Extract 35 mg/kg 1 ASA33-8 03/18/09 13:05 / srm
Organic Matter 14.8 0.02 ASA29-3 03/18/09 11:03 / srm
METALS, AMMONIUM ACETATE EXTRACTABLEPotassium 41 mg/kg 10 SW6010B 03/17/09 02:50 / tao
WATER EXTRACTABLE CONSTITUENTS (1:10)Conductivity, 1:10 0.14 mmhos/cm 0.010 ASA10-3 03/17/09 09:03 / srm
pH, 1:10 7.4 s.u. 0.1 ASA10-3 03/17/09 09:03 / srm
Calcium Equivalents 1.0 meq/100g 0.2 SW6010B 03/17/09 04:23 / tao
Sodium Equivalents 0.4 meq/100g 0.2 SW6010B 03/17/09 04:23 / tao
Sulfate as S 57.5 mg/kg 0.3 ASA10-3 03/17/09 00:58/ kh
Report RL - Analyte reporting limit. MCL - Maximum contaminant level.Definitions: QCL - Quality control limit. ND - Not detected at the reporting limit.

ENERGY LABORATORIES, INC. * 1120 S 27th St * PO Box 30916 * Billings, MT 59107-0916Toll Free 800.735.4489 * 406.252.6325 " FAX 406.252.6069 " [email protected]
LABORATORY ANALYTICAL REPORT
Client: PBS and JSite Name: Saltese Flats - Wetlands Feasibility Study Report Date: 04/09/09
Lab ID: B09030591-004 Collection Date: 11/20/08Client Sample ID: Saltese S2-2 (4-5) DateReceived: 03/09/09Matrix: Soil
MCUAnalyses Result Units Qualifiers RL QCL Method Analysis Date / By
PHYSICAL CHARACTERISTICSTexture SiL ASA15-5 03/18/09 16:38 / srm
- C = Clay, S Sand(y), Si = Silt(y), L = Loam(y)
CHEMICAL CHARACTERISTICSLime, Semi-Quantitative None Visual 03/17/09 09:03 / srm
Phosphorus, Olsen 10 mg/kg 1 ASA24-5 03/18/09 10:03 / srm
Nitrate as N, KCL Extract 5 mg/kg 1 ASA33-8 03/18/09 13:06 / srm
Organic Matter 2.14 0.02 ASA29-3 03/18/09 11:03 / srm
METALS, AMMONIUM ACETATE EXTRACTABLEPotassium 49 mg/kg 10 SW6010B 03/17/09 02:54 / tao
WATER EXTRACTABLE CONSTITUENTS (1:10)Conductivity, 1:10 0.030 mm hos/cm 0.010 ASA10-3 03/17/09 09:03 / srm
pH, 1:10 7.4 s.u. 0.1 ASA10-3 03/17/09 09:03 / srm
Calcium Equivalents ND meq/100g 0.2 SW6010B 03/17/09 04:27 / tao
Sodium Equivalents ND meq/100g 0.2 SW6010B 03/17/09 04:27 / tao
Sulfate as S 10.1 mg/kg 0.3 ASA10-3 03/17/09 01:10 / kh
Report RL - Analyte reporting limit. MCL - Maximum contaminant level.Definitions: QCL - Quality control limit. ND - Not detected at the reporting limit.

ENERGY LABORATORIES, INC. * 1120 S 27th St * PO Box 30916 * Billings, MT 59107-0916Toll Free 800.735.4489 * 406.252.6325 * FAX 406.252.6069 * eligenergylab.com
LABORATORY ANALYTICAL REPORT
Client: PBS and JSite Name: Saltese Flats - Wetlands Feasibility Study Report Date: 04/09/09
Lab ID: B09030591-005
Collection Date: 11/20/08Client Sample ID: Saltese S4-1 (0-1) DateReceived: 03/09/09Matrix: Soil
MCUAnalyses Result Units Qualifiers RE_ QCL Method Analysis Date / By
PHYSICAL CHARACTERISTICSTexture ASA15-5 03/18/09 16:38 / srm
- C = Clay, S = Sand(y), Si = Silt(y), L = Loam(y)
CHEMICAL CHARACTERISTICSLime, Semi-Quantitative None Visual 03/17/09 09:03 / srmPhosphorus, Olsen 3 mg/kg 1 ASA24-5 03/18/09 10:22 / srmNitrate as N, KCL Extract 46 mg/kg 1 ASA33-8 03/18/09 13:07 / srmOrganic Matter 27.2 0.02 ASA29-3 03/18/09 11:03 / srm
METALS, AMMONIUM ACETATE EXTRACTABLEPotassium 72 mg/kg 10 SW6010B 03/17/09 02:58 / tao
WATER EXTRACTABLE CONSTITUENTS (1:10)Conductivity, 1:10 0.13 mmhos/cm 0.010 ASA10-3 03/17/09 09:03 / srmpH, 1:10 5.2 s.u. 0.1 ASA10-3 03/17/09 09:03 / srmCalcium Equivalents 0.7 meq/100g 0.2 SW6010B 03/17/09 04:31 / taoSodium Equivalents 0.2 meq/100g 0.2 SW6010B 03/17/09 04:31 / taoSulfate as S 67.0 mg/kg 0.3 ASA10-3 03/17/09 01:21 / kh
Report RL - Analyte reporting limit. MCL - Maximum contaminant level.Definitions: QCL - Quality control limit. ND - Not detected at the reporting limit.

ENERGY LABORATORIES, INC. * 1120 S 27th St * PO Box 30916 * Billings, MT 59107-0916Toll Free 800.735.4489 " 406.252.6325 * FAX 406.252.6069 * [email protected]
LABORATORY ANALYTICAL REPORT
Client: PBS and JSite Name: Saltese Flats - Wetlands Feasibility Study Report Date: 04/09/09
Lab ID: B09030591-006 Collection Date: 11/20/08Client Sample ID: Saltese S4-2 (4-5) DateReceived: 03/09/09Matrix: Soil
MCLJAnalyses Result Units Qualifiers RL QCL Method Analysis Date / By
PHYSICAL CHARACTERISTICSTexture N/A ASA15-5 03/17/09 09:03 / srm
-Unable to analyze due to sample matrix
CHEMICAL CHARACTERISTICSLime, Semi-Quantitative Slight Visual 03/17/09 09:03 / srm
Phosphorus, Olsen 2 mg/kg 1 ASA24-5 03/18/09 10:23 / srm
Nitrate as N, KCL Extract 9 mg/kg 1 ASA33-8 03/18/09 13:08 / srm
Organic Matter 57.9 `)/0 0.02 ASA29-3 03/18/09 11:03 / srm
METALS, AMMONIUM ACETATE EXTRACTABLEPotassium 72 mg/kg 10 SW6010B 03/17/09 03:02 / tao
WATER EXTRACTABLE CONSTITUENTS (1:10)Conductivity, 1:10 0.33 mmhos/cm 0.010 ASA10-3 03/17/09 09:03 / srmpH. 1:10 5.0 s.u. 0.1 ASA10-3 03/17/09 09:03 / srmCalcium Equivalents 1.5 meq/100g 0.2 SW6010B 03/17/09 04:35 / taoSodium Equivalents 0.5 meq/100g 0.2 SW6010B 03/17/09 04:35 / taoSulfate as S 455 mg/kg 0.3 ASA10-3 03/17/09 01:33 / kh
Report AL - Analyte reporting limit. MCL - Maximum contaminant level.Definitions: QCL - Quality control limit. ND - Not detected at the reporting limit.

ENERGY LABORATORIES, INC. "1120 S 27th St * PO Box 30916 * Billings, MT 59107-0916Toll Free 800.735.4489 * 406.252.6325 * FAX 406.252.6069 * [email protected]
LABORATORY ANALYTICAL REPORT
Client: PBS and JSite Name: Saltese Flats - Wetlands Feasibility Study Report Date: 04/09/09
Lab ID: B09030591-007 Collection Date: 11/20/08Client Sample ID: Saltese S5-1 (0-1) DateReceived: 03/09/09Matrix: Soil
MCLJAnalyses Result Units Qualifiers RL QCL Method Analysis Date/ By
PHYSICAL CHARACTERISTICSTexture N/A ASA15-5 03/17/09 09:03 / srm
-Unable to analyze due to sample matrix
CHEMICAL CHARACTERISTICSLime, Semi-Quantitative None Visual 03/17/09 09:03 / srm
Phosphorus, Olsen 2 mg/kg 1 ASA24-5 03/18/09 10:25/ srm
Nitrate as N, KCL Extract 122 mg/kg 1 ASA33-8 03/18/09 13:30 / srm
Organic Matter 57.2 % 0.02 ASA29-3 03/18/09 11:03 / srm
METALS, AMMONIUM ACETATE EXTRACTABLEPotassium 100 mg/kg 10 SW6010B 03/17/09 03:05 / tao
WATER EXTRACTABLE CONSTITUENTS (1:10)Conductivity, 1:10 0.56 mmhos/cm 0.010 ASA10-3 03/17/09 09:03 / srm
pH, 1:10 4.5 s.u. 01 ASA10-3 03/17/09 09:03 / srm
Calcium Equivalents 2.9 meq/100g 0.2 SW6010B 03/17/09 04:39 / tao
Sodium Equivalents 0.8 meq/100g 02 SW6010B 03/17/09 04:39 / tao
Sulfate as S 659 mg/kg 0.3 ASA10-3 03/17/09 01:44 / kh
Report RL - Analyte reporting limit. MCL - Maximum contaminant level.
ND - Not detected at the reporting limit.Definitions: QCL - Quality control limit.

ENERGY LABORATORIES, INC. * 1120 S 27th St * PO Box 30916 * Billings, MT 59107-0916Toll Free 800.735.4489 * 406.252.6325 * FAX 406.252.6069 * [email protected]
LABORATORY ANALYTICAL REPORT
Client: PBS and JSite Name: Saltese Flats - Wetlands Feasibility Study Report Date: 04/09/09
Lab ID: B09030591-008 Collection Date: 11/20/08
Client Sample ID: Saltese S5-2 (4-5) DateReceived: 03/09/09Matrix: Soil
MCL/Analyses Result Units Qualifiers AL QCL Method Analysis Date / By
PHYSICAL CHARACTERISTICSTexture N/A ASA15-5 03/17/09 09:03 / srm
-Unable to analyze due to sample matrix
CHEMICAL CHARACTERISTICSLime, Semi-Quantitative None Visual 03/17/09 09:03 / srm
Phosphorus, Olsen 4 mg/kg 1 ASA24-5 03/18/09 10:26 / srm
Nitrate as N. KCL Extract 133 mg/kg 1 ASA33-8 03/18/09 13:10 / srm
Organic Matter 57.4 `)/0 0.02 ASA29-3 03/18/09 11:03 / srm
METALS, AMMONIUM ACETATE EXTRACTABLEPotassium 86 mg/kg 10 SW6010B 03/17/09 03:09 / tao
WATER EXTRACTABLE CONSTITUENTS (1:10)Conductivity, 1:10 0.57 mm hos/cm 0.010 ASA10-3 03/17/09 09:03 / srm
pH, 1:10 4.4 s.u. 0.1 ASA10-3 03/17/09 09:03 / srm
Calcium Equivalents 3.2 meq/100g 0.2 SW6010B 03/17/09 04:43 / tao
Sodium Equivalents 0.7 meq/100g 0.2 SW6010B 03/17/09 04:43 / tao
Sulfate as S 717 mg/kg 0.3 ASA10-3 03/17/09 02:42 / kh
Report AL - Analyte reporting limit. MCL - Maximum contaminant level.
ND - Not detected at the reporting limit.Definitions: QCL - Quality control limit.

ENERGY LABORATORIES, INC. "1120 S 27th St * PO Box 30916 * Billings, MT 59107-0916Toll Free 800.735.4489 * 406.252.6325 * FAX 406.252.6069 * [email protected]
LABORATORY ANALYTICAL REPORT
Client: PBS and JSite Name: Saltese Flats - Wetlands Feasibility Study Report Date: 04/09/09
Lab ID: B09030591-009
Collection Date: 11/20/08Client Sample ID: Saltese S6-1 (0-1)
DateReceived: 03/09/09
Matrix: Soil
MCL/Analyses Result Units Qualifiers RL QCL Method Analysis Date / By
PHYSICAL CHARACTERISTICSTexture SiL ASA15-5 03/18/09 16:38 / srm
- C = Clay, S = Sand(y). Si = Silt(y). L = Loam(y)
CHEMICAL CHARACTERISTICSLime, Semi-Quantitative None Visual 03/17/09 09:03 / srm
Phosphorus, Olsen ND mg/kg 1 ASA24-5 03/18/09 10:28 / srm
Nitrate as N, KCL Extract 63 mg/kg 1 ASA33-8 03/18/09 13:12 / srm
Organic Matter 27.4 0.02 ASA29-3 03/18/09 11:03/ srm
METALS, AMMONIUM ACETATE EXTRACTABLEPotassium 48 mg/kg 10 SW6010B 03/17/09 03:13 / tao
WATER EXTRACTABLE CONSTITUENTS (1:10)Conductivity. 1:10 0.11 mm hos/cm 0.010 ASA10-3 03/17/09 09:03 / srm
pH, 1:10 5.0 s.u. 0.1 ASA10-3 03/17/09 09:03 / srm
Calcium Equivalents 0.5 meq/100g 0.2 SW6010B 03/17/09 04:47 / tao
Sodium Equivalents ND meq/100g 0.2 SW6010B 03/17/09 04:47 / tao
Sulfate as S 37.5 mg/kg 0.3 ASA10-3 03/17/09 02:54 / kh
Report RL - Analyte reporting limit.Definitions: QCL - Quality control limit.
MCL - Maximum contaminant level.
ND - Not detected at the reporting limit.
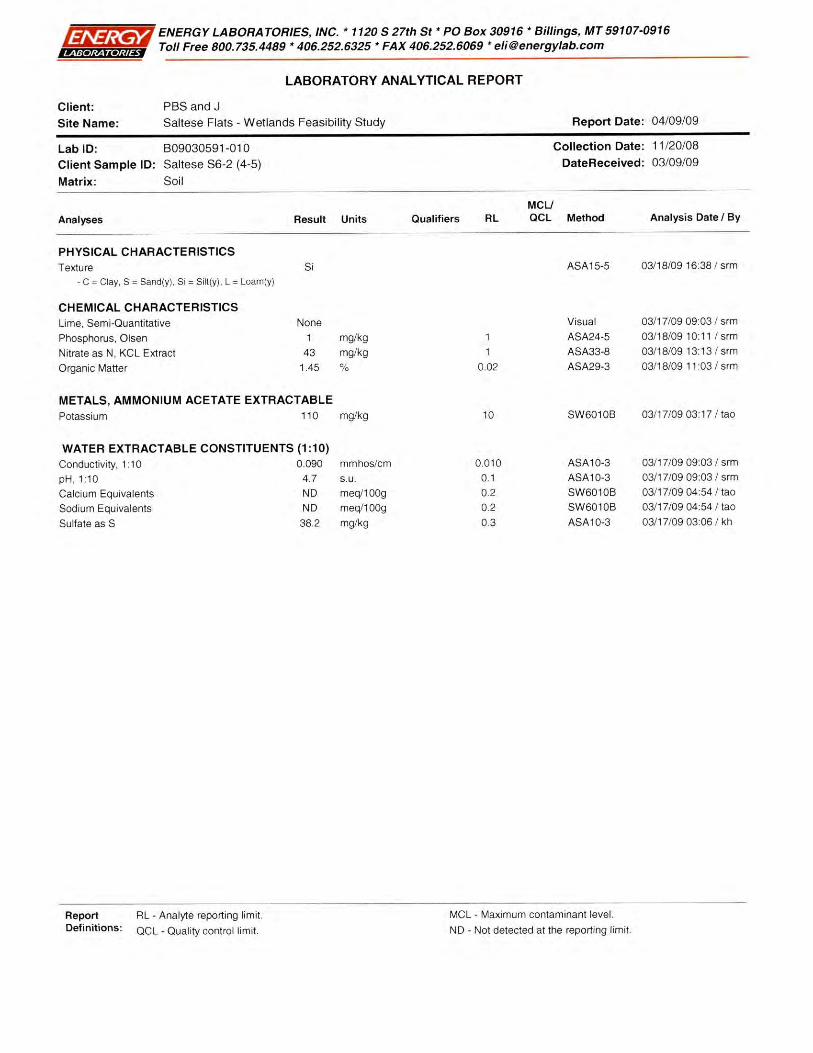
ENERGY LABORATORIES, INC. * 1120 S 27th St * PO Box 30916 * Billings, MT 59107-0916Toll Free 800.735.4489 * 406.252.6325 * FAX 406.252.6069 * [email protected]
LABORATORY ANALYTICAL REPORT
Client: PBS and JSite Name: Saltese Flats - Wetlands Feasibility Study Report Date: 04/09/09
Lab ID: B09030591-010 Collection Date: 11/20/08
Client Sample ID: Saltese S6-2 (4-5) DateReceived: 03/09/09
Matrix: Soil
Analyses Result UnitsMCLJ
Qualifiers RL QCL Method Analysis Date / By
PHYSICAL CHARACTERISTICSTexture Si ASA15-5 03/18/09 16:38 / srm
- C = Clay, S = Sand(y). Si = Silt(y), L = Loam(y)
CHEMICAL CHARACTERISTICSLime, Semi-Quantitative None Visual 03/17/09 09:03 / srm
Phosphorus, Olsen 1 mg/kg 1 A5A24-5 03/18/09 10:11 / srm
Nitrate as N, KCL Extract 43 mg/kg 1 ASA33-8 03/18/09 13:13 / srm
Organic Matter 1 45 % 0.02 A5A29-3 03/18/09 11:03 / srm
METALS, AMMONIUM ACETATE EXTRACTABLEPotassium 110 mg/kg 10 5W6010B 03/17/09 03:17 / tao
WATER EXTRACTABLE CONSTITUENTS (1:10)Conductivity, 1:10 0.090 mm hos/cm 0.010 ASA10-3 03/17/09 09:03 / srm
pH, 1:10 4.7 s.u. 0,1 ASA10-3 03/17/09 09:03 / srm
Calcium Equivalents ND meq/100g 0.2 SW6010B 03/17/09 04:54 / tao
Sodium Equivalents ND meq/100g 0.2 SW6010B 03/17/09 04:54 / tao
Sulfate as S 38.2 mg/kg 0.3 ASA10-3 03/17/09 03:06 / kh
Report RL - Analyte reporting limit. MCL - Maximum contaminant level.Definitions: QCL - Quality control limit. ND - Not detected at the reporting limit.

II II
IIB09030591
IIIIII
Energy Laboratories IncWorkorder Receipt ChecklistPBS and JLogin completed by: Darwin C. Miller
Date and Time Received: 3/9/2009 6:00 AM
Reviewed by: Denise Ruby
Received by: Ig
Reviewed Date: 3/9/2009 10 . 46:00 AM
Carrier name: Bus
Shipping container/cooler in good condition? Yes [71
12_, No 0 Not Present D
Custody seals intact on shipping container/cooler? Yes ril
12_, No D Not Present DCustody seals intact on sample bottles? Yes F-1
I_J No iii Not Present El
Chain of custody present? Yes Ur
12_1 No iii
Chain of custody signed when relinquished and received? Yes r7i No EiChain of custody agrees with sample labels? Yes l:71 No DSamples in proper container/bottle? Yes FA
12_, No Lil
Sample containers intact? Yes 171
12_1 No EiSufficient sample volume for indicated test? Yes 171
12_1 No 0All samples received within holding time? Yes 17
12_1 No Li
Container/Temp Blank temperature: 11°C
Water - VOA vials have zero headspace? Yes 1-1
l_J No D No VOA vials submitted El
Water - pH acceptable upon receipt? Yes nl No D Not Applicable El
Contact and Corrective Action Comments:
Client included a Lawn and Garden Check-in sheet for Saltese - S3 and no smaple was received. Per client call,disregard sheet. Samples are at two depths. so 1 check-in sheet for two samples.

Chain of Custody and Analytical Request Record Page 1 of 1Liii:ZAZZ.LAZIALA=M PLEASE PRINT- Provide as much information as possible.Company Name: Project Name, PWS, Permit, Etc. Sample Origin EPA/State Compliance:
PBS&J Saltese Flats - Wetlands Feasibility Study State: Yes 0 No •
Report Mail Address: 1120 Cedar Street Contact Name: Phone/Fax: Email: Sampler: (Please Print)Missoula, MT 59802 - 3911
Greg Howard 406 532-7251 [email protected]
Invoice Address: 1120 Cedar Street Invoice Contact 8, Phone: Purchase Order: Quote/Bottle Order:Missoula, MT 59802-3911 Chris Matt 406 532-7258 100002604
Special Report/Formats — ELI must be notifiedprior to sample submittal for the foilowing: 0 `-cor 03 ,n-c
,1..:±\_-,7-'5Yf. 1..(7.:hrl...-i..7-:;71-.=,-70
,---D"
Contact ELI prior toRUSH sample submittalfor charges and
ShijtV:i3
Cooler ID(s):
A2LA
c **--Iii(/)._cric 5, -- 20_,__o — 0 c)
LIW=0
l-<i—-°S
..U
scheduling—SeeInstruction Page
• DW • Comments: Receipt Temp
EDD/EDT(Electronic Data).r./A:—i col
Zi.)
c...c ..) c<I—
2co
°i ( c • GSALI POTVV/VVVVTP Format:El State: • LEVEL
C' 1— n, 0-0, ci.) 1-fm-j
g<ifyf(,) >I
a)-p_
0-,0
-..LUW
,.... S On ice:
Yes CN'o IV
LI Other: LINELAC Custody Seat itilC03 (/) °Z H
Intact libSAMPLE IDENTIFICATION
(Name, Location, Interval, etc.)Collection
DateCollection
Time MATRIX CO_1Signature 48,Match
t.:,,r,:_- ..1 i T,-1) ( 11120/08 1-5 X offn3sfali_L-tx)i,..,
2 Saltese S1-2 (4-5) 2 11/20/08 1-S X
Saltese S2-1 (0-1) , 11/20/08 1-S XCDfg,..hl - -CO3
4 Saltese 52-2 (4-5) 11/20/08 1-S X Q -ax-,-
Saltese S4-1 (0-1) 11/20/08 1 -S —004-{cg6 Saltese S4-2 (4-5) 11/20/08 1-S
— Saltese S5-1 (0-1) 11/20/08 1-S X —f307cl
Saltese S5-2 (4-5) 11/20/08 1-S (C))_ --ece
2---Saltese S6-1 (0-1) 11/20/08 1-S X CD—CD?
101
Saltese S6-2 (4-5) 3_ 11/20/08 1-S X —CI D
CustodyYRelinquished by (pent).
Greg HowardDate/Time: ture:, Via c (03/06/09 13:25
Received by (print): Date/Time: Signature:
Record Relinquished by (omit): Date/Tyne: Sriatu Received by (pnnt): Date/Time: Signature:
MUST be g a
Signed.Received by Laboratory: 1 Date/Ame , iv S•aRawy, A
Sample Disposal: Return to Client: Lab Disposal: -01 (0 1-Y-)e--- ill I i i . AIM*. JA .
In certain circumstances, samples submitted to Energy Laboratories, Inc. may be subcontracted to other certified laboratories in order to complete the analysis requested.This serves as notice of this possibility. All sub-contract data will be clearly notated on your analytical report.
Visit our web site at www.energylab.com for additional information, downloadable fee schedule, forms, and links.

Data Update and On-Site Feasibility Report Saltese Flats Wetland Restoration Investigation
January 2010 .00
Appendix E Wetland Delineation Maps, Forms, and Photos

Data Update and On-Site Feasibility Report Saltese Flats Wetland Restoration Investigation
January 2010 E-1
Figure E-1. Areas of Routine and Reconnaissance Wetland Mapping

Data Update and On-Site Feasibility Report Saltese Flats Wetland Restoration Investigation
January 2010 E-2
Figure E-2. Routine Wetland Mapping
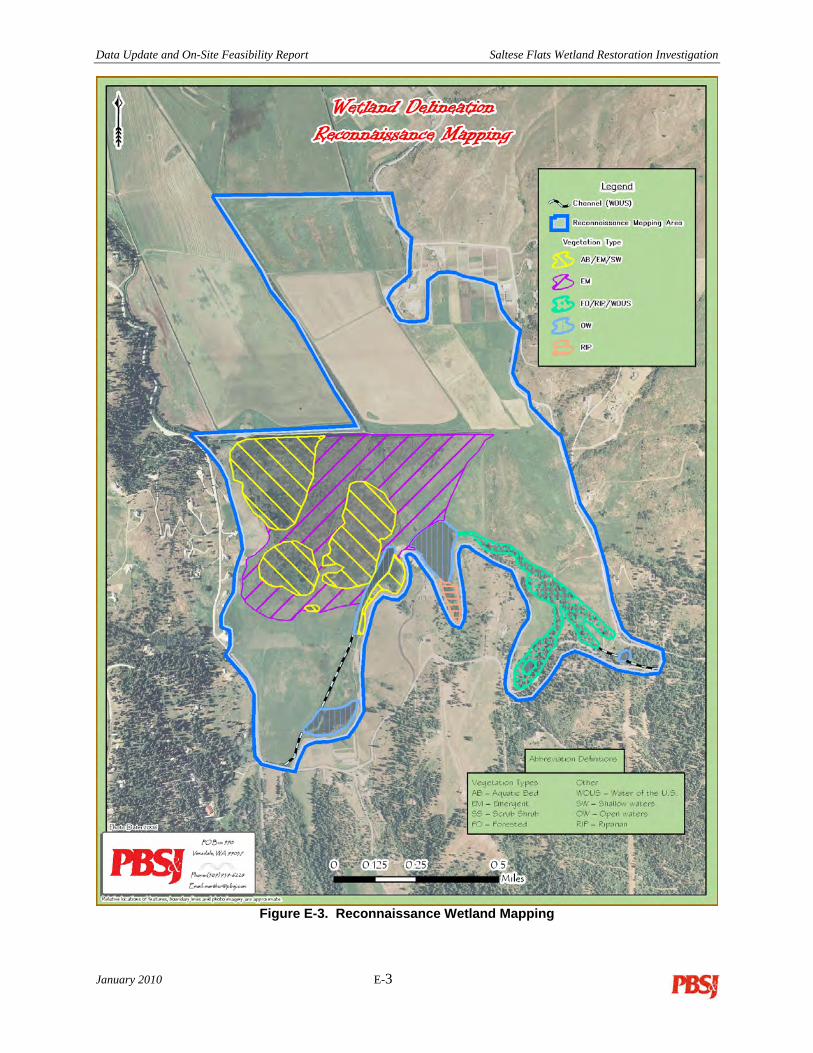
Data Update and On-Site Feasibility Report Saltese Flats Wetland Restoration Investigation
January 2010 E-3
Figure E-3. Reconnaissance Wetland Mapping

US Army Corps of Engineers Arid West – Version 11-1-2006
WETLAND DETERMINATION DATA FORM – Arid West Region
VEGETATION Tree Stratum (Use scientific names.) Absolute
% Cover Dominant Species?
Indicator Status Dominance Test Worksheet:
1.
2. Number of Dominant Species That Are OBL, FACW, or FAC: 1 (A)
3.
4. Total Number of Dominant Species Across All Strata: 1 (B)
= Total Cover
Sapling/Shrub Stratum Percent of Dominant Species That Are OBL, FACW, or FAC: 100 (A/B)
1. Prevalence Index worksheet:
2. Total %Cover of : Multiply by:
3. OBL species x1 =
4. FACW species x2 =
5. FAC species x3 =
= Total Cover FACU species x4 =
Herb Stratum UPL species x5 =
1. Scirpus validus 70 Yes OBL Column Totals: (A) (B)
2. Typha latifolia 15 No OBL Prevalence Index = B/A =
3. Sparganium emersum 10 No OBL Hydrophytic Vegetation Indicators:
4. Alisma plantago-aquatica 5 No OBL X__ Dominance Test is >50%
5. Phalaris arundinacea 3 No FACW Prevalence Index is <3.01 6.
7. Morphological Adaptations1 (Provide supporting data in
Remarks or on a separate sheet)
8. Problematic Hydrophytic Vegetation1 (Explain) 103 = Total Cover
Woody Vine Stratum
1. 1Indicators of hydric soil and wetland hydrology must be present.
2.
= Total Cover
% Bare Ground in Herb Stratum 3 % Cover of Biotic Crust Hydrophytic Vegetation Present? Yes ⌧ No
Remarks: Area dominated by hydrophytic vegetation.
Project Site: Saltese Flats City/County: Spokane Valley / Spokane Sampling Date: 9-23-08
Applicant/Owner: Spokane County State: WA Sampling Point: SP-10
Investigator(s): G. Howard Section, Township, Range: Section 29, T25N, R45E
Landform (hillslope, terrace, etc.): Plains Local relief (concave, convex, none): Concave Slope (%): 2
Subregion (LRR): Lat: 47°38'18.489"N Long: 117°7'42.855"W Datum: NAD 83
Soil Map Unit Name: Semiahmoo muck, drained NWI classification:
Are climatic / hydrologic conditions on the site typical for this time of year? Yes ⌧ No (If no, explain in Remarks.)
Are Vegetation , Soil , Or Hydrology , significantly disturbed? Are “Normal Circumstances” present? Yes ⌧ No
Are Vegetation , Soil , Or Hydrology , naturally problematic? (If needed, explain any answers in Remarks.)
SUMMARY OF FINDINGS – Attach site map showing sampling point locations, transects, important features, etc. Hydrophytic Vegetation Present? Yes ⌧ No
Hydric Soil Present? Yes ⌧ No
Wetland Hydrology Present? Yes ⌧ No
Is the Sampling Area within a Wetland? Yes ⌧ No
Remarks:
Sampling point considered within a wetland area. Area dominated by emergent vegetation type.

US Army Corps of Engineers Arid West - 11-1-06 Version
SOIL Sampling Point: SP-10 Profile Description: (Describe to the depth needed to document the indicator or confirm the absence of indicators.)
Depth Matrix Redox Features
(inches) Color (moist) % Color (Moist) % Type1 Loc2 Texture Remarks
0-8 10 YR 2/1 100 Loam
8-12+ 10 YR 2/2 100 Muck
1Type: C= Concentration, D=Depletion, RM=Reduced Matrix, 2Location: PL=Pore Lining, RC=Root Channel, M=Matrix.
Hydric Soil Indicators: (Applicable to all LRRs, unless otherwise noted.) Indicators for Problematic Hydric Soils3: Histosol (A1) Sandy Redox (S5) 1 cm Muck (A9) (LRR C)
Histic Epipedon (A2) Stripped Matrix (S6) 2 cm Muck (A10) (LRR B)
Black Histic (A3) Loamy Mucky Mineral (F1) Reduced Vertic (F18)
Hydrogen Sulfide (A4) Loamy Gleyed Matrix (F2) Red Parent Material (TF2)
Stratified Layers (A5) (LRR C) Depleted Matrix (F3) ⌧ Other (Explain in Remarks)
1 cm Muck (A9) (LRR D) Redox Dark Surface (F6)
Depleted Below Dark Surface (A11) Depleted Dark Surface (F7)
Thick Dark Surface (A12) Redox Depressions (F8)
Sandy Mucky Mineral (S1) Vernal Pools (F9)
Sandy Gleyed Matrix (S4) 3Indicators of hydrophytic vegetation and wetland hydrology must be present.
Restrictive Layer (if present):
Type:
Depth (Inches): Hydric Soils Present? Yes ⌧ No
Remarks: Area ponded or inundated for long period satisfying NRCS Hydric Soils Criteria # 4.
HYDROLOGY Wetland Hydrology Indicators:
Primary Indicators (any one indicator is sufficient) Secondary Indicators (2 or more required)
Surface Water (A1) Salt Crust (B11) Water Marks (B1) (Riverine)
High Water Table (A2) Biotic Crust (B12) Sediment Deposits (B2) (Riverine)
Saturation (A3) Aquatic Invertebrates (B13) Drift Deposits (B3) (Riverine)
Water Marks (B1) (Nonriverine) Hydrogen Sulfide Odor (C1) Drainage Patterns (B10)
Sediment Deposits (B2) (Nonriverine) ⌧ Oxidized Rhizospheres along Living Roots (C3) Dry-Season Water Table (C2)
Drift Deposits (B3) (Nonriverine) Presence of Reduced Iron (C4) Thin Muck Surface (C7)
Surface Soil Cracks (B6) Recent Iron Reduction in Tilled Soils (C6) Crayfish Burrows (C8)
Inundation Visible on Aerial Imagery (B7) Other (Explain in Remarks) Saturation Visible on Aerial Imagery (C9)
⌧ Water-Stained Leaves (B9) Shallow Aquitard (D3)
FAC-Neutral Test (D5)
Field Observations:
Surface Water Present? Yes No Depth (inches):
Water Table Present? Yes No Depth (inches):
Saturation Present? (includes capillary fringe) Yes ⌧ No Depth (inches):
Wetland Hydrology Present?
Yes
⌧
No
Describe Recorded Data (stream gauge, monitoring well, aerial photos, previous inspections), if available: Remarks: Hydrology indicator present with oxidized rhizospheres and indication of surface water inundation earlier in the season.
Project Site: Saltese Flats

US Army Corps of Engineers Arid West – Version 11-1-2006
WETLAND DETERMINATION DATA FORM – Arid West Region
VEGETATION Tree Stratum (Use scientific names.) Absolute
% Cover Dominant Species?
Indicator Status Dominance Test Worksheet:
1.
2. Number of Dominant Species That Are OBL, FACW, or FAC: 2 (A)
3.
4. Total Number of Dominant Species Across All Strata: 2 (B)
= Total Cover
Sapling/Shrub Stratum Percent of Dominant Species That Are OBL, FACW, or FAC: 100 (A/B)
1. Prevalence Index worksheet:
2. Total %Cover of : Multiply by:
3. OBL species x1 =
4. FACW species x2 =
5. FAC species x3 =
= Total Cover FACU species x4 =
Herb Stratum UPL species x5 =
1. Echinochloa crusgalli 50 Yes FACW Column Totals: (A) (B)
2. Sparganium emersum 20 Yes OBL Prevalence Index = B/A =
3. Typha latifolia 15 No OBL Hydrophytic Vegetation Indicators:
4. Bidens cernua 10 No FACW X__ Dominance Test is >50%
5. Cirsium arvense 5 No FACU Prevalence Index is <3.01 6. Carex sp. 1 No FAC
7. Epilobium ciliatum 1 No FACW Morphological Adaptations1 (Provide supporting data in
Remarks or on a separate sheet)
8. Phalaris arundinacea 1 No FACW Problematic Hydrophytic Vegetation1 (Explain) 103 = Total Cover
Woody Vine Stratum
1. 1Indicators of hydric soil and wetland hydrology must be present.
2.
= Total Cover
% Bare Ground in Herb Stratum 2 % Cover of Biotic Crust Hydrophytic Vegetation Present? Yes ⌧ No
Remarks: Area dominated by hydrophytic vegetation.
Project Site: Saltese Flats City/County: Spokane Valley / Spokane Sampling Date: 9-23-08
Applicant/Owner: Spokane County State: WA Sampling Point: SP-16
Investigator(s): G. Howard Section, Township, Range: Section 29, T25N, R45E
Landform (hillslope, terrace, etc.): Plains Local relief (concave, convex, none): Concave Slope (%): 2
Subregion (LRR): Lat: 47°38'21.598"N Long: 117°7'53.092"W Datum: NAD 83
Soil Map Unit Name: Semiahmoo muck NWI classification:
Are climatic / hydrologic conditions on the site typical for this time of year? Yes ⌧ No (If no, explain in Remarks.)
Are Vegetation , Soil , Or Hydrology , significantly disturbed? Are “Normal Circumstances” present? Yes ⌧ No
Are Vegetation , Soil , Or Hydrology , naturally problematic? (If needed, explain any answers in Remarks.)
SUMMARY OF FINDINGS – Attach site map showing sampling point locations, transects, important features, etc. Hydrophytic Vegetation Present? Yes ⌧ No
Hydric Soil Present? Yes ⌧ No
Wetland Hydrology Present? Yes ⌧ No
Is the Sampling Area within a Wetland? Yes ⌧ No
Remarks:
Sampling point considered within a wetland area. Area dominated by emergent vegetation type.
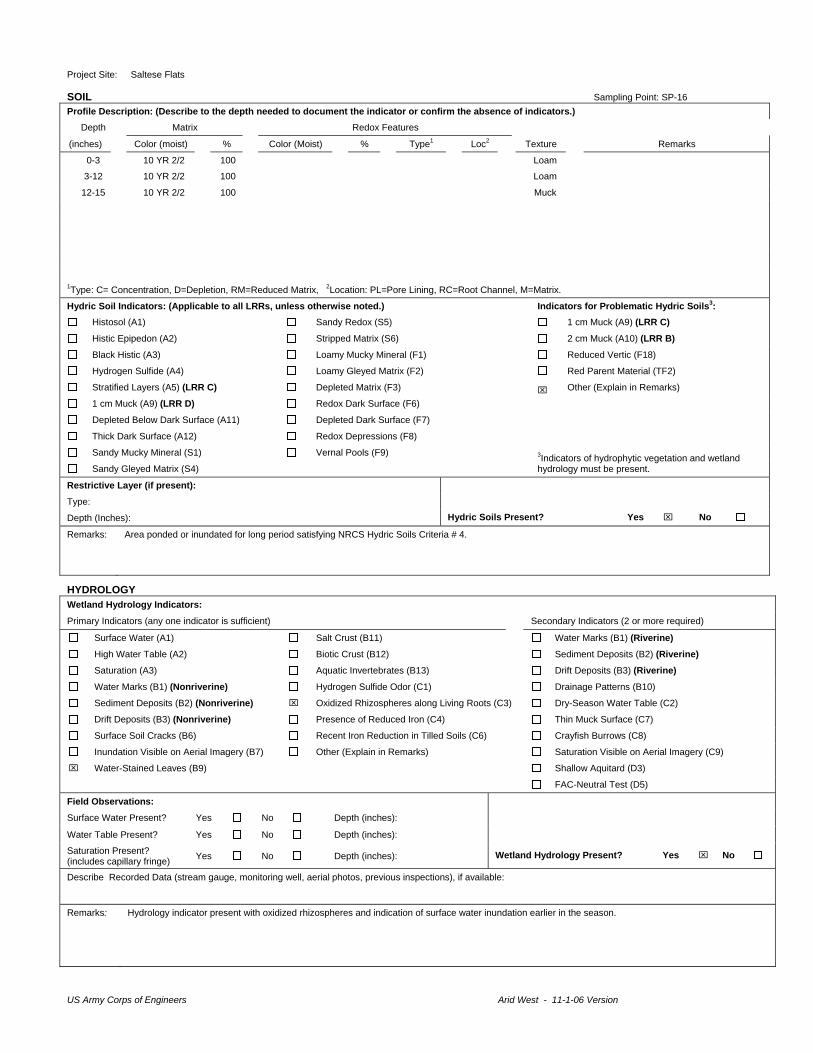
US Army Corps of Engineers Arid West - 11-1-06 Version
SOIL Sampling Point: SP-16 Profile Description: (Describe to the depth needed to document the indicator or confirm the absence of indicators.)
Depth Matrix Redox Features
(inches) Color (moist) % Color (Moist) % Type1 Loc2 Texture Remarks
0-3 10 YR 2/2 100 Loam
3-12 10 YR 2/2 100 Loam
12-15 10 YR 2/2 100 Muck
1Type: C= Concentration, D=Depletion, RM=Reduced Matrix, 2Location: PL=Pore Lining, RC=Root Channel, M=Matrix.
Hydric Soil Indicators: (Applicable to all LRRs, unless otherwise noted.) Indicators for Problematic Hydric Soils3: Histosol (A1) Sandy Redox (S5) 1 cm Muck (A9) (LRR C)
Histic Epipedon (A2) Stripped Matrix (S6) 2 cm Muck (A10) (LRR B)
Black Histic (A3) Loamy Mucky Mineral (F1) Reduced Vertic (F18)
Hydrogen Sulfide (A4) Loamy Gleyed Matrix (F2) Red Parent Material (TF2)
Stratified Layers (A5) (LRR C) Depleted Matrix (F3) ⌧ Other (Explain in Remarks)
1 cm Muck (A9) (LRR D) Redox Dark Surface (F6)
Depleted Below Dark Surface (A11) Depleted Dark Surface (F7)
Thick Dark Surface (A12) Redox Depressions (F8)
Sandy Mucky Mineral (S1) Vernal Pools (F9)
Sandy Gleyed Matrix (S4) 3Indicators of hydrophytic vegetation and wetland hydrology must be present.
Restrictive Layer (if present):
Type:
Depth (Inches): Hydric Soils Present? Yes ⌧ No
Remarks: Area ponded or inundated for long period satisfying NRCS Hydric Soils Criteria # 4.
HYDROLOGY Wetland Hydrology Indicators:
Primary Indicators (any one indicator is sufficient) Secondary Indicators (2 or more required)
Surface Water (A1) Salt Crust (B11) Water Marks (B1) (Riverine)
High Water Table (A2) Biotic Crust (B12) Sediment Deposits (B2) (Riverine)
Saturation (A3) Aquatic Invertebrates (B13) Drift Deposits (B3) (Riverine)
Water Marks (B1) (Nonriverine) Hydrogen Sulfide Odor (C1) Drainage Patterns (B10)
Sediment Deposits (B2) (Nonriverine) ⌧ Oxidized Rhizospheres along Living Roots (C3) Dry-Season Water Table (C2)
Drift Deposits (B3) (Nonriverine) Presence of Reduced Iron (C4) Thin Muck Surface (C7)
Surface Soil Cracks (B6) Recent Iron Reduction in Tilled Soils (C6) Crayfish Burrows (C8)
Inundation Visible on Aerial Imagery (B7) Other (Explain in Remarks) Saturation Visible on Aerial Imagery (C9)
⌧ Water-Stained Leaves (B9) Shallow Aquitard (D3)
FAC-Neutral Test (D5)
Field Observations:
Surface Water Present? Yes No Depth (inches):
Water Table Present? Yes No Depth (inches):
Saturation Present? (includes capillary fringe) Yes No Depth (inches):
Wetland Hydrology Present?
Yes
⌧
No
Describe Recorded Data (stream gauge, monitoring well, aerial photos, previous inspections), if available: Remarks: Hydrology indicator present with oxidized rhizospheres and indication of surface water inundation earlier in the season.
Project Site: Saltese Flats

US Army Corps of Engineers Arid West – Version 11-1-2006
WETLAND DETERMINATION DATA FORM – Arid West Region
VEGETATION Tree Stratum (Use scientific names.) Absolute
% Cover Dominant Species?
Indicator Status Dominance Test Worksheet:
1.
2. Number of Dominant Species That Are OBL, FACW, or FAC: 2 (A)
3.
4. Total Number of Dominant Species Across All Strata: 2 (B)
= Total Cover
Sapling/Shrub Stratum Percent of Dominant Species That Are OBL, FACW, or FAC: 100 (A/B)
1. Prevalence Index worksheet:
2. Total %Cover of : Multiply by:
3. OBL species x1 =
4. FACW species x2 =
5. FAC species x3 =
= Total Cover FACU species x4 =
Herb Stratum UPL species x5 =
1. Phalaris arundinacea 50 Yes FACW Column Totals: (A) (B)
2. Carex sp. 20 Yes FACW Prevalence Index = B/A =
3. Echinochloa crusgalli 10 No Hydrophytic Vegetation Indicators:
4. Agrostis sp. 5 No X__ Dominance Test is >50%
5. Juncus ensifolius 1 No Prevalence Index is <3.01 6.
7. Morphological Adaptations1 (Provide supporting data in
Remarks or on a separate sheet)
8. Problematic Hydrophytic Vegetation1 (Explain) 86 = Total Cover
Woody Vine Stratum
1. 1Indicators of hydric soil and wetland hydrology must be present.
2.
= Total Cover
% Bare Ground in Herb Stratum 20 % Cover of Biotic Crust Hydrophytic Vegetation Present? Yes ⌧ No
Remarks: Area dominated by hydrophytic vegetation.
Project Site: Saltese Flats City/County: Spokane Valley / Spokane Sampling Date: 9-23-08
Applicant/Owner: Spokane County State: WA Sampling Point: SP-17
Investigator(s): G. Howard Section, Township, Range: Section 29, T25N, R45E
Landform (hillslope, terrace, etc.): Plains Local relief (concave, convex, none): Concave Slope (%): 1
Subregion (LRR): Lat: 47°37'39.516"N Long: 117°8'1.895"W Datum: NAD 83
Soil Map Unit Name: Semiahmoo muck, drained NWI classification:
Are climatic / hydrologic conditions on the site typical for this time of year? Yes ⌧ No (If no, explain in Remarks.)
Are Vegetation , Soil , Or Hydrology , significantly disturbed? Are “Normal Circumstances” present? Yes ⌧ No
Are Vegetation , Soil , Or Hydrology , naturally problematic? (If needed, explain any answers in Remarks.)
SUMMARY OF FINDINGS – Attach site map showing sampling point locations, transects, important features, etc. Hydrophytic Vegetation Present? Yes ⌧ No
Hydric Soil Present? Yes ⌧ No
Wetland Hydrology Present? Yes ⌧ No
Is the Sampling Area within a Wetland? Yes ⌧ No
Remarks:
Sampling point considered within a wetland area. Area dominated by emergent vegetation type and located in the farmed pasture field.

US Army Corps of Engineers Arid West - 11-1-06 Version
SOIL Sampling Point: SP-17 Profile Description: (Describe to the depth needed to document the indicator or confirm the absence of indicators.)
Depth Matrix Redox Features
(inches) Color (moist) % Color (Moist) % Type1 Loc2 Texture Remarks
0-10 10 YR 2/1 100 Loam
1Type: C= Concentration, D=Depletion, RM=Reduced Matrix, 2Location: PL=Pore Lining, RC=Root Channel, M=Matrix.
Hydric Soil Indicators: (Applicable to all LRRs, unless otherwise noted.) Indicators for Problematic Hydric Soils3: Histosol (A1) Sandy Redox (S5) 1 cm Muck (A9) (LRR C)
Histic Epipedon (A2) Stripped Matrix (S6) 2 cm Muck (A10) (LRR B)
Black Histic (A3) Loamy Mucky Mineral (F1) Reduced Vertic (F18)
Hydrogen Sulfide (A4) Loamy Gleyed Matrix (F2) Red Parent Material (TF2)
Stratified Layers (A5) (LRR C) Depleted Matrix (F3) ⌧ Other (Explain in Remarks)
1 cm Muck (A9) (LRR D) Redox Dark Surface (F6)
Depleted Below Dark Surface (A11) Depleted Dark Surface (F7)
Thick Dark Surface (A12) Redox Depressions (F8)
Sandy Mucky Mineral (S1) Vernal Pools (F9)
Sandy Gleyed Matrix (S4) 3Indicators of hydrophytic vegetation and wetland hydrology must be present.
Restrictive Layer (if present):
Type:
Depth (Inches): Hydric Soils Present? Yes ⌧ No
Remarks: Area ponded or inundated for long period satisfying NRCS Hydric Soils Criteria # 4.
HYDROLOGY Wetland Hydrology Indicators:
Primary Indicators (any one indicator is sufficient) Secondary Indicators (2 or more required)
Surface Water (A1) Salt Crust (B11) Water Marks (B1) (Riverine)
High Water Table (A2) Biotic Crust (B12) Sediment Deposits (B2) (Riverine) ⌧ Saturation (A3) Aquatic Invertebrates (B13) Drift Deposits (B3) (Riverine)
Water Marks (B1) (Nonriverine) Hydrogen Sulfide Odor (C1) Drainage Patterns (B10)
Sediment Deposits (B2) (Nonriverine) Oxidized Rhizospheres along Living Roots (C3) Dry-Season Water Table (C2)
Drift Deposits (B3) (Nonriverine) Presence of Reduced Iron (C4) Thin Muck Surface (C7)
Surface Soil Cracks (B6) Recent Iron Reduction in Tilled Soils (C6) Crayfish Burrows (C8)
Inundation Visible on Aerial Imagery (B7) Other (Explain in Remarks) Saturation Visible on Aerial Imagery (C9)
⌧ Water-Stained Leaves (B9) Shallow Aquitard (D3)
FAC-Neutral Test (D5)
Field Observations:
Surface Water Present? Yes No Depth (inches):
Water Table Present? Yes No Depth (inches):
Saturation Present? (includes capillary fringe) Yes ⌧ No Depth (inches): 8
Wetland Hydrology Present?
Yes
⌧
No
Describe Recorded Data (stream gauge, monitoring well, aerial photos, previous inspections), if available: Remarks: Hydrology indicator present with soils saturated and indication of surface water inundation earlier in the season.
Project Site: Saltese Flats

US Army Corps of Engineers Arid West – Version 11-1-2006
WETLAND DETERMINATION DATA FORM – Arid West Region
VEGETATION Tree Stratum (Use scientific names.) Absolute
% Cover Dominant Species?
Indicator Status Dominance Test Worksheet:
1.
2. Number of Dominant Species That Are OBL, FACW, or FAC: 2 (A)
3.
4. Total Number of Dominant Species Across All Strata: 2 (B)
= Total Cover
Sapling/Shrub Stratum Percent of Dominant Species That Are OBL, FACW, or FAC: 100 (A/B)
1. Prevalence Index worksheet:
2. Total %Cover of : Multiply by:
3. OBL species x1 =
4. FACW species x2 =
5. FAC species x3 =
= Total Cover FACU species x4 =
Herb Stratum UPL species x5 =
1. Juncus bufonius 60 FACW Column Totals: (A) (B)
2. Gnaphalium palustre 20 FAC Prevalence Index = B/A =
3. Echinochloa crusgalli 15 FACW Hydrophytic Vegetation Indicators:
4. Polygonum sp. 5 FACW X__ Dominance Test is >50%
5. Prevalence Index is <3.01 6.
7. Morphological Adaptations1 (Provide supporting data in
Remarks or on a separate sheet)
8. Problematic Hydrophytic Vegetation1 (Explain) 100 = Total Cover
Woody Vine Stratum
1. 1Indicators of hydric soil and wetland hydrology must be present.
2.
= Total Cover
% Bare Ground in Herb Stratum 5 % Cover of Biotic Crust Hydrophytic Vegetation Present? Yes ⌧ No
Remarks: Area dominated by hydrophytic vegetation.
Project Site: Saltese Flats City/County: Spokane Valley / Spokane Sampling Date: 9-23-08
Applicant/Owner: Spokane County State: WA Sampling Point: SP-18
Investigator(s): G. Howard Section, Township, Range: Section 29, T25N, R45E
Landform (hillslope, terrace, etc.): Plains Local relief (concave, convex, none): Concave Slope (%): 2
Subregion (LRR): Lat: 47°37'15.086"N Long: 117°8'0.924"W Datum: NAD 83
Soil Map Unit Name: Semiahmoo muck NWI classification:
Are climatic / hydrologic conditions on the site typical for this time of year? Yes ⌧ No (If no, explain in Remarks.)
Are Vegetation , Soil , Or Hydrology , significantly disturbed? Are “Normal Circumstances” present? Yes ⌧ No
Are Vegetation , Soil , Or Hydrology , naturally problematic? (If needed, explain any answers in Remarks.)
SUMMARY OF FINDINGS – Attach site map showing sampling point locations, transects, important features, etc. Hydrophytic Vegetation Present? Yes ⌧ No
Hydric Soil Present? Yes ⌧ No
Wetland Hydrology Present? Yes ⌧ No
Is the Sampling Area within a Wetland? Yes ⌧ No
Remarks:
Sampling point considered within a wetland area. Area dominated by emergent vegetation type and located below the Morrison Diversion.

US Army Corps of Engineers Arid West - 11-1-06 Version
SOIL Sampling Point: SP-18 Profile Description: (Describe to the depth needed to document the indicator or confirm the absence of indicators.)
Depth Matrix Redox Features
(inches) Color (moist) % Color (Moist) % Type1 Loc2 Texture Remarks
0-10 10 YR 2/1 100 Loam
10-12+ 10 YR 2/2 100 Muck
1Type: C= Concentration, D=Depletion, RM=Reduced Matrix, 2Location: PL=Pore Lining, RC=Root Channel, M=Matrix.
Hydric Soil Indicators: (Applicable to all LRRs, unless otherwise noted.) Indicators for Problematic Hydric Soils3: Histosol (A1) Sandy Redox (S5) 1 cm Muck (A9) (LRR C)
Histic Epipedon (A2) Stripped Matrix (S6) 2 cm Muck (A10) (LRR B)
Black Histic (A3) Loamy Mucky Mineral (F1) Reduced Vertic (F18)
Hydrogen Sulfide (A4) Loamy Gleyed Matrix (F2) Red Parent Material (TF2)
Stratified Layers (A5) (LRR C) Depleted Matrix (F3) ⌧ Other (Explain in Remarks)
1 cm Muck (A9) (LRR D) Redox Dark Surface (F6)
Depleted Below Dark Surface (A11) Depleted Dark Surface (F7)
Thick Dark Surface (A12) Redox Depressions (F8)
Sandy Mucky Mineral (S1) Vernal Pools (F9)
Sandy Gleyed Matrix (S4) 3Indicators of hydrophytic vegetation and wetland hydrology must be present.
Restrictive Layer (if present):
Type:
Depth (Inches): Hydric Soils Present? Yes ⌧ No
Remarks: Area ponded or inundated for long period satisfying NRCS Hydric Soils Criteria # 4.
HYDROLOGY Wetland Hydrology Indicators:
Primary Indicators (any one indicator is sufficient) Secondary Indicators (2 or more required)
Surface Water (A1) Salt Crust (B11) Water Marks (B1) (Riverine)
High Water Table (A2) Biotic Crust (B12) Sediment Deposits (B2) (Riverine)
Saturation (A3) Aquatic Invertebrates (B13) Drift Deposits (B3) (Riverine)
Water Marks (B1) (Nonriverine) Hydrogen Sulfide Odor (C1) Drainage Patterns (B10)
Sediment Deposits (B2) (Nonriverine) ⌧ Oxidized Rhizospheres along Living Roots (C3) Dry-Season Water Table (C2)
Drift Deposits (B3) (Nonriverine) Presence of Reduced Iron (C4) Thin Muck Surface (C7)
Surface Soil Cracks (B6) Recent Iron Reduction in Tilled Soils (C6) Crayfish Burrows (C8)
Inundation Visible on Aerial Imagery (B7) Other (Explain in Remarks) Saturation Visible on Aerial Imagery (C9)
⌧ Water-Stained Leaves (B9) Shallow Aquitard (D3)
FAC-Neutral Test (D5)
Field Observations:
Surface Water Present? Yes No Depth (inches):
Water Table Present? Yes No Depth (inches):
Saturation Present? (includes capillary fringe) Yes No Depth (inches):
Wetland Hydrology Present?
Yes
⌧
No
Describe Recorded Data (stream gauge, monitoring well, aerial photos, previous inspections), if available: Remarks: Hydrology indicator present with oxidized rhizospheres, water stained leaves and indication of surface water inundation earlier in the season.
Project Site: Saltese Flats

US Army Corps of Engineers Arid West – Version 11-1-2006
WETLAND DETERMINATION DATA FORM – Arid West Region
VEGETATION Tree Stratum (Use scientific names.) Absolute
% Cover Dominant Species?
Indicator Status Dominance Test Worksheet:
1.
2. Number of Dominant Species That Are OBL, FACW, or FAC: 1 (A)
3.
4. Total Number of Dominant Species Across All Strata: 1 (B)
= Total Cover
Sapling/Shrub Stratum Percent of Dominant Species That Are OBL, FACW, or FAC: 100 (A/B)
1. Prevalence Index worksheet:
2. Total %Cover of : Multiply by:
3. OBL species x1 =
4. FACW species x2 =
5. FAC species x3 =
= Total Cover FACU species x4 =
Herb Stratum UPL species x5 =
1. Phalaris arundinacea 100 Yes FACW Column Totals: (A) (B)
2. Galium sp. 1 No FAC Prevalence Index = B/A =
3. Hydrophytic Vegetation Indicators:
4. X__ Dominance Test is >50%
5. Prevalence Index is <3.01 6.
7. Morphological Adaptations1 (Provide supporting data in
Remarks or on a separate sheet)
8. Problematic Hydrophytic Vegetation1 (Explain) 101 = Total Cover
Woody Vine Stratum
1. 1Indicators of hydric soil and wetland hydrology must be present.
2.
= Total Cover
% Bare Ground in Herb Stratum 0 % Cover of Biotic Crust Hydrophytic Vegetation Present? Yes ⌧ No
Remarks: Hydrophytic vegetation present with a mono-culture of reed canarygrass.
Project Site: Saltese Flats City/County: Spokane Valley / Spokane Sampling Date: 9-23-08
Applicant/Owner: Spokane County State: WA Sampling Point: SP-2
Investigator(s): G. Howard Section, Township, Range: Section 29, T25N, R45E
Landform (hillslope, terrace, etc.): Plains Local relief (concave, convex, none): Concave Slope (%): 1
Subregion (LRR): Lat: 47°38'21.037"N Long: 117°8'32.319"W Datum: NAD 83
Soil Map Unit Name: Lakesol silt loam, 0 to 20 percent slopes NWI classification:
Are climatic / hydrologic conditions on the site typical for this time of year? Yes ⌧ No (If no, explain in Remarks.)
Are Vegetation , Soil , Or Hydrology , significantly disturbed? Are “Normal Circumstances” present? Yes ⌧ No
Are Vegetation , Soil , Or Hydrology , naturally problematic? (If needed, explain any answers in Remarks.)
SUMMARY OF FINDINGS – Attach site map showing sampling point locations, transects, important features, etc. Hydrophytic Vegetation Present? Yes ⌧ No
Hydric Soil Present? Yes ⌧ No
Wetland Hydrology Present? Yes ⌧ No
Is the Sampling Area within a Wetland? Yes ⌧ No
Remarks:
Sampling point considered within a wetland area. Sampling point is within the bottom of a large ditch that serves as a conveyance system for irrigation waters and also seasonal fluctuation of ponding surface waters within Saltese Flats.

US Army Corps of Engineers Arid West - 11-1-06 Version
SOIL Sampling Point: SP-2 Profile Description: (Describe to the depth needed to document the indicator or confirm the absence of indicators.)
Depth Matrix Redox Features
(inches) Color (moist) % Color (Moist) % Type1 Loc2 Texture Remarks
0-10 10YR 2/1 100 Mucky Loam
10+ 10YR 2/1 100 Silt Loam
1Type: C= Concentration, D=Depletion, RM=Reduced Matrix, 2Location: PL=Pore Lining, RC=Root Channel, M=Matrix.
Hydric Soil Indicators: (Applicable to all LRRs, unless otherwise noted.) Indicators for Problematic Hydric Soils3: Histosol (A1) Sandy Redox (S5) 1 cm Muck (A9) (LRR C)
Histic Epipedon (A2) Stripped Matrix (S6) 2 cm Muck (A10) (LRR B)
Black Histic (A3) ⌧ Loamy Mucky Mineral (F1) Reduced Vertic (F18)
Hydrogen Sulfide (A4) Loamy Gleyed Matrix (F2) Red Parent Material (TF2)
Stratified Layers (A5) (LRR C) Depleted Matrix (F3) ⌧ Other (Explain in Remarks)
1 cm Muck (A9) (LRR D) Redox Dark Surface (F6)
Depleted Below Dark Surface (A11) Depleted Dark Surface (F7)
Thick Dark Surface (A12) Redox Depressions (F8)
Sandy Mucky Mineral (S1) Vernal Pools (F9)
Sandy Gleyed Matrix (S4) 3Indicators of hydrophytic vegetation and wetland hydrology must be present.
Restrictive Layer (if present):
Type:
Depth (Inches): Hydric Soils Present? Yes ⌧ No
Remarks: Hydric soil indicators present with loamy mucky mineral (F1) and areas of ponding water with a long duration or frequency within the ditch bottom that satisfies NRCS Hydric Soil Criteria # 4.
HYDROLOGY Wetland Hydrology Indicators:
Primary Indicators (any one indicator is sufficient) Secondary Indicators (2 or more required)
⌧ Surface Water (A1) Salt Crust (B11) Water Marks (B1) (Riverine)
High Water Table (A2) Biotic Crust (B12) Sediment Deposits (B2) (Riverine)
Saturation (A3) Aquatic Invertebrates (B13) Drift Deposits (B3) (Riverine)
Water Marks (B1) (Nonriverine) Hydrogen Sulfide Odor (C1) Drainage Patterns (B10)
Sediment Deposits (B2) (Nonriverine) Oxidized Rhizospheres along Living Roots (C3) Dry-Season Water Table (C2)
Drift Deposits (B3) (Nonriverine) Presence of Reduced Iron (C4) Thin Muck Surface (C7)
Surface Soil Cracks (B6) Recent Iron Reduction in Tilled Soils (C6) Crayfish Burrows (C8)
Inundation Visible on Aerial Imagery (B7) Other (Explain in Remarks) Saturation Visible on Aerial Imagery (C9)
Water-Stained Leaves (B9) Shallow Aquitard (D3)
FAC-Neutral Test (D5)
Field Observations:
Surface Water Present? Yes ⌧ No Depth (inches): 3
Water Table Present? Yes No Depth (inches):
Saturation Present? (includes capillary fringe) Yes No Depth (inches):
Wetland Hydrology Present?
Yes
⌧
No
Describe Recorded Data (stream gauge, monitoring well, aerial photos, previous inspections), if available: Remarks: Hydrology indicator present with surface waters within the ditch.
Project Site: Saltese Flats

US Army Corps of Engineers Arid West – Version 11-1-2006
WETLAND DETERMINATION DATA FORM – Arid West Region
VEGETATION Tree Stratum (Use scientific names.) Absolute
% Cover Dominant Species?
Indicator Status Dominance Test Worksheet:
1.
2. Number of Dominant Species That Are OBL, FACW, or FAC: 1 (A)
3.
4. Total Number of Dominant Species Across All Strata: 1 (B)
= Total Cover
Sapling/Shrub Stratum Percent of Dominant Species That Are OBL, FACW, or FAC: 100 (A/B)
1. Prevalence Index worksheet:
2. Total %Cover of : Multiply by:
3. OBL species x1 =
4. FACW species x2 =
5. FAC species x3 =
= Total Cover FACU species x4 =
Herb Stratum UPL species x5 =
1. Phalaris arundinacea 99 Yes FACW Column Totals: (A) (B)
2. Galium sp. 1 No Prevalence Index = B/A =
3. Hydrophytic Vegetation Indicators:
4. X_ Dominance Test is >50%
5. Prevalence Index is <3.01 6.
7. Morphological Adaptations1 (Provide supporting data in
Remarks or on a separate sheet)
8. Problematic Hydrophytic Vegetation1 (Explain) 100 = Total Cover
Woody Vine Stratum
1. 1Indicators of hydric soil and wetland hydrology must be present.
2.
= Total Cover
% Bare Ground in Herb Stratum 0 % Cover of Biotic Crust Hydrophytic Vegetation Present? Yes ⌧ No
Remarks: Area dominated by mostly a single hydrophytic species of vegetation.
Project Site: Saltese Flats City/County: Spokane Valley / Spokane Sampling Date: 9-23-08
Applicant/Owner: Spokane County State: WA Sampling Point: SP-4
Investigator(s): G. Howard Section, Township, Range: Section 29, T25N, R45E
Landform (hillslope, terrace, etc.): Slope Local relief (concave, convex, none): None Slope (%): 1-2
Subregion (LRR): Lat: 47°38'20.209"N Long: 117°8'21.768"W Datum: NAD 83
Soil Map Unit Name: Semiahmoo muck, drained NWI classification:
Are climatic / hydrologic conditions on the site typical for this time of year? Yes ⌧ No (If no, explain in Remarks.)
Are Vegetation , Soil , Or Hydrology , significantly disturbed? Are “Normal Circumstances” present? Yes ⌧ No
Are Vegetation , Soil , Or Hydrology , naturally problematic? (If needed, explain any answers in Remarks.)
SUMMARY OF FINDINGS – Attach site map showing sampling point locations, transects, important features, etc. Hydrophytic Vegetation Present? Yes ⌧ No
Hydric Soil Present? Yes ⌧ No
Wetland Hydrology Present? Yes ⌧ No
Is the Sampling Area within a Wetland? Yes ⌧ No
Remarks:
Sampling point considered within a wetland area. Wetland site is a mono-culture of reed canarygrass that receives periodic or seasonal flooding from fluctuating water table near the Graham pond.
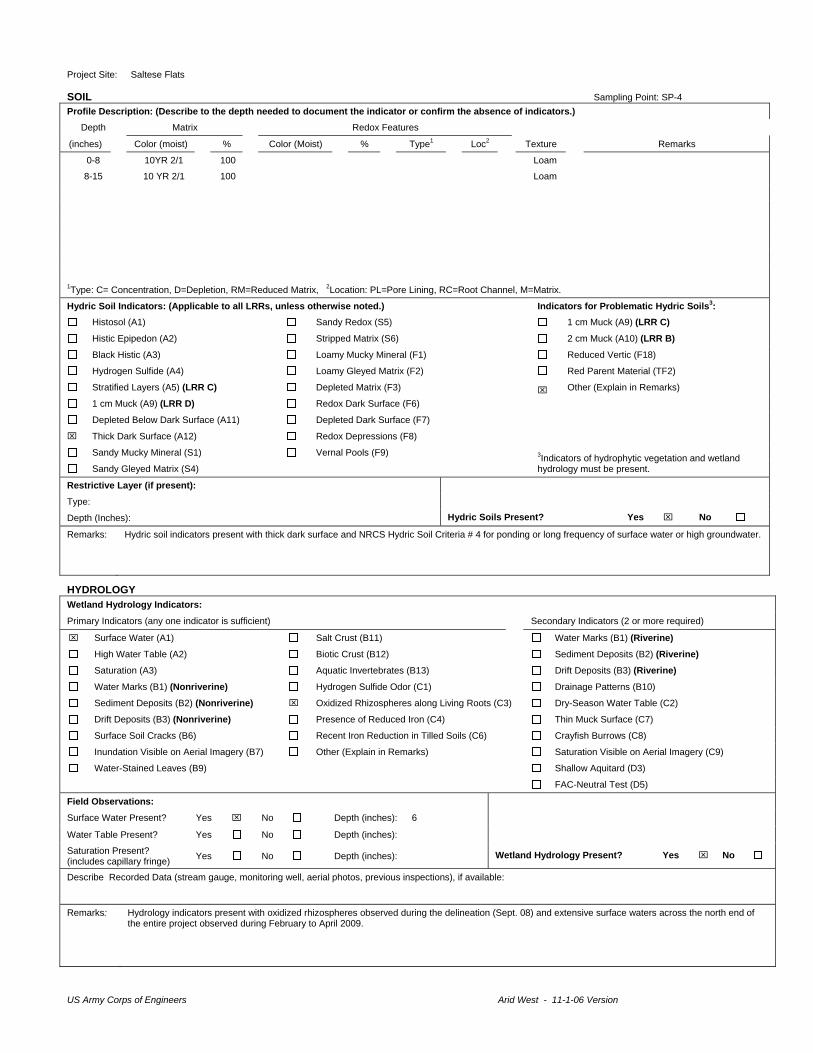
US Army Corps of Engineers Arid West - 11-1-06 Version
SOIL Sampling Point: SP-4 Profile Description: (Describe to the depth needed to document the indicator or confirm the absence of indicators.)
Depth Matrix Redox Features
(inches) Color (moist) % Color (Moist) % Type1 Loc2 Texture Remarks
0-8 10YR 2/1 100 Loam
8-15 10 YR 2/1 100 Loam
1Type: C= Concentration, D=Depletion, RM=Reduced Matrix, 2Location: PL=Pore Lining, RC=Root Channel, M=Matrix.
Hydric Soil Indicators: (Applicable to all LRRs, unless otherwise noted.) Indicators for Problematic Hydric Soils3: Histosol (A1) Sandy Redox (S5) 1 cm Muck (A9) (LRR C)
Histic Epipedon (A2) Stripped Matrix (S6) 2 cm Muck (A10) (LRR B)
Black Histic (A3) Loamy Mucky Mineral (F1) Reduced Vertic (F18)
Hydrogen Sulfide (A4) Loamy Gleyed Matrix (F2) Red Parent Material (TF2)
Stratified Layers (A5) (LRR C) Depleted Matrix (F3) ⌧ Other (Explain in Remarks)
1 cm Muck (A9) (LRR D) Redox Dark Surface (F6)
Depleted Below Dark Surface (A11) Depleted Dark Surface (F7)
⌧ Thick Dark Surface (A12) Redox Depressions (F8)
Sandy Mucky Mineral (S1) Vernal Pools (F9)
Sandy Gleyed Matrix (S4) 3Indicators of hydrophytic vegetation and wetland hydrology must be present.
Restrictive Layer (if present):
Type:
Depth (Inches): Hydric Soils Present? Yes ⌧ No
Remarks: Hydric soil indicators present with thick dark surface and NRCS Hydric Soil Criteria # 4 for ponding or long frequency of surface water or high groundwater.
HYDROLOGY Wetland Hydrology Indicators:
Primary Indicators (any one indicator is sufficient) Secondary Indicators (2 or more required)
⌧ Surface Water (A1) Salt Crust (B11) Water Marks (B1) (Riverine)
High Water Table (A2) Biotic Crust (B12) Sediment Deposits (B2) (Riverine)
Saturation (A3) Aquatic Invertebrates (B13) Drift Deposits (B3) (Riverine)
Water Marks (B1) (Nonriverine) Hydrogen Sulfide Odor (C1) Drainage Patterns (B10)
Sediment Deposits (B2) (Nonriverine) ⌧ Oxidized Rhizospheres along Living Roots (C3) Dry-Season Water Table (C2)
Drift Deposits (B3) (Nonriverine) Presence of Reduced Iron (C4) Thin Muck Surface (C7)
Surface Soil Cracks (B6) Recent Iron Reduction in Tilled Soils (C6) Crayfish Burrows (C8)
Inundation Visible on Aerial Imagery (B7) Other (Explain in Remarks) Saturation Visible on Aerial Imagery (C9)
Water-Stained Leaves (B9) Shallow Aquitard (D3)
FAC-Neutral Test (D5)
Field Observations:
Surface Water Present? Yes ⌧ No Depth (inches): 6
Water Table Present? Yes No Depth (inches):
Saturation Present? (includes capillary fringe) Yes No Depth (inches):
Wetland Hydrology Present?
Yes
⌧
No
Describe Recorded Data (stream gauge, monitoring well, aerial photos, previous inspections), if available: Remarks: Hydrology indicators present with oxidized rhizospheres observed during the delineation (Sept. 08) and extensive surface waters across the north end of
the entire project observed during February to April 2009.
Project Site: Saltese Flats

US Army Corps of Engineers Arid West – Version 11-1-2006
WETLAND DETERMINATION DATA FORM – Arid West Region
VEGETATION Tree Stratum (Use scientific names.) Absolute
% Cover Dominant Species?
Indicator Status Dominance Test Worksheet:
1.
2. Number of Dominant Species That Are OBL, FACW, or FAC: 3 (A)
3.
4. Total Number of Dominant Species Across All Strata: 3 (B)
= Total Cover
Sapling/Shrub Stratum Percent of Dominant Species That Are OBL, FACW, or FAC: 100 (A/B)
1. Prevalence Index worksheet:
2. Total %Cover of : Multiply by:
3. OBL species x1 =
4. FACW species x2 =
5. FAC species x3 =
= Total Cover FACU species x4 =
Herb Stratum UPL species x5 =
1. Eleocharis ovata 30 Yes OBL Column Totals: (A) (B)
2. Gnaphalium palustre 20 Yes FAC Prevalence Index = B/A =
3. Polygonum amphibium 15 Yes OBL Hydrophytic Vegetation Indicators:
4. Bidens cernua 5 No FACW X__ Dominance Test is >50%
5. Juncus bufonius 5 No FACW Prevalence Index is <3.01 6.
7. Morphological Adaptations1 (Provide supporting data in
Remarks or on a separate sheet)
8. Problematic Hydrophytic Vegetation1 (Explain) 75 = Total Cover
Woody Vine Stratum
1. 1Indicators of hydric soil and wetland hydrology must be present.
2.
= Total Cover
% Bare Ground in Herb Stratum 25 % Cover of Biotic Crust Hydrophytic Vegetation Present? Yes ⌧ No
Remarks: Area dominated by hydrophytic vegetation.
Project Site: Saltese Flats City/County: Spokane Valley / Spokane Sampling Date: 9-23-08
Applicant/Owner: Spokane County State: WA Sampling Point: SP-6
Investigator(s): G. Howard Section, Township, Range: Section 29, T25N, R45E
Landform (hillslope, terrace, etc.): Slope Local relief (concave, convex, none): None Slope (%): 2
Subregion (LRR): Lat: 47°38'19.737"N Long: 117°8'15.472"W Datum: NAD 83
Soil Map Unit Name: Fresh water marsh NWI classification:
Are climatic / hydrologic conditions on the site typical for this time of year? Yes No (If no, explain in Remarks.)
Are Vegetation , Soil , Or Hydrology , significantly disturbed? Are “Normal Circumstances” present? Yes No
Are Vegetation , Soil , Or Hydrology , naturally problematic? (If needed, explain any answers in Remarks.)
SUMMARY OF FINDINGS – Attach site map showing sampling point locations, transects, important features, etc. Hydrophytic Vegetation Present? Yes ⌧ No
Hydric Soil Present? Yes ⌧ No
Wetland Hydrology Present? Yes ⌧ No
Is the Sampling Area within a Wetland? Yes ⌧ No
Remarks:
Sampling point considered within a wetland area. Area dominated by emergent vegetation

US Army Corps of Engineers Arid West - 11-1-06 Version
SOIL Sampling Point: SP-6 Profile Description: (Describe to the depth needed to document the indicator or confirm the absence of indicators.)
Depth Matrix Redox Features
(inches) Color (moist) % Color (Moist) % Type1 Loc2 Texture Remarks
0-2 10 YR 2/1 100 Loam
2-6 10 YR 2/2 100 Loam
6-12 10 YR 3/3 100 Muck
1Type: C= Concentration, D=Depletion, RM=Reduced Matrix, 2Location: PL=Pore Lining, RC=Root Channel, M=Matrix.
Hydric Soil Indicators: (Applicable to all LRRs, unless otherwise noted.) Indicators for Problematic Hydric Soils3: Histosol (A1) Sandy Redox (S5) 1 cm Muck (A9) (LRR C)
Histic Epipedon (A2) Stripped Matrix (S6) 2 cm Muck (A10) (LRR B)
Black Histic (A3) Loamy Mucky Mineral (F1) Reduced Vertic (F18)
Hydrogen Sulfide (A4) Loamy Gleyed Matrix (F2) Red Parent Material (TF2)
Stratified Layers (A5) (LRR C) Depleted Matrix (F3) ⌧ Other (Explain in Remarks)
1 cm Muck (A9) (LRR D) Redox Dark Surface (F6)
Depleted Below Dark Surface (A11) Depleted Dark Surface (F7)
Thick Dark Surface (A12) Redox Depressions (F8)
Sandy Mucky Mineral (S1) Vernal Pools (F9)
Sandy Gleyed Matrix (S4) 3Indicators of hydrophytic vegetation and wetland hydrology must be present.
Restrictive Layer (if present):
Type:
Depth (Inches): Hydric Soils Present? Yes ⌧ No
Remarks: Area ponded or inundated for long periods satisfying NRCS Hydric Soils Criteria # 4.
HYDROLOGY Wetland Hydrology Indicators:
Primary Indicators (any one indicator is sufficient) Secondary Indicators (2 or more required)
Surface Water (A1) Salt Crust (B11) ⌧ Water Marks (B1) (Riverine)
High Water Table (A2) Biotic Crust (B12) Sediment Deposits (B2) (Riverine) ⌧ Saturation (A3) Aquatic Invertebrates (B13) Drift Deposits (B3) (Riverine)
Water Marks (B1) (Nonriverine) Hydrogen Sulfide Odor (C1) Drainage Patterns (B10)
Sediment Deposits (B2) (Nonriverine) Oxidized Rhizospheres along Living Roots (C3) Dry-Season Water Table (C2)
Drift Deposits (B3) (Nonriverine) Presence of Reduced Iron (C4) Thin Muck Surface (C7)
Surface Soil Cracks (B6) Recent Iron Reduction in Tilled Soils (C6) Crayfish Burrows (C8)
Inundation Visible on Aerial Imagery (B7) Other (Explain in Remarks) Saturation Visible on Aerial Imagery (C9)
⌧ Water-Stained Leaves (B9) Shallow Aquitard (D3)
FAC-Neutral Test (D5)
Field Observations:
Surface Water Present? Yes No Depth (inches):
Water Table Present? Yes No Depth (inches):
Saturation Present? (includes capillary fringe) Yes ⌧ No Depth (inches): 0
Wetland Hydrology Present?
Yes
⌧
No
Describe Recorded Data (stream gauge, monitoring well, aerial photos, previous inspections), if available: Remarks: Hydrology indicator present with saturated soils during the time of the investigation and indication of surface water earlier in the season.
Project Site: Saltese Flats

US Army Corps of Engineers Arid West – Version 11-1-2006
WETLAND DETERMINATION DATA FORM – Arid West Region
VEGETATION Tree Stratum (Use scientific names.) Absolute
% Cover Dominant Species?
Indicator Status Dominance Test Worksheet:
1.
2. Number of Dominant Species That Are OBL, FACW, or FAC: 2 (A)
3.
4. Total Number of Dominant Species Across All Strata: 2 (B)
= Total Cover
Sapling/Shrub Stratum Percent of Dominant Species That Are OBL, FACW, or FAC: 100 (A/B)
1. Prevalence Index worksheet:
2. Total %Cover of : Multiply by:
3. OBL species x1 =
4. FACW species x2 =
5. FAC species x3 =
= Total Cover FACU species x4 =
Herb Stratum UPL species x5 =
1. Typha latifolia 60 OBL Column Totals: (A) (B)
2. Polygonum amphibium 20 Prevalence Index = B/A =
3. Phalaris arundinacea 10 Hydrophytic Vegetation Indicators:
4. Bidens cernua 1 X__ Dominance Test is >50%
5. Gnaphalium palustre 1 Prevalence Index is <3.01 6.
7. Morphological Adaptations1 (Provide supporting data in
Remarks or on a separate sheet)
8. Problematic Hydrophytic Vegetation1 (Explain) 92 = Total Cover
Woody Vine Stratum
1. 1Indicators of hydric soil and wetland hydrology must be present.
2.
= Total Cover
% Bare Ground in Herb Stratum 10 % Cover of Biotic Crust Hydrophytic Vegetation Present? Yes ⌧ No
Remarks: Area dominated by hydrophytic vegetation.
Project Site: Saltese Flats City/County: Spokane Valley / Spokane Sampling Date: 9-23-08
Applicant/Owner: Spokane County State: WA Sampling Point: SP-7
Investigator(s): G. Howard Section, Township, Range: Section 29, T25N, R45E
Landform (hillslope, terrace, etc.): Plains Local relief (concave, convex, none): Concave Slope (%): 1
Subregion (LRR): Lat: 47°38'16.885"N Long: 117°8'10.208"W Datum: NAD 83
Soil Map Unit Name: Fresh water marsh NWI classification:
Are climatic / hydrologic conditions on the site typical for this time of year? Yes ⌧ No (If no, explain in Remarks.)
Are Vegetation , Soil , Or Hydrology , significantly disturbed? Are “Normal Circumstances” present? Yes ⌧ No
Are Vegetation , Soil , Or Hydrology , naturally problematic? (If needed, explain any answers in Remarks.)
SUMMARY OF FINDINGS – Attach site map showing sampling point locations, transects, important features, etc. Hydrophytic Vegetation Present? Yes ⌧ No
Hydric Soil Present? Yes ⌧ No
Wetland Hydrology Present? Yes ⌧ No
Is the Sampling Area within a Wetland? Yes ⌧ No
Remarks:
Sampling point considered within a wetland area. Area dominated by emergent vegetation type along fringe of Graham Pond. Site has fluctuating water levels throughout the season.

US Army Corps of Engineers Arid West - 11-1-06 Version
SOIL Sampling Point: SP-7 Profile Description: (Describe to the depth needed to document the indicator or confirm the absence of indicators.)
Depth Matrix Redox Features
(inches) Color (moist) % Color (Moist) % Type1 Loc2 Texture Remarks
0-2 10 YR 2/1 100 Loam
2-10 10 YR 2/1 100 Loam
10-15 10 YR 2/2 100 Muck
1Type: C= Concentration, D=Depletion, RM=Reduced Matrix, 2Location: PL=Pore Lining, RC=Root Channel, M=Matrix.
Hydric Soil Indicators: (Applicable to all LRRs, unless otherwise noted.) Indicators for Problematic Hydric Soils3: Histosol (A1) Sandy Redox (S5) 1 cm Muck (A9) (LRR C)
Histic Epipedon (A2) Stripped Matrix (S6) 2 cm Muck (A10) (LRR B)
Black Histic (A3) Loamy Mucky Mineral (F1) Reduced Vertic (F18)
Hydrogen Sulfide (A4) Loamy Gleyed Matrix (F2) Red Parent Material (TF2)
Stratified Layers (A5) (LRR C) Depleted Matrix (F3) ⌧ Other (Explain in Remarks)
1 cm Muck (A9) (LRR D) Redox Dark Surface (F6)
Depleted Below Dark Surface (A11) Depleted Dark Surface (F7)
Thick Dark Surface (A12) Redox Depressions (F8)
Sandy Mucky Mineral (S1) Vernal Pools (F9)
Sandy Gleyed Matrix (S4) 3Indicators of hydrophytic vegetation and wetland hydrology must be present.
Restrictive Layer (if present):
Type:
Depth (Inches): Hydric Soils Present? Yes ⌧ No
Remarks: Area ponded or inundated for long periods satisfying NRCS Hydric Soils Criteria # 4.
HYDROLOGY Wetland Hydrology Indicators:
Primary Indicators (any one indicator is sufficient) Secondary Indicators (2 or more required)
Surface Water (A1) Salt Crust (B11) ⌧ Water Marks (B1) (Riverine) ⌧ High Water Table (A2) Biotic Crust (B12) Sediment Deposits (B2) (Riverine) ⌧ Saturation (A3) Aquatic Invertebrates (B13) Drift Deposits (B3) (Riverine)
Water Marks (B1) (Nonriverine) Hydrogen Sulfide Odor (C1) Drainage Patterns (B10)
Sediment Deposits (B2) (Nonriverine) Oxidized Rhizospheres along Living Roots (C3) Dry-Season Water Table (C2)
Drift Deposits (B3) (Nonriverine) Presence of Reduced Iron (C4) Thin Muck Surface (C7)
Surface Soil Cracks (B6) Recent Iron Reduction in Tilled Soils (C6) Crayfish Burrows (C8)
Inundation Visible on Aerial Imagery (B7) Other (Explain in Remarks) Saturation Visible on Aerial Imagery (C9)
⌧ Water-Stained Leaves (B9) Shallow Aquitard (D3)
FAC-Neutral Test (D5)
Field Observations:
Surface Water Present? Yes No Depth (inches):
Water Table Present? Yes No Depth (inches):
Saturation Present? (includes capillary fringe) Yes ⌧ No Depth (inches):
Wetland Hydrology Present?
Yes
⌧
No
Describe Recorded Data (stream gauge, monitoring well, aerial photos, previous inspections), if available: Remarks: Hydrology indicator present with soils saturated to ground surface and indication of surface water earlier in the season.
Project Site: Saltese Flats
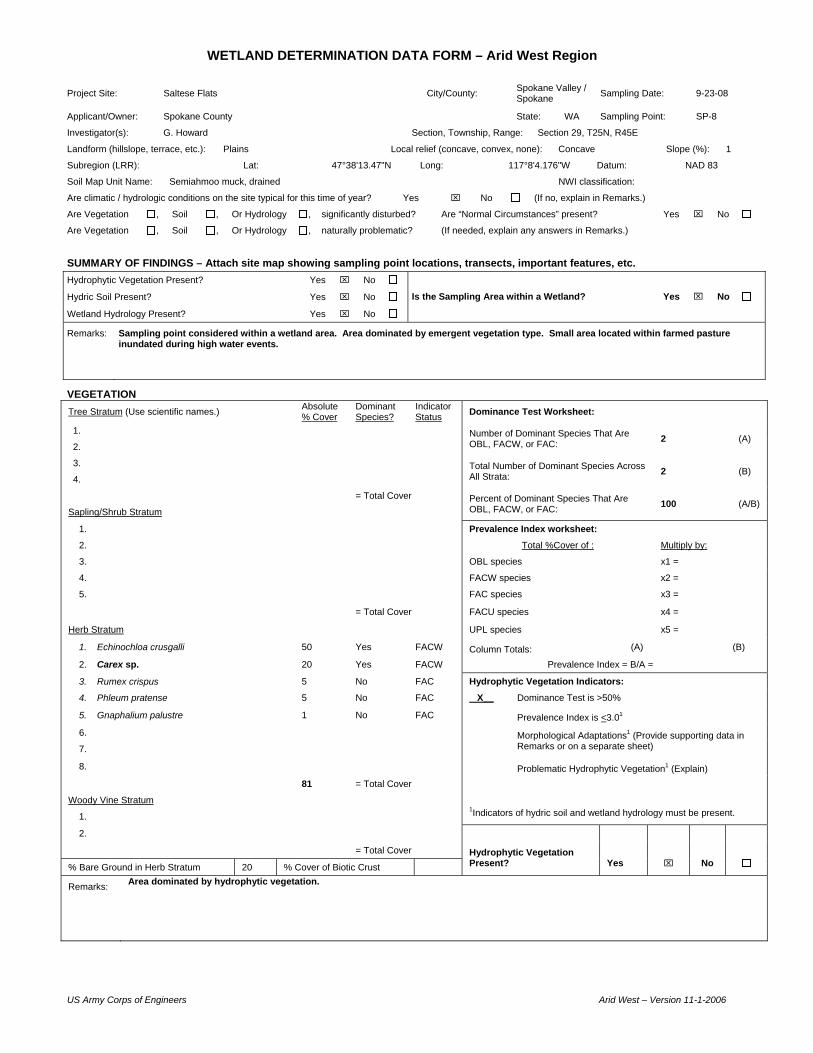
US Army Corps of Engineers Arid West – Version 11-1-2006
WETLAND DETERMINATION DATA FORM – Arid West Region
VEGETATION Tree Stratum (Use scientific names.) Absolute
% Cover Dominant Species?
Indicator Status Dominance Test Worksheet:
1.
2. Number of Dominant Species That Are OBL, FACW, or FAC: 2 (A)
3.
4. Total Number of Dominant Species Across All Strata: 2 (B)
= Total Cover
Sapling/Shrub Stratum Percent of Dominant Species That Are OBL, FACW, or FAC: 100 (A/B)
1. Prevalence Index worksheet:
2. Total %Cover of : Multiply by:
3. OBL species x1 =
4. FACW species x2 =
5. FAC species x3 =
= Total Cover FACU species x4 =
Herb Stratum UPL species x5 =
1. Echinochloa crusgalli 50 Yes FACW Column Totals: (A) (B)
2. Carex sp. 20 Yes FACW Prevalence Index = B/A =
3. Rumex crispus 5 No FAC Hydrophytic Vegetation Indicators:
4. Phleum pratense 5 No FAC X__ Dominance Test is >50%
5. Gnaphalium palustre 1 No FAC Prevalence Index is <3.01 6.
7. Morphological Adaptations1 (Provide supporting data in
Remarks or on a separate sheet)
8. Problematic Hydrophytic Vegetation1 (Explain) 81 = Total Cover
Woody Vine Stratum
1. 1Indicators of hydric soil and wetland hydrology must be present.
2.
= Total Cover
% Bare Ground in Herb Stratum 20 % Cover of Biotic Crust Hydrophytic Vegetation Present? Yes ⌧ No
Remarks: Area dominated by hydrophytic vegetation.
Project Site: Saltese Flats City/County: Spokane Valley / Spokane Sampling Date: 9-23-08
Applicant/Owner: Spokane County State: WA Sampling Point: SP-8
Investigator(s): G. Howard Section, Township, Range: Section 29, T25N, R45E
Landform (hillslope, terrace, etc.): Plains Local relief (concave, convex, none): Concave Slope (%): 1
Subregion (LRR): Lat: 47°38'13.47"N Long: 117°8'4.176"W Datum: NAD 83
Soil Map Unit Name: Semiahmoo muck, drained NWI classification:
Are climatic / hydrologic conditions on the site typical for this time of year? Yes ⌧ No (If no, explain in Remarks.)
Are Vegetation , Soil , Or Hydrology , significantly disturbed? Are “Normal Circumstances” present? Yes ⌧ No
Are Vegetation , Soil , Or Hydrology , naturally problematic? (If needed, explain any answers in Remarks.)
SUMMARY OF FINDINGS – Attach site map showing sampling point locations, transects, important features, etc. Hydrophytic Vegetation Present? Yes ⌧ No
Hydric Soil Present? Yes ⌧ No
Wetland Hydrology Present? Yes ⌧ No
Is the Sampling Area within a Wetland? Yes ⌧ No
Remarks:
Sampling point considered within a wetland area. Area dominated by emergent vegetation type. Small area located within farmed pasture inundated during high water events.

US Army Corps of Engineers Arid West - 11-1-06 Version
SOIL Sampling Point: SP-8 Profile Description: (Describe to the depth needed to document the indicator or confirm the absence of indicators.)
Depth Matrix Redox Features
(inches) Color (moist) % Color (Moist) % Type1 Loc2 Texture Remarks
0-3 10 YR 2/1 100 Loam
3-8 10 YR 2/1 100 Silt Loam
8-12 10 YR 2/2 100 Muck
1Type: C= Concentration, D=Depletion, RM=Reduced Matrix, 2Location: PL=Pore Lining, RC=Root Channel, M=Matrix.
Hydric Soil Indicators: (Applicable to all LRRs, unless otherwise noted.) Indicators for Problematic Hydric Soils3: Histosol (A1) Sandy Redox (S5) 1 cm Muck (A9) (LRR C)
Histic Epipedon (A2) Stripped Matrix (S6) 2 cm Muck (A10) (LRR B)
Black Histic (A3) Loamy Mucky Mineral (F1) Reduced Vertic (F18)
Hydrogen Sulfide (A4) Loamy Gleyed Matrix (F2) Red Parent Material (TF2)
Stratified Layers (A5) (LRR C) Depleted Matrix (F3) ⌧ Other (Explain in Remarks)
1 cm Muck (A9) (LRR D) Redox Dark Surface (F6)
Depleted Below Dark Surface (A11) Depleted Dark Surface (F7)
Thick Dark Surface (A12) Redox Depressions (F8)
Sandy Mucky Mineral (S1) Vernal Pools (F9)
Sandy Gleyed Matrix (S4) 3Indicators of hydrophytic vegetation and wetland hydrology must be present.
Restrictive Layer (if present):
Type:
Depth (Inches): Hydric Soils Present? Yes ⌧ No
Remarks: Area ponded or inundated for long period satisfying NRCS Hydric Soils Criteria # 4.
HYDROLOGY Wetland Hydrology Indicators:
Primary Indicators (any one indicator is sufficient) Secondary Indicators (2 or more required)
Surface Water (A1) Salt Crust (B11) ⌧ Water Marks (B1) (Riverine)
High Water Table (A2) Biotic Crust (B12) Sediment Deposits (B2) (Riverine) ⌧ Saturation (A3) Aquatic Invertebrates (B13) Drift Deposits (B3) (Riverine)
Water Marks (B1) (Nonriverine) Hydrogen Sulfide Odor (C1) Drainage Patterns (B10)
Sediment Deposits (B2) (Nonriverine) Oxidized Rhizospheres along Living Roots (C3) Dry-Season Water Table (C2)
Drift Deposits (B3) (Nonriverine) Presence of Reduced Iron (C4) Thin Muck Surface (C7)
Surface Soil Cracks (B6) Recent Iron Reduction in Tilled Soils (C6) Crayfish Burrows (C8)
Inundation Visible on Aerial Imagery (B7) Other (Explain in Remarks) Saturation Visible on Aerial Imagery (C9)
⌧ Water-Stained Leaves (B9) Shallow Aquitard (D3)
FAC-Neutral Test (D5)
Field Observations:
Surface Water Present? Yes No Depth (inches):
Water Table Present? Yes No Depth (inches):
Saturation Present? (includes capillary fringe) Yes ⌧ No Depth (inches): 0
Wetland Hydrology Present?
Yes
⌧
No
Describe Recorded Data (stream gauge, monitoring well, aerial photos, previous inspections), if available: Remarks: Hydrology indicator present with soils saturated to ground surface and indication of surface water earlier in the season.
Project Site: Saltese Flats

US Army Corps of Engineers Arid West – Version 11-1-2006
WETLAND DETERMINATION DATA FORM – Arid West Region
VEGETATION Tree Stratum (Use scientific names.) Absolute
% Cover Dominant Species?
Indicator Status Dominance Test Worksheet:
1. Popular sp. 70 Yes FAC
2. Number of Dominant Species That Are OBL, FACW, or FAC: 4 (A)
3.
4. Total Number of Dominant Species Across All Strata: 4 (B)
70 = Total Cover
Sapling/Shrub Stratum Percent of Dominant Species That Are OBL, FACW, or FAC: 100 (A/B)
1. Prevalence Index worksheet:
2. Total %Cover of : Multiply by:
3. OBL species x1 =
4. FACW species x2 =
5. FAC species x3 =
= Total Cover FACU species x4 =
Herb Stratum UPL species x5 =
1. Bidens cernua 40 Column Totals: (A) (B)
2. Juncus bufonius 20 Prevalence Index = B/A =
3. Phalaris arundinacea 20 Hydrophytic Vegetation Indicators:
4. Echinochloa crusgalli 10 X__ Dominance Test is >50%
5. Ranunculus sp. 5 Prevalence Index is <3.01 6.
7. Morphological Adaptations1 (Provide supporting data in
Remarks or on a separate sheet)
8. Problematic Hydrophytic Vegetation1 (Explain) 95 = Total Cover
Woody Vine Stratum
1. 1Indicators of hydric soil and wetland hydrology must be present.
2.
= Total Cover
% Bare Ground in Herb Stratum 5 % Cover of Biotic Crust Hydrophytic Vegetation Present? Yes ⌧ No
Remarks: Area dominated by hydrophytic vegetation.
Project Site: Saltese Flats City/County: Spokane Valley / Spokane Sampling Date: 9-23-08
Applicant/Owner: Spokane County State: WA Sampling Point: SP-9
Investigator(s): G. Howard Section, Township, Range: Section 29, T25N, R45E
Landform (hillslope, terrace, etc.): Plains Local relief (concave, convex, none): Concave Slope (%): 1
Subregion (LRR): Lat: 47°38'19.542"N Long: 117°7'54.996"W Datum: NAD 83
Soil Map Unit Name: Semiahmoo muck, drained NWI classification:
Are climatic / hydrologic conditions on the site typical for this time of year? Yes ⌧ No (If no, explain in Remarks.)
Are Vegetation , Soil , Or Hydrology , significantly disturbed? Are “Normal Circumstances” present? Yes ⌧ No
Are Vegetation , Soil , Or Hydrology , naturally problematic? (If needed, explain any answers in Remarks.)
SUMMARY OF FINDINGS – Attach site map showing sampling point locations, transects, important features, etc. Hydrophytic Vegetation Present? Yes ⌧ No
Hydric Soil Present? Yes ⌧ No
Wetland Hydrology Present? Yes ⌧ No
Is the Sampling Area within a Wetland? Yes ⌧ No
Remarks:
Sampling point considered within a wetland area. Area dominated by forested vegetation type.

US Army Corps of Engineers Arid West - 11-1-06 Version
SOIL Sampling Point: SP-9 Profile Description: (Describe to the depth needed to document the indicator or confirm the absence of indicators.)
Depth Matrix Redox Features
(inches) Color (moist) % Color (Moist) % Type1 Loc2 Texture Remarks
0-6 10 YR 2/1 100 Loam
6-12+ 10 YR 2/2 100 Muck
1Type: C= Concentration, D=Depletion, RM=Reduced Matrix, 2Location: PL=Pore Lining, RC=Root Channel, M=Matrix.
Hydric Soil Indicators: (Applicable to all LRRs, unless otherwise noted.) Indicators for Problematic Hydric Soils3: Histosol (A1) Sandy Redox (S5) 1 cm Muck (A9) (LRR C)
Histic Epipedon (A2) Stripped Matrix (S6) 2 cm Muck (A10) (LRR B)
Black Histic (A3) Loamy Mucky Mineral (F1) Reduced Vertic (F18)
Hydrogen Sulfide (A4) Loamy Gleyed Matrix (F2) Red Parent Material (TF2)
Stratified Layers (A5) (LRR C) Depleted Matrix (F3) ⌧ Other (Explain in Remarks)
1 cm Muck (A9) (LRR D) Redox Dark Surface (F6)
Depleted Below Dark Surface (A11) Depleted Dark Surface (F7)
Thick Dark Surface (A12) Redox Depressions (F8)
Sandy Mucky Mineral (S1) Vernal Pools (F9)
Sandy Gleyed Matrix (S4) 3Indicators of hydrophytic vegetation and wetland hydrology must be present.
Restrictive Layer (if present):
Type:
Depth (Inches): Hydric Soils Present? Yes ⌧ No
Remarks: Area ponded or inundated for long period satisfying NRCS Hydric Soils Criteria # 4.
HYDROLOGY Wetland Hydrology Indicators:
Primary Indicators (any one indicator is sufficient) Secondary Indicators (2 or more required)
Surface Water (A1) Salt Crust (B11) ⌧ Water Marks (B1) (Riverine)
High Water Table (A2) Biotic Crust (B12) Sediment Deposits (B2) (Riverine) ⌧ Saturation (A3) Aquatic Invertebrates (B13) Drift Deposits (B3) (Riverine)
Water Marks (B1) (Nonriverine) Hydrogen Sulfide Odor (C1) Drainage Patterns (B10)
Sediment Deposits (B2) (Nonriverine) Oxidized Rhizospheres along Living Roots (C3) Dry-Season Water Table (C2)
Drift Deposits (B3) (Nonriverine) Presence of Reduced Iron (C4) Thin Muck Surface (C7)
Surface Soil Cracks (B6) Recent Iron Reduction in Tilled Soils (C6) Crayfish Burrows (C8)
Inundation Visible on Aerial Imagery (B7) Other (Explain in Remarks) Saturation Visible on Aerial Imagery (C9)
⌧ Water-Stained Leaves (B9) Shallow Aquitard (D3)
FAC-Neutral Test (D5)
Field Observations:
Surface Water Present? Yes No Depth (inches):
Water Table Present? Yes No Depth (inches):
Saturation Present? (includes capillary fringe) Yes ⌧ No Depth (inches):
Wetland Hydrology Present?
Yes
⌧
No
Describe Recorded Data (stream gauge, monitoring well, aerial photos, previous inspections), if available: Remarks: Hydrology indicator present with soils saturated to ground surface and indication of surface water earlier in the season.
Project Site: Saltese Flats

PP1. View looking south along conveyance system for irrigation returns and fluctuating surface waters within Saltese Flats. Emergent vegetation type dominated by reed canarygrass.
PP2. View looking south along the fringe of Graham Pond at areas dominated by emergent vegetation. Photo view shows vegetation break between areas inundated for a majority of the season along pond fringe and zone of reed canarygrass receiving less inundation.
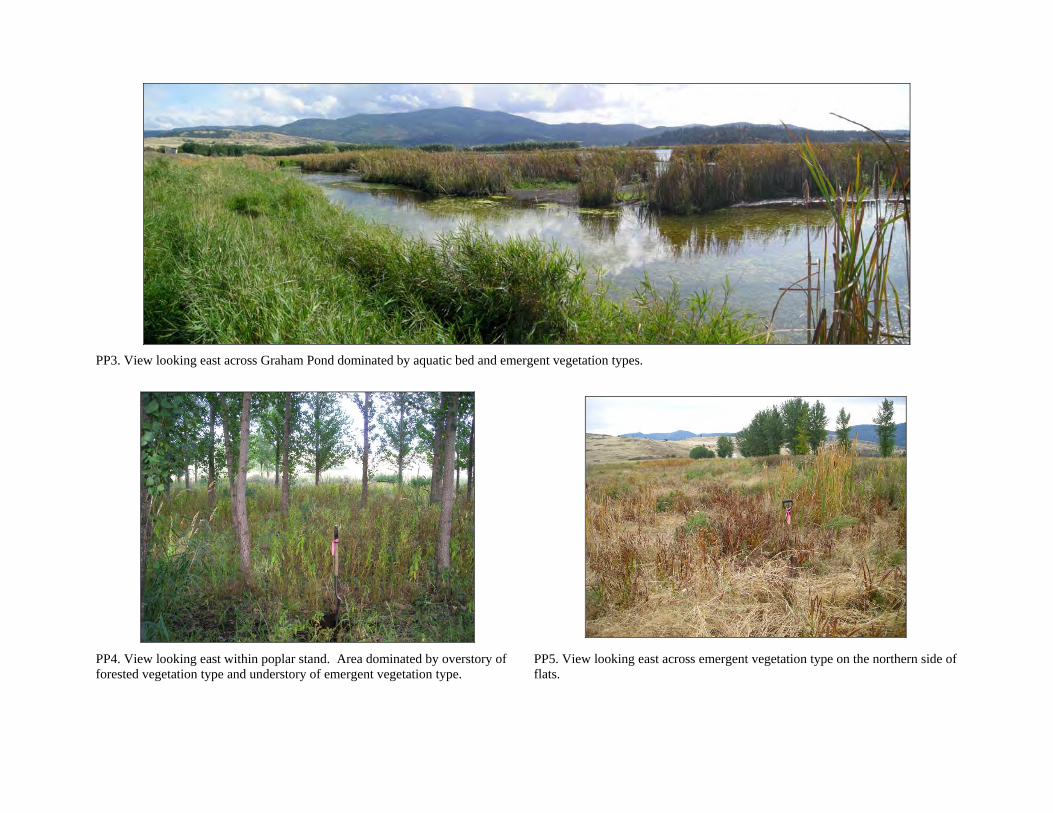
PP3. View looking east across Graham Pond dominated by aquatic bed and emergent vegetation types.
PP4. View looking east within poplar stand. Area dominated by overstory of forested vegetation type and understory of emergent vegetation type.
PP5. View looking east across emergent vegetation type on the northern side of flats.

PP6. View looking south across emergent vegetation type dominated by bulrush.
PP7. View looking east across emergent vegetation type located in farmed pasture dominated by barnyard grass.
PP8. View looking show across emergent vegetation type within farmed pasture.

PP9. View looking southwest along the Morrison Diversion. Area dominated by aquatic bed and emergent vegetation types.
PP9. View looking southeast across the area upstream of the Morrison Diversion. Area dominated by aquatic bed and emergent vegetation types.

Data Update and On-Site Feasibility Report Saltese Flats Wetland Restoration Investigation
January 2010 .00
Appendix F Surface Water Levels and Discharge Data and
Groundwater Elevation Data

Data Update and On-Site Feasibility Report Saltese Flats Wetland Restoration Investigation
January 2010 F-1
Table F-1. Surface Water Stage and Discharge Data Sites Above Saltese Flats
Site:Name: C-1 C-2 C-3 C-4 C-5Elev1:
Date Stage Elev Disch. Stage Elev Disch. Stage Elev Disch. Stage Elev Disch. Disch. Disch. Disch. Disch. Disch.
07/31/08 ----- ----- >0 ----- ----- >0 ----- ----- >0 ----- ----- 0 0 0 0 0 011/03/08 0.42 2075.42 0.04 0.40 2165.40 0.10 0.49 2155.49 0.09 ----- ----- abt 0.01 0 0 0 0 011/18/08 0.51 2075.51 NA2 0.37 2165.37 0.09 0.53 2155.53 0.08 1.04 2061.04 0.63 0 0 0 0 001/08/09 ----- ----- ----- 0.52 2165.52 0.63 Frzn ----- ----- NM ----- ----- NM NM NM NM NM01/12/09 0.99 2075.99 0.60 0.40 2165.40 0.25 0.57 2155.57 0.52 1.40 2061.40 1.81 NM NM NM NM NM04/21/09 1.54 2076.54 NA 0.78 2165.78 4.10 1.10 2156.10 5.00 1.28 2061.28 1.52 NM3 NM NM NM NM04/26/09 NM ----- NA 0.66 2165.66 2.80 1.04 2156.04 4.50 NM ----- ----- NM3 NM3 0 0 004/29/09 NM ----- NA 0.62 2165.62 1.75 0.98 2155.98 4.25 NM ----- ----- NM NM NM NM NM05/05/09 1.28 2076.28 3.40 0.64 2165.64 2.37 0.96 2155.96 4.15 1.26 2061.26 1.46 NM NM NM NM NM06/06/09 NM ----- NA 0.58 2165.58 0.99 0.68 2155.68 2.38 NM ----- ----- NM NM NM NM NM06/10/09 0.68 2075.68 1.32 0.58 2165.58 0.99 0.61 2155.61 1.86 0.78 2060.78 0.37 NM NM NM NM NM
Sites On Saltese Flats
Site:Name:Elev1:
Date Stage Elev Disch. Stage Elev Disch. Stage Elev Disch. Stage Elev Disch. Stage Elev
07/31/08 ----- ----- ----- ----- ----- ----- ----- ----- ----- ----- ----- ----- NM -----11/03/08 ----- ----- ----- ----- ----- ----- ----- ----- ----- ----- ----- ----- NM -----11/18/08 2.28 2040.28 ----- 0.75 2038.75 ----- ----- ----- ----- ----- ----- ----- 1.87 2041.8701/08/09 NM ----- NA NM ----- NA ----- ----- ----- ----- ----- ----- NM -----01/12/09 2.92 2040.92 NA 3.32 2041.32 NA ----- ----- ----- ----- ----- ----- 3.24 2043.2404/21/09 1.30 2039.3 NA 2.26 2040.26 NA ----- ----- ----- ----- ----- ----- NM4 -----04/26/09 NM ----- NA NM ----- NA ----- ----- ----- ----- ----- ----- NM4 -----04/29/09 NM ----- NA NM ----- NA ----- ----- ----- ----- ----- ----- NM4 -----05/05/09 2.45 2040.45 NA 2.20 2040.2 NA ----- ----- ----- ----- ----- ----- NM4 -----06/06/09 NM ----- NA NM ----- NA ----- ----- ----- ----- ----- ----- NM -----06/10/09 NA NA ----- ----- ----- ----- ----- ----- NM -----
Sites Below Saltese Flats
Site: SL-1Name: ShelleyElev1: Lake
Date Stage Elev Disch. Stage Elev Disch. Stage
07/31/08 ----- ----- 0 ----- ----- 0 See Stage in ft, elevation in ft MSL, discharge in cfs11/03/08 ----- ----- 0 ----- ----- 0 Separate Bold discharge values are actual measurements, others from rating curves11/18/08 0.60 2040.60 0 ----- ----- 0 Table Shaded value beyond curve limts, discharge estimated01/08/09 2.95 2042.95 NA ----- ----- NM ----- Gage not installed or elevation not available01/12/09 3.02 2043.02 NA 0.74 2017.74 7.90 NA Discharge Not Available (curve not yet established)04/21/09 1.66 2041.66 NA 0.90 2017.90 11.8 NM Not measured or site not visited04/26/09 1.48 2041.48 NA 0.80 2017.80 9.60 1 Survey elevations in italics are estimated from USGS Topo Map04/29/09 1.40 2041.40 NA 0.70 2017.70 6.68 2 Gage removed, reinstalled 1/12/0905/05/09 1.00 2041.00 3.32 0.56 2017.56 2.64 3 Not measured but flowing06/06/09 0.99 2040.99 NA 0.36 2017.36 0.45 4 Gage completely submerged06/10/09 0.50 2040.50 NA 0.32 2017.32 0.07
NA NA
QC-1 MP-1
SC-5SC-4
Quinnamose Creek Morrison Pond
2040
2017
GP-1
2075
2040
2165 2155 2060
2038 2038
Saltese Creek at Church Saltese Creek at Steen Rd
Saltese Creek Inlet Unnamed Tributary
SC-7SC-6
SC-2 SC-3
Culverts on East side of Saltese Flats
Graham PondFar West Channel West Channel Central Channel East Channel
UT-1SC-1

Data Update and On-Site Feasibility Report Saltese Flats Wetland Restoration Investigation
January 2010 F-2
0
0.2
0.4
0.6
0.8
1
1.2
1.4
1.6
1.8
2
0 0.1 0.2 0.3 0.4 0.5 0.6 0.7 0.8 0.9 1 1.1 1.2 1.3 1.4 1.5
Gage Height (ft)
Q (c
fs)
Gage MP-1Rating Curve
0.0
0.4
0.8
1.2
1.6
2.0
2.4
2.8
3.2
3.6
4.0
4.4
4.8
0.00 0.10 0.20 0.30 0.40 0.50 0.60 0.70 0.80 0.90 1.00 1.10
Gage Height (ft)
Q (c
fs)
Gage QC-1Rating Curve

Data Update and On-Site Feasibility Report Saltese Flats Wetland Restoration Investigation
January 2010 F-3
0
1
2
3
4
5
6
7
8
9
10
0.00 0.05 0.10 0.15 0.20 0.25 0.30 0.35 0.40 0.45 0.50 0.55 0.60 0.65 0.70 0.75 0.80 0.85 0.90
Gage Height (ft)
Q (c
fs)
Gage SC-7Rating Curve
0.0
0.2
0.4
0.6
0.8
1.0
1.2
1.4
1.6
1.8
2.0
2.2
2.4
2.6
2.8
3.0
0.00 0.05 0.10 0.15 0.20 0.25 0.30 0.35 0.40 0.45 0.50 0.55 0.60 0.65 0.70 0.75
Gage Height (ft)
Q (c
fs)
Gage UT-1Rating Curve

Data Update and On-Site Feasibility Report Saltese Flats Wetland Restoration Investigation
Table F-2. Groundwater Depth to Water and Elevation Data
Saltese Flats Shallow Well Monitoring Data
Well:Ground Elev:
TOC Elev:Date DTW1 Elev2 DTW1 Elev2 DTW1 Elev2 DTW1 Elev2 DTW1 Elev2 DTW1 Elev2 DTW1 Elev2
11/21/08 Dry ---- 3.46 2041.96 3.84 2039.57 4.76 2036.42 3.81 2038.57 4.07 2040.07 1.75 2042.9701/31/09 4.20 2038.16 3.10 2042.32 2.35 2041.06 2.05 2039.13 1.95 2040.43 1.21 2042.93 0.92 2043.8004/21/09 2.01 2040.35 ---- ---- 1.67 2041.74 0.32 2040.86 ---- ---- ---- ---- 0.87 2043.8505/02/09 3.32 2039.04 2.39 2043.03 1.92 2041.49 0.96 2040.22 0.96 2041.42 0.61 2043.53 0.66 2044.0606/23/09 2.72 2039.64 ---- ---- 2.91 2040.50 1.47 2039.71 2.91 2039.47 1.21 2042.93 ---- ----
Well:Ground Elev:
TOC Elev:Date DTW1 Elev2 DTW1 Elev2 DTW1 Elev2 DTW1 Elev2 DTW1 Elev2 DTW1 Elev2 DTW1 Elev2
11/21/08 4.82 2035.84 3.43 2036.52 4.02 2036.61 4.27 2036.18 3.54 2039.55 3.77 2040.57 3.41 2042.5601/31/09 1.82 2038.84 1.15 2038.80 3.11 2037.52 1.90 2038.55 1.77 2041.32 2.17 2042.17 1.67 2044.3004/21/09 ---- ---- ---- ---- ---- ---- ---- ---- 1.07 2042.02 ---- ---- ---- ----05/02/09 0.55 2041.81 0 2039.95 0.82 2042.59 1.18 2040.00 1.46 2040.92 2.71 2041.43 1.51 2043.2106/23/09 1.79 2040.57 0.42 2039.53 2.35 2041.06 ---- ---- 2.73 2039.65 2.33 2041.81 1.82 2042.90
1 Depth to water from ground surface2 Groundwater elevation in ft above mean sea level
2042.06
SFW-22045.422045.11
2040.662040.19
SFW-52042.382041.97
SFW-32043.412042.98
SFW-42041.18
SFW-72044.722044.34
SFW-8
SFW-62044.142043.722040.99
SFW-12042.36
SFW-92039.952039.65
SFW-102040.632040.42
SFW-112040.452040.09
SFW-122043.092042.77
SFW-132044.342043.82
SFW-142045.972045.60
January 2010 F-4

Data Update and On-Site Feasibility Report Saltese Flats Wetland Restoration Investigation
January 2010 .00
Appendix G Water Budget Scenarios

Data Update and On-Site Feasibility Report Saltese Flats Wetland Restoration Investigation
January 2010 G-1
Table G-1. Water Budget: Mean Values
Saltese Average Climate Conditions-Mean Values
Inputs Value Inputs Value
Area (Sq. Miles) 10.0 21.9 Aquifer Input X-Sec (ft2) 5000Basin Relief (x10^3 feet) 3 Aquifer Input Gradient 0.01Basin Slope 0.14 Aquifer Input K (ft/day) 20Mean PPT (inches) 19 Aquifer Output X-Sec (ft2) 80000Mean Basin elevation (x10^3 feet) 2.7 Aquifer Output Gradient 0.005% elevation >6000 ft 0 Aquifer Output K (ft/day) 100Basin Perimeter (miles) 10.0 Aquifer Vertical Leak K (ft/day) 0.0005Project Area (acres) 720
Yellow = Inputs Blue = Fixed or Calculated 21.7
Sum Sum Change Change SurfacePrecip GW Streamflow Inputs GW Leakage GW Flux Outputs Groundwater Storage Water
Month (in/mo) (ac-ft) (cfs) (ac-ft) ET (in/mo) (ac-ft/mo) (ac-ft/mo) (ac-ft) (ft) (ac-ft) % (ac-ft) (cfs)
1 2.35 0.69 0.79 189 0 10.8 27.5 38.3 0.00 0.0 100% 151 2.452 1.82 0.69 0.62 147 0 10.8 27.5 38.3 0.00 0.0 100% 109 1.773 1.63 0.69 0.92 153 0 10.8 27.5 38.3 0.50 144.0 100% -29 -0.474 1.31 0.69 11.93 795 3.73 10.8 27.5 262.0 1.00 288.0 100% 245 3.995 1.68 0.69 15.30 1020 5.82 10.8 27.5 387.3 1.50 432.0 100% 200 3.266 1.43 0.69 6.12 454 6.86 10.8 27.5 449.7 0.50 144.0 100% -140 -2.287 0.65 0.69 3.16 229 9.02 10.8 27.5 579.8 -1.00 -288.0 100% -63 -1.028 0.74 0.69 1.81 154 8.18 10.8 27.5 528.9 -1.00 -288.0 100% -87 -1.419 0.93 0.69 1.37 139 5.13 10.8 27.5 346.0 -0.75 -216.0 100% 9 0.1410 1.38 0.69 1.99 203 0 10.8 27.5 38.3 -0.50 -144.0 100% 309 5.0211 2.48 0.69 1.12 216 0 10.8 27.5 38.3 -0.25 -72.0 100% 250 4.0712 2.61 0.69 0.82 206 0 10.8 27.5 38.3 0.00 0.0 100% 168 2.73
Average 1.58 0.69 3.83 325.5 3.2 10.8 27.5 232.0 0.0 0.0 93.5 1.5Sum 19 8.3 45.95 3905.4 38.7 129.6 330.6 2783.9 0.0 0.0 1121.6 18.2
Ac-ft/yr 1140 8.3 2720 3905.4 2324 129.6 330.6 2783.9 1084.9
Inputs OutputsNet

Data Update and On-Site Feasibility Report Saltese Flats Wetland Restoration Investigation
January 2010 G-2
Table G-2. Water Budget: Dry (q90)
Saltese Average Climate Conditions-Dry (q90)
Inputs Value Inputs Value
Area (Sq. Miles) 10.0 21.9 Aquifer Input X-Sec (ft2) 5000Basin Relief (x10^3 feet) 3 Aquifer Input Gradient 0.01Basin Slope 0.14 Aquifer Input K (ft/day) 20Mean PPT (inches) 19 Aquifer Output X-Sec (ft2) 80000Mean Basin elevation (x10^3 feet) 2.7 Aquifer Output Gradient 0.005% elevation >6000 ft 0 Aquifer Output K (ft/day) 100Basin Perimeter (miles) 10.0 Aquifer Vertical Leak K (ft/day) 0.0005Project Area (acres) 720
Yellow = InputsBlue = Fixed or Calculated
Sum Sum Change Change SurfacePrecip GW Streamflow Inputs ET GW Leakage GW Flux Outputs Groundwater Storage Water
Month (in/mo) (ac-ft) (cfs) (ac-ft) (in/mo) (ac-ft/yr) (ac-ft/mo) (ac-ft) (ft) (ac-ft) % (ac-ft) (cfs)
1 1.61 0.69 0.35 118.3 0 10.8 27.5 38.3 0.00 0.0 100% 80 1.302 1.24 0.69 0.37 97.6 0 10.8 27.5 38.3 0.00 0.0 100% 59 0.963 1.11 0.69 0.46 95.2 0 10.8 27.5 38.3 0.50 144.0 100% -87 -1.424 0.90 0.69 2.76 219.9 3.73 10.8 27.5 262.0 1.00 288.0 100% -330 -5.375 1.15 0.69 3.21 262.0 5.82 10.8 27.5 387.3 1.50 432.0 100% -557 -9.066 0.98 0.69 2.14 187.6 6.86 10.8 27.5 449.7 0.50 144.0 100% -406 -6.607 0.44 0.69 0.98 86.3 9.02 10.8 27.5 579.8 -1.00 -288.0 100% -205 -3.348 0.51 0.69 0.65 70.3 8.18 10.8 27.5 528.9 -1.00 -288.0 100% -171 -2.789 0.64 0.69 0.53 71.0 5.13 10.8 27.5 346.0 -0.75 -216.0 100% -59 -0.9610 0.94 0.69 0.91 111.7 0 10.8 27.5 38.3 -0.50 -144.0 100% 217 3.5411 1.70 0.69 0.77 148.9 0 10.8 27.5 38.3 -0.25 -72.0 100% 183 2.9712 1.78 0.69 0.55 140.8 0 10.8 27.5 38.3 0.00 0.0 100% 102 1.67
Average 1.08 0.69 1.14 134.1 3.2 10.8 27.5 232.0 0.0 0.0 -98 -1.6Sum 13 8.26 13.69 1609.6 38.7 129.6 330.6 2783.9 0.0 0.0 -1174 -19.1
(ac-ft-yr) 780 8.26 797 1609.6 2324 129.6 330.6 2783.9
Inputs OutputsNet

Data Update and On-Site Feasibility Report Saltese Flats Wetland Restoration Investigation
January 2010 G-3
Table G-3. Water Budget: Wet (q10)
Saltese Average Climate Conditions-Wet (q10)
Inputs Value Inputs Value
Area (Sq. Miles) 21.0 21.9 Aquifer Input X-Sec (ft2) 5000Basin Relief (x10^3 feet) 3 Aquifer Input Gradient 0.01Basin Slope 0.14 Aquifer Input K (ft/day) 20Mean PPT (inches) 19 Aquifer Output X-Sec (ft2) 80000Mean Basin elevation (x10^3 feet) 2.7 Aquifer Output Gradient 0.005% elevation >6000 ft 0 Aquifer Output K (ft/day) 100Basin Perimeter (miles) 21.0 Aquifer Vertical Leak K (ft/day) 0.0005Project Area (acres) 720
Yellow = InputsBlue = Fixed or Calculated
Sum Sum Change Change SurfacePrecip GW Streamflow Inputs ET GW Leakage GW Flux Outputs Groundwater Storage Water
Month (in/mo) (ac-ft) (cfs) (ac-ft) (in/mo) (ac-ft/mo) (ac-ft/mo) (ac-ft) (ft) (ac-ft) % (ac-ft) (cfs) (cfs) (ac-ft)
1 3.34 0.69 2.61 357.6 0 10.8 27.5 38.3 0.00 0.0 100% 319.3 5.19 5.19 3122 2.58 0.69 2.00 275.6 0 10.8 27.5 38.3 0.00 0.0 100% 237.3 3.86 3.86 2323 2.31 0.69 3.19 331.1 0 10.8 27.5 38.3 0.50 360.0 100% 292.7 4.76 4.76 2864 1.86 0.69 52.11 3238.7 3.73 10.8 27.5 262.0 1.00 720.0 100% 2256.7 36.70 71.27 42765 2.38 0.69 67.14 4171.8 5.82 10.8 27.5 387.3 1.50 1080.0 100% 2704.5 43.99 84.74 50846 2.03 0.69 23.01 1503.1 6.86 10.8 27.5 449.7 0.50 360.0 100% 693.4 11.28 39.22 23537 0.92 0.69 15.21 968.9 9.02 10.8 27.5 579.8 -1.00 -720.0 100% 1109.1 18.04 28.15 16898 1.06 0.69 8.92 599.1 8.18 10.8 27.5 528.9 -1.00 -720.0 100% 790.1 12.85 22.83 13709 1.32 0.69 6.53 471.9 5.13 10.8 27.5 346.0 -0.75 -540.0 100% 665.8 10.83 23.76 1426
10 1.96 0.69 6.46 506.0 0 10.8 27.5 38.3 -0.50 -360.0 100% 827.6 13.46 29.46 176711 3.52 0.69 2.87 384.0 0 10.8 27.5 38.3 -0.25 -180.0 100% 525.7 8.55 8.55 51312 3.71 0.69 2.22 356.3 0 10.8 27.5 38.3 0.00 0.0 100% 317.9 5.17 5.17 310
Average 2.25 0.69 16.02 1097.0 3.2 10.8 27.5 232.0 0.0 0.0 895.0 14.6 36.22 2173Sum 27 8.26446281 192.27 13164.2 38.7 129.6 330.6 2783.9 0.0 0.0 10740.4 174.7 196.34 11780
(ac-ft-yr) 1620 8.26 11436 13164.2 2324 129.6 330.6 2783.9
Inputs OutputsNet Augmented
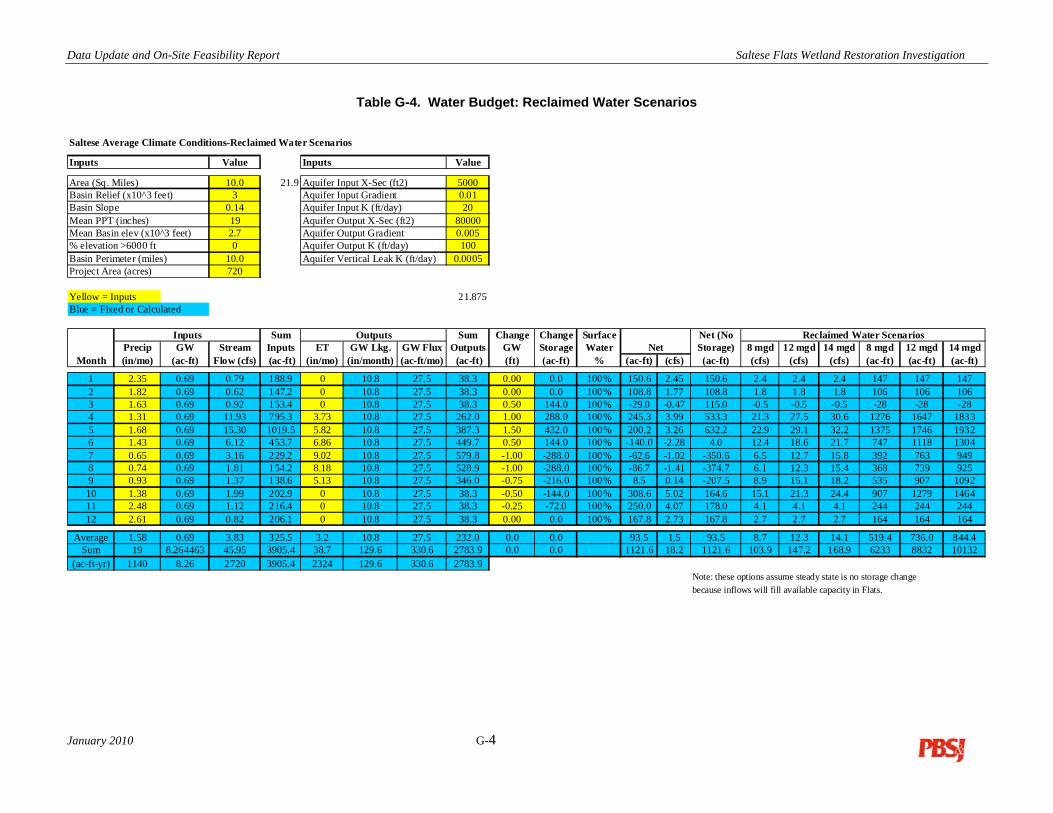
Data Update and On-Site Feasibility Report Saltese Flats Wetland Restoration Investigation
January 2010 G-4
Table G-4. Water Budget: Reclaimed Water Scenarios
Saltese Average Climate Conditions-Reclaimed Water Scenarios
Inputs Value Inputs Value
Area (Sq. Miles) 10.0 21.9 Aquifer Input X-Sec (ft2) 5000Basin Relief (x10^3 feet) 3 Aquifer Input Gradient 0.01Basin Slope 0.14 Aquifer Input K (ft/day) 20Mean PPT (inches) 19 Aquifer Output X-Sec (ft2) 80000Mean Basin elev (x10^3 feet) 2.7 Aquifer Output Gradient 0.005% elevation >6000 ft 0 Aquifer Output K (ft/day) 100Basin Perimeter (miles) 10.0 Aquifer Vertical Leak K (ft/day) 0.0005Project Area (acres) 720
Yellow = Inputs 21.875Blue = Fixed or Calculated
Sum Sum Change Change Surface Net (NoPrecip GW Stream Inputs ET GW Lkg. GW Flux Outputs GW Storage Water Storage) 8 mgd 12 mgd 14 mgd 8 mgd 12 mgd 14 mgd
Month (in/mo) (ac-ft) Flow (cfs) (ac-ft) (in/mo) (in/month) (ac-ft/mo) (ac-ft) (ft) (ac-ft) % (ac-ft) (cfs) (ac-ft) (cfs) (cfs) (cfs) (ac-ft) (ac-ft) (ac-ft)
1 2.35 0.69 0.79 188.9 0 10.8 27.5 38.3 0.00 0.0 100% 150.6 2.45 150.6 2.4 2.4 2.4 147 147 1472 1.82 0.69 0.62 147.2 0 10.8 27.5 38.3 0.00 0.0 100% 108.8 1.77 108.8 1.8 1.8 1.8 106 106 1063 1.63 0.69 0.92 153.4 0 10.8 27.5 38.3 0.50 144.0 100% -29.0 -0.47 115.0 -0.5 -0.5 -0.5 -28 -28 -284 1.31 0.69 11.93 795.3 3.73 10.8 27.5 262.0 1.00 288.0 100% 245.3 3.99 533.3 21.3 27.5 30.6 1276 1647 18335 1.68 0.69 15.30 1019.5 5.82 10.8 27.5 387.3 1.50 432.0 100% 200.2 3.26 632.2 22.9 29.1 32.2 1375 1746 19326 1.43 0.69 6.12 453.7 6.86 10.8 27.5 449.7 0.50 144.0 100% -140.0 -2.28 4.0 12.4 18.6 21.7 747 1118 13047 0.65 0.69 3.16 229.2 9.02 10.8 27.5 579.8 -1.00 -288.0 100% -62.6 -1.02 -350.6 6.5 12.7 15.8 392 763 9498 0.74 0.69 1.81 154.2 8.18 10.8 27.5 528.9 -1.00 -288.0 100% -86.7 -1.41 -374.7 6.1 12.3 15.4 368 739 9259 0.93 0.69 1.37 138.6 5.13 10.8 27.5 346.0 -0.75 -216.0 100% 8.5 0.14 -207.5 8.9 15.1 18.2 535 907 109210 1.38 0.69 1.99 202.9 0 10.8 27.5 38.3 -0.50 -144.0 100% 308.6 5.02 164.6 15.1 21.3 24.4 907 1279 146411 2.48 0.69 1.12 216.4 0 10.8 27.5 38.3 -0.25 -72.0 100% 250.0 4.07 178.0 4.1 4.1 4.1 244 244 24412 2.61 0.69 0.82 206.1 0 10.8 27.5 38.3 0.00 0.0 100% 167.8 2.73 167.8 2.7 2.7 2.7 164 164 164
Average 1.58 0.69 3.83 325.5 3.2 10.8 27.5 232.0 0.0 0.0 93.5 1.5 93.5 8.7 12.3 14.1 519.4 736.0 844.4Sum 19 8.264463 45.95 3905.4 38.7 129.6 330.6 2783.9 0.0 0.0 1121.6 18.2 1121.6 103.9 147.2 168.9 6233 8832 10132
(ac-ft-yr) 1140 8.26 2720 3905.4 2324 129.6 330.6 2783.9Note: these options assume steady state is no storage changebecause inflows will fill available capacity in Flats.
Inputs OutputsNet
Reclaimed Water Scenarios