Embed Size (px)
Citation preview
Data tools to support the RCSEng Right Care Commissioning Guidance

Copyright 2014 Right Care
Simon Swift
Methods
Director of Insight Analytics
Commissioning for Value
Data tools to support the RCSEng Right Care Commissioning Guidance
Online Learning Series
Right Care for Populations

Our roleCreated and maintaining web tools and technical documents
Working with each GDG to:
• Understand scope of guidance• Agreeing procedures• Creating hierarchy• Drafting technical definition• Creating draft data• Review• Finalise• Publish

Mantra
Data
Information ActionableKnowledge ChangeAnalysis Interpretation Decision
Evidence

• Are you different?• Do you know why?• What does it mean?• Are you comfortable being different?
Approach: Questioning variation
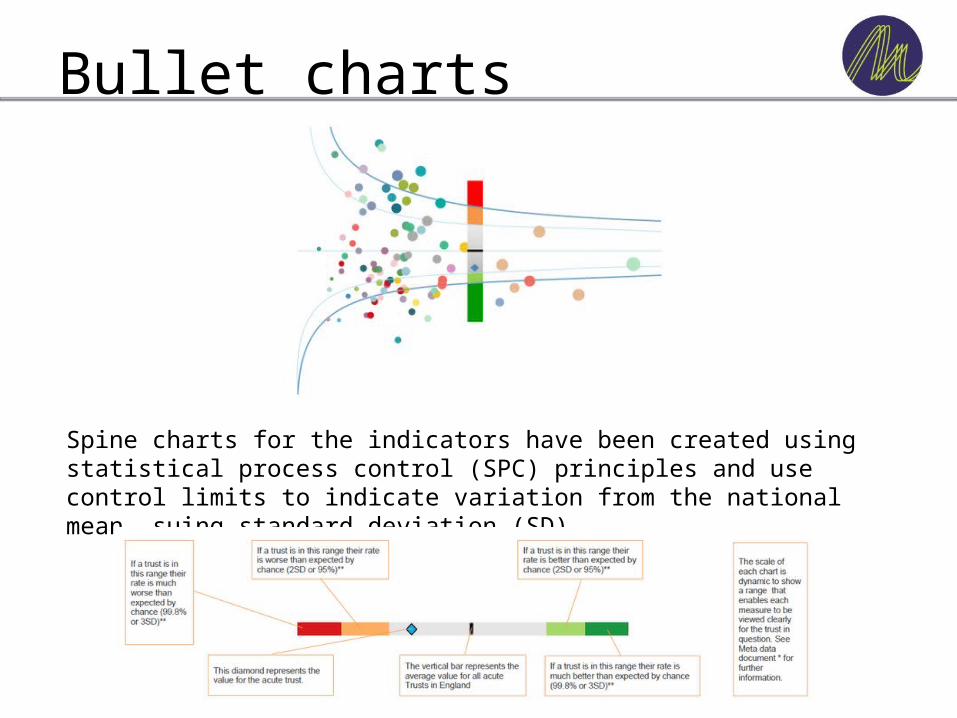
Bullet charts
Spine charts for the indicators have been created using statistical process control (SPC) principles and use control limits to indicate variation from the national mean, suing standard deviation (SD)
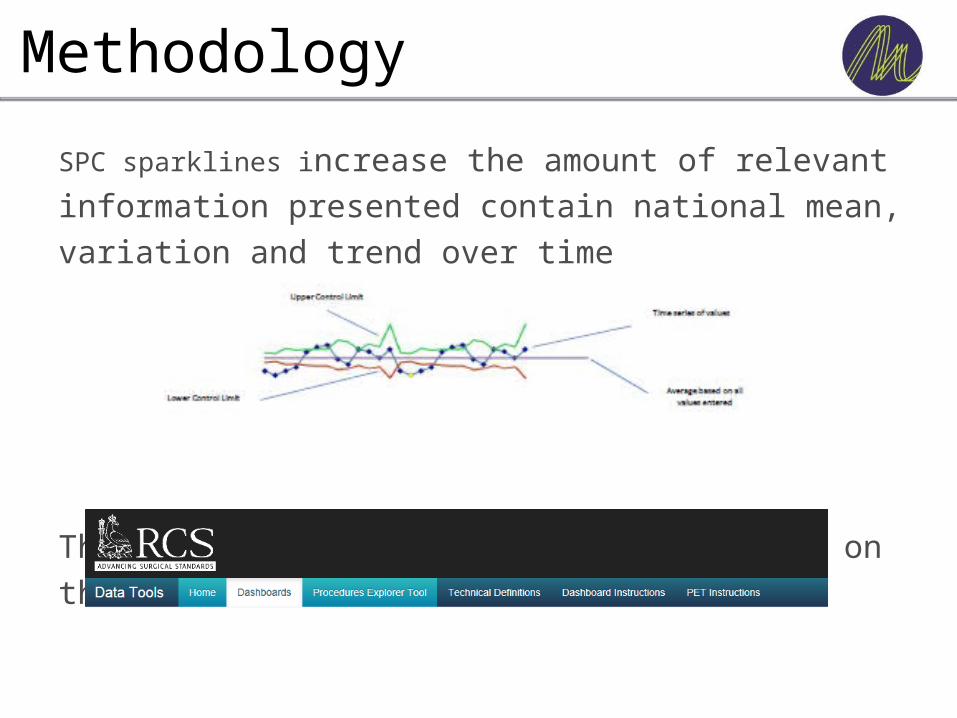
SPC sparklines increase the amount of relevant information presented contain national mean, variation and trend over time
The full technical guidance is available on the web page:
Methodology

Interpretation
A value that lies outside of the two SD (95%) control limits can be considered as an ‘alert’. Values that lie outside 3SD (99.8%) can be viewed as ‘alarms’.
A dashboard is the tin opener for a conversation, it is not a test. The data is the starting point and should not be arbitrarily used for performance management without local interpretation.

The data is wrong
DENIAL
It does not apply to me
ANGER
I will get the correct data
BARGAINING
There is nothing I can do about it
DEPRESSION
Acceptance and action
RESOLUTION
Adapted from Elisabeth Kübler-Ross 5 stage model
(Though more modern grief theories such as that of John Bowlby described as ‘ebb and flow of processes such as shock and numbness, yearning and searching, disorganization and despair, and reorganization’ have some attraction)
The five stages of grief

DATA TOOLS

Dashboards• Purpose
– Initial view by CCG of a core set of activity and output measures for each group in the guidance hierarchy
• Structure– Standard layout using SPC rules showing value, mean, national control
limits and trend
• Accessibility– Public
http://www.rcseng.ac.uk/providers-commissioners/nscc/data-tools
Procedures Explorer Tool• Purpose
– Enable users to interact with the data to ask questions and understand both commissioner and provider variation
• Structure– Standard tool for all guidance sets, with the same metrics as
dashboards• Variation view• Commissioner view• Provider view
• Accessibility– Publichttp://www.rcseng.ac.uk/providers-commissioners/nscc/data-tools
13
Online Learning Series
Right Care for Populations
Follow Right Care online•Subscribe to get a weekly digest of our blog alerts in your inbox, •Receive occasional eBulletins •Follow us on Twitter @qipprightcare
Find the full series at:
www.rightcare.nhs.uk/resourcecentre
Commissioning Guidance and Tools on RCS website
http://www.rcseng.ac.uk/healthcare-bodies/nscc