Embed Size (px)
Citation preview

DATA TELLS A STORY IMPROVING OUR ACADEMIC PLANS FOR SUCCESSFUL COLLEGE COURSE-TAKING IN HIGH SCHOOL
Elisabeth Barnett and Jennifer Kim, NCREST Teachers College, Columbia University March 2014 MEMCA Winter Conference Meeting

NCREST
• National Center for Restructuring Education, Schools and Teaching
• Focused on school
change, mainly in high schools
• Our team – college/high school partnership programs, especially Early Colleges
Related projects:
• MCNC – Middle College National Consortium schools
• MEMCA – Michigan Early Middle College Association schools
• MEMPHIS – District Early College initiative
• NEW YORK – Smart Scholars initiative
• BARD – High School Early College model
• SECEP – STEM Early College Expansion Project (I3 Grant: Michigan, Connecticut)
2 NCREST

Session Overview Your dual role:
• Continuous LEARNERS: Reflect on improving your own programs • Practitioner EXPERTS: Apply your school-based knowledge to
recommend best practices and strategies
Agenda • Data tells a story • Improving our academic plans • Breakout groups • Come back together (Wrap-up)
3 NCREST

MEMCA Conference Interest
45
60 65 65
90
112
0
20
40
60
80
100
120
2011-12Aug
2011-12Mar
2012-13Aug
2012-13Mar
2013-14Aug
2013-14Mar
Num
ber o
f reg
istr
ants
MEMCA Conference Meetings
4 NCREST

NCREST Data Workshops • Using data reports for school improvement and communication • Break out groups
Aug 2013 Data reports workshop
• Academic preparedness • College knowledge • Academic tenacity
Mar 2013 Early intervention system
• Full set of 3 core data reports • School Fact Sheets
Aug 2012 College going culture and
career readiness
• Data audiences (classroom, school, external) • Selecting relevant data points • Pecha Kucha presentations
Mar 2012 Using data to tell our
program story
• College readiness - David Conley framework • Contextual skills/awareness, Academic behaviors, Key content,
Cognitive strategies
Aug 2011 What our data say about
college readiness
5 NCREST

The Early College Data Project
Who is participating (2013-14)?
• MCNC (23 schools)
• MEMCA (Michigan) • 11 Original Data
Project Schools • 6-9 New Tech Schools
Core data activities:
• Data collection • School profile • College data • Student voices
• Data-informed decision making
• Internal and external audiences • Regular data conversations • Building capacity
6 NCREST

MEMCA Data Schools
11 Data
Project Schools
12 11 11
6 New Tech Data
Schools
0
5
10
15
20
2010-11(Pilot Year)
2011-12 2012-13 2013-14
7 NCREST
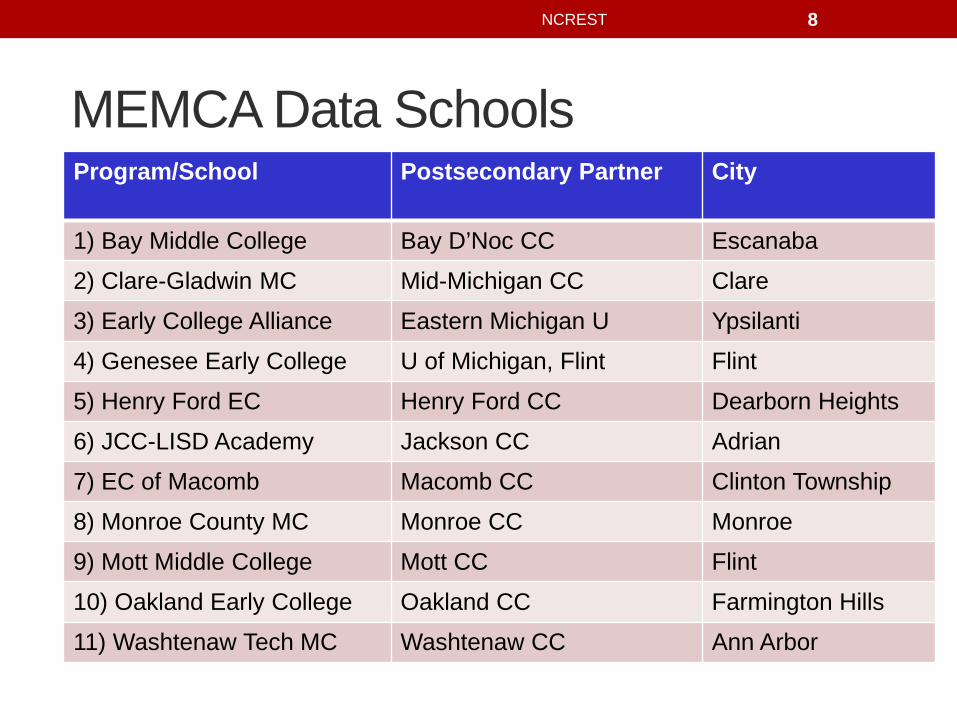
MEMCA Data Schools Program/School Postsecondary Partner City
1) Bay Middle College Bay D’Noc CC Escanaba
2) Clare-Gladwin MC Mid-Michigan CC Clare
3) Early College Alliance Eastern Michigan U Ypsilanti
4) Genesee Early College U of Michigan, Flint Flint
5) Henry Ford EC Henry Ford CC Dearborn Heights
6) JCC-LISD Academy Jackson CC Adrian
7) EC of Macomb Macomb CC Clinton Township
8) Monroe County MC Monroe CC Monroe
9) Mott Middle College Mott CC Flint
10) Oakland Early College Oakland CC Farmington Hills
11) Washtenaw Tech MC Washtenaw CC Ann Arbor
8 NCREST

Data Activities Over Time Data Activities School Year
College transcript data
School profile survey
Graduating student survey
2013-14
2,037 college course-taking students in 2012-13 (12 schools)
11 schools [+6 NT schools]
10-11 schools (Expected)
2012-13 1,739 college course-taking 2011-12 students (10 schools)
11 schools 7 schools 262 students 80% response rate
2011-12 1,526 college course-taking 2010-11 students (11 schools)
12 schools 8 schools 225 students
2010-11 Pilot Year
---- 12 schools 5 schools 132 students
9 NCREST

Gender
10
41% 43% 40%
59% 57% 60%
0%
20%
40%
60%
80%
100%
2011-12 2012-13 2013-14
Perc
ent o
f stu
dent
s
School Year
Female Male
NCREST

Race/Ethnicity
11
62%
71% 66%
32%
20% 21%
2% 3% 3% 1%
4% 4% 0%
20%
40%
60%
80%
100%
2011-12 2012-13 2013-14
Perc
ent o
f stu
dent
s
School Year
White Black Hispanic Other Asian
NCREST

Free/Reduced Lunch vs. Attendance
12
46% 39% 35%
92%
80%
95%
0%
20%
40%
60%
80%
100%
2011-12 2012-13 2013-14
Perc
ent o
f stu
dent
s
School Year
Daily Attendance Free/ Reduced Lunch
NCREST

Student Participation in College Courses
13
92%
98%
87%
94%
79%
71%
70%
80%
90%
100%
2011-12 2012-13
Perc
ent o
f stu
dent
s
School Year
12th graders 11th graders 10th graders
NCREST

Average College Credits Earned
14
44.1 40.0
23.4 20.7
8.6 7.3
0.0
10.0
20.0
30.0
40.0
50.0
2011-12 2012-13
Num
ber o
f col
lege
cre
dits
School Year
12th graders 11th graders 10th graders
NCREST

Average College GPA
15
2.89
3.05 2.93 3.11 3.19 3.23
2.50
3.00
3.50
4.00
2011-12 2012-13
Col
lege
GPA
School Year
10th graders 11th graders 12th graders
NCREST

College Performance Summary: 2012-13 College Course-taking Students
2012-13 Grade
Number of College
Course-taking Students
Cumulative College Coursework
Average GPA
Average Credits Earned
Percent of Courses Passed
(C grade or higher)*
9th graders 39 3.49 1.9 95% 10th graders 486 3.23 7.3 92% 11th graders 761 3.10 20.7 92% 12th graders 512 3.03 40.0 92% 13th graders 239 2.68 46.2 84% Total 2,037 3.07 25.0 90%
16
*Percentage of Courses Passed (C grade or higher): Includes A, B, C, P (Passing), D and F grades in the calculation
NCREST

What makes for a successful
college course-taking program and experience for our high school students?
Write down your important 2-3 aspects.
17 NCREST

College Course-taking in High School
1. Ensuring our students are ready to start college courses in high school.
2. Improving our academic program plans.
18 NCREST
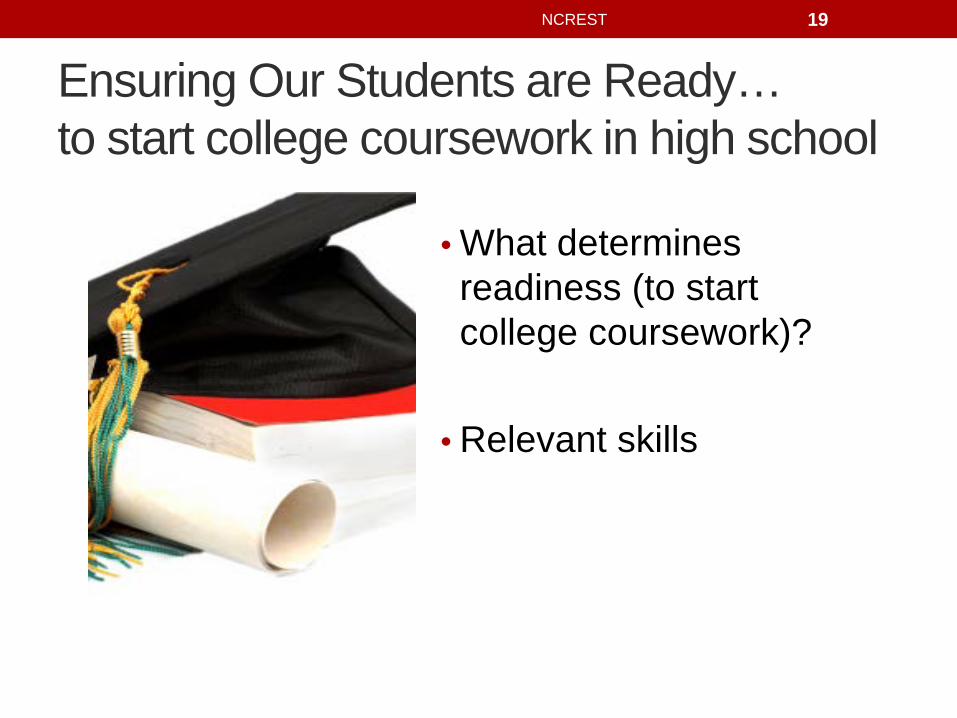
Ensuring Our Students are Ready… to start college coursework in high school
• What determines readiness (to start college coursework)?
• Relevant skills
19 NCREST

Assessment Use: 2-yr v. 4-yr Institutions
100%
94%
85%
51%
0% 20% 40% 60% 80% 100%
Some MATH test
Some READING test
Percent of postsecondary institutions
Percent of Postsecondary Institutions Using Placement Tests
Public 4-year
Public 2-year
20
Source: Fields & Parsad. (2014).
NCREST
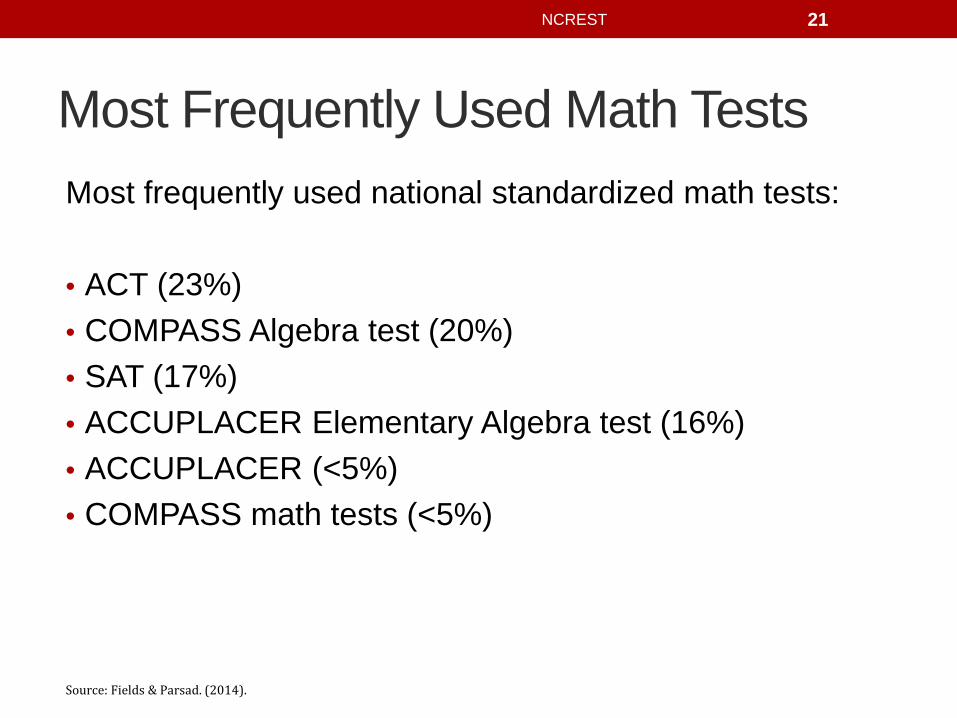
Most Frequently Used Math Tests Most frequently used national standardized math tests:
• ACT (23%) • COMPASS Algebra test (20%) • SAT (17%) • ACCUPLACER Elementary Algebra test (16%) • ACCUPLACER (<5%) • COMPASS math tests (<5%)
21
Source: Fields & Parsad. (2014).
NCREST
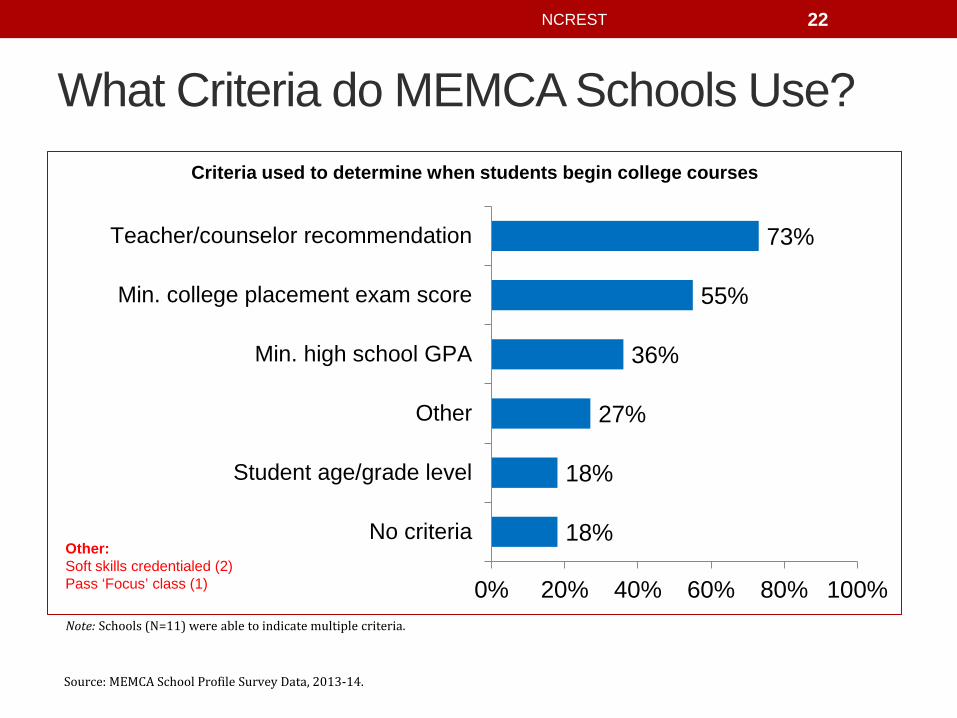
What Criteria do MEMCA Schools Use?
18%
18%
27%
36%
55%
73%
0% 20% 40% 60% 80% 100%
No criteria
Student age/grade level
Other
Min. high school GPA
Min. college placement exam score
Teacher/counselor recommendation
Criteria used to determine when students begin college courses
Other: Soft skills credentialed (2) Pass ‘Focus’ class (1)
22
Note: Schools (N=11) were able to indicate multiple criteria.
Source: MEMCA School Profile Survey Data, 2013-14.
NCREST

MEMCA v. NY Smart Scholars
0%
9%
26%
43%
43%
52%
18%
18%
27%
36%
55%
73%
0% 20% 40% 60% 80% 100%
No criteria
Student age/grade level
Other
Min. high school GPA
Min. college placement exam score
Teacher/counselor recommendation
Criteria used to determine when students begin college courses
MEMCANY SS
Other: MEMCA (Soft skills credentialed ) NY Smart Scholars (State HS exam scores)
23
Note: MEMCA schools (N=11), NY Smart Scholars schools (N=23) were able to indicate multiple criteria.
Sources: NYSED/NCREST Survey, 2012-13; MEMCA School Profile Survey Data, 2013-14.
NCREST

What Does it Mean to be College and Career Ready?
• A college and career ready student possesses the content
knowledge, strategies, skills, and techniques necessary to be successful in a postsecondary setting.
• Not every student needs exactly the same knowledge and skills to be college and career ready.
• A student’s college and career interests help identify the precise knowledge and skills the student needs.
24
Source: Conley. (2014).
NCREST

Relevant Readiness/Learning Skills Learning skills students need to be ready for the range of postsecondary learning environments:
• Study skills • Time management skills • Goal orientation • Persistence (determination, tenacity, grit)
• Self-awareness (knowing how one is doing in their courses) • Help-seeking (knowing how to obtain necessary resources) • Technological proficiency (knowing how to effectively use technology)
25
Source: Conley. (2014).
NCREST
For Us – 2 Types of Readiness
• General readiness for college and career
• Readiness to start college courses in high school
26 NCREST

Ensuring Our Students are Ready to Start College Coursework in High School
1. What requirements do our students need to meet to
enroll in college courses? Is it the same for all courses?
2. What are we doing to prepare students to start college courses in high school?
3. What about groups of students who struggle to attain readiness to start college courses? What are we doing about this?
NCREST 27

Assessing Our Programs for Successful College Coursework in HS
• New considerations for academic plans
• Types of college courses
• College performance
28
NCREST

Academic Plan
Grade 9
Fall
Grade 9
Spring
Grade 9
Summer
Grade 10
Fall
Grade 10
Spring
Grade 10
Summer
Grade 11
Fall
Grade 11
Spring
Grade 11
Summer
Grade 12
Fall
Grade 12
Spring
Grade 12
Summer
Grade 13
Fall
Grade 13
Spring
English
Math
Science
Social Studies, History & Government
Physical Education
Language
Elective
Seminar
Other
TOTAL Credits
Standardized HS Tests
Entrance/Exit College Tests
29
Total HIGH SCHOOL units earned = Total COLLEGE credits earned =
NCREST

Academic Plan Considerations • Clear goals and expectation –
• Minimum number of college courses and credits for students
• Sequencing – • A continuum of courses that progress from easier to more difficult • Using college/career orientation and skills courses strategically
• Rigor –
• Opportunities for students to take a rigorous high school curriculum • Appropriate level of challenge to keep students engaged but not discouraged • Vetting process of instructors*
• Policy context –
• Dual enrollment and articulation agreements in the state or with specific colleges • State and national tests (e.g., ACT, SAT) for high school students • College entrance exams or other criteria required by partner college
• Supports –
• Availability of supports to help students with coursework • Academic and social supports*
30
* Additional items included. Source: NCREST. (2011). Early College: 10 Key Decisions.
NCREST

College Course Enrollments by Subject/SchYr (2012-13 12th Graders)
Subject Gr 9 2009-10
Gr 10 2010-11
Gr 11 2011-12
Gr 12 2012-13 Total
BUSINESS -- <1% 1% 2% 2% COLLEGE SKILLS 51% 10% 2% 2% 3% COMMUNICATION -- 11% 9% 6% 8% COMPUTERS 9% 7% 6% 5% 5% EDUCATION -- -- 1% 1% 1% ENGINEERING -- <1% <1% <1% <1% ENGLISH 16% 15% 10% 11% 11% FOREIGN LANGUAGES 1% 3% 6% 4% HEALTH PROFESSIONS 4% 10% 5% 5% 6% MATH 9% 11% 12% 10% 11% PERSONAL/CULINARY SERVICES 2% 1% <1% <1% <1% PHILOSOPHY/RELIGION -- <1% 2% 4% 3% PHYSICAL EDUCATION 2% 5% 3% 4% 4% PROTECTIVE SERVICE -- <1% <1% 1% <1% SCIENCE 4% 7% 14% 16% 14% SOCIAL SCIENCE 2% 16% 25% 18% 20% TRADES -- <1% <1% 1% <1% VISUAL/PERFORMING ARTS -- 4% 7% 7% 7%
TOTAL <1% (45)
14% (1,027)
39% (2,858)
46% (3,369)
100% (7,299)
31 NCREST
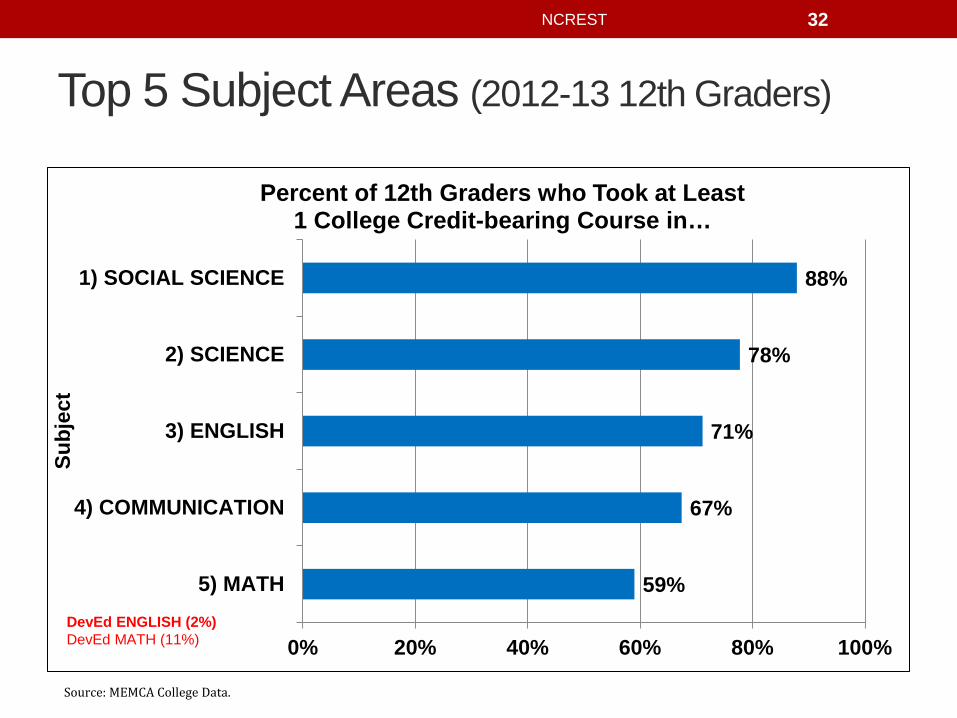
Top 5 Subject Areas (2012-13 12th Graders)
59%
67%
71%
78%
88%
0% 20% 40% 60% 80% 100%
5) MATH
4) COMMUNICATION
3) ENGLISH
2) SCIENCE
1) SOCIAL SCIENCE
Subj
ect
Percent of 12th Graders who Took at Least 1 College Credit-bearing Course in…
DevEd ENGLISH (2%) DevEd MATH (11%)
32
Source: MEMCA College Data.
NCREST

More Subject Areas (2012-13 12th Graders)
25%
34%
35%
35%
51%
54%
57%
0% 20% 40% 60% 80% 100%
12) HEALTH PROFESSIONS
11) COLLEGE SKILLS
10) PHILOSOPHY/RELIGION
9) FOREIGN LANGUAGES
8) COMPUTERS
7) PHYSICAL EDUCATION
6) VISUAL/PERFORMING ARTS
Subj
ect
Percent of 12th Graders who Took at Least 1 College Credit-bearing Course in…
33
Source: MEMCA College Data.
NCREST

Remaining Subject Areas (2012-13 12th Graders)
2%
2%
2%
4%
4%
6%
10%
11%
0% 20% 40% 60% 80% 100%
20) DEVED ENGLISH
19) TRADES
18) PERSONAL/CULINARY…
17) PROTECTIVE SERVICE
16) ENGINEERING
15) EDUCATION
14) BUSINESS
13) DEVED MATH
Subj
ect
Percent of 12th Graders who Took at Least 1 College Credit-bearing Course in…
34
Source: MEMCA College Data.
NCREST

Top 5 Subjects Areas: Performance
Subject A B C D F W
SOCIAL SCIENCE 47% 28% 15% 5% 4% 1%
SCIENCE 36% 34% 18% 5% 4% 2%
ENGLISH 59% 28% 8% 2% 2% 2%
COMMUNICATION 59% 28% 8% 2% 2% 2%
MATH 48% 27% 11% 5% 7% 2%
35
Percent of College Course Grades Results (2012-13 12th Graders)
Source: MEMCA College Data.
NCREST

Starter and Final Year Courses School Course names – Grade 10 Course names – Grade 12 School A • THEA 1001: INTRO THEATER ARTS
• THEA 1101: INTRO TO ACTING • CORC 1130: MUSIC LANG HIST & CULT • SPEC 1103: COMMUNICAT TECHNIQ
• CHEM 1050: GENERAL CHEM 1A • ENGL 2301: INTRO CREATIVE WRITING • MATH 1011: PRECALC or MATH 1201: CALCULUS • PSYC 2810: ABNORMAL PSYCHOLOGY I
School B • CPT101: Intro Comp or MUS105: Music App • PSY201: Gen Psych or SOC-101: Intro Soc • SPA101: Elementary Spanish I • COL03: College Skills
• ENG101: English Composition I • ENG102: English Composition II • BIO101: Bio Science I • MAT110: College Algebra or MAT120: Statistics
School C • FA 205: DRAWING • FA 305: PAINTING • History or Political Science course
• EN 110: COLLEGE COMPOSITION • EN 114: PUBLIC SPEAKING • PS 100: GENERAL PSYC or SO 100: INTRO TO SOC • GS 111: COLLEGE SUCCESS SKILL • MT 112: SURVEY OF MATH
School D • COM 115: Public Speaking • HPR 104: Health Career Opt & Readiness • CIS 118: Intro PC Applications • Criminal Justice or Health Careers course
• ENG 121: English Composition I • ENG 122: English Composition II • HPR 178: Medical Terminology • PSY 101: General Psychology I • ACC 101: Fundamentals of Accounting • MAT 135: Intro to Statistics
36
Source: MCNC College Data.
NCREST

General Ed and Career Tech College Course Enrollments
Career Technical
22%
General 70%
Other 8%
Percent of College Course
Enrollments (cumulative during HS)
2012-13
12th Graders
Source: MEMCA College Data.
37 NCREST
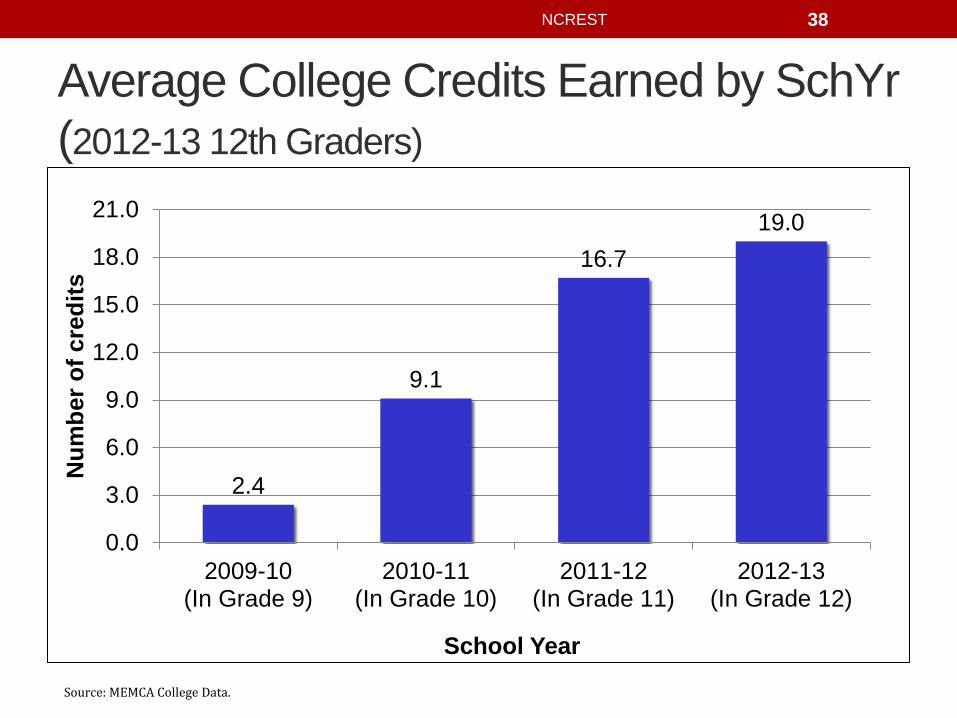
Average College Credits Earned by SchYr (2012-13 12th Graders)
2.4
9.1
16.7 19.0
0.0
3.0
6.0
9.0
12.0
15.0
18.0
21.0
2009-10(In Grade 9)
2010-11(In Grade 10)
2011-12(In Grade 11)
2012-13(In Grade 12)
Num
ber o
f cre
dits
School Year
Source: MEMCA College Data.
38 NCREST

College Course Grade Success by SchYr (2012-13 12th Graders)
96% 91% 91% 88%
4% 7% 8% 9% 0% 1% 1% 3%
0%
20%
40%
60%
80%
100%
2009-10(In Grade 9)
2010-11(In Grade 10)
2011-12(In Grade 11)
2012-13(In Grade 12)
Perc
ent o
f gra
des
School Year
Successful Not Successful Other
92% = Cumulative course passrate at C grade or higher
Successful = A, B, C; Not Successful = D, F Source: MEMCA College Data.
39 NCREST

College Credits Earned, per Student (2012-13 12th Graders)
1% 4% 4% 6% 4%
81%
0%
20%
40%
60%
80%
100%
0credits
1-5 6-10 11-15 16-20 More than20 credits
Perc
ent o
f stu
dent
s
Cumulative credits earned
Source: MEMCA College Data.
40 NCREST

College GPA, per Student (2012-13 12th Graders)
2% 8%
30%
60%
0%
20%
40%
60%
80%
100%
< 0.99 1.00 - 1.99 2.00 - 2.99 3.00 - 4.00
Perc
ent o
f stu
dent
s
Cumulative GPA Source: MEMCA College Data.
41 NCREST

EC Sample Study v. MEMCA
66%
77%
0% 20% 40% 60% 80% 100%
Students earned anycollege credit
Percent of Students Earning College Credit During High School
MEMCA EC Sample
Study
Note: Data reflect 2011-12 Early College students. Source: AIR/SRI. (2013); MEMCA College Data.
NCREST

EC Sample Study v. MEMCA
29%
47%
46%
53%
26%
79%
87%
92%
0% 20% 40% 60% 80% 100%
9thGrade
10thGrade
11thGrade
12thGrade
Percent of Students Who Took College Courses in High School
MEMCAEC Sample Study
Note: Data reflect 2011-12 Early College students. Source: AIR/SRI. (2013); MEMCA College Data.
NCREST
“[Re: National EC Study] Although the goal of Early Colleges is to get all student enrolled in college while in high school, our findings suggest that the Early Colleges did not meet this goal.” (AIR/SRI, 2013)

BREAKOUT GROUPS 10:15 – 11:20 - MEMCA Data Project Schools (3rd Floor) - Other Participants (Main room)

What makes for a successful
college course-taking program and experience for our high school students?
Go back to your original noted responses.
Any new thoughts?
45 NCREST