Embed Size (px)
Citation preview

April, 11th 2017
Data, Talent, and Performance Driven Organizations
Survey Says: Embrace Your Cultures
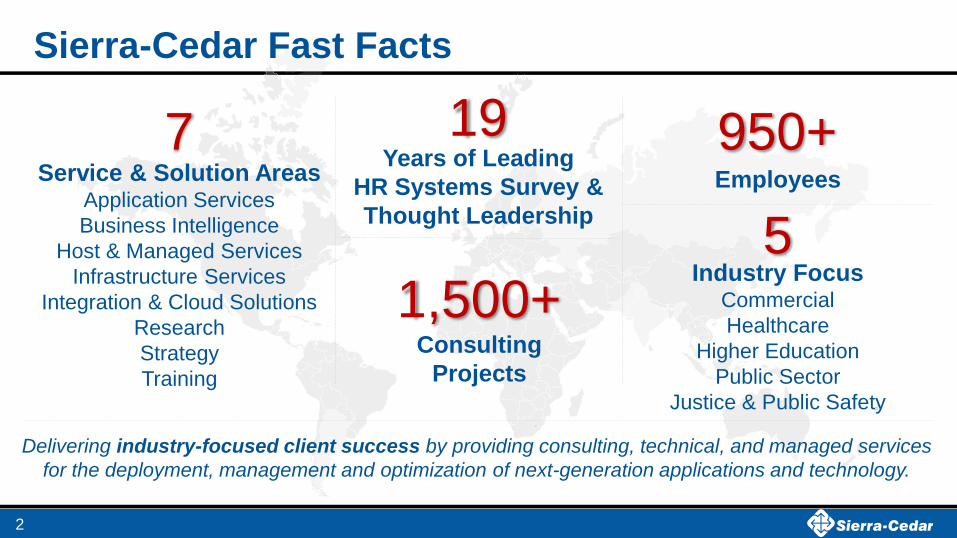
Employees Service & Solution Areas Application Services
Business Intelligence
Host & Managed Services
Infrastructure Services
Integration & Cloud Solutions
Research
Strategy
Training
Delivering industry-focused client success by providing consulting, technical, and managed services
for the deployment, management and optimization of next-generation applications and technology.
Industry Focus Commercial
Healthcare
Higher Education
Public Sector
Justice & Public Safety
Sierra-Cedar Fast Facts
Years of Leading
HR Systems Survey &
Thought Leadership
7 19 950+
5
2
Consulting
Projects
1,500+
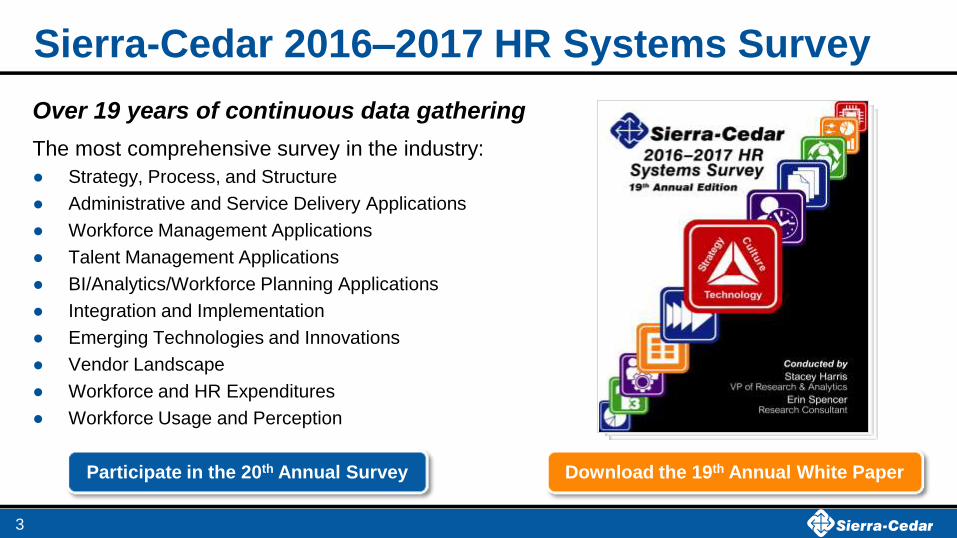
Sierra-Cedar 2016–2017 HR Systems Survey
Over 19 years of continuous data gathering
The most comprehensive survey in the industry:
● Strategy, Process, and Structure
● Administrative and Service Delivery Applications
● Workforce Management Applications
● Talent Management Applications
● BI/Analytics/Workforce Planning Applications
● Integration and Implementation
● Emerging Technologies and Innovations
● Vendor Landscape
● Workforce and HR Expenditures
● Workforce Usage and Perception
Participate in the 20th Annual Survey Download the 19th Annual White Paper
3

High Tech Health Manu-
facturing
Sierra-Cedar 2016–2017 HR Systems Survey Demographics: All Respondents
4
Trans./Comm.
Utilities
Higher Ed Finance Retail Ag. Mining.
Const.
16% 15% 14% 14% 11%
9% 8% 7% 7%
Other
20.6 Million Employees/Contingents
Avg. number of Employees = 13,551
1,528 Organizations
Industries
56%
21%
23%
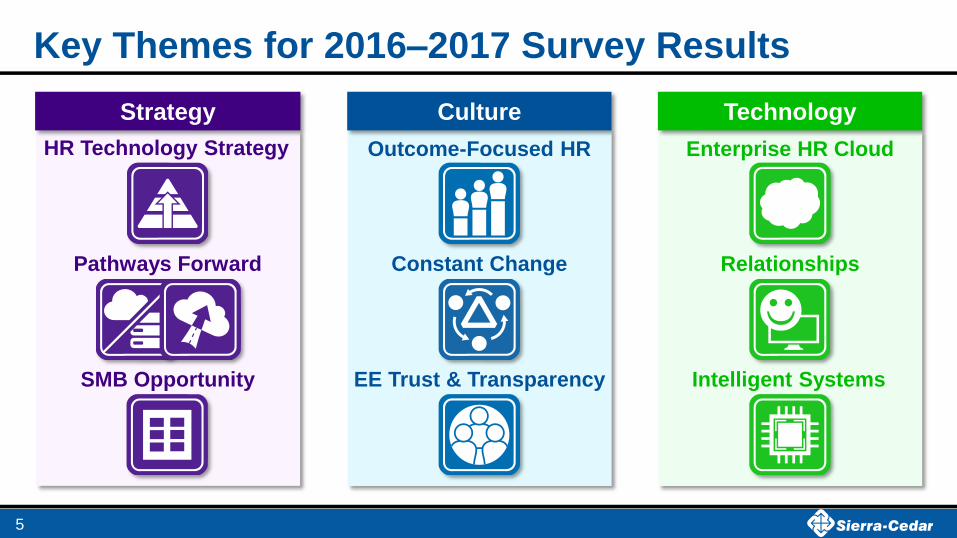
Culture Strategy Technology
Key Themes for 2016–2017 Survey Results
Relationships
HR Technology Strategy
SMB Opportunity
Enterprise HR Cloud
EE Trust & Transparency
Pathways Forward
Intelligent Systems
Outcome-Focused HR
5
Constant Change

Backlog, Pipeline, Customer Satisfaction
General Ledger, Purchasing, Budgeting, T&E Vendor Management
Project Costing, Contracts, Grants Projects
FIN
CRM
VMS
Talent Management Excellence
Service Delivery Excellence
Administrative Excellence
Workforce Management Excellence
Workforce Optimization Excellence
SOA, API, ETL
Enterprise Content Enterprise Workflow
Network Security
Enterprise Social
Mobile Access Integration Platform
Workforce Optimization Workforce Planning, Workforce Analytics,
Predictive Analytics
Service Delivery HR Help Desk, Portal
Self Service/Direct Access Employee Self Service
Manager Self Service
Workforce Management Time & Labor, Absence & Leave Management, Labor
Scheduling, Labor Budgeting, WFM Analytics,
Talent Management Recruiting, Performance, Learning, Compensation,
Succession, Career, Talent Profile, Onboarding, TM Analytics
Business Intelligence Foundation Reporting/Visualization and BI tools
Administrative Apps Core HRMS, Roles/Competencies (Profile Mgt.), Payroll,
Benefit Admin, Embedded HR Analytics,
Sierra-Cedar HCM Application Blueprint
66% Adoption
90% Adoption
60% Adoption
51% Adoption
39% Adoption
PaaS
Enterprise Data Privacy
7
Sierra-Cedar
Outcome Based
Organizations
66%
14%
42%
7%
66%
28%
43%
4%
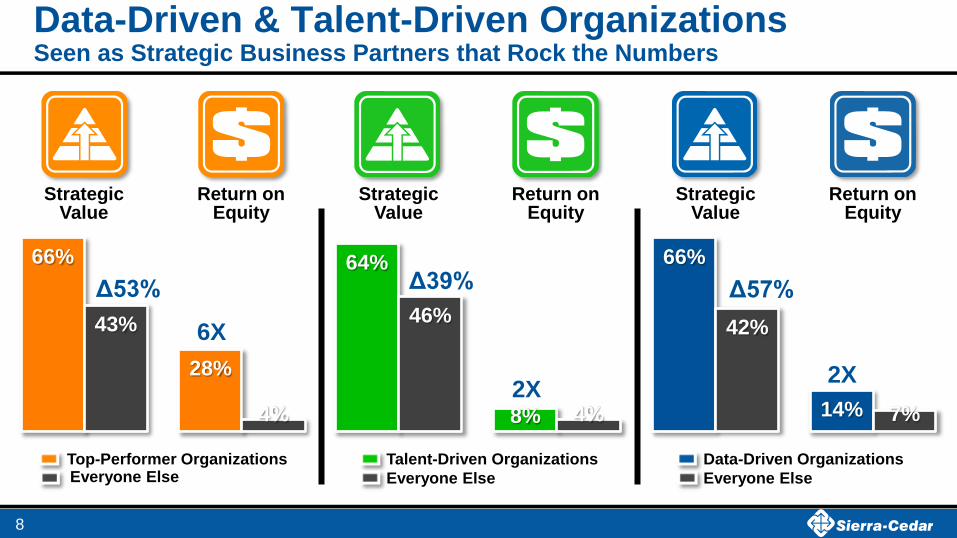
Data-Driven & Talent-Driven Organizations Seen as Strategic Business Partners that Rock the Numbers
8
64%
8%
46%
4%
Strategic Value
Talent-Driven Organizations
Everyone Else
2X
Δ53%
Return on Equity
Data-Driven Organizations
Everyone Else
Top-Performer Organizations Everyone Else
Δ39% Δ57%
2X
6X
Strategic Value
Return on Equity
Strategic Value
Return on Equity
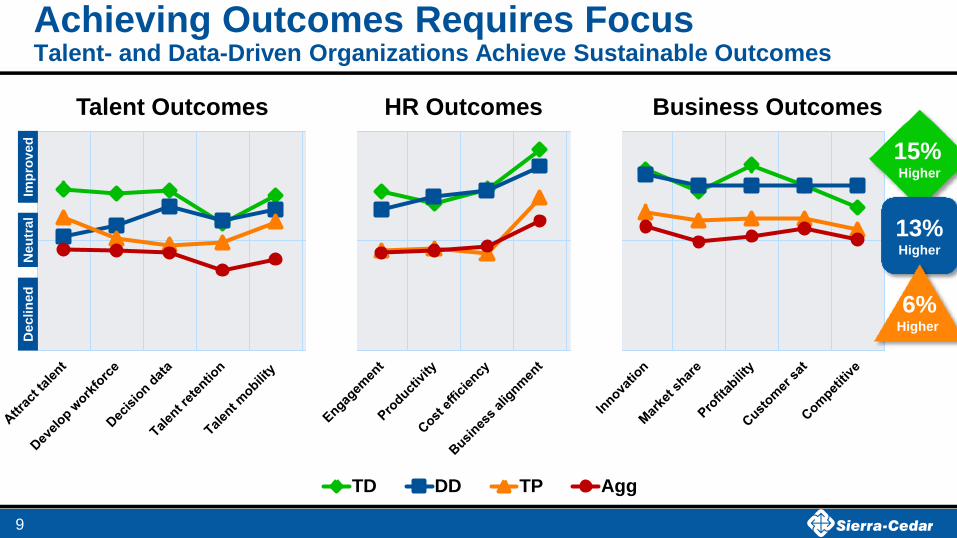
Achieving Outcomes Requires Focus Talent- and Data-Driven Organizations Achieve Sustainable Outcomes
9
TD DD TP Agg
Talent Outcomes HR Outcomes Business Outcomes
Imp
rov
ed
N
eu
tral
Declin
ed
15%
Higher
13%
Higher
6% Higher

Organization Sizes and Types
10
Data-Driven
Talent-Driven
Top Performers
Aggregate Small <2,500
Medium 2,500–10,000
Large 10,000+

Lessons from Outcome Based Organizations
We looked at the differences across these organizations in five ways:
● Strategy
● Culture
● Innovations
● Service and Efficiency
● Technology Approaches
11
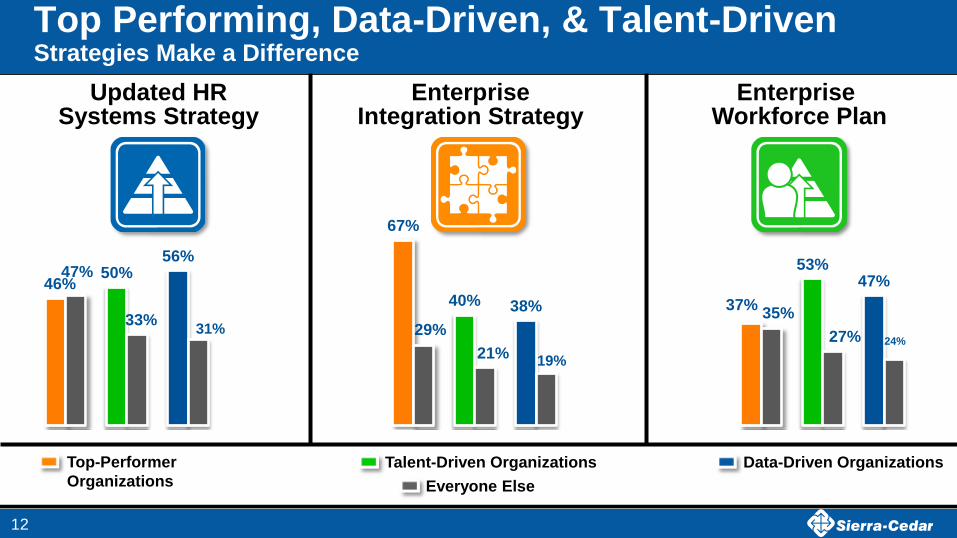
Top Performing, Data-Driven, & Talent-Driven Strategies Make a Difference
Enterprise Integration Strategy
Updated HR Systems Strategy
Enterprise Workforce Plan
46%
67%
37%
47%
29% 35%
50%
40%
53%
33%
21% 27%
56%
38%
47%
31%
19%
24%
12
Talent-Driven Organizations
Everyone Else
Data-Driven Organizations Top-Performer
Organizations

11%
5%
3%
3%
24%
12%
5%
13%
10%
19%
10%
11%
25%
20%
33%
19%
30%
44%
49%
54%
I don't know No Strategy Rarely Updated Developing Regularly Update
Regularly Updated Enterprise HR System Strategy It Makes a Difference in Outcomes
13

Creating Your HR Systems Strategy
1. Benchmark – Current State & Benchmark of HR Technology
Environment
2. Blueprint – Enterprise Business Goals & HR Strategies, Enterprise
System Strategies
3. Roadmap – Action Plan, Communication, Measures and KPIs
4. Governance – Decision Making, Maintenance, Change Management
5. Budgets & Resources – Required, Contingency plans, Outsourcing
Diagnosis – Guiding Policy – Coherent Action
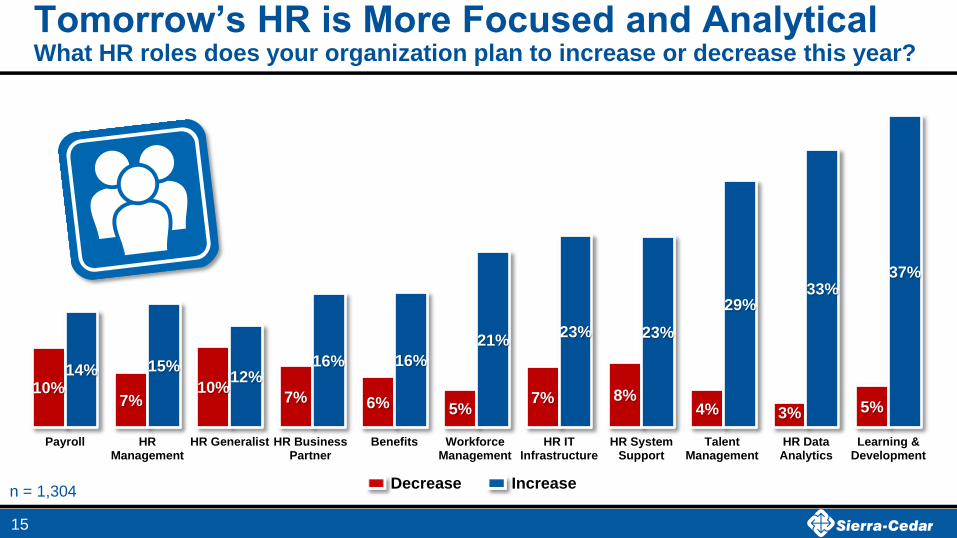
10% 7%
10% 7% 6% 5%
7% 8% 4% 3% 5%
14% 15% 12%
16% 16%
21% 23% 23%
29% 33%
37%
Payroll HRManagement
HR Generalist HR BusinessPartner
Benefits WorkforceManagement
HR ITInfrastructure
HR SystemSupport
TalentManagement
HR DataAnalytics
Learning &Development
n = 1,304 Increase Decrease
Tomorrow’s HR is More Focused and Analytical What HR roles does your organization plan to increase or decrease this year?
15

Workforce Planning Realities Rip & Replace Orgs More Likely to Conduct Enterprise Workforce Planning
30% 23% 21% 19% 18%
Rip &Replace
Hosting Parallel Hybrid Patchwork
Enterprise Workforce Planning
16
66% More Likely
22% of all organizations are conducting
Enterprise Workforce Planning
Workforce Planning
Approaches

Top Performing, Data-Driven, & Talent-Driven Culture is Critical for All Outcomes
Rewards & Recognition
Top Social Responsibility
Change Management Culture
19%
44%
30%
11%
38%
25%
15%
50%
43%
8%
25% 20%
15%
44%
35%
6%
25% 19%
17
Talent-Driven Organizations
Everyone Else
Data-Driven Organizations Top-Performer
Organizations

8%
3%
11%
27%
9%
34%
8%
38%
55%
9%
33%
27%
36%
53%
47%
Never Sporadically Key Projects Consistent Culture
2016 A Culture of Change Management Data and Talent Driven Orgs Support a Culture of Change Management
18

Continuous Culture of Change Management Making It Stick!
19
The move from CM for finite projects into continuous Change Management Models

Continuous Change Management From the Field
● Different communication mechanism for “critical” messages as opposed to
“informational”
● Bundle informational communications into batches sent less frequently
● Develop a “pull” culture based on notices posted at the job site that something is going
on, then have a centralized communication center
● Coordinate communications from different parts of the organization
● Build a technical solution that remedies the problem creatively in a way that is
consumable by a modern workforce. (e.g. for very select critical communications that are
time sensitive, use alerts on your phone similar to other alerts that you might get for news)
● Consistent communication strategy applied across the organization, so it is expected
and understood how and when communications come out
20

Social Responsibility Initiatives By Regulation
21
29%
47%
52%
58%
54%
55%
64%
69%
62%
66%
73%
74%
27%
23%
33%
23%
27%
27%
22%
21%
22%
27%
19%
20%
17%
16%
13%
15%
15%
13%
12%
4%
9%
6%
6%
5%
Outplacement
Tuition Assistance
Employee Engagement
Community/Volunteer
Retirement Planning
Wellness
Flex Schedules
Employee Assistance
Paid Family Leave
Comp/Pay Equity
Diveristy & Inclusion
Healthcare
Excellent/Good Average Poor/Terrible
High Regulation
Some Regulation
Not Regulated

80%
62%
7%
62% 68%
12%
76% 71%
49% 51%
64%
9%
80% 80%
46% 51%
65%
6%
Top Performing, Data-Driven, & Talent-Driven A Focus on Efficiency and Services Creates Possibilities
Top Process Maturity HR Help Desk
22
Manager Self Service
Talent-Driven Organizations
Everyone Else
Data-Driven Organizations Top-Performer
Organizations

With
Self Service*,
and Help Desk
No or Low Tech
223
Value of Service Delivery Technologies 60% More Employees Served with Mobile + Help Desk Technology
*With Self Service: Employee and manager Self Service applications serve 60% or more of employees and 50% or more of manager populations
47%
60%
Employees Served by HR Administrative Headcount
23
327
With
Mobile
With
Self Service*,
and Help Desk
356

Where Are Shared Service Centers Located? Primarily in HQ Nations until Organizations Globalize
51%
2%
8%
1%
2%
2%
1% 2%
4%
2% 41% Organizations Shared Services
are part of an Enterprise
Shared Services Model
24
4%

Functions Included in HR Shared Services
52%
79%
80%
82%
Employee Relations
HR Records
Payroll
Benefits Admin
21%
33%
61%
67%
Labor Sched
Labor Compliance
Time & Attendance
Absence/Leave
29%
31%
41%
53%
61%
55%
63%
68%
Career Dev
Succession Plng
Rewards & Recognition
Learning
Performance Mgmt
Onboarding
Recruiting
Compensation
21%
33%
41%
Workforce Plng
HR Analytics
Data privacy
25
Administrative
Talent
Management
Workforce
Optimization
Workforce
Management
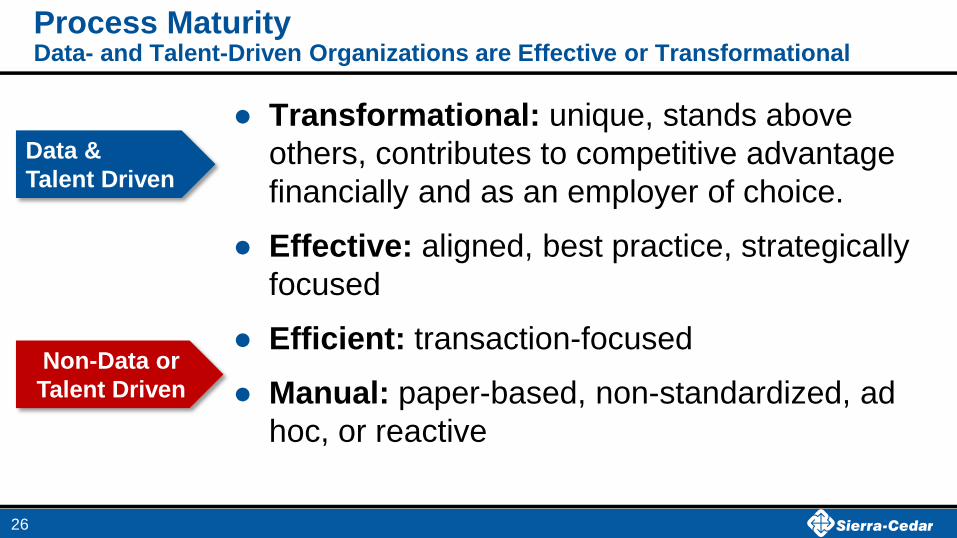
Process Maturity Data- and Talent-Driven Organizations are Effective or Transformational
● Transformational: unique, stands above
others, contributes to competitive advantage
financially and as an employer of choice.
● Effective: aligned, best practice, strategically
focused
● Efficient: transaction-focused
● Manual: paper-based, non-standardized, ad
hoc, or reactive
Non-Data or
Talent Driven
Data &
Talent Driven
26

47%
30%
37%
27% 23%
37% 34%
32%
48%
Parallel
Top Performing, Data-Driven, & Talent-Driven Approaches to Technology Differ Greatly
Top HR Tech Transformation Approach
Total HR Tech Adoption
Top Cloud Adopters
27
Patchwork Hybrid
15.4 15.2
21.6
16
21.9
16.1
Talent-Driven Organizations
Everyone Else
Data-Driven Organizations Top-Performer
Organizations

52%
43%
54%
31%
44%
35%
38%
24%
WFM Licensed
Payroll Licensed
HRMS Licensed
TM Licensed
On Premise Deployments
2016 The Enterprise HR Cloud Conversation Movement to the Cloud is about transforming the User Experience
n = 980
72%
63%
59%
50%
66%
51%
53%
41%
TM Cloud
HRMSCloud
PayrollCloud
WFM Cloud
SaaS/Cloud Deployments
28
3.46 Average User Experience Scores
2.99 Average User Experience Scores
Note these include combination and hosted environments
Today
12 Months

Ve
nd
or
Sa
tis
fac
tio
n
User Experience
Good Enough
Zone
We Expect More!
Zone
29
Workday
Ceridian DF
UltiPro
SF (EC)
Oracle
(HCM C)
SilkRoad
Kronos
WFC
Oracle PS
ADP
(WN)
Infor/Lawson
SAP (HCM)
Oracle EBS ADP (V)
ADP GV/E
Paycor
Kronos WFR
SumTotal SS
Administrative
Good Excellent
Dis
sati
sfi
ed
V
ery
Sati
sfi
ed
Poor
30
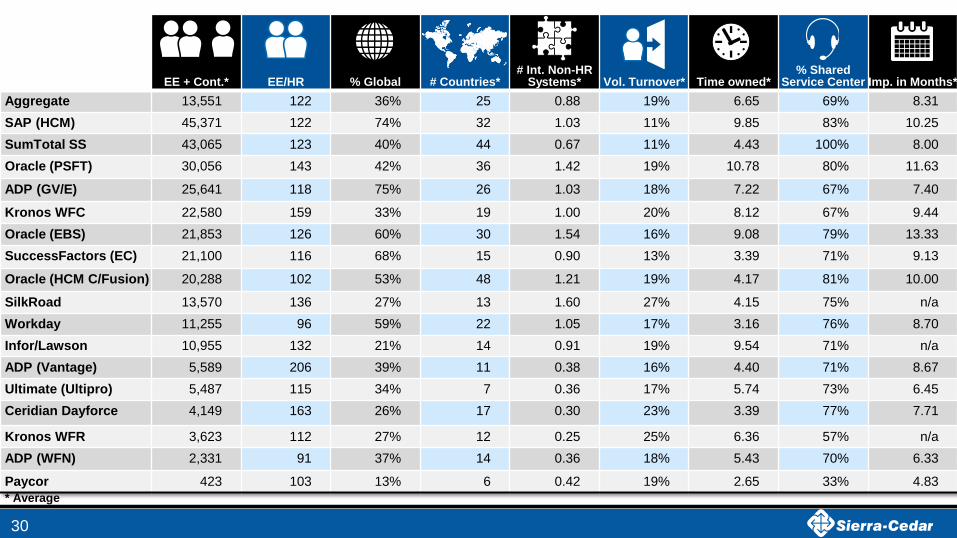
EE + Cont.* EE/HR % Global # Countries* # Int. Non-HR
Systems* Vol. Turnover* Time owned*
% Shared Service Center
Imp. in Months*
Aggregate 13,551 122 36% 25 0.88 19% 6.65 69% 8.31
SAP (HCM) 45,371 122 74% 32 1.03 11% 9.85 83% 10.25
SumTotal SS 43,065 123 40% 44 0.67 11% 4.43 100% 8.00
Oracle (PSFT) 30,056 143 42% 36 1.42 19% 10.78 80% 11.63
ADP (GV/E) 25,641 118 75% 26 1.03 18% 7.22 67% 7.40
Kronos WFC 22,580 159 33% 19 1.00 20% 8.12 67% 9.44
Oracle (EBS) 21,853 126 60% 30 1.54 16% 9.08 79% 13.33
SuccessFactors (EC) 21,100 116 68% 15 0.90 13% 3.39 71% 9.13
Oracle (HCM C/Fusion) 20,288 102 53% 48 1.21 19% 4.17 81% 10.00
SilkRoad 13,570 136 27% 13 1.60 27% 4.15 75% n/a
Workday 11,255 96 59% 22 1.05 17% 3.16 76% 8.70
Infor/Lawson 10,955 132 21% 14 0.91 19% 9.54 71% n/a
ADP (Vantage) 5,589 206 39% 11 0.38 16% 4.40 71% 8.67
Ultimate (Ultipro) 5,487 115 34% 7 0.36 17% 5.74 73% 6.45
Ceridian Dayforce 4,149 163 26% 17 0.30 23% 3.39 77% 7.71
Kronos WFR 3,623 112 27% 12 0.25 25% 6.36 57% n/a
ADP (WFN) 2,331 91 37% 14 0.36 18% 5.43 70% 6.33
Paycor 423 103 13% 6 0.42 19% 2.65 33% 4.83
* Average

9% 16% 8%
10% 11% 17% 20% 22% 29%
12% 20% 16%
48% 30% 30%
Reactive Focused
Multiple Pathways to an HR Tech Transformation Approach to Replacing Existing HR Technology By Size
Hybrids Move ONLY TM or WFM apps to Cloud
Rip & Replace Move everything all at once to the Cloud
Patchwork Replace as License Ends
Hosting/ Outsource Single Tenant, or BPO
31
Parallel Combo Licensed and Cloud Solutions
Hig
h R
isk
Lo
w R
isk

29%
11% 14%
7%
37%
18%
7% 9%
18% 20%
7% 7%
Top Performing, Data-Driven, & Talent-Driven Innovations Play a Role in Long Term Outcomes
Top adopters of WFM, TM, and BI
Early adopters of wearable tech
Mobile Adoption HR Tech Modules
32
3.6
4.4
6.1
4.1
6.4
3.6
Talent-Driven Organizations
Everyone Else
Data-Driven Organizations Top-Performer
Organizations
38%
10% 29%
23%
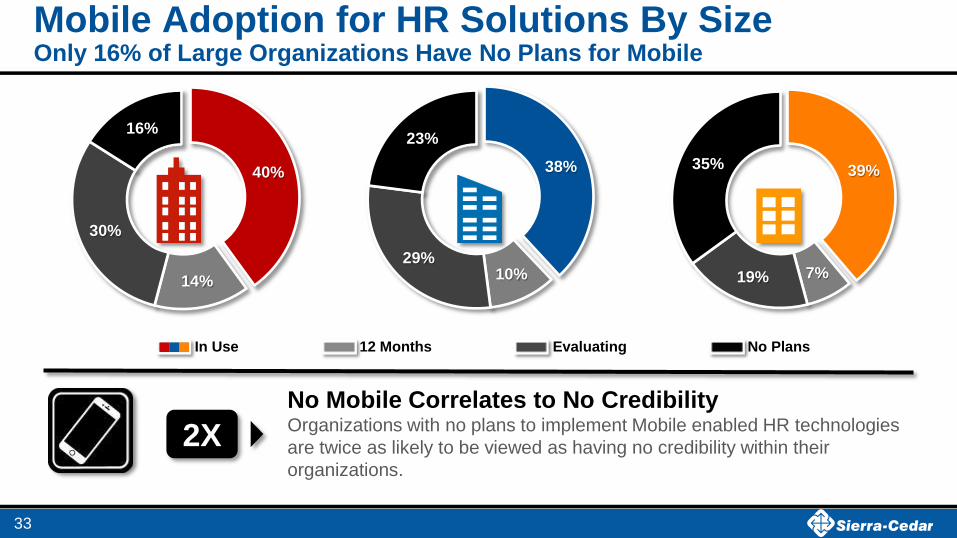
In Use 12 Months Evaluating No Plans
Mobile Adoption for HR Solutions By Size Only 16% of Large Organizations Have No Plans for Mobile
40%
14%
30%
16%
33
39%
7% 19%
35%
No Mobile Correlates to No Credibility Organizations with no plans to implement Mobile enabled HR technologies
are twice as likely to be viewed as having no credibility within their
organizations.
2X

APAC
Mobile-enabled HR Process Adoption Globally Mobile Adoption Varies Greatly
39% 43%
22%
44% 47% 52%
33%
56%
Organizations that Use Mobile-enabled HR Technology
34
2016 12 Months
Aggregate USA Only Non-India APAC India Only
USA

24%
14%
32%
16%
14%
4%
31%
66%
Top and Not Top Cloud Mobile Use
No Plans Evaluating Budgeted for 12 Months In Use Today
2016 Mobile and the Cloud High Cloud More Mobile
35

Emerging Technologies The Emergence of Active Technology – Requires Your Input
Workforce Using
Today 12 Months Evaluating No Plans
Wearable Technology 8% 1% 8% 86%
Machine Learning 6% 1.5% 10% 83%
36
Wearable Technology Data- and Talent-Driven Organizations
2X as Likely to be Early Adopters
Machine/AI Learning Data- and Talent-Driven Organizations
1 1/2X more likely to be using Today

Emerging HR/BI Analytics Trends The Emergence of Active Technology – Requires Your Input
Workforce Using
Today 12 Months Evaluating No Plans
Benchmarking Databases 17% 4.0% 18% 61%
Sentiment Analysis 4% 1.5% 10% 84%
37
Benchmarking 40% more likely to be used
by both Data- and Talent-
Driven Organizations
Sentiment Analysis Talent-Driven Organizations
are 3X more likely to be
Using Today or in 12 Months.

Strategic Social Technology Use by Generations One of the Only Areas Where Differences Show Up in Technology Adoption
71%
64% 65%
55%
48%
42%
35%
11% 5%
Older Workforce Equal Generations Younger Workforce
38

What Is HR Analytics?

Most Use HR Analytics to Look BACKWARD
40
46%
51%
59%
44% 41%
58%
Retention Risks
Compliance Risks
HR Benchmarking
Data-Driven Organization Non-Data-Driven Organization
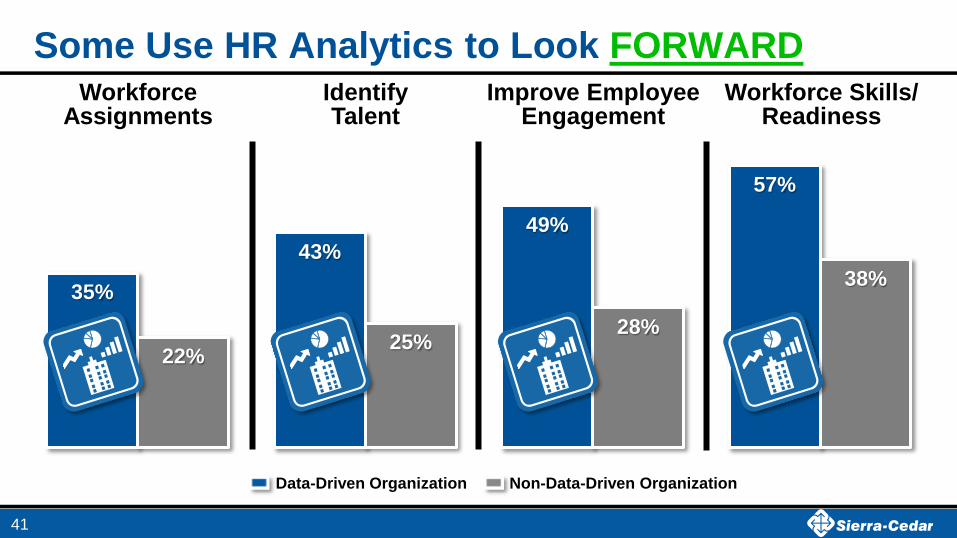
Some Use HR Analytics to Look FORWARD
41
35%
43%
49%
57%
22% 25%
28%
38%
Identify Talent
Workforce Assignments
Improve Employee Engagement
Workforce Skills/ Readiness
Data-Driven Organization Non-Data-Driven Organization

Data-Driven Orgs Also Focus on the BUSINESS
42
24%
30% 30%
44%
11% 8% 9%
21%
Data-Driven Organization Non-Data-Driven Organization
Increase Innovation/
Agility
Customer Satisfaction
Increase Competitive Advantage
Optimize Workforce
Productivity

Top Performers Talent Driven Data Driven
The Important Questions: Outcomes and Impact Top Performers, Talent-Driven, and Data-Driven Organizations
Top Quartiles
• Revenue/Employee
• Profit/Employee
• OIG (1 year)
• Return on Equity
• Mature Career Planning
• Succession Mgmt
• Metric Outcomes • Employee engagement
• Workforce readiness
• Retention risks
• Top talent
• Mature Workforce
Analytics
• 3+ Metrics
• 20%+ Managers/BI
• 3+ Data Sources
43
Performance-Based Decision Making
Talent-Based
Decision Making
Data-Based
Decision Making

Wrapping Up: Takeaways
Enterprise HR Systems Strategy, You Need One
Understand Your Culture and Support it With HR Processes and
Systems
There is No Perfect Technology Mix, but There is an Efficient
Technology Mix
Emerging Technology is about Achieving Outcomes
44
Thank you!
45
Visit Sierra-Cedar Website Get Full Survey Details and Sign Up To Participate Next Year!
46
www.Sierra-Cedar.com/annual-survey

Stacey Harris Vice President Research and Analytics, Sierra-Cedar
Background:
● Oversee the Annual HR Systems Survey and its safekeeping for the Industry
● HR and OE Practitioner for over 10 years in finance, retail, and franchised businesses.
● Director of Research at Bersin & Associates, Launched the HR research practice
● VP of Research for Brandon Hall Group
● Major Research and Papers: The High Impact HR Organization, The HR Framework, Employee Engagement: A Changing
Marketplace, and Relationship Centered Learning
● Feel free to connect at: www.linkedin.com/in/staceyharris
● @StaceyHarrisHR
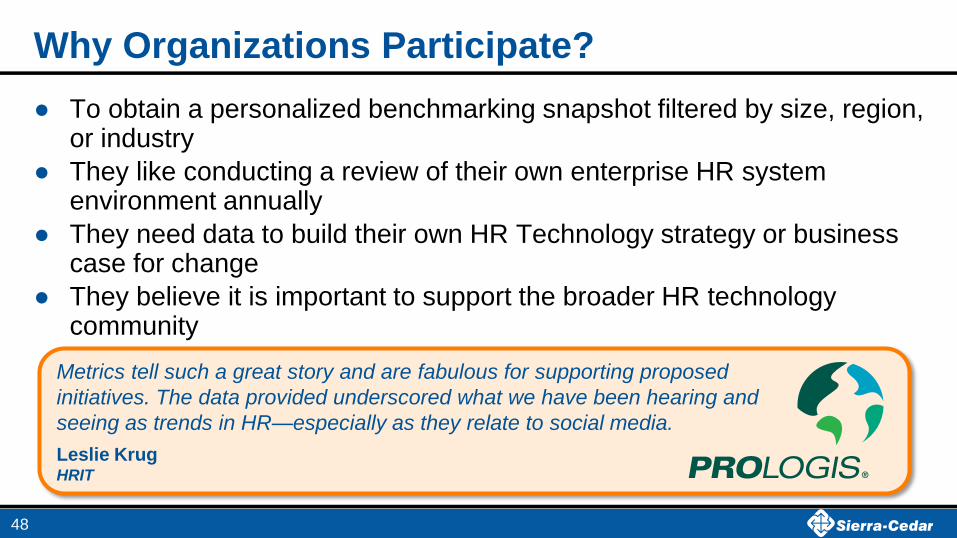
Metrics tell such a great story and are fabulous for supporting proposed
initiatives. The data provided underscored what we have been hearing and
seeing as trends in HR—especially as they relate to social media.
Leslie Krug HRIT
Why Organizations Participate?
● To obtain a personalized benchmarking snapshot filtered by size, region, or industry
● They like conducting a review of their own enterprise HR system environment annually
● They need data to build their own HR Technology strategy or business case for change
● They believe it is important to support the broader HR technology community
48

Introducing the “Top Performing Organizations” A Focus on Finances and Growth
Top Performing Top Quartile Non-Top Performing
Revenue
Per
Employee 2,000,000 444,000
Profit
Per
Employee 659,173 196,556
Operating
Income
Growth
(1 year)
0.28 -0.06
Return
On
Equity 0.36 0.11
49
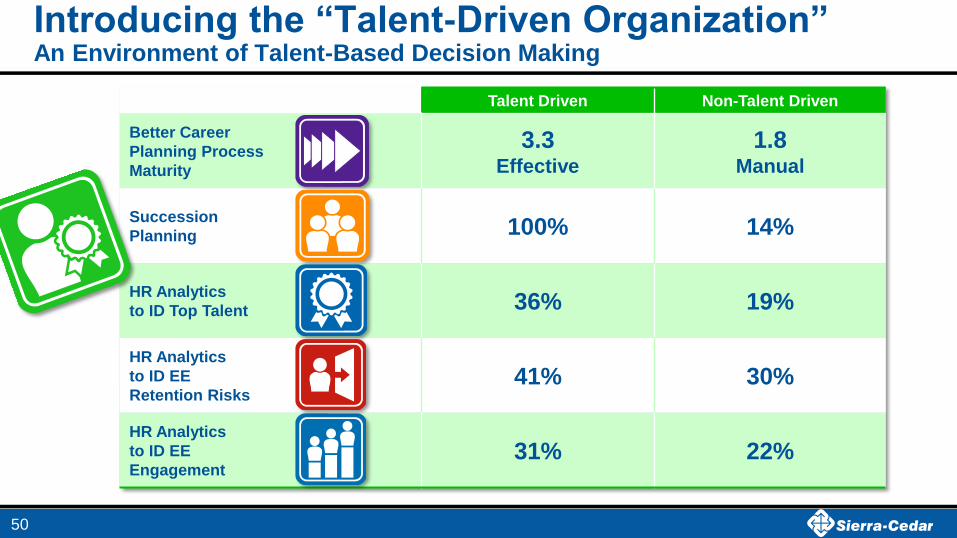
Introducing the “Talent-Driven Organization” An Environment of Talent-Based Decision Making
Talent Driven Non-Talent Driven
Better Career
Planning Process
Maturity
3.3 Effective
1.8 Manual
Succession
Planning 100% 14%
HR Analytics
to ID Top Talent 36% 19%
HR Analytics
to ID EE
Retention Risks 41% 30%
HR Analytics
to ID EE
Engagement 31% 22%
50
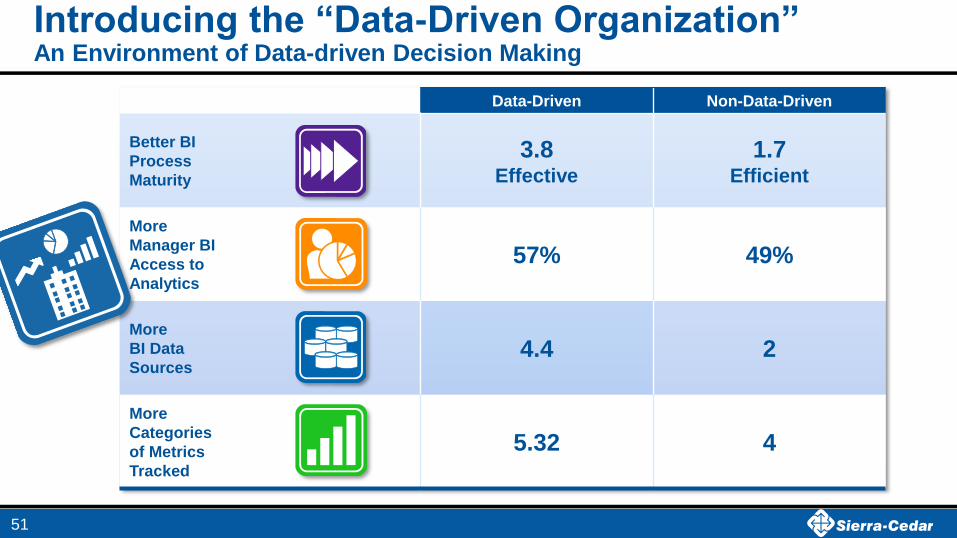
Introducing the “Data-Driven Organization” An Environment of Data-driven Decision Making
Data-Driven Non-Data-Driven
Better BI
Process
Maturity
3.8 Effective
1.7 Efficient
More
Manager BI
Access to
Analytics
57% 49%
More
BI Data
Sources 4.4 2
More
Categories
of Metrics
Tracked
5.32 4
51