Embed Size (px)
Citation preview

Data Structuring and Visualization of 3D Urban DataSome Aspects of the Doctoral Research “ 3D GIS for Urban Development”
Siyka Zlatanova, PhD candidateDr. K laus Tempfli , supervisor
ITC, 7500 AA P.O. Box 6, Enschede, the [email protected], [email protected]
Keywords: 3D GIS, VRML, data structuring, visualization, interaction, WWW
Abstract
The major idea of the current research is to build a concept for a 3D GIS appropriate for maintenance andreal-time manipulation of municipali ty data via Internet. A model containing geometric and thematicinformation about objects, spatial and thematic relationships should be developed. The research focuses thegeometric aspect of the problem with emphasis on development of a scheme to exchange data between thedatabase and rendering engines for visualization, navigation and manipulation.
The approach for visualization and interaction is based on the utili zation of Virtual Reali ty ModelingLanguage (VRML) and 3D Formal Data Structure (3D FDS). The VRML is chosen to model the scene forvisualization, i.e. to describe geometry, introduce dynamics, ill uminate the model, work via Internet, while 3DFDS is considered as basic data structure for data storage and spatial analysis.
A variety of visualization queries were performed in order to test suitabili ty of the couple 3D FDS and VRMLfor interaction with the model via Internet. The results of queries were visualized in HTML and VRMLbrowsers. The experimental work has revealed several shortcomings of 3D FDS with respect to fastcomposing of the VRML file:
1. The storage of coboundary relationship per face, i.e. left/right body, imposes maintenance of informationabout “air” body and “underground” body, which speeds down the formation of surfaces and bodies.
2. The explicit storage of boundary relationship per arc, i.e. begin /end node, does not show manyadvantages but requires extra traversing of one more table for visualization.
3. The implicit description of “holes” complicates the algorithms for coordinates extraction.
It can be concluded that all the necessary information for visualization of point, line, surface and simple bodyobjects can be extracted from the 3D FDS. However, organization of data is not eff icient to supply data for thefollowed approach.
One direction of the future work is related to extension of the conceptual model toward refinement of theobject identification, aggregation of multi-dimensional objects, definition of parameters describing behavior ofobject, developing a technique supporting LOD visualization. Another aim is refinement of the concept forpartitioning of the objects, especially surface objects, in order to avoid rendering pitfalls. The aspectsaddressed here contribute to clarification of a strategy for real-time manipulation of data.

1. IntroductionThe investigations of the current research are towards a strategy for a 3D GIS capable to deal with 3D urbaninformation, allowing interactive spatial queries via Internet. Each of these key issues requires specificconsideration and influences the selection of: 1)methods to collect data, 2)approaches to organize, retrieve andmaintain information and 3) techniques to visualize, navigate and interactively query the model (Tempfli andPilouk 1996).
3D urban data have always been diff icult to organize basically due to the complex geometry. Variety ofregular and irregular shapes, overhanging elements, concave shapes, multi-layered constructions, etc. are someof the trouble stones. The complexity requires appropriate subdivision of the space for simpli fication of thedata set and facili tation of data storage. In contrary, attribute and thematic data very often are assigned tocomposition of objects. The quite large amounts of data (geometry, text, texture) bring up questions of storageon distributed systems and special structuring of data (e.g. LOD for geometry and texture) for fast rendering.
A new aspect of the pursued 3D GIS is the manner of query and display of the outcomes. In the years of fasthardware and software development it is impossible to overlook some existing techniques for visualization andnavigation through models. At least low level virtual reali ty (VR) techniques like walk-through fly-over,examine, etc. has to be offered to improve legibili ty of data, facili tate manipulation and orientation inside themodel. Many software vendors already provide either tools to navigate through the model or export files whichcan be visualized in VR browsers. Techniques for introducing and controlli ng dynamic objects are alreadystandardized and platform independent. Therefore, working on a 3D data structure, relevant information forvisualization and interaction should be considered. The scope of the information stored per object has to beextended to embrace data and parameters for scene creation and dynamics.
The users of urban data are usually from various companies (e.g. municipali ty, electrical, water&sewagecompanies, tourist agencies, etc.) distributed in different building and parts of the town. Remote access to theinformation is obligatory if we want to: 1)to reduce the time and man-power for service and 2) to eliminatevisiting the GIS server to request information. One way is to build an Intranet network only among the users.Ànother way is to connect to Internet and fetch information via Internet. In both cases client-server connectionshould be established (see Figure 1)
Among the various problems related to 3D VR GIS thepresented paper focuses on several issues related toappropriate data structure for storage and retrieval ofinformation not only for spatial analysis but also forvisualization. First, a short explanation of the method forvisualization and query will be given, second, the structureof VRML and 3D FDS will be clarified and finally someconclusions and recommendations about 3D FDS as a datastructure capable to store data and respond to queries viaInternet will be presented.
2. The approachThe approach followed in the research is based on a combination of tools and techniques for access andexchange of data via Internet/Intranet (see Figure 1). Text information is visualized in the HTML and theVRML is utili zed for graphic information. This implies that the user has to be provided with software tobrowse text and graphics at the client station. The client works on a subset of the information (graphic modelor text in form of tables, lists, etc.) which physically can be either on the server or copied to the clientcomputer. The process of query, visualization and modification has several stages:
WWW
Local Client Remote Client
GIS SERVER
Figure 1: Client-server 3D GIS

1. User identification. At this stage a broad spectrum of important issues related to the protection of thedatabase, multi-user access, priority for modifications, etc. has to take place. Since the problems arebeyond the scope of the research, they will not be discussed further.
2. Query. The steps to request information are standard and widely implemented for various purposes(purchasing, searching). After user identification, the web server returns an initial form, where the usercan specify what kind of information he/she needs. The form is fill ed out by the user and send by the webbrowser at the client station (see Figure 2) back to the web server. The server executes a script whichextracts the necessary information from the data base, creates (on fly) a certain file (or files) and returnsthe result to the client. The simplest request to the web server is to return the URL of a file which alreadyexist, e.g. a file with the 3D graphic model of the entire town. Most often, however, the queries to the GISserver will be initiated by a user action inside the 3D model, e.g. the click with the mouse on a buildingcan be interpreted by the browser as request of information about the owner of the building.
3. Data visualization. The information received at the client site is visualized either in a HTML browser
(text, 2D graphics, etc.) or in a VRML browser (3D graphics and text). The user can interact with the 3Dmodel inside the VR browser, fly-over, walk-trough, examine and at the same time browse textinformation in the HTML browser. This can be displayed at the client screen in several ways: one windowwith several frames (see Figure 3a), several new windows (see Figure 3b) or combinations of them. Theindividual windows provide the user with more freedom to resize and adjust observed models, however,
Scr ipts: Java, Javascript, VBSscrip t
C G I s c r ip t s
database query&modification local query&modification
Database
Webserver
VRML browser
Web browser
GIS Server GIS Client
Figure 2: Data flow in client-server 3D GIS
a) one window b) several separate windows
Figure 3: VRML and HTML browsers at the client station
they complicate the control on displayed information and very soon create chaos on the client desktop. Theway to visualize 3D graphic information on the Internet is similar to visualization of text information. Afile with complete description of the scene for visualization, i.e. geometry, text, lights, texture, cameraposition, is created. The file is processed further by a VR browser which parses the information andcreates a scene graph. In fact the VR browser plays the role of the rendering engine in our approach.
4. Data modification. The term “data modifications” states for each change with the data set (geometry and
text). Graphic data modification can be deletion, adding, changing some values in the data set. When thechanges cover very large areas, indeed, automatic methods should be developed. Our interest, however, isin small changes which the user prefers to make manually. For example, texture changing for simulatingfuture changes of facades, operations on geometry for setting up a new building, positioning of trees todesign vegetation. The way to make such small modifications of geometric information is to utili zetechniques provided by the VRML, i.e. sensors, interpolators, or by scripts (Java, JavaScript or VBSscripts) written by the user and supported by the browser at the client station. The scripts run only at theclient side and do not influence the information on the server, neither the other clients. If the user isauthorized to change the information in the data base he has to follow a fill _out procedure similar to thequery of database, i.e. a form with desired parameters for modification and their new values has to befill ed in and sent to the server for processing by a CGI script on the server (see Table 1).
Table 1: Techniques for interactive manipulation of 3D GIS datalocal changes global changes
server (database) CGI scripts database updating softwareclient VRML, Java, etc. VRML, Java, etc.
Flexibili ty of the system in terms of an easy adjustment for various tasks, hardware and software independenceof the clients, are the major advantage of the approach. The software development does not need to start fromscratch. Many software modules already exist, e.g. fill -out forms, SQL scripts to access databases, securitytechniques, etc. A significant advantage is the use of Web and VRML browsers for display, which in practice,releases the software developer of the tedious work on graphics user interface. The approach ensures easy, lowcost, standardized access to 3D models.
3. Data structuresOne of the big challenges in 3D urban modeling is the visualization process with respect to increase readabili tyof data and realism of the model. Another advanced issue is interaction with the model and dynamicmodifications, which require clarification of object’s behavior. With respect to data structuring this means1)enhanced attribute information related to the visualization of geometry, e.g. material and color for rendering,texture for texture mapping, 2)parameters characterizing the behavior of dynamic objects. The strategy forvisualization and manipulation, described above, implies that VRML is used for scene design. Another datastructure, i.e. 3D FDS is used for data storage. Apparently, the major operation within thequery&visualization process is a conversion between 3D FDS and the standard VRML. Therefore, first, wewill make short overview of the mechanisms provided by the VRML to model 3D objects and after that wewill clarify the concept of 3D FDS.
3.1 VRMLAmong the rendering languages, VRML is a high-level language for scene modeling providing not onlytechniques and methods for rendering but also dynamics. The dynamics range from techniques to playanimation to detecting user actions (e.g. “mouse click”) and consequent reaction of objects. In this aspect themethods provided by the language can be classified as methods for scene design (geometry, lights, textures,etc.) and methods to bring dynamics.
The geometry can be performed by using predefined shapes (cone, box, sphere, etc.) or by sets of faces, linesand points. Since most of the geometry in urban areas is derived from measurements, it is diff icult to operate
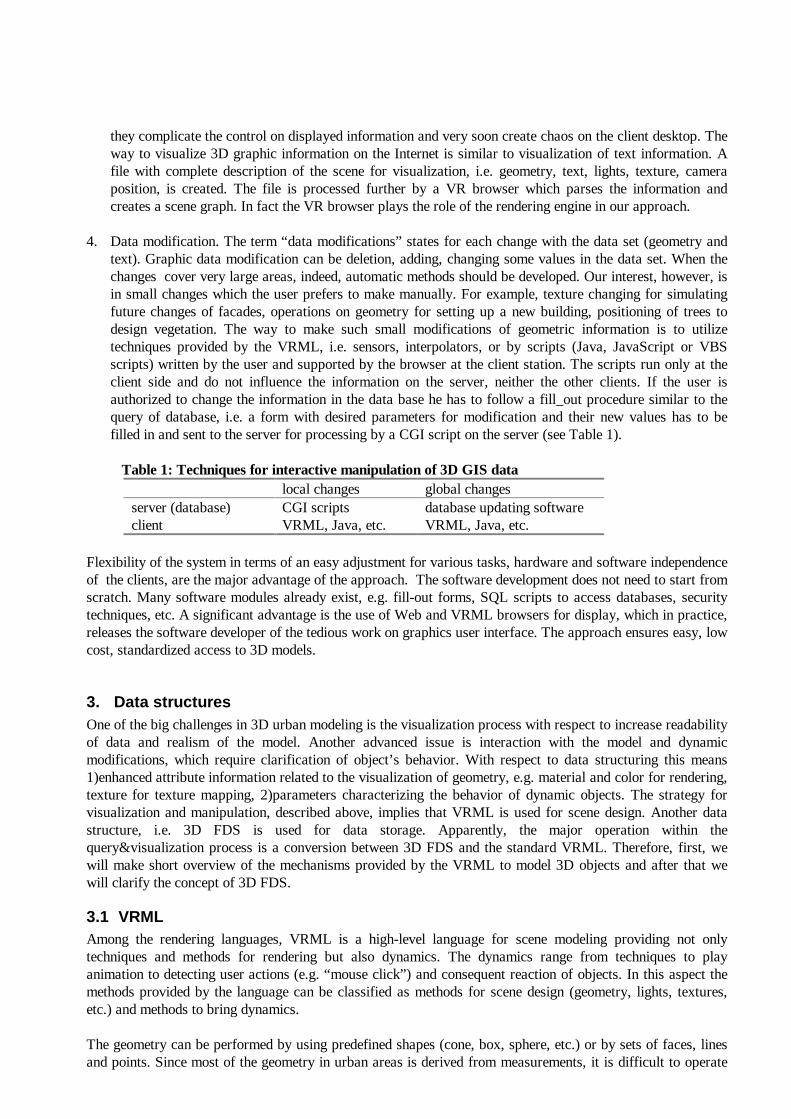
with predefined shapes. Therefore we will concentrate on the way VRML handles irregular shapes. The mainunit in the VRML is an object named node that can be everything, e.g.. geometry, text, view. The node dealingwith geometry is Shape, which has three basic elements: appearance, geometry and behavior. The appearancecontains data for rendering, behavior can be simulated by a combination of sensors for detection of user’sactions and interpolators for changing object’s parameters.
The geometry is presented by two lists: 1) the set of the all point coordinates composing an object and 2)ordered lists of points constituting the bordering faces (see Figure 4). The model created in this way is atypical shape model. Each solid object can be expressed as a function of faces and each face as function ofvertices. There is no principal difference in geometry of surfaces and solid objects. Line objects are lists ofvertices. The objects are embedded in Euclidean space.
The language follows an object oriented approach ensuring aggregations, encapsulation, classification, andinheritance mechanisms. Topology is build only among the vertices constituting one object. Despite the abili tyto create aggregations of objects, relationships “ inside” can be derived only by metric computations.
The VRML is quite suitable for urban modeling giving answer to some important questions, e.g. how toincrease the realism, how to visualize data in a faster manner. The solution of the VRML for realism isseveral operators allowing mapping of real photo images onto geometry. The way of mapping requires surfaceobjects textured with the same image file to be grouped (separated) in one object (see Figure 4, shape roof). Aspecial node permits Levels of Detail (LOD) techniques to be applied during visualization. The technique issimple and quite effective for real-time interaction with the model (Gruber et al. 1997). One object has severalgeometric descriptions (usually three): very detailed, e.g. all geometric details of the buildings plus texture;less detailed, e.g. only geometry without texture and coarse, e.g. only outlines of the buildings. The browseruses these several geometric descriptions per object for near and distant views, i.e. when the object is far wayfrom the observer a less detailed geometry is used.
In conclusion, the language is very flexible for composing objects, creating dynamic scenes, interactive workvia Internet, however, it is appropriate neither for data storage nor for performing spatial operations nor forfast rendering. It could be considered an intermediate step between data storage and visualization. The browsercreates its own scene graph (a kind of hierarchical data structure) for real time visualization and applies theneeded algorithms for rendering.
Figure 4: Modeling with VRML

3.2 3D FDS3D FDS was chosen for a basic data structure due to: abili ty for thematic and geometric description perobjects, vector approach to build geometry and 3D topology, expressed mainly as boundary relationships(Molenaar 1992). The data structure was tested already for various spatial analysis and promising results
were obtained (Rikkers et al. 1993, Pilouk 1996). Three levels can be distinguished in the model: two forgeometry and one for thematic classes (see Figure 5). Twelve conventions clarify model constraints, rules fordecomposition and intersection.
The first fundamental assumption is a full subdivision of the space, which implies that 1)the border betweentwo n-D objects is always only one (n-1) D object (n = 1,2,3) and 2)outer space (air) also should be consideredan object. The approach is opposite to the one followed in VRML, where composite of objects are build up,without information about the adjacent objects.
The other fundament of 3D FDS is “ the single valued map”, i.e. a geometric primitive (node, arc, face andedge) can appear in the description of only one elementary object of the same dimension (Molenaar 1989). Incontrast, the VRML allows one primitive to be part of several objects. The idea of single valued approach is topartition the space into non-overlapping (only relationship “meet”) objects (0,1,2,3 D) and thus ensuring 1:1relationships between objects and primitives of same dimensions, e.g. surface and face. In fact, the data modelis a partition of non-overlapping elementary objects of the same class. Some elementary objects from differentclasses can overlap, e.g. relationships “node on face”, “arc on face” are explicitly stored.
The structure has node, arc, edge and face as constructive primitives. The primitive edge is introduces onlyas a supporting element, defining left and right, however, it contains the orientation of the faces, which isimportant information for rendering engines, indicating which side of the face to be colored.
4. Implementation of the model (relational data structure)The conceptual model was tested, first for suff iciency of data to create the scene for visualization in theVRML and second, for eff icient traverse of the database to guarantee reasonable fast on-fly creation ofdocuments on the server. We used the implementation of 3D FDS into relation data structure presented by(Rikkers et al. 1993) and extended by (Tempfli and Pilouk 1996) for texture storage. The data model ismapped into 13 normalized tables (see Figure 6a). All the tables were realized (Paintsil , 1997) except “node onface”, “node in body”, “arc on face”, “arc in body” (see Figure 6b). Tables are stored in flat files and softwareto build the scene with VRML was developed. The experimental data set consists of buildings (body), surface,line and point objects from the central part of Enschede. The model is constructed by a semi-automatedprocedure developed at ITC (Zlatanova et al. 1998).
Rep r esents
C l a s sC l a s sC l a s s
F a c e
E d g e A r c
X Y Z
Bo r der
Le ft
Beg in
End
Is o n
Is in
Part of
Is in
Is o n
Backw or d
Fo rw ard
C l a s s
P o i n tL i n eB o d y
Part ofRig ht
N o d e
Geometric objects
Belo ng s to Be lo ng s to Be lo ng s to Be lo ng s to
Geomerticprimitives
S u r fa c e
Figure 5: 3D FDS - conceptual model

Since the data structure was tested mainly in the geometry domain, thematic analysis will not be discussedhere. The queries of interest for our approach are related to extraction of geometric information: coordinates,composing geometry of an object and the correct order of points bordering a face.
These queries, which we will name visualization queries, have two specific characteristics:• the traverse starts always from the highest level, i.e. object level• the traverse always ends on the lowest level, i.e. coordinates.
For example, to extract the coordinates of a body object, all the tables, i.e. BODYOBJ, FACE, EDGE, ARCand NODE, have to be visited. The time needed to scan the data base is proportional to the number of objectsto be included in a VRML file. For example, the user has a VRML file of the entire model and wants to see theshortest way to a shop. He initiates a query and fill s-in a form with the desired information, e.g. the address ofthe shop and the address of his location. All the needed objects inside the requested area are selected and thenthe visualization query is executed, i.e. “ collect coordinates and description of faces/lines per object” . Afterthat, highlighting the selected objects by changing their color or appropriate animation should be applied.Note, that the query and creation of the VRML file have to be executed on a remote server and the resultingfile has to be transferred back to the client. It is apparent that the time for traversing the database is crucial forthe system.
A close look at the process of creating a VRML file reveals some disadvantages of the relational organizationof data. The first problem comes from lack of explicit relationship face part of body . The query “collect allthe faces composing a body” requires entering and traversing the FACE table each time when a body orsurface object has to be included in the VRML file. Sometimes the number of faces, composing one buildingcan grow tremendously, e.g. up to 4000 triangles for the new ITC building. Automatically generated DTMleads also to large amounts of triangles.
The compulsory storage of left and right body per a face introduces a lot of useless repetitive information. Forexample, the information stored in the FACE table for a DTM is:
Table 2: Example of DTM data stored in the FACE tablefid bodyleft bodyright fpartofs… … … …
1245 -1 0 51246 -1 0 51247 -1 0 5… … … …
where 0 stands for air, -1 for underground and 5 is the identifier of the surface.
bid sid lid pid nid
arcendarcid xc yc zcnid
aisninbarcid
arcid aisonf
apartoflarcid
nid
nid
nisonf
nisinb
pclasslclasssclassbclass
BODYOBJ SURFACEO LINEOBJ POINTOBJ
arcpofl
arc node
arconf nodeonf
arcinb nodeinb
enoseq
face
arcbeg
arcid forbackfid
fid fpartofs bidleft bidright texturef
edge
SURFACEOsid sclass
BODYOBJbid bclass
LINEOBJlid lclass
POINTOBJpid pclass nid
FACEbidrightbidleftfid fpartofs
EDGEenoseq forbackarcidfid
ARCarcendarcbegarcid
NODEzcycxcnid
ARCPOFLarcid apartofl
texturef
a) all the tables b) implemented tables
Figure 6: 3D FDS - relation model

An improvement could be obtained if the FACE table is released a bit of all the data. The table contains links,which provide all the faces composing both body and surface. The way of storage has the an apparentadvantage for the link body-surface. However, it is diff icult to predict for a particular area how many surfaceswill be formed and certainly not every face is a part of surface. Therefore, the table face can be furthernormalized and the link face part of surface can be separated. This step limits search for all the facescomposing a surface only among the surface objects and avoid the traverse of the FACE table.
The previous step influences, however, the storage of the texture reference. In this research, real-photo imagesare used for texture. In this context, the field texturef points to a separate table containing the name of theimage file (JPEG, GIF, PGN) and a list of 2D texture coordinates for mapping onto geometry. The textureinformation is a type of attribute data related to the geometry of the objects. One object (body or surface) canbe textured with several images and one image file can be used for several surfaces. The approach followed inthis research is a separate image file for texturing per face. More details related to this topic can be found in(Sithole 1997). An advantage of this approach is the ease of data storage, while a limitation is theimpossibili ty to wrap a surface with one image file. In many cases draping with one image file is much moreeff icient, e.g. a DTM. To avoid this limitation the reference to the texture can be replaced in the tableFACEPOFS and enumeration of the faces part of surface has to be provided (see Figure 8a).
As was stated before, an indication which side of the face is textured can be necessary, e.g. two adjacentbuildings with a common wall (see Figure 4). This is quite important issue for dynamic modeling: suppose theuser shifts body2, both the wall of body1, which consists of face1 and face2, and the wall of body2 have tohave appropriate texture. For the purpose, a new column orient should be added in the table FACEPOFS (seeFigure 8a). A record in the FACEPOFS table is created only if the surface is created or texture exists. In otherwords in each case of existence of texture a surface object should be created. The procedure for constructingtextured body will be: 1)collect all the faces from face table, 2) compare orientation of the collected faces andthe orientation in facepos and assign the corresponding texture.
Modeling of line objects with VRML showed that visualization of simple lines does not provide realistic viewof the object. Better performance can be achieved if tiny cylinders instead of lines and small spheres instead ofpoints are used. Line modeling with predefined primitives (cylinders, spheres, etc.), however, require begin andend of line object to be established. The information in 3D FDS (only arc identifiers) is suff icient to constructthe line object, however the direction of the entire object is not known. The storage of the direction will speedup the process of extracting data for visualization, as well . The order of nodes is needed, which makes theproblem similar to order of nodes in edges, where forward/backward information is kept. Only a list of arcswill give the sequence of nodes but not beginning and end of the lines. Therefore a column with enoseq isadded to the ARCPOFL table (see Figure 8b).
The tables ARCINB and NODEINB rise the question aboutli ne and point objects inside the body “air” . In practice,every line object such as lamp, traff ic light, or point object,which is outside the buildings has to be registered in thesetables. Although this issue is not related directly to thevisualization process, it influences data storage, data editingand updating. Deletion of an object, which is inside the “air”body demands changes of the corresponding records in thesetables. A better solution is the storage of only those line andpoints objects, which are inside other than ”air ” bodies.
The data structure keeps explicitly the relationships “node on face” and “arc on face”. These relationships areproblematic for visualization in case of faces which are not triangles. In general, there is no conflict betweenthe VRML and the3D FDS in the representation of faces with more than three nodes. The limitation comesfrom the rendering engines, which deal only with triangles. All the other faces are subdivided by the renderingengine (in our case a VR browser) into arbitrary triangles. However, variety of artifacts (e.g. an arc flyingover the face) is observed on the screen, if an arc of “arc on face” relationships is not included into
face1
face2
body1
body2
face2
face1
face2
the "wall" of body2
the "wall" of body1
face2 is part of two surfaces
Figure 7: An example of a face needed twotextures
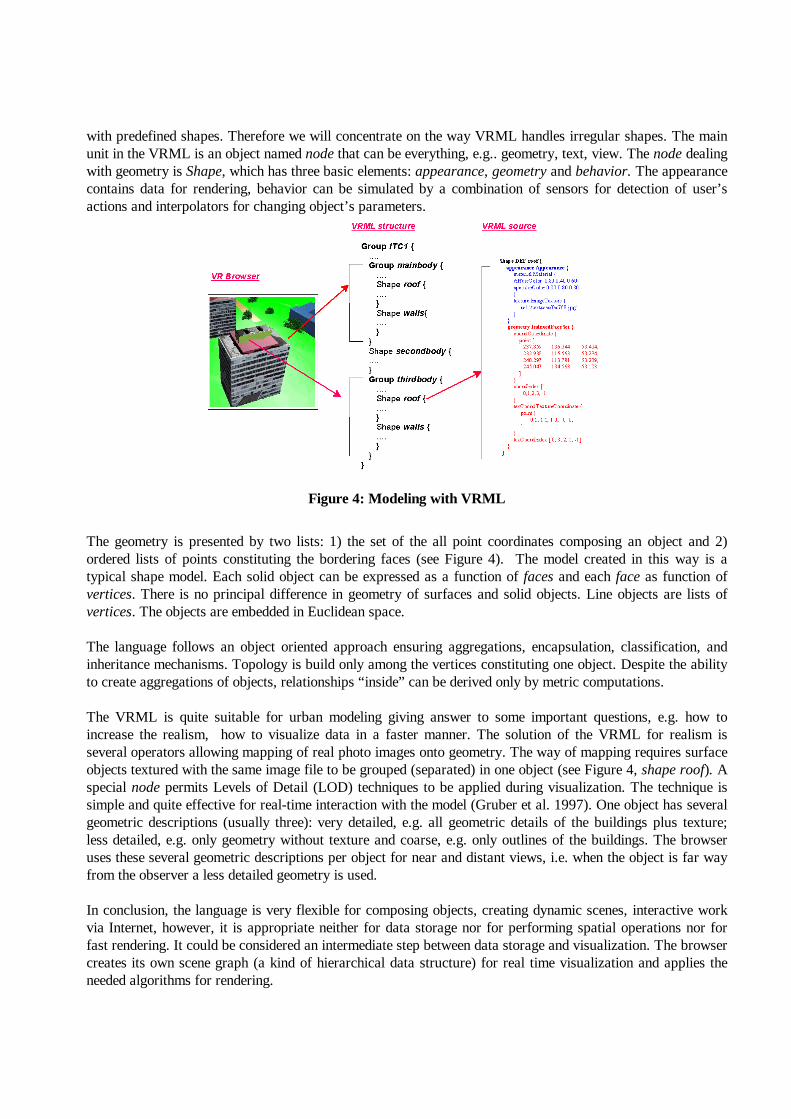
triangulation. The pitfall i s observed even if the face is strictly planar and the arc lies exactly on it. That is tosay the arcs and nodes have to be incorporated in the triangulation. The solution is not so simple. One way isalgorithms for triangulation on fly, prior the creation of a VRML file format to be performed. Createdtriangles, however, are not part of the database and eventual changes in the geometry are diff icult to behandled. The other way to avoid the problem is the storage of triangulated faces, which delivers new problemswhich will be discussed later. The obvious advantage is elimination of “arc on face” and “node on face” tables.
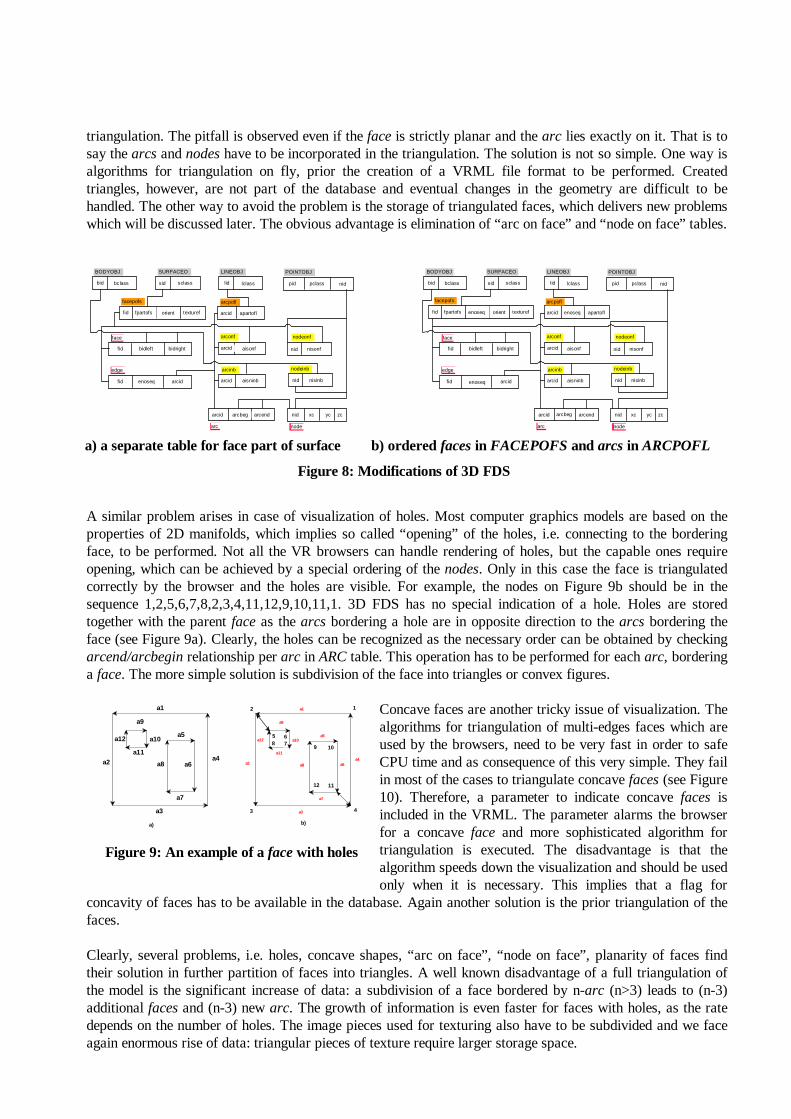
A similar problem arises in case of visualization of holes. Most computer graphics models are based on theproperties of 2D manifolds, which implies so called “opening” of the holes, i.e. connecting to the borderingface, to be performed. Not all the VR browsers can handle rendering of holes, but the capable ones requireopening, which can be achieved by a special ordering of the nodes. Only in this case the face is triangulatedcorrectly by the browser and the holes are visible. For example, the nodes on Figure 9b should be in thesequence 1,2,5,6,7,8,2,3,4,11,12,9,10,11,1. 3D FDS has no special indication of a hole. Holes are storedtogether with the parent face as the arcs bordering a hole are in opposite direction to the arcs bordering theface (see Figure 9a). Clearly, the holes can be recognized as the necessary order can be obtained by checkingarcend/arcbegin relationship per arc in ARC table. This operation has to be performed for each arc, borderinga face. The more simple solution is subdivision of the face into triangles or convex figures.
Concave faces are another tricky issue of visualization. Thealgorithms for triangulation of multi-edges faces which areused by the browsers, need to be very fast in order to safeCPU time and as consequence of this very simple. They failin most of the cases to triangulate concave faces (see Figure10). Therefore, a parameter to indicate concave faces isincluded in the VRML. The parameter alarms the browserfor a concave face and more sophisticated algorithm fortriangulation is executed. The disadvantage is that thealgorithm speeds down the visualization and should be usedonly when it is necessary. This implies that a flag for
concavity of faces has to be available in the database. Again another solution is the prior triangulation of thefaces.
Clearly, several problems, i.e. holes, concave shapes, “arc on face”, “node on face”, planarity of faces findtheir solution in further partition of faces into triangles. A well known disadvantage of a full triangulation ofthe model is the significant increase of data: a subdivision of a face bordered by n-arc (n>3) leads to (n-3)additional faces and (n-3) new arc. The growth of information is even faster for faces with holes, as the ratedepends on the number of holes. The image pieces used for texturing also have to be subdivided and we faceagain enormous rise of data: triangular pieces of texture require larger storage space.
bid sid lid pid nid
fid bidleft bidright
arcendarcbegarcid xc yc zcnid
aisninbarcid
arcid aisonf
apartoflarcid
nid
nid
nisonf
nisinb
pclasslclasssclassbclass
BODYOBJ SURFACEO LINEOBJ POINTOBJ
arc node
arconfface nodeonf
arcinb nodeinbedge
arcpofl
fid textureforient
facepofs
fpartofs
enoseqfid arcid
bid sid lid pid nid
fid bidleft bidright
arcidenoseqfid
arcendarcid xc yc zcnid
aisninb
aisonf nid
nid
nisonf
nisinb
pclasslclasssclassbclass
BODYOBJ SURFACEO LINEOBJ POINTOBJ
arc node
arconfface nodeonf
arcinb nodeinb
apartofl
arcpofl
edge
fid textureforientfpartofs enoseq
facepofs
arcbeg
enoseqarcid
arcid
arcid
a) a separate table for face part of surface b) ordered faces in FACEPOFS and arcs in ARCPOFL
Figure 8: Modifications of 3D FDS
a1
a2
a9
a11
a12
a3
a4a6a8
a7
a5a10
a1
a2
a9
a11
a12
a3
a4a8
a7
a5a10
9
12 11
10
a6
85 6
7
3 4
12
a) b)
Figure 9: An example of a face with holes

Therefore, we consider the partition into convex faces the most suitable way to avoid a variety of modelingproblems mentioned above. In general, the subdivided faces can be organized in 3D FDS but for the price ofmore data for storage.
One of the differences between 3D FDS and the VRML is related to the primitives used for description ofobjects. The 3D FDS maintains arcs, which is not a case in the VRML. In the 3D FDS, arcs are used only toexpress relationships among nodes, i.e. adjacency of nodes and establish their order, i.e. one of the nodes isfirst. These arcs are building elements for line objects and edge primitive, which are again sequences of arcs.Clearly, no other information than the order of nodes can be fetched from the ARC table. On the basis of thisconsideration we suggest to eliminate the ARC table from the data structure. A line object and edge primitivewill be sequences of nodes (see Figure 11). The substitution of sequence of arcs with sequence of nodes in theLINE and EDGE tables will not increase the number of records drastically: it remains the same in the EDGEtable and increases with one per line in the LINE table. Consequently, the global effect of this modification ofthe model will be significant reduction of data. The ARC table is one of the largest tables. The results ofexperiments with triangulated surfaces show that the ratio faces:arcs:nodes is 2:3:1. With elimination of theARC table relationships “arc in body” and “arc on face” are also superfluous, because “node in body” and“node on face” will present the same spatial relationships. Further investigations, however, are necessary forthe influence of this modification in spatial analysis domain. Deficit of arcs in a data model will complicatesome spatial analysis with line objects. For example, the query “ find with bodies are intersected by a givenline” , requires more operations than one presented in (Rikkers et al, 1993)
The last problem concerning 3D FDS is related to organization of supported by the VRML LOD. The LODcan be predefined and stored in the database or they can be created on fly. The lack of a technique to assignmore than one geometry description to an object, in practice, makes impossible the extension of the datastructure to maintain LOD.
a) correctly rendered concave face b) incorrectly rendered concave face
Figure 10: Rendering pitfalls
bid sid lid pid nid
fid bidleft bidright
nidenoseqfid
xc yc zcnid
nid
nid
nisonf
nisinb
pclasslclasssclassbclass
BODYOBJ SURFACEO LINEOBJ POINTOBJ
node
face nodeonf
nodeinbedge
nidenoseqlid
line
fid textureforientfpartofs enoseq
facepofs
Figure 11: A data structure without arcs
5. Conclusions and further researchThe work on modeling urban areas utili zing the 3D FDS and the VRML revealed several obstacles, whichmake the combination not so successful. The first question of our investigations referred the adaptabili ty of the3D FDS to contain information suff icient for the scene design. The answer is positive: the 3D FDS supplies allthe geometry information (coordinates, faces) needed for 3D visualization. Further elaboration of datastructure could permit information about geometry attributes and behavior to be maintained. Moresophisticated organization of texturing data has to be performed to enable advanced texturing techniques.
The troubles come with the dynamic query and adequate responses by the model in relatively fast manner. Wehave found the 3D FDS quite slow and not appropriate for real-time editing and manipulation via Internet.Based on our implementation work we figured out some week sides of the data structure, which can besummarized as follows:
• lack of spatial indexing: all the constructing primitives are stored in only four tables which have to bescanned for each object
• lack of explicit boundary information per body object, which requires collection of faces from the FACEtable.
• storage of arcbegin/arcend relationship, which complicates algorithms for coordinate extraction.• storage of coboundary relationship per face, i.e. left/right body, which leads to repetitive information• the implicit description of “holes”, which requires more sophisticated and thus slower algorithms for data
extraction.• explicit storage of relationships “arc on face” and “node on face”, which involves algorithms for
triangulation of the parent face• single-valued concept, which makes organization of LOD and thus visualization of large photo textured
models, impossible
One direction of future work is extension of the model toward aggregation of multi-dimensional objects andabili ty for parametric description. For the purpose, a data structure simpli fied to contain only faces and nodeswill be used as basic topological model, on which an R-three structure will be build up. We expect to be ableto organize easily several LOD and provide rules for aggregation of multi dimensional objects. Another aim isrefinement of the concept for partitioning of the objects, especially surface objects, in order to avoid renderingpitfalls. The aspects addressed here contribute to clarification of a strategy for real-time manipulation of dataand corresponding data structure for organization of data.

References
1. GRUBER, M., M. KOFLER and F. LEBERL,1997, Managing large 3D urban data base contentssupporting photo texture and levels of detail , In Proceedings of the Ascona Workshop'97, automaticextraction of man-made objects from aerial and space images, pp. 377-386
2. MOLENAAR, M., 1989, Single valued vector maps; a concept in Geographic Information Systems, GIS,Vol. 2, No. 1, pp. 18-27
3. MOLENAAR, M., 1992, A topology for 3D vector maps, ITC Journal 1992-1, pp. 25-334. PAINTSIL, J., 1997, 3D Topographic Data by Aerial Photogrammetry, MSc Theis, ITC, 95 p.5. PILOUK, M., 1996, Integrated Modeling for 3D GIS, PhD thesis, ITC, 200 p.6. RIKKERS R., M. MOLENAAR and J. STUIVER, 1993, A Query Oriented Implementation of a 3D
topologic Data structure, In EGIS'93: Vol.2, pp. 1411-14207. SITHOLE, G.,1997, Digital photogrammetry for automatic photo-texture extraction, MSc thesis, ITC,
104 p.8. TEMPFLI, K. and M. PILOUK, 1996, Practical Photogrammetry for 3D-GIS, In Proceedings of
ISPRS’96, Vol. XXX I, Part B4, pp. 859-8679. ZLATANOVA, S., J. PAINTSIL and K. TEMPFLI, 1998, 3D Object reconstruction form aerial stereo
images, In Proceeding of the 6th international conference in Central Europe on computer graphics andvisualization'98: Vol. III , pp. 472-478