Embed Size (px)
Citation preview

SRI International 1 10/31/07
Data Sets and Inquiry in Geoscience Education
Final Report NSF GEO 0507828
Dr. Daniel R. Zalles (Principal Investigator)
SRI International
Dr. Janice Gobert (co-Principal Investigator)
Worcester Polytechnic Institute
Dr. Edys Quellmalz (co-Principal Investigator)
WestEd
Amy Pallant (Senior researcher) Concord Consortium
October 31, 2007
This material is based upon work supported by the National Science Foundation under Grant No. 0507828.Any opinions, findings, and conclusions or recommendations expressed in this material are those of the author(s) and do not necessarily reflect the views of the National Science Foundation.

SRI International 2 10/31/07
TABLE OF CONTENTS ACTIVITIES
PROJECT MANAGEMENT AND COORDINATION.................................................. 3 DEVELOPMENT OF DESIGN PRINCIPLES............................................................. 4 DEVELOPMENT OF PROTOTYPE MODULES........................................................ 4 ADVISORY PANEL INPUT........................................................................................ 12 DETERMINING APPROPRIATE TECHNOLOGY PLATFORM FOR MODULE ADMINISTRATION.................................................................................... 15 DETERMINING APPROPRIATE TECHNOLOGY TOOLS........................................ 15 FEASIBILITY TESTING............................................................................................. 16 PILOT TESTING........................................................................................................ 16 SCORING ASSESSMENT RESULTS....................................................................... 19 DESIGN SCENARIOS............................................................................................... 20 EVALUATION............................................................................................................ 20 DISSEMINATION....................................................................................................... 21
FINDINGS PROJECT MANAGEMENT AND COORDINATION.................................................. 22 ALIGNMENTS TO STANDARDS AND EXISTING CURRICULA.............................. 22 ADVISORY PANEL INPUT........................................................................................ 22 FEASIBILITY TESTING............................................................................................. 23 PILOT TESTING OF CLIMATE MODULE................................................................. 24 PILOT TESTING OF PLATE BOUNDARIES MODULE............................................. 41 DESIGN TEMPLATE AND SCENARIOS ON ADDITIONAL GEOSCIENCE TOPICS...................................................................................................................... 50 DISCUSSION............................................................................................................. 54 DISSEMINATION....................................................................................................... 55 CITATIONS................................................................................................................ 56
APPENDICES A. EVALUATION REPORT........................................................................................ 57 B. TEMPLATE FOR SUPPLEMENTARY CURRICULUM AND ASSESSMENT MODULES............................................................................................................. 62 C. ASSESSMENT RESULT STATISTICS FROM THE TWO CLIMATE MODULE PILOT TESTS....................................................................................... 64 D. ASSESSMENT RESULT STATISTICS FROM THE PLATE BOUNDARIES MODULE PILOT TEST........................................................................................ 71

SRI International 3 10/31/07
ACTIVITIES
ACTIVITY 1. PROJECT MANAGEMENT AND COORDINATION Project Management. SRI International (SRI) is the prime grantee and coordinator of DIGS project tasks and subcontractors. Dr. Edys Quellmalz, SRI, was the Principal Investigator until 2007, responsible for coordinating and monitoring the technical activities and budget of both SRI internal tasks and the tasks of the subcontractor, Concord Consortium. Dr. Daniel R. Zalles, Educational Researcher at SRI, served until June 2007 as Co-Principal Investigator, leading the development of the unit and assessment about climate change. In June 2007, Dr. Zalles was authorized by NSF to become the PI when Dr. Quellmalz resigned her position at SRI and moved to WestEd. The Concord Consortium subcontract was led by Dr. Janice Gobert. Dr. Gobert and senior researcher Amy Pallant developed and piloted the unit and assessment about tectonic plate boundaries. Concord Consortium participated in weekly or bi-weekly project meetings with SRI staff and collaborated with SRI in the conceptual and programming aspects of unit and assessment task development. Zalles, Gobert, and Quellmalz directed the piloting and field-testing of the units and assessments, as well as the rubric-based scoring, analysis, and documentation of student assessment outcomes. Dr. Carlos Ayala, Assistant Professor, Curriculum Studies and Secondary Education at Sonoma State University, served as the External Evaluator. Project Goals. The project was designed to demonstrate exemplary designs of supplementary geoscience instructional and assessment activities that promote greater student understanding of how datasets and visualizations can be used to conduct geoscience inquiry. The goals of the project were to: 1. Develop design principles, specification shells, templates, and prototype exemplars for
supplementary modules (units and performance assessments) to provide evidence of: a. students’ geoscientific knowledge and inquiry skills (including data literacy skills) b. students’ abilities to access, use, analyze, and interpret geoscience data sets using
appropriate computer software 2. Pilot-test modules in two geoscience domains to ascertain module quality and feasibility of
implementation and technical quality of the performance assessments and accompanying scoring rubrics. Address relevant national standards.
3. Develop scenarios for additional modules for other geoscience topics in order to exemplify the module design principles.
4. Use appropriate computer-based technology to support the online delivery of the modules and enhance the modules' capabilities for facilitating student learning.
Goals 1 and 2 were the focus of the first year of the project. Goals 1 and 2 continued to be the focus of the work in Year 2, as was Goal 3.

SRI International 4 10/31/07
ACTIVITY 2. DEVELOPMENT OF DESIGN PRINCIPLES (Goal 1) Starting with national standards as the foundation, we developed a set of design principles that would inform module development. These design principles are: 1. The units need to be capable of being completed in 4 to 5 class periods and the
assessments in 1 to 2 class periods, in order to be attractive as supplements in the crowded typical science curriculum.
2. The modules (units and performance assessments) should focus on problem-based inquiry tasks (Evenson & Hmelo, 2000; Hmelo-Silver, 2004) with authentic data sets and content-appropriate data visualization and manipulation tools. This should facilitate greater student understanding of the use of datasets and visualizations in inquiry in different geoscience disciplines, Students should examine publicly-available data sets with the help of software tools that permit them to select, simulate, and represent the data in different ways. The students should explain their thinking as they respond to the problems. The task structures should permit measurement of task-appropriate components of inquiry, including stating research questions, posing hypotheses, planning and conducting investigations, gathering evidence, analyzing data, considering disconfirming evidence, and communicating explanations.
3. Performance assessments should be administered at the end of the module that are suitable for measuring students’ conceptual understandings and abilities to conduct and communicate investigations of significant, recurring problems (Baxter & Glaser, 1998; Bransford et al., 2000; Pellegrino et al., 2001). The performance assessments should present tasks which require that students transfer the inquiry skills and use of datasets and visualizations practiced in the units to new, yet conceptually-related problems. The assessment results should provide data on the students’ interactions with and manipulation of the visualizations and data sets and also document achievement of inquiry skills.
As we developed the modules, our challenges were to (1) identify the appropriate level of cognitive demand for technology use, data analysis, and other aspects of inquiry; (2) adequately scaffold the science and technology tools without overwhelming students with complexity, and (3) provide sufficient flexibility for teachers to tailor the implementation to their teaching style yet still maintain the module's key activities. The team also needed to make reasonable assumptions about students’ experiences with the geoscience content since the units were intended to supplement to the regular curriculum. ACTIVITY 3. DEVELOPMENT OF PROTOTYPE MODULES (Goal 1) We began by identifying which topics should be the focus of the modules. National and state (California and Massachusetts) standards on the topics were examined, then ranges of possible unit objectives and activities, interactive technologies, publicly available data sets, and content-appropriate data visualization formats were identified that might be used. The topics, tectonic plate boundaries and climate change, were chosen primarily because (1) the topics are widely taught in upper-level middle and/or secondary-level science curricula and (2) they present contrasting epistemic challenges with different implications for what types of problem-based tasks, data representations, and classroom inquiry activities are appropriate. Typical secondary science curricula were then analyzed to examine how texts addressed the topics. Then, as we chose topics and the specified student tasks, we selected data sets, visualizations, and software tools that would be appropriate for use by secondary students. Our selection criteria were that (1) the data sets needed to be sufficiently large to permit the

SRI International 5 10/31/07
investigation of change patterns in the phenomena and (2) the software needed to support student choice of data to examine, with a sufficiently simple interface for students to use with a brief tutorial. We established criteria that would guide how we developed the modules. Our development criteria were to (1) specify appropriate levels of cognitive demand for the science knowledge, inquiry tasks, and technology use; (2) build upon the science knowledge addressed in existing core curricula, and (3) provide sufficient flexibility in the module tasks to accommodate varying teacher instructional approaches. Drafts of specification shells were developed to guide the modules’ evolving designs. The shells outlined major unit and assessment activities, their problem-based activity sequences, and their alignments with national science inquiry and content standards.
Figure 1 displays the structure of the DIGS modules. Students complete 4-5 day supplementary curriculum units on important geoscience topics. In the process, they investigate authentic problems by examining publicly-available data sets with the help of appropriate software tools that permit them to select, simulate, and represent the data in different ways. The performance assessments present tasks which require that students transfer the use of datasets and visualizations and inquiry skills practiced in the units to new, yet conceptually-related problems. The assessment results provide data on the students’ achievement of content and inquiry skills and manipulation of the visualizations and data sets.
Figure 1: DIGS Module Design
We developed alignment tables and scenario specification shells to support the modules and cover both unit and assessment components of the respective modules. Specification shells present summary information about the modules’ activities, technologies, and data, plus alignments to NSES Inquiry and Content standards and AAAS standards (referred to as “benchmarks” by the AAAS). Alignment tables show which specific items are aligned to which standards. The alignments reflect which standards are addressed in the student skills and
Standards (content and inquiry)
Curriculum Units (4-5 class periods)
Performance Assessments (1-2 class periods)
Data sets
Data visualization tools
near-transfer

SRI International 6 10/31/07
understandings for which assessment items yield evidence. Corresponding alignments are made to unit activities that provide the opportunity for students to learn and practice the skills and understandings that are demonstrated in the student responses to the assessment items. It is this relationship between the opportunity to learn and practice the skill or understanding in the unit and the demonstration of the skill or understanding in the near-transfer problem offered in the assessment that the specification shells and alignment tables chronicle. Final versions of these documents are on the DIGS web site (http://digs.sri.com). The following are broad descriptions of the two modules that we developed under this project. For full details about the tasks in the modules, visit the unit directions, assessment directions, and specification shells on the DIGS web site. All module materials can be accessed from the respective module teacher pages on the site. Climate Module Description. In the Climate module, The Heat Is On: Understanding Local Climate Change, students draw conclusions about the extent to which multiple decades of temperature data about Phoenix suggest that a shift in local climate is taking place as opposed to exhibiting nothing more than natural variability. The data are from the Global Climate Historical Network (GHCN) database. GHCN is a large, multi-year, international project to measure temperature, precipitation, and air pressure from near the ground. Each monthly maximum and minimum temperature is the highest and lowest temperature reading for the month, measured in Celsius. In Phoenix and in most other places, the temperature data are collected at local airports. In Part A of the Climate module, students informally sample data from large year-by-year, month-by-month GHCN temperature data sets to critically examine if trends are evident. They create bar graphs to display the data they select for their sample. By the end of the unit, the students should recognize that the trends in the focal city, Phoenix, are more evident at night than during the day, and that these variances among the data have different implications for what may be causing local climate change. In Parts B and C of the module, students compare the change trends in Phoenix to larger geographically-distributed temperature-change trends, and then investigate if there is evidence of a relationship between the temperature data and the data about human influences on the environment (e.g., carbon emissions, pollutants regulated by the Environmental Protection Agency, and changes in population and development). The students are challenged in the unit to differentiate among the different impacts of these human influences. For example, in analyzing data and drawing conclusions, the students are supposed to apply their understanding of how some but not all EPA-regulated air pollutants induce a greenhouse effect in the atmosphere, how readings of anthropogenic carbon emissions in the atmosphere are not the same as readings of carbon accumulation, and how the increase in size of a developed urban area is more likely to cause increased urban heat island effects than increased greenhouse effects. Finally, in Part D of the module, students think critically about what can and cannot be known from the available data, recommend courses of action to address warming, and propose a research study to detect effects. In an extension activity, they learn that scientists are still struggling to explain why some places exhibit growing variances between night-time and daytime temperatures and how conclusions about climate change from the GHCN data should be tempered by acknowledgement of the fact that many GHCN monitoring stations are located at airports.

SRI International 7 10/31/07
The performance assessment for this module requires that students apply the methods and findings from the investigation of the climate data for Phoenix to climate data for Chicago. The Chicago data shows less evidence of trends in temperature change, and this is most evident comparing the night-time minimum temperature fluctuations between the two cities. Chicago also exhibits less increase in urban development and population growth than does Phoenix. In contrast to the curriculum unit, which primarily uses constructed-response tasks to encourage student explanation and discussion, the climate assessment tasks pose explicit selected- and constructed-response questions to ensure that the items elicit the intended thinking and hence provide evidence of the targeted standards-aligned skills and understandings. For example, in the unit students are asked to construct an interpretation or conclusion, whereas in the assessment, an item may present a set of choices which students then justify. Figure 2 displays examples of graphs of air temperature data that students examine for trends. Figure 3 shows examples of MyWorld™ GIS images that students critically examine for evidence of relationships (converse or inverse) between geographic distributions of anthropogenic carbon emissions and 30-year mean temperature differences.

SRI International 8 10/31/07
Figure 2: Excel Graphs of Air Temperature Data from Phoenix and Chicago

SRI International 9 10/31/07
Figure 3: Global Distributions of Carbon Emissions and Temperature Changes
1 2 Design decisions further guiding the development of the Climate Module included:
• determining the appropriate number of data sets and visualizations to prompt the intended inquiry in the short unit and assessment time frame
• representing the science and scientific uncertainty accurately • determining the appropriate amount of technology use • determining the appropriate amount of scaffolding to help students synthesize
observations from different data sets that have different ranges, relationships, and characteristics (e.g., nominal vs. ordinal)
• promoting the expression of amounts of scientific uncertainty that befit the limitations of the data at the students’ disposal (e.g., through self-ratings of confidence in conclusions and proposals of alternative hypotheses).
Plate Boundaries Module Description. The Plate Boundaries module, On Shaky Ground: Understanding Earthquake Activity Along Plate Boundaries, engages students in use of a time-based simulation to explore earthquakes’ relationship to the characteristics of plate boundaries in the Earth's crust. The tool used in this module, Seismic Eruption,3 simulates multiple decades of three-dimensional data about earthquakes around the world. In the module, the students:
1 Image is from Hansen, J., Sato, M., Ruedy, R., Lo, K. Lea, David W., Medina-Elizade, (2006). M. Global temperature change. Proceedings of the National Academy of Sciences, Vol. 103, p 14288. Published online Sept. 25, 2006. Retrieved on 5/18/2007 from http://www.pnas.org/cgi/reprint/0606291103v1.pdf. Image retrieved from Pearce, Fred. One Degree and We're Done For. New Scientist. Vol. 191., Number 2571, September 30, 2006. p. 8. Retrieved on 5/18/2007 from http://www.newscientist.com/data/images/archive/2571/25713301.jpg. 2 Image is from Carbon emissions data set copied from software program WorldWatcher: A Global Visualizer for Windows, Version 3. Created by the SSciVEE and WorldWatcher Curriculum Projects at Northwestern University. GIS images from My World™, Version 4.02. Copyright © 2000-2006 Northwestern University. All Rights Reserved. 3 Seismic Eruption. Version 2.1. Level 2006.05. © Alan Jones, 1996-2006. Freely available for downloading from the Web at http://www.geol.binghamton.edu/faculty/jones/#Seismic-Eruptions.

SRI International 10 10/31/07
• hypothesize about earthquake likelihood at locations around the world • observe earthquake patterns along divergent, convergent, and transform boundaries • collect data and compare earthquake depth, magnitude, frequency, and location along
the different plate types (convergent, divergent, transform) of plate boundaries • analyze earthquake data sets from United States Geologic Survey database along
different boundaries in data tables and in map representations • develop visualizations of plate boundaries (e.g., create cross-sections using the Seismic
Eruption tool, draw cross-sections) • relate interactions of the plates to the emergent pattern of earthquakes.
In part A of the module students predict what kind of earthquake hazards there are at three cities around the globe and are asked to assign a number to each city from a Likert scale that represents the risk of a major earthquake hazard. The students are asked to explain their reasoning about why they assigned that number. This question is revisited at the end of the module to see how much the students learned. In part B of the module, the students familiarize themselves with the Seismic Eruption software. The students look at maps which show earthquakes worldwide, and are also able to view cross-sections of the crust to see what kind of patterns the earthquakes make. The students answer a series of simple data-literacy questions. Part C prompts the students to come up with characteristics of the earthquakes that they observed at different plate boundaries in part B. Item C1 asks them to brainstorm a list of patterns and characteristics. C2 asks a general question about the occurrence of earthquakes at plate boundaries, while C3 is more specific in asking for characteristics of the earthquakes at the three different boundaries. In Part D of the Plate Boundaries module, the students revisit the Seismic Eruption software and print out screenshots of cross-sections that they take at each of the three boundaries. The cross-sections are used for answering questions in the following part, but also can be evaluated to determine the skill the students have with using the software and picking out locations that will show useful data. In Part E , students answer questions about the characteristics of earthquakes at the three different boundaries. The students are asked to elaborate on the magnitude, depth, frequency, and location of the earthquakes. Then the students are asked to explain how the movements of the plates at each boundary account for the patterns in the earthquake data on which the students just elaborated. This part guides the students by first having them identify patterns and then explain the patterns. Part F prompts students to apply their knowledge by presenting them with two tables of earthquake data. The students are asked to identify the type of boundary represented by each table, and to give three pieces of evidence each to back up their claim. Part G revisits the questions in part A. This revisiting exercise was included in the unit so that students have an opportunity to rethink prior answers and hence demonstrate what they have learned. To show the kind of data students are using, Figure 4 displays a two-dimensional overhead view of earthquake activity between 1960 and the present from the Seismic Eruption tool, in relation

SRI International 11 10/31/07
to plate boundaries. Figure 5 displays a cross-sectional view of earthquake activity between 1960 and 2007 at the Mid-Atlantic ridge location specified in Figure 4, plus the key for interpreting the symbology.
Figure 4 : Plate Boundaries and Simulated Earthquake Activity
Figure 5 Cross-Sectional View of Earthquake Simulation

SRI International 12 10/31/07
In the performance assessment for the Plate Boundaries module, the students run and analyze historical simulations of parallel earthquake data sets but on a type of plate boundary different from the one investigated in the unit. Assessment items A1 and A2 ask what similarities and differences, respectively, one might expect to find between the three types of convergent boundaries, and ask the students to state what they are basing their hypothesis on. The goal of these questions is to prompt them to make predictions on a transfer task regarding different types of specific convergent boundaries (continental-continental, oceanic-oceanic, and oceanic-continental). In part B of the assessment, the students are shown a map of the world with earthquakes marked and with three locations pointed out, along with three cross-sections. The students are asked to describe what they see in the cross-sections and are told to match the cross-sections up with the locations on the world map and identify the boundary types. This section makes available more data for the students to use, but requires that they use what they have learned to identify the type of boundary depicted from the visualizations. In part C of the assessment, the students are prompted to draw conclusions. C1 asks them to complete a table by listing the magnitudes, depths, and locations of the earthquakes at each of the three boundaries. This question assesses how much content knowledge the student had gained. C2 prompts the students to sketch the three types of convergent boundaries, much like in the unit, though the students are only specifically asked to label the location of the earthquakes, and the question does not mention geologically significant features. Its intent is to bring about understanding by having the students make a 2-D representation of a 3-D mental model. It also brings to light misconceptions the students may have about the processes along the boundaries. In question C3, the students are asked to describe how the processes along each boundary result in the patterns of earthquakes exhibited in the data. This question is similar to C2, but asks for the response in words instead of a drawing. Finally, C4 asks them to look at a certain location on the map from part B and predict the likelihood of a big earthquake (magnitude greater than 6.5) in the next 50 years, and to explain their reasoning. Design decisions shaping development of the Plate Boundaries module included:
• incorporating into the student materials the appropriate amount of scaffolding for running the seismic eruption simulations
• building in more inquiry opportunities in addition to data analysis • developing a context setting which was relevant when the content was not about
earthquakes and their hazards specifically, but more generally about the likelihood of earthquakes.
ACTIVITY 4. ADVISORY PANEL INPUT (Goal 1) We convened a full-day meeting of the project’s advisory panel and consulting scientists on January 20, 2006 at SRI. The advisors were Daniel Edelson (Northwestern University), Dan Barstow (TERC), Cathryn Manduca (Carleton College), and Barbara Nagle (Lawrence Hall of Science). The consultants were Christopher Hancock (TERC), Mark McCaffrey (University of Colorado), and Justin Rubenstein (Stanford University). The proposal references all of the above individuals except for Dr. Rubenstein. We brought Dr. Rubenstein into the project as a consultant soon before the meeting to provide additional scientific expertise about plate tectonics and earthquake measurement. His doctoral research at the Stanford Department of

SRI International 13 10/31/07
Geophysics involved using microearthquakes as probes of larger earthquake rupture. The external evaluator, Carlos Ayala (Sonoma State University), participated as well. Drafts of shells and alignment tables were given to the advisors for their review prior to the meeting and they provided feedback about these documents at the meeting. For their follow-up reviewing activity in winter 2006-2007, they were given updated versions of these materials plus teacher directions, student unit directions, student assessment directions, and student response forms per module. The meeting began with an overview of:
• the goals of the project • our plans for determining a technical infrastructure that would support online delivery of
the units and assessments • our processes for development and testing, and • our plans for a template and additional scenarios that would support the development of
more units and assessments that serve the same general objectives in other geoscience areas.
Next, we presented our first drafts of specification shells for the modules and assessments, and Dr. Ayala presented his evaluation design. Finally, we sought advice about what issues should be addressed in pilot testing of the modules in schools. Issues such as availability of computers, data access, and student response capture were discussed. Soon after the meeting, we decided to add another content consultant, Dr. Christopher Anderson, a practicing climatologist who could provide more input about the scientific accuracy and authenticity or the Climate module activities. Dr. Anderson is Lead Mesoscale Modeler at the NOAA/ESRL/GSD/FAB in Boulder, Colorado. His doctoral research involved examining hydrological processes in regional climate simulations. The advisors were asked to give feedback on the modules and assessments between pilot tests. Figure 6 shows a questionnaire they were asked to complete.

SRI International 14 10/31/07
Figure 6: Advisory Panel Review Questionnaire
DIGS Project
Review Questionnaire Climate Unit and Assessment
Name: Date: The overall project's objective is to develop prototypes of supplementary curriculum units and performance assessments that provide evidence of students’ geoscientific knowledge and inquiry skills (including data literacy skills) and students’ ability to access, use, analyze, and interpret technology-based geoscience data sets. The climate unit’s overall objective is to help students develop greater understanding of the types of critical thinking that real climatologists exercise when called upon to make judgments and render advice on complex scientific phenomena for which the available public data are limited. The climate unit engages students in using science knowledge about climate addressed in their regular curriculum to conduct investigations involving the use of authentic climate data sets and visualizations. Please go to http://digs.sri.com. There, you'll find: • Teacher introduction and directions • Specification shell for the unit and assessment • Alignment tables for the unit and assessment The specification shell for the unit and assessment specifies the science content and inquiry standards that are addressed by the climate unit activities and assessment tasks and questions. Please read the specifications documents first as overviews of the unit and assessment targeted content and structure. Then, read the Teacher Introduction and directions and follow the links to the unit and assessment. We would appreciate any additional comments or recommendations you would like to make. Questions: 1. How well do the climate unit and assessment address the goals of the DIGS project? 2. To what extent do the tasks in the unit and assessment align to the specified standards, as identified in the rows of the specification shell? 3. Comment on the appropriateness of the climate unit and assessment for the high school level. 4. Are the pedagogical strategies appropriate for addressing the unit goals? 5. To what extent are the uses of technology and data appropriate for the high school level and for the five-day period of time allotted for the core unit components? 6. To what extent are the science content and inquiry activities accurately portrayed and communicated? 7. Do the unit and assessment activities seem engaging? 8. What additional comments and recommendations will help us improve the unit and assessment?
SRI International 15 10/31/07
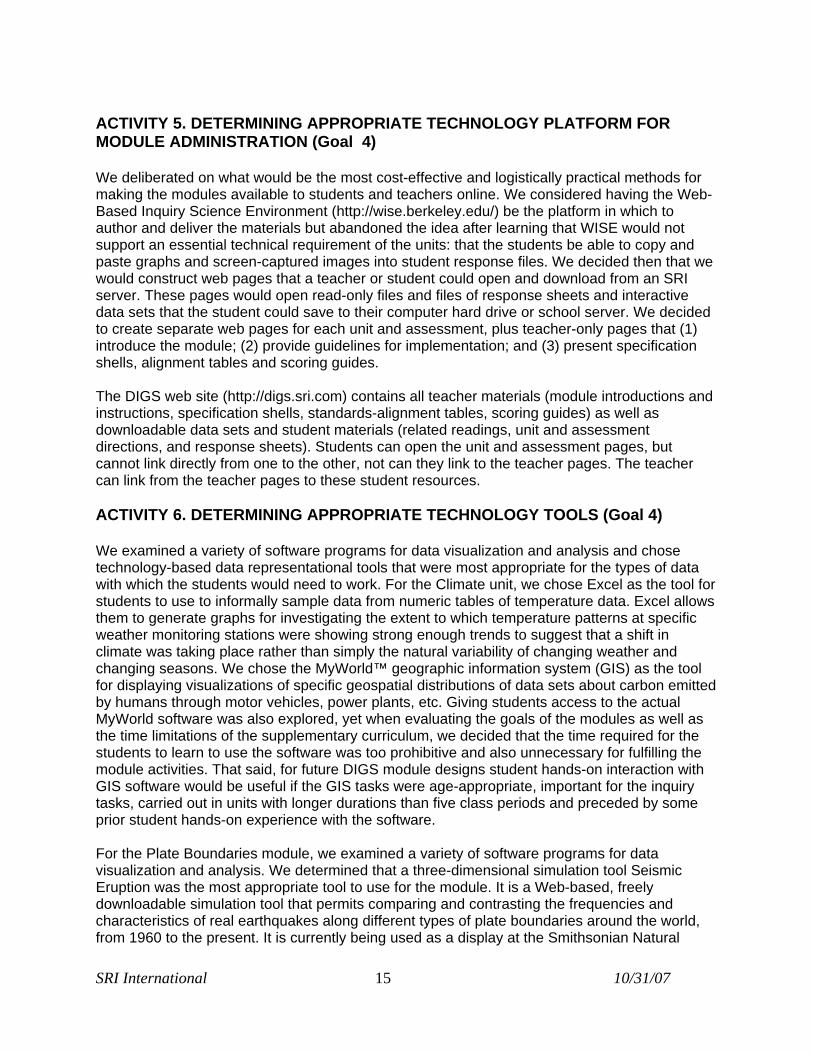
ACTIVITY 5. DETERMINING APPROPRIATE TECHNOLOGY PLATFORM FOR MODULE ADMINISTRATION (Goal 4) We deliberated on what would be the most cost-effective and logistically practical methods for making the modules available to students and teachers online. We considered having the Web-Based Inquiry Science Environment (http://wise.berkeley.edu/) be the platform in which to author and deliver the materials but abandoned the idea after learning that WISE would not support an essential technical requirement of the units: that the students be able to copy and paste graphs and screen-captured images into student response files. We decided then that we would construct web pages that a teacher or student could open and download from an SRI server. These pages would open read-only files and files of response sheets and interactive data sets that the student could save to their computer hard drive or school server. We decided to create separate web pages for each unit and assessment, plus teacher-only pages that (1) introduce the module; (2) provide guidelines for implementation; and (3) present specification shells, alignment tables and scoring guides. The DIGS web site (http://digs.sri.com) contains all teacher materials (module introductions and instructions, specification shells, standards-alignment tables, scoring guides) as well as downloadable data sets and student materials (related readings, unit and assessment directions, and response sheets). Students can open the unit and assessment pages, but cannot link directly from one to the other, not can they link to the teacher pages. The teacher can link from the teacher pages to these student resources. ACTIVITY 6. DETERMINING APPROPRIATE TECHNOLOGY TOOLS (Goal 4) We examined a variety of software programs for data visualization and analysis and chose technology-based data representational tools that were most appropriate for the types of data with which the students would need to work. For the Climate unit, we chose Excel as the tool for students to use to informally sample data from numeric tables of temperature data. Excel allows them to generate graphs for investigating the extent to which temperature patterns at specific weather monitoring stations were showing strong enough trends to suggest that a shift in climate was taking place rather than simply the natural variability of changing weather and changing seasons. We chose the MyWorld™ geographic information system (GIS) as the tool for displaying visualizations of specific geospatial distributions of data sets about carbon emitted by humans through motor vehicles, power plants, etc. Giving students access to the actual MyWorld software was also explored, yet when evaluating the goals of the modules as well as the time limitations of the supplementary curriculum, we decided that the time required for the students to learn to use the software was too prohibitive and also unnecessary for fulfilling the module activities. That said, for future DIGS module designs student hands-on interaction with GIS software would be useful if the GIS tasks were age-appropriate, important for the inquiry tasks, carried out in units with longer durations than five class periods and preceded by some prior student hands-on experience with the software.
For the Plate Boundaries module, we examined a variety of software programs for data visualization and analysis. We determined that a three-dimensional simulation tool Seismic Eruption was the most appropriate tool to use for the module. It is a Web-based, freely downloadable simulation tool that permits comparing and contrasting the frequencies and characteristics of real earthquakes along different types of plate boundaries around the world, from 1960 to the present. It is currently being used as a display at the Smithsonian Natural

SRI International 16 10/31/07
History Museum as well as in several national parks. The software imports data from the U.S. Geological Survey (USGS) and plots the epicenters, providing a visualization of change over time. The software also offers a tool that enables users to create cross-sections along any transects. In comparison to the source USGS database which is more difficult to use, and My World, which is not available freely except for research and did not include simple cross-section visualization capabilities, we determined that the Seismic Eruption software was best suited to the needs of the learners for which we were designing the units and assessments.
Unfortunately, Seismic Eruption presented limitations due to it being written in the C programming language rather than in Java. It could not run on Macintosh operating systems, unless the Macintoshes used had dual-platform software. Also, it led to several unique user interface issues that had to be circumvented by adding into the module more extensive directions for how to use the technology. Nonetheless, the powerful visualization of the earthquake data overruled the disadvantages, especially when considering the value of the dynamic simulations, the opportunity provided for students to choose locations for collecting data, and the accessibility of the representations. ACTIVITY 7. FEASIBILITY TESTING (Goals 1 & 2) Between the advisory panel meeting and feasibility testing, the final designs of the modules took shape, although the designs would still go through several iterations between tests and completion of the project. We carried out early feasibility tests with small groups of students to determine that the tasks and questions elicited the intended knowledge and inquiry skills and were appropriate for the intended grade levels. Five students were tested for the Climate module and four were tested for the Plate Boundaries module. Two of the five students trying out the Climate module worked in a pair and were observed discussing how to respond to the tasks. All other students doing feasibility tests worked alone. We interviewed all of the students during and after the testing. ACTIVITY 8. PILOT TESTING (Goals 1 & 2) In preparation for pilot testing, we developed teacher interview questionnaires and written student feedback questionnaires, as well as procedures for teacher and student cognitive interviews. Results from the interviews and questionnaires are described in the Findings. We recruited teachers through emails sent out to science department chairpersons in Boston and San Francisco Bay schools. Figure 7 displays how we described the project in the letter.

SRI International 17 10/31/07
Figure 7 : Description of Project in Teacher Recruitment Letter
We are developing supplementary high school units on plate boundaries and climate change for Earth science and environmental science classrooms. Our goal is to see what deeper understandings students can develop about these topics when engaging in inquiry with scientific data sets and appropriate technology tools; for example, the climate change unit has students compare annual and seasonal data about climate change in local settings with parallel data about other local settings and regional and global trends. The plates unit has students examine plate boundaries in relation to USGS data about earthquake occurrences in terms of depth, magnitude, and location. We have been designing each unit to be five class periods long, followed by a two period performance assessment.
We are looking for teachers who might be interested in trying either or both of these units out with students next year. In addition, we would really appreciate some preliminary feedback before we finalize the units. Some of the two units' activities will involve students' having hands-on time at computers, yet we also want to build into the units' structures enough flexibility and adaptability to accommodate different amounts of technology access at the school and different teaching styles. So, for example, you could incorporate whole-class demonstrations, presentations, and discussions in addition to student computer time if that is important to you. We would like to try the units out in two classes in the fall and more later in the year and are willing to pay you or other teachers in your Science Department a stipend for your involvement. We are also open to collaborating with our teacher partners on conference presentations and publications. Please e-mail me or call me about this. I'm looking forward to hearing from you.
Eight Bay Area teachers expressed interest in one or both of the modules. Of the eight, we selected two for the Climate module pilot tests because their schools were within driving distance from SRI, and they taught students with contrasting backgrounds and in different types of course tracks (see Findings for details). After reviewing the Climate module scenario, one teacher took himself out of consideration because he decided that the material would be too difficult for his students (ninth-graders taking a non-college preparatory general science course). He anticipated that the students would have difficulty doing the data-centric activities, including basic graph interpretation, even though data analysis was a ninth grade requirement in their standards. In the Boston area, we sent out e-mails to a number of schools and received interest from a subset of teachers from the schools. For our first Plate Boundaries pilot test, we worked with two teachers at one school, and then carried out significant revising. For the second pilot test, the students were provided an opportunity, at a different school, to have the entire eighth-grade earth science-teaching faculty pilot the module with their classes, all during the same month. We selected one class from each teacher to observe. We only scored results from the second pilot test because too many revisions needed to be made to the module to justify scoring assessments from the first one. Ultimately, we decided to limit the piloting of the Plate Boundaries module to the Boston area and the Climate module to the San Francisco Bay Area because the primary authors of the Plate Boundaries module reside in the Boston area and the primary author of the Climate module resides in the San Francisco Bay Area.

SRI International 18 10/31/07
Pilot Testing of the Climate Module After revising the modules in response to student feasibility testing, we pilot tested each module. We conducted round 1 of the Climate module pilot test in four 11th and 12th grade advanced placement environmental science classes in October 2006, at a San Francisco Bay Area public high school. The students who participated in the pilot test completed the core components of the unit in five days and the assessment in two days. The second round of pilot testing took place in May 2007 at a different Bay Area high school with two classes of at-risk 11th and 12th grade students taking a non-AP science course about environmental science and chemistry. Teachers were interviewed at the completion of the pilot tests. Figure 8 shows the questions the teachers were asked.
Figure 8 : Teacher Interview Questions BACKGROUND INFORMATION 1. For how many years have you been teaching? 2. For how many years have you been teaching environmental science? 3. Please summarize how often you use computers for instructional purposes with your students and for what purposes? FEEDBACK ON THE DIGS UNIT AND ASSESSMENT 4. Describe how the DIGS unit and assessment is similar to what you've done before with your students (for example, in terms of its content, its focus on inquiry, its focus on data, use of technology, use of open-ended questions, emphasis on active rather than passive learning). 5. Describe how the DIGS unit and assessment is different from what you've done before with your students (for example, in terms of its content, focus on inquiry, focus on data, use of technology, use of open-ended questions, emphasis on active rather than passive learning). 6. What classroom activities did you conduct with the students to prepare them for the unit? 7. What classroom activities will you conduct with the students after the unit that reinforces what the students learned or practiced? 8. Was there anything you found especially appealing about the unit and/or assessment? 9. Was there anything that you found especially problematic about the unit and/or assessment? 10. What improvements, if any, do you suggest for the unit and/or assessment? We also gathered student feedback on a short feedback questionnaire composed of scaled items and some short constructed response items.

SRI International 19 10/31/07
We conducted cognitive interview sessions during the piloting of the assessment component of the module. We asked small sets of students to think aloud as they worked through the items, in addition to the usual writing of responses required by the assessment. The teachers identified these students as being average achievers and extroverted enough to feel comfortable verbalizing their thinking to a researcher. The cognitive interviews helped us analyze how well the prompts elicited the intended inquiry skills and content knowledge (Quellmalz and Haydel, 2003) and hence provided partial evidence of the content and construct validity of the items. The scheme we used to code the cognitive interview results enabled us to identify mismatches between the written responses and oral responses and to classify the mismatches on the basis of what the results suggested about the items' validity. The results were used to identify (1) needs for further item revising and (2) cases when students expressed their reasoning more fully in speaking than in writing. Pilot Testing of Plate Boundaries Module The Plate Boundaries module was first pilot-tested in two 9th grade classes of a public high school in a suburb of Boston, Massachusetts in December 2006. The second round of pilot testing was conducted in 15 8th grade classes in a similar community during January and February 2007. In this school, the topic of plate boundaries is taught in 8th grade instead of in 9th grade, which is more typical. As with the Climate module, we conducted cognitive interview sessions for the piloting of the assessment component. In the pilot test classrooms, we asked small sets of students to think aloud as the students worked through the items. These students were identified by their teachers as being average science achievers (medium-high and medium-low) and extroverted enough to feel comfortable verbalizing their thinking to a researcher. Students worked on answering the questions while talking out loud about what the students were doing on the assessment tasks. We recorded these assessments and then scored. The codings of the cognitive interview results were used for the same purposes as in the pilot testing of the Climate Module assessment. ACTIVITY 9A. SCORING ASSESSMENT RESULTS Climate Assessment Scoring Procedures We used small sets of student responses to create standards-aligned scoring rubrics for each assessment item, plus illustrative examples of student work per item. We gathered the rubrics and exemplars in scoring guides that we used to train scorers experienced in K-12 science education and assessment. The pilot assessment results from the Climate module pilot tests were scored by two individuals seasoned in scoring constructed responses on science assessments. One of these individuals is the science department chairperson at a nearby middle school. The other is a former vice principal, teacher, and consultant to SRI who has done extensive work scoring science inquiry assessments on other SRI projects funded by NSF and the U.S. Department of Education. We scored a total of 102 student papers, which included 79 from the first set of pilot classrooms and 23 from the second set of pilot classrooms. There were four classrooms of students in the first pilot set and two classrooms of students in the second pilot set There were a smaller number of student papers from the second set of classrooms because the second set included fewer classrooms. In the first set of classrooms, the students worked individually on the assessment tasks. In the second set however, the students worked in pairs because the teacher felt strongly that the students would perform better that way, and we felt that getting student

SRI International 20 10/31/07
responses which demonstrate the best possible thinking and level of effort was a higher priority than maintaining parallelism between the different pilot conditions. Treatment of missing values. We coded missing values from the pilot tests differently because there were differences in the amount of time the two teachers allotted for students to work on the assessment. The first pilot test teacher allotted two full complete class periods to assessment administration4 whereas the second teacher only allotted one class period. Hence, every student in the first pilot had an opportunity to fully complete the items whereas most in the second pilot test did not have this opportunity. This variance was accommodated by how we treated mid-level responses. With the responses from the first set of classrooms, we scored any instance of a missing response as a 0 (lowest possible score) for the item, whereas with the responses from the second set of classrooms, we coded the missing responses as missing values and did not include them in the computation of means and standard deviations for the item. This accounts for the variances in numbers of responses per item from which the item means and standard deviations were calculated. Rater training. We pre-scored 20 assessment papers. Of the 20, we used 10 as training papers and another 10 as calibration papers. We created first drafts of item-specific rubrics while scoring the 20 training and calibration papers. We located examples of student responses at each scale point and inserted them into the scoring guide. Calibration papers were inserted into each individual scorer’s packet as a check on the scorers' fidelity to the rubrics. We varied the numbers of examples per item according to how many examples would be optimal. Training proceeded item by item. The raters double-scored an additional 16 papers that had not already been scored for training or calibration as an additional check on inter-rater reliability. The rest of the responses were single-scored. The scoring guide is posted on the DIGS web site. Plate Boundaries Assessment Scoring Procedures Development of rubrics for scoring students’ data and calculation of inter-rater reliability. As with the Climate assessment, the item-specific rubrics we developed to score student responses were either on a two point scale (correct or incorrect) or, more frequently, on three-point scales. The three point scales helped us differentiate among responses that demonstrated full understanding and provided all of the needed information (2 points), partial understanding or only part of the information (1 point), and no understanding or little or no information (0 points). We determined that a few item rubrics needed 4 point scales to permit even more detailed differentiations among answers. We compiled inter-rater reliability statistics from the total number of responses (357) that were double-scored. ACTIVITY 11. DESIGN SCENARIOS (Goal 3) We developed four scenarios that illustrate ways the DIGS design principles can be used to design modules on other goescience topics. The scenarios are described under Finding 6. ACTIVITY 12. EVALUATION As the external evaluator, Dr Carlos Ayala provided input at the Advisory Panel meeting and feedback about the module materials during the advisory panel module review process. He
4 In actuality, a few students in the first pilot finished by the end of the first period, and all the rest finished at various points before the second class period ended. No students needed two complete class periods to finish the assessment.

SRI International 21 10/31/07
reviewed the design documents, instruments, documentation of the external reviews, the module materials, and data collected by project staff during pilot testing. He also observed two pilot test classes, reviewed documentation of the assessment technical quality and listened to audiotapes of student cognitive interviews to confirm that the items and tasks were eliciting the intended inquiry skills and geoscience content. Dr. Ayala's evaluation report is included in Appendix A . ACTIVITY 13. DISSEMINATION We authored the following papers and presentations, all of which Dr. Zalles delivered at professional meetings or conferences. DIGS was the primary focus of each paper except for the one delivered at Purdue University, in which Zalles described DIGS in a section about applying the principles of inquiry to building student civic engagement around contemporary environmental problems. Zalles, D. (2007). Designing online social networks to ratchet up the quality of civic discourse.
SRI International. Paper delivered at the Ackerman Colloquium, Center for Civic Education, Purdue University, July, 2007.
Zalles, D., Quellmalz, E., Gobert, J., Pallant, A. (2007). Building data Literacy, visualization, and
inquiry in geoscience education. SRI International. Paper delivered at ESRI Education Users’ Conference, June 2007.
Zalles, D., Quellmalz, E., Gobert, J., Pallant, A. (2007). Assessing student learning in the Data
Sets and Inquiry in Geoscience Education (DIGS) project. SRI International. Paper delivered at Annual Meeting of the Educational Research Association, April 2007.
Zalles, D., Quellmalz, E., Gobert, J., Pallant, A. (2006). Assessing the Impact of Data-Immersive
Technology-Enabled Inquiry Projects on High School Students' Understanding of Geoscience. SRI International. Presentation delivered at Annual Meeting of the American Geophysical Union.
Zalles, D., Quellmalz, E., Gobert, J., Pallant, A. (2005). Using geoscience data sets to promote
inquiry. SRI International. Poster presentation delivered at Annual Meeting of the American Geophysical Union.

SRI International 22 10/31/07
FINDINGS
FINDING 1. PROJECT MANAGEMENT AND COORDINATION The Center for Technology in Learning at SRI International (SRI), Concord Consortium and WestEd collaborated productively through weekly conference calls and email. Documents generated by the collaborators supported the design of the curriculum modules (e.g., units, assessments, scoring guides, specification shells, alignment tables), plus observation forms and questionnaires used to gather findings in feasibility testing and pilot testing. FINDING 2. ALIGNMENTS TO STANDARDS AND EXISTING CURRICULA (Goal 1) To find the key ideas we planned to address in the topics of plate boundaries and climate change, we reviewed standards and textbooks with an eye toward detecting how they address inquiry. The AAAS Benchmarks and National Science Education Standards provided information about which key ideas we should address in the modules, each of which consists of a unit and assessment. We examined high school-level science textbooks in order to determine the extent to which the topics we were considering were addressed in typical science high school science courses that cover aspects of geoscience. While the topics of plate tectonics and earthquakes get fairly standard treatment in standards and textbooks (e.g., types of plate boundaries, p and s curves, earthquake measurement practices, earthquake effects), there was more variance in how climate change and human influences on it is treated. Yet, we found precedence for the major themes that would ultimately drive the climate unit and assessment design. For example, the Glencoe Science Interactions Series describes urban heat island effects in a section on microclimates, Prentice-Hall's Earth Science textbook, Ninth Edition, addresses the differences between weather and climate, the varying components of air, how people have altered the atmosphere's composition, the Greenhouse Effect, feedback mechanisms, global warming, and how temperature data are obtained. The environmental science textbook published by Scott Foresman and Addison Wesley describes types of air pollution and their global impacts, as well as global warming and the greenhouse effect. As we proceeded iteratively with development of the units and assessments, much of our decision-making about the designs was driven by our interest in providing students opportunities to engage in a full range of task types that aligned to the national science inquiry standards (e.g., planning studies, analyzing data, interpreting results, and communicating supported conclusions). In addition, when appropriate to the topic, we wanted to prompt in the students a degree of scientific skepticism that befits the limitations of the authentic public data selected by the researchers around which to build inquiry activities. Hence, one Climate module activity asks students to not only draw conclusions and provide supporting evidence from the available data, but also to judge how confident they are in their conclusions relative to the strength of the evidence. The module also asks them to identify possible alternative explanations that may account for lack of effects. FINDING 3. ADVISORY PANEL INPUT (Goal 1) The advisory panel had two opportunities to provide feedback, and their input helped us tighten the foci of the modules and to ensure that they were age-appropriate. Their first opportunity was at the advisory panel meeting in January 2006. After reviewing first drafts of the specification shells for the modules, the panel members and content consultants were impressed by the technologies being considered, especially the seismic simulation tool, which they found

SRI International 23 10/31/07
particularly impressive because of its ability to display three-dimensional, cross-sectional rendering of geographically-situated earthquake behavior over time. Yet, the advisers suggested that the foci of the modules be narrowed more and aligned more closely to the standards. The advisors remarked that the early Climate module version they reviewed focused on too many data sets, visualization modes, and software. They noted that the early version of the Plate Boundaries module was too heavily rooted in traditional didactic pedagogy and short on inquiry tasks. Their feedback was used to make revisions to the units. We responded to the feedback about the Climate module by limiting our foci to “case studies” about recent temperature change in specific urban microclimates (Phoenix and Chicago) and by not introducing precipitation data or paleoclimate proxy data. Both of these types of data had much potential for rich inquiry but the 5 days scheduled for the unit delivery was too limited to makeuse of these data feasible. We responded to the feedback about the Plate Boundaries module by increasing both the number of inquiry tasks in the module and the scaffolding of the earthquake simulation tool. The second opportunity to provide feedback was through a questionnaire that we sent between pilot tests in the winter of 2006-2007. Observations from various advisers and consultants about the Climate module included the following:
• Greater conciseness could be achieved through further editing, though all activities in the module were essential to fulfill the inquiry and data literacy objectives.
• An alternative way to represent the temperature data in relation to geography in the extension activity would be to place bar graphs of local temperature change directly next to the particular location on a GIS map of the focal locality so that spatial and temporal representations can be examined all on one representation.
• The presentation of new data to the student could be staggered somewhat differently so that the same culminating research question could be asked multiple times, each time preceded by the introduction of a new layer of data about the focal phenomena.
• Further editing was needed to ensure that certain concepts were accurately represented to the students (e.g., policy, urban heat island, and city-only data vs. data about a city and its surrounding developed area).
• The activities in the module would be more accurately represented to the student as inquiry activities about climate rather than an as examples of practices in which real climatologists engage, because real climatologists conduct their research at a much more sophisticated level than would have been achievable with the DIGS students.
The feedback offered about the Plate Boundaries module was that its “storyline” about doing a risk analysis was inappropriate because there were too many other variables to take into account. Hence, we removed the story line from the final version. The advisors also observed that the Climate module is more difficult than the Plates Boundaries module and hence should be used at a higher grade level. The piloting confirmed this. 8th and 9th grade teachers decided to pilot the Plate Boundaries module and 11th and 12th grade teachers decided to pilot the Climate module. FINDING 4. FEASIBILITY TESTING (Goals 1 & 2) Feasibility Testing of the Climate Module

SRI International 24 10/31/07
Following a round of revisions that we made after the Advisory Panel meeting, we conducted feasibility testing of the Climate module with three individual students plus a pair of collaborating students who were observed discussing their responses. We gauged how well the tasks elicited the intended geoscience content and inquiry skills by encouraging the students to express what they were thinking as they carried out the tasks. The feasibility tests of the unit, for example, revealed which characteristics of the unit tasks were novel for the students. For example, one of the Climate module testers, a student entering 12th grade, said that she had never in class analyzed temporal data from the sources of data used in the unit (such as that of the data in the unit that comes from the Global Historical Climate Network and from the Environmental Protection Agency). A key finding of the Climate module feasibility testing was that we needed to provide more scaffolding in the units that would help students synthesize data to draw conclusions about the focal phenomena. For example, the Climate Unit asks students to draw a conclusion about whether the climate in Phoenix has been in a warming trend and what might explain the warming. To help the students explain the warming, the unit asks them to examine different data sets about pollution and population growth. As a result of feedback from feasibility testing of the unit, a “synthesis table” was added for students to complete as the students examine each subsequent data set. The synthesis table required that for each data set, the students identify the geographical breadth of the data and the time span, then rate it and explain the extent to which the data set showed a pattern of increase or decrease. Feasibility Testing of the Plate Boundaries Module We conducted feasibility tests with four students doing an early draft of the Plate Boundaries module to determine how well they understood the intentions of the questions and directions and whether they could respond with answers that showed they were capable of demonstrating the focal skills and understandings. Students provided feedback to us as they progressed through the activities, answering questions and expressing ideas regarding instruction and user interface. The feasibility tests of the unit revealed which characteristics of the unit tasks required a greater amount of scaffolding for the students. For example, the students needed more support in order to successfully use the Seismic Eruption software. We designed, in response to this, a tutorial for students to learn how to use the Seismic Eruption tool. FINDING 5A. PILOT TESTING OF CLIMATE MODULE (Goals 1 & 2) This section describes our findings from two pilot tests of the Climate module. We conducted two tests to provide the opportunity to detect additional revision needs of the module materials with students who had different skill levels and come from different schools and classes. Each pilot test consisted of (1) a teacher implementing the unit and assessment in the presence of a researcher who observed and assisted the teacher when needed, (2) cognitive interviews of students carrying out the assessment, (3) administration of a post-unit student survey and teacher interview, and (4) scoring student assessment results using item-by-item analytic rubrics that we created specifically for the assessment. These pilot tests helped us make final refinements to the materials to make them better aligned with teacher and student needs and to make the assessment rubrics reliable. First Climate Module Pilot Test: Implementation Findings

SRI International 25 10/31/07
Participants. The school site of the first pilot test served a largely homogeneous community. The school had a high percentage of White, non-Hispanic students (75%) and Asian/Pacific Islander students (15%). Only 2% of the school’s students were Hispanic.5 Background. The DIGS pilot school year, 2006-2007, was the first year in which the environmental science course was taught at the school. It is a popular elective for 11th and 12th graders. The school expected 40 to 50 students to enroll in the course, yet approximately 150 did so. The course is partially funded by an external group, the Regional Occupational Program, a state program with a mandate to provide high school students and adults with job skills. The pilot teacher's salary was paid by this program. She taught four classes of the course. Each class's size ranged from 20 to 30. The teacher incorporated the Climate module into her unit on global warming. Before giving the module, she did a carbon sequestration lab with her students using an activity developed by the NSF-funded Environmental Science Activities for the 21st Century (ESA21) Project6. Students went to nine eucalyptus trees next to the school and measured their circumference and calculated their diameter. Then the students used a biometrics formula to calculate the tree’s biomass, which they used as a measure of carbon dioxide intake. Finally, the students put their data into Excel and generated graphs, much as they would end up doing in the Climate module. This was their first use of Excel for graph-generation in the course. The next time they would use Excel was in the Climate module. Immediately after the unit, a guest speaker presented an abridged version of the slide presentation that Al Gore used in his documentary, An Inconvenient Truth. Technology supports. The entire unit and assessment was implemented in a school computer lab. Each individual student had access to his or her own computer and completed all written work separately, yet the teacher allowed the students to discuss answers to the different questions in the unit. The teacher took all materials from the SRI-server-hosted Climate module student web pages and embedded them in her web site for the course. We posted all module materials on the SRI server and made them downloadable so that students could put their files on hard drives, thumb drives, or into folders on their school's server. Facilitation. For the duration of the module, an SRI researcher helped the teacher monitor the classes, provided help to individual students as needed, and occasionally addressed the group with clarifications. The researcher took the role of a participant observer, offering support to the teacher while observing and noting implementation issues in the process. Minor revisions to the unit materials were made as needed when the comments and questions the students were asking revealed a problem with the way the questions or directions were worded. The teacher also transitioned students from one activity to another by overviewing the next task and prompting students to read the directions for how to complete it. We aimed to make the directions comprehensive enough to successfully support the implementation of the module as an independent activity (such as a homework assignment) yet flexible enough to support a teacher who wants more direct involvement. Setting and student grouping. The teacher pre-assigned the students to small groups and arranged their seats accordingly. Students sat at their computers at long tables that all faced forward. Small-group members sat next to each other but all faced the same way. The students
5 National Center for Education Statistics, retrieved from http://www.nces.ed.gov/globallocator/ on 9/12/2007 6 http://esa21.kennesaw.edu/activities/trees-carbon/trees-carbon.pdf

SRI International 26 10/31/07
were encouraged to discuss and ask each other questions as they proceeded through the activities, but this interaction was not required until Part D of the unit, for which small collaborative groups prepared presentations. Each student was responsible for completing an individual unit response sheet until Part D, when small groups collaborated to produce PowerPoint presentations. Daily task sequence. The students completed the core components of the unit in five days and the assessment in two days. The class spent additional periods and homework time on supplemental activities (e.g., pre-activity brainstorming, Excel tutorial, live presentations, and an extension activity) that we developed to either support (Excel tutorial) or provide enhancement if teachers have more class time to devote to the module. The DIGS web site differentiates among the core and supplemental components, as does the daily task sequence summary table below (Table 1). All core and supplemental components are available on the web site.
Table 1: Daily Task Sequence Breakdown for the Climate Unit, Pilot Test 1 Day Unit or assessment Activities 1 Unit Pre-Unit brainstorming Activity (supplemental)2 Unit Excel tutorial (supplemental) Part A (core) 3 Unit Part A (core) 4 Unit Part B (core) 5 Unit Parts C & D (core) 6 Unit Part D (core -- half a period) 7 Unit Live presentations (supplemental) 8 Unit More live presentations and debriefing
discussion (supplemental) 9 (homework) Unit Extension activity (supplemental) 10 Assessment Parts A-C 11 Assessment Part D The following is a more detailed description about the first eight days. • Day 1 (Monday): Students completed the pre-unit brainstorming activity for which they
wrote down their conceptions about what factors influence climate change. This activity is posted as an extra resource on the DIGS Climate module web site. The students also silently read an introductory section about the national climate change controversy and about inquiry in climate science.
• Day 2 (Tuesday): Students in a large group activity read aloud the introduction to the case study. The teacher called on different students to read different parts. The students also did the tutorial exercises about how to create Excel graphs, then answered questions A1-A3, which required that they sample the Excel-based temperature data to produce graphs that would allow them to investigate change trends over time.
• Day 3 (Wednesday). Students finished Part A, which prompted them to analyze the data from the graphs they produced the day before.
• Day 4 (Thursday). Students completed Part B (analysis of spatially distributed temperature change data in larger geographical regions) and started on Part C (analysis of data about changes in anthropogenic factors related to temperature—CO2 emissions, air pollution, population, & development).
• Day 5. (Monday) Students completed Part C of the unit and began preparing presentations for Part D. The students used a special PowerPoint template to draw

SRI International 27 10/31/07
conclusions, make recommendations, plan further research, and reflect on the usefulness of the data for answering the core questions of the unit.
• Day 6 (Tuesday). Students spent the last half of the period completing the development of their presentation slides for part D. (The first half was spent taking a short unrelated test.)
• Day 7 (Wednesday). Most student groups delivered their PowerPoint presentations live. • Day 8 (Thursday). The last two student groups delivered their PowerPoint presentations,
which were followed by a class discussion about subtleties in the unit data, the urban heat island phenomenon, and global warming. The DIGS researcher videotaped Days 7 & 8. He also got copies of all the students' PowerPoint presentations.
Grading. The teacher told the students that their presentations would count as 50 percent of their Global Warming unit grade and that their answers on other parts of the unit would also factor in, but did not specify by how much. Student behavior and classroom logistics. Students varied with respect to how quickly they completed tasks, how well they stayed focused, and how carefully they read directions. Due to the fact that the students had access to their unit files in their folders on the school Blackboard server and could access their folders at home, absent and tardy students were able to complete as homework what they did not finish in class. In the end, all of the students in the four class periods completed all unit and assessment tasks. Teacher participation. The teacher monitored, yet intervened little when students were doing their work. Before the unit implementation, the teacher reviewed all the materials, but not enough to always be clear when paraphrasing the written directions in the Student Unit Directions file. Also, the teacher chose not to take much class time leading large-group discussion or debriefing, though the module teacher instructions recommended that. While this hands-off style provided students the maximum amount of time to complete their hands-on work, it also made it more difficult for the teacher to conduct formative assessment of the student learning along the way. Observations of student responses to unit tasks. Through posing questions, answering questions, listening to student groups interact, and listening to the group presentations at the end of the unit, the visiting DIGS researcher and the teacher were able to discern some broad patterns about how the students were cognitively processing the material. Lower performing students were able to respond well to data analysis tasks when there were simple relationships. Yet, when the data suggested more complex relationships (e.g., non-linear, mediated), the students were more likely to become confused. For example, one student, upon recognizing somewhat of an inverse relationship in the Arctic region between carbon emissions and temperature increases (see Unit item C1) stated to his partner that this must mean there is no global warming. The student was not taking into account how feedback loops help determine variances in climate change, nor was the student cognizant of how carbon emissions in the atmosphere are not the same phenomenon as carbon accumulations. Higher performing students, however, understood that the inverse relationship is not evidence of lack of global warming, though some understood why better than others. Also, higher performing students could better demonstrate additional inquiry skills, such as the usefulness of generating lines of best fit on scatterplots showing temperature changes, and generating scientifically based recommendations for solutions rather than socially based ones (e.g., suggesting a policy because it would have positive consequences, scientifically speaking, rather than suggesting it because it is relatively inexpensive or easy for people to adapt to).

SRI International 28 10/31/07
Teacher feedback about the module. The teacher, in her interview after implementation, reported that an appealing feature of the module was how it presented a relevant and meaningful application of Excel graphing to science . The school has a requirement that students need to learn how to use spreadsheet programs, but teachers have struggled with figuring out how to do that in interesting ways. The teacher felt that the DIGS module provided a novel and engaging way for teachers at the school to meet the requirement. Specifically, she liked how the module directs students to select a limited sample of data from large data sets to put into a graph for data analysis. Another appealing feature the teacher noted was how the module elicits from the students open-ended thinking on “ill-structured” problems (Jonassen, 1997). For improvement, she suggested (as did some of her students) that the unit would have been more interesting if different small groups of students could have researched and presented about climate change in different cities rather than exclusively in Phoenix. She also suggested that the reading load be made more concise. We followed up the latter suggestion in subsequent revisions. We did not follow up the former suggestion because we deliberately chose to use Phoenix due to the fact that its recent history shows a relatively linear trend in dramatically increased development and discernible nighttime temperature warming. We needed a city that presents a clear contrast between the focal city of the unit and the focal city of the assessment (Chicago). That said, there is nothing to prevent other teachers from using equivalent data about different cities for either the unit or the assessment, provided that they understand that they would also need to review the assessment scoring rubrics to see if any needed to be changed to accommodate the different characteristics of the alternative cities. Results from student feedback questionnaire. After completing the unit, students responded anonymously to a feedback questionnaire. Figure 9 shows the percentages of responses to the scaled choices in the selected response items of the questionnaire.

SRI International 29 10/31/07
Figure 9: DIGS Climate Unit Student Survey Results for First Pilot
N=80 1. Did the unit help you appreciate what real climate scientists do?
a. a lot (55%) b. a little (45%) c. not at all (0%)
2. Rate the level of difficulty of the unit. a. way too difficult (1%) b. a bit too difficult (36%) c. about right (60%) d. too easy (4%)
3. Did the unit help you understand the characteristics and complexities of climate change more? a. not at all (3%) b. a bit (60%) c. a lot (38%)
4. Would you like to do more units in your science classes that have you investigate real data about complex science topics? a. not at all (9%) b. maybe (58%) c. definitely (34%)
5. After taking the unit, are you interested in taking more science courses or pursuing a science career? a. less interested (5%) b. no effect on my interest (48%) c. maybe more interested (41%) d. definitely more interested (4%)
6. How interesting and engaging was the unit? a. very (13%) b. somewhat (60%) c. perhaps a bit, but not much (20%) d. not at all (8%)
7. Rate the amount of time you had to complete the unit a. not enough time –felt rushed (54%) b. just the right amount of time (41%) c. too much time – didn’t need all of it (4%)
8. How much does the unit resemble prior work you’ve done in your science classes? a. a lot (1%) b. somewhat (20%) c. a little (49%) d. not at all (25%)
We also included the following open-ended feedback questions on this questionnaire and on the other versions given to students in the different pilot test classrooms:
1. What did you like most about the unit? 2. What did you like least about it? 3. What was the most challenging part of the unit? 4. What was the least challenging part? 5. Do you have any suggestions for improvement?
On the positive side,

SRI International 30 10/31/07
• 55% of the student respondents felt that the unit helped them a lot to appreciate what real climate scientists do (55%).
• 60% felt that the level of difficulty was just about right. • 60% felt that the unit helped them understand the characteristics and complexities of
climate change a bit more and 38% said a lot more. • 58% said the students would like to do more units in science classes that have you
investigate real data about complex science topics. • 60% responded that that unit was somewhat interesting and engaging, and 13% felt it
was very much so. • 70% felt that unit resembles to some extent prior work the students have done in their
science classes, though there were differences of opinions about how much. Challenges were:
• Only 45% said that after the students took the unit, they were more interested in taking more science courses or in pursuing a science career.
• 54% felt there was not enough time to complete the unit and as a result the students felt rush (follow-up interviews suggested that the students felt most rushed preparing their class presentations)
Cognitive interviews. During assessment administration, we conducted a cognitive interview with one student per class, for a total of four interviews. We compared the written constructed responses of these four students to what the students expressed orally and flagged seven mismatches between the written responses and the oral responses. Of the seven, six oral responses revealed the need for more clarity in the language of the item. The seventh revealed student misconceptions about the content not evident from the written response. Following up on the results of the cognitive interviews, we carried out appropriate item revisions before the second pilot test was conducted. Summary. The implementation of the first pilot test provided us with the opportunity to detect problems with the wording of questions and directions without compromising implementation. These problems would arise usually from questions the students posed while they were doing the tasks. Implementation stayed on track because the teacher could make necessary clarifications to her classes while they were working on the tasks. The most troublesome implementation challenge arose with the graph-making functionality in Excel. We discovered a software bug in the chart-making wizard that causes the wizard to crash if more than six noncontiguous rows or 10 non-contiguous cells are selected. Fortunately, we discovered a workaround strategy in which graphs can be created by bypassing most of the wizard and inputting labels and other ancillary features after the graph has been generated, rather than through the wizard. Second Climate Module Pilot Test Implementation Findings Participants. In contrast to the setting of the first pilot test, the school setting of the second pilot test served an economically diverse set of communities. What differentiated the second pilot school from the first was that the second had a much higher percentage of Hispanic students (38%) and smaller percentages of White non-Hispanic (38%) and Asian/Pacific Islander students (10%).7
7 National Center for Education Statistics, retrieved from http://www.nces.ed.gov/globallocator/ on 9/12/2007

SRI International 31 10/31/07
Background. The pilot classes were part of a special “Computer Academy" program for at-risk students. Most of the students had grade point averages in the C's and D's and were characterized by their teacher as "middle to low" achievers. Quite a few were English-as-a-Second Language students, but the teacher did not provide exact numbers. The students were enrolled in the Computer Academy program because they were at risk of not graduating due to their poor attendance. In this program, entire cohorts of students stay together from class to class, and there is one teacher per subject. The pilot teacher had taught high school science for 10 years, including three years teaching environmental science. In addition, he designed environmental science curricula when he taught briefly at the University of California at Berkeley. The teacher developed his own lab activities because he felt that the school's pre-developed labs were too scripted. He called them "labs in a can." Prior to implementing the Climate module, he designed and implemented a lab activity in which the students created physical models of their environmental degradation characteristics (e.g., pollution, runoff) in their communities. The students ran their models in the rain to see what types of run-off resulted, then revised the models. For example, some moved their sewage treatment plant downhill after seeing what sewage runoff patterns resulted from a rainstorm. In a different lab before the DIGS implementation, the students designed models of houses or other structures using different alternative energy sources. This work became relevant on the fourth day of the DIGS unit implementation, when the students were thinking about recommendations to Phoenix. The teacher brought out a student model of an energy-efficient house to establish in their minds a connection between the DIGS module and their prior work. Prior to the implementing the module with his classes, the teacher did a taped cognitive interview as he responded in writing to each item of the assessment. The results confirmed that the prompts and tasks were written and structured well enough to meet their objective, which was to lead him in understand what he was supposed to think about and do. He produced the intended high-quality answers. The teacher cognitive interview session was also useful in yielding the need for some additional minor modifications of the language so that his limited-English proficient students could understand the questions and directions. There was enough time between teacher’s cognitive interview and the classroom implementation to make these modifications. Prior to starting the Climate module, the teacher showed the students the documentary An Inconvenient Truth to learn about global warming. In computer class, the students had already used Excel to make and graph budgets but had not yet done with Excel what they would be called on to do in the DIGS Climate module: to select and graph limited samples of data from large data sets for the purpose of looking for trends. Technology supports. We had to scale back the technology in the unit and assessment because the school's technology resources were very limited. There was a computer lab at the school, yet unlike the school in the first pilot, this school did not give students their own folders on a server. Furthermore, the school did not provide students with email accounts, which would have allowed them to email themselves the files to save them, nor could the students save work on the hard drives of the lab’s computers. The teacher said that the files could not be saved on the school hard drives either. Upon learning about these technology limitations, the visiting DIGS researcher and the teacher decided that, in the unit, the computers would be used only in the first activity, where students generate bar graphs of their choice in Excel to examine changes in temperatures in Phoenix. Other materials had to be printed out, and answers written on paper.

SRI International 32 10/31/07
Facilitation. Two DIGS researchers functioned as participant observers for the duration of the second pilot test. One occasionally addressed the entire class with additional hints or clarifications. At the end of the second class session each day, the two researchers met with the teacher to discuss what adaptations might be in order for the next day. On the second day, the external evaluator visited the two classes. The two researchers and the evaluator circulated the classroom observing students, asking occasional questions to gauge what the students were thinking, and providing individual assistance if requested. After his classroom visit, the DIGS PI and the evaluator spent two hours debriefing. The evaluator presented some recommendations about how the problems could be addressed by instruction on subsequent days of the unit. Setting and student grouping. On the first day of the unit, the students were in the computer lab, where the computers were arranged along the walls. All students were seated facing the walls. Students spent the other days in the regular classroom where they sat facing each other at tables that could accommodate anywhere from four to six students comfortably. The teacher and the researchers used a screen and overhead projector at the front during the unit to introduce the different graphs and maps of temperature and carbon emission data. The teacher placed the students in pairs to complete the unit and assessment tasks because he perceived that the students would concentrate better and stay on task more when working in pairs than when working individually. Daily task sequence. The teacher assigned four class periods for the unit and one class period for the assessment. With the exception of the Excel graph-making tutorial, he did not assign any supplemental activities. The teacher wanted to devote more time to the DIGS module and to environmental science in general in his curriculum, yet decided, regretfully, that he could only allot one week because the state 11th grade science test does not cover inquiry or environmental science topics enough to justify more time to the module. Table 2 shows the daily breakdown for this pilot test.
Table 2: Daily Task Sequence Breakdown for Climate Unit, Pilot Test 2 Day Unit or assessment Activities 1 Unit Excel tutorial (supplemental) & Part A (core) 2 Unit Parts A & B (core) 3 Unit Parts C & D (core) 4 Unit Part D (core) 5 Assessment All parts
• Day 1 (Monday): Students completed the DIGS Excel graphing tutorial and produced the graphs to answer questions A1 and A2.
• Day 2 (Tuesday). Students completed the analysis questions in Part A and started on Part B of the unit.
• Day 3 (Wednesday).Students answered the questions in Part C and started on Part D. • Day 4 (Thursday).Students finished answering the questions in Part D and then there
was a large group session of answer-sharing and discussion. • Day 5 (Friday): Students did the assessment.
Each period was 50 minutes long. Throughout the week, there was much pressure to complete the tasks. From a development perspective, we found these constraints useful to the project because they compelled us to make additional revisions for the sake of conciseness.

SRI International 33 10/31/07
Grading. The students were told that their assessments would count "significantly" in their final grade but the teacher did not specify to them how he would factor in the quality of their responses. He emphasized the students should “give it their best effort.” Student behavior and classroom logistics. The fact that the students had an attendance problem was evident on various days of the unit by virtue of the fact that many arrived late. For example, on the third day, 25 minutes of the period had already passed before the final student arrived. As was the case in the first pilot, the students varied in terms of how quickly they completed tasks, how well they stayed focused, and how much they read the directions. Teacher participation. Compared to the teacher in the first pilot test, who maintained a largely hands-off disposition, this teacher was active in intervening to help struggling students overcome problems. His interventions consisted of short lectures and hints that he would pose when he felt appropriate. In addition, he introduced each day's new tasks to the whole class in what the researchers judged to be an engaging manner. For example, when talking about urban heat island effects, he asked the students if any of them had ever been to Phoenix and talked animatedly about how extremely hot the Phoenix climate is. Observations of student responses to unit tasks. The following anecdotes describe challenges faced by various students and what additional interventions were designed and executed during the implementation of the unit to assist them. The teacher and the researchers detected the challenges when assisting the students listening to them express what was on their mind in cognitive interviews that the researchers held during the administration of the assessment.
Sampling the data to produce interpretable graphs. Students were asked, for the minimum temperature and maximum temperature data sets, to produce one graph per set that would help them figure out which of these two claims the students most agree with. • Claim 1: The data show enough of a pattern of increase between 1948 and 2003 to
indicate that the climate in Phoenix is warming. • Claim 2: The data DO NOT show enough of a pattern of increase between 1948 and
2003 to indicate that the climate in Phoenix is warming The students were prompted to write the claim with which they agree and explain how their graph supported their answer. The intention was to get them to conceive of and execute a data sampling plan. Though most students were able to quickly produce the graphs, some had problems with details such as making sure that they had the column and row header cells selected. One student started selecting every row of data. When asked why, he said “I should take all the rows” but then the student next to him helped him figure out that selecting a sample of the data would be more appropriate. At the beginning of the Day 2 lesson, the teacher conducted informal assessment of whether the students understood what the purpose of the graph-production task was. He checked their thinking about this in order to see of they students understood what it meant to "sample data". In a subsequent large group discussion, the teacher asked the students to explain what sampling is or think of an example of sampling. No student in either class could correctly answer the question. Examples of answers offered by students included (1) "you minimize a set of points," (2) “it’s an experiment,” and (3) “you try it out.”
Interpreting complex graphs showing annual and monthly differences. When attempting to interpret data on bar graphs showing full sets of annual data (e.g., each month's data plus the annual mean) a challenge for some students was how to differentiate between what the teacher called the "little hills" on the temperature bar graphs (e.g., the clusters of bars showing the year by year temperatures for a particular month) and the "big hills" (e.g., the

SRI International 34 10/31/07
entire graphs' sets of month-by-months clusters). Some students were confusing the pattern of monthly change on the “big hill” with inter-annual change over the range of years displayed on the graph. To clarify the difference, the teacher, with the help of a DIGS researcher, presented a short tutorial about the “big hills” and the “small hills,” using new overheads (see Figure 10 below).
Figure 10: Example of Hills on a Bar Graph Showing Full Data for a Sample of Years
On Day 4 of the unit the teacher provided some additional instruction about how to interpret the trends on the temperature change bar graphs. To scaffold the trend analysis process more so that students could overcome their prior confusion about what the "big hills" and "little hills" meant, he displayed graphs of examples of disaggregations of the data in Figure 10 above. Figure 11 below displays the disaggregations.

SRI International 35 10/31/07
Figure 11: Annual Temperature Data Disaggregations
Annual Means
0.0
2.0
4.0
6.0
8.0
10.0
12.0
14.0
16.0
1948 1963 1971 1978 1987 1995 2003
Mean
July
19.0
20.0
21.0
22.0
23.0
24.0
25.0
26.0
27.0
1948 1955 1963 1971 1978 1987 1995 2003
July
December
0.0
0.5
1.0
1.5
2.0
2.5
3.0
3.5
4.0
1948 1955 1963 1971 1978 1987 1995 2003
December
1948
-5.0
0.0
5.0
10.0
15.0
20.0
25.0
Janu
ary
Februa
ryMarch April
MayJu
ne July
August
Septem
ber
Octobe
r
Novem
ber
Decem
ber
1948
2003
0.0
5.0
10.0
15.0
20.0
25.0
30.0
Mean
Janu
ary
Febr
uary
March
April
MayJu
ne July
Augus
t
Septem
ber
Octobe
r
Novem
ber
Decem
ber
2003
Displaying these graphs one by one, the teacher asked students to look critically for trends in the annual means, then at the multi-year July and December graphs, and finally at the 1948 and 2003 graphs. Each time, he asked “Do the data on the graph(s) show that the Phoenix minimum temperatures are increasing? Which part(s) of the graph(s) tell you it is or is not?” He then showed them again the fuller data set from which these graphs were extracted (see Figure 10) and asked if the students felt confident about whether Phoenix was getting warmer. With this scaffolding, students were more able to understand how the “big hill” represented the flow of seasonal changes that one would see any year and the “small hills” represented the year-by-year changes in the span of a particular month. Looking for patterns in GIS-based global data of carbon emissions and 30-year mean temperature increases. To detect a pattern in geographically-distributed raster data one must observe and synthesize relationships between the focal raster variable (in this case, three-year temperature changes in carbon emissions) and the geographical variables that are implicit in the distribution of the raster variable. Some of the students had trouble understanding the significance of the color coding in the DIGS unit map visualizations of

SRI International 36 10/31/07
carbon emissions and temperature change and needed help relating the map key to the colorings of the geographical regions. Formulating and communicating data-based arguments. The students had difficulty figuring out what criteria they should use to support or refute claims about climate change from the temperature data and how to clearly communicate the ways that the data support their position. Their difficulty was made apparent in one of the large-group discussions. The students were asked to raise their hands if they were convinced that the Phoenix monthly minimum temperatures were showing a clear pattern of increase. All of them said yes. However, when asked the same question about the maximum temperatures, which showed far less of a trend, the whole class minus one replied that the trend was also evident with them. The discussion moved to how one person's criterion for how much evidence is needed to show a convincing trend is likely to vary from person to person. They discussed for example how someone might be convinced that the climate is getting warmer because the annual means are consistently rising. They also discussed how a more skeptical person may need to see a consistent rise in every month’s minimum temperature, or at least in 75% of the months, or over a bigger range of years. Planning research for finding effects. When answering the various inquiry questions found in Part D of the unit, lively discussions among the students revealed that were thinking hard about how often to collect data and from where to collect it (to measure effects of their policy recommendations). In a class discussion, one of the DIGS researchers posed some questions about whether the data the students advocated collecting should be collected outside of Phoenix in addition to inside of it. The students’ struggled with this, which suggested that they did not understand why comparison data are worth collecting. The researcher hinted that equivalent-sized temperature reductions in a rural and urban setting would suggest that an urban heat-island reduction program was not causing the reductions. These hints prompted more suggestions from the students that revealed they were starting to recognize the value of collecting comparison data. For example, one student said he would collect data in different parts of Arizona where there are high carbon dioxide levels in order to see if there would be a decrease in the carbon dioxide in five years, after the new policy went into effect. Some students said they would recommend collecting the temperature data at night as well as during the day. One student said he would collect data three times each 24-hour period: early in the morning, at noon, and at night.8
Teacher feedback about the module. The teacher praised the unit for the way it prompted the students to revisit the data sets multiple times, challenge them to think about appropriate inquiry strategies for the focal problem-solving tasks, and develop a deeper understanding of the complexities surrounding the issue of global warming and climate change. He also made three suggestions for improvements: (1) focus on data from their local community instead of data about Phoenix and Chicago, for which they have no personal connection; (2) embed hands-on kinesthetic components to balance out the seatwork, for which he said the students have limited attention spans; and (3) provide more extensive teacher directions such as full-fledged lesson plans and more professional development material for the teacher about the focal inquiry skills and understandings.9
8 It is worth noting here that there is an item on the assessment that scores how well students can justify a research plan. 9 These additional teacher materials are worth developing but were not feasible to develop within the project's budget.

SRI International 37 10/31/07
Results from student feedback questionnaire. After completing the unit, students responded anonymously to a feedback questionnaire. Figure 12 shows the percentages of responses to the scaled choices in the selected response items of the questionnaire.
Figure 12: DIGS Climate Unit Student Survey Results for First Pilot N=3310 1 How difficult was the unit?
a. way too difficult (6%) b. a bit too difficult (36%) c. just about right (55%) d. too easy (3%)
2 Did the unit help you understand climate change any better? a. not at all (9%) b. a bit (58%) c. a lot (33%)
3. Did the unit help you understand how to work with data any better? a. not at all (0%) b. a bit (75%) c. a lot (25%)
4. Would you like to do more units in your science classes in which you analyze real data? a. not at all (30%) b. maybe (55%) c. definitely (15%)
5. After taking the unit, are you interested in taking more science courses or in perhaps becoming a scientist? a. less interested (15%) b. no effect on my interest (49%) c. maybe more interested (30%) d. definitely more interested (6%)
6. How interesting was the unit? a. very interesting (18%) b. somewhat interesting (55%) c. perhaps a bit interesting, but not much (24%) d. not interesting at all (3%)
7. Did you have enough time to spend on the unit? a. not enough time – felt rushed (42%) b. just the right amount of time (55%) c. too much time – did not need all of it (3%)
8. How similar was the unit to other work you have done in science class? a. very similar (3%) b. somewhat similar (42%) c. a little bit similar (49%) d. not at all similar (6%)
On the positive side,
• 55% of the student respondents felt that the difficulty of the unit was just about right • 58% felt that the unit helped them understand the characteristics and complexities of
climate change a bit better, and 33% said a lot better.
10 The 12th graders were officially absent on the day that the teacher administered the questionnaires, so only the 11th graders had an opportunity to complete it.

SRI International 38 10/31/07
• 75% said the unit helped them it to understand how to work with data better and 25% said it helped them a lot.
• 55% said they would maybe like to do more units in science classes that involve investigating real data about complex science topics, and 13% said definitely.
• 55% responded that that unit was somewhat interesting and 18% felt it was very interesting.
• 55% felt there the right amount of time was allotted to complete the unit (though that was not the case with the performance assessment).
Challenges were:
• Only 36% said that after they took the unit, they were more interested in taking more science courses or in pursuing a science career.
• Only 45% felt it was similar to other work they have done in science class. Cognitive interviews. During the administration of the student assessment, separate cognitive interview sessions were conducted with different groups of students in the two classes. In the period 1 class, two pairs of students were taped talking about their responses to the items. One pair wrote individual responses and the other pair collaborated on a single set of responses.11 In addition there was one un-taped cognitive interview with one pair of students12. Each student expressed his or her own thoughts about the assessment tasks. In the period 2 class, two researchers taped two cognitive interview sessions with one pair of students per researcher. The individuals in each pair verbalized their thoughts about the tasks to the researcher but each pair collaborated on a single set of written responses. Later, the transcripts were coded against the written responses to detect student comments that might indicate validity problems with the items. An assessment scorer and the evaluator coded separately the taped cognitive interviews to corroborate their independent flagging of responses to items when the items did not elicit the intended content and inquiry due to the intervention of construct-irrelevant factors. Five of the oral responses were flagged as revealing instances of students misreading or misunderstanding the question due to factors such as unfamiliar vocabulary. Four of the oral responses revealed the need for additional minor item revising for greater clarity. The researchers also used the cognitive interviews to identify whether there were any oral responses that were discrepant from the written responses in ways that were more specific than the written responses and hence more revealing of student misconceptions about the content. Eight such responses were flagged. The results of these cognitive interviews prompted one more set of minor revisions to the assessment instrument, which appear in the final version on the DIGS web site. In general, the cognitive interview results provided evidence that some students who knew how to interpret the data were less adept at explaining what they were noticing about the data. According to the teacher, some of these communication problems were due to English-language limitations. Yet, there is evidence that their limited prior science classroom experience made them insufficiently familiar with the language of data analysis (e.g., trends, relationships among variables, distributions) to express their observations adequately.
11 The teacher wanted to give the students latitude in how they chose to respond. 12 A technical malfunction with the audio recorder made it impossible to tape this cognitive interview but the researcher took notes.

SRI International 39 10/31/07
Findings from the Climate Assessment Pilot Tests We took a sample of student responses from the pilot testing described above and scored them. As we scored them, we developed item-by-item analytic rubrics. We then brought scorers in who used the rubrics to score all the student assessment responses. Our scoring procedure allowed us to refine the rubrics for the sake of maximizing their reliability. Inter-rater reliability. We compiled inter-rater reliability statistics from the 414 responses that both raters scored from the training papers, calibration papers, and double-scored papers.13 The raters discussed all responses that they double-scored so that they could find disagreements and reach consensus. Of all the student responses that were double-scored, the inter-rater reliability agreement was 91.1%. Of the 8.9% of disagreements, most were quickly resolved through discussion. 0.9% of the disagreements were substantive, which meant that the disagreements were indicative of problems with the rubric. Because all of the disagreements were verbalized during discussions in the training sessions, the rubrics could be revised and training paper responses revisited before the scorers commenced with the scoring of the main body of responses to the focal item. Final minor revisions of rubrics. Because DIGS was a pilot project, we expected that the scoring sessions would reveal the need for small modifications to the rubrics but the scoring procedures were designed to allow for the modifications to be made without compromising the reliability of the results. The most significant rubric revisions we made involved changing the number of scale points to facilitate more consistent interpretation. We changed one rubric from a four-point scale to a three-point scale and another we changed in the opposite direction. The other changes we made were small clarifications to the language of the scoring criteria. Assessment results from the Climate module pilot test. Appendix C shows descriptive statistics for each item, grouped according to the national standards to which the items are aligned. To permit the ranking of mean student performance per item, regardless of the size of the scale, we converted the means to a common 0-1 metric (p values) by dividing the mean of the scores for the item into the number of scale points in the item. In addition, in Appendix C, we present more detailed item-by-item descriptive statistics.
13 The numbers of responses used to calibrate these statistics varied slightly per item because the numbers of responses from the training set that were used as exemplars varied. When the researchers noticed in their pre-scoring of the training set that that the responses to a particular item were yielding a wide diversity of responses, the researchers assigned more of the responses to the exemplars in the scoring guide and less to the calibration set. The converse was true if the researchers noticed less diversity in the responses.

SRI International 40 10/31/07
Table 43 displays the aggregate p values by standard sorted from highest to lowest value.
Table 3: Aggregated Results by Standard, Climate Module Assessment
Standard Number of items
P value (mean on 0-1 metric)
Use technologies to collect, organize, and display data 1 0.87Radiation of heat 2 0.77Human-induced changes to atmosphere 3 0.74Plan method 1 0.73Review, summarize, and explain information and data 14 0.70Formulate testable hypothesis 2 0.63Logical connections between hypothesis and design 1 0.58Construct a reasoned argument 2 0.54Scientific skepticism 1 0.48Critique explanations according to scientific understanding, weighing the evidence, and examining the logic 1 0.36Interactions within and among systems result in change 1 0.29 The mean p value across the 29 items on the assessment was .66. The results from Table 3 show that the student responses to an item aligned to the standard about using technologies to collect, organize, or display data received the highest mean score (.87) whereas an item designed to assess understanding about how change results from interactions among systems got the lowest mean score (.29) The mean of the 14 items calling for making analytical observations from data got higher mean scores (.70) than most of the other inquiry items. Means of items requiring application of knowledge about radiation of heat (e.g., urban heat island effects) and human-induced changes to atmosphere and were high (.77 and .74 respectively). Essentially, students performed best on items requiring use of technology to perform tasks with fairly low cognitive demand and on items that tap their understanding of content. Scores were lower on inquiry tasks that were not about data analysis. The lowest scores were received on items that required critical thinking (construct a reasoned argument; scientific skepticism; and critique explanations according to scientific understanding, weighing the evidence, and examining the logic) and general systemic thinking. Climate Pilot Test Summary Our results, gleaned from classroom observations, teacher interviews, and student feedback questionnaires show that (1) the Climate module could be successfully carried out within the targeted time constraints but not under more restrictive constraints; (2) students perceived the module as being interesting, relevant and useful for their building of greater skills with data and understanding of scientific methods and practices; and (3) the modules helped fill a gap that the teachers perceived as existing in their science curricula for inquiry and data-based activities. Results of pilot test assessment administrations showed that the assessments met criteria of technical quality, as evidenced by inter-rater reliability, the results of cognitive interviews, and student written responses. Student responses to items showed that students were sufficiently cognizant about the intentions of the items to provide adequate, anticipated responses. The relatively lower scores on items that required higher-order critical thinking and systemic thinking

SRI International 41 10/31/07
attest to the relatively low amount of opportunity students typically get to practice such skills in the science classroom. There are certain challenges that confront designers of problem-based geoscience inquiry curricula geared to the high school level. High school geoscience continues in some states such as California to be hampered by the fact that it receives little or no attention on state science tests, which makes it difficult for some teachers to assign to it the higher priority they may think it deserves in their courses. Faced with this reality, we made some early choices that paid off in the pilot tests. The researchers built in to the designs flexibility with the technology requirement, the pedagogical delivery requirement, and the time length requirement. Schools vary considerably in how much technology-based coursework they can support with software, hardware, and infrastructure, and teachers vary considerably in how they prefer to deliver instruction and how much time they can allot to a supplementary unit. The Climate module’s division into core and supplemental components gave the teachers with different time constraints a range of feasible choices for implementation, and the module’s differentiation between core and supplementary technology requirements permitted a teacher with minimal technology supports to implement the module as well as a teacher with far greater supports. Finally, our inclusion of explicit written student directions made it equally possible for a teacher with a more hands-off style to implement the unit as a teacher with a more hands-on didactic style. FINDING 5B. PILOT TESTING OF PLATE BOUNDARIES MODULE (Goals 1 & 2) This section describes our findings from two pilot tests of the Plate Boundaries module. We conducted two tests to provide the opportunity to detect additional revision needs of the module materials with students who had different skill levels and come from different schools and classes. Each pilot test consisted of (1) a teacher implementing the unit and assessment in the presence, in some cases, of a researcher who observed and assisted the teacher when needed, (2) cognitive interviews of students carrying out the assessment, (3) administering a post-unit student survey and teacher interview, and (4) scoring assessment results from a subset of students in the second pilot test using item-by-item analytic rubrics that we created specifically for the assessment. The first pilot of this module showed us the need for significant changes to the materials in order to help the students perform the tasks using the technology. The second pilot test affirmed that these changes helped the students perform the tasks better. First Plate Boundaries Module Pilot Test: Implementation Findings Participants. The Plates Boundaries module was first piloted with two teachers in two ninth grade classes in a high school in a suburb of Boston. The school has minimal ethnic diversity (87% of the White, non-Hispanic; 5% Asian/Pacific Islander, 3% Black non-Hispanic, 2% Hispanic). Each class included about 20 students.14 Background. The teachers in the first pilot test chose to substitute some of their typical Plate Boundaries unit with the DIGS unit. We did not expect this because we always intended for the DIGS modules to be supplemental to the regular curriculum, not used as a replacement for it. This is in contrast to the teachers in the second pilot, who chose to use it as a follow-up to a typical plates tectonics unit rather than as an introduction to the unit. 14 National Center for Education Statistics, retrieved from http://www.nces.ed.gov/globallocator/ on 9/12/2007

SRI International 42 10/31/07
Technology supports. The teachers implemented the entire unit and assessment in the regular classroom, with a suite of mobile computers. Each pair of students had one computer with which to work. Each teacher downloaded the appropriate materials from the SRI server-hosted web site and downloaded the appropriate software and the Microsoft Word documents. The teachers also printed a hard copy version of the curriculum. Work was saved on individual computers rather than on a server. All student work was also saved onto an external thumb drive to expedite start up time at the beginning of class. Facilitation. A DIGS researcher was present in the classes. The researcher took field notes about how the teacher was implementing the unit and, on occasion, answered questions from the students about the software or the content. The researcher did this to identify implementation challenges and places in the activities where the students became confused. Setting and student grouping. The students worked in pairs for the implementation of the unit and individually for the assessment. Daily task sequence. The students completed the unit and the assessment in five class periods. Additional homework time was spent on curriculum activities (e.g., pre-activity brainstorming) and answering some of the transfer problems. Teacher feedback about the module. As a result of interviews with the teachers, we decided to provide a separate tutorial for the students about how to use the Seismic Eruption software. We also got feedback from the teachers about how to revise the questions so as to be more appropriate for middle school.

SRI International 43 10/31/07
Results from student feedback questionnaire. After completing the unit, students responded anonymously to a feedback questionnaire. Figure 13 shows the percentages of responses to the scaled choices in the selected response items of the questionnaire.
Figure 13: DIGS Plates Unit Student Survey Results for First Pilot
N=47 1. Did the unit help you appreciate what real geologists do?
a. a lot (11%) b. a little (72%) c. not at all (17%)
2. Rate the level of difficulty of the unit. a. way too difficult (3%) b. a bit too difficult (38%) c. about right (59%) d. too easy (0%)
3. Would you like to do more units in your science classes that have you investigate real data about complex science topics? a. not at all (3%) b. maybe (75%) c. definitely (22%)
4. After taking the unit, are you interested in taking more science courses or pursuing a science career? a. less interested (6%) b. no effect on my interest (68%) c. maybe more interested (26%) d. definitely more interested (0%)
5. How interesting and engaging was the unit? a. very (14%) b. somewhat (41%) c. perhaps a bit, but not much (38%) d. not at all (8%)
6. Rate the amount of time you had to complete the unit a. not enough time –felt rushed (50%) b. just the right amount of time (37%) c. too much time – didn’t need all of it (13%)
7. How much does the unit resemble prior work you’ve done in your science classes? a. a lot (3%) b. somewhat (26%) c. little (34%) d. not at all (37%)
On the positive side,
• 59% of the student respondents felt that the difficulty of the unit was just about right • 83% felt that it helped them appreciate what real geologists do, either a little (72%) or a
lot (1%) • 75% said they would maybe like to do more units in science classes that involve
investigating real data about complex science topics, and 22% said definitely. • 41% responded that that unit was somewhat interesting and 14% said very interesting.
Challenges were:

SRI International 44 10/31/07
• Only 26% said that after they took the unit, they may be more interested in taking more science courses or in pursuing a science career.
• Only 37% felt there the right amount of time was allotted to complete the unit, whereas 50% felt rushed.
• Only 29% felt it was very similar or somewhat similar to other work they have done in science class
Summary. The implementation of the first pilot test provided the research team with the opportunity to detect problems and follow up with modifications to unit and assessment tasks. We modified tasks slightly to clarify issues that were unclear to students and to accommodate the fact that the second pilot testing would be done in 8th grade. Our changes fell into four categories:
1. The addition of a context setter/story line in an attempt to give the unit more relevance, thereby possibly increasing student engagement.
2. A fairly large-scale edit of the questions since the students from the first pilot commented on there being redundancy.
3. A reduction of the number of open-ended questions in order to make the unit more time-manageable and provide more scaffolding.
4. An increase in support for classroom management. Second Plate Boundaries Module Pilot Test: Implementation Description & Findings Participants. Our second pilot occurred in 15 8th grade classes in a suburban Boston middle school. The school has minimal ethnic diversity (81% White, non-Hispanic; 10% Asian/Pacific Islander, 5% Hispanic, 4% Black non-Hispanic). Each class included approximately 20 students.15 One of the participating teachers had taught for nine years and the other two had been teaching for five. Background. The teachers varied in how they prepared the students for the content of the module. Two teachers completed a unit on continental drift and plate tectonics as well as a unit on earthquakes from the Web-Based Inquiry Science Environment project. One teacher had the students practice evaluating map data to draw conclusions. Another teacher had already used the Seismic Eruption tool in her class but did so as whole group instruction rather than for the hands-on work that the DIGS module initiates. This teacher reported that she was in the habit of introducing data analysis and inquiry to students whenever she could in her curriculum. Prior to the DIGS unit, her class completed a plate tectonics unit which focused on the four different types of plate boundaries and the patterns of earthquakes and volcanoes found at each. In his prior unit on plate boundaries, the third teacher had his class study earthquakes’ relationships to plate boundaries, but had not prompted the students to interpret and analyze data the way they did in the module, nor had he gotten them to examine earthquake magnitude and location as an indicator of the plate boundary type. All three of the teachers made regular use of computers in their classrooms before implementing the module, though one of them used a computer only to project images for stimulating class discussions. The other two teachers made more hands-on use of the computers. All three teachers had their students use computers immediately prior to the Plate Boundaries unit for a two-week-long instructional unit on plate tectonics called “What’s on your plate?” which the Concord Consortium researchers designed on a prior project. The teachers 15 National Center for Education Statistics, retrieved from http://www.nces.ed.gov/globallocator/ on 9/12/2007

SRI International 45 10/31/07
also used the computers frequently for other technological implementations, including BioLogica Finally, another teacher had students use laptops for interactive software programs one or two times for every unit she taught. All the teachers planned to follow the DIGS module up with related classroom activities, such as evaluating other plate boundary cross-sections, applying their knowledge from the DIGS module, and supporting their conclusions with material discussed in class prior to DIGS. One teacher planned to have her students investigate P and S waves, use them to prove that the earth has layers, and locate epicenters. Another teacher planned to have her students look at some other cross sections as a class and discuss what was happening in each example. This activity, she claimed, would provide an opportunity for students to review the material and for the teacher to emphasize the main ideas. Technology supports. The entire unit and assessment was implemented in the students' regular classrooms, which were designed like labs with both desks and computers. There was one computer for every pair of students in the class. Each teacher took all materials from the SRI server-hosted Plate Boundaries module and embedded them in his/her web site for the course. Having all materials downloadable from the SRI server made it possible for the teachers to restrict the students' computer work to the school server and eliminate firewall problems that could have arisen if the students needed to use the materials directly from the SRI server. Facilitation. In twelve of the fifteen classrooms, the teacher completely ran the implementation; that is, there were no researchers present. However, for three of the classes (one selected from each teacher), a researcher was present for all implementation class periods. In these classes the researcher took field notes on how the unit was being implemented. In two out of three, an iPod recorder was on for the entire duration in order to record all teachers’ comments to the students. This was done in order to track how the unit was being implemented. Setting and student grouping. The students worked in pairs for the implementation of the unit. The pairs were assigned by the teacher of each class. The students worked individually on the assessment. Daily task sequence. The students completed the core components of the unit in five days and the assessment in two days. The three teachers used additional periods and homework time to assign students to a Plate Boundaries module supplemental pre-unit brainstorming activity that was developed to enhance the unit. The following description of one teacher’s implementation provides an example of how the hands-on DIGS unit material could be supported and adapted to a teacher’s typical teaching style. On the first day, she began the unit implementation with the “objective for today”: “Students will be able to predict patterns in earthquakes based on the type of boundary where the earthquakes occur.” She also gave a class presentation on the world’s earthquakes from 1960 to the present using the Seismic Eruption software. On the second day the teacher scaffolded students’ use of the Seismic Eruption tool by leading the whole class through carrying Part C of the unit. The teacher reified students’ prior knowledge about different types of boundaries and their main characteristics. She emphasized to the students that they should be looking for patterns in the data and scaffolded group discussion about detecting patterns.

SRI International 46 10/31/07
On the third day, the teacher overviewed the instructions for Part D and noted what data analyses the class would be doing the next day. She used a globe to demonstrate the differences between the cross-section view and the global view, and asked the class to reflect on why this is important. She reified that what the students had been looking at in the Seismic Eruption tool was an example of “looking down at the cake”. She scaffolded their understanding of azimuth, scaffolded their cross-sections at each type of plate boundary, and explained how the tool represented each type of boundary with different colors. On Day 4, the teacher worked with individual groups as the students answered more parts of the unit. On day 5, she gave them a goal for the day and provided procedural scaffolding of how to produce their “reports”. She frequently checked in with all groups. Each of the three teachers monitored their students’ progress on the unit and answered questions the students posed, but they varied in terms of how “tightly” they tried to keep their students on the same activities at the same time. They told the students that their work on the unit and assessments would be counted towards their overall plate tectonics unit grade. Teacher feedback about the module. In their interviews, the teachers reported both similarities and differences between their prior classroom activities and those of the DIGS module. One of the teachers had her students look at earthquake characteristics in relation to plate boundaries before implementing DIGS but the students had not focused on reading data in that manner nor had the students looked at earthquake magnitude and location as an indicator of the plate boundary type. The DIGS module directed students to look at far more data to synthesize their ideas than was typical in these teachers’ classes. Another teacher said that the module was different than what she did before because the students selected their own data sets, analyzed them, and formulated conclusions about them, plus the students could interact with the software rather than just watch the teacher use it. Aspects of the module that the teachers found particularly appealing were that (1) the students had to select their own data and interpret it; (2) the data were real and global; (3) the students had the opportunity to explore global patterns of real data independently and describe it using screenshots and Word; and (4) the students could work with partners, use software, and work on an ongoing investigation. Aspects of the module that the teachers found problematic were: (1) technical issues that arose from students trying to open and navigate two software programs (Microsoft Word and Seismic Eruption) simultaneously; (2) struggles with understanding what the cross-section was in the tools' 3D environment, and (3) implementing the final activity of the unit without more teacher guidance. (In the final activity, the students are supposed to revisit their earlier analyses of the likelihood that a 6.5 magnitude earthquake might occur in three different cities around the world in light of the plate boundary earthquake behavior-pattern analyses they performed in the interim). One teacher felt that the module covered too much content for her 8th graders. She said that "Being able to visualize and comprehend the map view and its corresponding cross-section view was really abstract and challenging for (her students). Because of this and because the students (hadn’t) practiced these skills much in the past, it was difficult for them to select data from the entire map that (were good examples of) earthquake patterns at each boundary. Students enjoyed looking at the patterns, but struggled to actually make the connection between the map and cross-section views." She said she wanted to use the module again, but would modify it so that the students focus on one type of boundary alone and put into a slide presentation its map view and cross-section view. Finally, one teacher did not recognize that the near-transfer tasks in the assessment constituted a true assessment because his

SRI International 47 10/31/07
conception of an assessment is that it assesses knowledge directly gained from prior instruction. In his view, the near transfer tasks of the DIGS module assessment constituted new material. Results from student feedback questionnaire. Figure 14 below displays results from the anonymous student feedback questionnaires.
Figure 14: DIGS Plates Unit Student Survey Results for Second Pilot N=3616 1. Did the unit help you appreciate what real climate scientists do?
a. a lot (34%) b. a little (59%) c. not at all (6%)
2. Rate the level of difficulty of the unit. way too difficult (0%) a bit too difficult (20%) c. about right (80%) d. too easy (0%)
3. Did the unit help you understand the characteristics and complexities of plate boundaires more? a. not at all (0%) b. a bit (41%) c. a lot (59%)
4. Would you like to do more units in your science classes that have you investigate real data about complex science topics? a. not at all (13%) b. maybe (69%) c. definitely (19%)
5. After taking the unit, are you interested in taking more science courses or pursuing a science career? a. less interested (6%) b. no effect on my interest (44%) c. maybe more interested (38%) d. definitely more interested (13%)
6. How interesting and engaging was the unit? a. very (19%) b. somewhat (63%) c. perhaps a bit, but not much (13%) d. not at all (6%)
7. Rate the amount of time you had to complete the unit a. not enough time –felt rushed (41%) b. just the right amount of time (59%) c. too much time – didn’t need all of it (0%)
8. How much does the unit resemble prior work you’ve done in your science classes? a. a lot (6%) b. somewhat (47%) c. little (28%) d. not at all (19%)
16 Only two full classes from one of the teachers filled out the survey directly in class. Other classes of students were assigned the survey as homework, but the teachers did not forward the responses to the researchers.

SRI International 48 10/31/07
On the positive side,
• 83% of the student respondents felt that the unit helped them appreciate what real geologists do, either a little (59%) or a lot (34%)
• 59% felt that the unit helped them better understand the characteristics and complexities of plate boundaries a lot more and 41% said a bit more
• 69% said they would maybe like to do more units in science classes that involve investigating real data about complex science topics, and 19% said definitely.
• 51% said that after taking the unit they either were maybe more interested (38%) or definitely more interested in taking more science courses or pursuing a science career
• 63% responded that that unit was somewhat interesting and 19% said very interesting. • 59% felt that the teacher allotted enough time to complete the unit, yet 41% said they
rushed. • 47% felt it was somewhat similar to other work they have done in science class and 6%
said a lot.
A comparison of the results of the questionnaires from the first and second pilots suggests that the students in the second pilot had a better experience with the unit, though the students in the first pilot overall had a fairly good experience with it too. Fewer in the second pilot felt rushed and more felt that the unit activities resembled other class activities. Part of these more positive responses may be due to the fact that we made significant changes to the unit between the pilot tests to provide more scaffolding of the tasks and more help with how to use the tool. The better outcomes in the second pilot test were also manifested in the fact that 51% were now more interested in taking more science courses or pursuing a science career, whereas only 26% responded that way in the first pilot. Cognitive interviews. During assessment administration, we conducted a cognitive interview with two students in each of the three classes whose assessments were scored; therefore a total of 6 students were interviewed. The data provided us a way to examine, in a deeper way, how the students were reasoning about each of the assessment activities. We compared written responses to oral responses to identify mismatches and to determine if any mismatches called into question the construct validity of the items. There were 11 mismatches but none suggested the presence of validity problems with the item. Of the 11, there were six cases where the oral responses demonstrated greater understanding than the corresponding written responses, and one case of the opposite. Three oral responses were more elaborate than the corresponding written responses but this greater elaboration was not demonstrative of greater understanding. One student's oral response, when compared to his written response, demonstrated a misunderstanding that was markedly different yet equally wrong. Summary. The pilot testing in 15 classrooms gave use the opportunity to get feedback about a larger group of students than we anticipated. Though the school is more demographically homogeneous and affluent than we would have preferred for a second pilot test setting, we nevertheless decided that it would be a worthwhile site because it provided the opportunity to test with a larger number of students. Furthermore, it had the technology to make implementation feasible. The feedback provided by the teachers about so many students in so many different classes made us better able to generalize about the implementation patterns to students of varying skill levels in science.

SRI International 49 10/31/07
Findings from the Plate Boundaries Assessment Pilot Tests We took a sample of student assessment papers from the second pilot test described above and scored them. As we scored them, we developed item-by-item analytic rubrics. With the exception of one graduate student who scored some of the student papers, the DIGS researchers at the Concord Consortium scored all the student work. Inter-rater reliability. Inter-rater reliability statistics were compiled from the total number of responses we double-scored (357). Of all the student responses that we double-scored, the inter-rater reliability agreement was 72%, and it was 80% if we discount some items where there was miscommunication among the scorers about scoring instructions.17 Assessment results from the Plate Boundaries module pilot test. Appendix D shows descriptive statistics for each item, grouped according to the national standards to which the items are aligned. To permit the ranking of mean student performance per item, regardless of the size of the scale, we converted the means to a common 0-1 metric (p values) by dividing the mean of the scores for the item into the number of scale points in the item. In addition, in Appendix D, we present more detailed item-by-item descriptive statistics. Table 4 displays the aggregate p values by standard sorted from highest to lowest value.
Table 4: Aggregated Results by Standard, Plates Module Assessment
Standard Number of items
P values (means on 0-1 metric)
Develop a hypothesis 2 0.38Develop and use diagrams and charts 6 0.59Review, summarize, and explain information and data 3 0.54Construct a reasoned argument 2 0.29Make a prediction using data 1 0.58Summarize patterns 3 0.59
The mean p value across the 17 items on the assessment was .54. The results from Table 4 show that items that asked students to develop and use diagrams and charts (.59), summarize patterns (.59) and review, summarize, and explain information and data (.54), make a prediction using data (.58) and summarize patterns (.59) had the highest scores. Students had more difficulty on items aligned to developing a hypothesis (.38) and constructing a reasoned argument (.29). These findings resemble the findings from the Climate module, which also showed the students performed lowest on inquiry tasks requiring higher-level reasoning. Plate Boundaries Pilot Test Summary Results from the Plate Boundaries module pilot test provided us with evidence that students were able to correlate plate motion to the patterns of earthquakes along the different types of boundaries and were able to analyze data represented both numerically and using the visualization tools. Students were able to look at the data sets in the aggregate and reason
17 The DIGS Concord researchers would re-check the scores of the four affected items before publishing these results. The responses to the items that are to be re-checked are the "B" items, so the percentages displayed on those items should be interpreted more cautiously than the scores on the other items.

SRI International 50 10/31/07
about the likelihood of earthquake occurrences around the world. Student challenges noted by the researcher included:
• understanding scale in visual representations and comparisons • interpreting the cross-sectional representations in relation to the map view
representations • defending conclusions about earthquake patterns along plate boundaries as a result of
limited data collection The most successful part of the unit was the clearly evident engagement that the students experienced with the Seismic Eruption software. Teachers and students alike clearly felt that the unit was an asset for learning about the different characteristics of earthquakes at the different boundaries. Admittedly, the user interface of the Seismic Eruption software had some difficult features that we needed to develop a tutorial to explain. Nevertheless, the students seemed capable of relating the patterns they observed in the table-based data sets with the simulated earthquake behavior at the plate boundaries. This was shown by the students’ responses to the tasks we put in the unit. In addition, the students' responses to assessment items provided evidence that they were capable of relating earthquake patterns to plate boundaries by drawing pictures of the interactions and showing relationships to earthquake epicenter patterns, and using their understanding of the patterns to interpret numerical data sets. As we developed the module, we were concerned about whether middle and high school students would be capable of interpreting the actual data sets that we provided them. Though resources are abundant in the geosciences, there are few data sets that are instantly usable besides those accessible through GIS software tools that require significant training time. The Seismic Eruption software solved this problem. We were also concerned about how well we could determine the appropriate degree of scaffolding that students would need to learn with these types of tools and representations. In the end, based on current literature on scaffolded inquiry and teachers’ comments about the degree of open-endness of some of the activities, we decided that the student learning in the unit would need to be scaffolded in a fairly tight manner. That decision appears to have paid off by virtue of the more effective implementation in the second pilot compared to the less effective implementation in the first. FINDING 6. DESIGN TEMPLATE AND SCENARIOS ON ADDITIONAL GEOSCIENCE TOPICS (Goal 3) As described under Activity 2 of this final report, we developed design principles for geoscience inquiry units and assessments and applied them to the topics of climate change and plate boundaries. To show the general applicability of these design principles, we created a template for designing such scenarios and used it to create four additional scenarios on other geoscience topics. In this section, we present those four scenarios and also present scenarios of the two modules we developed for this project. The template is displayed in Appendix B. A scenario (1) provides a narrative description of a potential supplementary module that could be derived from the template; (2) proposes the general science standards that a module would address, types of representations students would experience, the datasets and visualizations that might be employed, a driving problem, curriculum activities, and evaluation procedures; and (3) proposes the key features of the module’s performance assessment, including the standards to be tested, the assessment tasks, and scoring and reporting methods.

SRI International 51 10/31/07
DIGS Prototype Module Scenarios Climate Module. The Climate module addresses earth science NSES standards for grades 9-12 related to understanding contemporary environmental changes particularly human-induced changes to atmosphere (e.g., population growth, resource use). The driving problem presented is that residents in a city want to know if their climate is getting warmer and if so, whether there is anything that can be done at the local level to help solve the problem. Data representations include data tables, bar and line graphs, girded maps, and aerial images. Data sets and visualizations include monthly minimum and maximum surface air temperatures, a gridded map of carbon emissions, a data table of "State by State Carbon Dioxide Emissions from Fossil Fuel Combustion, a data table showing decade-by-decade population increases from 1910 to 2000 and data about the city’s physical size in 1973 and 1992. Curriculum activities and outcomes engage students in planning research strategies, investigating historical trends in temperature to see if warming is occurring and if the warming is just local or happening in larger geographical areas. Students also examine other data related directly or indirectly to human-induced climate change (e.g., population, urban land mass, carbon emissions, and greenhouse-effect-related pollutants regulated by the Clean Air Act) to see if they notice parallel trends between the climate change in the city and data on these human-induced factors. Finally, students prepare an appraisal of what is going on with the local climate and why, propose a policy to help cool the city, then a research plan to evaluate the effects of their recommendations. As they complete these tasks, the students come to appreciate the systemic relationships among air temperature, air pollutants, and urban heat island effects. Rubrics guide evaluation of student assignments. The performance assessment asks students to apply inquiry strategies and use of datasets and visualizations to a similar problem in a different city which also has issues with air pollution and urban heat island effects. Rubrics guide scoring of student responses to the assessment tasks. Scores are reported by standard. Plate Boundaries Module. The plate tectonics unit and assessment address earth science standards related to crustal dynamics and inquiry abilities. In earth science NSES standards for grades 5-8, plate tectonics are addressed within the structure of the earth system and in grades 9-12 as concepts within energy in the earth system. The curriculum unit is designed to supplement traditional plate tectonics curricula by asking students to conduct investigations revealing the relationships of the patterns of earthquake occurrences, their depth, magnitude and location. The driving problem of the unit and assessment is to understand the nature of earthquakes most likely to occur along different plate boundaries. The types of representations students use include data tables, maps, and graphs. The visualization and analysis tools include GIS images and a simulation tool, Seismic Eruption, which promotes a three-dimensional understanding of plate movement and change over time. In the 4-day supplementary curriculum unit, curriculum activities follow the standard process of scientific inquiry. Students hypothesize about the likelihood of an earthquake at various locations in the world, observe patterns along divergent, convergent, and transform boundaries, collect data, and compare earthquake features at different boundaries. Students analyze earthquake data sets in data tables and in map representations, then select and analyze cross sections to relate the interaction of the plates to the emergent pattern of earthquakes. Evaluation of student assignments is guided by scoring rubrics keyed to the science content and inquiry abilities addressed in the unit. The performance assessment tasks parallel the unit activities to gather evidence of student attainment of the targeted scientific content and inquiry abilities. Students offer an hypothesis, analyze earthquake data along the three types of convergent plate boundaries, develop visualizations, and write explanations to support their

SRI International 52 10/31/07
prediction. Student assessment data are reported by the content and inquiry standards. Rubrics guide scoring of student responses. Scores are reported by standard. Additional Scenarios We intend for these scenarios to describe major features of curriculum and assessment modules that could be developed to support students doing extensive inquiry with visualizations and datasets that are relevant to other geoscience topics . The scenarios provide examples of use of the DIGS design principles for developing additional modules for additional geoscience content areas. The visualizations and datasets we describe in the scenarios are intended to serve as examples. The tools we describe were accessed from resources listed on the DLESE website. Sample Earth History/Fossils Scenario. The National Science Education Standards for Earth Science in grades 5-8 include understanding earth history as revealed by erosion and fossils. The NSES for grades 9-12 address understanding of rock sequences and fossils and the origin and evolution of the earth system and earth materials. A number of relevant datasets and visualizations can support student investigations. The Sedimentation Models tool presents a diverse group of visualizations ranging from photos and still images sequences to animation and output from computer simulations. Geologic Time and the Fossil Record is an interactive site allowing investigations of how fossil evidence and the principle of superposition can used to determine age of rock layers and fossils. A driving problem for a supplementary unit could be to figure out the ages and types of rock in a particular locale. Students could begin by searching the datasets of the designated locale to find the types of rocks and fossils. Referring to the Sedimentation Models tool, students could compare the types of rocks and fossils in the designated locale to those in another locale and explain how the records suggest the relative ages of the regions. To support their conclusions, students could run investigations using the Geologic Time and the Fossil Record to simulate the types of rock layers and fossils characteristic of an age. Rubrics would guide teachers’ evaluations of students’ investigations, use of the technologies, and evidence in support of their conclusions. The performance assessment would assess the concepts and inquiry skills addressed in the unit. The assessment would present students with a dataset of images and with models from different locales. Assessment tasks would ask students to investigate types and ages of rocks by comparing and using simulated dating techniques. Rubrics describing levels of conceptual understanding and inquiry abilities would be used by teachers to score student responses. Data would be reported by the content and inquiry standards. Sample Landform Scenario. The National Science Education Standards for Earth Science in grades 5-8 identify understanding the structure of the earth system, including soils, landforms, and the rock cycle. The NSES for grades 9-12 include understanding earth materials. Following a unit on weathering and erosion, a module on landform evolution could provide students with opportunities to study and conduct investigations using animations and simulations of processes that occur over extended time periods. The visualizations and datasets could involve, for example, WILSIM, a Java applet that offers a web-based interactive landform simulation model of fluvial erosion. The model displays changes related to slope and erosion through animations, snapshots, and profiles. The simulation begins with a rainfall event, and erodes and deposits sediments as it follows water moving downhill. The conditions of the simulation can be configured to vary by time, pattern of rainfall events, bedrock composition, and tectonic uplift rate. The curriculum activities could engage students in using the WILSIM tool. A driving problem could be to predict how a particular area's landform might change as a result of varying rainfall patterns. Students could analyze profiles of an area’s history of landform change and rainfall amounts. Students could conduct investigations of the effects of differing amounts of

SRI International 53 10/31/07
rainfall by varying the amount of rainfall on different landforms (e.g., steep slopes, flat plains). Students could graph and analyze the extent of erosion for the different land forms and amount of rain. Students could make a presentation of their findings. Rubrics focusing on the accuracy and appropriateness of student work would guide evaluation of student assignments. The performance assessment would present students with descriptions of the features of a different landform. The students would use the WILSIM tool to simulate the same rainfall event patterns on different tectonic uplift rates and bedrock characteristics. A series of assessment questions and tasks would target the science content and inquiry abilities (e.g., configuring the model, expressing content knowledge through a reasonable prediction, drawing evidence-based conclusions). Results would be reported by science standard. Sample Hydrology Scenario. The National Science Education Standards for Earth Science in grades 5-8 include understanding the structure of earth system landforms and the water cycle. Science curriculum units address topics such as water on land and in the sea, weathering, and erosion. A technology-based module to supplement a unit on processes that shape the earth could engage students in the use of visualizations, datasets, and simulations to investigate factors affecting wetlands. The Analyzing Wetlands, Earth Exploration Toolbook provides a database on protected international wetlands. Another potential technology tool, Annotation Change in Satellite Images, teaches students how to document changes in before-and-after sets of satellite images. A driving problem could be for students to recommend how to protect a wetland of interest to them from threats such as erosion and floods that are exacerbated by human development. Curriculum activities could engage students in using the visualizations and datasets to support their inquiry processes. Students could begin with understanding the problem by searching databases and satellite images on the chosen wetland. Students could represent the different forms of data by extracting the data and satellite images that would allow comparison of the wetland features over time. Students could then analyze the types and rates of changes in the wetland and investigate a proposed change by examining how the change will affect the health of another wetland. Students could use the information, data, and images from the curriculum activities to support a presentation on their recommendation. Rubrics focusing on the appropriateness, breadth and depth of students’ inquiry abilities and content would guide evaluation of outcomes demonstrated in the student work in the curriculum activities. The performance assessment would present a brief, parallel problem for a new wetland (e.g., a younger wetland, or a wetland in a different type of biome). The types of tasks would be adapted to the briefer time span of the assessment by limiting the scope of the problem, limiting the data analyses, and writing more succinct responses. Evidence of the science content and inquiry abilities addressed in the curriculum activities would be elicited in a series of assessment tasks in which students would use the visualizations and data sets to demonstrate their knowledge and skills. Rubrics would guide scoring of the student work in the assessment tasks. Data on student achievement would be reported by the key content and inquiry abilities. Sample Solar System Scenario. The National Science Education Standards for Earth Science in grades 5-8 identify understanding the solar system including days, years, phases, and eclipses. The NSES for grades 9-12 address the origin and evolution of the universe. In 9-12 curricula, the study of the solar system presents challenges because of scope and visibility. Following a unit on the solar system, students could deepen their understanding by actively manipulating components of the solar system to study relative positions related to times of the year, phases, and eclipses. Datasets and models such as SimSolar display positions of the sun, moon, and planets for any data selected. Students can tilt and rotate the entire system to view it from various perspectives. They can set the system in motion and observe planets move around

SRI International 54 10/31/07
their orbits. Students can zoom in an out and activate labels that identify solar system components. The Solar System Simulator also allows user to manipulate seasons on Earth and other planets. In the Animated Virtual Planetarium, the Rotating Sky module shows movement of stars in both celestial and horizon views. A driving problem for a supplementary unit might be to figure out safe timing for the return of a Mars explorer research ship and to represent the positions of the solar system components for the recommended time. Students could begin by investigating in SimSolar the positions of the sun, moon, and planets at varying times of the year and also light and cosmic conditions such as pathways of comets and meteors. Students could also manipulate the Rotating Sky module in the Animated Virtual Planetarium to depict the movement of stars at varying times. Students could compare the positions of components of the solar system at potentially different times for re-entry and relate those times to safety conditions such as heat, light, and known timing of comets. To support their recommendations, students could capture screen shots of the solar system components to compare at the recommended time and one other time and argue the safety advantages of their recommendation. Rubrics would guide teachers’ evaluations of students’ investigations, use of the technologies, and evidence in support of their conclusions. The performance assessment would assess the concepts and inquiry skills addressed in the unit. The assessment would present students with pre-specified settings to run SimSolar and ask students to describe and explain safety conditions at those times. Then students could be asked to find a new safe time, depict it in the two simulations, and explain the advantages of that time. Rubrics describing levels of conceptual understanding and inquiry abilities would be used by teachers to score student responses. Data would be reported by the content and inquiry standards. DISCUSSION We addressed a set of key issues in the course of the project that have implications for how useful the DIGS design principles could be for the development of future data-centered inquiry modules on geoscience topics. One challenge we faced was how to prompt a wide range of inquiry tasks within the constraints of the focal phenomena and data sets. Some of the inquiry standards such as designing an experiment and testing a hypothesis are more easily addressed in biology, chemistry, or physics labs than in our tasks. We were also challenged to reduce the cognitive load on students so that we could work within our self-imposed time constraints of five-class-period units and two-class-period performance assessments. We imposed these time constraints because we assumed that the average teacher would be unwilling to devote more than that amount of time to a supplementary unit that is designed for applying prior learning of content to inquiry tasks. With these constraints came trade-offs. At first, we saw potential for building a wider range of tasks into the units that would address more data sets and stimulate more investigations, but our time constraints forced us to limit the range. We also were forced by the time constraints to limit the student uses of technologies that would have otherwise yielded richer student thinking about the topics. For example, both units had the potential to provide the foundation for extended hands-on time with a geographic information system such as MyWorld™ or ArcExplorer™, but we concluded there was not enough time to teach the students how to use these tools without sacrificing core components of the units. Nevertheless, we found it possible to (1) prompt a range of data analysis tasks, (2) provide end-of module assessment tasks that measure near-transfer, (3) find evidence that our modules filled a gap in the typical secondary-level science education programs, and (4) adapt our design principles to the contrasting demands of our focal topics.

SRI International 55 10/31/07
Prompting a range of data analysis tasks. We found with both modules that it was relatively easy and straightforward to construct data analysis tasks because we were committed from the outset to centering our modules on using real data sets about real geoscientific phenomena. Hence, we built our modules around the data sets and representational tools that we found feasible for the upper middle and high school level courses that cover the topics, within the time constraints for module duration that we assumed would be needed to make the modules fit within the typical teacher's crowded schedule. Providing end-of module assessment tasks that measure near-transfer. We aimed to provide a means of assessing the skills and understandings that are the foci of the problem-based learning activities in the units. We felt that such assessments would provide a way for future teacher users of the modules to directly assess impact. Without such assessments, teachers would rely on traditional assessments that are not well calibrated to detect the student learning outcomes that result from implementations of problem based inquiry curricula. We were able to construct parallel tasks that applied the unit activities to different yet related problems and were able to adapt the tasks so that the student responses would yield clear evidence of their skills and understandings and were able to align these skills and understandings to national science standards. Filling a gap. Our teachers welcomed the modules as opportunities for their students to make choices in data investigations and explain their reasoning. The technology we chose enabled many of the tasks, especially the Seismic Eruption software we used in the Plate Boundaries Module and the Excel software we used in the Climate Module. Modules like the ones we developed in DIGS can fill a gap in the typical science curriculum. Students often do not have enough time in school to develop their data literacy and other inquiry skills in their science classes. This may be because their teachers feel too much pressure to prepare students for standardized tests that are more aligned to content standards than to inquiry standards. It may also be because the teachers cannot find inquiry curricula with which they are satisfied, such as the Climate Module pilot test teacher who complained about the "labs in a can" at his school. Adaptability to the contrasting demands of our focal topics. In some ways, the Climate Module presented a bigger development challenge than the Plate Boundaries Module which had students investigate the relatively predictable relationships between plate boundary characteristics and earthquake activity. The Climate Module, by contrast, addressed what constitutes evidence of climate change and its causes, a topic that is more controversial and complex. Hence, we felt that it required more of an "ill-structured" set of problem-based tasks than the Plates topic. Yet, we needed for it to tell enough of a story of trends and relationships among variables to be usable for high school students. At the same time, we tried to use the uncertainty found in climate science as an asset for student learning rather than as a liability. To do this, we prompted the students not only to draw evidence-based conclusions but also to think critically about what they did not know from the data and what additional research would be appropriate. FINDING 7. DISSEMINATION Researchers Zalles, Gobert, Quellmalz and Pallant co-authored presentations and papers that Zalles delivered over the course of the project, In December 2006 and 2007, Dr. Zalles made a presentation about the DIGS project at the Annual Meeting of the American Geophysical Union. The 2006 session was entitled "Inquiring with Geoscience Datasets: Instruction and Assessment." At the 2007 AGU meeting, Dr. Zalles and consultant Mark McCaffrey organized the session “Data Need Not Be Deadly: Bringing Inquiry Alive to Foster Earth System Science

SRI International 56 10/31/07
Education and Scientific Literacy.” His DIGS presentation during the session was titled “Assessing the Impact of Data-Immersive Technology-Enabled Inquiry Projects on High School Students' Understanding of Geoscience.” Zalles also presented papers about DIGS at the April 2007 Annual Meeting of the American Educational Research Association (“Assessing Student Learning in the Data Sets and Inquiry in Geoscience Education (DIGS) Project and at the June 2007 ESRI Education Users’ Conference (“Building data Literacy, visualization, and inquiry in geoscience education”). Most recently, he described various DIGS tasks and results in a presentation at the July 2007 Ackerman Colloquium, sponsored by Purdue University’s Center for Civic Education (“Designing Online Social Networks to Ratchet up the Quality of Civic Discourse”). Now that the final materials have been posted to the DIGS web site, plans are underway to post links to it on appropriate geoscience education portals such DLESE and SERC. CITATIONS Baxter, G. P., & Glaser, R. (1998). Investigating the cognitive complexity of science
assessments. Educational Measurement: Issues and Practice, 17, 37-45.
Bransford, J. D., Brown, A. L., & Cocking, R. R. (2000). How people learn: Brain, mind, experience, and school. Washington, DC: National Academy Press.
Evenson, D. H., & Hmelo, Cindy E. (Eds.). (2000). Problem-Based Learning: A Research Perspective on Learning Interactions. Mahwah, New Jersey: Lawrence Erlbaum Associates.
Hmelo-Silver, C. E. (2004). Problem-based learning: What and how do students learn?
Educational Psychology Review, 16, 235-266. Jonassen, D.H. (1997). Instructional Design Models for Well-Structured and Ill-Structured
Problem-Solving Learning Outcomes. Educational Technology: Research and Development, 45(1), 65-95.
Pellegrino, J., Chudowsky, N., & Glaser, R. (2001). Knowing what students know: The science and design of educational assessment. Washington, DC: National Academy Press.
Quellmalz, E. S., & Haydel, A. M. (2003, April). Using cognitive analyses to describe students’ science inquiry and motivation to learn. Paper presented at the annual meeting of the American Educational Research Association, Chicago, IL.

SRI International 57 10/31/07
APPENDIX A. EVALUATION REPORT This document serves as the final evaluation report on the Data and Inquiry in Geoscience Education (DIGS) project. The DIGS project is under the direction of Drs. Daniel Zalles, Edys Quelmalz, and Janice Gobert. This report is based on information gathered from the original proposal, program documentation, observations of assessment implementation, review of assessment and curriculum, reviewing think aloud data, classroom visits, discussions with key staff members, and the curriculum and assessment materials. This report addresses
1. Based on the written proposal and team discussions, what are the project’s expectations?
2. Using evidence from observations, interviews and program documentation, what has the CTL team accomplished with respect to those expectations?
3. Has the curriculum design team met these expectations? Data and Inquiry in Geoscience Education (DIGS) is a proof-of-concept project that aims to increase student learning using web-based supplementary geoscience curriculum modules. The modules engage and scaffold middle and secondary students in inquiry projects addressing important geoscience problems using technology to access real data sets in the geosciences and then interpret, analyze, and communicate findings based on these data sets. The curriculum modules are intended to address NSES geoscience and inquiry standards as well as NCTM data literacy standards. Since inquiry-based and data-rich geoscience curricula are few and valid assessments of the corresponding conceptual understanding and inquiry processes are rare, the project was expected to lay the foundation for the expansion of the repertoire of resources available to geoscience educators. The project was a proof-of-concept demonstration of an innovative resource that addresses inquiry and geoscience education standards. The curriculum inquiry modules and performance assessment modules using geoscience data sets were developed with the combined expertise of geoscientists, science educators, researchers, and assessment specialists. Few geoscience curricula have access to Web-based modules that engage students in inquiry using real geoscience data sets. This project created and implemented performance assessments with technical quality data that provided evidence of students' understanding of geoscience, the full range of inquiry abilities, and proficiency with the tools of geoscience. Cognitive interviews with students contributed to the research base on student conceptual and inquiry learning in the geosciences. Evaluation activities In order to carry out the evaluation of this project, I attended the advisory board meeting in early 2006 discussing module development and technology support. I reviewed the DIGS website with the information for the teachers. I also reviewed the climate and plate units early and then later in their development and the advisors’ responses to the units and plans. In addition, I contributed to the evaluation questions that were sent to the advisory board as they reviewed the units and assessments. To examine the quality of each of the module's performance assessments, I listened to audio transcripts of four pilot students' cognitive interviews against the written responses of the same students. Finally, I observed two classrooms implementing the climate unit during the second piloting. I base my findings on these evaluation activities. Module Development and Implementation In this project, the researchers proposed to create two different geoscience Inquiry curriculum modules and corresponding performance assessments in which students use web-based geoscience data sets to carry out inquiry in the middle or secondary science classroom. They

SRI International 58 10/31/07
proposed to create “near-transfer” performance assessments that correspond to the curriculum projects. The researchers’ main aim was to develop performance assessments and the corresponding supplementary curricular modules to support student success on the performance assessments. The researchers have successfully developed the materials as stated in their expectations. In this project, students completed 4-5 day supplementary curriculum units on important geoscience topics: Climate change and Understanding Plate Boundaries. The DIGS researchers chose these topics because (1) the topics are widely taught in secondary science classrooms; (2) they provide the contrasting inquiry methods applied across different geoscience disciplines, and (3) large publicly-available real-world data sets are available, as are software tools that permit students to represent the data in different ways. The modules were piloted in the Boston area and San Francisco Bay Area. Climate Module The Climate module developed for this project is titled The Heat is On: Understanding Local Climate Change. In this module, students draw conclusions about the extent to which temperature data about Phoenix, Arizona suggests that a shift in climate is taking place there. Students struggle with human-induced temperature change versus natural variability. Students take temperature data and make bar graphs as well as read maps and interpret world maps that indicate the amount of carbon dioxide and temperature changes over time. The data are from the Global Climate Historical Network data base. In the module, students compare the changing trends in Phoenix to larger temperature trends from around the world, then search for evidence of a relationship between the temperature data and data that would suggest human induced changes (such as carbon dioxide in the air). The performance assessment requires that students apply the methods and findings from the Phoenix investigation to climate data for Chicago. The assessments are near transfer tasks of the curriculum units. The climate assessment poses more selected- than constructed-response items than the supplemental unit. Plate Boundaries Module The Plate Boundaries module developed for this project is titled On Shaky Ground: Understanding Earthquake Activity along Plate Boundaries. Students use simulations to explore relationships between earthquakes and the characteristics of plate boundaries in the Earth's crust. The researchers selected Seismic Eruption as a software program that simulates three-dimensional data about world-wide earthquakes over time. Students hypothesize about the likelihood of earthquakes at different locations around the world, observe earthquake patterns, collect earthquake data across different plate boundaries, develop cross sectional visualizations of plate boundaries, and relate interactions of the plates to the emergent pattern of earthquakes. In the assessment, the students run and analyze historical simulations of earthquake data on a type of plate boundary different from the one investigated in the unit—again a near transfer task. Software Selection In order to support students in their analysis of the data sets, software programs were selected. For the Plate Boundaries unit, a three-dimensional simulation tool called Seismic Eruption was selected. This program allows students to compare earthquakes along different plate boundaries. For example, it allows students to see a cross section of a plate boundary while plotting the depths of earthquakes. For the Climate Unit, the researchers chose Excel as the tool with which students would get hands-on time to sample data and produce graphs to investigate air temperature change trends. They chose the MyWorld™ geographic information system to display visualizations of specific geospatial distributions of temperature and carbon emission data sets. The selection of the data sets and modeling tools that students would be able to interpret and use are probably one of the most crucial components for successful implementation. In this case, students were able to use the data sets, software, and models.

SRI International 59 10/31/07
Expert Review and Testing The curriculum units and corresponding performance assessments were reviewed by geoscientists, science education experts, data literacy education experts, and assessment experts. During development, a panel of advisors reviewed the module materials and alignments to standards. The advisors further reviewed modules between the pilot tests. An advisory panel meeting was held in the first year of the project where advisors gave input about the modules. Later, advisors reviewed the materials separately and provided feedback to the researchers. The researchers carried out feasibility testing with small groups of students to determine the extent to which the tasks and questions were clear, that the tasks elicited the intended knowledge and inquiry skills, and that the tasks were grade level appropriate. Five students were tested for the climate module and four were tested for the plate boundaries module. The students were observed responding to the prompts and were debriefed about the modules in interviews. Once the researchers revised the modules based on the feasibility testing, the two modules were pilot tested. In October 2006, the first round of the climate module pilot test was conducted in four 11th and 12th grade environmental science classes in California. Ninety-nine students participated in the pilot test and completed the core. The second round of pilot testing took place in May 2007 in California in two classes that contained a total of sixty students. The plate boundaries module was first pilot tested in two 9th grade classes in a public high school in Massachusetts. A second round of pilot testing was conducted in 15 classes of 8th grade students in a district near Boston in which plate boundaries is taught in 8th grade rather than in the more typical 9th grade. During pilot testing, the researchers asked average-achieving (medium high and medium low) students to think aloud as they responded to the assessment prompts. The think-aloud transcripts permitted analysis inquiry skills and content knowledge elicited by the assessment tasks and provided partial evidence of content and construct validity. The researchers observed the students while they completed the supplemental curricular units and assessments. Results from the climate unit testing indicated that students were especially engaged by the opportunities provided them in the modules to make choices about what temperature data to examine. The researchers noted that students had challenges with (a) applying the knowledge of emission effects with data analyses, (b) differentiating between the concepts of carbon emission and carbon accumulation, (c) understanding how daily minimum, maximum, and mean monthly temperature readings carry different implications for understanding climate trends (d) drawing conclusions based on scientific evidence and (e) recognizing the importance of collecting counterfactual data when evaluating outcomes of interventions. This evaluator observed that students had difficulty with interpreting their temperature graphs especially with monthly fluctuations versus yearly changes and making decisions about what data are most convincing and reliable. Students clearly need more experience working with and interpreting data sets. Students had some familiarity with Excel, but their interpretations of the data were limited. This is no fault of the curriculum; rather, a justification for its need. Results from the plate boundaries unit pilot testing indicated that students were able to relate plate motion to the patterns of earthquakes along the different types of boundaries and were able to analyze data represented both numerically and using the visualization tools. Students were able to review earthquake data and draw conclusions with evidence about the type of boundary the data represent. The researchers noted that students had difficulty with understanding scale in the visual representations, (b) interpreting the cross-sectional

SRI International 60 10/31/07
representation of the plate boundary as it related to the map view representation and (c) drawing and defending conclusions about earthquake patterns along plate boundaries as a result of limited data collection. As identified in both pilot tests with schools across the nation, students clearly struggle with using and interpreting data and drawing conclusions from large real life data sets. This only emphasizes the need for more of such data and inquiry-centered curricula. Performance Assessments The researchers developed performance assessments for both curricular areas. These assessments were pilot tested and cognitive interviews conducted to ascertain the expected links between the tasks and the intended standards. Upon review of the performance assessment cognitive interviews, I noticed that the items and tasks designed for the project elicited the expected content knowledge and inquiry skills. For example, in the think-aloud student work for the Plate Boundaries assessment, students were asked to describe differences in earthquake patterns between different convergent plate boundaries. Students responded with statements about the densities of the plates leading to different seismic and volcanic events. Students also were able to observe data about a plate boundary and draw conclusions using evidence about the type of boundary that the data and visualization represent. Project Distinction During my career as a science educator and researcher over the past 27years, I have been exposed to numerous science curricula: some innovative, others repetitive. What makes the DIGS curriculum stand out is that students are beginning to carry out science processes using the actual data that geoscientists might use, plus they are using databases in order to draw conclusions about real life questions. In many innovative curricula, students might collect data and manage that data, but in this curriculum students use the large data sets generated by scientists to draw conclusions. Furthermore, in this curriculum students learn about managing data, natural variation within gradual trends, and struggle with averages versus actual data etc., which are all important inquiry/data management skills. Finally, the students learn to understand that these data represent a model of the physical world. In my observations of the tasks that students are expected to do, not all students got where they were supposed to be, but they moved in that direction. For example during the observation of the Climate unit, students struggled with interpreting patterns in annual averages of temperature data against seasonal fluctuations yet most students were able to explain what the data represented. Conclusions This curriculum stands apart from most other geosciences K-12 curricula because students use real world geoscientific data in order to draw conclusions using an inquiry approach (i.e., earth quake data in relation and learning about plate tectonics as well as climate data in relation and learning about weather and climate change). Overall, the researchers successfully completed and pilot tested their curriculum as outlined in the grant proposal. Two curriculum modules were produced and performance assessments for those modules were created. The modules and performance assessments were reviewed by a panel of experts, they were tested with small groups of students and then they were pilot-tested in multiple classrooms across the United States. Evidence from the performance assessments cognitive interviews and student work indicates that tasks evoked the knowledge and performances intended as well as made aware to this evaluator the greater need for students to learn to analyze data and draw conclusions based on evidence. Also noteworthy is the dissemination of the materials and research. The researchers have documented their progress and have presented their findings at conferences.
SRI International 61 10/31/07
Learning from the implementation. Based on the cognitive interviews and observations of curriculum implementation, there may be great challenges to the implementation in other classrooms and schools BUT that these implementation challenges result from students not being ready for this kind of work rather than a curricular issue. The curriculum is asking for the students to do exactly what they need to do in order to learn these tasks and the assessments ask the right questions to find out what they know about the tasks. For example, being able to work with Excel in order to make graphs and use the graphs for data analysis requires that students have some prior experience with this kind of work. However, some of the students that I interviewed in the classroom stated that they had not used Excel before and almost no student was able distinguish between the difference mean data and real data let alone distinguish between trends and natural variation. If this kind of knowledge is important, then the need for this curriculum is huge but the implementation of the curriculum requires multiple opportunities for students to learn the data processing skills as well as be able to draw conclusions from the data once they have an understanding of it. Another implementation issue worth mentioning is the general lack of computers in the schools. There are some schools with great technology, but many schools are under funded and ill equipped to use this technology-rich material. Design Principles Applied to Other Science Areas. Another important conclusion revolves around the application of the design principles to other science content areas. The developers embedded a problem-based learning task in each unit that required the investigation of data that may not have a single correct response (e.g., investigating the links between earthquake depth and type of plate boundary). The National Research Council's National Science Education Standards, with their board conceptual knowledge and inquiry skills, serve as the foundation for these problem-based learning tasks. The learning tasks and performance assessments asked the students to pose research questions, pose hypotheses, plan and conduct investigations, gather evidence, analyze data, consider disconfirming evidence, and provide evidence based explanations. When the design principles (i.e., using problem-based learning tasks requiring scientific inquiry skills along with evidence-based performance assessments) are applied to other content areas there are several issues to consider. Since the application of the inquiry skills and modeling in a broad way are similar across scientific fields but specific methods of analysis, reasoning and modeling vary across disciplines, curriculum and assessment development requires strong and broad scientific knowledge of the curriculum and assessment developer as well as the classroom teacher. Second, finding the right kinds of data sets and modeling tools that would be interpretable by students may be difficult to find in all geoscience areas. Finally, with the curriculum of the schools bursting at the seams with material, what will these units replace in the classroom? While some geoscientists rely on the analysis of these kinds of data, what other types of geoscience investigations might be necessary or not to include in the curriculum. Overall, this evaluator, having worked with other geoscience curricula, found DIGS to fill in the gap on the use of large data sets for analysis with meaningful real world scenarios that engaged students. Many of the students who worked with the units developed additional inquiry skills that they had not learned before. I think the greatest challenge and therefore opportunity for this curriculum is the development of these data set inquiry skills that DIGS provides. This curriculum successfully lays the foundation for these types of curricula.

SRI International 62 10/31/07
APPENDIX B. TEMPLATE FOR SUPPLEMENTARY CURRICULUM AND ASSESSMENT MODULES Introduction The supplementary modules developed for the NSF project, Datasets and Inquiry in Geoscience Education (DIGS), follow a set of design principles and structures that can be used to shape additional curriculum modules for a range of geoscience concepts and inquiry skills used conducting authentic inquiry in them. The DIGS curriculum modules are designed to present significant, recurring problem types with multiple solutions; conceptual questions that require drawing and explaining relationships among elements in complex systems; the integration of data and information from multiple data sets and representational formats; activities engaging students in dynamic, iterative inquiry processes, including planning, conducting, analyzing, interpreting, and communicating; and use of multiple Web-based data sets and visualizations and analysis tools. The generic template for the DIGS curriculum and assessment modules lays out the specification choices for the science content and inquiry standards the module is designed to promote, the types of driving problems, curriculum activities and assessment tasks that students will engage in, the geoscience datasets, software, and visualization tools students will use, and the kinds of evidence that will be gathered to determine that students are achieving the targeted standards. Once choice from the menus in the template are made by the module designer, task shell can be developed that outline the particular problem, sequence of curriculum and assessment tasks and questions, technology to be used, and alignments with targeted standards. The design process begins by selecting the standards and particular concepts and skills to be promoted and tested.
• Geoscience area: (e.g., Objects in the Universe, History of Earth, Properties of Earth Materials, Tectonics, Energy in earth Systems, Climate and Weather, Biogeochemical Cycles.)
• Grade levels: 5-8, 9-12 • Science content: (specified concepts and principles from the area, e.g., Uneven heating
causes global wind patterns) • Science inquiry skills: NSES inquiry abilities, e.g., pose questions, design and conduct
investigations, analyze, interpret data, explain findings, communicate findings) • Technology proficiencies: (e.g., use visualizations, spreadsheets, softwares
Curriculum and Assessment Template The prototype DIGS units and assessments incorporated design features from each of the areas below:
• Authentic problem: (Students are presented with an overarching problem that can be addressed by using datasets, software, and visualization tools to collect, analyze, and draw conclusions about the problem.)
• Types of scenarios: e.g., o Given a problem, make hypotheses, analyze and interpret datasets and displays,
communicate findings and conclusions; o Given datasets and displays, identify problem, analyze and interpret data from
multiple sources, communicate conclusions/recommendations; make presentations.
• Types of activities: e.g.,

SRI International 63 10/31/07
o Access data and information, o Specify which variables to manipulate, o Conduct investigations with the dataset/technology tool, o Transform data from one representation to another, o (add the menu of choices)
• Types of representations: e.g., o Data tables o Data graphs o Geospatial data visualizations o Remote sensing o Video o Animations o Models o Simulations
• Types of technology: e.g., o Web-based databases o Software applications o Productivity tools. o Internet
• Types of student responses and work products: E.g., o Graphs, charts o Screen shots o Written explanations o Reports o Models (student-generated) o Presentations
• Criteria for achievement of goals/standards o Rubrics to evaluate student work o Use of scores for reports to students and teachers

SRI International 64 10/31/07
APPENDIX C. ASSESSMENT RESULT STATISTICS FROM THE TWO CLIMATE MODULE PILOT TESTS The first table below shows descriptive statistics for each item, in order of their sequence on the instrument:
• Range • Scale size • N • Mean • Std. Deviation • Mean on 0-1 metric (p value) • Frequencies for each score value
The second table shows the p values by item and standard. Both tables display the mean item p value (.66) at the bottom.
Table C1. Climate Assessment Descriptive Statistics for Each Item Item (sr=selected response; cr=constructed response) Range
Scale size Interval N Mean
Std. Deviation
P value (mean on 0-1 metric)
Frequencies for each score value (1 column per value)
0 1 2 3 missing
A1 (cr). Produce a graph that allows you to compare the minimum monthly temperatures in 1948 and 2003. 0-2 3 2 80 1.74 0.4428 0.87 0 21 59 0 22 A2 (cr). Look at the annual means in 1948 and 2003. Do they suggest there was a temperature increase? Explain your answer in a sentence or two. 0-1 2 1 100 0.70 0.5096 0.70 30 70 n/a n/a 2 A2 (sr). Look at the annual means in 1948 and 2003. Do they suggest there was a temperature increase? Explain your answer in a sentence or two. 0-1 2 1 100 0.93 0.2564 0.93 7 93 n/a n/a 2 A3 (cr). Look at the month-by-month data in 1948 and 2003. Do they suggest there was a temperature increase? Explain your answer in a sentence or two. 0-2 3 2 80 1.34 0.7786 0.67 15 23 42 n/a 22
A4 (cr). Describe what you noticed in the graphs that supports your answer. 0-2 3 2 100 1.03 0.8097 0.52 31 35 34 n/a 2
A4 (mc). Which statement is most accurate about the minimum temperature data? 0-1 2 1 97 0.88 0.3310 0.88 12 85 n/a n/a 5

SRI International 65 10/31/07
A5 (cr). Describe what you noticed in the graphs that supports your answer. 0-2 3 2 100 0.77 0.7635 0.39 43 37 20 n/a 2
A5 (mc). Which statement is most accurate about the Chicago maximum temperature data? 0-1 2 1 100 0.80 0.4264 0.80 21 79 n/a n/a 2
B1 (cr). Describe what you noticed on Map 1 that supports your answer. 0-2 3 2 100 1.43 0.7946 0.72 19 19 62 n/a 2
B1 (mc). Which answer describes how fast Chicago is warming compared to the rest of Illinois? 0-1 2 1 100 0.94 0.2387 0.94 6 94 n/a n/a 2
B2 (cr). Describe what you noticed on Map 1 that supports your answer. 0-2 3 2 98 0.94 0.6859 0.47 26 52 20 n/a 4 B2 (mc). How quickly is Chicago warming compared to how quickly other areas of the 48 states in the continental U.S. are warming? 0-1 2 1 100 0.92 0.2727 0.92 8 92 n/a n/a 2 C1 (cr). Agree or disagree with this statement: “The data on Maps 1 and 2 provide evidence that LOCAL COMMUNITIES can have a direct and powerful impact on their LOCAL CLIMATES. In a sentence or two, write if you agree or disagree and describe what you noticed on both Map 1 and Map 2 that supports your answer. 0-2 3 2 95 0.72 0.6130 0.36 35 52 8 n/a 7 C2 (cr). The table and graph below show the populations of Phoenix and Chicago every 10 years since 1940. In sentence or two, compare how Phoenix’s population changed with how Chicago’s population changed. 0-2 3 2 92 1.02 0.5341 0.51 12 66 14 n/a 10 C3 (cr). Explain your selection 0-3 4 3 92 1.26 1.0149 0.42 30 16 38 8 10

SRI International 66 10/31/07
C3 (mc). The images below show changes in the physical size of the Greater Chicago area (the city and its suburbs) in 1973 and 1992 compared with the changes in the Greater Phoenix area, as measured in square miles. The developed land is colored red. Which claim most accurately summarizes how the physical sizes of the two cities changed. 0-1 2 1 92 0.88 0.3262 0.88 11 81 n/a n/a 10 D1 (cr). Do the data you examined about Chicago convince you that its climate is getting warmer? If yes is your answer, what data in particular? If no is your answer, why not? 0-2 3 2 91 1.01 0.6749 0.51 20 50 21 n/a 11 D2. Do you see a relationship in the data you examined between changes in Chicago's temperatures and population? Write yes or no, then explain your answer. 0-2 3 2 92 1.15 0.7694 0.58 21 36 35 n/a 10 D3. Do you see a relationship in the data you examined between changes in Chicago's temperatures and physical size? Write yes or no, then explain your answer. 0-2 3 2 81 1.19 0.7764 0.59 18 30 33 n/a 21 D4 (cr). Explain your selection. 0-1 2 1 87 0.86 0.3468 0.86 12 75 n/a n/a 15 D4 (mc). Chicago's City Council is thinking of enacting some of the policies listed below. Recommend one that could lead to less carbon being emitted into the atmosphere. 0-1 2 1 87 0.99 0.1072 0.99 1 86 n/a n/a 15 D5 (cr). Explain your selection. 0-1 2 1 82 0.69 0.4648 0.69 25 56 n/a n/a 20 D5 (mc). To reduce urban heat island effects, the Chicago City Council may carry out one of the actions listed below. Select one that you recommend. 0-1 2 1 82 0.84 0.3675 0.84 13 69 n/a n/a 20

SRI International 67 10/31/07
D6. Imagine that after the Chicago City Council puts policies in place that decrease urban heat island effects, they discover that the residents of Chicago are using less electricity. What might explain how the reduction in heat island effects and the reduction in electricity may be related? 0-2 3 2 82 0.57 0.8319 0.29 53 11 18 n/a 20 D7. The Chicago City Council does what you recommend to reduce urban heat island effects. A few years later, the Council wants you to evaluate if the policy is successful. Below is a list of possible types of data you might collect. Select two types you think should be collected. Then, explain your selections. 0-2 3 2 82 0.77 0.6344 0.38 28 45 9 n/a 20 D8. Why would it be a good idea to collect your data in the city AND in rural locations near the city? 0-2 3 2 82 1.16 0.7930 0.58 20 29 33 n/a 20 D9. The City Council has given you a limited budget for collecting data. How often do you think the data should be collected? Select one answer, then explain your selection. 0-2 3 2 82 1.45 0.6695 0.73 8 29 45 n/a 20 D10 (cr). How confident are you that the temperature data and other data you examined provides enough evidence to explain if Chicago is or is not getting warmer. Select one answer, then explain your selection. 0-2 3 2 81 0.96 0.7656 0.48 25 34 22 n/a 21 D11 (cr). Imagine that ten years have passed since Chicago's City Council approved policy measures that were supposed to lead to reductions in how much carbon the Chicago residents emit. However, temperatures have not gone down. What might explain why? 0-2 3 2 81 1.32 0.6486 0.66 8 39 34 n/a 21 Mean item p value 0.66

SRI International 68 10/31/07
Table C2. Climate assessment p values by item and standard
Standard Scoring criterion Item P value (mean on 0-1 metric)
Construct a reasoned argument
Demonstrated ability to argue the extent to which conceptually related but non-parallel data sets show
D2 (cr). Do you see a relationship in the data you examined between changes in Chicago's temperatures and population? Write yes or no, then explain your answer 0.58
Construct a reasoned argument
Reasonable data-based argument supported by data from diverse data sets and data representations
D1 (cr). Do the data you examined about Chicago convince you that its climate is getting warmer? If yes is your answer, what data in particular? If no is your answer, why not? 0.51
MEAN FOR THE STANDARD 0.54
Critique explanations according to scientific understanding, weighing the evidence, and examining the logic
Demonstrated ability to make a data-based conclusion about relationships between raster map variables
C1 (cr). Agree or disagree with this statement: “The data on Maps 1 and 2 provide evidence that LOCAL COMMUNITIES can have a direct and powerful impact on their LOCAL CLIMATES. In a sentence or two, write if you agree or disagree and describe what you noticed on both Map 1 and Map 2 that supports your answer. 0.36
MEAN FOR THE STANDARD 0.36
Formulate testable hypothesis
Reasonable, scientifically-grounded attempt to generate an alternative hypothesis that might explain the lack of an effect of an intervention
D11 (cr). Imagine that ten years have passed since Chicago's City Council approved policy measures that were supposed to lead to reductions in how much carbon the Chicago residents emit. However, temperatures have not gone down. What might explain why? 0.66
Formulate testable hypothesis
Ability to critically examine the extent to which conceptually related data sets about population change and temperature change show correlations
D3 (cr). Do you see a relationship in the data you examined between changes in Chicago's temperatures and physical size? Write yes or no, then explain your answer. 0.59
MEAN FOR THE STANDARD 0.63
Human-induced changes to atmosphere
Understanding enough about human sources of carbon emissions to recognize possible solutions
D4 (sr). Chicago's City Council is thinking of enacting some of the policies listed below. Recommend one that could lead to less carbon being emitted into the atmosphere. 0.99
Human-induced changes to atmosphere
Understanding enough about human sources of carbon emissions to recognize possible solutions D4 (cr). Explain your slecction. 0.86
Human-induced changes to atmosphere
The explanation for the selection demonstrates understanding of how data collection supports evaluating effects of interventions implemented to solve problems about human-induced effects on air temperature
D7 (cr). The Chicago City Council does what you recommend to reduce urban heat island effects. (cr). A few years later, the Council wants you to evaluate if the policy is successful. Below is a list of possible types of data you might collect. (cr). Select two types you think should be collected. Then, explain your selections. 0.38
MEAN FOR THE STANDARD 0.74

SRI International 69 10/31/07
Interactions within and among systems result in change
Understanding systemic relationships between specific anthropogenic influences on climate (urban heat island effects and the CO2 emissions)
D6 (cr). Imagine that after the Chicago City Council puts policies in place that decrease urban heat island effects, they discover that the residents of Chicago are using less electricity. What might explain how the reduction in heat island effects and the reduction in electricity may be related? 0.29
MEAN FOR THE STANDARD 0.29
Logical connections between hypothesis and design
Understanding why it is important to collect comparison group (control/treatment) data to test a hypothesis (i.e., that a particular interventions will have the intended positive effects)
D8 (cr). Why would it be a good idea to collect your data in the city AND in rural locations near the city? 0.58
MEAN FOR THE STANDARD 0.58
Plan method A cogent data collection strategy is expressed
D9 (cr). The City Council has given you a limited budget for collecting data. How often do you think the data should be collected? Select one answer, then explain your selection. 0.73
MEAN FOR THE STANDARD 0.73
Radiation of heat
Understanding enough about sources of urban heat island effects to recognize possible solutions
D5 (sr). To reduce urban heat island effects, the Chicago City Council may carry out one of the actions listed below. Select one that you recommend. 0.84
Radiation of heat
Understanding enough about sources of urban heat island effects to recognize possible solutions D5 (cr). Explain your selection. 0.69
MEAN FOR THE STANDARD 0.77
Review, summarize, and explain information and data
Appropriate analysis of graph data and clear communication of evidence
A2 (cr). Look at the annual means in 1948 and 2003. Do they suggest there was a temperature increase? Explain your answer in a sentence or two. 0.70
Review, summarize, and explain information and data
Appropriate analysis of raster map-based data and clear communication of evidence
B1 (cr). Describe what you noticed on Map 1 that supports your answer. 0.72
Review, summarize, and explain information and data
B1 (sr). Which answer describes how fast Chicago is warming compared to the rest of Illinois? 0.94
Review, summarize, and explain information and data
Appropriate analysis of graph data and clear communication of evidence
A2 (sr). Look at the annual means in 1948 and 2003. Do they suggest there was a temperature increase? Explain your answer in a sentence or two. 0.93
Review, summarize, and explain information and data
Appropriate analysis of raster map-based data and clear communication of evidence
B2 (sr). How quickly is Chicago warming compared to how quickly other areas of the 48 states in the continental U.S. are warming? 0.92
Review, summarize, and explain information and data
Appropriate analysis of graph data and ability to clearly communicate the analysis
A3 (cr). Look at the month-by-month data in 1948 and 2003. Do they suggest there was a temperature increase? Explain your answer in a sentence or two. 0.67

SRI International 70 10/31/07
Review, summarize, and explain information and data
Appropriate analysis of remotely-sensed, image-based data and clear communication of evidence
C3 (sr). The images below show changes in the physical size of the Greater Chicago area (the city and its suburbs) in 1973 and 1992 compared with the changes in the Greater Phoenix area, as measured in square miles. The developed land is colored red. Which claim most accurately summarizes how the physical sizes of the two cities changed. 0.88
Review, summarize, and explain information and data
Reasonable and accurate comparing and contrasting of trends in parallel, graphically-represented data sets
A4 (sr). Which statement is most accurate about the minimum temperature data? 0.88
Review, summarize, and explain information and data
Reasonable and accurate comparing and contrasting of trends in parallel, graphically-represented data sets
A5 (sr). Which statement is most accurate about the Chicago maximum temperature data? 0.80
Review, summarize, and explain information and data
Reasonable and accurate comparing and contrasting of trends in parallel, graphically-represented data sets
A4 (cr). Describe what you noticed in the graphs that supports your answer. 0.52
Review, summarize, and explain information and data
Appropriate analysis of graph data and clear communication of evidence
C2 (cr). The table and graph below show the populations of Phoenix and Chicago every 10 years since 1940. In sentence or two, compare how Phoenix’s population changed with how Chicago’s population changed. 0.51
Review, summarize, and explain information and data
Appropriate analysis of remotely-sensed, image-based data and clear communication of evidence C3 (cr). Explain your selection 0.42
Review, summarize, and explain information and data
Appropriate analysis of raster map-based data and clear communication of evidence
B2 (cr). Describe what you noticed on Map 1 that supports your answer. 0.47
Review, summarize, and explain information and data
Reasonable and accurate comparing and contrasting of trends in parallel, graphically-represented data sets
A5 (cr). Describe what you noticed in the graphs that supports your answer. 0.39
MEAN FOR THE STANDARD 0.70
Scientific skepticism
Reflection about level of certainty which shows understanding about the constraints of building a scientific argument about climate change from the limited data available.
D10 (cr). How confident are you that the temperature data and other data you examined provides enough evidence to explain if Chicago is or is not getting warmer. Select one answer, then explain your selection. 0.48
MEAN FOR THE STANDARD 0.48
Use technologies to collect, organize, and display data
A bar or line graph is produced that meets stated specifications for content
A1 (cr). Produce a graph that allows you to compare the minimum monthly temperatures in 1948 and 2003. 0.87
MEAN FOR THE STANDARD 0.87 MEAN ITEM P VALUE 0.66

SRI International 71 10/31/07
APPENDIX D. ASSESSMENT RESULT STATISTICS FROM THE PLATE BOUNDARIES MODULE PILOT TEST The first table below shows descriptive statistics for each item, in order of their sequence on the instrument:
• Range • Scale size • N • Mean • Std. Deviation • Mean on 0-1 metric (p value) • Frequencies for each score value
The second table shows the p values by item and standard. Both tables display the mean item p value (.54) at the bottom.
Table D1. Plate Boundaries Descriptive Statistics for Each Item18
Item Range
Scale size N Mean
Std. Deviat
ion
Mean on 0-1 metric
(p value)
Frequencies for each score value (1 column per value)
0 0.5 1 1.5 2 3 missing
A1 (cr). What similarities in earthquake patterns might you expect to find between oceanic-continental, oceanic-oceanic, and continental-continental convergent boundaries? What are you basing your hypothesis on? 0-2 3 106 0.74 0.6079 0.37 33 12 49 2 10
n/a 5
A2 (cr). What differences in earthquake patterns might you expect to find between oceanic-continental, oceanic-oceanic, and continental-continental convergent boundaries? What are you basing your hypothesis on? 0-2 3 106 0.77 0.8624 0.38 53 3 20 n/a 30
n/a 6
B1, Picture/Box A (cr). Next to each picture on the next page summarize the data and describe the patterns of earthquakes along each boundary. 0-2 3 105 1.24 0.6271 0.62 11 n/a 57 n/a 37
n/a 5
18 The DIGS Concord researchers will re-check the scores of the four affected items before publishing these results. The responses to the items that need to be re-checked are the "B" items, so the percentages displayed on those items should be interpreted more cautiously than the scores on the other items.

SRI International 72 10/31/07
B1, Picture/Box B (cr). On the next page are cross-sections of convergent boundaries labeled on the world map above. Next to each picture on the next page summarize the data and describe the patterns of earthquakes along each boundary. 0-2 3 104 1.17 0.5769 0.58 10 n/a 66 n/a 28
n/a 6
B1, Picture/Box C (cr). On the next page are cross-sections of convergent boundaries labeled on the world map above. Next to each picture on the next page summarize the data and describe the patterns of earthquakes along each boundary. 0-2 3 104 1.14 0.6239 0.57 14 n/a 61 n/a 29
n/a 6
B2, Picture A (cr). Describe and label each picture with the type of convergent boundary (continental-continental, continental-oceanic, oceanic-oceanic) and the letter it corresponds to with the map above. 0-2 3 103 1.26 0.8113 0.63 24 1 27 n/a 51
n/a 6
B2, Picture B (cr). Describe and label each picture with the type of convergent boundary (continental-continental, continental-oceanic, oceanic-oceanic) and the letter it corresponds to with the map above. 0-2 3 102 1.42 0.7818 0.71 19 n/a 23 n/a 60
n/a 7
B2, Picture C (cr). Then, describe and label each picture with the type of convergent boundary (continental-continental, continental-oceanic, oceanic-oceanic) and the letter it corresponds to with the map above. 0-2 3 102 1.18 0.8770 0.59 32 1 21 n/a 48
n/a 7
C1 (cr). Compare the magnitude, depth and location of earthquake epicenters along the convergent boundaries by completing the table for continental-continental boundaries. . 0-3 4 103 2.1 0.9753 0.70 8 n/a 20 n/a 29
46 8
C1 (cr). Compare the magnitude, depth and location of earthquake epicenters along the convergent boundaries by completing the table for continental-oceanic boundaries. 0-3 4 102 2.13 1.0309 0.71 7 n/a 27 n/a 14
54 9
C1 (cr). Compare the magnitude, depth and location of earthquake epicenters along the convergent boundaries by completing the table for oceanic-oceanic 0-3 4 103 1.59 1.1499 0.53 22 n/a 31 n/a 17
33 8

SRI International 73 10/31/07
boundaries.
C2, o to c (cr). Draw a sketch of the different convergent boundaries. Draw and label the location of the earthquakes along the convergent boundaries 0-3 4 100 1.72 1.1956 0.57 23 n/a 20 n/a 20
37 12
C2. o to o (cr). Draw a sketch of the different convergent boundaries. Draw and label the location of the earthquakes along the convergent boundaries 0-3 4 94 1.51 1.2702 0.50 32 n/a 14 n/a 14
34 13
C2, c to o (cr). Draw a sketch of the different convergent boundaries. Draw and label the location of the earthquakes along the convergent boundaries 0-3 4 111 1.58 1.1347 0.53 25 n/a 30 n/a 30
26 12
C3 (cr). Explain how the process along each type of boundary helps describe the patterns you see with the data. 0-2 3 106 0.76 0.8207 0.25 40 n/a 27 n/a 18
n/a 21
C4 (cr). Look at the data from location C on the map. Predict the likelihood of big earthquakes (magnitude greater than 6.5) occurring there within the next 50 years. 0-2 3 107 1.15 0.9064 0.58 41 n/a 27 n/a 18
n/a 21
C4 (cr). Explain your reasoning for your prediction. 3 107 0.66 0.7328 0.33 29 n/a 14 n/a 42
n/a 22
Mean item p value .54

SRI International 74 10/31/07
Table D2. Plate Boundaries assessment p values by item and standard
Standard Scoring criterion Item Mean on 0-1
metric (p value)
Develop a hypothesis
Demonstrate skill at identifying patterns in data and use them in a hypothesis
A1 (cr). What similarities in earthquake patterns might you expect to find between oceanic-continental, oceanic-oceanic, and continental-continental convergent boundaries? What are you basing your hypothesis on? 0.37
Develop a hypothesis
Demonstrate skill at identifying patterns in data and use them in a hypothesis
A2 (cr). What differences in earthquake patterns might you expect to find between oceanic-continental, oceanic-oceanic, and continental-continental convergent boundaries? What are you basing your hypothesis on? 0.38
MEAN FOR THE STANDARD 0.38
Develop and use diagrams and charts
Recognizing and understanding differences in data
C1 (cr). Compare the magnitude, depth and location of earthquake epicenters along the convergent boundaries by completing the table for continental-continental boundaries. . 0.70
Develop and use diagrams and charts
Recognizing and understanding differences in data
C1 (cr). Compare the magnitude, depth and location of earthquake epicenters along the convergent boundaries by completing the table for continental-oceanic boundaries. 0.71
Develop and use diagrams and charts
Recognizing and understanding differences in data
C1 (cr). Compare the magnitude, depth and location of earthquake epicenters along the convergent boundaries by completing the table for oceanic-oceanic boundaries. 0.53
Develop and use diagrams and charts
Recognizing and understanding differences in data
C2, o to c (cr). Draw a sketch of the different convergent boundaries. Draw and label the location of the earthquakes along the convergent boundaries 0.57
Develop and use diagrams and charts
Recognizing and understanding differences in data
C2. o to o (cr). Draw a sketch of the different convergent boundaries. Draw and label the location of the earthquakes along the convergent boundaries 0.50
Develop and use diagrams and charts
Recognizing and understanding differences in data
C2, c to o (cr). Draw a sketch of the different convergent boundaries. Draw and label the location of the earthquakes along the convergent boundaries 0.53
MEAN FOR THE STANDARD 0.59
Review, summarize, and explain information and data
Demonstrate skill at describing data
B2, Picture A (cr). Describe and label each picture with the type of convergent boundary (continental-continental, continental-oceanic, oceanic-oceanic) and the letter it corresponds to with the map above. 0.63
Review, summarize, and explain information and data
Demonstrate skill at describing data
B2, Picture B (cr). Then, describe and label each picture with the type of convergent boundary (continental-continental, continental-oceanic, oceanic-oceanic) and the letter it corresponds to with the map above. 0.71
Review, summarize, and explain information and data
Demonstrate skill at describing data
B2, Picture C (cr). Then, describe and label each picture with the type of convergent boundary (continental-continental, continental-oceanic, oceanic-oceanic) and the letter it corresponds to with the map above. 0.59
MEAN FOR THE STANDARD 0.64
Construct a reasoned argument
A cogent description of patterns is given
C3 (cr). Explain how the process along each type of boundary helps describe the patterns you see with the data. 0.25
Construct a reasoned argument
A cogent explanation of the prediction is given C4 (cr). Explain your reasoning for your prediction. 0.33

SRI International 75 10/31/07
MEAN FOR THE STANDARD 0.29
Make a prediction using data
A cogent prediction is given using data
C4 (cr). Look at the data from location C on the map. Predict the likelihood of big earthquakes (magnitude greater than 6.5) occurring there within the next 50 years. 0.58
MEAN FOR THE STANDARD 0.58
Summarize patterns Demonstrate skill at describing patterns in data
B1, Picture/Box A (cr). Next to each picture on the next page summarize the data and describe the patterns of earthquakes along each boundary. 0.62
Summarize patterns Demonstrate skill at describing data
B1, Picture/Box B (cr). On the next page are cross-sections of convergent boundaries labeled on the world map above. Next to each picture on the next page summarize the data and describe the patterns of earthquakes along each boundary. 0.58
Summarize patterns
Demonstrate skill at using data to create a reasoned argument.
B1, Picture/Box C (cr). On the next page are cross-sections of convergent boundaries labeled on the world map above. Next to each picture on the next page summarize the data and describe the patterns of earthquakes along each boundary. 0.57
MEAN FOR THE STANDARD 0.59 MEAN ITEM P VALUE 0.54