Embed Size (px)
Citation preview

DATA SERVICES MARKET INQUIRY
PROVISIONAL FINDINGS AND RECOMMENDATIONS
competition commissionsouth africa
24 April 2019


1
SUMMARY OF PROVISIONAL FINDINGS AND RECOMMENDATIONS 8
1. INTRODUCTION 20
1.1. Initiation and Terms of Reference 20
1.2. Call for Submissions 21
1.3. Public hearings 21
1.4. Status of this report and way forward 21
1.5. Structure of this report 22
2. OVERVIEW OF THE PROVISION OF DATA SERVICES 23
2.1. Supply, access and use of data services 23
2.2. The value chain 25
2.3. Broad economic characteristics of telecommunications services 27
2.4. Policy, legislative and regulatory environment 29
2.5. Approach to the remainder of the report 30
3. INTERNATIONAL PRICE COMPARISONS AND THE LEVEL OF PRICES 32
3.1. Submissions regarding international price comparisons 33
3.2. Existing market research on international price comparisons 37
3.3. Preliminary Findings 67
4. THE STRUCTURE OF DATA PRICES AND ANTI-POOR PRICING 69
4.1. Submissions on pricing to low-volume consumers 69
4.2. Assessment 72
4.3. Preliminary Findings 81
5. COST DRIVERS – SPECTRUM AND FACILITIES ACCESS ISSUES 83
5.1. Spectrum 83
5.2. Facilities access and pricing 93
6. MOBILE COMPETITION 98
6.1. Submissions 98
6.2. Competition at a retail market level 100
6.3. Wholesale markets 123
6.4. Preliminary Findings 132
7. FIXED LINE SUPPLY GAP 135
7.1. Value chain and business models 136
7.2. Assessment and key findings 143
TABLE OF CONTENTS

2
8. PROVISIONAL RECOMMENDATIONS 146
8.1. Immediate actions on retail price structure and level 147
8.2. Addressing cost drivers: spectrum and facilities leasing 149
8.3. Enhancing competition: Wholesale mobile roaming and MVNOs 151
8.4. Development of alternative infrastructure for data services 153
9. APPENDIX A:
VALUE CHAIN AND IDENTIFICATION OF MARKETS 156
9.1. Value Chain 156
9.2. Identification of broad markets for the assessment 164
9.3. Identified markets relevant to the inquiry 172
10. APPENDIX B:
ECONOMICS OF TELECOMMUNICATIONS MARKETS AND INTERVENTION 173
10.1. Key features of telecommunications markets 173
10.2. Competition issues in telecommunications 180
10.3. Common remedies to address competition issues 184
11. APPENDIX C:
POLICY, LEGISLATIVE AND REGULATORY ENVIRONMENT 190
11.1. Policy, legislation and regulations 190
11.2. Key players in the sector 197
11.3. Regulatory issues 200
11.4. Policy, legislative and regulatory developments 202
12. APPENDIX D:
SUMMARY OF SUBMISSIONS AND KEY CONCERNS 211
12.1. Submissions received in response to the CfS 211
12.2. Submissions received for the public hearings 228
12.3. Other issues identified during the course of the Inquiry 243
13. APPENDIX E:
DETAILED DISCUSSION OF VODACOM AND MTN SUBMISSIONS ON
COMPARATIVE PRICE LEVELS 245
14. APPENDIX F:
SPECTRUM 263
14.1. What is spectrum and why is it important? 263
14.2. Approaches to spectrum assignment and considerations 266
14.3. Spectrum assignment in South Africa 277
15. APPENDIX G:
NATIONAL ROAMING 281
15.1. Operator views on national roaming 281

3
Table 1: Tarifica overall ranking of mobile prepaid plans (Q2 2017)
Table 2: Prices for 500MB, 1GB and 2GB data bundles within BRICS (USD) (2017)
Table 3: Prices for MTN pre-paid data bundles across countries (USD) (2017)
Table 4: Cheapest prepaid 1GB data prices in South Africa and five other large African markets (USD prices per GB)
Table 5: SA’s prepaid data prices compared to four developed players performed (26 September 2016)
Table 6: South Africa’s rank for ITU prepaid and post-paid data prices (USD, PPP) across three samples (2016)
Table 7: Tarifica overall ranking of mobile post-paid plans (Q2 2017)
Table 8: SA’s post-paid mobile prices compared to four developed players (2016)
Table 9: BRICS ranking from 80 countries’ residential broadband tariffs (Q2 2018)
Table 10: African country ranking from 80 countries’ residential broadband tariffs (Q2 2018)
Table 11: SA Broadband prices compared to four developed countries (2015)
Table 12: The extent to which the implied prices of smaller bundles (i.e. 5MB, 10MB, 50MB, & 100MB) in South Africa exceed the prices of larger bundles (i.e. 1GB & 2GB) (Dec 2018)
Table 13: Selected small bundle sizes with short validity periods versus 1GB valid for 30 days for Vodacom (Mar 2019)
Table 14: Selected small bundle sizes with short validity periods versus 1GB valid for 30 days for MTN (Mar 2019)
Table 15: Effective data rates for various bands of data usage on the MTN network (indexed) (Feb 2018-Jun 2018)
Table 16: Effective prices for various bands of data usage on the Vodacom network (indexed) (Jan 2016-Aug 2018)
Table 17: Share of OOB data in total traffic and in total revenue on the MTN and Vodacom network
Table 18: Operator subscriber numbers (2018)
Table 19: Number of mobile sites per operator (2017)
Table 20: Roaming charges comparison
Table 21: Effective roaming rate per MB in the Vodacom/Rain roaming agreement using June 2018 access fees
Table 22: Overall rate table for the roaming agreement between MTN and Cell C
Table 23: Variable roaming rate for the roaming agreement between Vodacom and Telkom
Table 24: Effective roaming rate per MB in the Vodacom/Rain roaming agreement using June 2018 access fees
Table 25: AlwaysOn Wi-Fi prices
Table 26: Estimated national fibre infrastructure market shares
Table 27: A list of markets identified by ICASA and vertical links between them
Table 28: Composition of the GSMA MCI
Table 29: BRICS countries GDP/capita (PPP $), growth rates, consumption per user
Table 30: Regression coefficients of ITU prices and prices/GDP per capita on log GDP per capita (2016)
Table 31: Spectrum Assignment to major MNOs in South Africa
LIST OF TABLES
42
43
47
52
56
59
60
61
65
66
67
73
75
75
77
78
78
104
118
127
127
129
129
129
141
161
166
249
254
259
279

4
Figure 1: Data contribution to operator service revenue (2015 – 2018)
Figure 2: Vodacom national coverage by technology layer (Jan 2015 - Dec 2018)
Figure 3: Telecommunications sector value chain
Figure 4: Mobile prepaid data prices in USD (PPP), 500MB (2016)
Figure 5: Mobile prepaid data prices for BRICS in USD (PPP), 500MB (2016)
Figure 6: Mobile prepaid data prices for African countries in USD (PPP), 500MB (2016)
Figure 7: SADC prices (USD) for 500MB prepaid data bundle (2017)
Figure 8: SADC prices (USD) for 1GB prepaid data bundle (2017)
Figure 9: SADC prices (USD) for 2GB prepaid data bundle (2017)
Figure 10: Vodacom 1GB retail tariffs across Africa (2017)
Figure 11: Vodacom 2GB retail tariffs (2017)
Figure 12: A4AI’s 1GB mobile prepaid prices in USD (PPP) for low and middle-income
countries (2016)
Figure 13: RAMP Index cheapest prepaid mobile 1GB data prices for 50 African countries in
USD (Q2 2018)
Figure 14: Cheapest prepaid mobile 1GB data prices for SADC countries in USD (Q2 2018)
Figure 15: Comparison of 1GB price for SA against 12 African countries (Q2 2014 to Q2 2018)
Figure 16: SA rank for 1GB price against 12 African countries (Q2 2014 to Q2 2018)
Figure 17: Comparison of 1GB price for SA against 41 African countries (Q3 2015 to Q2 2018)
Figure 18: SA rank for 1GB price against 41 African countries (Q3 2015 to Q2 2018)
Figure 19: Mobile post-paid data prices in USD (PPP), 1GB (2016)
Figure 20: Mobile post-paid data prices for BRICS in USD (PPP), 1GB (2016)
Figure 21: Mobile post-paid data prices for African countries in USD (PPP), 1GB (2016)
Figure 22: Fixed data prices in USD (PPP), minimum 1GB data cap per month (2016)
Figure 23: Fixed data prices for BRICS in USD (PPP), minimum 1GB data cap per month
(2016)
Figure 24: Fixed data prices for African countries in USD (PPP), minimum 1GB data cap per
month (2016)
Figure 25: The extent to which the implied price/GB of a 100MB bundle exceeds the price of
1GB bundle (Jan 2014 - Nov 2018)
Figure 26: The extent to which the implied price/GB of a 50MB bundle exceeds the price of
1GB bundle (Jan 2014 - Nov 2018)
Figure 27: The extent to which the implied price of 20-30MB bundles exceed the price of 1GB
bundle (Jan 2014 - Dec 2018)
Figure 28: Vodacom’s indexed usage per subscriber
Figure 29: MTN’s indexed usage per subscriber
LIST OF FIGURES
23
24
26
39
40
40
44
45
46
47
48
49
50
51
52
53
54
54
58
58
59
63
63
64
73
74
74
79
79

5
Figure 30: Telkom’s indexed usage per subscriber
Figure 31: Operator Service Revenue share (2018)
Figure 32: Operator Service Revenue share (2015 – 2018)
Figure 33: Operator Subscriber market share (2018)
Figure 34: Operators subscriber market share (2010 – 2018)
Figure 35: Operator Data Revenue share (2018)
Figure 36: Operator market shares, Data Revenue (2015 – 2018)
Figure 37: Operator market share, Prepaid Data Revenue (Q3 2016 - Q1 2018)
Figure 38: Operator data traffic market share (June 2016 – March 2018)
Figure 39: 20-30MB prepaid bundles valid 1 month (in Rands)
Figure 40: 100MB prepaid bundles valid 1 month (in Rands)
Figure 41: 1GB prepaid bundles valid 1 month (in Rands)
Figure 42: Cell C prepaid prices for different data bundle sizes
Figure 43: Post-paid contract with 1GB without device (in Rands)
Figure 44: Post-paid contract with 5GB without device (in Rands)
Figure 45: Prepaid revenue per GB
Figure 46: Prepaid revenue per GB (indexed)
Figure 47: Capital intensity of mobile operators (2001-2018)
Figure 48: Revenue and capital expenditure of mobile operators (2017)
Figure 49: ICASA’s cost model (cost per data megabyte in 2017)
Figure 50: Vodacom’s churn rates for contract customers
(year ended 31 March 2001- 31 March 2017)
Figure 51: IP Connect
Figure 52: Telecommunications sector value chain
Figure 53: An example of submarine cables connecting South Africa to the rest
of the world
Figure 54: Example of a national backhaul network
Figure 55: GSMA affordability indices - Entry (100MB), Medium (500MB), High (1GB)
baskets (2016-2017)
Figure 56: GDP per capita (PPP) 2017
Figure 57: Data affordability comparisons between South Africa and an international
sample of countries on the GSMA database (2017)
Figure 58: Data price comparisons between South Africa and an international sample of
countries on the ITU database, 2016
Figure 59: Comparison of the relationship between ITU 500MB basket prices and GDP
per capita when headline prices are used (left) and when prices are expressed
as a % of GDP per capita (2016)
Figure 60: Comparison of the relationship between ITU 1GB basket prices and GDP per
capita when headline prices are used (left) and when prices are expressed as a
% of GDP per capita (2016)
Figure 61: Various uses of radio frequency spectrum in general
Figure 62: Cell C’s coverage areas for roaming on Vodacom’s 3G network
Figure 63: Cell C’s coverage areas for roaming on Vodacom’s 2G Network
79
102
102
103
103
105
105
106
106
108
109
109
111
112
113
114
114
119
119
120
122
142
157
159
160
251
252
255
255
259
260
264
282
283

6
2G Second generation mobile systems (technology)3G Third generation mobile systems (technology)4G/LTE Fourth generation systems (technology)/Long term evolution4G/LTE Fourth generation/long term evolutionA4AI Alliance for Affordable Internet ADI Affordability Drivers Index ADSL Asymmetric digital subscriber lineANC African National Congress APN Access Point Network/NameASO Analogue Switch-OffATC American Tower CompanyAWS Advanced Wireless Services BEREC Body of European Regulators for Electronic Communications BRICS Acronym for the association of five major emerging economies: Brazil, Russia, India, China and South AfricaCCA Combinatorial Clock Auction CfS Call for SubmissionsCINX Cape Town Internet Exchange CPI Consumer Price Index (Indices) DFA Dark Fibre Africa DG MT The DG Murray Trust DINX Durban Internet Exchange DOC Department of Communications DSL Digital subscriber lineDTPS Department of Telecommunications and Postal ServicesDTT Digital Terrestrial TelevisionECA Electronic Communications Act, 2005 (Act No. 36 of 2005) ECN Electronic Communications NetworkECNS Electronic Communications Network ServicesEU European Union FCC Federal Communications CommissionFCFS First-come-first-served FTTB Fibre-To-The-BusinessFTTH Fibre-To-The-HomeFTTP Fibre-To-The-PremisesGB GigabytesGDP Gross Domestic ProductGHz GigahertzGNI Gross National Income GSM licence Global System for Mobile Communications licenseGSMA Global System for Mobile Communications Associations HDS High Demand Spectrum ICASA Independent Communications Authority of South AfricaICT White Paper National Integrated ICT Policy White Paper ICT Information Communications and TechnologyIMT International Mobile Telecommunications
LIST OF ABBREVIATIONS

7
IoT Internet of Things ISP Internet Services ProviderISPA Internet Services Providers Association ITA Invitation to Apply ITU International Telecommunication Union ITU International Telecommunications Union JINX Johannesburg Internet ExchangeKZN KwaZulu-Natal LLU Local Loop Unbundling MB MegabytesMCI Mobile Connectivity Index MER Market Exchange Rate MHz MegahertzMMA Media Monitoring Africa MNO Mobile Network OperatorMoA Memorandum of AgreementMoC the Ministry of Communications MoU Memorandum of understandingMTRs mobile termination rates MVNO Mobile Virtual Network OperatorNCC Rapid Deployment National Coordinating CentreNDP National Development Plan NERA National Economic Research Associates NLD National Long Distance networkNRFP National Radio Frequency Plan OECD The Organisation for Economic Co-operation and Development OOB Out-of-bundle OTTs Over-the-top services PBOs Public Benefit Organisations PPP Purchasing Power ParityPSTN Public Switched Telephone Network RAMP index RIA African Mobile Pricing RAMP IndexRAN Radio Access NetworkRIA Research ICT Africa SADC Southern African Development CommunitySAex South Atlantic Express Cable SAHRC South Africa Human Rights CommissionSMMEs Small, medium and micro-enterprises SMRA Simultaneous Multi-Round Auction SMS Short Message Service SOE(s) State-Owned Enterprise(s)SWN single wholesale network ToR Terms of referenceToR Terms of Reference TVWS Television White Spaces USA United States of America USAASA Universal Service and Access Agency of South Africa USAF Universal Service and Access FundUSAOs Universal Access and Service Obligations VMI Value for Money Index VoIP Voice over Internet ProtocolWLL Wireless Local Loop WOAN Wireless Open Access Network

8
1. The Data Services Market Inquiry was initiated by the Competition Commission in terms of Section 43B(2) of the Competition Act No. 89 of 1998 (as amended) in August 2017, in response to a request from the Minister of Economic Development. The initiation of the Inquiry followed persistent concerns expressed by the public about the high level of data prices and the importance of data affordability for the South African economy and consumers. The purpose of the Inquiry as set out in the terms of reference is to understand what factors or features of the market(s) and value chain may cause or lead to high prices for data services, and to make recommendations that would result in lower prices for data services.
2. Following the initiation, a formal Call for Submissions was published on 20 September 2017. Sixteen submissions were received, including the major operators and consumer rights organisations. The Commission’s Inquiry team also held public hearings in Pretoria from 17 to 19 October 2018 where oral and written submissions were received from 15 stakeholders. The Commission has also requested and received information on services and prices from major operators as well as information from other market players.
3. This report provides the provisional findings and recommendations of the Commission. At a number of points the report calls for further submissions. More broadly, the Commission invites stakeholders to make further submissions and provide comments on both the findings and the recommendations within this report by 14 June 2019. This deadline for submissions will
be strictly enforced in order to ensure the Inquiry can be finalised timeously. Submissions can be made electronically and sent to the following address: [email protected].
Benchmarking confirms SA prices are high
4. The terms of reference required that the Inquiry undertake an international benchmarking of South African data prices. Notwithstanding the challenges involved, international price comparison studies do have some probative value by providing a simple and effective cross-check on the general level of advertised prices in a market. Their use has become relatively standard internationally and the Inquiry was able to draw on an extensive volume of existing benchmarking exercises including that of the ITU, Tarifica, ICASA, and Research ICT Africa. Whilst effective prices, which incorporate free data offers but also data expiry, may differ to advertised prices, this is the case for all countries and not just South Africa.
5. The existing international comparisons on mobile prepaid data prices collectively indicates that South Africa currently performs poorly relative to other countries, with prices generally on the more expensive end.
5.1. The ITU data shows that South Africa ranks poorly when compared across a worldwide selection of countries and is considerably more expensive than the cheapest offers. The ITU also finds that South Africa also ranks poorly relative to other African countries as a group. This is illustrated in the global comparison as well as the African
SUMMARY OF PROVISIONAL FINDINGS AND RECOMMENDATIONS

9
5.2. Tarifica’s most recent benchmarking report highlights South Africa’s poor performance in the ‘data-only’ prepaid market. South Africa ranks 17th overall in the prepaid mobile plans out of the selected 25 countries, where the overall ranking is based on an average performance score across consumer profiles. For different consumer profiles, Tarifica’s benchmark study shows South Africa ranked 14th out of 25 countries for light data-only users, 20th for moderate data only users and 22nd place for heavy data-only users. Tarifica notes there is scope for improvement, suggesting also that these results are driven by the higher prices of large operators.
5.3. ICASA’s latest tariff report on price benchmarking highlights South Africa’s prices are expensive compared to other countries. This includes comparisons across BRICS and SADC countries. Disturbingly, ICASA shows that Vodacom and MTN prices in South Africa are considerably higher than the prices they charge in other countries in which they operate. This is illustrated for Vodacom in the 1GB category below and for MTN across a few bundle sizes in the table below.
Mobile prepaid data prices in USD (PPP), 500MB (2016)
Source: adapted from ITU ICT 2017 Prices report
Mobile prepaid data prices for African countries in USD (PPP), 500MB (2016)
Source: adapted from ITU ICT 2017 Prices report

10
5.4. The latest benchmarking data from Research ICT Africa also shows that South Africa performs unfavourably against other African countries, where its 1GB data price ranks among the more expensive countries in their RAMP index with the gap widening over time as prices fall faster in other countries.
Vodacom 1GB retail tariffs across Africa (2017)
Source: adapted from ICASA Bi-annual Tariff report 2017
Prices for MTN pre-paid data bundles across countries (USD) (2017)
Source: adapted from ICASA Bi-annual Tariff report 2017
Country 500MB 1GB 2GBSouth Africa 7.84 11.95 19.42
Botswana N/A 12.53 19.33
Ghana 2.22 4.43 7.10
Ivory Coast 1.69 3.37 6.33
Liberia N/A N/A 0.04
Nigeria N/A 3.15 5.04
Rwanda N/A 2.32 N/A
Uganda 5.56 8.34 N/A
Zambia 1.69 3.41 6.75
Afghanistan N/A 4.32 5.76
Benin N/A 7.17 10.76
Cyprus N/A 18.88 27.15
Iran N/A 0.14 0.23

11
6. Interestingly, South Africa performs better on the same international benchmarks for mobile postpaid data prices relative to the prepaid data prices, although South Africa is still considerably more expensive than the cheapest country from the global ITU sample. Benchmarking by Tarifica, #datamustfall and MyBroadband information also suggests that South Africa’s post-paid packages are better priced than its prepaid offers. This finding indicates a potential structural problem with retail prices in South Africa, whereby poorer, prepaid consumers are exploited with relatively higher prices than the wealthier post-paid consumers.
Anti-poor retail price structures lacking transparency
7. The disturbing finding from the benchmarking exercise that lower income consumers may be exploited to a far greater degree relative to
wealthier consumers for mobile data prices is confirmed by the Inquiry’s assessment of retail and effective price structures.
8. An assessment of headline retail prices of all mobile operators demonstrates that consumers of small data bundles, generally being poorer consumers, pay inexplicably more on a per MB/GB basis. For instance, relative to a 1GB data bundle, a consumer buying a 100MB data bundle will pay roughly twice the price on a per MB basis for the same data period validity. A consumer buying a 50MB bundle will pay up to three times more and a 20MB bundle up to four times more. In addition, the Inquiry also found that punitive out-of-bundle (OOB) rates are more frequently imposed on purchasers of small data bundles or indeed those that do not commit to a bundle at all. These are generally the lower income consumers.
SA rank for 1GB price against 41 African countries (Q3 2015 to Q2 2018)
Source: RIA RAMP Index and data submissions to the Commission, 2019
The extent to which the per MB prices of smaller bundles exceed the per MB prices of larger bundles (Dec 2018)
Source: Tarifica, operators’ catalogues, websites and online sources
% higher than 1GB % higher than 2GB20-30MB 50MB 100MB 20-30MB 50MB 100MB
Cell C 236% 115% 95% 302% 157% 133%
MTN 275% 213% 119% 362% 285% 169%
Telkom 193% 193% 193% 317% 317% 317%
Vodacom 168% 236% 95% 221% 302% 133%

12
9. Operators have sought to argue that smaller bundles on short validity periods compare more favourably. Whilst that may be the case, a 20MB bundle valid for a day is still about 66% more expensive than a one month 1GB bundle on the Vodacom network. However, the very short validity period also makes that smaller bundle more likely to expire, making the effective rate likely higher still.
10. Operators have also argued that this gap in the prices paid by lower income consumers narrows once one takes into account the effective rates paid, which include better priced short-validity bundles as well as free and promotional data. The Inquiry has tested this assertion based on a large sample of subscribers on each network and found that it is not the case. The sample shows that subscribers consuming between 100-500MB per month can pay more than twice per MB compared to consumers of 1-2GB per month. This is far worse for even poorer consumers, with those consuming between 50-100MB per month paying up to three times more and 20-50MB around four times more.
11. The Inquiry has also found that consumers of smaller data bundles tend to be far more exposed to out-of-bundle (OOB) rates, which also serves to increase effective rates payable by typically lower income consumers. OOB payments have been found to be up to half the data spend for small bundle subscribers relative to more negligible levels for large bundle subscribers. This makes intuitive sense as subscribers able to afford larger bundles of data may be less likely to run out of in-bundle data.
12. Trends in per subscriber usage levels across pre-paid and post-paid subscribers show the effect of the relatively higher prices for pre-paid. Whilst usage amongst post-paid subscribers is growing materially, usage for pre-paid subscribers is relatively flat by comparison. This suggests that pricing is limiting the ability of lower income subscribers to make greater use of data services, which in turn restricts the benefits of the digital economy to this class of consumer.
13. The lack of transparency over the effective rate that consumers are paying for data across networks to the consumers themselves is of a material concern for the Inquiry. This rate may be higher than the headline rate for some given out-of-bundle rates kicking in and data expiring before use, or lower than headline rates given free or promotional packages. The lack of price transparency inhibits price
competition as consumers are not aware of the effective rates paid which limits their ability to compare across networks. Consumers may mistake the occasional promotion or free data which goes unused as providing lower rates than may actually be the case. The additional concern is that occasional cheaper pricing to particular consumers or at points of time is not transmitted to other consumers and time periods through lower headline tariffs. Ultimately price competition is stronger where prices to more price sensitive consumers is transmitted to those that are less price sensitive. Therefore the touted shift to personalised pricing is of concern to the Inquiry.
14. The Inquiry is also concerned that this particular dynamic around pricing may be responsible for the anti-poor pricing structures that we observe in the market. Poorer consumers have far fewer opportunities to off-load from mobile data networks for their data service needs compared to wealthier consumers. Wealthier consumers are more likely to have a fixed broadband service at home, Wi-Fi at work and free public Wi-Fi at shopping centres or entertainment venues. It is quite likely that the lack of mobile off-load opportunities, combined with a lack of disposable income, are why the mobile operators are less inclined to drop prices to poorer consumers. This is because they have no real alternatives to turn to if pricing is not more competitive, and a drop in price will not result in a massive surge in data usage leaving the operator revenue-neutral.
A lack of spectrum and cost-based facilities access drives up costs
15. It seems to be common cause that the failure to release high demand spectrum due to delays in digital migration has left mobile operators with both insufficient spectrum and a lack of access to favourable low frequency bands, raising costs unnecessarily. This is because operators need to compensate for the lack of spectrum through increasing the volume of base stations, raising capital and operational costs. In a similar manner, different frequency bands have different propagation qualities which may impact on the extent of capital expenditure required to service demand in different areas. Low frequency bands are more favourable for less populated areas as fewer base stations are required to achieve coverage, but they are also better at providing indoor coverage even in dense urban areas. Digital migration should free up precisely these lower frequency bands.

13
16. Despite calls for the rapid release of high demand spectrum, this process has been subject to considerable delay and litigation. This delay was in large part due to the need to clarify policy positions in respect of the assignment of spectrum, including whether to support the introduction of a wholesale open access network (the WOAN) and whether existing operators would retain current spectrum and/or get access to unassigned high demand spectrum. However, after getting greater clarity as to the policy position there is a risk that the assignment process is once more delayed due to Departmental restructuring and the withdrawal of legislative changes to the Electronic Communications Act (ECA). The other threat to the process is that digital migration itself does not proceed rapidly and the spectrum is not available for use even upon assignment.
17. Whilst the release of spectrum will reduce operator costs, the Inquiry finds that this will not necessarily result in price decreases unless there is sufficient competitive pressure on mobile operators to do so. Furthermore, the actual assignment of spectrum, both in terms of volume and frequency bands, itself has an impact on the extent of competition in that market. For instance, the lack of assignment in low frequency bands such as that faced by Telkom Mobile currently is likely to result in a cost disadvantage, which may restrict how aggressive it can be on pricing. Spectrum assignment therefore cannot simply be undertaken on the basis of revenue maximisation, but must factor in how the assignment impacts on competitive forces if lower costs are to translate into lower prices. The assignment must therefore be pro-competitive in design.
18. Similar considerations arise in the context of the WOAN design. The purpose of the WOAN is to provide a wholesale network that may service a layer of new mobile virtual network operators (MVNOs) at the retail level in an effort to stimulate greater competition at this level. Originally, it was also designed to reduce infrastructure costs by promoting a single network layer, but that policy has subsequently been abandoned and rightly so. There are material competition concerns from creating a wholesale monopoly, from a pricing but also network quality & innovation perspective, and most of the cost-reduction gains can be achieved with better facilities access regulation. However, even in its current conceptualisation the WOAN needs to be designed in a manner that is likely to make it an effective competitor if the MVNOs that make use of it are to exert some competitive constraint and grow at
the retail level. This requires consideration of funding and business models, not just the technical assessment of spectrum assignment as undertaken by the CSIR. If the WOAN is to be operated by an existing vertically integrated operator, then the design considerations will need to include ensuring vertical separation and cost-orientated wholesale pricing.
19. Another large cost driver is that of passive infrastructure, such as base stations and high sites, but also ducts and poles for fibre backhaul. The Inquiry is of the view that efforts to enhance facilities access and sharing can substantially reduce operating costs and ensure the rapid deployment of competing infrastructure, to the potential benefit of lower prices eventually. Indeed, operators have already engaged in mutually beneficial passive infrastructure sharing arrangements amongst each other in order to reduce operating or capital costs. There is also a legislative basis within the ECA for regulating facilities access and ICASA has put in place such regulations.
20. However, despite this there remain persistent complaints around gaining access to facilities and doing so on fair commercial terms. In reality, commercial models are typically successful where there is mutual benefit from bringing similar infrastructure to the table or agreement as to a mutual investment programme. Where there is inequity in passive infrastructure holdings between operators, there is often a resistance to infrastructure sharing by the incumbent holder of more infrastructure facilities. This is because a denial of access, or strategies that amount to a constructive denial, provides an incumbent with a competitive advantage over a newer rival and such strategic behaviour may also slow the expansion and competitive significance of the new rival. Whilst some operators argue that this may undermine the incentive to invest in new facilities, in reality the leadership position in facilities and other infrastructure is often a result of simply being a first-mover and historic restrictions on entry. This applies both to operators such as Vodacom in mobile facilities, but equally to operators such as Telkom in fixed line facilities.
21. The critique of current regulations is that they fail to address strategic behaviour by incumbents with a hold over a high proportion of facilities, namely that the regulations do not apply to all facilities (e.g. ducts and poles), fail to adequately deal with spurious claims that sharing is technically infeasible (e.g. on base stations), and

14
also do not regulate the price at which sharing takes place resulting in cost escalation. The Amendment Bill in respect of the ECA seemed to plan on tackling this regulatory vacuum prior to its withdrawal from parliament. In particular, it sought to institute cost-orientated pricing for facilities under a broader wholesale open access regime, the regulatory rules to which ICASA would put in place within 18 months of the Amendment coming into law.
22. The Commission has some concerns as to the full extent of the direction that such amendments take, in particular in respect of potentially mandating active infrastructure sharing. Whilst there is generally consensus that passive infrastructure sharing reduces costs and is beneficial to competition, there is less consensus that active infrastructure sharing is necessarily desirable under all circumstances. In particular, active infrastructure sharing increases the risk of collusion given the closer collaboration and greater extent of information access that such arrangements require. In addition, active sharing may also inhibit beneficial infrastructure-led service competition if it means additions to quality or service innovations are immediately shared with rivals. The direction taken should be facility-specific, weighing up the incremental benefits of moving to active sharing as against any risks to competition. The Inquiry is also concerned as to the potential delays that may occur in moving forward on this front, as the withdrawal of the Amendment Bill coupled with a proposed lengthy 18 month process for ICASA to complete any regulations in the event the Bill is resurrected suggest that it will be years before adequate movement on addressing facilities access is achieved.
Price-based competition in mobile markets can be improved materially
23. With the exception of Vodacom and MTN, there was consensus from the submissions that price-based competition amongst mobile operators was inadequate, including the ability of the challenger networks of Cell C and Telkom Mobile to effectively constrain the two first-movers. Based on the evidence before the Inquiry, we find that there is considerable scope to improve price-based competition in the mobile data services market.
24. The retail mobile market has remained stubbornly concentrated despite the entry of two challenger networks over time. Vodacom has a share in mobile services more generally,
and data services specifically, that exceeds the thresholds used in the Competition Act for a conclusive determination of dominance. MTN has constantly skirted around the threshold level where there is a rebuttable presumption of dominance. These shares have barely changed over time.
25. The pricing analysis undertaken by the Inquiry concurs that these two operators are to a large extent able to price independently of the challenger networks.
25.1. On headline data prices, Cell C has historically been more aggressive and yet the two larger networks have found it profitable to not follow their pricing downwards. As a result, it seems that Cell C has recently determined that it cannot win sufficient share by lowering prices and has proceeded to raise them back upwards. More recently, it has been the turn of Telkom Mobile to be more aggressive on pricing, dropping headline rates well below its rivals. However, the larger networks, especially Vodacom, have not sought to respond with lower headline prices themselves.
25.2. Whilst the two largest operators claim to respond in other ways, such as short-validity bundles and selective free or promotional data, the evidence on overall revenue per GB shows that there is still a large gulf between what they are able to effectively charge inclusive of all these items and what the challenger networks effectively charge for prepaid data.
26. The resilience of the dominant positions lends credence to the submissions which suggest certain market features serve to perpetuate the first mover advantages of Vodacom and MTN, and that the failure to regulate these in the past has contributed to this dynamic. The market features which seem to play more of a role are the following:
26.1. The larger subscriber base and levels of profitability of the two largest networks provides them with a considerable advantage in rolling out new technologies and services relative to the challenger networks. This is because the large capital expenditure requirements to provide wide coverage of such services and ensure sufficient capacity to maintain high network quality levels can be funded out

15
of retained earnings whilst still providing ongoing shareholder returns. In contrast, the smaller and less profitable subscribers of the challenger networks means they are not able to fund capital expenditure to the same level, in part because they need to do so through shareholder equity or debt funding. The constant battles Cell C has had with its debt levels and equity refinancing over an extended period are reflective of precisely this challenge for the newer networks. Telkom Mobile has had the benefit of a parent company with other business lines, but it is still having to fund new infrastructure with debt. This places the smaller networks at a disadvantage in providing the same subscriber coverage and network quality.
26.2. This in turn weakens price-based competition as lower prices from challenger networks do not necessarily get a pronounced subscriber switching response due to network quality differences. This permits the larger networks to be less responsive on price and maintain higher levels of profitability, perpetuating the cycle of higher levels of infrastructure expenditure. It also softens price competition from the challenger networks as aggressive price declines may become financially unsustainable, especially considering the need to still fund investment in infrastructure. Where there is an insufficient subscriber response, lower prices provide less revenue from which to fund capital expenditure. Where lower prices do attract subscribers, the network capacity will be placed under pressure requiring more capital expenditure but also risking the loss of subscribers if network quality degrades. The outcome is that the challenger networks may have to resort to softer price competition in order to protect their financial viability.
26.3. The greater scale built through the first-mover advantage provides other benefits to the incumbents, namely a lower unit cost base than the challenger networks. This means that challenger networks are less able to impose a real pricing constraint on the larger networks.
26.4. The stickiness of more valuable contract customers, more favourable site locations and spectrum assignments are also factors that have played into the hands of first-
mover networks historically, albeit that their role or effect may have reduced over time.
27. The findings in the retail market also point towards potential problems in the wholesale markets. This is because later entrants (and retail service providers such as MVNOs) generally rely on the wholesale supply of infrastructure and other services from first-mover operators for the supply of their own services. Whilst this provides an opportunity to provide challenger networks with some of the benefits acquired by the larger networks, the reality is that it is rarely in the interests of the larger networks to provide access, or to do so on fair and reasonable terms. This was evident with call termination rates, but is also evident in other areas where there is no current effective regulation. Aside from facilities leasing discussed above, the other areas include the following:
27.1. Wholesale roaming arrangements are necessary for challenger networks to achieve national coverage whilst still rolling out their networks. The bargaining dynamics in respect of these arrangements clearly favours the first-mover networks as the only ones with national coverage, as there are not really many outside options for the challenger networks. Furthermore, as the challenger networks desperately require such roaming agreements to be able to offer a national service, the incumbents have less need to contract which places them in a strengthened bargaining position. The evidence on historical agreements is consistent with these inequitable bargaining positions, with high minimum payments required, high marginal rates, poor roaming quality through lack of seamless handover and denial of roaming for new data service lines. Newer agreements seem to offer some improvement and will be reviewed in the next phase. However, unless roaming rates are more cost-orientated it will constrain price competition as more aggressive pricing by challengers will not be profitable if traffic occurs on roaming partners.
28. A further area where wholesale markets have visibly failed is in providing wholesale network access for the purposes of retail competitors in the form of MVNOs. This is an area where the incumbent networks have not been active, and only one network – Cell C – has emerged as a supplier of such services. Whilst technically there may be more scope for wholesale competition

16
for such services as all four networks may be potential options rather than the two for national roaming, it is apparent that practically this has not been the case. Given the inability of three networks to offer wholesale MVNO deals, this has left the option of making use of a single provider for those firms looking to launch MVNOs. This is not the kind of market scenario which results in competitive pricing. As a result, MVNOs are simply not a material feature of the South African market and have remained niche operations designed to provide benefits to support retention of other customer bases.
Addressing the fixed line supply gap for alternative data services
29. The overwhelming focus of submissions made to the Inquiry focused on mobile data services, which is unsurprising given that mobile data coverage is effectively universal and it is the primary means through which most consumers get data services. The submissions on fixed line were sparse, and maybe because much of the focus was on reducing data prices to poorer consumers, where the lack of fixed line infrastructure in those communities meant many stakeholders deemed it less relevant. However, the Inquiry remains interested in the fixed line supply of data services and the potential role it can play in reducing data prices more generally and to poorer consumers more specifically.
30. One reason for this interest is that fixed line supply remains the backbone in the supply of not just household and business access, but also public data services such as public Wi-Fi or even community networks. These represent alternative sources of data service, and therefore have the potential to provide cheaper (or even free) data services at different geographic places and/or different points in the day to consumers. This is in part because that infrastructure is frequently cheaper for large data volumes given costs are largely fixed and sunk. Indeed, if business models such as Vumatel’s proposed R89 uncapped option for Alexandra can get off the ground then it would completely transform the data environment even for lower income households.
31. Cheaper prices are important in themselves, but also this infrastructure can be an alternative source of competitive pressure on mobile data services to bring those prices down. This is largely because fixed line services are typically provided through Wi-Fi at the point of use, and hence available for smartphones to connect to.
However, such competitive pressure is only likely to occur if these services are far more pervasive (to give more opportunity for off-load), and if they also have reach into poorer communities which currently have no options outside of mobile and which are being exploited as a result.
32. The Commission is of the view that one cannot focus exclusively on trying to fix mobile competition as a solution to high data prices. Insufficient competition amongst mobile operators has been a persistent concern for decades, proving difficult to change effectively through interventions and also dependent on competitor firm performance. The Inquiry therefore considers that efforts to extend the reach of alternative infrastructure such as fixed line or fixed wireless into poorer areas, even if only in the form of public Wi-Fi, remains an important solution to high data prices now and in the future.
33. However, the legacy of apartheid and the economic characteristics of fixed line infrastructure means that this market has, and will continue to, primarily service wealthy, historically white, urban areas absent some form of intervention. In this respect, the market is failing lower income and rural households which most need the benefit of lower data prices, and which require alternatives to mobile where there is a pricing structure that exploits this position.
33.1. The apartheid legacy meant that there existed a fixed line copper-based service through aerial poles or underground ducts in former whites only residential areas. This legacy infrastructure has enabled the more immediate provision of ADSL broadband services by Telkom Openserve to these residential areas at low incremental cost. In addition, the duct and pole infrastructure provides the basis of rapid and lower cost fibre rollout by Openserve into these same residential areas, making the deployment of FTTH in these areas far more likely. In contrast, the residential areas of historically disadvantaged South Africans generally lack this legacy infrastructure, making it far more costly to roll out such services in those areas. This includes not just the last mile, but also the metro fibre backhaul as apartheid spatial planning has resulted in lower income areas being spatially separate and far from business districts and wealthier suburbs. This in turn makes such investment far less likely and requiring investment from both backhaul and FTTH providers.

17
33.2. Aside from the cost of rollout, it is apparent that even for FTTH service providers that lack the legacy infrastructure of Openserve, the primary targets for FTTH roll out are the wealthy suburbs given that there is likely to be a better investment case in these areas. This is because for the largely fixed investment to make a return, the FTTH provider needs to be able to sign up sufficient households in an area. Wealthy areas have more households that a) have income levels sufficiently high to make FTTH affordable, b) are likely to already have data devices (tablets, smartphones, computers and smart TVs), and c) have the demand for high data usage applications which FTTH lends itself to services such as video streaming subscriptions. All things equal, the higher costs of providing infrastructure would still make the investment case less likely. In addition, lower incomes which makes fibre less affordable and more limited given the current demand for data hungry applications mean that fewer households will likely demand the service, reducing the investment case for rollout to these areas.
33.3. Even the rollout of public Wi-Fi has favoured the wealthy and has been insufficient in terms of coverage to give even those consumers numerous off-load opportunities. It would seem that public Wi-Fi outside of some metro government offerings has been limited largely to restaurants and shopping malls in wealthier areas. This is likely to be the case because there is more benefit to shops and restaurants providing such free services if it assists in attracting wealthier customers which have smart devices and may choose where to go based on the availability of a public Wi-Fi service. The lack of rollout by local government exacerbates the lack of public Wi-Fi access for lower income consumers as commuter and public service points outside of private businesses are unserved by public Wi-Fi.
34. Whilst there are some sporadic efforts at free public Wi-Fi through some metro governments and speculation on potential business models for township areas (located closer to business areas), it is self-evident to the Inquiry that this is far too limited and highly unlikely to result in market reach to the vast majority of low income and rural areas. The market is therefore unlikely to itself correct for this vast disparity in alternative infrastructure access for lower
income consumers relative to wealthier ones absent some form of intervention and action.
35. It would seem to the Inquiry that if this is to change, then there are broadly two aspects of the market which require intervention. These are addressing the cost of infrastructure rollout to these areas and identifying innovative business models to provide affordable packages to low income individuals at home or free services in public.
35.1. The cost of infrastructure rollout is large in general for fixed line services due to the costs of trenching and the sunk fixed costs incurred upfront. Any strategy to address the market failure and support the extension of such services into lower income and smaller rural towns will need to find a means to reduce these costs. Cost reduction is important for another reason, namely that it reduces the hurdle requirements on the demand side to support the investment decision to roll out into those areas.
35.2. As the infrastructure also lends itself to localised monopolies, and is currently dominated by Telkom Openserve, not just the underlying costs of such infrastructure need to be reduced, but also there needs to be sufficient market and countervailing constraints such that these positions are not exploited through high pricing.
35.3. The cost structure also affects pricing, which is often at a level that enables recovery of the fixed costs. For FTTH this presents challenges as the absolute minimum monthly pricing to make services affordable to lower income households may still be uneconomic to support the investment decision. Innovation is therefore going to be required to make such services available and for businesses to invest in rollout. For free public Wi-Fi the challenge is likely to be different. The potential demand from a broader customer base in a public area may be sufficient to support the monthly service fees. However, funding this from a government perspective is likely to be challenging at a time of tight budget constraints at all levels of government. This too is going to require some innovation in business models in order to draw in private funding and lower the cost of service to government.
18
PROVISIONAL RECOMMENDATIONS
36. The Commission has identified a provisional package of recommendations that provide immediate relief to high prices, especially for low income consumers, combined with initiatives to improve mobile price competition and greater alternatives to consumers over the medium term.
Immediate relief on data pricing
37. The programme for immediate relief on data pricing includes the following recommendations on the level and structure of pricing:
37.1. A commitment by mobile operators to reduce headline tariff levels to the current effective level of charges inclusive of occasional free data and promotions, which ensures lower average rates are available to all subscribers, all of the time. The greater price transparency also promotes price-based competition.
37.2. A commitment by mobile operators to then reduce the price of sub-1GB bundles to within an objectively justifiable and socially defensible range of the 1GB price, provisionally a maximum of 25% higher on a per MB basis. This will provide immediate relief to lower income consumers using smaller data packages. A similar commitment on maximum out-of-bundle rates relative to in-bundle rates is also required as lower income consumers have been found to be more exposed to these, raising their effective data costs.
37.3. A consistent industry-wide approach to the zero-rating of content from public benefit organisations and educational institutions to ensure broad application.
37.4. Absent such commitments, regulators should coordinate around a legislative or regulatory means to achieve such outcomes which may include amendments to the ECA, additions to ICASA’s End-User and Subscriber Service Charter Regulations, obligations or an investigation of excessive pricing to lower income consumers by the Commission.
38. This should then be followed by the urgent assignment of high demand spectrum and cost-orientated access to a broader range of facilities to reduce infrastructure costs, alongside
obligations to pass on cost savings to lower prices.
38.1. In the assignment of spectrum by ICASA, the objective should be to improve affordability and enhance competition. Any assignment should be contingent upon obligations to pass through cost reductions from greater spectrum access, alongside other obligations to improve affordable access. This may potentially include the provision of free public Wi-Fi in certain lower income areas or commuter routes, or the extension of fibre backbone infrastructure to such areas. Pro-competitive assignment may include spectrum caps on larger operators, asymmetric assignments and set asides for new entrants such as the WOAN, in a manner that ensures a prospect of commercial success.
38.2. The use of existing facilities leasing legislation and regulations to extend the list of essential facilities to include ducts and poles, but also to impose cost-orientated pricing requirements on such facilities. This should reduce costs, especially for challenger networks, and promote more rapid rollout of infrastructure to the benefit of greater price-based competition.
Intermediate programme to enhance price-based competition
39. An intermediate programme would look to find means to enhance price-based mobile competition and promote the development of alternative infrastructure to provide data services in lower income areas and smaller secondary cities and towns nationally.
40. In terms of enhancing price-based competition in the mobile industry, the Commission recommends more regulatory scrutiny and potentially action at the wholesale level of the industry in the event there are no voluntary commitments to improve the terms of wholesale access.
40.1. National roaming arrangements with the smaller networks need to move towards more cost-orientated pricing levels to support the ability of the smaller networks to be more aggressive on price without incurring losses on the roaming side, whilst using roaming as a means to expand capacity to still deliver a high quality data service to new subscribers.
19
40.2. The failure of operators to compete for MVNO arrangements also needs to be addressed, along with the level of wholesale pricing to resellers more generally. Whilst the WOAN has been proposed as one means to address this market failure, voluntary commitments to improve the terms of access amongst existing operators in the short-term, failing which regulatory action, is still most likely required as a more immediate solution whilst the WOAN gets established.
40.3. In both these cases, some form of functional and/or accounting separation may be required of the larger networks if there is to be greater transparency as to the costs of the radio access network (RAN) and core network relative to the retail services. Such separation may also provide more appropriate incentives to the network layer to engage in fairer access pricing to third parties relative to the operator’s own retail division. These are certainly some of the lessons from the Telkom settlement agreement with the Commission which is widely perceived to have had a transformative impact on wholesale infrastructure access in fixed line.
40.4. In addition, the history of failure to engage in necessary wholesale regulation, not just of mobile but also fixed line markets, which has resulted in entrenched concentration strongly suggests that reform to the legislative and/or regulatory framework is most likely required if the institutions are to deliver on this type of regulatory action going forward. It would seem that not only are the preconditions for regulatory action under section 67 of the Electronic Communications Act (ECA) unnecessarily onerous, but they may also serve to limit the degree of collaboration between regulators. For instance, there would seem to be no basis currently on which ICASA could regulate based on findings by the competition authorities, either in market inquiries or as a result of enforcement action. More effective means of inter-regulator collaboration would strengthen regulatory oversight, enforcement and regulation in these markets. The current process to amend the ECA presents an opportunity to bring about such changes.
41. The development of alternative infrastructure to provide data services in lower income areas and smaller secondary cities and towns nationally will provide off-load opportunities from the mobile networks to free public Wi-Fi or even simply lower priced subscription Wi-Fi services. It will also provide an additional point of competitive pressure on mobile prices if there is a more pervasive presence. Whilst this is naturally occurring in wealthier areas, there are barriers to investment in poorer areas.
41.1. The Commission recommends that local and national government, under the lead of the Department of Telecommunications and Postal Services (DTPS), actively support the development of free public Wi-Fi in low income areas, including commuter points (e.g. train stations, taxi ranks) and public spaces (e.g parks, shopping areas, government service offices). The initiative should look to crowd in private provision in order to reduce the cost and extend the reach of the programme. This will require innovation around business models, such as a limited free service in exchange for the ability to offer a premium subscription service or models based on advertising and/or data use.
41.2. Aside from free public Wi-Fi, government should look to use its own demand and facilities to reduce the costs of investment in both backhaul and last mile infrastructure into lower income areas, and improve the investment case with base customer demand. This would enhance the investment case for private providers to roll out infrastructure and/or use any base infrastructure to innovate around commercial models for business and residential supply in these areas. This initiative may begin with fast-tracking the intended rapid infrastructure deployment strategy which sought to facilitate greater ease in acquiring wayleaves and the use of municipal infrastructure such as poles for aerial deployment.
41.3. More generally, government should ensure that where it does make use of its procurement in these markets that this is done in a manner which supports a more competitive environment, be it through supporting smaller players / new entrants or facilitating open access on the infrastructure.

20
42. The Data Services Market Inquiry (“the Inquiry”) was initiated by the Competition Commission (“the Commission”) in terms of Section 43B(2) of the Competition Act No. 89 of 1998 (as amended) (“the Act”) in August 2017. The initiation of the Inquiry followed concerns expressed by the Minister of Economic Development (“the Minister”) about the high level of data prices and the importance of data affordability for the South African economy and consumers1. Having considered the request of the Minister, the Commission initiated the market inquiry as “it has reason to believe that there are features of the sector that prevent, distort or restrict competition within the sector, and/or to achieve the purposes of the Act.”2
43. A “market inquiry” is defined by the Act as “a formal inquiry in respect of the general state of competition in a market for particular goods or services, without necessarily referring to the conduct or activities of any particular names firm”3. Thus the Inquiry in this case considers the market for data services, but is not limited to any specific firm or conduct.
44. The overall objective of the Inquiry is to understand the cause of high data prices in South Africa and make recommendations to address pricing. Recommendations may include both recommendations for changes to legislation and regulatory changes.
1.1. Initiation and Terms of Reference
45. On 18 August 2017, the Commission initiated the Inquiry with the release of the Terms of Reference (“ToR”)4 for the Inquiry. The ToR defines the essential purpose of the Inquiry as follows: “In essence, the purpose of the inquiry is to understand what factors or features of the
1 Government Gazette No. 41054, 18 August 2017, para. 2.32 Government Gazette No. 41054, 18 August 2017, para. 2.33 Competition Act of South Africa, Section 43A.4 Government Gazette No. 41054, 18 August 2017 (available on: http://www.compcom.co.za/data-market-inquiry/)5 Government Gazette No. 41054, 18 August 2017, para. 3.1
market(s) and value chain may cause or lead to high prices for data services, and to make recommendations that would result in lower prices for data services.”5
46. Thus the purpose of the Inquiry is two-fold: firstly, to understand the reasons for high data prices and, secondly, to make appropriate recommendations to address those reasons such that prices are ultimately lowered. We discuss our approach to this challenge in greater detail in the following section.
47. The ToR also provides greater detail on the main objectives of the market inquiry: “… The main objectives of the market inquiry are to: Obtain a clear understanding of the data services value chain, including the interaction and commercial relationships between different levels of the value chain, and the relationship with other parts of the ICT sector and the broader economy. Assess the state of competition in the market at every stage of the value chain for provision of data services in order to identify areas of market power where customers or consumers may be exploited or excluded by firms and to identify any other structural, behavioural or regulatory factors that may influence competition or pricing. The assessment would include but not be limited to:
• Market structure;• The general adequacy and impact of the
current regulatory regime;• Strategic behaviour by large fixed and mobile
incumbents;• Costs faced and profits earned by fixed and
mobile network operators;• Current arrangements for sharing of network
infrastructure;
1. INTRODUCTION

21
• Investment in infrastructure by operators and access to, and allocation of, spectrum as they relate to data services price and competition concerns; and
• The adequacy of regulation to promote new South African entrants (particularly historically disadvantaged individuals), including but not limited to matters such as dynamic spectrum access and local loop unbundling. Benchmark South African data services pricing against those of other countries. Establish whether data supply quality and coverage is adequate by international standards and the country’s developmental needs.” (original paragraph numbering removed)
48. The outcome of the market inquiry will be to make recommendations on any matter covered in the ToR. As detailed in the ToR, recommendations could include both legislative and regulatory recommendations such as:
48.1. “Recommendations to government as to how the market could be made more competitive and inclusive and how data prices can be brought down in order to secure South Africa’s position as a low-data-cost economy.” 6
48.2. “Recommendations to the sector regulator on the competitive impact of the regulatory framework, and any need for amendments thereto.”7
1.2. Call for Submissions 49. The Inquiry commenced on 18 September 2017,
20 business days after the publishing of the ToR8. The formal Call for Submissions (CfS) was then published on 20 September 20179 to invite all stakeholders to make formal submissions to participate in the Inquiry. The CfS asked for submissions on all the themes raised by the ToR but also followed the ToR in providing guideline questions to assist stakeholders in making submissions. Themes included the level of pricing compared to other countries and the potential causes for high prices, the value chain
6 Government Gazette No. 41054, 18 August 2017, para. 3.4.17 Government Gazette No. 41054, 18 August 2017, para. 3.4.28 Government Gazette No. 41054, 18 August 2017, para. 4.69 Competition Commission Data Services Market Inquiry, Call for Submissions, 20 September 2017 (available on: http://www.compcom.co.za/data-market-inquiry/)10 See: http://www.compcom.co.za/data-market-inquiry/ 11 Competition Commission Data Services Market Inquiry, “Notice: Public Hearings for the Data Services Market Inquiry”, 13 September 2018 (available on: http://www.compcom.co.za/data-market-inquiry/
for data services, the state of competition in data services and the prevalence of any prohibited conduct, telecommunications sector regulation and spectrum, and data supply quality and coverage.
50. In total, 16 submissions were received in response to the CfS during the course of November 2017, including submissions from the major operators and consumer rights organisations. These are discussed in greater detail in Appendix D below, and non-confidential versions of public submissions are available on the Commission’s website.10
1.3. Public hearings
51. As part of the evidence gathering process the Commission’s Inquiry team also held public hearings in Pretoria from 17 to 19 October 2018. The hearings invited written and oral submissions focusing on the following four key questions:
51.1. “Are data prices in South Africa (whether mobile, fixed or other) higher than they ought to be?
51.2. To the extent that data prices in South Africa are higher than they ought to be, what are the factors that drive these outcomes?
51.3. How can these factors be effectively remedied?
51.4. What is the impact of data prices and access to data more broadly on lower-income customers, rural customers, small businesses and the unemployed? How important are affordable data prices for these customers?”11
52. Submissions were received from 15 stakeholders.
1.4. Status of this report and way forward
53. This is a provisional report, and as such findings are not final, but rather represent the provisional views of the Inquiry and are thus subject to change. At a number of points, this report calls for further submissions on specific aspects. More broadly, the Inquiry also invites

22
stakeholders to make further submissions and provide comments on both the findings and the recommendations within this report by 14 June 2019. This deadline for submissions will be strictly enforced in order to ensure the Inquiry can be finalised timeously. Submissions can be made electronically and sent to the following address: [email protected].
54. Following the publishing of this report and the receipt of submissions and comments on the report, the Inquiry will engage in further engagements with key stakeholders. While the Commission is required to publish a final report before 31 December 2018, the amended date of completion for the Inquiry12, the Commission wishes to finalise the Inquiry earlier than this. Timelines adopted by the Inquiry will be communicated by the Commission.
1.5. Structure of this report
55. The Report is structured as follows.
55.1. The first section provides a brief background to the provision of data services in South Africa, including the current state of access, the value chain and regulatory context.
55.2. The second and third sections examine the level and structure of data pricing in South Africa. In benchmarking prices in relation to other countries, it finds that mobile prepaid data prices in particular are high. Furthermore, in terms of the structure of prices, prices are found to be anti-poor insofar as low-volume users inexplicably pay multiple times what high-volume users do on a ‘per megabyte’ or ‘per gigabyte’ basis.
55.3. The fourth section examines the causal role of particular cost drivers in the value chain on prices. It finds that spectrum constraints result in higher mobile data costs and the assignment of spectrum will reduce costs, and potentially mobile data prices, if done in a pro-competitive manner. It also finds that the lack of systematic cost-orientated access to infrastructural facilities, due to strategic behaviour of operators and regulatory failure, unnecessarily raises costs overall and for later entrants in particular.
12 Economic Development Department, Competition Commission, Government Gazette, No. 42337, p. 24
55.4. The fifth section examines the state of competition in mobile data markets specifically. It finds that the markets are concentrated and continue to be dominated by the first movers, Vodacom and MTN. Whilst the later entrants have made some inroads, they still face challenges in competing effectively with the incumbents. This means that competition is not as effective as it should be, impacting negatively on data prices. This is evident from the price analysis which indicates Vodacom in particular, but often also MTN, is not that responsive to price reductions by challenger networks, and also achieves a much higher revenue per GB once free and promotional data offers are considered. Wholesale markets with unequal bargaining relationships have historically contributed to the entrenchment of concentration levels.
55.5. The sixth section examines fixed line and associated infrastructure at the retail level. Whilst the submissions were limited on this issue, we have identified the development of alternative infrastructure markets as important in providing consumers the opportunity to offload onto cheaper network alternatives (such as free public Wi-Fi) which may also bring additional pressure on mobile pricing. The section explores the current business models in the value chain and the impediments to private investment in rolling out in lower income areas and secondary cities and towns.
55.6. Lastly, we provide our provisional conclusions and recommendations.

23
56. Data refers to the transmission of information in a digital format where volumes are measured in units such as Gigabytes (GB) and Megabytes (MB). Data allows consumers to access content on the internet, use Over-the-Top services, communicate via email, and stream or download videos and other content amongst other activities. Data services refers to the provision of such data to consumers whether business or residential, on fixed lines such as fibre or asymmetric digital subscriber line (ADSL)13 or via mobile technology.
57. Data is becoming a more important part of the telecommunications industry and mobile telecommunications in particular. This is reflected in the following figure which shows the percentage of mobile service revenue (voice, short message services (SMS) and data together) that is accounted for by data as per Mobile Network Operators’ (MNOs’)14 financial
13 Asymmetric Digital Subscriber Line – a technology used to access the internet over copper wire local loops.14 Also referred to as operators or mobile operators.
statements and results. It shows that the proportion of revenue accounted for by data has generally been increasing and in some cases data accounts for the majority of service revenue.
2.1. Supply, access and use of data services
58. Since their launch in the early 1990s, mobile networks have grown to become the main vehicle for internet access in the country. Mobile coverage in South Africa is almost universal.
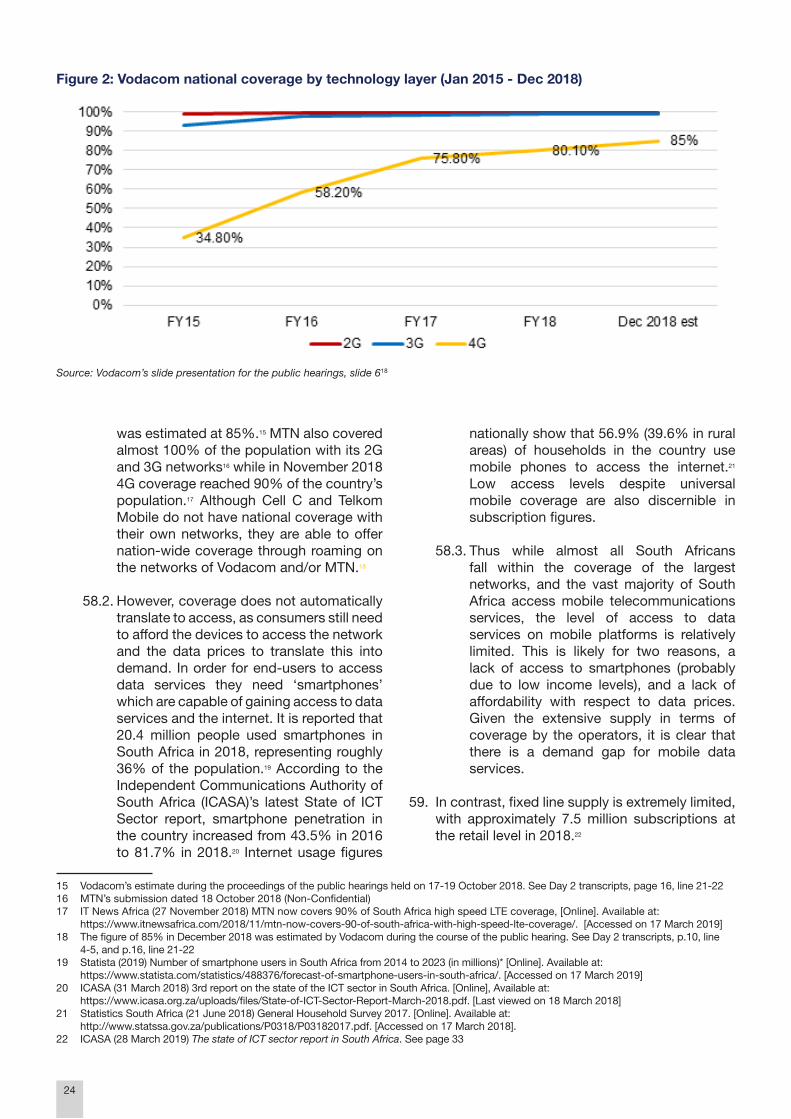
58.1. Technically, almost everyone in South Africa is able to access mobile communication services. As illustrated in Figure 2 below, almost 100% of the population fell within Vodacom’s second generation (2G) and third generation (3G) networks (systems) as at the end of 2018. Coverage of the fourth generation networks (4G), also known as the Long Term Evolution (LTE)
2. OVERVIEW OF THE PROVISION OF DATA SERVICES
Figure 1: Data contribution to operator service revenue (2015 – 2018)
Source: Operators’ Annual Financial Statements, Integrated Reports, Financial statements and Results presentations.Notes: Results as per financial year, except Cell C (as at end of December for each respective year).
24
Figure 2: Vodacom national coverage by technology layer (Jan 2015 - Dec 2018)
Source: Vodacom’s slide presentation for the public hearings, slide 618
was estimated at 85%.15 MTN also covered almost 100% of the population with its 2G and 3G networks16 while in November 2018 4G coverage reached 90% of the country’s population.17 Although Cell C and Telkom Mobile do not have national coverage with their own networks, they are able to offer nation-wide coverage through roaming on the networks of Vodacom and/or MTN.18
58.2. However, coverage does not automatically translate to access, as consumers still need to afford the devices to access the network and the data prices to translate this into demand. In order for end-users to access data services they need ‘smartphones’ which are capable of gaining access to data services and the internet. It is reported that 20.4 million people used smartphones in South Africa in 2018, representing roughly 36% of the population.19 According to the Independent Communications Authority of South Africa (ICASA)’s latest State of ICT Sector report, smartphone penetration in the country increased from 43.5% in 2016 to 81.7% in 2018.20 Internet usage figures
15 Vodacom’s estimate during the proceedings of the public hearings held on 17-19 October 2018. See Day 2 transcripts, page 16, line 21-2216 MTN’s submission dated 18 October 2018 (Non-Confidential)17 IT News Africa (27 November 2018) MTN now covers 90% of South Africa high speed LTE coverage, [Online]. Available at: https://www.itnewsafrica.com/2018/11/mtn-now-covers-90-of-south-africa-with-high-speed-lte-coverage/. [Accessed on 17 March 2019]18 The figure of 85% in December 2018 was estimated by Vodacom during the course of the public hearing. See Day 2 transcripts, p.10, line 4-5, and p.16, line 21-2219 Statista (2019) Number of smartphone users in South Africa from 2014 to 2023 (in millions)* [Online]. Available at: https://www.statista.com/statistics/488376/forecast-of-smartphone-users-in-south-africa/. [Accessed on 17 March 2019] 20 ICASA (31 March 2018) 3rd report on the state of the ICT sector in South Africa. [Online], Available at: https://www.icasa.org.za/uploads/files/State-of-ICT-Sector-Report-March-2018.pdf. [Last viewed on 18 March 2018]21 Statistics South Africa (21 June 2018) General Household Survey 2017. [Online]. Available at: http://www.statssa.gov.za/publications/P0318/P03182017.pdf. [Accessed on 17 March 2018].22 ICASA (28 March 2019) The state of ICT sector report in South Africa. See page 33
nationally show that 56.9% (39.6% in rural areas) of households in the country use mobile phones to access the internet.21 Low access levels despite universal mobile coverage are also discernible in subscription figures.
58.3. Thus while almost all South Africans fall within the coverage of the largest networks, and the vast majority of South Africa access mobile telecommunications services, the level of access to data services on mobile platforms is relatively limited. This is likely for two reasons, a lack of access to smartphones (probably due to low income levels), and a lack of affordability with respect to data prices. Given the extensive supply in terms of coverage by the operators, it is clear that there is a demand gap for mobile data services.
59. In contrast, fixed line supply is extremely limited, with approximately 7.5 million subscriptions at the retail level in 2018.22

25
59.1. Total fixed broadband subscriptions spiked from just over 3 million in 2017 to over 7.5 million in 2018. This increase was driven by the jump in ADSL and fibre-to-the-premises (FTTP). According to the 2017 General Household Survey, only 10.6% of South African households had access to the Internet at home. At a provincial level, Western Cape (25.7%) and Gauteng (16.5%) had the highest percentage of households who have access to the internet at home. For the two predominately rural provinces, Limpopo and Eastern Cape, access to the internet at home was 2.2% and 3.5% respectively. The spike in the number of subscriptions, mainly driven by fibre deployments in more affluent urban areas, means that fixed line access has increased.
59.2. Fibre has been quick to challenge ADSL as the major means of fixed line access but despite the accelerated growth in fibre rollout, penetration remains low. Fibre grew from 3% of total fixed-line subscriptions in 2015 to 9% in 2017.23 This grew to more than 20% in 2018.24 It is understood that the increased penetration of fixed infrastructure is skewed towards urban areas.25 26
59.3. Other forms of fixed internet connection available to end-users include free Wi-Fi at public hotspots and public facilities such as schools and libraries. People who are employed may also get access to broadband Internet and Wi-Fi at their workplace. Internet cafes are also another platform for internet access for people who are willing to and able to purchase these services. Some restaurants also provide free-public Wi-Fi to their patrons. Fixed line access through these platforms remains extremely limited and skewed towards wealthier urban areas.27
2.2. The value chain
60. Figure 3 below depicts the structure of the South African telecommunications industry in the form of a value chain. As shown in the figure, there are three broad layers in the telecommunications
23 ICASA’s (26 March 2018). The state of ICT sector in South Africa. See graph 2124 ICASA (28 March 2019) The state of ICT sector report in South Africa. See page 3325 DTPS’s presentation at the public hearings held on 17-19 October 2018. See Day 3 transcripts, p.81; line 3-426 Internet Solutions’ presentation at the public hearings held on 17-19 October 2018. See day 3 transcripts, p.31; line 16-1827 Statistics South Africa (21 June 2018) General Household Survey 2017. [Online]. Available at: http://www.statssa.gov.za/publications/ P0318/P03182017.pdf. [Accessed on 17 March 2018]28 Sharing of active elements of the RAN is not permitted by the current regulatory framework in South Africa. See ICASA’s findings document, p.19
value chain and therefore also the provision of retail data services, namely the infrastructure layer, the wholesale layer and the retail layer.
60.1. Infrastructure layer. The upstream layer comprises the network infrastructure owned by network operators. The networks of various operators are interconnected, allowing users of one network to access content from, or to communicate with, users of other networks. The infrastructure starts with international fibre infrastructure, wherein submarine fibre cables connect different countries and continents. These cables land at landing stations located in coastal areas. These are then connected to national fibre infrastructure which connects major population centres such as cities and towns. Metropolitan fibre networks then provide connection between local sites within major population areas. The ultimate connection between users and the network infrastructure, known as local or last mile connectivity, may either be by fixed or wireless means. Communication services, namely voice, SMS and data run in the network infrastructure.
60.2. Wholesale layer. The middle layer comprises the wholesale of network services. This refers to network access granted to service providers who do not own any network infrastructure or have limited network infrastructure. Mobile operators in South Africa are vertically integrated and do not typically separate their wholesale and retail services. However, operators such as Cell C and Telkom Mobile, who have limited geographical coverage, acquire roaming services from larger operators such as Vodacom and MTN at wholesale terms. Other ways in which mobile wholesale services are provide include Mobile Virtual Network (MVNO) access, reverse billed APN (Access Point Network) and potentially radio access network (RAN) sharing.28 Fixed line operators provide internet services providers (ISPs) with access to the fixed networks to enable them to sell communication services to end-users by means of copper, ADSL, or fibre.

26
60.3. Retail layer. The downstream (retail) layer deals with the retail of communication services to consumers or businesses. The mobile operators are vertically integrated and they sell communications services directly to end-users. MVNOs, through the
networks of their hosts, also sell mobile communication services to end-users. Fixed line services are provided to end-users (both enterprise and residential customers) through copper and fibre.
Figure 3: Telecommunications sector value chain
Source: Own construction partially based on submissions from Telkom, MTN, Vodacom, and the Electronic Communications Network (ECN)
61. In conducting a market inquiry, the Commission has no requirement to engage in a formal market definition assessment such as that required in order to assess a firm’s dominance under Section 7 of the Act. In identifying markets, the Commission recognises that the ICASA recently engaged in an extensive Priority Markets Inquiry in which it sought to determine the broad markets within the value chain and engaged operators extensively for input in this regard.29 The Commission has no reason to differ with ICASA’s conclusions, especially as few differences existed between ICASA and operators in any
29 ICASA Priority Markets Discussion Document, p.ii, paragraph 2
event. We reflect below the broad markets within the value chain relevant to the provision of both mobile and fixed data services.
61.1. In terms of mobile data the following markets play a role in the ultimate retail pricing observed:61.1.1. Retail market R1 – Retail supply of
mobile services,61.1.2. Wholesale market W1 – Wholesale
supply of mobile termination services,
61.1.3. New wholesale market W3 –

27
Wholesale supply of mobile services, which includes MVNO access, national roaming, passive RAN sharing and active RAN sharing,
61.1.4. Upstream market U2 – National Transmission services,
61.1.5. Upstream market U3 – Metropolitan connectivity,
61.1.6. Upstream market U4 – Fixed access services.
61.2. In terms of fixed data the following markets play a role in the ultimate retail pricing observed:
61.2.1. Retail market R3 – Retail supply of access to the internet from fixed connections,
61.2.2. Wholesale market W6 – Wholesale supply of asymmetric broadband origination,
61.2.3. Wholesale market W7 – Wholesale supply of internet connectivity,
61.2.4. Upstream market U2 – National Transmission services,
61.2.5. Upstream market U3 – Metropolitan connectivity, and
61.2.6. Upstream market U4 – Fixed access services.
62. Appendix A provides a detailed description of the telecommunications services value chain and the identification of markets by ICASA. To the extent that any differences in views between ICASA and other stakeholders are relevant, or to the extent that we identify or assess narrower markets within the broader definitions of ICASA, we address these aspects at the relevant point of the assessment in this report.
2.3. Broad economic characteristics of telecommunications services
63. The telecommunications market has become a major facilitator of economic growth and participation, where countries strive for competitive outcomes in the market so as to maximise the potential for lower prices, expanded
30 CCRED (2016) Competition, barriers to entry and inclusive growth: Telecommunications Sector Study. Working paper 2/2016 pg. 131 However, state ownership of the fixed line incumbent limits the independence of markets regulation, see Waverman, L., & Koutrompis, P. (2011) Benchmarking Telecommunications Regulation, Telecommunications, Policy, 3532 Jamison, M. (2012) Methods for Increasing Competition in Telecommunications Markets. Public Utility Research Center, University of Florida.33 Jamison, M. (2012) Methods for Increasing Competition in Telecommunications Markets. Public Utility Research Center, University of Florida; Mondliwa,P (2016) Barriers to entry in telecoms. CCRED Policy Brief.
34 Jamison, M. (2012) Methods for Increasing Competition in Telecommunications Markets. Public Utility Research Center, University of Florida., p.30
services and increased innovation.30 This section serves to provide a broad overview of the economic characteristics in telecommunications markets as well as the main competition issues that typically arise in these markets as a result of its characteristics.
64. Historically, telecommunications markets were treated as natural monopolies in which the state-owned enterprises (“SOEs”) were regulated as public utilities and received state support through regulation which enabled their monopoly status.31 It is generally advantageous to have an early presence in a market, setting oneself up as an incumbent with an established customer base. A first mover advantage could thereby also impose switching costs on consumers or alternate suppliers as they would incur costs related to number porting and fixed contract terms. The majority of economic studies find empirical support for the existence of first mover advantages which enable pioneering firms to set prices above competitive levels and thus gain excessive profits.
65. There exists both economies of scope and scale in telecommunications markets as the high fixed costs can be split across different products and increased volumes of any given product. High barriers to entry and expansion are observed due to a number of market factors including high (and sunk) fixed costs, regulation, strategic behaviour by incumbents, and sticky switching behaviour32 which can prevent a market from achieving competitive outcomes.33 Economies of scale increase barriers to entry and expansion as potential entrants or smaller competitors need to attract sufficient scale in order to reduce average unit costs and be competitive with the incumbent operator.
66. Telecommunications markets have traditionally been dominated by firms that are vertically integrated, where these firms are involved in more than one stage of value chain (e.g. the upstream and the downstream), further limiting the scope for competition and entry.34 At the various levels of the value chain, there also exist important operational interdependencies

28
between firms and competitors. The provision of an operator’s voice service, for example, is reliant on other operators’ services such as roaming and access to infrastructure. Network effects are also characteristic of telecommunications markets where “the value of a service to an individual customer depends on the number of other customers who use the service”.35
67. Highly differentiated product offerings are typically found in telecommunications markets as service providers compete for market share by providing differentiated products in the form of varying network capabilities, handsets and various service bundles36 that satisfy a variety of consumer needs. Telecommunications markets are also dynamic as they are constantly changing, particularly in terms of innovation and technology.
68. As a result of the aforementioned features of telecommunications, there are common competition issues which arise in these markets, namely barriers to entry and expansion, market concentration and market conduct concerns.
68.1. In terms of barriers to entry, there are absolute barriers that legally deny market entry and often relate to regulations in the market such as licencing. Structural barriers arise from market conditions that entail high and sunk costs, network effects and an incumbent’s control of the means of production e.g. a scarce resource37. Barriers to entry also result from economies of scale and strategic advantages, which occur due to an incumbent’s first mover advantage over potential entrants and small rivals.38 For instance, a first mover is most likely able to secure access to the best mobile sites.
35 Jamison, M. (2012) Methods for Increasing Competition in Telecommunications Markets. Public Utility Research Center, University of Florida.p.1036 New Zealand Commerce Commission (2016) Competition in the fixed and mobile telecommunications markets, p.337 ICN (2006) ICN Merger Guidelines Workbook- Prepared for the Fifth Annual ICN Conference. p.55.38 ICN (2006) ICN Merger Guidelines Workbook- Prepared for the Fifth Annual ICN Conference. p.56.39 New Zealand Commerce Commission, (2006) “A Review of Cellular Mobile Market Entry Issues”, 10 October 2006. p.15; ACCC (2018, p.5); Lee and Lee (2006); Kovecevic et al., (2016)40 Kovacevic, D., Krajnovic, A., & Sain. (2016) “Market Analysis of the Telecommunications Market – The Case of Croatia”. Information Technology, p.161 – 175.41 Muck, J & Heimeshoff, U (2012) First-mover Advantages in Mobile Telecommunications: Evidence from OECD countries. Discussion Paper No71: 1-41.42 The ICN (2006) notes that market shares among market participants that varies considerably over a relatively short time period might be suggestive of a competitive situation where no firm has market power; conversely, the persistence of a more rigid pattern over a period of time may be indicative of a situation of market power, p.3443 The Competition Act, no.89 of 1998 defines the “market power” as “the power of a firm to control prices, or to exclude competition or to behave an appreciable extent independently of its competitors, customers or suppliers” 44 Section 7 of the Competition Act, no.89 of 1998 notes that a firm with market power is dominant.45 Jamison, M. (2012) Methods for Increasing Competition in Telecommunications Markets. Public Utility Research Center, University of Florida, p. 36-4746 CPB Netherlands Bureau for Economic Policy Analysis (2005) Do market failures hamper the perspectives of broadband? No 102, p. 40
68.2. Telecommunications markets are often highly concentrated,39 which typically tends to oligopolistic competition, particularly in the upstream markets.40 In most instances, telecommunication markets display market shares that are asymmetrically distributed in favour of incumbents due to their first mover advantage.41 High and unchanging market share rankings in telecoms often signal that these markets are characterised by firms having a degree of market power.42
68.3. Competition issues arise around market conduct when firms use their market power43 to distort competition in their favour, generally taking the form of an “abuse of market power” or an “abuse of dominance”44. Given the features of telecommunications markets, market conduct that is potentially exclusionary and anti-competitive includes outright refusals to deal such as denying access to infrastructure and roaming services; constructive refusals to deal such as providing access to infrastructure on unfair and discriminatory terms; predatory pricing, cross-subsidization or margin squeeze; coordination; and excessive pricing.45
69. Due to the characteristics of telecommunications services and the related competition issues, there are often market failures in these markets, particularly due to the existence of market power, which results in sub-optimal market outcomes.46 As a result of the potential for market failure and the importance of telecommunications to consumers and businesses, it has been considered by governments as an important area for regulation in order to ensure that the principle of fair competition is upheld in the public interest. The prevalence of market failures and the need for regulation also appears to

29
be a concern in South Africa given the policy, legislative and regulatory environment for the sector. We consider this in the following section. Further detail on the economic characteristics of the telecommunications sector is also provided in Appendix B of this report.
2.4. Policy, legislative and regulatory environment
70. Given that the telecommunications sector is commonly regulated – and South Africa is no exception - an important element for the Inquiry to consider is the policy, legislative and regulatory environment in which the telecommunications sector operates. The South African Government has implemented various policies and development plans in which it emphasises key policy objectives and goals for the Information and Communication and Technology (ICT) sector. In order to achieve the country’s socio-development goals, core ICT policies are adopted with the aim to support the Government’s vision of “robust, reliable, affordable and secure ICT services”.47 The sector’s key policy objectives focus mainly on the provision of high-speed and affordable broadband access via the efficient use of underlying infrastructure, which will contribute to economic growth.48
71. The National Development Plan (NDP), as a long term development plan for South Africa, focuses both on affordability and access goals with respect to broadband services. National access to broadband services at competitive prices is emphasised throughout the NDP and its stated goal by 2030 is to “…make high-speed broadband internet universally available at competitive prices” (our emphasis).”49 To take forward the spirit of the NDP, South Africa adopted a national broadband policy in 2010 called SA Connect. Broadly, the policy’s main objective is to achieve nationally available and affordable broadband for all the country’s users.50 SA Connect highlights the context of high communication costs in South Africa and includes targets for broadband affordability such as every South African having access to broadband services at 2.5% or less of the average monthly income.51
47 DTPS.gov.za (2018) Constitutional Mandates, [Online] Available at: https://www.dtps.gov.za/index.php?option=com_content&view=article&id=12&Itemid=165 [Accessed 18 June 2018]48 ICASA (16 February 2018) Discussion document. Appendix 2: Government Policy Objectives. Government Gazette No. 4144649 National Planning Commission (2011) National Development Plan 2013: Our Future- make it work’. Pretoria, p. 3450 DOC (20 November 2013) SA Connect: creating opportunities, ensuring inclusion- SA Broadband policy, p. 351 DOC (20 November 2013) SA Connect: creating opportunities, ensuring inclusion- SA Broadband policy, p.1252 This refers to the lowest of the three layers in the value chain described above i.e. the retail layer53 DTPS (3 October 2016) National Integrated ICT Policy White Paper. Pretoria54 DTPS (3 October 2016) National Integrated ICT Policy White Paper. Pretoria55 The Electronic Communications Act 36 of 2005. Government Gazette No. 28743. 18 April 2006
72. As a central policy framework for the economy’s transformation into an inclusive digital society, the National Integrated ICT Policy White Paper (“ICT White Paper”) largely focuses on improving infrastructure access and the avoidance of infrastructure duplication, improving competition (particularly in the ‘services market’52), and the inclusion of all South Africans in the digital economy.53 The ICT White Paper was published in October 2016 and has been approved by Cabinet. It outlines sector policies required to achieve its policy goals, the primary one being the creation of a national wholesale open access network (WOAN) using all high-demand spectrum. Further initiatives within the ICT White Paper include the creation of an open access environment that provides access to essential facilities, infrastructure sharing and rapid infrastructure deployment.54
73. In terms of the sector’s current legislation, the Electronic Communications Act 36 of 2005 (“the ECA”) is the primary legislation governing the electronic communications sector in South Africa. The primary object of the Act is “to provide for the regulation of electronic communications in the Republic in the public interest”.55 The ECA and the Electronic Communications Amendment Act 1 of 2014 cover the main areas of licensing, access, infrastructure rights, spectrum frequency management and assignment, markets and competition. The Act, as amended, served to refine licensing issues, to make further provision towards ensuring effective competition and to remove regulatory bottlenecks in the sector. The Act establishes the mandate for ICASA, as the industry regulator, to regulate sectoral licensing and it contains separate chapters for electronic communications networks, for the laying of fixed-line network infrastructure and for radio frequency spectrum where ICASA’s assignment and management responsibilities are outlined.
74. Changes in the sector are being driven by a progressive policy environment, as well as imminent legislative and regulatory interventions which are likely to have significant implications for the sector. The current legislative initiative from the Department of Telecommunications and Postal Services (“DTPS”) is to amend the ECA

30
in line with the ICT White Paper. The latest draft of the Electronic Communications Amendment Bill (“Amendment Bill”), published on 31 August 201856 and tabled in Parliament on 19 September 2018, thus represents a translation of the White paper provisions into legislation. Although the Amendment Bill was recently withdrawn from Parliament (detailed further in Appendix 11.7), a revised form of the Amendment Bill is expected to return to Parliament in the coming months. The Amendment Bill was a substantial, sector-altering piece of legislation that aimed to address a number of issues identified in the ICT Policy White Paper and included provisions for a WOAN57, the assignment and use of spectrum, rapid deployment, and obligations to provide open access to electronic communication facilities at the wholesale level58.
75. Established and governed by the ICASA Act 13 of 2000,59 as amended,60 ICASA is the independent communications regulator. ICASA, as an entity that currently reports to the Ministry of Communications (MoC), is responsible for (amongst others) issuing licenses to telecommunications and broadcasting service providers, enforcing regulatory compliance and managing the effective use of radio frequency spectrum.61
76. ICASA has enacted to regulate the mobile termination rates (MTRs) or interconnections rates that carriers charge for terminating or completing calls on each other’s network.62 Within its focus on reducing the cost of data, ICASA has also published its amended End-User and Subscriber Service Charter Regulations on 7 May 2018.63 Under the new regulations, implemented from 28 February 2019, service providers are prohibited from charging subscribers for out-of-bundle (OOB) data usage without prior subscriber consent. The regulations also require all licensees to provide an option to consumers to roll over unused data and to provide consumers with the option to transfer data to another subscriber on the same network.64 Operators have since implemented changes regarding the roll-over of data.
56 Electronic Communications Amendment Bill. Government Gazette No. 41880, 31 August 201857 Electronic Communications Amendment Bill. Government Gazette No. 41880, 31 August 2018. Chapter 3A58 Electronic Communications Amendment Bill. Government Gazette No. 41880, 31 August 2018. Chapter 859 The ICASA Act 13 of 200060 The ICASA Amendment Act 2 of 2014, Government Gazette No. 37537, 7 April 201461 Independent Communications Authority of South Africa. 2017. Our Mandate- Policy Mandate. [Online]. Available at: https://www.icasa.org.za/pages/our-mandate [Accessed on 18 June 2018]62 Amendment of the Call Termination Regulations. Government Gazette No 41943 (Notice 489 of 2018). 28 September 201863 The End-User and Subscriber Services Charter Amendment Regulations, Notice 233 of Government Gazette 41613. 7 May 201864 ICASA website. [Online]. Available at: https://icasa.org.za.live.flowroot4.flowsa.net/news/2018/announcement-of-final-end-user-and-ser vice-subscriber-charter-regulations. [Last viewed 09 April 2019]65 Invitation to provide written comments on proposed policy and policy directions to the authority on licensing of unassigned high demand spectrum. Government Gazette No. 41935. 27 September 2018
77. In addition to the aforementioned initiatives currently underway, we note that regulatory interventions for the sector are ongoing – as this report is published, ICASA is conducting a market review into the mobile market and the DTPS has released a draft Policy Direction to ICASA on the assignment of unassigned high demand spectrum (HDS).65 In line with President Cyril Ramaphosa’s recent call to assign radio spectrum, and on the basis of the existing ECA, the draft Policy Direction deals primarily with the licencing of a WOAN, the spectrum to be awarded to the WOAN, and the licensing of unassigned HDS to other licensees. Once finalised, the policy direction will result in ICASA moving to issue an Invitation to Apply (ITA) in respect of an Electronic Communications Network Services (ECNS) licence and spectrum licences, including that for the provision of WOAN services, which currently represents an important process that has been set in motion for the sector and its future.
78. In a progressive and rapidly changing policy, legislative and regulatory environment, it is important that recommendations flowing from the Inquiry take into account both the environment and the key developments therein. The recommendations of the Inquiry must be made within the constraints of this environment, but can also assist in directing or shaping new and imminent developments such as the finalisation of the Amendment Bill and the process of assigning the currently unassigned spectrum.
79. Further details regarding the sector’s policy, legislative and regulatory environment are provided in Appendix C.
2.5. Approach to the remainder of the report
80. The premise for the Inquiry is that data prices in South Africa may be unreasonably high and the ToR also calls for the benchmarking of prices in South Africa against other countries. Thus the first step undertaken is to understand how data prices in South Africa compare to other countries

31
and also how prices compare across different categories of customers, and in particular poorer consumers.
81. After establishing how prices compare, the report then turns its attention to what factors or features of the mobile market and value chain may cause or lead to high prices for data services. We organise these into two broad areas, namely cost and competition factors.
81.1. High prices may be caused by cost factors driven by regulatory or competition failure. Operators, regardless of their market position, will seek to at least recover their costs, and these costs may be influenced by the competitive or regulatory environment. For instance, regulatory failure to provide access to key resources such as spectrum may result in unnecessarily high costs for all operators. Similarly, costs may also be unnecessarily high for some operators due to a competition failure at a wholesale level, and a failure to regulate such markets.
81.2. High prices may also be caused by hindrances to effective competition, regardless of the cost level. Where competition is inadequate or non-existent, firms have more market power and a greater ability to increase prices above the competitive level. Competition concerns may arise in a range of ways – from the particular market structure or from specific advantages to certain firms that cannot be matched by rivals. The state of competition, as shown in the ToR, is a necessary avenue of assessment. However, it is important to note that a market inquiry simply seeks to establish what may be hindering more effective competition, and to remedy that, rather than seek to establish dominance and a substantial lessening of competition which are the domain of abuse cases.
82. After understanding what factors may be negatively affecting price levels, the report turns to provisional recommendations as to what types of interventions might serve to enhance competition or reduce costs, to the ultimate benefit of lower prices. The provisional recommendations take into account remedial action proposed through submissions to the
Inquiry designed to address high prices. At this stage the recommendations are provisional, and the Inquiry will be taking further submissions and engaging with various stakeholders on these and other potential interventions.
83. We note that the identification of issues and the direction of inquiry has been informed by the extensive and very useful submissions received by the Inquiry. Some aspects of the ToR have not been developed extensively where there have been no submissions on that aspect (or the submissions received do not identify concerns), and any other documents or research gathered by Inquiry team does not suggest any concerns. A complete summary of all the submissions received, organised by issue, is contained in Appendix D. However, we also refer to such submissions under the relevant factors discussed in the main report.

32
84. As stated in the ToR, the Data Services Market Inquiry is being conducted in response to the Minister’s concerns regarding “…high data costs in South Africa and the importance of data affordability for the South African economy and consumers”66. The telecommunications sector has features which, the Commission believes, could potentially prevent, distort or restrict competition within the sector. While there is widespread perception of high prices, this section considers the question of pricing further and to what extent pricing outcomes in South Africa are higher than other countries.
85. Such an exercise is useful in that it may suggest, dependant on the extent to which local pricing outcomes are higher than other countries, that there exist concerns at some point along the value chain. Lower relative prices may suggest that there are fewer, if any, concerns in the market for data services. As pointed to above, higher relative prices may suggest competition concerns or cost concerns. Higher prices may also suggest inherent cost differences between countries such as differences in geography, population density, or other input costs.
86. While international price comparisons or benchmarking studies are important exercises, they are typically not definitive in and of themselves. This is because there are difficulties in both conducting and interpreting such analyses, as stakeholders have noted. The process of benchmarking in telecommunications usually involves the comparison of one operator’s prices and quality aspects against its competitors or one country’s product/service offerings compared to those of other countries.67 Despite benchmarking being open to varied interpretations and data-related challenges in some instances, there is a general sense that benchmark reports can provide the market with
66 Data Services Market Inquiry- Terms of Reference, Government Gazette (No. 41054) on 18 August 2017, p. 4 par. 2.367 http://www.gwsolutions.com/benchmarking-basics.php68 This is required in terms of the Data Services Market Inquiry’s Terms of Reference, Government Gazette (No. 41054) on 18 August 2017; p. 5-6, para. 3.3.269 Tarifica (2017) Global Benchmark Report, p. 1
a reasonable view of how mobile and fixed data prices compare across operators, countries and regions as well as over time. These challenges can in some instances be overcome or mitigated, as we show below.
87. This section focuses on international price comparisons i.e. the comparison of South African data services prices against those of other countries.68 Benchmarking these prices has the main purpose of providing a view of whether data prices are in fact high relative to other countries and therefore whether prices in South Africa may be higher than they ought to be, as well as highlighting regional trends and discrepancies between countries.69
88. This section is structured as follows:
88.1. Firstly, we provide a summary of submissions made regarding South Africa’s data prices relative to prices in other countries and international price comparisons more broadly.
88.2. Secondly, we provide a detailed discussion covering all existing international price comparison studies, research reports, and relevant data sources accessible by the Inquiry. In so doing we also address the submissions by Vodacom in particular suggesting that prices in South Africa may not be too high or that international price comparisons should not be emphasised or relied upon, the detail of which is in large part contained in Appendix E.
88.3. Finally, we conclude the assessment and what this means for the Inquiry more broadly.
89. What this section shows is that South Africa’s overall data prices, for both fixed and mobile
3. INTERNATIONAL PRICE COMPARISONS AND THE LEVEL OF PRICES

33
data, are high relative to many other countries. While it is clear that there are challenges in comparing South Africa’s prices against those of other countries, and that South Africa is in general terms not the worst performer in terms of prices both globally and in Africa, it is also clearly evident that South Africa is far from being amongst the best performers in terms of pricing.
90. More broadly, the analysis presented in this section is consistent with the position of the ToR in that there is reason to believe that there may be specific factors or features of the markets in South Africa that result in prices for data being higher than they ought to be. Thus a more detailed consideration of the market(s) for data in South Africa is both justified and necessary, hence the work of the Inquiry and the assessment of this report more broadly.
3.1. Submissions regarding international price comparisons
91. This sub-section covers a summary of the main points raised from those stakeholders that made submissions regarding international price comparisons for data prices, whether fixed or mobile data prices.
Vodacom
92. Vodacom and its economists, Frontier Economics, made a number of submissions to the Inquiry regarding the comparison of mobile prices across countries. Firstly, Vodacom argues that pricing comparisons are difficult for a number of reasons. Secondly, it argues that even when benchmarking studies are conducted the results point to South Africa performing reasonably well against comparator countries, particularly when these challenges (which relate to adjusting for quality factors) are accounted for. Thirdly, it argues that when considering the affordability of data, which is measured by price relative to Gross Domestic Product (GDP) per capita, South Africa in some cases outperforms the expected level of performance.
93. Vodacom submits that there is a challenge in comparing the prices of mobile data when the
70 Vodacom letter dated 30 November 2017 (in CDH’s letter head) (Non-confidential version) p. 2, para 4.171 Vodacom letter dated 30 November 2017 (in CDH’s letter head) (Non-confidential version) p. 2, para 4.172 Vodacom letter dated 30 November 2017 (in CDH’s letter head) (Non-confidential version) p. 2, para 4.173 Frontier Economics (30 November 2017) Assessing key outcomes in the market for mobile data services in South Africa (Non-confidential version), p. 574 Frontier Economics (30 November 2017) Assessing key outcomes in the market for mobile data services in South Africa (Non-confidential version), p. 575 Frontier Economics (30 November 2017) Assessing key outcomes in the market for mobile data services in South Africa (Non-confidential version), p. 16
mobile market typically sees data sold as part of a bundled offering which combines data with voice and messaging services.70 The operator describes [].71 The operator states that this thereby creates a difficulty in investigating and calculating the exact or isolated cost of the data component within its bundled offers.72
94. One of the main submissions of Vodacom concerns the challenges involved in benchmarking mobile prices across countries. Vodacom has categorised these challenges into those related to price outcomes, as well as those issues resulting from non-price factors (such as network coverage, quality and speed) when conducting a benchmarking study.
94.1. It states that the measurement and comparison of prices of mobile data is complex due to countries having many different mobile tariffs, with a number of different prices for each mobile tariff. Vodacom makes specific reference to the frequent updating and adding of pricing promotions to mobile tariffs, as well as countries’ differing tariff structures, as contributors to the complexity involved in country price comparisons for mobile data.73 Vodacom indicated that the true effective price of mobile data depends on the consumer usage attached to a tariff plan, along with specific promotions at the time of usage.74
94.2. Vodacom indicated that the non-price characteristics of mobile data offerings should also be considered when conducting a benchmarking analysis. These non-price factors relate both to the actual mobile offering in terms of speed and network quality and coverage, as well as more broadly to the individual countries’ economic and geographic factors which could complicate a comparative study. The operator notes that these factors could include, but are not limited to, a country’s level of development in the telecommunications sector, its level of urbanisation and its population density.75
34
94.3. In addition to the non-price factors that can influence benchmarking results, Vodacom states that further exogenous factors should be considered. One such factor is the size of the comparator group in a benchmark study. The sample size of countries being compared, according to Vodacom, presents another non-price factor that is not always accounted for in international benchmarking studies. Vodacom notes that some existing benchmarking studies, where they cite the Global System for Mobile Communications Associations (GSMA) and International Telecommunication Union (ITU) databases, take into account a wider international sample while still accounting for increased variation in the level of economic development. This is done by accounting for affordability where differences in average country incomes (measured as GNI76 per capita) are used as a proxy for the level of economic development across countries. Vodacom states that a number of studies have shown income as a significant influencing factor for mobile service demand77, and it notes South Africa’s performance on headline prices is on par with the sample average when accounting for different income levels across countries.
94.4. Further, innovative features of mobile offers are cited by Vodacom as service elements not reflected by the studies that consider only headline price benchmarking. The main innovations affecting the mobile market, Vodacom states, are the zero-rating of data where customers are not charged for data on zero-rated applications, the value added content offered by operators through their networks, as well as more specialised innovations which allow end-users more customisation and control in their chosen services.
95. Additional arguments made by Vodacom concern the review of existing benchmarking studies, which take into account both price and non-price aspects when comparing the price of
76 Gross National Income77 Frontier Economics (30 November 2017) Assessing key outcomes in the market for mobile data services in South Africa (Non-confidential version), p. 4078 Frontier Economics (30 November 2017) Assessing key outcomes in the market for mobile data services in South Africa (Non-confidential version), p. 679 Frontier Economics (30 November 2017) Assessing key outcomes in the market for mobile data services in South Africa (Non-confidential version), p. 680 Frontier Economics (30 November 2017) Assessing key outcomes in the market for mobile data services in South Africa (Non-confidential version), p. 781 MTN submission (Non-confidential version) dated 27 November 2017, p. 34, para 3.3082 MTN submission (Non-confidential version) dated 27 November 2017, p. 34, para 3.31
mobile data in South Africa to other countries. In reviewing benchmark studies done by ICASA and Research ICT Africa (RIA), Vodacom concludes that South Africa’s data prices, on a pure headline price basis, are typically lower than the average for African countries.78 When considering the non-price outcomes in these studies (such as speed, coverage, and mobile data take-up) Vodacom finds that South Africa performs well on a number of benchmarks compared to other countries. These benchmarks include key non-price outcomes that affect consumers’ overall valuation of mobile services.79
96. The operator also notes that distinct, non-price risks exist for a country like South Africa, whose operators are dealing with limited access to spectrum, which it says prevents many operators from extending spectrum-related benefits to mobile consumers in South Africa.80
MTN
97. MTN submits a number of points to the Inquiry concerning the cross-country comparison of data prices. Broadly, MTN points out confounding factors that are a potential source of significant bias in international benchmarking analyses, which increase the likelihood that they produce misleading results.81 These confounding factors are discussed below. MTN also point to what they indicate as more direct and reliable indicators to consider when comparing data prices across different countries, which include “…the intensity of investment, improvements in network quality and coverage, growth in the volumes of data served, as well as pricing dynamics over time”.82
98. MTN notes that there is complexity behind the accurate measurement of prices seen across different countries, which makes this type of comparison difficult. Each country, MTN notes, offers a range of different bundles where the pricing methods are not uniform across all compared countries. For example, the operator states that prices are more dynamic in South Africa compared to other countries because data prices in South Africa are often linked to the

35
choice of network and subscribers’ usage times and patterns.83
99. MTN indicates there are various confounding issues which can affect the accuracy of international benchmark studies, and should thereby be accounted for in these kinds of comparisons.
99.1. The competitive conditions across considered comparator countries could be different due to demand factors in each market and the cost base of a country (where a higher cost base in one country could make it appear more expensive than others). Additionally, MTN states that competitive pricing might not be present in comparator countries and it could be hard to establish if the prices charged in a country are at competitive price levels and, if not, the reasons why this is not the case.84
99.2. MTN states that different countries encounter different cost factors related to the provision of mobile data services to subscribers. MTN notes the impact of an operator’s subscriber base on an operator’s cost, particularly in relation to the density, the type and the demand distribution of its subscribers.85 MTN also states the availability of spectrum and different spectrum bands as a critical cost factor for operators.86
99.3. MTN states that non-price, quality-related factors are often not accounted for in international benchmarking studies. These non-price factors, according to MTN, form a significant part of how operators in South Africa compete with one another and include network quality (mainly relating to mobile data download speeds) and network coverage.87 MTN notes that a further non-price element, within the South African mobile industry, is the operator-driven initiatives to increase accessibility to communications, such as
83 MTN submission (Non-confidential version) dated 27 November 2017, p. 34, para 3.3584 MTN submission (Non-confidential version) dated 27 November 2017, p. 34, para 3.3685 MTN submission (Non-confidential version) dated 27 November 2017, p. 34, para 3.42-3.4386 MTN submission (Non-confidential version) dated 27 November 2017, p. 36, para 3.4487 MTN submission (Non-confidential version) dated 27 November 2017, p. 36, para 3.3888 MTN submission (Non-confidential version) dated 27 November 2017, p. 36, para 3.4089 MTN submission (Non-confidential version) dated 27 November 2017, p. 36, para 3.32-3.3390 MTN submission (Non-confidential version) dated 27 November 2017, p. 37, para 3.45-3.4691 MTN submission (Non-confidential version) dated 27 November 2017, p. 36, para 3.4792 MTN submission (Non-confidential version) dated 27 November 2017, p. 36, para 3.4993 MTN submission (Non-confidential version) dated 27 November 2017, p. 36, para 3.3094 MTN submission (Non-confidential version) dated 27 November 2017, p. 36, para 3.2
offering low or zero-rated applications to local subscribers.88
99.4. Each comparator country’s demographics and socio-economic factors, according to MTN, could make international price benchmarking very challenging as this could affect the correct selection of comparator countries as well as the accuracy of any judgements made by comparing prices across countries.89
100. MTN advocates for considering the affordability of mobile data services across countries, which it holds could be more comprehensive in accounting for cost differentials in each country. MTN shares that the commonly used purchasing power parity adjusted exchange rates are not as comprehensive as the consideration of affordability in accounting for the specific mix of costs relevant to mobile data services.90 In this regard, MTN provides the examples of the GSMA Mobile Connectivity Index (MCI) as well as the World Bank and ITU studies that address this aspect of affordability.91 The GSMA MCI, for instance, takes the minimum cost of a low usage, medium usage and high usage tariff, and calculates prices as a proportion of Gross National Income (GNI) per capita. On this basis (and based on the studies by the World Bank and ITU), MTN notes that SA subscribers are typically far better off than those affordability tariffs available in many comparator countries in Africa.92
101. In addition to the confounding factors for international benchmarking discussed above, MTN also includes indicators which they view as more direct assessors of the state of competition and data prices in comparator countries.93 These direct indicators are cited as the intensity of operator investment, improvements in network quality and coverage, growth in the volumes of data served by operators, as well as pricing changes over time (where MTN note that average prices for mobile data connectivity have decreased significantly over time).94

36
Telkom
102. In its written submission and presentation to the Public Hearings, Telkom acknowledges (like Vodacom and MTN) that international benchmarking of mobile data prices can be challenging and describes these issues as user-profile representativeness, price measurement, choice of comparator countries, cross-country differences in non-price factors and static “snapshot” analyses.95 Telkom’s submission reviews both the Frontier Economic Report submitted on behalf of Vodacom and the Tarifica Global Benchmark Report, where Telkom states that both reports are subject to the aforementioned challenges. Aside from the reports’ methodological concerns, Telkom agrees that the results suggest a general picture of data prices in South Africa being higher than they ought to be due to a mobile data market that is not effectively competitive.96 Telkom further submits that part of higher relative data prices is a consequence of the dominance of two large mobile operators, Vodacom and MTN, as their prices are higher than their rivals and their subscriber bases are the largest.97
Tarifica
103. Tarifica, an international pricing and plan data provider, responded to the Inquiry’s CfS by submitting the company’s Global Benchmark Report on consumer mobile tariffs for Q2 2017.98 Tarifica’s report appears to indicate that Vodacom and MTN’s mobile data prices are higher than prices if the market had effective competition. Due to Tarifica using a weighted average of operator scores (with market shares as weights) in order to calculate each country’s average scores, the report therefore indicates that South Africa’s ranking in the study is primarily a result of the high prices charged by Vodacom and MTN.99 Further details regarding Tarifica’s report are discussed in Section 3.2 below.
95 Telkom’s submission dated 15 October 2018 (Non-confidential), p. 10-1196 Telkom’s submission dated 15 October 2018 (Non-confidential), p. 1897 Telkom presentation to the public hearings, dated 18 October 2018. Slide 2798 Tarifica submission dated 1 November 2017 (updated final report sent 9 October 2018)99 Tarifica submission dated 1 November 2017 (updated final report sent 9 October 2018)100 MWEB submission dated 1 November 2017, p. 1101 MWEB submission dated 1 November 2017, p. 1102 DTPS submission dated 3 November 2017, p. 2103 DTPS submission dated 3 November 2017, p. 2104 RIA’s written submission to the Public Hearings, dated 11 November 2018, para. 3.2105 RIA’s presentation to the Data Inquiry Public Hearings, dated 17 October 2018, slide 4-5106 BRICS is the acronym coined for an association of five major emerging economies: Brazil, Russia, India, China and South Africa107 ICASA presentation to the Data Inquiry Public Hearings, dated 19 October 2018, slide 7108 ICASA presentation to the Data Inquiry Public Hearings, dated 19 October 2018, slide 7
MWEB
104. In its submission to the Inquiry, MWEB notes [].100 MWEB also states, [].101
DTPS
105. The DTPS has also made a submission to the inquiry, where they note [].102 [].103
Research ICT Africa
106. RIA states, in its written submission and presentation to the Public Hearings, that the cost of communication in South Africa is high in comparison with other African countries.104 RIA focuses largely on the cost of the cheapest 1GB of data in South Africa compared to other African countries, where it submits that South Africa performs poorly in this regard as reflected in its poor ranking in the RIA Mobile Pricing (RAMP) Index.105 RIA’s benchmarking studies are discussed in further detail in Section 3.2 below.
ICASA
107. In its presentation in the Public Hearings, ICASA presented the findings from its international benchmarking exercise on the prices of 500MB, 1GB and 2GB data bundles offered by mobile operators in the SADC region and BRICS106 countries.107 Despite the general difficulties in conducting a benchmarking analysis ICASA revealed that its exercise, which considered data prices and other relevant factors (like spectrum assignment, legislative frameworks and market structure), indicated that data prices in South Africa are not the highest in the SADC and BRICS countries while also never ranking as the lowest. The study showed that the South African operators who operate internationally, namely Vodacom and MTN, charge customers in South Africa higher prices for data than in other countries in which they have a presence.108 ICASA’s benchmarking exercise is discussed in further detail in Section 3.2 below.
37
ANC
108. At the Public Hearings, the ANC shared its view that the cost of data in South Africa is significantly higher than in other African countries.109 The ANC presented a graph, based on research conducted by RIA, showing the 2017 price of 1GB of data (in dollars) across six African countries, where South Africa ranked as the most expensive country with $7.5, and Egypt the most affordable at $1.4.110 Additionally, the ANC highlighted the result of ICASA’s benchmarking study, where Vodacom and MTN have more expensive data prices than offered in the other countries they operate in.111
The Right2Know Campaign
109. The Right2Know (R2K) Campaign conducted research, along with the Link Centre, into the cost of communications in South Africa, where data from Tarrific112 was used to compare data prices across countries.113 In its written submission and presentation to the Public Hearings, R2K presented their findings, which indicated that contract data prices in South Africa, when adjusted for cost of living, “remains one of the most expensive in the world when benchmarked against other countries”. R2K also submit that South Africa has the second highest data contract prices compared to the BRICS countries, which are 134% more expensive than the cheapest data prices in the group.114
Alliance for Affordable Internet
110. In its presentation to the Public Hearings, the Alliance for Affordable Internet (A4AI) presented its research on affordable broadband in Africa, where it highlighted South Africa’s poor performance in terms of its Affordability Drivers Index (ADI).115 The ADI does not directly measure affordability, but relies on an in-depth analysis of communications infrastructure, access and affordability indicators to rank 58 African countries. A4AI showed that South Africa only places 7th out of the top ten African countries in the 2017 ADI.
109 ANC presentation to the Data Inquiry Public Hearings, dated 19 October 2018, slide 5110 ANC presentation to the Data Inquiry Public Hearings, dated 19 October 2018, slide 5111 ANC presentation to the Data Inquiry Public Hearings, dated 19 October 2018, slide 6112 Tariffic, a local research company tracking mobile phone packages, has closed its operations as of April 2018113 Right2Know written submission to the Data Inquiry Public Hearings, dated 12 October 2018, p. 3114 Right2Know presentation to the Data Inquiry Public Hearings, dated 17 October 2018, slide 4115 A4AI Internet presentation to the Data Inquiry Public Hearings, dated 19 October 2018, slide 4116 MTN submission dated 27 November 2017, (Non-confidential version) p. 34, para. 3.31117 MTN submission dated 27 November 2017, (Non-confidential version) p. 34, para. 3.30
Conclusion
111. Outside of MTN and Vodacom, the submissions detailed above suggest that prices for data in South Africa do not compare well against other countries globally. This aligns with the more widely held public view that South Africa’s data prices are too high, particularly in comparison to other countries.
112. It is only MTN and Vodacom that appear to present what might be termed as “opposing” views. In brief, they submit that international price comparisons should be interpreted with caution due to the complexities involved in undertaking such studies and the confounding factors that may be unobserved and affect the reliability of the results. They also submit that affordability measures, where prices relative to GDP per capita are considered, are a more relevant basis for comparisons than actual prices. It is also contended by Vodacom (through its economists, Frontier Economics) that South Africa performed as predicted, or even better, when considering affordability measures.
3.2. Existing market research on international price comparisons
113. Vodacom and MTN in particular have cautioned against a benchmarking exercise, arguing that these are complex and the results may not be robust.
113.1. In its submission on 27 November 2017, MTN noted that international price benchmarking should be treated with “extreme caution”116. Because international price benchmarking is subject to many “confounding factors” which are “potential sources of significant bias”, many attempts at international benchmarking will likely “produce misleading results”.117 It argues that even if confounding factors are controlled for, international price benchmarking is likely to provide a far less reliable guide about the state of competition in South Africa than “direct indicators”, which include “intensity of investment, improvements

38
in network quality and coverage, growth in the volumes of data serviced as well as pricing dynamics over time.”118
113.2. Vodacom similarly argued on the basis of the 30 November 2017 Frontier report that significant cross-country variations make obtaining robust results based on cross-country comparisons of headline prices difficult.119 Therefore, the results of benchmarking studies need to be interpreted carefully.120 Specifically, Frontier noted the following: “…it is misleading to conclude that one country is more expensive than another country based on a simple comparison of headline prices, without taking into account differences in these non-price factors, in order to assess value-for-money more accurately”121. The factors that require consideration in benchmarking studies include quality differences (e.g. network quality and customer service), underlying cost differences (e.g. digital spectrum allocations, population densities), differences in the demand for data services (measured by GDP/capita and to a lesser extent monthly consumption data per user) and differences in offers (e.g. promotions, zero-rated applications, personalised offers).122
114. The Inquiry agrees that benchmarking is an imperfect and complex exercise and that confounding factors can make international price benchmarking difficult. However, this does not imply that international price comparisons are without merit or should not be considered by the Inquiry.
114.1. Indeed, international benchmarking is evidently a standard approach to assess pricing, undertaken across telecommunications authorities and governments, as well as research organisations and global organisations such as the International Telecommunications Union (“ITU”). In addition, the methodologies and
118 MTN submission dated 27 November 2017, (Non-confidential version) p. 34, par. 3.31-2119 Vodacom’s letter dated 30 November 2017 (in CDH letter head), (Non-confidential version) par. 6.3120 Frontier Economics (30 March 2017) Assessing key outcomes in the market for mobile data services in South Africa (in Vodacom’s sub mission dated 30 November 2017), (Non-confidential version) p.13121 Frontier Economics (30 March 2017) Assessing key outcomes in the market for mobile data services in South Africa (in Vodacom’s sub mission dated 30 November 2017), (Non-confidential version) p.13122 Frontier Economics (30 March 2017) Assessing key outcomes in the market for mobile data services in South Africa (in Vodacom’s sub mission dated 30 November 2017), (Non-confidential version) p.13-14 Also see MTN submission dated 27 November 2017, (Non-confidential version) p. 34, par. 3.30123 ITU (2014) A Practical Guide on benchmarking Telecommunication Prices, p.1
approaches used in international price comparisons have also developed, including approaches that attempt to account for country differences or approaches that compare against similar countries or groups of countries.
114.2. Furthermore, the purpose of the inquiry is to understand if data prices are generally high comparative to other countries, and if so, what may be causing this and how can that be remedied. For this purpose the international benchmarking is particularly useful. The exercise is not one of undertaking an excessive pricing assessment under an abuse of dominance investigation where greater specificity of the usefulness of comparators may be required if one is seeking to draw specific conclusions on mark-ups.
115. Notwithstanding the challenges involved, international price comparison studies do have some probative value. Even if limited in terms of the strength of conclusions that can be drawn, benchmark studies provide a simple and effective cross-check on the general level of prices in a market.123 Therefore, in this section, we review the available research comparing data prices in South Africa to other countries. This section covers existing benchmark research from a variety of sources including well-known ICT research organisations, widely-used technology sites, telecommunications service companies, ICT-related coalitions, broadband market intelligence companies as well as research from the industry regulator, ICASA.
116. The studies found contain benchmarking evidence covering the 2014 to 2018 period, with the bulk of the research sourced from RIA and ICASA which mainly cover prepaid mobile data prices. Despite the inclusion of some older studies and benchmarking reports, most of the existing research presented below is focused on the 2017 to 2018 period and is therefore more relevant in terms of international benchmark evidence for data prices.

39
117. In reviewing studies, the Inquiry has not limited itself to studies focusing on ‘data-only’ tariff comparisons, especially as the structure of operator activities in South Africa often entails data being sold within a bundled offer that could include voice, where operator costs are common to both types of service and similar observations can be made. ‘Data-only’ offers have also been compared.
118. This section covers international benchmarking or price comparison studies that consider a) mobile data prices for prepaid data and bundled top-ups, b) mobile post-paid data prices, and c) fixed data tariffs.
3.2.1. Data prices of mobile prepaid broadband products
International Telecommunications Union
119. For international mobile price comparisons, the ITU collects two types of mobile pricing data from countries worldwide, namely prepaid handset-based mobile broadband plans with a data allowance of 500MB per month, and post-paid computer-based mobile broadband plans with a data allowance of 1GB per month.124 The latter category is briefly discussed in the section below covering post-paid price comparisons. The ITU collects the mobile broadband prices for the least expensive plan
124 ITU (2017) ICT Prices 2017 report. [Online]. Available at: https://www.itu.int/en/ITU-D/Statistics/Documents/publications/misr2017/IP B2017_E.pdf [Accessed on 23 August 2017]125 In addition to the PPP conversion, the ITU also expresses the mobile broadband prices as a percentage of GNI per capita which is not reported here.126 South Africa’s rank is based on USD prices only and accounts for duplicate country prices.
with a 30-day validity period from the operator with the largest market share, measured by the number of mobile broadband subscriptions. Each country’s local prices are converted to US dollars, as well as dollar values (based on World Bank data) at purchasing power parity (PPP) to adjust for purchasing power across the selected countries.125
120. The latest mobile prepaid handset-based broadband prices, which the ITU reported in its ICT Prices 2017 report, show that South Africa’s cheapest prepaid 500MB, at USD 6.73, ranks 60th place out of 192 countries, when the country rankings are based on the 500MB price in dollars. 126 Kyrgyzstan and Cambodia are ranked first place for their 500MB prepaid offer costing USD 1, while the United States ranks last with 500MB costing USD 54.44. Figure 4 below shows that when accounting for price level differences between countries, however, these ranking change considerably as South Africa ranks within the higher priced countries at a rank of 131st out of the 169 countries for which PPP dollar prices were available. The top-ranked country for 500MB prepaid data is Pakistan with USD 2.51 (PPP), whereas Guinea-Bissau ranks as the most expensive country for 500MB with USD 123.35 (PPP). South Africa’s cheapest 500MB price, in PPP$ terms, is around 833% more expensive than the cheapest offer in Pakistan.
Figure 4: Mobile prepaid data prices in USD (PPP), 500MB (2016)
Source: adapted from ITU ICT 2017 Prices report

40
121. According to the ITU pricing data for the BRICS countries 127, Figure 5 indicates that when adjusting for different price levels across countries, South Africa had the highest price in 2016 for 500MB prepaid data at USD 23.42 (PPP), which is around 180% more expensive than the cheapest price from the BRICS countries, offered in Russia at the time at a price of USD 8.35 (PPP).
122. When looking at the ITU mobile prepaid data prices for the African countries within the global sample of 2016 USD prices (adjusted for the purchasing power of different currencies), the prices show that South Africa ranks 34th cheapest of the 45 countries, which is within the higher prepaid 500 MB data prices, at USD 23.42 (PPP). This is shown in Figure 6 below. The cheapest country in Africa for 500MB prepaid data is Cabo Verde at USD 3.47 (PPP), while Guinea-Bissau is the most expensive African country (and the most expensive country from the global sample) with the price of 500MB prepaid data priced at USD 123.35 (PPP).
127 ITU (2017) ICT Prices 2017 report. [Online]. Available at: https://www.itu.int/en/ITU-D/Statistics/Documents/publications/misr2017/IPB2017_E.pdf [Accessed on 23 August 2017]
Figure 5: Mobile prepaid data prices for BRICS in USD (PPP), 500MB (2016)
Source: adapted from ITU ICT 2017 Prices report
Figure 6: Mobile prepaid data prices for African countries in USD (PPP), 500MB (2016)
Source: adapted from ITU ICT 2017 Prices report

41
Tarifica
123. Tarifica publishes a quarterly Global Benchmark Report that illustrates the relative pricing of mobile services worldwide.128 The report shows the cost of mobile services, both prepaid and post-paid, for various consumer classes from major MNOs in 25 countries and 82 major operators. The benchmark study is built on 18 distinct profiles which are constructed to represent the monthly mobile needs of different consumer groups, from a feature phone user with a tight budget in a developing country to a heavy data user in a developed country. Tarifica’s research includes country rankings for mobile prepaid and post-paid plans combining voice, SMS and data, as well as data-only rankings.
124. Tarifica uses the OECD129-methodology based basket approach and the “Rational Consumer” model in choosing plans for each basket, where researchers select the least expensive option that meets the minimum requirements of each profile.130 One time fees and promotions, as well as prepaid plans and offers that are not valid for at least 28 days are excluded from the study. The final market price of each selected offer is calculated using a weighted average of operator scores with market shares as weights in order to calculate each country’s average scores. All prices are converted to US dollars131, after which the results are adjusted to account for cost of living differences by using PPP.132
128 Tarifica (2017) Global Benchmark Report- Study of Consumer Mobile Tariffs Q2 2017. Submitted on 1 November 2017 (since updated)129 OECD is the Organisation for Economic Co-operation and Development130 Tarifica (2017) Global Benchmark Report- Study of Consumer Mobile Tariffs Q2 2017. Submitted on dated 1 November 2017 (since updated), p.3131 This conversion is based on the average currency conversion rate between the United States and the selected country throughout the second quarter of 2017.132 Tarifica (2017) Global Benchmark Report- Study of Consumer Mobile Tariffs Q2 2017. Submitted on 1 November 2017 (since updated), p.3133 The consumer profiles include three types of offers; offers with prepaid voice/SMS/data, offers with prepaid voice/SMS, and offers with prepaid data only.134 Tarifica (2017) Global Benchmark Report- Study of Consumer Mobile Tariffs Q2 2017. Submitted on 1 November 2017 (since updated), p.11135 Tarifica (2017) Global Benchmark Report- Study of Consumer Mobile Tariffs Q2 2017. Submitted on 1 November 2017 (since updated), p.13
125. South Africa ranks 17th overall in the prepaid mobile plans out of the selected 25 countries, where the overall ranking is based on an average performance score across consumer profiles.133 For Tarifica’s ‘data-only’ user profiles, a light user is described as using 250MB on 3G or better speed, a moderate user uses 1GB also on 3G or better speed and a heavy user uses 4GB on 4G service.134 Tarifica’s benchmark study shows, as seen in Table 1 below, that South Africa does not perform strongly in the prepaid ‘data-only’ segment as it ranked 14th cheapest out of 25 countries for light data-only users, 20th cheapest for moderate data only users and only 22nd place for heavy data-only users.135 Within the prepaid plan categories, Tarifica’s research therefore appears to indicate that data-heavy consumer profiles fair worse than light users, relative to other countries. This trend is similarly observed for Tarifica’s post-paid ‘data-only’ ranking for South Africa relative to the other countries in the sample.

42
126. Based on their pricing data from the Q2 2017 report, Tarifica notes that there is room for improvement in the prepaid data market in South Africa, particularly in the moderate and heavy user categories.136 Furthermore, the report’s methodology of using operators’ market shares to calculate a weighted average price for each country therefore suggests that South Africa’s ranking in the study is driven primarily by the data prices charged by the two largest operators, Vodacom and MTN.
ICASA
127. ICASA publishes a Bi-Annual Retail Tariff report on the analysis of tariff notifications submitted to it by operators to highlight different tariff
136 Tarifica (2017) Global Benchmark Report- Study of Consumer Mobile Tariffs Q2 2017. Submitted on 1 November 2017 (since updated),p.22137 ICASA includes 14 of the 16 SADC countries, namely: Angola, Botswana, Lesotho, Madagascar, Malawi, Mauritius, Mozambique, Namibi a, Seychelles, South Africa, Swaziland, Tanzania, Zambia and Zimbabwe (DRC and Comoros missing).
plans which existed in the market (or were filed) during a six-month period. In its 2018 Bi-annual Retail Tariff Report, covering the period 1 July to 31 December 2017, ICASA compares the price of prepaid mobile data in the BRICS countries (Brazil, Russia, India, China, South Africa), the SADC countries137, as well as the prepaid data prices across the countries in which Vodacom and MTN operate. These comparisons are done across three data price categories, cheapest, average and highest:
127.1. Cheapest refers to the best-priced operator of all the available operators in a country.
Ranking Country Average Performance
Light User (data only)
Moderate User (data only)
Heavy User (data only)
1st India 3.33 1 4 10
2nd Sweden 3.44 2 5 1
3rd Turkey 3.78 7 7 3
4th Kenya 5.11 3 2 8
5th United Kingdom 6.33 11 8 6
6th Pakistan 6.89 4 1 4
7th Nigeria 7.89 5 3 7
8th Australia 8.00 15 10 5
9th Mexico 9.44 18 13 20
10th France 10.22 12 11 11
11th Germany 10.22 13 15 16
12th Singapore 11.33 10 6 12
13th Brazil 13.67 6 17 21
14th United States 14.22 19 18 17
15th Malaysia 14.78 9 9 2
16th Spain 16.44 20 16 15
17th South Africa 16.67 14 20 22
18th Qatar 18.11 25 23 18
19th South Korea 18.78 8 14 19
20th Bahrain 19.11 24 21 9
21st Thailand 19.22 17 12 14
22nd Kuwait 20.44 23 19 13
23rd Oman 21.11 16 22 24
24th United Arab Emirates 22.33 21 25 25
25th Saudi Arabia 24.11 22 24 23
Table 1: Tarifica overall ranking of mobile prepaid plans (Q2 2017)
Source: adapted from Tarifica Global Benchmark Report, Q2 2017

43
127.2. Average refers to the average price across all operators in a country.
127.3. Highest price refers to the price of the worst-priced operator in a country.
128. For each of these categories, ICASA considered
the rates of 30-day 500MB, 1GB and 2GB data bundles and converted these rates to US dollars using the global market exchange rate (MER), which converts mobile data prices using a direct conversion of all the benchmarked countries’ currencies to the USD spot rates.138 It should be acknowledged that ICASA has conducted these comparisons from a basic pricing perspective, and “…other factors such as mobile network reach/coverage, service quality (i.e. speed and latency), technology type (e.g. LTE), and the price of the mobile devices were not taken into account in conducting this analysis (emphasis added).”139 ICASA also notes that an equalisation calculation method140 was used in the report to obtain the best estimate of data bundles where there were different data bundles sizes.141
129. In the tariff report, ICASA compared data prices within the BRICS countries. The cheapest, average and highest prices for the 500MB, 1GB and 2GB prepaid data bundles (valid for 30 days) in South Africa were compared to those available in Brazil, Russia, India and China for 2017.142 The results from this comparison, seen in Table 2 below, show that China’s cheapest, average and highest prepaid
138 ICASA does not provide the date of the exchange rate applied when spot exchange rates were used.139 ICASA (2018) Bi-annual Report on the analysis of tariff notifications submitted to ICAS for the period 1 July to 31 December 2017, p.48140 The ICASA Bi-annual Report does not provide an explanation of the ‘equalisation method’ used in its report.141 ICASA (2018) Bi-annual Report on the analysis of tariff notifications submitted to ICAS for the period 1 July to 31 December 2017, p.49142 ICASA notes in its report that the prices were sourced from operator websites and converted on 20 September 2017.
prices for the 500MB, 1GB and 2GB packages are significantly higher than in the other four countries. The best-priced data offers across the different packages are generally found in Russia and India. The results for each data bundle are further discussed below:
129.1. For the 500MB bundle, South Africa’s cheapest price of USD 2.63 ranks it third cheapest in the category, where Russia has the cheapest price at USD 1.29 and India the second cheapest offer at a price of USD 1.90. The average and highest prices for 500MB in South Africa also rank it in third place (where this refers to either the third best or third worst offer) across the BRICS countries.
129.2. Within the 1GB prices, India ranks as the best offer for both the cheapest and average price categories, and Russia as the best offer amongst the highest prices for 1GB. South Africa again ranks third place for the cheapest and average 1GB prices, and fourth place for the highest 1GB prices.
129.3. For 2GB bundles, the best offer for the cheapest 2GB price is in India and Russia has the best offer for average and highest priced 2GB offers. South Africa ranks third place for the cheapest 2GB, and fourth place for the average and highest 2GB prices.
Ranking500MB 1GB 2GB
Cheapest Average Highest Cheapest Average Highest Cheapest Average Highest
Brazil 5.30 6.64 7.98 10.65 10.91 11.18 14.05 14.14 14.90
China 12.50 28.75 45.00 25.00 57.50 90.00 15.21 70.07 160.00
India 1.90 2.18 2.67 1.03 2.33 2.78 2.72 4.13 4.61
Russia 1.29 1.29 1.29 2.59 2.59 2.59 4.02 4.08 4.14
South Africa 2.63 5.72 7.90 4.89 9.04 12.04 7.15 14.43 19.57
South Africa rank
3 3 3 3 3 4 3 4 4
Table 2: Prices for 500MB, 1GB and 2GB data bundles within BRICS (USD) (2017)
Source: adapted from ICASA Bi-annual Tariff report 2017

44
130. In most cases, South Africa is placed 3rd cheapest (or equivalently 3rd most expensive) of the BRICS countries. From ICASA’s comparison on the data prices across the BRICS countries, it seems that South Africa performs better on the cheapest offers than the highest-priced offers. This may be explained by the fact that in South Africa there has been a disparity in pricing between Telkom and the larger operators, with Telkom offering the cheaper data bundles, whereas Vodacom and MTN generally have higher-priced bundles. Accordingly, South Africa seems to perform relatively worse when considering the highest prices. Table 2 also suggests that the bigger firms in South Africa compete relatively more on the smaller bundle sizes than the larger offers.
131. The ICASA tariff report also includes a comparison of mobile prepaid data prices within the SADC countries for 2017,143 which is presented here as the data has been provided to us. For the 500MB bundle comparison in the SADC region, shown in Figure 7 below, the following is observed by ICASA:
143 ICASA notes in its report that the prices were sourced from operator websites and converted on 20 September 2017.
131.1. In terms of the cheapest operator’s price, South Arica appears to perform well, ranking 3rd out of 14 SADC countries. Mozambique has the lowest bundle price of USD 0.83 while Botswana has the highest price at USD 26.95.
131.2. In terms of the average price across operators, South Africa ranks as the 6th cheapest country for 500MB of the 14 countries. Again, Mozambique has the lowest bundle for average 500MB prices (USD 0.83) while Botswana’s average price is the highest at USD 26.95.
131.3. In terms of the price of the most expensive operator (the highest price), South Africa ranks as the 8th best offer for the highest-priced offers. South Africa’s highest 500MB rate (at USD 7.90) compares poorly to the highest rate in Mozambique (at USD 0.83), as it is 851% more expensive than in Mozambique.
132. In comparing the 1GB prepaid data bundles across 15 SADC countries for the three categories of cheapest, average and highest price, shown in Figure 8 below:
132.1. South Africa’s USD 4.89 price comes in 6th place for the cheapest 1GB data bundle within the SADC region. The DRC has the cheapest 1GB prepaid data bundle at USD 1.29, while Seychelles has the most expensive cheapest 1GB rate.
Figure 7: SADC prices (USD) for 500MB prepaid data bundle (2017)
Source: adapted from ICASA data, submitted to the Commission on 4 October 2018

45
132.2. In terms of the average price across countries, South Africa’s 1GB offer ranks 7th place amongst the SADC countries, while DRC has the best average-priced offer at USD 1.29 and Zimbabwe the worst offer at USD 26.11.
132.3. Regarding the highest-priced offers,
144 ICASA (2018) Bi-annual Report on the analysis of tariff notifications submitted to ICASA for the period 1 July to 31 December 2017, p.51 (Figure 11)145 No information on for 2GB bundles was collected for Angola.
South Africa’s 1GB of data (at USD 12.04) ranks it 9th best amongst the SADC countries, which is better than its neighbouring countries’ highest prices, namely USD 30 for Zimbabwe and USD 20.02 for Swaziland. Again, the DRC has the best highest-price 1GB prepaid data bundle at USD 1.29.
133. The ICASA report also looks at the three price categories of 2GB prepaid data bundles across 14 SADC countries, shown in Figure 9 below:
133.1. DRC has the cheapest 2GB prepaid data bundle with a price of USD 1.03. From the report’s graph144, it appears that South Africa’s cheapest 2GB bundle price ranks 4th out of the 14 SADC countries145. The worst-ranking cheapest price for 2GB is USD 47.17 from Seychelles.
133.2. The lowest average price for the 2GB bundle across the given SADC countries
is offered in Mozambique for USD 3.38. South Africa’s average 2GB price ranks as the 8th best offer, while Seychelles also has the highest average price (at USD 47.17).
133.3. Zimbabwe has the highest 2GB data bundle at USD 50, which is 155.5% higher than South Africa’s most expensive 2GB price of USD 19.57. South Africa’s highest 2GB prices ranks as the 8th best offer of the 14 countries, with Mozambique offering the best (lowest) highest 2GB price for USD 3.38.
Figure 8: SADC prices (USD) for 1GB prepaid data bundle (2017)
Source: adapted from ICASA data, submitted to the Commission on 4 October 2018

46
134. In addition to the BRICS and SADC comparisons, ICASA’s report also includes comparisons of MTN and Vodacom South Africa data prices for 2017 with the prices in other countries where they operate.146 Table 3 below shows the cheapest MTN pre-paid data prices of its 500MB, 1GB and 2GB bundles that it charges across the thirteen countries in which MTN operates: 147
134.1. The table indicates that the cheapest 500MB pre-paid data bundle offered by MTN is in the Ivory Coast and in Zambia (with a price of USD 1.69), compared to the most expensive in South Africa at USD 7.84. It is unlikely that this differential can be explained by simple country-specific factors as, drawing on the information in Figure 7 above, the average 500MB price for Zambia is approximately double (89.3%) that of South Africa.
134.2. The cheapest 1GB from MTN is sold in Iran at USD 0.14, while MTN charges the highest price for 1GB in Cyprus at USD 18.88, and the second highest price in Botswana at USD 12.53. The price MTN charges for 1GB in South Africa is USD 11.95, which is 8,435.7% higher than the cheapest offer in Iran (at USD 0.14). A 1GB from MTN is priced at USD 2.32 in
146 ICASA notes in its report that the prices were sourced from country specific operator websites and converted on 15 December 2017.147 ICASA lists only 13 of the countries in which MTN operates, with an explanation for the selection not stated in the report.
Rwanda, making it the cheapest African country for 1GB of MTN prepaid data. South Africa’s MTN 1GB price (USD 11.95) is about 415% more expensive than the cheapest 1GB offered in Rwanda.
134.3. The table also shows that MTN’s second highest price for 2GB across the countries it operates in, is South Africa at a price of USD 19.42, with the most expensive offer in Cyprus at USD 27.15. The cheapest 2GB data bundle from MTN is offered in Liberia for USD 0.04 and the second cheapest in Iran for USD 0.23. MTN SA’s price for the same bundle (at USD 19.42) is higher than cheapest bundle in Liberia by 48,450% and Iran by 8,343.5%. Table 3 therefore shows that MTN generally charges more in South Africa for the same data bundles than the other countries where it operates, with only Botswana and Cyprus having higher prices than in South Africa.
Figure 9: SADC prices (USD) for 2GB prepaid data bundle (2017)
Source: adapted from ICASA data, submitted to the Commission on 4 October 2018

47
135. The figures below depict ICASA’s comparison of Vodacom’s 1GB and 2GB prepaid data bundle prices across the African countries in which Vodacom operates: 148
135.1. As shown in Figure 10 below, Vodacom charges the highest price in South Africa, at USD 11.06 for a 1GB data bundle, while only USD 1.12 for the
148 The report states that there was limited information to compare Vodacom SA prices to other Vodacom/Vodafone companies in other countries, which limited consistent benchmarking across the data categories.149 The reported Vodafone 1GB price for DRC differs from the DRC prices reported in Figure 8, which suggests that Vodafone’s data was not used in that graph.
same product in Egypt. This implies a customer in South Africa pays 887.5% more for a 1GB bundle from Vodacom than from Vodafone in Egypt. The 1GB bundle from Vodacom South Africa is also 38.3% more expensive than the second highest offer, which ICASA reports as a price of USD 8 charged in DRC.149
Country 500MB 1GB 2GBSouth Africa 7.84 11.95 19.42
Botswana N/A 12.53 19.33
Ghana 2.22 4.43 7.10
Ivory Coast 1.69 3.37 6.33
Liberia N/A N/A 0.04
Nigeria N/A 3.15 5.04
Rwanda N/A 2.32 N/A
Uganda 5.56 8.34 N/A
Zambia 1.69 3.41 6.75
Afghanistan N/A 4.32 5.76
Benin N/A 7.17 10.76
Cyprus N/A 18.88 27.15
Iran N/A 0.14 0.23
Table 3: Prices for MTN pre-paid data bundles across countries (USD) (2017)
Source: adapted from ICASA Bi-annual Tariff report 2017
Figure 10: Vodacom 1GB retail tariffs across Africa (2017)
Source: adapted from ICASA Bi-annual Tariff report 2017

48
135.2. A similar result emerges when considering the different prices charged by Vodacom for the 2GB data bundle in the countries in which it operates (see Figure 11 below), as captured by ICASA.150 Vodacom charges the highest 2GB data bundle price in South Africa at USD 18.49, which is 815% more
150 We note there are minor differences between the reported Vodacom 2GB price in Tanzania (USD 8) and the highest 2GB price reported for Tanzania shown in Figure 6 (USD 6.75), which could be the result of exchange rate effects between the time periods of data collection (Figure 6 data was collected 20 September 2017 while data in Figure 8 was collected 15 December 2017).151 Vodacom’s presentation at the public hearings held on 17-19 October 2018. See Day 2 Transcripts, p.36
expensive than the cheapest 2GB offer, which Vodacom sells for USD 2.02 in Egypt. The 2GB price offered by Vodacom in South Africa is also 63.3% higher than the second highest Vodacom price, which is the USD 11.32 offered in Lesotho.
136. Overall, ICASA’s benchmarking results suggest that South Africa is not a strong performer in the prices for prepaid mobile data when compared to countries in the SADC region, the BRICS group, and the countries in which South Africa’s operators offer data. ICASA’s comparisons of the prepaid data prices across the SADC and BRICS countries both show that South Africa performs better when compared along the cheapest offers, while its performance is relatively weaker in the average and highest price categories. ICASA’s report provides snapshots of data prices where the bulk of the results appear to support the notion that data prices in South Africa are higher than many other countries, although it is also not the worst performer with a number of countries at higher price points than South Africa.
137. We note that Frontier Economics, on behalf of Vodacom, comes to a different conclusion on the ICASA data. However, it would seem that this is largely a difference in interpretation, with Frontier Economics arguing that a ranking
around the mid-point for certain comparisons does not reflect high prices but average performance. The implication is that as long as data prices in South Africa are broadly in line with the sample averages, they are not a cause for concern.
138. The Inquiry does not agree that data prices in South Africa ought only to be ‘average’ as opposed to one of the better countries, or at least compared to an average or predicted price in order to understand whether there could be a concern. The CEO of Vodacom Mr Shameel Joosub would appear to have a similar view when asked whether we should be comparing ourselves to an average or the best particularly in relation to Africa in the Data Inquiry Hearings: “That said, I think it’s fair to say we should be comparing ourselves towards the best? I don’t think we should be comparing ourselves to just the best in Africa, but we should be comparing ourselves to the best in the world” 151 (emphasis added).
Figure 11: Vodacom 2GB retail tariffs (2017)
Source: adapted from ICASA Bi-annual Tariff report 2017

49
139. Appendix E provides a detailed discussion of the submissions by Vodacom (Frontier Economics) and MTN on international price comparisons, and our response thereto.
Alliance for Affordable Internet
140. A4AI is a global coalition consisting of various national multi-stakeholder alliances which work towards achieving affordable, universal access to the internet. As part of A4AI’s flagship annual research project, the ‘Affordability Report’, pricing data is collected for low and middle-income countries regarding mobile broadband data costs. A4AI collects pricing data according to the ITU methodology where the cheapest handset-based mobile prepaid broadband
152 A4AI (2016) Mobile Broadband Data Costs for 2016. [Online].Available at: https://a4ai.org/mobile-broadband-pricing-data/ [Accessed on 25 August 2018]153 RIA (2018) Dominant operators’ data prices remain static while SA struggles to get and stay online. Policy brief 1, 2018, p.2154 The full list of African countries covered in the RAMP Index is available on the RIA online portal. Available at: https://researchictafrica.net/ ramp_indices_portal/155 RIA (2018) Dominant operators’ data prices remain static while SA struggles to get and stay online. Policy brief 1, 2018, p.2
plans, providing at least 1GB of data over a 30-day period, are selected from the largest MNO in each country.152
141. The benchmarking result from A4AI’s 2016 mobile prepaid 1GB prices, is shown in Figure 12 below. Of the 40 countries for which 2016 pricing data was available, South Africa ranks 29th cheapest when considering the PPP price alone, with a price of USD 23.81. The data shows the cheapest 1GB is from Sri Lanka with a price of USD 4.05, while Zimbabwe has the highest 1GB cost at USD 68.81. According to the 2016 data from A4AI, South Africa’s cheapest prepaid 1GB price is around 145% more expensive than the cheapest offer from Sri Lanka.
Research ICT Africa
142. RIA is a regional ICT research organisation which records pricing data from operators across Africa. In its comparison studies, RIA mainly focuses on the cost of the cheapest 1GB of prepaid mobile data which is used to compare prices in South Africa with other African countries. The primary focus of RIA’s research is the RAMP Index which is a database
collection of the cheapest monthly prepaid mobile 1GB data bundles153. This database comprises of prices collected from all operators across 49 African countries, where RIA’s main findings report on the cheapest price across operators within a country.154
143. In the most recent pricing study by RIA, the comparisons from the RAMP Index data for Q1 2018 are reported.155 For the prepaid mobile
Figure 12: A4AI’s 1GB mobile prepaid prices in USD (PPP) for low and middle-income countries (2016)
Source: A4AI 2016 price database

50
pricing comparisons, a 1GB measure is used in the index as prices for this product are commonly available across the included countries, thereby allowing for a simple price comparison across multiple markets. The basket or bundle methodology involves capturing the price of all offers available for a 1GB data bundle per month from a the main operators156 in a given country, and then comparing the countries based on the cheapest 1GB data available in each country.157 The baskets are then converted to US dollars (USD) for comparison across the African markets.158
144. In terms of South Africa’s current performance, as reported in the latest RIA pricing study,159 South Africa ranks 35th out of the 49 countries in the RAMP index for Q1 2018 with a price of USD 8.29, where the 49th country has the
156 Although the study acknowledges the entry of Rain into the data market, with its affordable 5c per MB (or R50 per 1GB) offer, its offer has been excluded from the cross country comparisons as Rain’s ‘data only’ network (which is only available for LTE devices) has just entered the market and the company is currently too small a competitor to be considered in the cross-country cheapest 1GB comparison.157 The studies included in this section typically adopt the OECD “basket” approach, which involves the collection and comparison of the price of all available plans in each country that delivers a particular combination of voice, messaging and data. In this case, the data baskets refer to the price of 1GB prepaid mobile data bundles valid for monthly periods. See: OECD. 2017. Revised OECD Telecommucation Price Baskets, p.3158 The particular methodology involved in the exchange rate conversion is not stated in the paper.159 RIA (2018) Dominant operators’ data prices remain static while SA struggles to get and stay online. Policy brief 1, 2018, p.2160 We note the discrepancy between the Q1 2018 Policy Brief reporting 49 countries and RIA’s actual data containing 50 countries. RIA submitted pricing data to the Commission for the 50 countries in the RAMP Index, for the period Q1 2018 and Q2 2018 (which is not currently available on the online RAMP Index portal).
most expensive 1GB of data. RIA’s RAMP index dataset for Q1 2018 and Q2 2018, shows a sample of 50 countries where South Africa ranks 35th out of 50 countries for both quarters.160 For the most recent period, Q2 2018, Figure 13 below shows South Africa’s price for 1GB mobile prepaid data amongst the prices of 50 African countries in the RAMP Index. The pricing data indicates that South Africa’s cheapest 1GB, at USD 7.84, is higher than the sample average price of USD 7.58 (shown by the dotted line) and around 593% more expensive than the cheapest prepaid 1GB from Egypt at USD 1.13. South Africa’s 35th place ranking places it amongst the more expensive countries in the RAMP Index sample. Zimbabwe has the most expensive 1GB at USD 30, which is approximately 282% more expensive than South Africa’s cheapest 1GB.
Figure 13: RAMP Index cheapest prepaid mobile 1GB data prices for 50 African countries in USD (Q2 2018)
Source: RIA RAMP Index and data submissions to the Commission (2019)

51
145. In addition to the benchmarking research for African countries, RIA also present comparisons for 1GB prices within the SADC region. Figure 14 below presents the cheapest prepaid mobile 1GB data prices for the SADC countries for the latest quarter, Q2 2018.161 RIA included the prices (in USD) of the cheapest 1GB data offer from the largest operators within each country. Using the latest RIA data, it shows that South Africa’s 1GB price of USD 7.84 ranks it 9th of the 14 SADC countries, placing it among the more expensive SADC countries. The price of
161 RIA’s RAMP index pricing database includes prices for 14 SADC countries, while no prices are available for Comoros and Seychelles.162 RIA (2017) SA data prices static for two years but consumers not flocking to cheapest product offering, Policy Brief no. 3 2017, p.8163 RIA have indicated that these countries were chosen based on market size (from economy size and population base), as well as pricing competition among operators.164 USD prices for 1GB prepaid data are converted to respective domestic currency prices for each indicated quarter (using quarterly average exchange rates from Investing.com, available at: https://za.investing.com/currencies/usd-ghs-historical-data). The CAGR is taken for each country to indicate the price changes over the 10 quarters.
1GB data in South Africa is around 6.5 times (or 559%) more expensive than in Namibia, which is the cheapest SADC country with a price of USD 1.19. Of the SADC countries reported, the figure shows Zimbabwe ranks as the most expensive 1GB price, at USD 30, which is almost 4 times more expensive than the 1GB price in South Africa. The comparison of 1GB prepaid data prices within the SADC countries therefore places South Africa’s price as one of the more expensive countries, although not the most expensive.
146. In the 2017 RAMP Index study162, RIA also compared South Africa to five other countries that it refers to as “…some of the most dynamic telecommunications markets in Africa…”163 Here South Africa’s cheapest 1GB prepaid data prices are compared (in USD) to Egypt, Tanzania, Ghana, Nigeria and Kenya. Along this country selection, for Q1 2016 to Q2 2017, South Africa ranks last as its data prices are the most expensive. We have updated this assessment to include RIA’s pricing information for the same comparator countries up to and including Q2 2018.
147. Table 4 below indicates that the cheapest 1GB price in South Africa is between two
to seven times more expensive than Egypt, Tanzania, Ghana and Nigeria. Table 4 below also shows that from Q1 2016 to Q2 2018, the USD prices of 1GB prepaid data indicate that South Africa’s prices showed slight increases over the period, on a compound annual basis, while the other countries’ prices decreased. When looking at each country’s domestic 1GB prices,164 these prices also display a decrease over the period, while South Africa’s prices have remained flat. This data indicates that the observed trends are not a product of exchange rate effects over the period, in that South Africa has performed unfavourably against these other countries over time.
Figure 14: Cheapest prepaid mobile 1GB data prices for SADC countries in USD (Q2 2018)
Source: RIA RAMP Index and data submissions to the Commission, 2019

52
148. Using RIA’s RAMP index data, we have conducted a historical comparison of South Africa’s prices for 1GB of data against other African countries over a longer time period – Q2 2014 to Q2 2018165. RIA’s database contains observations for 12 African countries over this entire period: Botswana, Cameroon, Ethiopia, Ghana, Kenya, Morocco, Mozambique, Namibia, Nigeria, Rwanda, Tanzania and Uganda. This comparison over time is illustrated in the Figure 15 below, and what it shows is that South Africa generally ranks above the median price for all 13 countries, particularly in the later part of the period (from Q4 2015 onwards).
165 RAMP Index, 2018, adapted with further RIA RAMP Index data submitted to the Commission (25 January 2019).166 These results are not driven by exchange rate effects as the results for these countries show the same trend when accounting for the domestic prices and exchange rates over the period.
149. This figure shows that South Africa’s prices have typically been poorer than the majority of African countries in the sample. More importantly, when looking at South Africa’s prices as a percentage of the median price, it shows that South Africa has performed increasingly poorly over time relative to the other countries. Thus even to the extent that one could argue that South Africa’s ranking at any point in time is meaningless in that it is driven by country-specific factors or differences in quality, the figure below shows that South Africa’s relative performance has declined over time, which is a cause for concern and strong evidence that prices in South Africa are higher than they should be.166
Q12016
Q2 2016
Q32016
Q42016
Q12017
Q2 2017
Q32017
Q42017
Q12018
Q2 2018
CAGR
Egypt 3.1 2.8 2.8 1.7 1.4 1.2 1.7 1.7 1.1 1.1 -10%
Tanzania 6.0 0.9 2.4 3.0 2.3 2.3 2.9 2.3 2.2 2.2 -10%
Ghana 3.9 3.9 2.5 2.5 2.3 2.3 2.7 2.7 2.7 2.6 -4%
Nigeria 5.1 4.9 3.2 3.2 3.2 3.1 2.9 2.8 2.8 2.8 -6%
Kenya 5.0 5.0 5.0 5.0 4.9 4.9 4.9 2.9 2.5 2.5 -7%
SA 6.3 6.6 7.0 7.1 7.5 7.6 7.5 7.3 8.3 7.8 2%
Table 4: Cheapest prepaid 1GB data prices in South Africa and five other large African markets (USD prices per GB)
Source: RIA Policy Brief no.3 (2017) and calculations based on RIA submission to the Commission (2019) as well as exchange rate data.
Figure 15: Comparison of 1GB price for SA against 12 African countries (Q2 2014 to Q2 2018)
Source: RIA RAMP Index and data submissions to the Commission, 2019

53
150. Over the period Q2 2014 to Q2 2018, Figure 16 below shows the deterioration in South Africa’s ranking against these countries, where it placed 5th cheapest of the 13 countries in Q4
167 These results are not driven by exchange rate effects as the results for these countries show the same trend when accounting for the domestic prices and exchange rates over the period.
2014 and recently only ranked 12th cheapest (or second most expensive) of the 13 African countries since Q4 2017.
151. When considering a wider sample of African countries in RIA’s RAMP index, the available price data for 1GB is limited to the period Q3 2015 to Q2 2018. According to the RAMP index, there are 42 African countries that have prices for a 1GB of mobile prepaid data across this time period. Figure 17 below shows that from the period Q3 2015 to Q4 2016, South Africa ranks below or on par with the median price of the 42 African countries. Since Q1 2017, however, South Africa’s 1GB price has ranked higher than the median price, which indicates an increase in its 1GB price relative to the wider group of countries.167
152. This figure points to South Africa’s performance being generally worse than most African countries in the sample. Even within this larger sample of African countries, it is clear from South Africa’s price as a percentage of the median price that South Africa has performed increasingly poorly relative to its African peers over time. This is consistent with the Figure 15 above and equally suggests that 1GB data prices in South Africa are higher than they should be.
Figure 16: SA rank for 1GB price against 12 African countries (Q2 2014 to Q2 2018)
Source: RIA RAMP Index and data submissions to the Commission, 2019

54
153. Over the period Q3 2015 to Q2 2018, Figure 18 below shows the deterioration in South Africa’s ranking against these countries, where it placed 13th cheapest within the 42 countries
in Q3 2015 and recently ranked 32nd and 31st within this larger group for Q1 and Q2 2018 respectively. South Africa has performed increasingly poorly relative to its African peers.
Figure 17: Comparison of 1GB price for SA against 41 African countries (Q3 2015 to Q2 2018)
Source: RIA RAMP Index and data submissions to the Commission, 2019
Figure 18: SA rank for 1GB price against 41 African countries (Q3 2015 to Q2 2018)
Source: RIA RAMP Index and data submissions to the Commission, 2019

55
154. In an earlier 2014 study by RIA,168 another index named the African Broadband Value for Money Index (which has since been discontinued) measured operators according to more than only price, as average speed was also considered. The index measured the monthly prepaid 1GB price (in USD) in relation to quality, which was based on the average download/upload speed (in kbps) divided by the 1GB basket price. The index represented a dataset of selected large operators, for which both speed and price data was available, across 14 African countries where higher scores for the speed/price ratio indicate higher value for money.169 In terms of performance according to the speed/price measurement, Vodacom South Africa ranked best out of the local players with 9th place out of the 30 operators across the covered African countries for Q2 2014. MTN South Africa ranked 15th place and Cell C ranked 19th place. South Africa ranked 8th out of the 14 countries. This suggest that South Africa may perform better when a quality aspect such as speed is taken into account, although when this assessment was conducted by RIA, South Africa was still outperformed by a number of countries. It is also important to note that in terms of pricing, South Africa ranked 10th out of the 14 countries in the same period (Q2 2014) and thus the result is not necessarily significantly different. As noted above, South Africa’s ranking has deteriorated over time since 2014.
155. In summary, RIA research generally highlights the high price of prepaid mobile data prices in South Africa when compared to other African countries. RIA’s research suggests that, particularly in recent times, South Africa’s prices for 1GB of data have been higher than the majority of its African peers. Most notably, South Africa has performed increasingly poorly relative to other African countries in recent years, which provides a strong indication that data prices are in fact too high in South Africa. When considering a measure of quality – speed – the evidence suggests that South Africa would compare more favourably against it African peers, although on the speed-price ratio, it was still outperformed by other African countries in 2014.
168 RIA (2014) SA broadband quality drops but prices remain high, Policy Brief no. 3 2014, p.3169 The countries include: South Africa, Mozambique, Nigeria, Ghana, Tanzania, Kenya, Uganda, Senegal, Ethiopia, Cote d’Ivoire, Botswana, Namibia.170 Fin24. ‘#DataMustFall: Government interference will drive data prices up, FMF’. [Online]. Available at: https://www.fin24.com/Tech/News/ datamustfall-government-interference-will-drive-data-prices-up-fmf-20170810 [Accessed on 10 November 2017]171 MyBroadband is a South Africa technology news website offering IT industry news and insights.172 MyBroadband (2016) #DataMustFall mobile prices misleading. [Online]. Available at: https://mybroadband.co.za/news/cellu lar/180730-datamustfall-mobile-prices-misleading.html [Accessed on 12 November 2017]
156. Once more, Frontier Economics, on behalf of Vodacom, appears to reach a different conclusion on the RIA data. However, as with the ICASA comparisons, it would seem this is primarily a difference in interpretation whereby Frontier Economics believes that average rankings are not a cause for concern. In addition, it seems that Frontier Economics has not had regard to the complete set of RIA data and comparisons. Appendix E provides a detailed discussion of the Frontier Economics submissions, including the RIA data discussion.
#datamustfall and MyBroadband
157. The #DataMustFall campaign gained popularity in 2016 largely off the back of an inaccurate comparison of mobile data prices across South Africa, Namibia, Nigeria and India. The comparison shows how South Africans were being charged a price of R149 per GB whereas the price was R11 per GB in India, R22 in Nigeria, and R32 in Namibia.170 The accuracy of these reported figures raised questions regarding their sources, which remains unknown. In addition, further information on how comparator countries were selected, how the data was standardised and how the 1GB prices were chosen is not stated and, as such, are all unknown factors in this study.
158. Subsequent reports (which also do not provide the above-mentioned details), including an article from MyBroadband171, came out correcting the figures and providing an apparently more accurate picture.172 The corrected figures (see Table 5 below) still convey the idea that South Africa’s 1GB mobile data price is higher when compared to countries like India, Nigeria and Namibia, where the 1GB cost from Vodacom South Africa, for example, is around three times as much as the 1GB offer from Airtel in India. The comparison in the table below does, however, convey a more accurate view of mobile data prices listed at the time (as at 26 September 2016) in these countries. MTN South Africa’s 1.5GB prepaid package for R160, for instance, comes out cheaper than Namibia’s MTC 1.5GB package for R219.

56
159. Frontier Economics, on behalf of Vodacom, has criticised the use of data pricing comparisons across countries primarily on the basis that it either fails to take into account differences in non-price factors such as the quality of the networks, or other factors such as differences in demand or labour costs. It is for this reason that they argue South African prices are expected to perform worse relative to other African countries as quality is higher.
160. As a result, rather than contest the actual comparisons outlined above, Frontier Economics has focused on determining if data prices in South Africa perform better when attempting to make adjustments for these factors. In so doing, it undertakes two exercises, one related to an alleged ‘value-for-money’ index and another related to GDP per capita. As these exercises are lengthy and complex, and also subject to confidentiality claims, we deal with them in detail in Appendix E. However, in summary we find the following:
160.1. On value-for-money, Frontier Economics undertakes an exercise using the GSMA MCI as a measure of value-for-money and seeks to re-evaluate relative prices adjusting for this factor. However, as discussed in detail in Appendix E, the MCI measure is not a measure of value-for-money but rather a measure of the enabling environment for mobile internet, including factors such as labour skill levels over which MNOs have no influence.
160.2. On GDP per capita, Frontier Economics seeks to evaluate prices adjusted for GDP per capita to determine if South African prices are in line with or below the level predicted by statistical correlations of pricing and GDP per capita. However, as we discuss in detail in Appendix E, there is a lack of a theoretical basis for a relationship between data prices and GDP per capita. Because there are a number of ways in which GDP per capita may affect data prices, the expected direction of the relationship is also unclear. The data presented by Frontier reflects the lack of clarity about the relationship and there are many contradictions about the direction of the relationship throughout their report. Furthermore, based on price data from the ITU, this relationship is not large. Therefore, comparing South Africa’s actual prices to the predicted price based on a linear statistical relationship between data prices and GDP per capita is inappropriate.
Conclusions on prepaid mobile
161. In summary, the existing international comparisons on mobile prepaid data prices collectively show that South Africa currently performs poorly relative to other countries. The ITU data shows that South Africa ranks poorly when compared to dollar-based prepaid data prices (in PPP) across a worldwide selection of countries, as well as being considerably more expensive than the cheapest offers. Tarifica’s
Prepaid Mobile Data PricesOperator Country Data Package Price
Vodacom South Africa 1GB R149
MTN South Africa 1.5GB R160
Telecom Namibia Namibia 1GB R139
MTC Namibia 1.5GB R219
Airtel India 1GB R50
Vodafone India 1GB R61
MTN Nigeria 1.5GB R43
Globacom Nigeria 2GB R43
Table 5: SA’s prepaid data prices compared to four developed players performed (26 September 2016)
Source: Adapted from MyBroadband, 2016 (see footnote 172)

57
most recent benchmarking report highlights South Africa’s poor performance in the ‘data-only’ prepaid market, suggesting these results are driven by the larger operators and that there exists scope for improvement for prepaid data services in South Africa. ICASA’s latest tariff report on price benchmarking indicates an underperformance by South Africa, where most results highlight South Africa’s prices as expensive compared to other countries. The latest benchmarking data from RIA also shows that South Africa performs unfavourably against other African countries, where its 1GB data price ranks among the more expensive countries in the RAMP index dataset.
162. As discussed above, conducting benchmarking studies can be challenging and complex. However, despite these challenges, the studies covering the current performance of SA’s prepaid mobile data prices relative to other countries (across global, BRICS and African country groupings) strongly suggest that South Africa performs poorly, even if its prices are not the worst. Importantly, the analysis over time using the RIA data provides a strong sense that even if rankings themselves are subject to these concerns of benchmarking studies (as noted here), the analysis over time disproves this somewhat and shows that South Africa performs increasingly poorly over time relative to other African countries.
3.2.2. Data prices of mobile post-paid broadband products
163. This section covers the available, although limited, benchmarking evidence comparing South Africa’s mobile post-paid data prices to other countries. The comparisons are generally based on the prices of a 1GB post-paid package (mobile or computer-based) and exclude OOB post-paid charges.
173 ITU (2017) ICT Prices 2017 report. Available at: https://www.itu.int/en/ITU-D/Statistics/Documents/publications/misr2017/IPB2017_E.pdf [Accessed on 23 August 2017]174 The same ITU methodology for mobile prepaid data applies to the post-paid data
International Telecommunications Union
164. As indicated in the previous section, the ITU collects prices for post-paid computer-based mobile broadband plans with a data allowance of 1GB per month across 188 countries.173 The post-paid plans require a SIM card-enabled USB dongle to be plugged in to a computer, with a data validity period of 30 days. The ITU collects the prices of the cheapest post-paid plans from the mobile operator with the highest market share in each selected country.174 The limitations of the ITU’s post-paid benchmark data should also be acknowledged and include the consideration of the cheapest offers from operators with the highest market share (and not all offers), and that the 1GB package recorded by the ITU is limited to a SIM card-enabled USB dongle plugged into a computer. It is thus a data-only product rather than a hybrid product with data, voice and messaging services.
165. Notwithstanding these limitations, the 2017 ICT Prices report shows that South Africa’s cheapest post-paid 1GB monthly contract price is USD 5.10, which ranks 20th cheapest out of the 188 countries, where the country rankings are based on the USD price for 1GB. Sri Lanka ranks first place as the cheapest post-paid 1GB, costing USD 1.80, and Gambia ranks as the most expensive country with a price of USD 62.24. Figure 19 below shows that when adjusting the USD prices for purchasing power, as done with the mobile prepaid prices, South Africa ranks 32nd out of the 169 countries for which PPP prices were recorded, with a price of USD 12.58. The cheapest post-paid 1GB price, in PPP terms, is offered in Cambodia at USD 5.03, while South Sudan charges the most expensive price at USD 258.09. South Africa’s cheapest post-paid 1GB price, in PPP terms, is 150% more expensive than the cheapest offer in Cambodia.

58
166. The ITU’s post-paid price data for the BRICS countries is shown in Figure 20 below. The figure shows that South Africa had the cheapest price in 2016 for 1GB post-paid data at USD 12.58
(PPP), while Brazil offered the most expensive 1GB among the BRICS countries at USD 32.79 (PPP).
167. Within ITU’s global sample of countries, the 1GB mobile post-paid data prices in 2016 for the African countries are shown in Figure 21 below. The prices are adjusted for the purchasing power across countries. The figure indicates that South Africa’s price of USD 12.58 (PPP) ranks as the 7th cheapest price out of 45 African countries, and therefore within the lower post-paid data prices in the African sample.
The cheapest country in Africa, according to the ITU data, is Nigeria at USD 9.24 (PPP), while the most expensive African country (as well as the most expensive country within the global sample) is South Sudan with a 1GB price of USD 258.09 (PPP).
Figure 19: Mobile post-paid data prices in USD (PPP), 1GB (2016)
Source: adapted from ITU ICT 2017 Prices report
Figure 20: Mobile post-paid data prices for BRICS in USD (PPP), 1GB (2016)
Source: adapted from ITU ICT 2017 Prices report

59
168. In general, the ITU data from the ICT Prices report indicates that South Africa’s relative performance of post-paid data-only data prices, across the global, BRICS and African country groups, is notably better than its benchmarking
175 Tarifica (2017) Global Benchmark Report- Study of Consumer Mobile Tariffs Q2 2017. Submitted on 9 October 2018, p.11
performance for its mobile prepaid data prices. This is presented in the Table 6 below, where South Africa’s more favourable country rank per sample selection for its 2016 post-paid data prices is evident.
Tarifica
169. As mentioned in the mobile prepaid data section, Tarifica releases a quarterly Global Benchmark Report illustrating the relative pricing of both mobile prepaid and post-paid services around the world. This section looks at the results regarding South Africa’s performance in the prices for post-paid data services, which includes country rankings for mobile post-paid plans combining voice, SMS and data, as well as data-only rankings. For Tarifica’s ‘data-only’ post-paid user profiles, a light user uses 500MB on 3G or better speeds, a moderate user uses 2GB on 3G or better speeds and a heavy user uses 8GB on 4G.175
170. Tarifica’s benchmark results for mobile post-paid plans among the 25 countries, as seen in Table 7 below, show that South Africa ranks 16th best for post-paid data plans, slightly better than its 17th rank for its prepaid data plans. This overall rank is based on an average performance score across offers with a mixture of prepaid voice/SMS/data, offers with prepaid voice/SMS, and offers with prepaid data only. For Tarifica’s ‘data-only’ user profiles, South Africa generally performs better than its prepaid ‘data-only’ plans, ranking 2nd best for post-paid light data-only users, 7th best for moderate data-only users and 14th best for heavy data-
Figure 21: Mobile post-paid data prices for African countries in USD (PPP), 1GB (2016)
Source: adapted from ITU ICT 2017 Prices report
Sample selection 500MB Prepaid Rank 1GB Post-paid RankGlobal
(169 countries)*131/169 32/169
BRICS 5/5 1/5
African(45 countries)*
34/45 7/45
Table 6: South Africa’s rank for ITU prepaid and post-paid data prices (USD, PPP) across three samples (2016)
Source: adapted from ITU ICT 2017 Prices report *The global samples for prepaid and post-paid data prices do not cover the same country selection, as the countries are selected based on
available USD (PPP) prices. This also applies to the African country samples.

60
only users.176 Tarifica notes, in their ‘Analysis’ section, that South Africa has many different post-paid plan structures where the rankings suggest that South Africa’s heavy user ‘data-only’ plans fair worse than the moderate and light user ‘data-only’ plans, as noted with its
176 We note that a price dataset by Tarifica shows that some of the countries that outperform South Africa in the moderate and heavy user categories, while ranking worse than South Africa for light users, do not offer 500MB ‘data-only’ offers, which could imply these rankings are subject to the availability of comparable offer sizes across countries.177 Tarifica (2017) Global Benchmark Report- Study of Consumer Mobile Tariffs Q2 2017. Submitted on 9 October 2018, p.22178 Tariffic has closed its operations as of April 2018.179 Tariffic! (2016) The Tariffic Perfect Package Tracker- Q32016: #Datamustfall Edition. [Online]. Available at: https://www.tariffic.com/blog/ the-tariffic-perfect-package-tracker-q3-2016 [Accessed on 14 November 2017].The report is referenced on the following link: http://www.bizcommunity.com/Article/196/545/151725.html180 The criteria for the inclusion of Kenya and Australia is not clear.
pre-paid performance.177 For the light user post-paid ‘data-only’ plans, Tarifica indicates that South Africa’s 2nd place ranking suggests the country’s operators are very price competitive in this category.
Tarrific!
171. In 2016, a local research company (at the time) 178called Tariffic! released a price comparison report on data contract prices179 across BRICS-
member countries (Brazil, Russia, India, China), as well as Kenya and Australia.180 While we have not been able to review the original report, it appears the methodology behind the research involved identifying post-paid data
Table 7: Tarifica overall ranking of mobile post-paid plans (Q2 2017)
Source: adapted from Tarifica Global Benchmark Report, Q2 2017
Ranking Country Average Performance
Light User (data only)
Moderate User (data only)
Heavy User (data only)
1st United Kingdom 2.67 6 1 4
2nd Pakistan 3.44 4 3 6
3rd Turkey 4.44 11 6 2
4th France 5.56 9 2 3
5th Sweden 5.67 15 4 1
6th India 6.11 5 11 17
7th Australia 6.33 12 8 5
8th Nigeria 9.00 1 5 10
9th Germany 10.11 13 10 8
10th Singapore 10.33 7 13 9
11th Mexico 11.67 14 15 22
12th Thailand 11.89 8 9 7
13th Spain 12.00 10 14 15
14th Kenya 14.00 3 12 11
15th Brazil 14.22 16 17 18
16th South Africa 15.11 2 7 14
17th South Korea 15.78 18 18 23
18th United States 16.67 19 16 19
19th Qatar 18.89 21 20 16
20th Malaysia 19.89 22 21 20
20th Bahrain 19.89 20 19 12
22nd Oman 21.56 17 24 24
23rd Kuwait 22.00 24 22 13
24th Saudi Arabia 23.44 23 23 21
25th United Arab Emirates 24.33 25 25 25

61
prices for Q3 2016 from ‘leading’ MNOs181 in the other countries, which were then compared against the average data contract prices across all the South African operators.182 In addition to converting the prices of various data contracts to Rands,183 Tariffic! rebased all figures to a cost of living measure to make the results more comparable across countries.184
172. Tariffic!’s analysis is said to show that, after adjusting for currency and the cost of living, South Africa’s 1GB, 2GB and 3GB data contract prices were the second highest (or second most expensive) within the group during Q3 2016.185 Brazil ranked as the worst performer with the highest data contract prices across the country selection. Tariffic! stated that South Africa’s contract data prices during Q3 2016 were 134% higher, on average, than the cheapest prices in the group.186
#datamustfall and MyBroadband
173. As noted previously, the call for data prices to fall in South Africa gained momentum following a 2016 comparison of incorrect mobile data prices charged in South Africa, Namibia, Nigeria and India. Following the popularity of the results across social media platforms, news articles started to report on more accurate data prices, which also included a tabled comparison of the 1GB post-paid prices charged by operators
181 The measurement involved in determining the ‘leading MNOs’ is not stated in the report reference.182 The specific details regarding this calculation are not provided in the report reference.183 The information regarding the currency conversion and exchange rates used are not provided in the report reference.184 The specific details regarding the rebasing calculation are not provided in the report reference.185 Tariffic! (2016) The Tariffic Perfect Package Tracker- Q32016: #Datamustfall Edition. [Online]. Available at: https://www.tariffic.com/blog/ the-tariffic-perfect-package-tracker-q3-2016 [Accessed on 14 November 2017]186 The actual post-paid prices are not provided in the report reference.187 MyBroadband (2016) #DataMustFall mobile prices misleading. [Online]. Available at: https://mybroadband.co.za/news/cellu lar/180730-datamustfall-mobile-prices-misleading.html [Accessed on 30 October 2017]188 The news reports do not provide methodology-related information or details.
(at the time) within the above-mentioned countries.187 Although more accurate prices have been reported, a weakness of the #datamustfall meme-related reports concerns basic details regarding the underlying research methodology not being provided or made available.
174. The Table 8 below, as part of one of the reports188, shows that Vodacom South Africa charged R75 for a 1GB post-paid data package in 2016, which is 47% more expensive than the cheapest post-paid 1GB offered in India for R51 (by Airtel) at the time. The most expensive post-paid 1GB at the time was found in Namibia, from Telecom, with a price of R149 (which is 98.6% more expensive than South Africa’s price in 2016). Between the prepaid data prices in Table 5 and the post-paid data prices in Table 8, it seems that South Africa’s operators, at the time, had lower-priced 1GB post-paid packages relative to their prepaid 1GB packages, where the other countries’ operators did not show such significant price differences (if any) between their prepaid and post-paid 1GB offers. For instance, in 2016 South Africa (Vodacom) charged R75 for a 1GB post-paid package, but charged R149 for the prepaid package which is almost 50% more than the post-paid price.
Post-paid Mobile Data PricesOperator Country Post-paid Data Package Price
Vodacom South Africa 1GB R75
MTN South Africa 1.5GB R79
TelecomNamibia
Namibia 1GB R149
MTC Namibia 1.5GB R219
Airtel India 1GB R51
Vodafone India 1GB R51
MTN Nigeria 1.5GB R43
Globacom Nigeria 2GB R43
Table 8: SA’s post-paid mobile prices compared to four developed players (2016)
Source: Adapted from MyBroadband, 2016 (see footnote 172)

62
Conclusions on post-paid mobile
175. The ITU data shows that South Africa’s relative performance of post-paid data prices, across the global, BRICS and African country groups, is notably better than its benchmarking performance for its mobile prepaid data prices, although South Africa is still considerably more expensive than the cheapest country from the global sample. For Tarifica’s ‘data-only’ user profiles based on Q2 2017 pricing data, South Africa generally performs more favourably in its post-paid offers (more so than with its prepaid prices), ranking 2nd best for post-paid light ‘data-only’ users. The #datamustfall and MyBroadband information also suggests that South Africa’s post-paid packages are better priced than its prepaid offers. Tarrific!’s analysis from 2016, however, indicates that South Africa’s cheapest post-paid data offers for 1GB, 2GB and 3GB ranked as the second most expensive prices in the comparator group and also came in considerably more expensive than the cheapest prices in the sample.
176. Overall, the above research on price comparisons for mobile post-paid data suggests that South Africa generally performs better in its prices for post-paid mobile services relative to its performance in prepaid prices. However, despite South Africa’s better post-paid performance relative to prepaid data prices, the benchmarking evidence does point to relatively expensive post-paid prices in South Africa, at least in certain segments.
3.2.3. Fixed broadband prices
177. The section below covers the available benchmarking studies on fixed broadband (mainly residential) prices. The fixed broadband studies include a global price benchmarking report by the ITU, a recent global study by Cable and BVA BDRC Continental, and the latest tariff report by Point Topic. An older, basic price comparison study by MyBroadband is also covered.
International Telecommunications Union
178. In addition to the mobile-cellular and mobile broadband pricing data, the ITU also collect global prices data on fixed data, which is
189 ITU (2017) ICT Prices 2017 report, p.18. [Online]. Available at: https://www.itu.int/en/ITU-D/Statistics/Documents/publications/misr2017/ IPB2017_E.pdf [Accessed on 23 September 2018]190 In addition to the PPP conversion, the ITU also expresses the fixed broadband prices as a percentage of GNI per capita- not reported here.191 The ITU report only has recorded PPP$ prices for 172 of the full 195 country sample (23 countries have no PPP$ values).
termed fixed-broadband sub-basket prices in its latest ICT Prices report.189 The ITU fixed-broadband sub-basket refers to the monthly price for an entry-level fixed-broadband plan with a minimum monthly data allowance of 1GB, for a minimum advertised download speed of 256 kilobits per second (kbit/s). As with the ITU’s mobile data prices, the fixed data prices are converted to US dollars, as well as PPP dollar values (based on World Bank data) to adjust for purchasing power across the selected countries.190 For the fixed data prices, the ITU also captures the advertised download speeds and monthly data allowance for each plan.
179. Out of the 195 countries included in the ITU’s fixed broadband services comparison, 194 have recorded USD prices for fixed data plans, where South Africa’s fixed broadband sub-basket, with a cap of 1GB data per month at 1.0 Mbit/s, ranks 78th place at a monthly price of USD 18.29. Along the USD price metric, Syria Arab Republic ranks 1st place with a price of USD 1.74 for unlimited monthly fixed data at a speed of 0.3Mbit/s while the most expensive unlimited fixed data offer is from Central African Republic at USD 487.35, also with a speed of 0.3Mbit/s. Figure 22 below shows that when the rankings from the ITU fixed data prices are ordered from lowest to highest based on USD PPP prices (to account for the cost of living differences across countries) South Africa ranks 111th out of 172 countries with a price of USD 45.13 (PPP) for 1GB fixed data at 1.0Mbit/s.191 The figure shows Mauritius is the top-ranked country for fixed data with USD 5.13 (PPP) for a 2GB data cap with a speed of 0.5Mbit/s, and Chad is ranked as the worst country with a price of USD 874.39 (PPP) for unlimited data with 0.3Mbit/s
180. These ranking results based on the ITU’s pricing data seem to indicate that the relative prices for fixed data offers are not driven by quality aspects (such as the data speed) or the size of the fixed data allowance per month. For example, South Africa’s 1GB fixed data offer at a relatively low speed of 1.0Mbit/s comes at a price of USD 45.13 (PPP), while the United Kingdom offers 12GB fixed data per month at a higher speed of 17Mbit/s for a price of USD 7.55 (PPP), which is almost six times cheaper

63
than South Africa’s price. These observations also apply to the benchmarking outcomes when comparing the prices of the fixed data offers amongst BRICS and African countries, as discussed below.
181. The ITU’s fixed data prices (and their accompanying speeds) for the BRICS countries are shown in Figure 23 below. The figure shows that South Africa had the highest price in 2016 for 1GB fixed data at USD 12.58 (PPP) with the lowest speed of 0.3Mbit/s, while
192 ITU. 2017. ICT Prices 2017 report, p.20. [Online]. Available at: https://www.itu.int/en/ITU-D/Statistics/Documents/publications/misr2017/ IPB2017_E.pdf [Accessed on 23 September 2018]
Russia offered the most affordable fixed data plan (with unlimited data) among the BRICS countries at USD 16.69 (PPP) with the highest speed of 30Mbit/s.192 In terms of the data sizes of the fixed plans, Russia and China offered unlimited fixed data plans, while Brazil’s offer included 50GB, India’s included 1.5GB and South Africa’s allowed 1GB per month. South Africa could thereby be viewed as charging the highest price in 2016 for the smallest fixed data plan, with the lowest speed, among the BRICS countries.
Figure 22: Fixed data prices in USD (PPP), minimum 1GB data cap per month (2016)
Source: adapted from ITU ICT 2017 Prices report
Figure 23: Fixed data prices for BRICS in USD (PPP), minimum 1GB data cap per month (2016)
Source: adapted from ITU ICT 2017 Prices report

64
182. Within ITU’s global sample of countries, the fixed data prices in 2016 for the African countries are shown in Figure 24 below. The prices are adjusted for the purchasing power across countries. The figure indicates that South Africa’s price of USD 45.13 (PPP) ranks as the 7th cheapest price of the 44 African countries, and therefore within the lower post-paid data prices in the African sample. The cheapest country in Africa, according to the ITU data, is
193 ITU (2017) ICT Prices 2017 report, p.21. [Online]. Available at: https://www.itu.int/en/ITU-D/Statistics/Documents/publications/misr2017/ IPB2017_E.pdf [Accessed on 23 September 2018]194 Cable.co.uk. (2018) Worldwide Broadband Price Comparison- Methodology. [Online]. Available at: https://s3-eu-west-1.amazonaws.com/ assets.cable.co.uk/broadband-speedtest/worldwide-broadband-price-comparison-2018%E2%80%93press-release.pdf [Accessed on 10 November 2018]195 Data downloaded from Cable.co.uk website. [Online]. Available at: https://www.cable.co.uk/broadband/deals/worldwide-price-compari son/ [last viewed on 08 April 2019]
Mauritius at USD 5.13 (PPP) with a speed of 0.5 Mbit/s, while the most expensive African country (as well as the most expensive country within the global sample) is Chad with a fixed data price of USD 874.39 (PPP) with 0.3Mbit/s. Despite a price decline in average fixed data prices in Africa since 2008, the ITU note that Africa’s average fixed broadband prices as a region remain the highest of all regions covered in their benchmark study. 193
Cable and BVA BDRC Continental
183. A 2018 study by Cable and BVA BDRC Continental compared the prices of residential broadband packages from 196 countries, including South Africa, to determine the cost of broadband across the world and thereby provide a ‘big-picture’ view of worldwide broadband prices.194 Over 3,351 individual, monthly residential broadband packages were tracked from all countries with readily available broadband pricing. The price of the most basic package at each speed level was extracted from ‘primary’ fixed line providers for each country (which is referred to as a provider that is widely available in each country). All these packages were then compiled to create the average cost of broadband per month in each country. The fixed residential broadband prices,
for either ADSL or fibre-based packages, were converted to USD for comparability, using real time exchange rates at the time of the study.
184. The Cable and BVA BDRC Continental study revealed that Sub-Saharan Africa fares as the worst region, with most of its 31 countries in the more expensive half of the rankings. South Africa’s average cost of broadband per month is listed as USD 55.25, which ranks the country’s price at 93rd out of 196 counties. South Africa’s average broadband cost of USD 55.25 compares favourably to the average cost of USD 73.31 across all countries.195 The average broadband cost is, however, around 1,005% more expensive than the cheapest average broadband cost in Ukraine of USD 5.0. At the worst end of the rankings, Mauritania has an average broadband cost of USD 768.16.
Figure 24: Fixed data prices for African countries in USD (PPP), minimum 1GB data cap per month (2016)
Source: adapted from ITU ICT 2017 Prices report
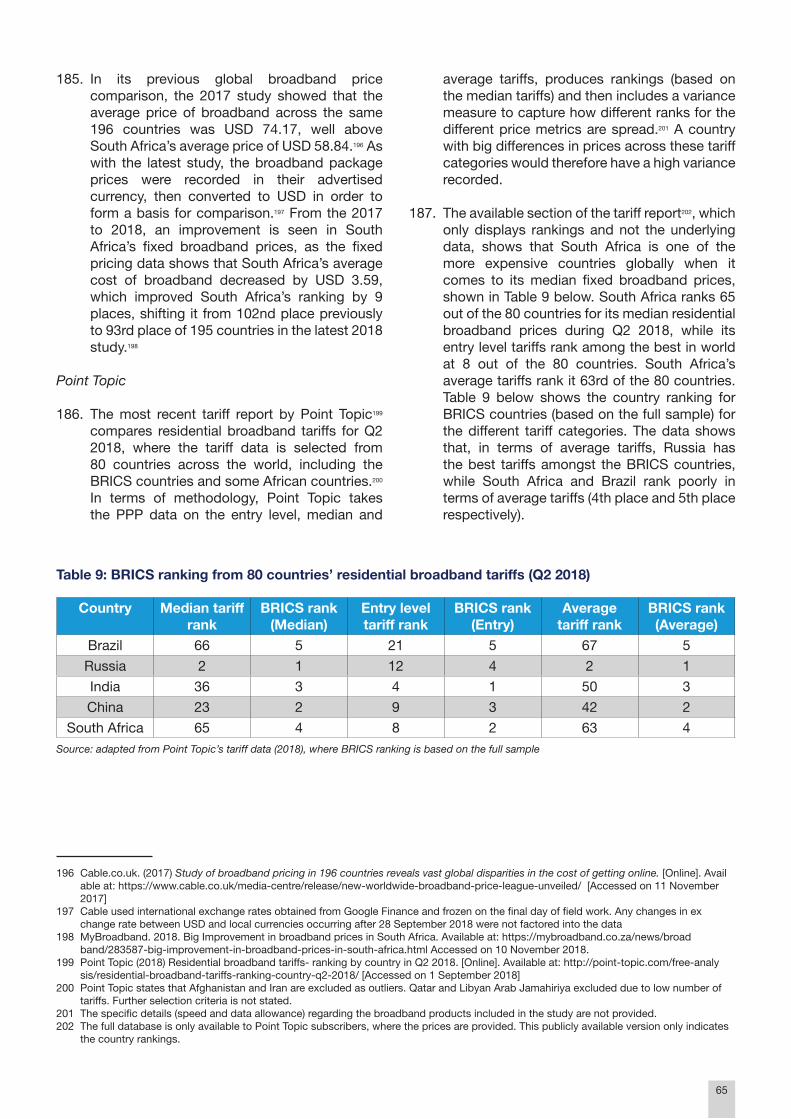
65
185. In its previous global broadband price comparison, the 2017 study showed that the average price of broadband across the same 196 countries was USD 74.17, well above South Africa’s average price of USD 58.84.196 As with the latest study, the broadband package prices were recorded in their advertised currency, then converted to USD in order to form a basis for comparison.197 From the 2017 to 2018, an improvement is seen in South Africa’s fixed broadband prices, as the fixed pricing data shows that South Africa’s average cost of broadband decreased by USD 3.59, which improved South Africa’s ranking by 9 places, shifting it from 102nd place previously to 93rd place of 195 countries in the latest 2018 study.198
Point Topic
186. The most recent tariff report by Point Topic199 compares residential broadband tariffs for Q2 2018, where the tariff data is selected from 80 countries across the world, including the BRICS countries and some African countries.200 In terms of methodology, Point Topic takes the PPP data on the entry level, median and
196 Cable.co.uk. (2017) Study of broadband pricing in 196 countries reveals vast global disparities in the cost of getting online. [Online]. Avail able at: https://www.cable.co.uk/media-centre/release/new-worldwide-broadband-price-league-unveiled/ [Accessed on 11 November 2017]197 Cable used international exchange rates obtained from Google Finance and frozen on the final day of field work. Any changes in ex change rate between USD and local currencies occurring after 28 September 2018 were not factored into the data198 MyBroadband. 2018. Big Improvement in broadband prices in South Africa. Available at: https://mybroadband.co.za/news/broad band/283587-big-improvement-in-broadband-prices-in-south-africa.html Accessed on 10 November 2018.199 Point Topic (2018) Residential broadband tariffs- ranking by country in Q2 2018. [Online]. Available at: http://point-topic.com/free-analy sis/residential-broadband-tariffs-ranking-country-q2-2018/ [Accessed on 1 September 2018]200 Point Topic states that Afghanistan and Iran are excluded as outliers. Qatar and Libyan Arab Jamahiriya excluded due to low number of tariffs. Further selection criteria is not stated.201 The specific details (speed and data allowance) regarding the broadband products included in the study are not provided.202 The full database is only available to Point Topic subscribers, where the prices are provided. This publicly available version only indicates the country rankings.
average tariffs, produces rankings (based on the median tariffs) and then includes a variance measure to capture how different ranks for the different price metrics are spread.201 A country with big differences in prices across these tariff categories would therefore have a high variance recorded.
187. The available section of the tariff report202, which only displays rankings and not the underlying data, shows that South Africa is one of the more expensive countries globally when it comes to its median fixed broadband prices, shown in Table 9 below. South Africa ranks 65 out of the 80 countries for its median residential broadband prices during Q2 2018, while its entry level tariffs rank among the best in world at 8 out of the 80 countries. South Africa’s average tariffs rank it 63rd of the 80 countries. Table 9 below shows the country ranking for BRICS countries (based on the full sample) for the different tariff categories. The data shows that, in terms of average tariffs, Russia has the best tariffs amongst the BRICS countries, while South Africa and Brazil rank poorly in terms of average tariffs (4th place and 5th place respectively).
Country Median tariff rank
BRICS rank (Median)
Entry level tariff rank
BRICS rank (Entry)
Average tariff rank
BRICS rank (Average)
Brazil 66 5 21 5 67 5
Russia 2 1 12 4 2 1
India 36 3 4 1 50 3
China 23 2 9 3 42 2
South Africa 65 4 8 2 63 4
Table 9: BRICS ranking from 80 countries’ residential broadband tariffs (Q2 2018)
Source: adapted from Point Topic’s tariff data (2018), where BRICS ranking is based on the full sample

66
188. When extracting the tariff rankings for the African countries within the sample, Table 10 below indicates that South Africa’s entry level tariffs are the best amongst the 8 African countries. South Africa’s median and average tariffs rank it 3rd and 4th best of the African countries respectively. Mauritania performs the worst
203 MyBroadband (2015) Are South Africa’s ADSL and fibre prices really that high? Available at: https://mybroadband.co.za/news/broad band/130254-are-south-africas-adsl-and-fibre-prices-really-that-high.html [Accessed on 11 November 2017]204 The article does not state the criteria for the country selection.205 The articles lists the following exchange rates used: 1USD=12.15ZAR; 1AUD=9.43ZAR; 1GBP=19.20ZAR; 1NZD=8.35ZAR.206 The study does not state how the operators and their prices were selected, as it is unclear whether the cheapest offers were included in the comparison or what the ‘total monthly price’ is comprised of.207 MyBroadband (2015) ‘Are South Africa’s ADSL and fibre prices really that high?’ [Online]. Available at: https://mybroadband.co.za/news/ broadband/130254-are-south-africas-adsl-and-fibre-prices-really-that-high.html [Accessed on 11 November 2017]208 The total monthly price reflects monthly data subscription charges, which appears to exclude set-up costs (although not clearly stated).
amongst the African countries, as its ranking is last across the median, entry and average tariff categories. Of all the 80 countries, Venezuela has the lowest median broadband prices for the period, followed by Russia and Ukraine. Mauritania is again ranked last with the highest median prices for residential broadband.
My Broadband study
189. An international benchmark study203 conducted by MyBroadband in 2015 compared South African fixed broadband prices to four developed players namely, the United States, United Kingdom, Australia and New Zealand.204 The fixed broadband prices across the four developed countries were converted to Rands using exchange rates at the time.205 The benchmark exercise included fixed broadband monthly data with different of speeds ranging upwards from 3Mbps and data from 50GB to unlimited data. 206
190. The exercise, although a basic comparison, revealed that South Africa’s local fixed broadband prices at the time were more or less in line with international prices for low-end packages, but relatively expensive when compared to the other countries’ high-end packages (see Table 11 below).207 For example, Telkom, at the time, offered a fixed broadband service in South Africa which included 50GB at 10Mbps for a price of R699, which is just 1.6%
higher than the same data allowance offered by Telstra (in Australia) at a slower speed of 8Mbps. In terms of a high-end package comparison, Telstra offered 200GB data with a speed of 100Mbps for R1,037 per month, whereas Telkom offered the same package for R1,799, which is 73.5% more expensive than Telstra’s offer at the time. These results should be considered alongside the weaknesses in this comparison, which includes missing details regarding the methodology as it is unclear how the operators and their prices were selected.
191. In conclusion, aside from the noted limitations, the available studies comparing South Africa’s fixed broadband prices to other countries, seem to indicate that South Africa’s prices for low-end fixed broadband packages are more comparable to other countries while its high-end packages are more expensive relative to other countries. Broadly, the benchmarking outcomes point to South Africa performing poorly when its broadband prices (notably its average and median fixed prices) are benchmarked against a global country sample
Country Median tariff rank
Africa rank (Median)
Entry level tariff rank
Africa rank (Entry)
Average tariff rank
Africa rank (Average)
Tunisia 19 1 27 2 57 2
Egypt 44 2 59 5 31 1
Algeria 69 4 72 6 69 6
Morocco 71 5 42 4 68 5
Senegal 72 6 75 7 62 3
Sudan 74 7 34 3 72 7
Mauritania 80 8 79 8 77 8
South Africa 65 3 8 1 63 4
Table 10: African country ranking from 80 countries’ residential broadband tariffs (Q2 2018)
Source: adapted from Point Topic’s tariff data (2018), where African country rankings are based on the full sample of 80 countries

67
or against the BRICS countries, as it shows in most cases that South Africa is one of the more expensive countries globally. The exception is the Cable and BVA BCRC Continental study. When compared to the smaller sample of African countries, however, South Africa tends to show a relatively more favourable performance in terms of its fixed broadband prices. However, these countries tend to have undeveloped fixed line markets and also perform poorly by global standards on the pricing of fixed line infrastructure.
3.3. Preliminary Findings
192. This section offered a review of the available international research comparing data prices in South Africa to other countries, with the
aim of providing a simple and effective cross check on the general level of prices in the data services market in South Africa. The bulk of the benchmarking reports focus on the 2017 to 2018 period, while this section has also included some of the historic data prices covering the 2014 to 2018 period.
193. The existing market research covering the comparison of South Africa’s mobile prepaid data prices relative to other countries (across global, BRICS and African country groupings) shows that South Africa’s prepaid data prices perform poorly, where its prices often rank among the more expensive countries. When assessing South Africa’s benchmark performance over time, the analysis of RIA’s data shows that, beyond country rankings
Country Operator Speed Data Total Montly Price208
Australia Engin 20Mbps 50GB R424
US Comcast 3Mbps Unlimited R425
Australia Engin 20Mbps Unlimited R519
UK Unlimited Broadband 17Mbps 10GB R576
New Zealand Vodafone 10Mbps 80GB R576
New Zealand Vodafone 40Mbps 80GB R576
New Zealand Vodafone 100Mbps 80GB R576
UK Unlimited Broadband 17Mbps Unlimited R672
UK Unlimited BT Infinity 76Mbps Unlimited R672
Australia Telstra 8Mbps 50GB R688
South Africa Telkom 10Mbps 50GB R699
New Zealand Vodafone 10Mbps Unlimited R743
New Zealand Vodafone 40Mbps Unlimited R743
New Zealand Vodafone 100Mbps Unlimited R743
Australia Engin 50Mbps 100GB R754
South Africa Telkom 20Mbps 50GB R790
US Comcast 25Mbps Unlimited R814
UK Unlimited BT Infinity 38Mbps Unlimited R826
Australia Telstra 20Mbps 200GB R877
US Comcast 105Mbps Unlimited R960
South Africa Telkom 40Mbps 100GB R1,028
Australia Telstra 100Mbps 200GB R1,037
Australia Telstra 20Mbps 500GB R1,066
South Africa Telkom 10Mbps Unlimited R1,188
South Africa Telkom 20Mbps Unlimited R1,787
South Africa Telkom 100Mbps 200GB R1,799
South Africa Telkom 40Mbps Unlimited R2,587
Table 11: SA Broadband prices compared to four developed countries (2015)
Source: adapted from Point Topic’s tariff data (2018), where African country rankings are based on the full sample of 80 countries

68
themselves, South Africa’s prepaid data performance has deteriorated in recent years relative to other African countries. Importantly this result would not be influenced by the country-specific factors that detractors of price benchmarking exercises usually point to, and therefore reinforces the finding that South Africa performs relatively poorly compared to other countries in respect of prepaid data prices.
194. The benchmarking outcomes for South Africa’s mobile post-paid data prices against the global, BRICS and African country groups appears improved relative to South Africa’s prepaid data rankings. This general outcome is evidenced in the data from ITU, Tarifica and information from #datamustfall meme-related reports and MyBroadband studies. Although South Africa’s price rankings are generally better for mobile post-paid data prices (relative to the prepaid comparisons), research evidence, particularly from ITU and Tarrific!, still shows that South Africa’s post-paid data prices are significantly higher than the cheapest country prices.
195. In reviewing the available benchmarking studies on fixed broadband prices, the information shows that South Africa may have more comparable prices for its low-end fixed packages relative to other countries, whereas its high-end fixed packages are priced higher than many other countries. South Africa generally ranks unfavourably when benchmarked against a global country sample.
196. Across the categories of mobile and fixed data prices, the current available benchmarking evidence illustrates that South Africa underperforms relative to other countries and this is particularly true for mobile data prices, and prepaid prices specifically. Within mobile data services, the existing studies indicate that the prepaid segment is where the most room for improvement exists as South Africa performs relatively poorly in the mobile prepaid segment with its data prices often being ranked among the more expensive countries within a study. This is also relevant to the next section, which examines the structure of mobile pricing and finds that low volume, prepaid package pricing is considerably inferior to higher volume packages.
69
197. As set out in the ToR for the inquiry, this inquiry was initiated following the Minister’s concerns relating to high data costs in South Africa and the importance of data affordability for the South African economy and consumers. In order to help address the Minister’s concerns, the Commission published a CfS (see Section 1.2 for details on the CfS) to ask stakeholders to make submissions on the effects of data services challenges on consumers and businesses in low-income, under-developed, or rural areas in South Africa.
198. Furthermore, the Commission held public hearings into the high cost of data on 17-19 October 2018. In preparation for the public hearings, the Commission sent a notice regarding public hearings containing key questions to guide submissions by stakeholders. As part of the key questions on the notice, the Commission sought to understand the impact of data prices on poor consumers. In addition, the team invited stakeholders to propose remedies that can aid or reduce data prices for poorer consumers. The Commission received written submissions from stakeholders addressing these questions prior to making oral submissions at the public hearings.
199. Several of the submissions made by stakeholders in response to the CfS and in their written submissions for the public hearings as well as oral submissions at the public hearings suggest that data prices paid by low-volume consumers in South Africa are higher on a ‘per megabyte basis’ than data prices paid by high-volume consumers and this has a negative impact on low-volume consumers. As low volume consumers are likely to be poor consumers, this pricing structure effectively penalises the poor.
209 Amandla.mobi submission dated 01 November 2017210 Amandla.mobi’s submission also represented 44,726 people who signed their names in support of the submission. The people signed their names in petition for data prices to fall211 Amandla.mobi submission dated 01 November 2017212 R2K, launched in August 2010, is a coalition of organisations and activists across South Africa focusing on issues of information access, secrecy, surveillance, media and communication rights and freedom of expression.
200. In this section we do not consider the overall level of data prices in South Africa (the focus of this report more broadly), but we consider the specific observation noted by stakeholders and accepted by MNOs that, when looking at headline prices, low-volume consumers tend to pay much higher prices for data than high-volume consumers on a ‘Rand per megabyte’ measure.
4.1. Submissions on pricing to low-volume consumers
201. This section summarises the relevant views expressed by Amandla.mobi, the Right2Know campaign (R2K), DG Murray Trust (DG MT), RIA, Media Monitoring Africa (MMA), the Internet Service Providers Association (ISPA), Afrihost, the African National Congress (ANC), and the four operators.
202. Amandla.mobi, a civil society organisation with a membership base of 131,000 claimed that “The Poor Pay many times more for data than the rich and fail to benefit from competition.”209 210 In its submission, Amandla.mobi stated that there is research work it is aware of showing that low income consumers are purchasing data in much smaller quantities than 1GB. Such research is said to be suggesting that these consumers are buying in quantities as low as 20MB to 30MB, while some of the consumers are using mobile data without buying data bundles. Amandla.mobi argued that it is prices of small data bundles and OOB prices that affect the poor.211
203. R2K212 also raised concerns about the cost of data in South Africa by stating that data prices in South Africa are unaffordable to almost half of South Africans the majority of which fall within the low-income bracket of R6,400 – R3,201 per month and the very low income bracket of R3,200
4. THE STRUCTURE OF DATA PRICES AND ANTI-POOR PRICING

70
per month and below. R2K contends that the perceived high cost of data limits the extent to which low-income consumers, rural consumers, small businesses and the unemployed can conduct tasks that would otherwise require extra money and time, such as applying for jobs, receiving offers, work-related transactions, and crime prevention. As such, the high cost of data limits the benefits that can be derived by these consumers from being connected.
204. In addition, in its presentation to the Commission’s public hearings, RIA indicated that low-income earners pay significantly higher proportions of their disposable income to access telecommunication services. RIA further argued that the cost of internet is creating barriers to connecting the low-income earners with 50% of South Africans, the 50% being those in the lower income brackets, not having access to the internet.
205. DG MT started its presentation by quoting statistics from Statistics South Africa (Stats SA) showing that 55% of South Africans live below the poverty line. DG MT went on to state that despite Government’s vision of connecting 100% of South Africans to broadband services at not more than 2.5% of the population’s monthly income, with just over a year to go (as at the day of the presentation), “over half of South Africans still spends 15-40% of their income to buy a modest 1GB of mobile data.213” According to DG MT and Amandla.mobi, low income consumers in South Africa often buy data in small quantities as low as 20MB to 30MB. Putting this in perspective, DGMT argued that consumers who often pay R12 for a bundle of just 30MB of data, effectively pay an exorbitant R400/GB.
206. DG MT argues that wealthier individuals who qualify for post-paid contracts of the other hand pay approximately half the price paid by pre-paid users for 1GB of mobile data and receive even greater discounts when purchasing more data. DG MT estimates that low income consumers, “who pay R12/MB (equal to R400/GB) often pay 10-30 times more for their data than wealthier individuals that, for example, can afford to buy 100GB (valid for 1 year) at a time for R16/GB”214 (emphasis added).
213 DGMT’s PowerPoint presentation for the public hearings. Slide 9214 DGMT’s PowerPoint presentation at the public hearings. Slide 10215 ISPA’s presentation at the public hearings. Slide 3216 Minister of Telecommunications and Postal Services, Dr. Siyabonga Cwele (13 March 2018) cited in ISPA’s presentation at the public hearings. Slide 4217 Cell C’s presentation at the public hearings held on 17-19 October 2018. See Day 2 transcripts, p.199, line 1-6218 MTN’s presentation at the public hearings held on 17-19 October 2018. See Day 2 transcripts, p.82, line 20
207. In addition, DG MT noted that poorer South Africans are vulnerable to excessive OOB data rates as they are most likely to run out of data because mobile operators normally promote certain data bundles with short validity periods which makes it more likely that users will end up using very expensive OOB data.
208. ISPA’s position was based on benchmark studies that are available in the public domain. Based on such benchmarks, ISPA contends that it is not disputed that mobile data is more expensive for lower income groups in South Africa.215 In support of its contention, ISPA relied on a quote by the Minister of Telecommunications and Postal Services which reads as follows: “We have a strange market where it costs the poor more to access data than it costs the rich.”216
209. It appears from the above that there are two general claims made by stakeholders in relation to the structure of data pricing: 1) prices for low-volume data bundles are higher than prices for high-volume data bundles on a per gigabyte basis and 2) the poor spend a greater proportion of their income on data. Cell C argued that the question should not be whether the low-income consumers are paying more for data than high income consumers because those disparities will always exist since different categories of consumers have different levels of disposable income.217 MTN argued that poor consumers do not spend a higher proportion of their income on data because data from Stats SA shows that households at rural areas spend 2.7% of their income on communications services.218 However, even to the extent that poor consumers do not spend a greater proportion of their income on data, this could also be the result of data being unaffordable in itself. Thus this question (the second of the two claims above) is not relevant for the purposes of this Inquiry. Our focus thus remains on the first of the two claims above i.e. whether prices for low-volume data are higher than prices of high-volume data on a per gigabyte basis.
210. Before engaging in a detailed assessment of the claim, we consider the MNOs’ responses to this claim. Vodacom and Telkom agree that low

71
volume consumers pay more for data than high volume consumers, at least when considering headline prices, but they suggest that such trends are justified. Vodacom also suggested that low-income consumers have options to make data purchases more affordable. Cell C did not provide a direct response to the claim, but stated that the focus should be on determining the real price (or cost) of a MB of data.219 Once that is done, the correct regulatory framework must be imposed to make data affordable for poorer consumers (notwithstanding that the rich will also benefit).220 MTN refuted these claims and, like Vodacom, suggested that low-income consumers have options to make data purchases more affordable.
211. Telkom submits that although it may seem at a headline level that low volume bundles are priced significantly higher than high volume bundles on a per gigabyte basis, “the difference in those prices gets a bit narrow”221 when one considers that, according to Telkom, larger bundles normally expire before they get depleted whereas this is not the case with smaller bundles. Telkom concedes that this does not totally eliminate the gap but argued that there is an explanation for that. The explanation is that there is a cost difference in the delivery of small bundles and large bundles emanating from two things. Firstly, “a network is a very large fixed cost asset, so the more volume you’ve got in it, the lower the unit costs of a unit of output, in this case data.”222 Secondly, on the retail side, Telkom argues that although the process of selling small and large bundles is the same, there are economies of scale when selling larger volumes of data.
212. Vodacom also agreed that factually bundle rates decrease the larger the bundle volume one purchases by stating that: “In determining our pricing, we also look at bundle sizes. […] the bigger the bundle, the lower the rate.”223 However, Vodacom raised two interrelated points regarding relative pricing of data bundles of different sizes that are worth scrutinizing. Firstly, Vodacom argued that headline prices are not a good indicator of relative pricing (or
219 Cell C’s presentation at the public hearings held on 17-19 October 2018. See Day 2 transcripts, p.198, line 16-24220 Cell C’s presentation at the public hearings held on 17-19 October 2018. See Day 2 transcripts, p.199, line 1-6221 Telkom’s presentation at the public hearings held on 17-19 October 2018. See Day 2 transcripts, p.159, line 6222 Telkom’s presentation at the public hearings held on 17-19 October 2018. See Day 2 transcripts, p.159 (line 1-20)-160 (line 1-5)223 Vodacom’s presentation at the public hearings held on 17-19 October 2018. See Day 2 transcripts, p.15, line 6-7224 Vodacom’s presentation at the public hearings held on 17-19 October 2018. See Day 2 transcripts, p.15, line 12-16225 Vodacom’s presentation at the public hearings held on 17-19 October 2018. See Day 2 Transcript, p.15, line 7-9226 Vodacom stated that 80% of its pre-paid customers choose to buy hourly, daily, and weekly bundles.227 Vodacom’s presentation at the public hearings held on 17-19 October 2018. See Day 2 Transcript, p.50, line 6-9228 Vodacom’s presentation at the public hearings held on 17-19 October 2018. See Day 2 transcripts, p.20, line 5-11
price discrimination) between smaller and larger data bundles. Secondly, Vodacom suggests that a better and more effective way of doing this is to consider effective prices which take into account data consumption and consumer preferences.
213. In building up these points, Vodacom probed: “[…] the question is, what is the price of a gig? Is it R12 which we charge for an hour for a gig. R29 which we charge for a day, R79 for 7 days, R99 for 2 weeks or 30 days for R149 which is actually 2 gigs, so R75 a gig because you get a gig at night as well.”224 Vodacom then contended that there is a role played by the validity period for data. In this regard, Vodacom stated that “[…] the shorter the validity period, the lower the rate as well. So, hourly data, daily data, weekly data is cheaper than the monthly data.” 225
214. Vodacom contend that because of the low-price of short-validity data bundles, low volume consumers effectively pay lower prices for data than high-volume consumers who purchase longer validity bundles. As a result, according to Vodacom, this means that 80% of its customers226 have cheaper prices than some of the customers who buy larger bundles.227
215. When asked if the picture would be the same if small bundles and larger bundles with the same validity periods were compared to each other, Vodacom argued that one has to go beyond the headline prices when analysing prices of data and consider what is known as effective prices in the industry, which is the quotient of revenue from data sales and data traffic. Vodacom argues that because of promotional activity (e.g. Buy 1GB for R149 and get 1GB free to use at night, or buy 1GB valid for 1 day for R29, or buy 1GB valid for 1 hour at R12) coupled with personalised offers on the ‘Just-For-You’ promotions, customers are able to optimise such that the effective price paid is lower for low-income consumers than it is for high volume consumers.228

72
216. This view was shared by MTN who stated that dynamics in the pricing of data services have changed from the traditional price of, for example, R149 per GB valid for 30 days to what is called dynamic pricing which takes into account the usage patterns of data users. According to MTN, this has forced MNOs to introduce different pricing plans such as social bundles. For example, MTN has the WhatsApp bundle priced at R30 per GB, Vodacom has the same bundle at R29 per GB and Cell C’s one is priced at R17 per GB.229
4.2. Assessment
217. Although it is not immediately clear why the price differentials exist, or if this is a product of any concern or market failure, access to affordable data for all consumers is essential and in particular low-income consumers. Access to affordable data is important to low-income consumers because it can enable them to easily and cheaply embark on many activities such as job hunting, paying bills, transferring money, sharing and distributing information and crime prevention amongst other things.230 Without access to data, these activities require extra money to be carried out. Some stakeholders, such as MMA, consider data as a human right and advocate that it be thought of just like water and electricity,231 and every citizen should have free basic access to data.232
218. The views expressed by stakeholders as summarised above suggest that low volume consumers pay more for data than high-volume consumers on a per megabyte (per gigabyte) basis to the detriment of low-income consumers. In this section we conduct an analysis that seeks to establish:
218.1. Whether low-volume consumers pay more for data on a per-gigabyte basis than high-volume consumers. This is done in two ways: Firstly, in terms of headline prices (and the impact of low-cost short-validity bundles on prices), and secondly, in terms of effective prices where we look at actual usage for consumers of different volumes.
218.2. We also consider the potential reasons explaining these price differentials.
229 MTN’s presentation at the public hearings held on 17-19 October 2018. See Day 2 transcripts, p.99, line 3-21230 Right2Know submission dated 01 November 2017, p. 5231 MMA’s presentation at the public hearings held on 17-19 October 2018. See Day 1 transcripts, p.97, line 8-11232 MMA presentation at the public hearings held on 17-19 October 2018, slide 7233 We grouped this category because MNOs do not offer similar volumes of smaller data bundles. Cell C and MTN offer 20MB, Telkom offers 25MB, while Vodacom offers 30MB.
4.2.1.Headline prices: Do low-volume consumers in South Africa pay more for data services than high-volume consumers?
219. As discussed above, we are of the view that in order to conduct a like-for-like comparison, data bundles with the same validity periods have to be compared against each other, notwithstanding Vodacom and MTN’s reservations against this approach. Furthermore, we note that headline prices are an indicator of what the consumer pays because in making a decision on how much to spend on data or on the size of data bundle to buy, the consumer does not take into account effective prices of data but considers the headline price relative to his budget. Notwithstanding this we still consider effective prices further below.
220. Our first piece of analysis of headline prices considers data bundles with a validity period of 30 days. This analysis is conducted to test the veracity of the claim that low-volume bundles are priced higher than larger volumes on a per gigabyte basis, notwithstanding that MNOs did not refute the claim.
221. The small data bundles that we used in this analysis are the 20-30MB,233 50MB and 100MB. The larger sizes used are the 1GB and 2GB data bundles. In conducting the comparison, we convert the headline price of a small data bundle into price per gigabyte using the scale: 1GB = 1000MB. The headline price of the 2GB bundle was divided by two. For each of the bundle sizes, we took the price prevailing as at December 2018, which is the latest date for which data was collected.
222. The table below shows that indeed, the implied prices of low-volume bundles are significantly higher than the prices of high volume bundles. For example, the 5MB data bundle valid for 30 days costs 400% higher than a 1GB data bundle and 515% higher than a 2GB data bundle valid for the same period. This translates to at least 6 times higher than both the 1GB and 2GB data bundles.
223. The same picture is observed for the 20-30MB bracket, 50MB and 100MB which cost from 95% up to 362% higher than the 1GB and 2GB data bundles. The price differentials have

73
persisted for a long period of time as shown in the figures below.
224. Figure 25 below depicts the spread, in absolute Rand terms, between the implied price per GB of a 100MB data bundle and the headline price of a 1GB data bundle for each operator. The spread shows the extent to which the implied price per GB of a 100MB data bundle exceeds the headline price of a 1GB data bundle.
225. The figure shows that the spread is consistently wider and stable for both MTN and Vodacom. For Vodacom, this spread decreased from R211 to in July 2014 to R141 for the rest of the period when Vodacom reduced the price of its 1GB data bundle from R279 to R149. For MTN, the spread widened from R141 in March 2015 to R190 for the rest of the period. This was due to MTN raising the price of its 1GB bundle from R149 to R160.
226. For Cell C the spread can be observed to have increased over time to eventually catch up with that of Vodacom from January 2017 until the end of the observed period. The reason for this is that Cell C gradually increased the price of the 100MB data bundle over the years to be more aligned with those of MTN and Vodacom. At the beginning of the period, the implied price per GB of Cell C’s 100MB data bundle was only R1 rand higher than the price of 1GB which was
priced at R149. The spread widened over time to R41 between January 2015 and May 2016, R101 between June 2016 and January 2017 and eventually caught up with that of Vodacom at R141 for the rest of the observation period.
227. For Telkom, the spread was R120 between January 2014 and July 2015. The spread increased to R191 when Telkom dropped the price of its 1GB from R180 to R99 in August
% higher than 1GB % higher than 2GB
5MB 20-30MB 50MB 100MB 5MB 20-30MB 50MB 100MB
Cell C 236% 115% 95% 302% 157% 133%
MTN 400% 275% 213% 119% 515% 362% 285% 169%
Telkom 193% 193% 193% 317% 317% 317%
Vodacom 168% 236% 95% 221% 302% 133%
Table 12: The extent to which the implied prices of smaller bundles (i.e. 5MB, 10MB, 50MB, & 100MB) in South Africa exceed the prices of larger bundles (i.e. 1GB & 2GB) (Dec 2018)
Source: adapted from Point Topic’s tariff data (2018), where African country rankings are based on the full sample of 80 countries
Figure 25: The extent to which the implied price/GB of a 100MB bundle exceeds the price of 1GB bundle (Jan 2014 - Nov 2018)
Source: Tarifica, operators’ catalogues, websites and online sources

74
2015. Telkom’s wider spread relative to its competitors is not solely attributed to the price discrimination between smaller bundles and larger bundles, but mostly to the significant reduction of the price for a 1GB data bundle. Had Telkom not reduced the price, its spread would be amongst (if not) the lowest.
228. Figure 26 and Figure 27 depict the spread using the 50MB and the 20-30MB data bundles respectively. Both figures confirm the picture observed above but further show that the discrimination is more skewed against smaller data bundles as the spread is wider the smaller the bundle.
229. The figures further show the result of Cell C increasing its prices of the 50MB and the 20MB over time. This move by Cell C suggest that its lower prices for smaller bundles were not beneficial to it versus what would appear to be a strategy to follow the larger operators more closely.
230. As discussed above, Vodacom argued that because of short validity bundles with lower
headline prices, low volume consumers pay less for data than high-volume consumers. In order to probe this claim, we compared the implied price per GB (computed from headline prices) of small data bundles with a short validity period with the headline price of a 1GB data bundle valid for a month for both MTN and Vodacom. The results of the analysis are shown in the tables below.
Figure 26: The extent to which the implied price/GB of a 50MB bundle exceeds the price of 1GB bundle (Jan 2014 - Nov 2018)
Source: Tarifica, operators’ catalogues, websites and online sources
Figure 27: The extent to which the implied price of 20-30MB bundles exceed the price of 1GB bundle (Jan 2014 - Dec 2018)
Source: Tarifica, operators’ catalogues, websites and online sources

75
231. The tables above show that the implied price per GB of most data bundles with shorter validity periods is higher than the price of a 1GB data bundle valid for one month for both MTN and Vodacom. For example a 25MB bundle valid for 1 day on the MTN network costs more on a per gigabyte basis that a 1GB data bundle valid for 30 days. The same is true for the 50MB valid for 7 days. Vodacom’s 20MB and 100MB data bundles also have higher implied prices per gigabyte than the 1GB data bundle valid for a month. Although the 15MB valid for 1 hour costs R133 on a per gigabyte basis, it is highly likely that a consumer buying this bundle will buy data bundles several times a month, which will make data more expensive for the consumer over a 30 day period. The same can be said about Vodacom’s 1GB valid for two weeks priced at R100.
232. This is therefore inconsistent with Vodacom’s claims that because of the low-price short-validity data bundles, low volume consumers would effectively pay lower prices for data than high-volume consumers who purchase longer validity bundles. The headline data presented above does not support this claim by Vodacom. Vodacom’s claim also relies on low-volume consumers purchasing erratically, or at least that the demand patterns of low-
234 At the time this data was collected there was no duration shorter than 1 day on Vodacom’s website.
volume consumers are very much intermittent rather than consistent or ‘every day’.
4.2.2. Effective prices analysis
233. Another critique of headline price comparisons advanced by Vodacom and MTN is that headline price comparisons fail to take into account consumer preferences. They state that the better and important metric for an analysis of price discrimination across data bundles is effective prices which can be derived by dividing total data revenue by total data traffic. The two MNOs argue that when effective prices are considered, the reality is that low-volume consumers pay lower effective prices than high-volume consumers.
234. Vodacom and MTN argue that MNOs use machine learning to study customer usage patterns and then embark on what they call dynamic pricing, also called personalised pricing or private pricing. Essentially, they use algorithms that create price offers for individual consumers based on a variety of factors such as the data consumption pattern of the consumer and capacity availability where the consumer is located, to mention just a few. This enables them to offer data bundles with lower validity periods at much lower prices. It is their argument that because many of their
Bundle validity price (Rand) MB Price/GB- 1 hour - - -
20MB 1 day234 5 20 250
100MB 7 days 17 100 170
1GB 2 Weeks 100 1,000 100
1GB 30 days 149 1,000 149
Table 13: Selected small bundle sizes with short validity periods versus 1GB valid for 30 days for Vodacom (Mar 2019)
Source: Calculations based on data collected from Vodacom’s website in March 2019
Bundle validity price (Rand) MB Price/GB15MB 1 hour 2 15 133.3
25MB 1 day 5 25 200
50MB 7 Days 10 50 200
1GB 2 Weeks 110 1,000 110
1GB 30 Days 149 1,000 149
Table 14: Selected small bundle sizes with short validity periods versus 1GB valid for 30 days for MTN (Mar 2019)
Source: Calculations based on data collected from MTN’s website in March 2019

76
customers (61% for Vodacom235 and 80% for MTN236) buy data on personalised offers, it shows that customers prefer dynamic pricing or to buy low-cost low-validity data bundles.
235. As stated above, our position is that headline prices are an indicator of what the consumer pays. In making a decision on how much to spend on data or on the size of data bundle to buy, the consumer does not take into account effective prices of data but considers the headline price relative to his budget. However, we conduct an analysis of effective prices below to show that even if we consider effective prices as Vodacom and MTN prefer, we find that low-volume consumers do not get better prices than high-volume consumers.
236. Our analysis of effective prices is based on sample data at an individual consumer level provided by the MNOs. This enables us to compare the effective prices for data of different categories of consumers classified by volume. The aim of this exercise is to test the proposition of MTN and Vodacom that low-volume consumers face lower effective prices than high-volume consumers.
237. For this analysis we used a detailed sample of consumer data provided by the MNOs. Given the claims regarding effective prices being lowest for low-volume (or poor) consumers that were made by MTN and Vodacom, and MTN and Vodacom being regarded as the largest operators, we have presented an assessment of the consumer data provided by each.
MTN
238. During the course of the inquiry MTN submitted a sample of consumer data containing 1,000,000 (one million) observations on data used by consumers on the MTN network across the country. The sample contains data from each month between February 2018 and July 2018. For this analysis we considered only pre-paid customers since it is pre-paid consumers who are more likely to comprise poor consumers. Furthermore, data revenue for post-paid consumers is partly estimated from revenue for a basket of products i.e. voice, SMS and data, and thus the allocated data revenue figures are estimated by the MNOs. In any event, pre-
235 Vodacom’s presentation at the public hearings held on 17-19 October 2018. See Day 2 transcripts, p.16, line 14-16236 MTN’s presentation at the public hearings held on 17-19 October 2018. See Day 2 transcripts, p.103, line 19-20237 110,309 observations were dropped because there was no information for July 2018. 1,048 observations were dropped because negative free data was reported. 2,439 observations were dropped because negative OOB rates were reported. Lastly, 2 observations where users used 50-100GB were dropped because they were considered as outliers. Excluding these observations does not affect the results of the analysis since the observations represent an immaterial proportion of the sample.
paid customers represent 95.6% of the sample provided by MTN. After further data cleaning, more observations were dropped,237 taking the sample used for the analysis to 848,447.
239. This analysis looks at the effective price paid by consumers of different volume (usage) classes to determine how low-volume users compare with high-volume users in terms of prices. In analysing the data, we grouped customers according to their monthly data usage, such as (i) no in bundle usage; (ii) 0-1MB; (iii) 1-5MB; (iv) 5-10MB, etc. as can be seen in the table below. In calculating effective prices, we computed the rate (effective price) for each consumer and then computed the average for all consumers falling into a usage category. We converted all prices into a per gigabyte basis and indexed them for confidentiality reasons. The results are presented in the table below.
240. We note that about 72% of the customers in the sample falls under the category which does not use in-bundle data and hence we did not analyse effective prices for this category. Moreover, some customers in the sample used very little in-bundle data of less than 1MB. For these customers, given their minimal usage, the effective in-bundle rate would be extremely high. Hence in order to be conservative we did not analyse effective prices for this category as well. This also affects the category of customers within the 1-5MB bracket, which although we used, we place less emphasis on it in our conclusions in order to be conservative.
241. Even after adopting a conservative approach, the analysis shows that it is not true that the effective prices on the MTN network are lower for lower-volume consumers, who are more likely to be poor, than they are for higher-volume consumers. For example, the table below shows that customers using between 5-10MB of in-bundle data face an effective price (index) of 2,156, which is more than 20 times the price of 100 faced by consumers in the 1-2GB bracket. All the rates decline the more the usage. They decline to 817 and 285 for the 10-20MB and 100-500MB brackets respectively and are even lower for greater usage. The same pattern is observed for data usage when free data is also included. As can be seen in the column reporting on data rate with free data, all smaller

77
usage brackets have a higher price index than the 1-2GB usage bracket. This is despite the fact that an examination of the data shows that free data in fact accounts for a larger share of consumption for lower-volume consumers according to the data provided by MTN.
242. Most of the users fall within the 100-500MB bracket. This means that most customers pay an effective price (indexed) of 2,421, 285, 381 and 273 per Gig on OOB rates, in-bundle rates, data without free data and data with free data respectively, all of which are considerably higher than the price of 100 in the 1-2GB bracket of in-bundle consumption. A further observation is that OOB prices are significantly higher than prices on all other types of usage.
238 8215 observations were dropped because they contained information on subscribers who paid for data but used less than 1MB of it. 14 observations were considered as outliers as they were for users who used 50-100GB. 624 observations were not considered because of missing payment information. Dropping these observations does not affect the results of the analysis since the observations represent an immaterial proportion of the sample.
Vodacom
243. During the course of the inquiry Vodacom submitted a sample of over 959,967 observations of data consumed by users on the Vodacom network. The data included information on OOB data and in-bundle data consumed for the period from January 2016 to August 2018. Of the total sample, 320,566 of the observations were for post-paid data and were thus not included in this analysis for the same reasons stated for MTN above.
244. After further data cleaning, more observations were dropped,238 leaving the ultimate sample considered for this analysis at 638,763 observations.
Data usage OOB price index**
In-bundle price index**
Price index for data
without free data***
Price index for data with free data****
Obser-va-tions
Percentage of sample
0 - - - - 608,807 71.8%
0-1MB - - - - 3,126 0.4%
1-5MB 2,972 5,829 3,932 2,187 4,675 0.6%
5-10MB 2,714 2,156 2,042 1,163 3,746 0.4%
10-20MB 2,742 817 1,021 583 11,612 1.4%
20-50MB 2,425 652 840 513 20,150 2.4%
50-100MB 2,277 460 607 399 23,059 2.7%
100-500MB 2,421 285 381 273 71,839 8.5%
500MB-1GB 2,619 136 191 152 36,762 4.3%
1-2GB* 2,544 100 135 112 39,022 4.6%
2-3GB 2,398 108 134 114 13,706 1.6%
3-5GB 2,270 113 142 125 8,195 1.0%
5-10GB 2,298 88 121 109 3,188 0.4%
10-50GB 2,113 74 85 81 560 0.1%
Total sample - - - - 848,447
Table 15: Effective data rates for various bands of data usage on the MTN network (indexed) (Feb 2018-Jun 2018)
Notes*Index explained – The index uses in-bundle consumption in the 1-2GB usage band as a base. The index indicates the positions of effective prices of different usage bands (e.g. 10-20MB) across different types of consumption (e.g. OOB) relative to the effective price of the 1-2GB usage band on the in-bundle consumption type which we use to represent the minimum for high-volume usage. In constructing the index, we set the price of the 1-2GB usage band of in-bundle consumption type at 100. We then computed the relative positions of the effective prices of all the other bands across consumption types to the 1-2GB bracket. The index is a pure number and has no unit of measurement. **OOB and In-bundle price index refers to the indexed effective prices of OOB and In-bundle rates respectively. For each usage band, the effective rates were computed by dividing the total revenue earned by total traffic.***Price index for data without free data refers to the indexed effective price of data without free data. Data without free data is the sum of OOB bundle and in-bundle data used by a subscriber. Therefore, the effective rate for this category divides the sum of OOB and in-bundle revenue by the sum of OOB and in-bundle traffic. ****Price index for data with free data refers to the indexed effective price of data with free data. The effective price of data with free data, is the sum of OOB and in-bundle data revenue (no revenue is earned on free data) divided by the sum of OOB, in-bundle, and free data traffic.

78
245. Following the methodology adopted for the MTN analysis above, we found that consumers in the smaller data usage bands face higher effective prices than consumers in the 1-2GB data usage band and larger.
246. As shown in Table 16, this is true for all the different types of consumption reported on (i.e. OOB, in-bundle and all data). Therefore, based on the sample consumer data considered, we
find that it is not true that low volume consumers pay lower effective prices on the Vodacom network than high volume consumers.
247. A further examination of the data as shown in Table 17 shows that low-volume consumers used a higher proportion of OOB data relative to in bundle data. Thus low-volume consumers and therefore poorer consumers are more exposed to the high OOB rates.
Share of OOB in data usage in data revenue in data usage in data revenueMTN (July 2018) Vodacom (July 2018)
0 [] [] [] []0-1MB [] [] [] []1-5MB [] [] [] []
5-10MB [] [] [] []10-20MB [] [] [] []20-50MB [] [] [] []50-100MB [] [] [] []100-500MB [] [] [] []500MB-1GB [] [] [] []
1-2GB* [] [] [] []2-3GB [] [] [] []3-5GB [] [] [] []5-10GB [] [] [] []10-50GB [] [] [] []
Table 17: Share of OOB data in total traffic and in total revenue on the MTN and Vodacom network
Source: Tarifica, operators’ catalogues, websites and online sources
Data usage OOB price index**
In-bundle price index**
Price index for all data***
Observations Percentage of sample
0 - - - 392,332 61.4%0-1MB - - - 9,120 1.4%
1-5MB 825 1,151 956 10,692 1.7%5-10MB 781 571 576 7,149 1.1%10-20MB 762 368 423 11,194 1.8%20-50MB 783 230 297 28,017 4.4%50-100MB 779 196 248 27,785 4.3%100-500MB 781 161 196 83,578 13.1%500MB-1GB 726 127 145 28,221 4.4%
1-2GB* 694 100 112 22,018 3.4%2-3GB 674 89 98 8,276 1.3%3-5GB 652 80 87 6,163 1.0%5-10GB 637 68 74 3,078 0.5%
10-50GB 549 51 55 1,140 0.2%Total sample - - - 638,763
Table 16: Effective prices for various bands of data usage on the Vodacom network (indexed) (Jan 2016-Aug 2018)
* Index explained – The index uses in-bundle consumption in the 1-2GB usage band as a base. The index indicates the positions of effective prices of different usage bands (e.g. 10-20MB) across different types of consumption (e.g. OOB) relative to the effective price of the 1-2GB usage band on the in-bundle consumption type which we use to represent the minimum for high-volume usage. In constructing the index, we set the price of the 1-2GB usage band of in-bundle consumption type at 100. We then computed the relative positions of the effective prices of all the other bands across consumption types to the 1-2GB bracket. The index is a pure number and has no unit of measurement.**OOB and In-bundle price index refers to the indexed effective prices of OOB and In-bundle consumption respectively. For each usage band, the effective rates were computed by dividing the total revenue earned by total traffic. Note that total traffic for both OOB and in-bundle consumption includes free data. Some free data is allocated to in-bundle consumption whereas other free data is allocated to OOB consumption by Vodacom. ***Price index for all data is the aggregate of all data consumption on the Vodacom network. This includes OOB and in-bundle consumption together with the free data allocated to each.

79
Figure 28: Vodacom’s indexed usage per subscriber
Source: Operators’ submission to the Data Inquiry
Figure 29: MTN’s indexed usage per subscriber
Source: Operators’ submission to the Data Inquiry
Figure 30: Telkom’s indexed usage per subscriber
Source: Operators’ submission to the Data Inquiry

80
4.2.3. Data usage per subscriber
248. The differential in pricing, with much higher prices to lower income consumers, would also appear to be one factor that has constrained usage growth amongst such consumers. The figures below compare usage per subscriber trends for pre-paid and post-paid (and hybrid where applicable) consumers on the Vodacom, MTN and Telkom networks respectively. Cell C did not provide data on the number of subscribers by plan type and are therefore not part of this analysis. To deal with confidentiality issues, all values are indexed with the starting value of prepaid as the base (100).
249. Usage per subscriber trends are more sluggish for pre-prepaid users and increase exponentially for post-paid consumers as shown below. This is consistent with the findings above that poor consumers face higher prices than wealthier consumers.
4.2.4. Reasons why data prices are high for low-income consumers relative to high income consumers
250. When the panel at the public hearings asked the MNOs why low-volume data bundles are priced significantly higher than high-volume bundles, Vodacom, MTN and Cell C did not provide a clear answer preferring rather to argue that such lower income consumers could do equally well on an effective price basis. Telkom argued effective price analysis revealed a smaller gap, but also stated the following:
250.1. Firstly, Telkom states that “a network is a very large fixed cost asset, so the more volume you’ve got in it, the lower the unit costs of a unit of output, in this case data.”239 In essence this amounts to a claim that the larger-volume customers are commercially more valuable to the operator due their impact on per-unit costs and thus lower prices are charged to the large-volume consumers in order to drive volumes.
250.2. Secondly, on the retail side, Telkom argues that although the process of selling small and large bundles is the same, there are economies of scale when selling larger volumes of data.
239 Telkom’s presentation at the public hearings held on 17-19 October 2018. See Day 2 transcripts, p.159, (line 1-20)-160 (line 1-5)
Volume argument
251. It does not follow that simply because there are scale effects at a network level that any price difference based on volume is justifiable.
251.1. First, volume is largely being driven by factors other than price. There is a rapid growth in demand for data services due to the spread of smart devices and a burgeoning supply of online content and services. This means growth is occurring irrespective of price and therefore will also bring down unit costs irrespective of price structure.
251.2. Second, even if the operators wish to incentivise consumers to make more use of data by selling larger packages at lower prices, no operator has been able to justify how this rationale warrants the multiple times higher prices for smaller packages that are clearly bought by lower income consumers. The approach has typically been to deny such a difference exists based on effective prices, which we find is not the case as outlined above.
252. What the Inquiry team suspects is that lower income consumers are being exploited with price differences that lack any objective rationale simply because they are poor, lacking in both income and alternative data service options. The implication is that these customers’ usage volumes do not necessarily increase as markedly in response to lower prices, which means operators are less willing to provide lower prices because it reduces total revenues. We outline this below:
252.1. Firstly, low-volume consumers are generally consumers with low income levels. Therefore they have relatively less disposable income with which to purchase data services. As such, their expenditure on data is seen as more of a necessity and thus largely confined to smaller data bundles which are more affordable in absolute terms relative to larger bundles. Profit-maximising MNOs are therefore more likely to decrease prices to higher-volume (richer) consumers who are more responsive to price changes. In effect, the decrease in prices to richer consumers are more than compensated for by the greater volumes purchased whereas the same may not be true for poorer consumers.

81
252.2. Secondly, low income consumers are more likely to be entirely dependent on mobile networks for internet services. Unlike the middle class and wealthier individuals, low-income consumers do not have alternatives to mobile data, such as fibre at home and broadband internet and Wi-Fi at the workplace. Wealthier individuals also often are given free Wi-Fi in restaurants and malls in which they shop. As a result of these occasional alternatives, wealthier consumers are more able to offload data consumption from the mobile network and therefore their usage will be more responsive to pricing. However, the lack of alternatives for low income consumers means their mobile data consumption is less responsive to prices.240
253. Our pricing analysis above is, to some degree, consistent with this. In the analysis, we observed that Cell C gradually increased its pricing of small bundles over time to almost match Vodacom and MTN. This could mean that Cell C did not benefit from keeping prices low and found it fit to lift prices to the level of its larger rivals. There must have been a limited negative volume response such that this decision was profitable.
254. However, just because there is some profit-maximisation rationale does not in fact justify the price differentials that exist. Part of that rationale hinges on exploiting those consumers with few alternatives – in effect an exploitation based on market power or a lack of constraints in respect of those customers. The other part of that rationale hinges on penalising poorer consumers simply because they are income-constrained – i.e. because they are poor. This too is socially and morally reprehensible. If these are the drivers of current market outcomes then there are clear concerns as to how the market is failing to deliver on better pricing to those most in need of it.
Transaction cost argument
255. Amandla.mobi argued that there is no economic nor technical reason for MNOs to discriminate pricing between low and high volume consumers. For this argument, Amandla.mobi
240 This observation of price elasticities for low-volume consumers could also more accurately explain Telkom’s reasoning above. It is per haps not that larger consumers are more valuable in and of themselves, but rather that larger consumers are more responsive to price changes and this volume response assists in utilising capacity. However, it is also consistent with simple profit maximising behaviour on the part of MNOs.241 Singh, R., and Sy-Changco, J. (March 2009) Buying less, more often: An evaluation of sachet marketing strategy in an emerging market. The Marketing Review, 2009, Vol. 9, No. 1242 Amandla.mobi’s presentation at the public hearings held on 17-19 October 2018. Day 1 Transcripts, p.11243 Amandla.mobi’s presentation at the public hearings held on 17-19 October 2018. Day 1 Transcripts, p.11244 Amandla.mobi’s presentation at the public hearings held on 17-19 October 2018. Day 1 Transcripts, p.10-11
relied on the phenomena of ‘sachet pricing’. Sachet pricing is a well-known phenomenon in economics and commonly applied in the marketing of fast moving consumable goods (FMCG). It relates to the marketing “strategy involving designing, packaging, and selling a product/service in a small pack size at an affordable price point to consumers.” 241
255.1. Although sachet pricing delivers the small packages at lower prices for consumers, the costs related to the design, packaging, and distribution of the to be product tend to be higher for smaller packages than for larger packages, thereby making the price per-unit higher for smaller packages than for larger packages. In such markets, price discrimination can be justified and the extent of the price discrimination can be measured to test for reasonableness.
255.2. Dr. De Lanerolle, on behalf of Amandla.mobi, argued that “with mobile data it’s very difficult to see any significant cost differences”242 in the delivery of smaller and larger data bundles. In his argument, Dr De Lanerolle made mention of one factor that could lead to such cost differences. This is, where smaller bundles are concerned, “a mobile operator has to send messages to tell you that your bundle has(sic) been activated and also to tell you, that it’s running out, or run out”243 as opposed to fewer SMSs where larger bundles are concerned. However, he argued that this would be immaterial as the costs of sending an SMS are very low.
255.3. Dr De Lanerolle also argued that even if cost differences existed and were anything to consider, the price differences prevailing in the mobile data market are too high to justify such. In this regard, he compared the mobile data industry with the FMCG industry. He showed that in the FMCG industry, a smaller packet of washing powder (250g) costs about double the price of a larger packet (5KG) on a per-KG basis.244 Contrary, in the mobile industry, considering data prices on Vodacom, smaller bundles (15MB)

82
cost unreasonably more than larger bundles (5 times a 1GB and 60 times a 10GB bundle) on a per gigabyte basis.245
255.4. Furthermore, in contrast to physical products such as washing powder, marginal costs or average variable costs for data services are unlikely to be much larger for smaller amounts of data or lower-volume consumers. The majority of costs in the telecommunication industry is the network costs, a fixed cost which is effectively shared across all purchases. Thus the cost differences in selling different sizes of data bundles is likely to be relatively small and unable to explain the huge differences in headline and effective pricing that we observe.
4.3. Preliminary Findings
256. The aim of this section was to probe the claim made by various stakeholders that the structure of data prices in South Africa is not favourable to poor citizens. Specifically, stakeholders claimed that that data prices price paid by low-volume consumers in South Africa are higher on a ‘per megabyte basis’ than data prices paid by high-volume consumers and this has a negative impact on low-volume consumers. From our assessment of this claim we made the following findings:
256.1. Using headline data prices of the four major MNOs, we found that it is true that prices of smaller data bundles are higher than the prices of larger data bundles on a per-megabyte basis in multiples of up to six times. This trend is observed to have persistent over a long period of time.
256.2. Using headline data prices, we compared low-volume data bundles of short validity against a 1GB data bundle valid for 30 days to test Vodacom’s claim that because of the low-price short-validity data bundles it offers, low volume consumers pay lower prices for data than high-volume consumers who purchase longer validity bundles. We found that this claim by Vodacom is not supported by headline pricing data.
256.3. Using effective prices (i.e. total revenue divided by total traffic) based on actual consumption from samples of prepaid consumers’ purchasing data, we tested
245 Amandla.mobi’s presentation at the public hearings held on 17-19 October 2018. Day 1 Transcripts, p.10-11
Vodacom and MTN’s claims that low-volume consumers pay less for data than high volume consumers when effective prices are considered. Vodacom and MTN argued that effective prices are a better and important measure of price levels than headline prices as they take into account data usage and consumer preferences. They argued that low-volume consumers faced lower effective prices. Despite our view that focusing on effective prices would be incorrect as these are unobservable to the consumer when making purchase decisions, our analysis of effective prices shows that low-volume consumers face the highest effective prices for both Vodacom and MTN.
256.4. If the claim by Vodacom and MTN that low-volume consumers pay less for data than high volume consumers was true (and that effective prices are a relevant consideration for consumer behaviour), we would expect data traffic to increase faster for low volume consumers (pre-paid) than for high volume consumers (post-paid). However, usage per subscriber trends are more sluggish for pre-prepaid users and increase faster for post-paid consumers, which is consistent with our finding that pre-paid consumers face significant higher prices than post-paid consumers.
256.5. We found that it is unlikely that the differences in pricing between low-volume and high-volume consumers can be explained by cost differences. Our view is that it is likely that such differences exist because low volume consumers are less price elastic than wealthier consumers because they have lower disposable income, and they do not have alternatives such as fibre at home, Wi-Fi and broadband at the workplace. This shows a material failure in the market and an exploitation of the lack of constraints faced by MNOs in pricing to these customers.
257. On the basis of these findings, we are of the view that the pricing structure for data in South Africa disadvantages poor consumers. As such, we are of the view that steps need to be taken to remedy this pattern of pricing. We deal with remedies in Section 8 below.

83
258. This section examines the causal role of particular cost drivers in the value chain on mobile data costs, and potentially prices. Operators, regardless of their market position, will seek to at least recover their costs, and these costs may be influenced by the competitive or regulatory environment. Interventions which serve to reduce cost structures have the potential to reduce prices if there exists sufficient price-based competitive pressure within the market to do so. Cost reduction strategies must therefore still take into consideration the competitive context if they are to succeed in reducing prices rather than simply enhancing the profitability of operators.
259. The submissions, public hearings and general public discourse around the mobile telecommunications sector in South Africa have clearly identified a lack of access to spectrum and facilities sharing as two areas which may be unnecessarily driving up costs to the detriment of mobile prices. Indeed, the ToR also identifies the costs faced by operators as a factor to be investigated by the Inquiry, including the current arrangements for sharing of network infrastructure and access to spectrum. However, in both cases there is also clearly a competition dimension as the allocation of spectrum and terms of access have the potential to impact on the extent of competition in the market. Appendix F provides a detailed discussion of spectrum and some of the drivers of the approach to assignment, whilst Appendices B and C touch on the role of facilities access and current policy in South Africa respectively. This section focuses on their cause of higher costs and policy direction going forward.
5.1. Spectrum
260. It seems to be common cause that the delays in digital migration and the release of high demand
246 Backhaul is the infrastructure that connects mobile base stations to the operator’s core network.247 Frontier Economics report (30 November 2017) (in Vodacom’s submission of 30 November 2017, Non-Confidential version), p.33
spectrum (“HDS”) to MNOs is unnecessarily driving up network infrastructure costs which may ultimately impact on mobile data price levels. It is also common cause that the spectrum assignment across different bands also impacts the cost structure of MNOs. We briefly touch on these aspects first.
261. In the context where the release of spectrum is imminent, the debate has shifted to how that spectrum will be assigned and the impact of such an assignment on both relative cost levels and competition. We examine where the process is at and the submissions made in the course of the Inquiry as to the direction of spectrum assignment.
5.1.1. Existing spectrum allocation raises costs
262. A common industry concern, evidenced from the submissions, is the limited access to spectrum for South Africa’s mobile operators. This is claimed to prevent operators from increasing their capacity to meet the growing demand for data or alternatively, forcing upon them more costly infrastructure rollout to compensate, which drives up costs. The operators have, both in their submissions to the Inquiry and in public discourse, called for more decisive action in addressing the current spectrum constraint in order to allow more effective competition and coverage expansion.
Limited spectrum
263. According to Vodacom, the ability of MNOs to supply mobile data is determined by a combination of the number of base stations, spectrum and backhaul capacity.246 In light of this, Vodacom argues that spectrum is important in the supply of mobile data.247 Vodacom further states that the quality of mobile data services offered by MNOs within their RAN and the costs thereof are determined by the
5.COST DRIVERS – SPECTRUM AND FACILITIES ACCESS ISSUES

84
total amount of spectrum available as well as the type of spectrum available. Vodacom also submits that South African MNOs only have access to 900MHz248, 1800MHz and 2100 MHz bands while MNOs in many other countries are assigned additional spectrum suitable for delivering 4G data services (700 MHz, 800MHz, and 2600MHz). Vodacom further submits that South African MNOs currently have limited spectrum compared to MNOs operating in other developed countries. For instance, even though there are issues with releasing spectrum in some countries in the European Union, Vodacom submits that [] than Vodacom in South Africa. Accordingly, Vodacom is of the view that South African MNOs will end up with even less spectrum (per mobile user) if there are any further delays in releasing new spectrum.249
264. In addition, Vodacom highlights that due to the limited access to spectrum, South African MNOs are already capacity constrained and this in turn is increasing the costs of supplying data due to the need to invest in more sites to expand capacity. In particular, Vodacom submits that “at present, the only low frequency spectrum that operators have access to, is in the 900MHz band. Since Vodacom still needs to offer 2G and 3G services, it does not have sufficient capacity to re-farm it for 4G”250. According to Vodacom, the implication of this is that Vodacom uses 1800MHz spectrum to offer 4G services. Vodacom however argues that it is more expensive to use 1800MHz spectrum to offer 4G services as more sites are needed due to the shorter range of higher frequency spectrum band. Vodacom further predicts that as data usage continues to increase, MNOs are likely to become “increasingly capacity constrained in the absence of additional high frequency spectrum”251. Vodacom argues that this would further increase costs as MNOs would need to invest in more sites and equipment in order to increase capacity.252
265. Cell C also argues that all the MNOs (except Telkom Mobile) are capacity constrained and
248 Mega Hertz249 Frontier Economics report (30 November 2017) (in Vodacom’s submission of 30 November 2017, Non-Confidential version), p.33-35250 Frontier Economics report (30 November 2017) (in Vodacom’s submission of 30 November 2017, Non-Confidential version), p.35251 Frontier Economics report (30 November 2017) (in Vodacom’s submission of 30 November 2017, Non-Confidential version), p.35252 Frontier Economics report (30 November 2017) (in Vodacom’s submission of 30 November 2017, Non-Confidential version), p.35253 Cell C submission dated 24 November 2017 (Non-Confidential version), p.16-17254 Stakeholders’ presentations at the public hearings held on 17-19 October 2018. See day 1 transcripts, p.26 and p.76; and Day 2 tran scripts, p.45 and p.62255 Gigahertz256 Telkom submission dated 17 November 2017 (Non-confidential version), p.19257 Telkom submission dated 17 November 2017 (Non-confidential version), p.19258 Radio propagation is the behaviour of radio waves as they travel from one point to another in the atmosphere.259 Telkom’s submission dated 17 November 2017 (Non-Confidential version), p.19260 Telkom’s submission dated 17 November 2017 (Non-Confidential version), p.19
they are unable to meet the growing demands on their networks. Cell C further submits that one way of increasing capacity in order to meet rising demand “is to acquire more spectrum, the other is to build more network infrastructure”253. The alternative therefore has cost implications.
266. Other stakeholders such as Research ICT Africa, DG MT, the ANC and A4AI are also broadly in agreement that South African MNOs are spectrum constrained and high-demand spectrum should be assigned as soon as possible to MNOs.254
The spectrum band assignment
267. Telkom submits that “there is currently an asymmetry in the assignment of low frequency spectrum (i.e., spectrum below 1GHz255) between the various mobile operators in South Africa”.256 According to Telkom, ”the only International Mobile Telecommunications (“IMT”) band currently available below 1 GHz (i.e. 900MHz band) has been fully assigned to Vodacom, MTN and Cell C”257 with Telkom not holding spectrum within this band. Telkom further states that different frequency bands have different propagation characteristics258 “and this has significant economic implications for network operators”.259 Telkom explains that “lower frequency bands propagate further than high frequency bands. It therefore costs less to provide coverage over large areas using lower frequency bands than using higher frequency bands. Lower frequency bands also penetrate buildings more effectively which improves indoor coverage”.260 Vodacom also argues that both low frequency and high frequency spectrum is crucial because it can reduce coverage-related costs (with low-frequency spectrum) and capacity-related costs (with high-frequency spectrum).
268. Telkom also illustrates the impact of not being assigned sub-1Ghz spectrum on its costs of providing data. In this regard, Telkom estimates that “[] would be required to

85
provide coverage to a 2000 km2 urban area with 900MHz spectrum, while [] would be required to provide coverage to the same area using 1800MHz spectrum”261. Given this, Telkom argues that the costs of a network rollout are increased because [] are required to provide coverage using 1800MHz spectrum. Further, using an estimated capital expenditure of [] and an annual operating expenditure of [] per base station, Telkom estimates that “it would therefore require [] capex to provide coverage in the 2000 km2 urban area using 1800MHz spectrum as compared to sub-1GHZ spectrum”.262 This number also implies an [] in operational expenditure. Beyond the financial implications, Telkom points that it would take more time to build a network using higher frequency spectrum compared to using lower frequency spectrum.263
269. Lastly, Telkom highlights that asymmetries in spectrum assignment affect the competitive dynamics of MNOs. In this regard, Telkom argues that MNOs that incur higher costs in building and maintaining a network because they have not been assigned lower frequency spectrum are at a competitive disadvantage as compared to the MNOs that have been assigned lower frequency spectrum.264
270. Cell C shares similar views and submits that “to provide national coverage in the most efficient and least costly manner and to ensure that high-speed broadband services are available to all of South African’s citizens, an operator should be licensed to use frequency in both the low and high bands within its network”.265 Cell C further submits that important differences remain in the spectrum assignments of the MNOs. Specifically, Cell C submits that “both the MTN and Cell C assignment in the 900MHz band are not contiguous”.266 According to Cell C, “in some cases this means that the later of the spectrum bands assigned is not situated immediately next to the existing spectrum bands assigned and the spectrum cannot be bundled together for LTE use”.267 Cell C further adds that
261 Telkom’s submission dated 17 November 2017 (Non-Confidential version), p.31, para.131262 Telkom’s submission dated 17 November 2017 (Non-Confidential version), p.31, para.131263 Telkom’s submission dated 17 November 2017 (Non-confidential version), p.32, para.131-132264 Telkom’s submission dated 15 October 2018 (Non-confidential version), p.22265 Cell C’s submission dated 24 November 2017 (Non-Confidential version), Annexure B, para. 1.5266 Cell C’s submission dated 24 November 2017 (Non-Confidential version), Annexure B, p. 22267 Cell C’s submission dated 24 November 2017 (Non-Confidential version), Annexure B, p. 22268 Cell C’s submission dated 24 November 2017 (Non-Confidential version), Annexure B, p. 22269 Cell C’s submission dated 24 November 2017 (Non-Confidential version), Annexure B, p. 22270 Paired spectrum allocates two distinct and equal frequency bands, one assigned to “downlink” from the base station to mobile devices, and the other to “uplink”, [Online]. Available at: http://www.broadbandhomecentral.com/report/backissues/Report0704_5.html [Accessed 21 January 2019].271 Vodacom’s submission dated 15 October 2018 (Non-confidential version), p. 18 -20272 MTN’s submission dated 27 November 2017 (Non-Confidential version), p. 46 and 48
“the bundling of spectrum for the provision of standard LTE services can be done only where the spectrum assigned is contiguous.”268 According to Cell C, “this results in difficulties in network equipment having to be differently configured for each band, and this results in higher costs to Cell C. This is a recognised factor in assessing competitive disadvantages in mobile telecommunications.”269
Relative spectrum assignment
271. Using paired spectrum270 per 100,000 customers, Vodacom highlights that in South Africa, MTN and Vodacom have an under allocation of spectrum while Telkom and Cell C have an over allocation of spectrum. In light of this, and in order to alleviate the impact of lack of spectrum assignment, Vodacom submits that it has implemented measures such as investing in new sites, re-farming spectrum and [], albeit that these are temporary measures.271
272. MTN also argues that the lack of additional spectrum has resulted in the most constrained MNOs having to substantially increase their capital expenditure in order to increase their capacity to continue meeting the increasing growth in demand, while increasing network quality. MTN further submits that while 544MHz of spectrum has been assigned to various MNOs, several spectrum bands such as 700MHz, 800MHz and 2600MHz have not yet been assigned to MNOs. MTN also highlights that South African MNOs have far less spectrum assigned to them than many of their foreign counterparts. MTN also points to the fact that in several countries similar spectrum assignments are shared by three MNOs only. MTN further argues that because SA MNOs are faced with “less fixed infrastructure and less potential to offload mobile data onto WI-FI or other fixed solutions, the spectrum constraints faced by SA MNOs are even more acute”.272
273. Using the spectrum to subscriber share ratio, MTN also argues that MTN and Vodacom have

86
an under-allocation of spectrum while Telkom, Cell C and other smaller players have an over allocation of spectrum. MTN also argues that the lack of spectrum has led to much higher levels of investment for MTN and Vodacom “resulting in higher costs and prices than would otherwise have been enjoyed”.273 For instance, MTN states that in 2017 alone, it invested in an additional 1,500 sites at a cost of R7.9 billion and the majority of these sites (60%) were built in order to increase capacity rather than improving quality. Accordingly, MTN argues that “many such sites could be avoided if new spectrum was available.”274
274. MTN further states that “out of the six licensed mobile network operators not all of us are using the spectrum that the government gave us, there is a lot of inequality around the allocation of spectrum, some are siting and some people are starving on spectrum”.275 In this regard, MTN is of the view that ICASA should enforce the use it or lose it policy pertaining to spectrum allocation in order to remedy this situation.276
5.1.2. The release of high demand spectrum will reduce costs
275. There is an effective consensus among stakeholders that assigning high demand spectrum to MNOs will bring a number of benefits, including cost reduction. For instance, Vodacom submits that “making spectrum suitable for 4G services (i.e. 800 MHz, 1800 MHz and 2600 MHz) available as soon as possible could therefore be expected to bring a number of benefits. In particular, it would allow operators to increase coverage and capacity to meet rapidly rising demand in a cost-efficient manner.”277 Telkom also submits that “the assignment of additional spectrum will affect how South African mobile operators expand LTE coverage, and how they introduce 5G technologies”.278
276. MNOs also argue that additional spectrum will allow them to carry more data (more
273 MTN‘s submission dated 27 November 2017 (Non-Confidential version), p.48274 MTN’s submission dated 27 November 2017 (Non-Confidential version), p. 50275 MTN’s presentation at the public hearings held on 17-19 October 2018. See day 2 transcripts, p. 88276 MTN’s presentation at the public hearings held on 17-19 October 2018. See day 2 transcripts, p. 115277 Frontier Economics report (Non-Confidential version) in Vodacom’s submission dated 30 November 2017, p.5278 Telkom’s submission dated 15 October 2018 (Non-Confidential version), p.24279 Frontier Economics report (Non-Confidential version) in Vodacom’s submission dated 10 October 2017, p. 78280 MTN submission dated 27 November 2017 (Non-Confidential version), p. 50-51281 Frontier Economics report (Non-Confidential version) in Vodacom’s submission dated 30 November 2017, p 36-37282 Frontier Economics report (Non-Confidential version) in Vodacom’s submission 30 November 2017, p. 33283 MTN submission dated 27 November 2017 (Non-Confidential version), p. 5284 Vodacom’s submission dated 07 August 2018, p. 17285 Vodacom’s submission dated 07 August 2018, p. 17286 Vodacom’s submission dated 07 August 2018, p. 17
volume) at a higher speed, and higher speeds means better quality. According to Vodacom, “when additional spectrum is released, and if access to ducts and poles for backhaul and backbone (used for providing both fixed and mobile services) is granted, this will expand the capacity on MNO’s networks, which should further increase competition for providing national roaming and MVNO access”.279 MTN also submits that “if additional spectrum could be released, by way of illustration if digital spectrum alone were released, speeds up to 300Mbit/s could be available immediately, which would deliver significant quality improvements to users”.280 Vodacom further highlights that the benefits of releasing spectrum include faster deployment of 4G/5G technologies which will increase quality of mobile data services and decrease costs, increase data speeds, bring lower latency and increase reliability.281
277. Furthermore, MNOs argue that additional spectrum will also reduce the costs of supplying data to consumers. In this regard, Vodacom submits that “making additional spectrum available as soon as possible would bring significant benefits including alleviating capacity constraints, reducing the cost of network expansion, allowing the deployment of more efficient technologies and enhancing competition”.282 According to MTN, the one particular regulatory intervention needed is allocating more spectrum to MNOs in order “to allow them to compete even more effectively, and provide greater access to mobile data services, at even lower costs”.283
278. Specifically, Vodacom explains that the introduction of new technology reduces network unit costs. In this regard, Vodacom submits that “[].“284 Vodacom further adds [].285 Vodacom however caution that []286.
5.1.3. The current process to release spectrum
279. Appendix C provides a detailed discussion of the developments in the policy, regulations

87
and administrative action by ICASA in respect of the allocation of high demand spectrum. In essence, the process has been as follows:
279.1. ICASA issued an ITA on 15 July 2016 for the allocation of high demand spectrum to ECNS licensees. ICASA was subsequently taken on review by the DTPS amongst others, challenging the general approach to the assignment of spectrum. The DTPS expressed the concern that the ITA was issued prior to the finalisation of government policy which would guide the approach to high demand spectrum assignment.
279.2. The ICT White Paper287 was subsequently published in October 2016 by the DTPS, detailing the overarching policy framework for the economy’s transformation into an inclusive and innovative digital and knowledge society.288 Subsequently passed by Cabinet, the White Paper called for the creation of a national WOAN using high-demand spectrum.289 The impression from the White Paper is that all HDS would be assigned to the WOAN.
279.3. In order to give effect to the ICT White Paper, amendments to existing legislation were required resulting in the draft Electronic Communications Amendment Bill (“Amendment Bill”) published on 17 November 2017 for public comment.290 Chapter 3A of the Amendment Bill proposes an insertion to provide for the issuing of an ECNS licence and radio frequency spectrum licenses to the WOAN, in order to provide wholesale electronic communications network services on an open access basis.291 The Minister must consider
287 Released on October 2016. Government Gazette no. 40325.288 DTPS (2016) National Integrated ICT Policy White Paper- 3 October 2016, p. 3, para. 1.2289 Pater, D. & Hurst, R (2017) National Integrated ICT Policy White Paper- Africa Analysis View.290 Electronic Communications Amendment Bill. Government Gazette No. 41261, 17 November 2017291 Electronic Communications Amendment Bill. Government Gazette No. 41880, 31 August 2018. Chapter 3A.292 Ellipsis (2017) Overview of the Draft ECA Bill 2017, p.1. [Online]. Available at: https://www.ellipsis.co.za/wp-content/uploads/2017/12/ Overview-EC-Amendment-Bill-2017.pdf [Accessed on 18 June 2018]293 Joint Statement: Minister Dr. Siyabonga Cwele and the Council of ICASA agree to settle the spectrum court challenge and to initiate the licensing of unallocated high demand spectrum. 26 September 2018. [Online]. Available at: https://www.dtps.gov.za/index.php?op tion=com_content&view=article&id=760:minister-dr-siyabonga-cwele-and-the-council-of-icasa-agree-to-settle-the-spectrum-court-chal lenge-and-to-initiate-the-licensing-of-unallocated-high-demand-spectrum&catid=13&Itemid=138 [Accessed on 12 November 2018]294 South African Government (September 2018) President Cyril Ramaphosa: Economic stimulus and recovery plan speech. [Online]. Available at: https://www.gov.za/speeches/president-cyril-ramaphosa-economic-stimulus-and-recovery-plan-21-sep-2018-0000 [Ac cessed on 12 November 2018]295 Invitation to provide written comments on proposed policy and policy directions to the authority on licensing of unassigned high demand spectrum. Government Gazette No. 41935. 27 September 2018.296 Ellipsis (2018) Overview: the proposed policy and policy directions on the WOAN and licensing of unassigned high- demand spectrum. [Online]. Available at: https://www.ellipsis.co.za/wp-content/uploads/2018/10/ellipsis-overview-draft-policy- directions-on-the-WOAN-and-spectrum-october-2018.pdf [Accessed on 20 October 2018]
incentives that may be granted to the WOAN and will initiate the licensing process by issuing a policy direction to ICASA in terms of section 5(6) for it to publish an ITA.292 The Amendment Bill specifies that ICASA can only proceed to assign licences for HDS not assigned to the WOAN once a range of conditions are met, including having the WOAN fully functional and other MNOs purchasing 30% of its capacity.
279.4. DTPS and ICASA finally settled their litigation on ICASA’s ITA on 26 September 2018293 following President Cyril Ramaphosa’s call to “initiate the process for the allocation of high-demand radio spectrum to enable licensing” as part of the announcement of the economic stimulus and economic recovery plan.294
279.5. The following day DTPS issued an invitation to provide written comments on the draft proposed policy direction to ICASA (“draft Policy Direction”) on licensing of unassigned HDS.295 The purpose of the proposed draft Policy Direction is to direct ICASA to urgently consider the licensing of unassigned high demand spectrum to the WOAN and to other licensees.
279.5.1. The subtle change in direction contained in this policy direction was that Cabinet approved the simultaneous licensing of HDS to MNOs and the WOAN. This is in part based on the outcomes of a study conducted by the Council for Scientific and Industrial Research (CSIR) on the spectrum requirements of the WOAN.296 This study is

88
attached to the draft Policy Direction.
279.5.2. Furthermore, MNOs will not be required to return already-assigned HDS (not at least until 2028 when the licenses expire) and that any licensing in terms of the ITA would be for unassigned HDS only (not existing HDS).297
279.5.3. The intent was that at the end of the public consultation process, and a consideration of the final Policy Direction issued by the MoTPS, ICASA will commence the licensing process for the assignment of unassigned HDS.298
279.6. President Cyril Ramaphosa announced on 22 November 2018 that the Department of Communications (DOC) and the DTPS will be merged with Stella Ndabeni-Abrahams being appointed as Minister, heading up both departments. Subsequently, on 12 February 2019 the Communications Minister announced the withdrawal of the Amendment Bill to enable further consultations and to align it with the drive towards the fourth industrial revolution. It seemed the intent was also to bring it before the new parliament formed following national elections on 8 May 2019.
280. The withdrawal of the Amendment Bill has left some questions as to the current status of the draft Policy Direction issued to ICASA last September and whether that is the intended policy direction going forward. However, we understand that it is formulated in terms of the current ECA and not the Amendment Bill, and therefore the DTPS can legitimately conclude that Policy Direction enabling ICASA to proceed with the licensing of HDS. It also seems that there has been a clear shift in direction towards moving ahead with the licensing of unassigned HDS to MNOs whilst simultaneously supporting the emergence of a WOAN, and allowing MNOs to retain their existing HDS. We therefore proceed to analyse the spectrum assignment debate on this basis.
297 Government Gazette, No. 41935 (27 September 2018). Department of telecommunications and Postal Services: “Invitation to provide written comments on proposed policy and policy directions to the Authority on licensing of unassigned high demand spectrum”.298 Telecommunications and Postal Services on ITA settlement agreement. Gov.za/speeches299 Frontier Economics report in Vodacom’s submission dated 10 October 2017, p.77 300 MTN’s submission dated 27 November 2017 (Non-Confidential version), p.42-43301 MTN ‘s submission dated 27 November 2017 (Non-confidential version), p.43302 MTN ‘s submission dated 27 November 2017 (Non-confidential version), p.43
5.1.4. Spectrum policy and competition
281. The timing of the submissions (written and public) as well as the changing policy stance from the DTPS means that much of the input to the Inquiry on spectrum assignment going forward still focused on some of the earlier policy positions rather than where policy appears to have moved. However, it is still worth considering the submissions on how HDS should be allocated as the insights still impact on how the Inquiry team assesses the direction spectrum assignment should take. Below we summarise all the concerns with respect to future changes to the spectrum status quo, all of which confirm that spectrum assignment affects competition in the market. Furthermore, Appendix F has a detailed discussion of how competition effects are typically a key consideration in spectrum assignment and often a factor that motivates how the assignment is done.
281.1. Vodacom [].299
281.2. MTN is also concerned with the awarding of spectrum to the WOAN as per the ICT White Paper. In this regard, MTN states that “the White Paper proposes that all high demand spectrum (presumably including the high demand spectrum which has been allocated to MTN) be assigned to an open access basis, which suggests that such spectrum (including the high demand spectrum that has already been allocated) will be assigned to the WOAN”300. MTN further states that without access to additional spectrum, it will not be able to offer data at a competitive price.301 MTN points to the lack of evidence that WOANs are successful in delivering on the promises of better coverage or lower prices for consumers.302 Additionally, MTN states that the Operators Forum (which is made up of Vodacom, MTN, Cell C, Telkom, Multisource Telecom and Neotel) had engaged with government on the White Paper proposals, particularly regarding the WOAN. The Amendment Bill’s latest content (at the time of MTN’s submission), however, shows (according to MTN) a lack of regard for industry

89
submissions and input on the ICT White Paper.303
281.3. Cell C raises concerns regarding the ITA from ICASA for unassigned high-demand spectrum in 2016. In this regard, Cell C argues that the structure of the ITA (in Lots)304 would have benefited the larger MNOs because they have greater financial resources and thus in a position “to out-bid smaller operators for the most useful and attractive Lots”305. According to Cell C, the awarding of the unassigned high demand spectrum through Lots would have further entrenched market power of the larger MNOs.306
281.4. Telkom, too, submits that the assignment of spectrum licensees and the monitoring of its use is a core regulatory function which holds significant impact on how competition evolves within the sector.307 Telkom is concerned about the delay in implementing the digital migration process and its impact on assigning digital dividend spectrum. In this regard, Telkom states that “700MHz and 800MHz bands will become fully available only after TV broadcasting has been migrated out of them”.308 Telkom further submits that the “deadline for this migration is currently set for December 2018 but it has already faced a number of delays and is unlikely to be completed by this date”.309
281.5. Electronic Communications Network (ECN) submits that the ICT White Paper and the proposals for a WOAN set out therein acknowledge the issue of the lack of available spectrum. ECN states it is also clear that the proposal for a WOAN is a highly contentious and increasingly-politicised issue, with ongoing litigation between the Minister and ICASA.310 According to MWEB [].311
281.6. A4AI also notes the documented link between spectrum allocation and
303 MTN’s submission dated 27 November 2017 (Non-confidential version), p. 44-45304 This is explained in more detail in the sub-section of Appendix F that deals with spectrum assignment methods305 Cell C’s submission dated 24 November 2017 (Non-Confidential version), para. 5.3306 Cell C’s submission dated 24 November 2017 (Non-Confidential version), para. 5.3307 Telkom’s submission dated on 17 November 2017 (Non-Confidential version) , p.42308 Telkom’s submission dated 17 November 2017 (Non-Confidential version), p. 31309 Telkom’s submission dated 17 November 2017 (Non-Confidential version), p. 31310 ECN submission dated 1 November 2017 (Non-Confidential version), p. 31311 MWEB submission dated 1 November 2017312 A4AI submission dated 1 November 2017 (Non-Confidential version), p. 3313 A4AI submission dated 1 November 2017 (Non-Confidential version), p. 3
broadband access.312 A4AI states in its submission that it considers spectrum as an essential resource underpinning the operations of the mobile industry. It notes that the allocations of spectrum must therefore be well planned, with special consideration given to the coverage of rural areas and unserved communities in South Africa.313
282. The position of submissions is that the approach to spectrum assignment can have significant consequences for competition is supported by international experience and literature. In Appendix F, we detail the key considerations and objectives in spectrum assignment and it is clear that, firstly, spectrum assignment can have significant consequences for competition – both positive and negative – and, secondly, government and regulators internationally use spectrum assignment and the various approaches to spectrum assignment to protect and enhance the levels of competition in mobile telecommunications. Appendix F provides an overview of some of the specific measures and approaches adopted by regulators internationally to ensure positive competition effects.
5.1.5. Assessment and key findings
Need to urgently license unassigned HDS
283. It seems common cause amongst all stakeholders that spectrum is not only a critical resource in the provision of mobile broadband, but that the current allocation of HDS to mobile broadband is inadequate by global standards. This is primarily because South Africa has fallen behind on digital broadcasting migration, which means that spectrum that has already been released to mobile broadband services in other jurisdictions on the basis of the ITU spectrum plan has yet to be assigned in South Africa. It is also common cause that the scarcity of HDS for mobile broadband is likely to be artificially raising the costs of providing broadband services, and therefore may be one of the contributing factors to current high data prices.

90
284. It therefore follows that the completion of the digital migration process and the release of HDS in the 700MHz and 800MHz bands to mobile broadband is urgent. This is because it has the potential to reduce broadband costs, which then provides a basis for reducing prices if competition is effective. Furthermore, the Inquiry also finds that it is similarly urgent that ICASA explore the reassignment of HDS that is not being used by other licensees. While the amended ECA will likely address this through the ‘use it or lose it’ principle, any option to release such spectrum or cancel licences in the short-term should be considered. We understand that ICASA has already begun the process of using TVWS314 for mobile telecommunications which is promising.
285. The Inquiry team is also of the view that the current direction in spectrum policy that seeks to assign a portion of unassigned HDS to existing MNOs simultaneously with an assignment to the WOAN (and before waiting for the full network development of the WOAN and other conditions to be met) is the correct approach.
285.1. The Inquiry team is of the view that assigning all high-demand spectrum (both currently assigned and unassigned) to the WOAN is not healthy as this will create a near-monopoly RAN provider. The Inquiry is of the view that infrastructure competition can be very healthy in the telecommunications industry as it provides strong incentives to invest in improvements in quality and coverage to the benefit of consumers, as well as strong incentives to extract efficiencies. A monopoly RAN provider is also likely to require regulatory oversight and even price regulation given its position, and most of the benefits from infrastructure sharing to reduce costs can potentially be achieved through facilities leasing regulations without the need to create the distortion of a RAN monopoly.
285.2. It would also seem that on the basis of the CSIR study attached to the draft Policy Direction, the WOAN would not require all of the unassigned HDS in order to provide a national service that can provide for the needs of at least 20% of the consumers. Even if this benchmark for the share of market or download
314 A4AI submission dated 1 November 2017 (Non-Confidential version), p. 3
speeds is revised through the policy direction engagement, it still seems unlikely that the WOAN will require all of the unassigned spectrum, at least from a technical standpoint. This means that some of the unassigned HDS can be allocated to existing MNOs in order to reduce their costs and improve services.
285.3. If the WOAN does not require all the unassigned HDS, then there would seem to be little reason to delay the assignment of that portion which the WOAN does not require to existing MNOs now. In whatever form, the WOAN is likely to take some time to develop and faces challenges to become a success in any event. If data costs are to fall and consumers to get relief from high prices then it is preferable to make that assignment soon.
WOAN design to ensure commercial success
286. The concept of the WOAN is controversial, regardless of whether it is to be a RAN monopoly or not.
286.1. The DTPS and many stakeholders see it as essential if a more healthy service level competition is to emerge and there is to be a reduction in the system costs from sharing of infrastructural facilities amongst these service providers. This appears to be a response to the lack of wholesale markets emerging, let alone competitive wholesale markets, for RAN services that might support competitive MVNOs. Vertical integration appears to provide little incentive for existing MNOs to open up this space (as discussed in the next section).
286.2. In contrast, other stakeholders express the concern that a WOAN faces considerable hurdles to being commercially successful given that it is a late entrant into the market facing up against strong incumbents. If this is the case, then valuable spectrum may lie underutilised. Whilst some MNOs claim the WOAN might have a commercial advantage from cheaper spectrum, the Inquiry team feels this is highly unlikely given the other barriers a WOAN may face in launching successfully. In any event, the WOAN, as it is currently

91
envisaged, would bring greater levels of competition to wholesale markets as well as final retail markets.
287. The Inquiry team is of the view that a WOAN is just one of the potential policy responses to improving competition in mobile broadband markets, the alternative being to facilitate greater infrastructure sharing at cost and also force open wholesale markets for MVNOs. However, if this approach is to be successful, then it is imperative that the WOAN is designed in a manner that enhances its prospect of commercial success, not just technical capability, such that it has the desired outcome.
287.1. As will be discussed in the next section, the Inquiry is of the view that competition in the mobile market can be greatly enhanced from its current state, including at the wholesale level. There would seem to be limited incentive for incumbent MNOs to compete fiercely for wholesale business (i.e. MVNOs), resulting in competition being effectively limited to that between the vertically integrated operators. A WOAN is one solution to this problem, with the other being more intrusive regulation at the wholesale level. However, on the reduction of system costs, the Inquiry team is of the view that this can be achieved through other means such as facilities leasing regulations as discussed next. Moreover, the WOAN, especially in its current proposed form as another market participant (or a restructured version of a current participant), does not present a solution to the facilities sharing objective.
287.2. The Inquiry is also of the view that there are definite risks to the commercial success of the WOAN. If these risks are not addressed, then there is a real concern that the opportunity to bring in another infrastructure competitor whilst HDS is available may be wasted, and hence the HDS wasted too. These risks are the same risks that any new entrant faces in mobile against well-entrenched incumbents, and are the reasons why late entrants Cell C and Telkom Mobile have struggled to make inroads.
287.3. If the WOAN is to be successful, then the DTPS and ICASA need to give careful thought as to how to ensure commercial
success rather than simply technical requirements. This also needs to go beyond making the WOAN a monopoly or choking other MNOs of HDS in the meantime, as those approaches have other undesirable costs and policy direction has rightly shifted away from those options.
287.3.1. For instance, the CSIR study would seem to focus more on technical requirements to service a portion of the market at particular speeds. It does not seem to consider whether that spectrum allocation will provide the WOAN with a competitive offering relative to other MNOs spectrum allocations.
287.3.2. Similarly, mandating access to facilities for the WOAN is still likely to face the same problems that any facilities leasing regulations may face, namely that of the technical ability to provide such access at a cost-reflective price. These are covered in the next sub-section.
287.3.3. A commitment to buy capacity from the WOAN by other MNOs seems to be the main solution to the commercial viability concern at this stage, and yet that is unlikely to be sufficient to ensure commercial success. The Inquiry team is of the view that consideration needs to extend to whether a credible consortium exists for the licence with the capability to both fund the rollout but also offer a credible and sustainable business model for the WOAN. This would include the ability to deliver a competitive service (i.t.o. price and quality) such that it is able to attract and develop material service provider customers to support the business. If such a consortium is not forthcoming, then consideration needs to go to whether an existing MNO take on the WOAN role, with incentives to do so and with contractual conditions

92
imposed to ensure the desired wholesale outcomes. In terms of the contractual conditions, these would be to ensure that wholesale services are provided on a cost-orientated and non-discriminatory basis given that a vertically integrated provider may have incentives to inhibit rival service providers. This may require accounting separation at least in order to ensure adequate oversight. In addition, in the event of a vertically integrated provider of the WOAN, safeguards need to be put in place to ensure that it does not become a platform for information sharing and coordinated conduct. This requirement reinforces the notion that some functional or operational separation of the RAN and service divisions is desirable, much like that undertaken by Telkom following the settlement agreement with the Commission.
Allocation amongst MNOs (and WOAN) needs to be pro-competitive
288. On the basis of submissions, as well as the Commission’s experience from prior merger cases, it is apparent that the relative quantum of spectrum allocated as well as the assignment across different spectrum bands can impact on the costs, quality and quantum of broadband services. As a result, that relative assignment of HDS can impact on the state of competition in the market, either positively or negatively.
289. It is also the case that whilst the assignment of HDS will likely reduce the costs of providing mobile broadband, these cost reductions are only likely to be passed onto consumers if there is sufficient price-based competition. It is the view of this Inquiry that the current state of price competition in mobile markets can be improved, as discussed in the next section. This would also seem to be the view of the DTPS and ICASA, and all stakeholders other than Vodacom and MTN. The White Paper and subsequent proposed legislative amendments, including that of the WOAN, have their foundation in a belief that competition is inadequate and needs to be enhanced. ICASA itself has prioritised a market inquiry into mobile broadband.
290. The Inquiry team is therefore of the view that the assignment process undertaken by ICASA needs to prioritise the achievement of an allocation that enhances, or at very least preserves and does not undermine, competition amongst MNOs (and the WOAN).
290.1. In this respect, ICASA should ensure the design of the allocation of HDS is not done to achieve other objectives, such as maximising revenues. Rather, ICASA should place competition as the primary objective driving design decisions, including the allocation reserved for the WOAN as discussed above.
290.2. Putting competition at the forefront of design would affect the design of the different lots of spectrum available, taking into account the current allocations across MNOs, as well as the bidding mechanism. The appendix on spectrum (Appendix F below) provides a detailed discussion of some of the different approaches adopted in other jurisdictions designed to achieve different outcomes.
290.3. The Inquiry is also of the view that allocating more spectrum to MNOs with more subscribers is not sound and may merely serve to entrench any dominant positions in the market. As such, ICASA also needs to consider in its design whether a purely symmetrical approach continues to inform its spectrum policy, or if some asymmetry, including pro-competitive asymmetry, should be a factor in assignment.
Opportunity for imposing welfare-enhancing conditions
291. Many jurisdictions have used the licensing of scarce HDS to MNOs as an opportunity to also achieve other objectives through the imposition of conditions or obligations on recipients of HDS. This is feasible because the HDS has commercial value to the MNOs, and hence they are willing to make such commitments in exchange for the HDS, or a reduction in the costs of HDS. Indeed, in the original ITA ICASA sought to impose a minimum national broadband coverage and speed on all recipients of HDS.
292. The Inquiry is of the view that the leverage provided by the release of HDS be utilised effectively by ICASA to ensure that recipients

93
behave in a manner that supports the provision of lower data prices, in particular to lower income consumers. In this respect, the release of HDS should not seek to simply achieve the objective of maximising revenue generation, but rather focus on achieving desired outcomes in line with national policy objectives.
292.1. In the context where there is already universal coverage of mobile broadband, the Inquiry is of the view that the focus of such conditions may be better placed on making broadband affordable rather than further coverage requirements. In this manner, any obligations would address the real issue, which is one of affordability and the demand gap. This is not to say that some coverage obligations might still be imposed, but rather where the focus of the obligations should lie.
292.2. The Inquiry has received numerous submissions on how best to reduce data prices and extend services to the poor. A number of these solutions lend themselves to obligations around HDS and can be considered by ICASA. These include the relatively standard type obligations such as services to schools and other public institutions. However, there is no reason why such obligations cannot extend to behavioural obligations such as those suggested in respect of reducing the differential between small and large data bundles, the requirement to reduce data prices in line with data cost reductions experienced due to spectrum, and the provision of free public Wi-Fi in particular community spaces.
292.3. Speed requirements should also be carefully considered in assigning HDS and imposing conditions on such assignments. Speed requirements may be more important to high-volume (and thus richer) consumers than low-volume (and thus poorer) consumers. The Inquiry team is of the view that differentiation on the price-quality trade-off may be beneficial to consumers and the industry more broadly. Regulations or conditions should not prevent the offering of services with lower speed but also lower prices – such differentiation is common in the fixed line space.
315 ICASA Discussion document, Appendix 2: Government Policy Objectives. Government Gazette No. 41446. 16 February 2018, p. 90316 Ellipsis (2015) Rapid deployment of electronic communications facilities. [Online]. Available at: https://www.ellipsis.co.za/rapid- deployment-of-electronic-communications-facilities/ [Accessed on 20 July 2018]317 Electronic Communications Amendment Bill. Government Gazette No. 41880, 31 August 2018. Chapter 4.
5.2. Facilities access and pricing
293. Another area where there appears to be some common cause is in relation to facilities access and sharing of infrastructure. Whilst operators will frequently refer to the facilities of others rather than their own when arguing for access, the common thread through the submissions is that facilities are costly and time-consuming to duplicate. As such, improvements in access and sharing modalities can only reduce infrastructure costs and enhance the speed of rollout for competing networks – both of which enhance competition. This extends to the infrastructure of municipalities, such as securing wayleaves and access to high sites in order to rapidly roll out infrastructure.
294. Given there is already a framework within the ECA and ICASA regulations for facilities access, the debate is more about ensuring actual access to all infrastructure types at cost-effective prices. This debate also occurs within the context of the Amendment Bill which itself seeks to provide a legislative basis for an enhanced wholesale open access regime around facilities and an extension of current infrastructure sharing.
5.2.1. Legislative changes and submissions
295. The ICT White Paper places a particular focus on access and infrastructure supply-side issues. The policy highlights the infrastructure-based challenges in the provision of broadband, which include ineffective competition, supply bottlenecks, infrastructure duplication, and the inefficient use of scarce resources.315 These policies found their way into the Amendment Bill for the ECA prior to it being withdrawn from parliament. The particular form it took in the Amendment Bill is covered in detail in appendix D on policy and legislative changes, but can be summarised as follows:
295.1. The Rapid Deployment Policy seeks to simplify and minimize the period from the time of application for wayleaves and permits to the issuance thereof, which would decrease the cost and time involved in infrastructure deployment and thereby further policy efforts to address the costs to communicate in South Africa.316 In totality, the revisions in the Act cover the following aspects317: ECNS

94
licensees’ right to enter and use property; the requirements for ‘adequately served’ locations; the proposed definition of ‘essential facilities’; the access to high sites for radio-based systems (where these sites are defined as “any structure or feature, constructed or natural, including buildings, which is suitable for radio-based systems”); access to trenches, government infrastructure and buildings; the provisions of new property developments and buildings; the application process and procedure for network deployment; fees, charges and levies involved in infrastructure deployment; the apportionment of roles and responsibilities in supporting rapid infrastructure deployment; and the relevant rapid deployment regulations.318
295.2. In the Open Access section of the Amendment Bill, it creates the obligation319 that all ECNS licensees provide open access to electronic communications facilities at a wholesale level along the following principles: active infrastructure sharing; cost-orientated pricing; access to its electronic communications network or electronic communications facilities (as prescribed by ICASA); and specific network and population coverage targets.320 The obligation is only made subject to technical ability, not commercial. Open access to networks or facilities must be non-discriminatory among comparable types of networks or facilities and not be of a lower technical standard and quality than that provided by the licensee to itself or to an affiliate.321 Wholesale open access regulations are to be drafted by ICASA within an 18 month period after the Amendment Bill comes into effect. These open access regulations will cover, among others, the terms and conditions for the different open access categories (such as a ECNS licensee, a vertically-integrated entity or a deemed entity) and the procedures and time frames for negotiating, concluding
318 Ellipsis (2017) Overview of the Draft ECA Bill 2017. Page 2. [Online]. Available at: https://www.ellipsis.co.za/wp-content/uploads/2017/12/ Overview-EC-Amendment-Bill-2017.pdf [Accessed on 18 June 2018]319 The amendment seeks to oblige electronic communications network service licensees to provide wholesale open access upon request.320 Electronic Communications Amendment Bill. Government Gazette No. 41880, 31 August 2018. Chapter 8.321 The ECA Bill. Amendment of section 43 of Act 36 of 2005.322 Ellipsis (2017) Overview of the Draft ECA Bill 2017, p. 12. [Online]. Available at: https://www.ellipsis.co.za/wp-content/uploads/2017/12/ Overview-EC-Amendment-Bill-2017.pdf [Accessed on 18 June 2018]323 Frontier Economics report (Non-confidential) on behalf of Vodacom (submitted on 30 November 2017), p. 39, Section 3.5324 MTN’s submission dated 27 November 2017 (Non-confidential version), p. 52325 MTN’s submission dated 27 November 2017 (Non-confidential version), p. 52326 ECN submission dated 1 November 2017 (Non-Confidential version), p. 6
and implementing wholesale open access agreements.322
296. These infrastructure and supply-side issues are also contained within submissions to the Inquiry, discussed in brief below but in more detail in the appendix on submissions.
296.1. In its submission, Vodacom indicates that access to existing duct and pole infrastructure would help to reap the benefits of additional mobile spectrum. Providing alternative operators with this access (to ducts and poles) would, according to Vodacom, incentivise competitive investment by significantly reducing the cost of network roll-out. Infrastructure access, according to its submission, would make it more viable for operators to build their own backhaul instead of relying on other operators to provide it.323
296.2. MTN submits that in addition to the binding spectrum constraint, operators face numerous demand and supply factors which hinder improvements of access to data services, especially for low-income consumers in South Africa.324 According to MTN, the supply side factors have a significant impact on the cost of providing data services. MTN’s submission notes various supply side cost factors like energy pricing, battery theft and vandalism at base station sites, as well as the increasing infrastructure replacement and upgrade costs. MTN indicates that wayleave applications are also costly and time consuming, adding to supply side costs for operators.325
296.3. ECN further states that one of the main causes of higher data prices in South Africa is that ICASA failed to regulate competition in the wholesale and retail mobile data services as required by Chapter 10 of the ECA.326 Telkom submits that wholesale mobile network services (roaming, RAN sharing, access)

95
are not fully regulated, but are subject to commercial considerations, specifically the Facilities Leasing Regulation of 2010 which obliges all ECNS-licensed operators to lease facilities. ECN notes that the price that may be charged by the facility owner has not, however, been regulated. This is also acknowledged by Telkom, who submits that access seekers are disadvantaged by no regulation of the price if the wholesale market is not working effectively.327 Cell C shares a similar view and submits that although the ECA obliges licensees to share their facilities in terms of Chapter 8 of the ECA, the price that may be charged by the owner of the facilities has not been regulated, even though there is scope to implement such a framework.328
5.2.2. Assessment and Key Findings
297. There is little doubt that facilities and other passive infrastructure contribute materially to the cost of supplying broadband services, both fixed and mobile. There is also little doubt that gaining access to the infrastructure of municipalities and other operators can be time-consuming and delay the deployment of competing infrastructure. It follows naturally that efforts to enhance facilities access and sharing can substantially reduce operating costs and ensure the rapid deployment of competing infrastructure, to the potential benefit of lower prices eventually.
298. Indeed, operators themselves frequently seek to engage in mutually beneficial passive infrastructure sharing arrangements amongst each other in order to reduce operating or capital costs. We have also seen the emergence of tower companies within the mobile space which own and operate sites which are then leased to different MNOs. There are also moves to more active infrastructure sharing arrangements in some jurisdictions as operators seek to contain the high cost of new generation technology rollouts, such as 5G.
299. However, such commercial models typically arise in the context where there is mutual benefit to the arrangements, namely where both parties have infrastructure to bring to the table or agree a mutual investment programme in passive infrastructure. Where there is inequity in passive infrastructure holdings
327 Telkom Communication with the Commission (Non-Confidential version), 17 November 2017, p.27 & 32328 Cell C submission dated 24 November (Non-Confidential version), p. 13
between operators, there is often a resistance to infrastructure sharing by the incumbent holder of more infrastructure facilities. This is because a denial of access provides it with a competitive advantage over a newer rival, and such strategic behaviour may also slow the expansion and competitive significance of the new rival. Even where access is mandated, incumbents may engage in strategies that amount to a constructive denial (e.g. citing technical difficulties in accommodating the sharing of access) or inflate the price for access to ensure that competitive advantage remains. In fact, such strategies are cited in submissions by later entrants.
300. Whilst it may be argued that the incentives to invest in facilities may be undermined by mandated access, the reality is that most situations of inequitable holdings of facilities are merely the result of first-mover incumbency rather than greater levels of investment or risk-taking. This applies to the ducts and poles of fixed line operator Telkom that Vodacom seeks access to, but equally to the high sites of Vodacom’s own mobile network that Telkom cites as important to its mobile entry.
300.1. The leadership position in holding of facilities in these cases is due to the fact that the firms were licensed monopolies or duopolies for a substantial period of time, allowing them to build up a strong position in facilities.
300.2. The first-mover advantage afforded by past restrictions on entry also imply that facilities ownership remains skewed within many infrastructure markets, which provides the structural conditions for strategic behaviour by such incumbents to deny or constructively deny access to those facilities. In other words, the structure of facility ownership is not conducive to mutually beneficial sharing of facilities on fair, cost-orientated terms.
300.3. In this context, the current regulations which mandate access to facilities but which do not necessarily clarify all facilities that are covered (such as ducts and poles) or seek to regulate the price of such access, are likely to be inadequate in order to prevent such strategic behaviour. This would certainly seem to be the view across most operators, even

96
if it is not their view of their own facilities but rather those of other operators.
301. For these reasons, the Inquiry is of the view that the policy direction towards cost-orientated access to passive facilities with stronger enforcement regulations devised by ICASA is correct. If this can be achieved through legislative change as proposed in the Amendment Bill, then this is a preferable outcome as it would facilitate a more rapid move to such outcomes, as well as greater certainty for operators in the broader telecommunications industry. However, the Inquiry team is of the view that the following requires greater thought by ICASA in shaping those regulations around infrastructure access and sharing.
301.1. Whilst there is generally consensus that passive infrastructure sharing reduces costs and is beneficial to competition, there is less consensus that active infrastructure sharing is necessarily desirable under all circumstances.
301.1.1. One of the reasons for this is that whilst passive infrastructure sharing would seem to hold limited risk for facilitating collusion, active infrastructure sharing holds more risk due to the need for closer collaboration over the infrastructure service. Under active infrastructure sharing, participants may be exposed to strategic / confidential information of the each other such as new technological services or the sales performance and customer profile of each other. This may be used to put in place or enforce a collusive arrangement.
301.1.2. A further reason is that such active infrastructure sharing may also reduce infrastructure competition which is desirable in many respects as it provides incentives for firms to invest in and innovate around the services and service quality. If an innovation is effectively shared with a competitor due to active infrastructure
sharing, then there may be less incentive to undertake such an innovation. Obviously this would only apply to those innovations that cannot be separated from the shared infrastructure component.
301.2. Therefore whilst the current Amendment Bill proposes active infrastructure sharing too, the Inquiry is of the view that in the actual implementation that ICASA needs to be more circumspect about where such sharing is desirable and where it is undesirable. Factors that might be weighed up in this context are the actual extent of cost savings from moving from passive to active sharing, the necessity of active sharing to provide a competing service and the potential costs/risks in terms of undermining competition (both infrastructure competition and collusive outcomes).
301.2.1. For instance, active sharing may be desirable in sparser rural areas where MNOs are primarily providing coverage rather than capacity sites. This is because it may enable large cost savings given land mass coverage and benefits to not duplicating underutilised fibre links to such sites. However, it may be less desirable in denser urban and peri-urban areas where MNOs may seek to compete more on service quality and innovation and already need to roll out a denser network of capacity sites which leaves less scope for large cost savings.
301.2.2. Similarly, in the fixed line environment there may be bottlenecks or underutilised facilities where active sharing may be either necessary or provide material cost benefits with little risk of adverse competitive effects. This might include, for instance, access to public Wi-Fi hotspot infrastructure if duplicate infrastructure is prevented

97
by the landowner. However, there are equally going to be circumstances where active sharing provides limited benefits beyond passive sharing, and increases the risks of collusion.
301.3. Cost-orientated pricing needs to reflect the best practice principles around regulatory tariff setting, which seek to strike a balance in preserving the incentives to invest whilst also providing access on fair terms such that the access provider is not placed at a competitive disadvantage.

98
302. This section examines competition in the mobile data market and whether there is scope to improve the extent of competition to the benefit of lower data prices, to low income consumers in particular. The submissions, public hearings and general public discourse around the mobile telecommunications sector in South Africa have clearly identified that competition is not as robust as it should be, with the first mover networks still enjoying considerable market power with more recent challenger networks struggling to break their stranglehold on the market. The extent of competition in the market and market structure has also been traversed in numerous competition complaints and failed merger notifications before the Commission. Indeed, it seems that outside of the larger networks themselves, the lack of robust competition in mobile markets appears to be common cause.
303. The section begins with a discussion of the submissions made in respect of mobile competition and barriers to entry. We then proceed to discuss features of the market, starting with the level and trends in concentration in retail markets before moving onto headline pricing, vertical integration, first mover advantages and spectrum assignment. We then proceed to wholesale markets, focusing exclusively on roaming arrangements and their effect on entrants given that facilities leasing is dealt with in the previous section.
6.1. Submissions
304. This sub-section provides a high level summary of all submissions regarding mobile competition and barriers to entry. A detailed summary of all the submissions made by stakeholders is contained in Appendix D.
329 Telkom’s submission dated 17 November 2017 (non-confidential version), p.43330 Telkom submission dated 17 November 2017, (non-confidential version), p. 11331 Cell C submission dated 24 November 2017, (non-confidential version), p. 2332 Cell C submission dated 24 November 2017, (non-confidential version), p. 5
Competition dynamics
305. This sub-section provides a high level summary of all submissions regarding competitive dynamics in the South African mobile data market. The majority of the stakeholders are of the view that there are competition issues in the mobile data market, MTN and Vodacom are however of the view that the mobile data market is competitive. Vodacom in particular is of the view that infrastructure based competition is key and that is already happening in the mobile data market.
306. Below is a high level summary of all the submissions regarding competition dynamics.
307. Telkom submits that over the last three years, only Telkom Mobile has significantly reduced mobile data prices while other MNOs have not reduced data prices. Telkom submits that this potentially shows that there are competition issues in the mobile broadband market.329 Telkom also submits that the incumbents, Vodacom and MTN dominate the market and collectively Vodacom and MTN have [] of mobile subscribers and [] of mobile data revenue market shares.330
308. Cell C submits that in the South African MNO market, two incumbent MNOs are dominant on any measure. According to Cell C, MTN and Vodacom have national coverage, whereas Cell C and Telkom Mobile are reliant on roaming services from Vodacom and MTN respectively because they do not have national coverage.331 Cell C further states that Vodacom and MTN‘s market shares have not changed significantly between 2012 and 2016, together Vodacom and MTN have more than 90% market share based on revenue.332
6. MOBILE COMPETITION

99
309. ECN shares similar views and submits that there is no doubt that Vodacom is dominant in the provision of retail mobile data services as its market share is greater than 45% and MTN is likely to account for between 35%-45% of the market share.333 Right2Know also submits that the telecommunications sector is dominated by a few companies and the nature of the market is oligopolistic.334
310. According to Right2Know, the communication sector also acts like a cartel in that costs (prices) are high by world standards.335 A similar view is shared by amandla.mobi who submits that the dominance of MTN and Vodacom is creating an environment conducive for possible collusive behaviour. amandla.mobi further states that Vodacom and MTN‘s dominance has allowed them to keep the price of data high, while creating the illusion for competition by offering promotions that are often temporary.336 DG MT also submits that “it would appear that mobile networks are taking advantage of poorer South Africans by charging them disproportionately high prices for data services”.337 DG MT further states that while mobile operators appear to reduce data prices through special offers, the specials are complicated and are often temporary in nature.338
311. Vodacom is of the view that the mobile market in which data is sold is competitive.339 Vodacom also states that “there is currently strong infrastructure-based competition between the four MNOs”.340 Vodacom further states that notwithstanding differences in market shares, there is competition amongst MNOs across a wide range of dimensions including prices, coverage, data speeds, innovation and customer service. Vodacom further argues that MNOs are in a position to “replicate each other’s’ coverage by extending their own network coverage”341, MNOs are always making substantial investments in order to maintain their market shares and “smaller operators
333 ECN submission dated 01 November 2017(Non-confidential), p. 27334 Right2Know submission dated 01 November 2017, p. 5335 Right2Know submission dated 01 November 2017, p. 10336 amanda.mobi submission dated 02 November 2017, p. 3337 DG MT submission, dated 31 October 2017, p. 2338 DG MT submission, dated 31 October 2017, p. 2339 Vodacom letter (non-confidential version) dated 30 November 2017 (In Cliffe Dekker Hofmeyer’s letter head), p. 1, para. 2.3340 Vodacom letter (non-confidential version) dated 30 November 2017 (In Cliffe Dekker Hofmeyer’s letter head), p.13, para. 1.5.1.1341 Frontier Economics (30 November 2017) Assessing key outcomes in the market for mobile data services in South Africa, p.12 342 Frontier Economics (30 November 2017) Assessing key outcomes in the market for mobile data services in South Africa, p.12343 Vodacom letter (non-confidential version) dated 30 November 2017 (In Cliffe Dekker Hofmeyer’s letterhead), p.13, para. 1.5.1.1344 Vodacom letter (non-confidential version) dated 30 November 2017 (In Cliffe Dekker Hofmeyer’s letterhead), p. 15, para. 2.12345 Transcript of the data market inquiry public hearings 18 October 2018, p.46346 Transcript of the data market inquiry public hearings 18 October 2018, p.30347 MTN submission Non-confidential dated 27 November 2017, p. 21348 MTN submission Non-confidential dated 27 November 2017, p. 21
exert a stronger competitive constraint than is suggested by market shares alone”.342
312. Vodacom further submits that “there are also a number of commercially negotiated national roaming and Mobile Virtual Network Operator (“MVNO”) deals in South Africa, which enable and enhance competition in the mobile retail market”343. Furthermore, Vodacom adds that “with Rain’s entry, the number of operators providing roaming have now increased to three, increasing the options available further”344. Further, Vodacom adds that “the market is very competitive in the way that customers respond to what Telkom is doing. That is they are growing. To gain 5.5% market-share and growing 30-40% in Telkom, you can’t be uncompetitive.345” Vodacom further argues that there is price competition and price competition has led to the introduction of small bundles with short validity.346
313. MTN shares a similar view and submits that “the provision of mobile connectivity and in particular mobile data services in South Africa is highly competitive”347. MTN‘s argument is on the basis that MNOs have made substantial investments in order to improve the quality and the coverage of their networks, MNOs connections quality have considerably improved over time, data usage volume has exponentially risen, average mobile data prices have decreased significant and MNOs are constantly competing to offer consumers the best quality network and the best retail offering.348
314. MTN further argues that the market is competitive at both levels, at the infrastructure level and at the service level. At the infrastructure level, MTN argues that there are six players, although two are undoubtedly larger than the rest, but there is competition. MTN further argues that MTN and Vodacom compete with each other to provide roaming services to Telkom and Cell C. MTN further argues that Telkom and Cell

100
C are able to negotiate prices with MTN and Vodacom before choosing which network to roam on.349 At the retail level, MTN argues that there is a lot of price differentiation and MTN also runs simulations in order to determine what the customers respond to and thereafter they decide on what to deliver and at what price.350
Barriers to entry and expansion
315. This sub-section provides a high level summary of all the submissions regarding barriers to entry and expansion. The majority of the stakeholders are of the view that there are high barriers to entry and expansion.
316. ECN submits that barriers to entry in the provision of mobile ECNS are high because only six ECNS operators have been assigned GSM351 (Global System for Mobile Communications) and other high-demand spectrum. The second barrier identified by ECN is the capital required by operators in order to build a national mobile ECNS network. Based on this, ECN is of the view that there is less competition in the market that needs it the most (or the market in which South Africa needs it the most).352
317. MWEB submits that [].353
318. Telkom submits that it has proven challenging for new mobile operators to enter the mobile broadband market and successfully challenge Vodacom and MTN.354 According to Telkom, this shows that there is a lack of effective competition in the provision of mobile broadband services. Further, Telkom submits that new mobile entrants face substantial barriers to entry and expansion which limit their ability to complete with incumbent operators because amongst others; costs of building and operating the network are high, there is a lack of suitable sites for RAN infrastructure and there are spectrum challenges.355 Telkom further states that although roaming agreements can be concluded to mitigate some of the challenges
349 MTN‘s presentation at the public hearings held on 17-19 October 2018. See Day 2 transcripts, p.107
350 MTN‘s presentation at the public hearings held on 17-19 October 2018. See Day 2 transcripts, p.107-108351 Global System for Mobile Communications- GSM is a standard developed by the European Telecommunications Standards Institute to describe the protocols for second-generation digital cellular networks used by mobile devices such as tablets.352 ECN submission Non-confidential dated 01 November 2017, p. 23 & 25353 MWEB submission dated 01 June 2017, p. 1-3354 Telkom submission Non-confidential dated 17 November 2017, p. 33355 Telkom submission Non-confidential dated 17 November 2017, p. 34356 Telkom submission Non-confidential dated 17 November 2017, p. 34357 Cell C submission Non-confidential dated 24 November 2017, p. 14358 Cell C submission Non-confidential dated 24 November 2017, p. 13-14359 DTPS submission dated 03 November 2017, p. 6
faced by a new entrant, “the terms of these roaming agreements can be unfavourable to entrants or smaller operators with limited bargaining power and could mean that their incremental costs are higher than those of the large mobile network operators, putting them at a commercial disadvantage”.356
319. Cell C submits that “new entrants wishing to enter the market will likely struggle to gain access to existing infrastructure on reasonable terms, as Cell C has struggled since its launch”357. This is on the basis that at the time Cell C entered the market in 2001, only Vodacom and MTN were licensed to provide mobile services. Cell C however concluded a national roaming agreement with Vodacom which allowed Cell C to offer mobile services throughout the country even though at that time Cell C did not have its own network in most areas in South Africa. Cell C however highlights that the ECA or otherwise does not regulate the terms of the roaming agreements. In addition, Cell C states that its roaming agreement with Vodacom does not include LTE roaming and Cell C anticipates that it will be very expensive to obtain the LTE roaming services.358
320. DTPS submits that [].359
6.2. Competition at a retail market level
321. As noted in section 2.2, the retail layer of the telecommunications industry in South Africa concerns the retail of communication services where operators sell their communications services directly to end-users.
322. This section considers the retail of mobile services, both more broadly in terms of voice, SMS and data services, and in terms of data services specifically. While a formal definition of the market in terms of the Competition Act is not needed in conducting a market inquiry, it is likely that the relevant competition market here would be no broader than mobile. Indeed this was the finding of ICASA in respect of its
101
priority markets inquiry360. Of the operators, only Telkom claimed some substitutability between fixed and mobile361, but ICASA found that the market should be defined as no broader than retail mobile services. The submissions to ICASA show that a narrower market for mobile data services could be defined but given the common players and common infrastructure, the dynamics are unlikely to differ significantly. We consider both retail mobile services as a whole as well as retail mobile data services in this section.
6.2.1. Market structure and concentration
323. Since its launch in 1994, the mobile sector as a whole in South Africa has shown significant growth with the widespread and expanding use of mobile devices and services. South Africa’s mobile market consists largely of four MNOs which include Vodacom, MTN, Cell C and Telkom. Vodacom and MTN entered the mobile market in 1994, while Cell C entered the market in 2001 followed by Telkom Mobile (named 8ta) in 2010. There are also a number of MVNOs operating in South Africa, including the likes of Hello Mobile, Virgin Mobile, Me&You Mobile, MRP Mobile, FNB Connect and others. Rain, a fixed-LTE provider and data-only mobile network (which excludes national coverage), entered the mobile market with the launch of its full services in 2018.
324. Submissions to the Inquiry, such as those from Telkom362 and Cell C,363 have highlighted the market structure and concentration issues in the mobile market as they have stated it is concentrated with only four players of which they submit two are dominant players (Vodacom and MTN) with enduring market positions. The features of the mobile market structure are often described as resembling an oligopoly market due to a few large firms controlling the industry.364 Previous work of the Commission has also found concentration issues within the mobile market as covered, for example, in the prohibited Telkom/BCX merger365 and the abandoned Vodacom/Neotel366 and MTN/Telkom367 transactions.
360 ICASA (17 August 2018), Findings Document On Priority Markets Inquiry In The Electronic Communications Sector361 ICASA (17 August 2018), Findings Document On Priority Markets Inquiry In The Electronic Communications Sector , page 24
362 Telkom presentation to Public Hearings 18 October 2018, slide 24363 Cell C presentation to Public Hearings 18 October, slide 5364 ITU, Mobile overtakes Fixed: Implications for Policy and Regulation (2003), p. 23365 Competition Tribunal. Case No: 51/LM/Jun06366 Competition Tribunal. Case No: 2014Jul0382367 Competition Commission (2015) Media release- MTN/Telkom transaction. [Online]. Available at: http://www.compcom.co.za/wp-content/ uploads/2015/01/Commission-recommends-prohibition-of-MTN-and-Telkom-merger.pdf [Accessed on 10 February 2019]368 ICASA. 2018. 3rd Report of the state of the ICT sector in South Africa. Appendix 2, p. 61.
325. This section provides a brief overview of South Africa’s mobile market from a market structure perspective, which includes current and historic information on the number of players in the mobile market and the market shares of those players. The market share information covers the operators’ market shares of mobile retail services more broadly, by reported service revenue and subscriber numbers, followed by an overview of the more narrow mobile data services market shares by revenue and traffic volumes. This section also notes the effect of infrastructure on the market structure at a retail level.
Total service revenue and subscriber market share
326. Although market share information for mobile operators is often reported according to subscriber numbers, the Commission views operator market shares by revenue as a more relevant indicator in that it likely provides a more robust indication of market power whereas subscriber numbers may include both large and small users. This section does, however, also include a look at subscriber market shares in that it can offer additional evidence on the operators’ market shares currently and over time.
327. Mobile services revenue is defined by ICASA as “…retail revenue earned from the provision of mobile-cellular communication services, including all voice, SMS and data services offered by mobile operators offering services within the country during the financial year under review”.368 When reviewing the operators’ reported service revenues for 2018, the figure below shows that Vodacom has 49.8% share of the mobile market in terms of service revenue. MTN has the second largest revenue share with a market share of 33.5%, while Cell C and Telkom have significantly less revenue share at 12% and 4.7% respectively. This current view of the mobile market appears to confirm the general view of a concentrated mobile market in South Africa where there exists two larger players, Vodacom and MTN, accounting for the majority of the market between them (at more than 80%) in terms of service revenue.

102
329. As noted above, this section also considers the additional market structure evidence provided by assessing market shares based on operator subscriber numbers, which are typically measured by the number of active SIM cards across voice, SMS and data services over a three-month period. The figure below shows the operator subscriber market shares for 2018. What seems clear from the current picture of subscriber shares is that Vodacom has the largest share of subscribers for 2018 with a 43.8% market share, and MTN again has the second largest share with 31.8%
369 Business Tech (2018) South African Mobile market share Vodacom vs MTN vs Cell C vs Telkom. Available at: https://businesstech.co.za/ news/mobile/266423/south-african-mobile-market-share-vodacom-vs-mtn-vs-cell-c-vs-telkom/ [Accessed on 10 March 2019]
of subscribers. Cell C has a smaller share of 17.2% of subscribers, while Telkom only has 5% market share. The MVNOs in the South African mobile market include the likes of Hello Mobile, Virgin Mobile, Me&You Mobile, MRP Mobile, FNB Connect, which run on Cell C’s network. The MVNOs, however, only account for less than 2% market share in terms of subscriber numbers in 2018.369 Rain, a data-only mobile network launched its services in 2018, but remained very small at the time of conducting this assessment and is therefore not shown in these figures.
Figure 31: Operator Service Revenue share (2018)
Source: Operators’ Annual Financial Statements, Integrated Reports, Financial statements and Results presentations. Results as per financial year, except Cell C (as at end of December for each respective year).
328. When comparing operators’ reported annual service revenues over time, Figure 32 below also indicates that Vodacom and MTN are the larger operators in the mobile market with a combined service revenue share of above 80% from 2015 to 2018. The historic view of service revenue shares shows the trend of largely constant market shares as there has been minimal change for each of the four operators’ shares over the period. The smaller competitors Cell C and Telkom have consistently accounted for a minor stake of the mobile market, while the larger operators continually form the bulk of the service revenue.
Figure 32: Operator Service Revenue share (2015 – 2018)
Source: Operators’ Annual Financial Statements, Integrated Reports, Financial statements and Results presentations. Results as per financial year, except Cell C (as at end of December for each respective year).

103
370 BusinessTech (2018) South African Mobile market share Vodacom vs MTN vs Cell C vs Telkom. Available at: https://businesstech.co.za/ news/mobile/266423/south-african-mobile-market-share-vodacom-vs-mtn-vs-cell-c-vs-telkom/ [Accessed on 10 March 2019].371 BusinessTech. 2018. South African Mobile market share Vodacom vs MTN vs Cell C vs Telkom. Available at: https://businesstech.co.za/ news/mobile/266423/south-african-mobile-market-share-vodacom-vs-mtn-vs-cell-c-vs-telkom/ [Accessed on 10 March 2019].
Figure 33: Operator Subscriber market share (2018)
Source: adapted from Business Tech article (2018)370
330. The figure below covers the main operators’ subscriber market shares over time to assess the trend of subscriber shares for the period 2010 to 2018. The mobile market appears concentrated around two players, Vodacom and MTN, who have consistently covered more than a 70% market share of subscribers in the mobile market from 2010 to 2018. The figure below suggests that the later entrants Cell C and Telkom have not been able to bring much competitive pressure into the mobile market as they have struggled to maintain significant portions of subscriber market share over time. Vodacom and MTN, however, show enduring market positions in the mobile market, despite the market entry of the smaller players. The subscriber shares over time show that the MVNOs have not been able to attract significant customers over the years, with less than 2% market share, and have therefore not made any substantial inroads into the mobile market in South Africa. While Cell C was able to make inroads in terms of subscriber share in 2014 and 2015, these gains were reversed in later years.
Figure 34: Operators subscriber market share (2010 – 2018)
Source: 2010 – 2017 data for operators adapted from RIA written submission to Data Inquiry Public Hearings (11 October 2018) and 2018 operator data and MNVO data (2011- 2018) taken from Business Tech article (2018) 371
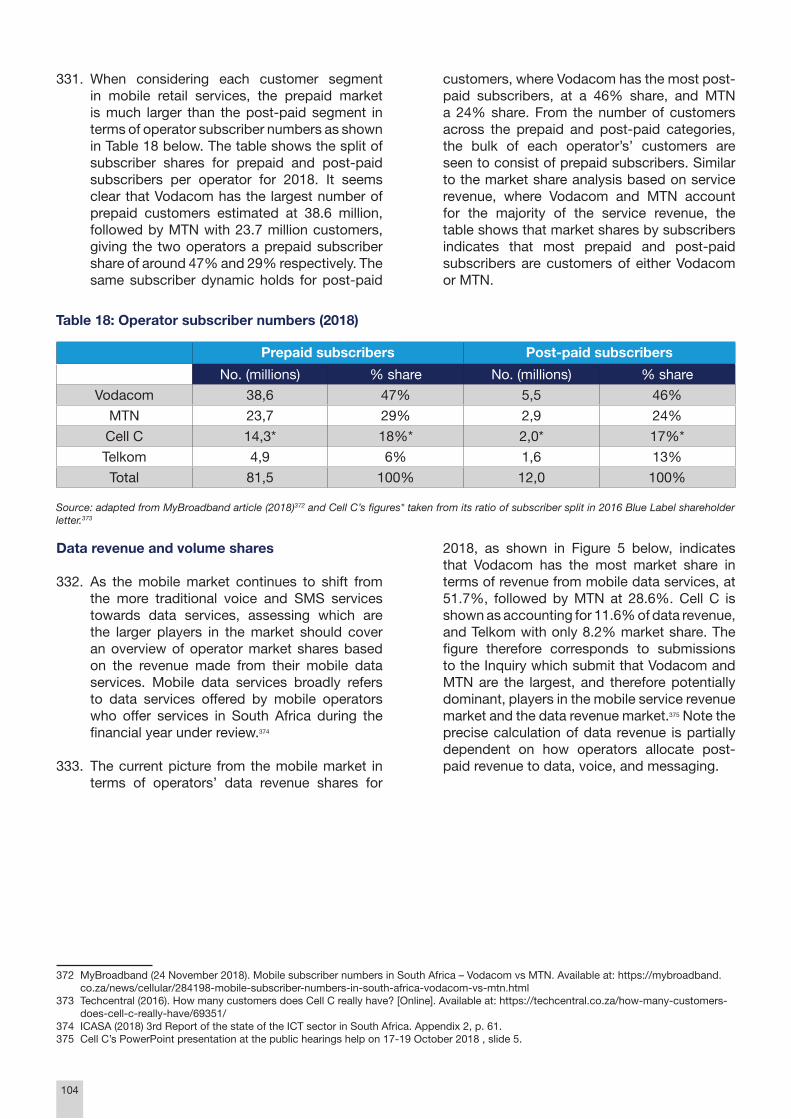
104
331. When considering each customer segment in mobile retail services, the prepaid market is much larger than the post-paid segment in terms of operator subscriber numbers as shown in Table 18 below. The table shows the split of subscriber shares for prepaid and post-paid subscribers per operator for 2018. It seems clear that Vodacom has the largest number of prepaid customers estimated at 38.6 million, followed by MTN with 23.7 million customers, giving the two operators a prepaid subscriber share of around 47% and 29% respectively. The same subscriber dynamic holds for post-paid
372 MyBroadband (24 November 2018). Mobile subscriber numbers in South Africa – Vodacom vs MTN. Available at: https://mybroadband. co.za/news/cellular/284198-mobile-subscriber-numbers-in-south-africa-vodacom-vs-mtn.html373 Techcentral (2016). How many customers does Cell C really have? [Online]. Available at: https://techcentral.co.za/how-many-customers- does-cell-c-really-have/69351/374 ICASA (2018) 3rd Report of the state of the ICT sector in South Africa. Appendix 2, p. 61.375 Cell C’s PowerPoint presentation at the public hearings help on 17-19 October 2018 , slide 5.
customers, where Vodacom has the most post-paid subscribers, at a 46% share, and MTN a 24% share. From the number of customers across the prepaid and post-paid categories, the bulk of each operator’s’ customers are seen to consist of prepaid subscribers. Similar to the market share analysis based on service revenue, where Vodacom and MTN account for the majority of the service revenue, the table shows that market shares by subscribers indicates that most prepaid and post-paid subscribers are customers of either Vodacom or MTN.
Data revenue and volume shares
332. As the mobile market continues to shift from the more traditional voice and SMS services towards data services, assessing which are the larger players in the market should cover an overview of operator market shares based on the revenue made from their mobile data services. Mobile data services broadly refers to data services offered by mobile operators who offer services in South Africa during the financial year under review.374
333. The current picture from the mobile market in terms of operators’ data revenue shares for
2018, as shown in Figure 5 below, indicates that Vodacom has the most market share in terms of revenue from mobile data services, at 51.7%, followed by MTN at 28.6%. Cell C is shown as accounting for 11.6% of data revenue, and Telkom with only 8.2% market share. The figure therefore corresponds to submissions to the Inquiry which submit that Vodacom and MTN are the largest, and therefore potentially dominant, players in the mobile service revenue market and the data revenue market.375 Note the precise calculation of data revenue is partially dependent on how operators allocate post-paid revenue to data, voice, and messaging.
Prepaid subscribers Post-paid subscribers
No. (millions) % share No. (millions) % share
Vodacom 38,6 47% 5,5 46%
MTN 23,7 29% 2,9 24%
Cell C 14,3* 18%* 2,0* 17%*
Telkom 4,9 6% 1,6 13%
Total 81,5 100% 12,0 100%
Table 18: Operator subscriber numbers (2018)
Source: adapted from MyBroadband article (2018)372 and Cell C’s figures* taken from its ratio of subscriber split in 2016 Blue Label shareholder letter.373

105
335. In terms of mobile customer segment revenue, the figure below shows the quarterly market shares of operators according to their prepaid data revenue shares from Q3 2016 to Q1 2018, using data submitted the Commission by the operators. What is clearly observed in the figure is that Vodacom and MTN combined currently, as of Q1 2018, have the largest shares of prepaid data revenues in the mobile market, accounting
for more than [] of prepaid data revenue. This status quo also holds for the period Q3 2016 to Q1 2018, where the market shares have remained constant over time with the two larger players accounting for most of the prepaid data revenue, and the smaller players accounting for much smaller shares of the market ([] for Cell C and [] for Telkom).
Figure 35: Operator Data Revenue share (2018)
Source: Operators’ Annual Financial Statements, Integrated Reports, Financial statements and Results presentations. Results as per financial year, except Cell C (as at end of December for each respective year).
334. The figure below shows data revenue share by operator from a historic perspective covering the period 2015 to 2018. Even though Cell C and Telkom gained a small measure of data revenue share over the period, MTN and particularly Vodacom have made up the bulk of data revenue in the mobile market and continue to do so with a combined data revenue share of over 80%. Between the two larger players, MTN has shown a decline in its share of data revenue since 2015, while Vodacom has shown increases in its share of data revenue over the period. While showing more variation than shares at a service level, data revenues shares have been reasonably constant over time. If anything, it appears that Vodacom has gained share at MTN’s expense, while Cell C and Telkom have grown but remain relatively small.
Figure 36: Operator market shares, Data Revenue (2015 – 2018)
Source: Operators’ Annual Financial Statements, Integrated Reports, Financial statements and Results presentations. Results as per financial year, except Cell C (as at end of December for each respective year).

106
336. When looking at operators’ share of data traffic in terabytes, as shown in Figure 38 below, it is observed that Telkom’s share of data traffic (in terabytes) has grown over the period to become the [] share as Telkom utilises more of its mobile network capacity and its high-frequency spectrum for larger volume products. We note, however, that this has not translated into more value for Telkom in terms of increased revenue shares in the prepaid and post-paid mobile segments. The fact that Vodacom dominates
revenues and not traffic does indicate that it has some pricing power, or is at least able to price to a large extent independently of operators such as Telkom Mobile. Vodacom’s data traffic share has shown a slight decrease since June 2016 (from what appears as a result of Telkom’s increased share of traffic), while MTN’s share has remained fairly constant over the period. Of the four operators, Cell C is shown to have the [] share of data traffic.
Figure 37: Operator market share, Prepaid Data Revenue (Q3 2016 - Q1 2018)
Source: Operators’ submissions to the Data Inquiry
Figure 38: Operator data traffic market share (June 2016 – March 2018)
Source: Operators’ submissions to the Data Inquiry
[]
[]

107
Infrastructure and mobile retail services
337. When considering the market structure and concentration of the mobile market at a retail level, it is important to note that the history of investment in infrastructure and the vertical relationship between the larger and smaller firms in terms of access to infrastructure through roaming could have a major effect on the ability of the smaller firms to compete and on market structure at the retail level more broadly.
338. Vodacom and MTN were the first operators to enter the mobile market in 1994, where they operated as the only two operators for 7 years, after which Cell entered the market in 2001. Telkom Mobile only entered the market 9 years after Cell C. This context has resulted in a market structure where only Vodacom and MTN have been able to build up their networks to a national coverage level and thus the challenger networks (Cell C and Telkom) rely on the bigger players to provide a national roaming service. Consequently, the ability of the challenger operators to compete in the retail mobile market is perhaps less than what their market shares would suggest as the additional marginal (variable) costs involved in roaming mean that the smaller players are less able to compete on pricing. The persistent low market shares themselves may suggest that the newer operators are limited in their ability to constrain the larger operators.
339. Market research and previous telecommunications cases376 suggest that the larger operators are also better placed to compete beyond the price of their services as they are able leverage their market positions to investing in their networks in order to provide better quality and coverage of their mobile services.377 The larger operators have []378. Within South Africa’s mobile market, [].379
Conclusion
340. The market share figures, across subscriber numbers and revenues (whether service revenue or data revenue) convey a concentrated mobile market where Vodacom and MTN hold the majority of market share in South Africa’s retail mobile market, while the later entrants, Cell C and Telkom, have struggled to gain a presence
376 Competition Tribunal. Case No: 2014Jul0382. Mergers and Acquisitions’ Report. Available at: https://www.comptrib.co.za/assets/Up loads/vodacom-neotel_non-confidential-report.pdf [Accessed on 10 February 2019]377 RIA (2018) Dominant operator’s data prices remain static while SA struggles to get and stay online. Policy Brief 1, p. 6378 Genesis Analytics (2015) Competitive Assessment of the Proposed Vodacom Acquisition of Neotel (Confidential version), p. 8379 Genesis Analytics (2015) Competitive Assessment of the Proposed Vodacom Acquisition of Neotel (Confidential version), p. 11
in the market and thereby remain small relative to the incumbents. The same status quo from the mobile market exists in the market for mobile data services as the bulk of data revenue shares lie with Vodacom and MTN. What is also evident is that the market position and shares of the firms have remained relatively consistent over time in the mobile market. From the market structure evidence and the submissions to the Inquiry, the mobile market in South Africa seems to resemble an oligopoly market structure as there are indications that the market is concentrated and dominated by a small number of firms.
341. The results from this section have therefore highlighted the extent of difference between the strong positions of the market leaders in retail mobile services, Vodacom and MTN, and the relatively smaller positions of the smaller competitors, Cell C and Telkom. The figures and tables reflect the durability of the larger players’ positions despite attempts by the challenger networks to gain market share. Even aspects which are not in themselves directly related to the retail market, such as infrastructure, bear influence on the retail mobile market as advantageous infrastructure ownership can impact an operators’ retail performance where it could influence its ability to invest in the provision of better quality mobile services.
6.2.2. The extent of pricing pressure
342. In this sub-section, we analyse data prices over time to determine what trends are noticeable and whether the larger operators are responsive to pricing pressure brought by the challenger networks. Firstly, we analyse headline data prices (prepaid and post-paid prices) for the four main MNOs. We then analyse relative pricing on revenue per GB (prepaid and post-paid prices) for the four main MNOs. Thereafter, we provide preliminary views.
Relative pricing on headline prices: Prepaid
343. We commence this assessment by analysing prepaid and post-paid headline data prices for selected bundles over time. As also alluded to in Section 4 above, headline prices are the most relevant basis for an analysis of relative pricing and pricing pressure across the MNOs.

108
343.1. Effective prices cannot be observed by consumers and therefore their purchase decisions are more likely to be influenced by headline prices and changes to headline prices. When consumers refer to the costs of mobile data, they are referring to headline data prices.
343.2. Headline data prices are also available to all consumers all of the time. While there is product differentiation (and therefore price discrimination) at a headline level across different bundles sizes and validity periods, for a specific bundle, both marginal consumers and infra-marginal consumers benefit from a decrease in the headline price.
343.3. However, personalised or private pricing cannot be observed prior to purchase by consumers and may be used by MNOs in order to extract maximum rents from individual consumers. Personalised pricing also appears to be aimed at getting consumers to purchase more data once the consumer has already made a purchase (based on headline prices). It appears to be aimed, at least in some instances, at driving MNOs’ volumes where capacity is available. See for instance this quote from MTN during the public hearings:
380 MTN’s presentation at the public hearings held on 17-19 October 2018. See Day 2 transcripts, p. 106, line 5-9
343.4. “because of people spend what we try to do is differentiate…you essentially use(sic) the AI technology spoken(sic) about and the machine learning tools to price for the customer […] so if you are spending 10 Rands a month in data what we will try to do is scratch you to 15 rand but for that we could give you a gig right“380
344. In most instances, we have included both smaller and large data bundles in this assessment in order to analyse data prices by high-volume users (richer consumers) and low-volume users (mostly likely low-income consumers).
345. Below we analyse the prices of 20-30MB prepaid bundles valid for a month over time. We analyse the 20-30MB bundles together because the four main MNOs do not offer the same small bundle size. As the graphic below shows, Cell C initially charged the cheapest price in the 20-30MB prepaid bundles category until Cell C increased its price in July 2016 and again in February 2017. Telkom substantially decreased its 25MB bundle price in August 2015. Vodacom and MTN had not followed Cell C’s lower price initially, and also did not respond to Telkom’s price reduction. In fact, MTN increased its price for a 20MB bundle of data in May 2015.
Figure 39: 20-30MB prepaid bundles valid 1 month (in Rands)
Source: Tarifica, operators’ catalogues, websites and online sources
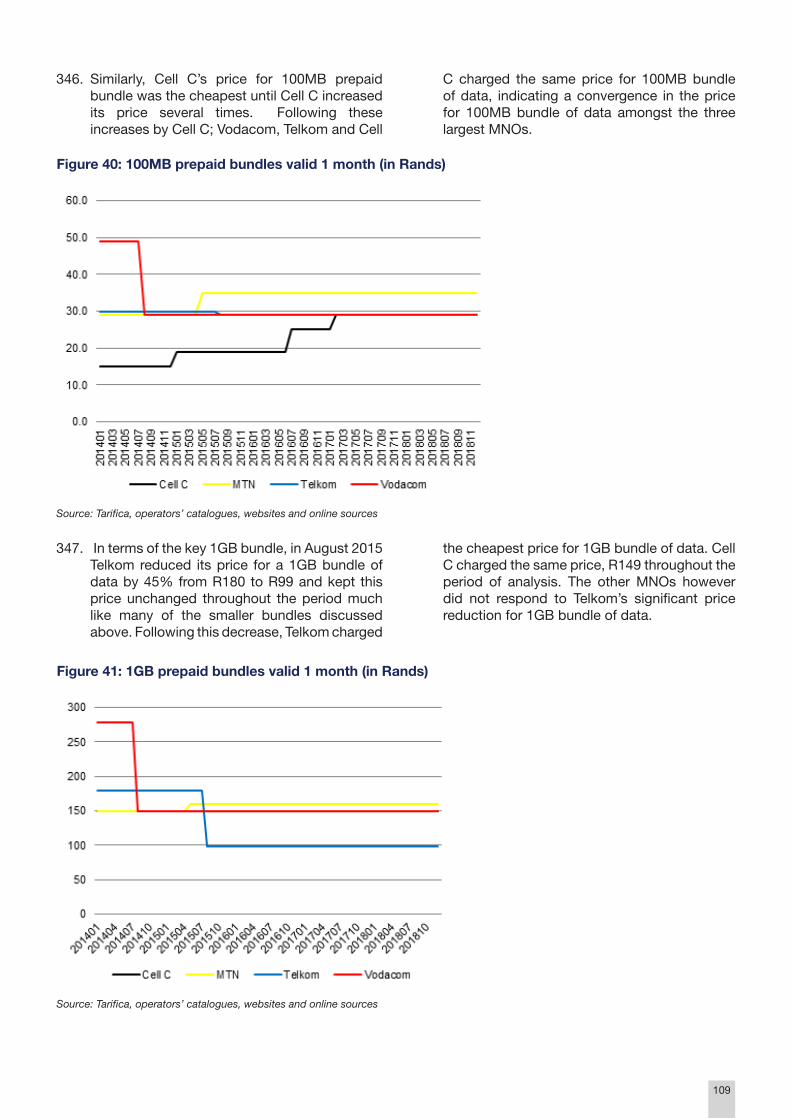
109
346. Similarly, Cell C’s price for 100MB prepaid bundle was the cheapest until Cell C increased its price several times. Following these increases by Cell C; Vodacom, Telkom and Cell
C charged the same price for 100MB bundle of data, indicating a convergence in the price for 100MB bundle of data amongst the three largest MNOs.
347. In terms of the key 1GB bundle, in August 2015 Telkom reduced its price for a 1GB bundle of data by 45% from R180 to R99 and kept this price unchanged throughout the period much like many of the smaller bundles discussed above. Following this decrease, Telkom charged
the cheapest price for 1GB bundle of data. Cell C charged the same price, R149 throughout the period of analysis. The other MNOs however did not respond to Telkom’s significant price reduction for 1GB bundle of data.
Figure 40: 100MB prepaid bundles valid 1 month (in Rands)
Source: Tarifica, operators’ catalogues, websites and online sources
Figure 41: 1GB prepaid bundles valid 1 month (in Rands)
Source: Tarifica, operators’ catalogues, websites and online sources

110
348. During the public hearings, Vodacom and MTN were specifically requested to respond as to why they did not respond to Telkom’s price reduction for 1GB bundle of data.
348.1. Vodacom argued that they responded in a different way.
348.2. Firstly, Vodacom submits that they added an extra 1GB of data in terms of night data and that only consumers can judge whether this is completely comparable with Telkom’s bundle. Secondly, Vodacom argued that 80% of their customers are buying daily and weekly bundles, so they introduced R12, R29, R79 and R99 daily/weekly bundles in order to compete with Telkom.381 On this basis, Vodacom argued that there is price competition and this has led to the introduction of smaller bundles with short validity.382 Further, Vodacom argued that “If I drop the price new, I will end up with a background loss which essentially means that I don’t have the money to drop the prices for everyone else as you asked; do I drop it across the board. So, that’s the issue. But also, I need the money to be able to invest because without doing anything, with that traffic growing 50% a year, I need the R 9.2 billion to put in to just keep up with the pace”.383
348.3. Firstly, the introduction of smaller bundles with shorter validity period cannot be regarded as a direct competitive response by Vodacom as these products (a 1GB bundle over 30 days and 1GB bundle for 1 week or 1 day) are not equivalent. Secondly, by arguing that Vodacom would have realised lower profits had Vodacom responded to Telkom’s price reduction shows that for Vodacom, the profit maximising strategy was not to follow Telkom’s price reduction which means that Vodacom is able to act independently of their competitors on pricing to a large extent.
381 Vodacom’s presentation at the public hearings held on 17-19 October 2018. See Day 2 transcripts, p. 45-46, line 15-27382 Vodacom‘s presentation at the public hearings held on 17-19 October 2018. See Day 2 transcripts, p. p.30383 Vodacom’s presentation at the public hearings held on 17-19 October 2018. See Day 2 transcripts, p. 46, line 11-16384 MTN’s presentation at the public hearings held on 17-19 October 2018. See Day 2 transcripts, p. 100, line 15-18385 MTN’s presentation at the public hearings held on 17-19 October 2018. See Day 2 transcripts, p. 102, line 6-11386 Frontier Economics (30 November 2017) Assessing key outcomes in the market for mobile data services in South Africa (non-confidential version), p.12 387 Transcript of the data market inquiry public hearings 18 October 2018, p.46
348.4. MTN also shares similar views and submits that “the majority of the people on the yellow network use the hourly bundles, the day bundles and the weekly bundles and the weekly bundles are actually cheaper than the monthly bundles ....”384
348.5. Further, MTN states that “Telkom has been very successful in terms of recruiting customers and growing traffic and also doing a good job pushing the competition. We normally test these things like the 149 that you are taking about we will run simulations, we will see the responses from customer, we will see the response from the network perspective from those kind of analyses we decided we are going to compete the different way”.385
348.6. Again, the introduction of smaller bundles with shorter validity period cannot be regarded as a competitive response. The implication from MTN’s statement is that the response to Telkom from customers was not sufficiently large to mean that MTN needed to adjust its pricing on a comparable product.
349. Vodacom in their initial submission also argued that MNOs are always making substantial investments in order to maintain their market shares and “smaller operators exert a stronger competitive constraint than is suggested by market share alone”.386 Vodacom further argued during the public hearings that “The market is very competitive in the way that customers respond to what Telkom is doing. That is they are growing. To gain 5.5% market-share and growing 30-40% in Telkom, you can’t be uncompetitive”. 387
350. However, the evidence does not support the arguments that smaller operators exert a stronger competitive constraint than is suggested by market share alone and that the market is competitive in the way that the customers have responded to what Telkom is doing.

111
350.1. Firstly, while Cell C describes itself as a disruptor in the market and historically has priced lower than its larger rivals, the data suggests that more recently Cell C has begun to adjust pricing upwards in order to follow the pricing pattern of MTN and Vodacom. Beyond these price increases, the figure below which shows Cell C prepaid bundle prices, also paints a picture of largely unchanging prices over the period and hence not seeking to challenge pricing of larger operators to gain share. This suggests a softening of competition in the market or even a
realisation from Cell C that it is more profitable to follow the price leadership of the larger networks rather than compete aggressively. Whether Cell C is unable to encourage sufficient levels of switching at lower prices, discouraged from being aggressive by high levels of debt or grown sufficiently such that its incentives have changed, the evidence suggests a market that is not sufficiently competitive to start with, or a market that has become less competitive over time.
350.2. Secondly, it is only Telkom currently that is pricing more aggressively but other operators are not following it down on headline prices. If smaller operators like Telkom exerted a stronger competitive constraint than is suggested by market share alone, MTN and Vodacom would have decreased their prices for 1GB bundle of data in response to Telkom’s significant price reduction. The fact that MTN and Vodacom did not reduce their prices for 1GB bundle of data suggests that they act independently of their competitors and thus an indication of market power and competition concerns in the market.
350.3. In addition, market shares do in fact give an indication of competitive constraint. Based on the reasoning by the larger networks, revenue and profits do matter for network investment. However, as highlighted in section 6.2.1 above, on a revenue basis Vodacom and MTN hold the majority of market share in South Africa’s retail mobile market, while the later entrants, Cell C and Telkom, have struggled to gain a presence in the market and thereby remain small relative to the incumbents. Furthermore, as further highlighted in section 6.2.1, the market position and shares of the firms have remained relatively consistent over time and this is an indication that the larger operators’ failure to respond to
Figure 42: Cell C prepaid prices for different data bundle sizes
Source: Tarifica, operators’ catalogues, websites and online sources

112
a more aggressive pricing strategy by Telkom has not harmed them materially, again reflecting the ability to price to a large extent independently of their competitor.
351. A further concerning trend is that headline data prices (especially prepaid data bundle prices) have not been decreasing every year which should be expected in the context where volumes are growing and hence unit costs should be decreasing based on operator submissions around the cost structure. In this regard, RIA submits that “there is evidence of minimal pricing competition among operators. The 1 GB prices in South Africa have remained constant for more than nine quarters, since Q3 2015”388. Telkom shares the same view and submits that “for many of the large mobile network operators, however, mobile data prices have been relatively static, over the past four years”389.
352. Based on the foregoing observed patterns, we are of the view that headline data prices are not
388 RIA’s submission dated 11 October 2018, p.8389 Telkom’s submission dated 17 November 2017 (non-confidential version), p. 22390 The post-paid contracts typically include data, voice and messages. The post-paid tariff plans are offered on month-to-month basis or with commitment periods of 6, 12, 24 and 36 months. Therefore, the cost of mobile data is not comparable directly across operators, unless they have the same contract length and no voice minutes and messages are included in the bundle. Also, the comparison over time is difficult because old tariffs are withdrawn and replaced by new ones with difference allowances
moving in a manner consistent with aggressive competitive interaction between MNOs and a highly competitive retail mobile market for prepaid bundles.
Relative headline pricing: Post-paid390
353. As shown in the graphic below, the post-paid analysis for the key 1GB bundles shows similar patterns to the prepaid headline pricing above. Cell C was historically the cheapest but has been increasing its price, not decreasing, as other operators seemingly did not respond to those lower prices. Vodacom’s price for 1GB post-paid data bundle is higher than the prices charged by other MNOs. Telkom’s price is the lowest throughout the period and again other MNOs did not reduce their prices to match Telkom’s price. MTN has been making their offerings a little more competitive in this post-paid segment which may be part of their strategy to regain some lost market share from Vodacom. However, it is still not at the Telkom Mobile level.
354. As observed below, on the 5GB bundle MTN reduced their price several times and they currently charge the same price for 5GB bundle of data as Cell C and Telkom. We therefore observe a convergence in the price for 5GB bundle of data for the three MNOs.
355. However, Vodacom has not reduced its prices and currently charges the highest price for 5GB bundle of data. Prices have also remained unchanged since mid-2016 which suggest a lack of active competition on headline prices for a few years.355. We now turn our attention to effective prices.
Figure 43: Post-paid contract with 1GB without device (in Rands)
Source: Tarifica, operators’ catalogues, websites and online sources

113
Relative pricing on revenue per GB
356. During the public hearings, Vodacom and MTN specifically argued that their effective prices have decreased significantly over time. In order to try test this assertion, the Commission calculated effective prices for each MNO over time from the revenue and usage data submitted by MNOs. From the submitted data, we divided data revenue by data usage to derive revenue per GB for each MNO. The Commission has comparable data from all the MNOs from June 2016 to March 2018 and thus our period of analysis is from June 2016 to March 2018.
357. However, the major difficulty with this measure is that it does not necessarily reflect or capture the extent of decline in effective prices for different bundles, but rather may reflect the fact that certain consumers are using more data volumes and hence buying into larger bundles which are priced lower on a per GB basis than smaller bundles as outlined in detail in the previous section.
357.1. This is confirmed by Vodacom which states that “you have the price itself coming down, but you also people buying bigger bundles. So, as people buy bigger bundles, the rates get cheaper, okay. So basically what then happens is the effective price drops”.391
357.2. Whilst it may be argued that in such a case for that person the effective price has come down, it is evident that this is
391 Transcript of the data market inquiry public hearings 18 October 2018, p. 22
simply a symptom of higher volumes of data usage which are being driven by other factors such as the burgeoning online content, not lower effective pricing on a bundle-by-bundle basis which is what we are mainly interested in.
357.3. In order to properly measure effective price changes, one would need to undertake the same exercise as outlined in section 4, whereby one looks at the effective price for different bundles purchased but do so over time.
358. As a result, observing a decline in the revenue per GB does not necessarily equate to an observation of lower effective prices, and so there is a limited value to be derived from this measure. This is especially as we know data usage by individual consumers is increasing and therefore expect revenue per GB to be falling over time even if prices did not decline. However, the measure may still be informative on a relative basis. This is because relative revenue per GB may provide some information about the extent of competition across all bundles and including free data. If indeed free or promotional data has been used as a means of competitive response, then we would expect that the effective revenue per GB to converge more closely than the headline pricing above.
359. Below we show the revenue per GB of data for all the MNOs over time. As the graphics below demonstrate, whilst revenue per GB has been coming down (as expected based on increased
Figure 44: Post-paid contract with 5GB without device (in Rands)
Source: Tarifica, operators’ catalogues, websites and online sources

114
usage), Vodacom and MTN’s revenue per GB is [] and have not declined at a faster pace []. Indeed, revenue per GB for Vodacom and MTN have declined more slowly than Telkom in particular. The graphics also demonstrate that even on this measure, Cell C’s revenue per GB has increased recently which is consistent with increasing headline prices.
360. As with headline prices, this evidence does not suggest robust price competition from the larger networks in response to the challenger networks. Whilst effective prices are completely untransparent to consumers, to the
extent revenue per GB captures other alleged competitive efforts like free data, it still does not seem that MTN and Vodacom have reacted to Telkom and Cell C in a material way. In fact, MTN and Vodacom’s revenue per GB have largely followed the same pattern, perhaps indicating that the two largest MNOs only react to each other’s competitive pressure, or that the decrease in effective pricing is merely a function of the increase in market volumes driven by investment in 4G and greater demand from consumers given quality improvements and new data uses.
Figure 45: Prepaid revenue per GB
Source: Operators’ submissions to the Inquiry (confidential)
Figure 46: Prepaid revenue per GB (indexed)
Source: Operators’ submissions to the Data Inquiry’s request for information
[]

115
361. Post-paid is more difficult to analyse given that some operators have hybrid packages which do not fit neatly within one or the other category. We have elected to combine these under post-paid. There is also the difficulty that post-paid packages may be combined with voice, SMS and handsets and how operators elect to allocate overall service revenue to data as opposed to these other services may differ. For this reason we place less store in the results for post-paid analysis.
362. However, even with these potential anomalies, post-paid revenue per GB follows a similar pattern to prepaid with the exception that []. [] is the one operator with [], and it may also allocate revenue in a different manner. Regardless however, [] revenue per GB is materially higher than [] for the entire period of analysis, reflecting that it seems able to price to a large extent independently of its competitors.
363. MTN in their initial submission argued that increased data usage is itself direct evidence of strong competition in this market.392 MTN initially also argued that average mobile data prices have decreased significantly and that this was an indication of a competitive market.393 In motivating this point, MTN states that “the volume of mobile data handled by MTN has grown 18 times in the past 5 years, while MTN’s data prices have fallen by 85% over this same period, and its 4G LTE handset prices have fallen by 86% over the past 3 years”. 394
364. As discussed above, increased data usage is unlikely to be evidence of strong competition in the market as other factors drive data usage regardless of pricing, and so-called effective prices measured as revenue per GB more likely reflect growing usage rather than lower prices. Given that headline prices have remained fairly constant and there is little evidence of smaller players being able to constrain larger players, the increase in market volumes is more likely driven by investment in 4G and network capacity and greater demand from consumers given quality improvements, changes in consumption patterns of consumers who purchase more larger, cheaper bundles, as alluded to by Vodacom above as well as product differentiation.395 Operators themselves
392 MTN’s submission dated 27 November 2017 (non-confidential), p. 21393 MTN’s submission dated 27 November 2017 (non-confidential), p. 21394 MTN’s submission dated 27 November 2017 (non-confidential), p. 21395 Transcript of the data market inquiry public hearings 18 October 2018, page 22, 27, 99, 100396 Frontier Economics report (Non-Confidential version) in Vodacom’s submission dated 10 October 2017, p. 10
point to the roll-out of new technology and how this increases capacity and decreases per unit costs. Vodacom (through Frontier Economics) also directly linked decreases in effective prices to new technologies when it submits that “Vodacom’s effective data prices have fallen in each year between 2013 and 2017 leading to a total decrease in data prices of 62% between 2013 and 2017, as a result of increasing data usage and the migration of more advanced technologies, such as 4G”396.
Observations from headline prices and revenue per GB over time
365. As shown above, headline data prices have not decreased substantially across all MNOs in recent years. Telkom did decrease its prices substantially but other MNOs did not react to Telkom’s decrease in prices. Cell C’s initial prices for some smaller bundles of data were the cheapest in the market but Cell C subsequently increased its prices for these smaller bundles of data. Overall, Vodacom’s prices []. This suggests a lack of robust price competition, price following behavior, and potentially dominance on the part of one or both of Vodacom and MTN.
366. Although revenue per GB has decreased materially for all operators, this does not necessarily reflect a decrease in effective prices (i.e. headline price alongside free and promotionally priced data) but is equally caused by increased volume usage driven by other factors. As such, this is unable to inform us of changes in effective prices, but the relative revenue per GB is informative insofar as it too indicates that the larger networks are able to extract []. This is indicative of [] and again consistent with an indication of a lack of robust competition and the ability of larger networks to price to a large extent independently of the challenger networks.
367. The Inquiry also remains materially concerned about movements in headline data prices because headline data prices are costs incurred by all consumers (marginal consumers, infra-marginal consumers and low-income consumers) when using data services. They are also the main mechanism by which pricing pressure may be transmitted to the entire

116
market, whereas more personalized offerings do not play this transmission role. In addition, they are completely untransparent insofar as consumers have no specific knowledge on the effective rate they pay considering in-bundle rates, free data and when data expires. This makes it extremely difficult for consumers to compare effective prices across MNOs and move operators in response to such differences. As a result, the overall role of pricing as a means to facilitate competition is lost and this pricing structure blunts competitive forces. This reduces price competition, enabling the larger networks to behave to a large extent independently of the challenger networks.
6.2.3. Market features that hinder later entrants
368. First mover advantages are a common feature of telecommunications markets (as discussed in Section 2.3 and 10.1 of Appendix B below) and appears to be at play here in South Africa, where submissions suggest that Vodacom and MTN have significant first-mover advantages relative to the other MNOs in the country. Both entered the mobile market in 1994 while Cell C entered in 2001 and Telkom entered in 2010. As shown above, first movers Vodacom and MTN are significantly larger than the two later entrants on a range of measures. Market shares have been relatively constant, with Cell C and Telkom unable to take significant market share from the incumbents in the 18 and 9 years of operations respectively.397 The enduring dominance of Vodacom and MTN is according to Telkom “detrimental to consumers and also in the long run, it’s detrimental to competition”398.
369. All submissions on this issue received by the Inquiry appear to agree that Vodacom and MTN have significant first-mover advantages.399 These advantages include (a) the ability to reinvest profits into capital expenditure, (b) economies of scale from large fixed costs which enabled Vodacom and MTN to be more competitive than newer competitors, (c) better site locations, (d) a head start in attracting mobile customers who tend to be ‘sticky’, a problem which is further
397 RIA’s written submission for the public hearings dated 11 October 2018, par. 7398 Telkom’s presentation at the public hearings held on 17-19 October 2018. See Day 2 Transcripts, p.145-146399 Cell C’s submission dated 24 November 2017 (Non-confidential), p. 9-10; Telkom’s submission dated 17 November 2017 (non- confidential), p. 34-35; Telkom’s submission dated 15 October 2018 (Confirmed as non-confidential on 29 March 2019), p.19-20, 22; RIA’s submission dated 11 October 2018, para. 7; RIA’s PowerPoint presentation at the public hearings on 17 October 2018, Slide 15400 Vodacom’s presentation to the Public Hearings, 18 October 2018, Slide 3401 MTN’s presentation at the public hearings held on 17-19 October 2019. See Day 2 transcripts, p. 96402 Vodacom’s presentation at the public hearings held on 17-19 October 2018. See Day 2 transcripts, p. 7403 Vodacom’s presentation at the public hearings held on 17-19 October 2018. See Day 2 transcripts, p. 5404 MTN’s presentation at the public hearings held on 17-19 October 2019. See Day 2 transcripts, p. 86405 MTN’s presentation to the Public Hearings, 18 October 2018, Slide 24
exacerbated by different rates for in-net and off-net calls (‘club effects’), high termination rates until recently, and the imposition of high early termination penalties (‘switching costs’) for post-paid customers, and (e) relatively favourable spectrum assignments. These are discussed in more detail below.
The capex arms race
370. An important advantage for first movers is the ability to reinvest market power-driven profits into capital expenditure (“capex”), which in turn result in improved network coverage and quality (e.g. speed), both of which are key aspects of competition. In particular, it appears that Vodacom and MTN’s record of investment is driven and funded by their historical market position of being one of two operators and their resulting dominance after the entry of Cell C and Telkom.
371. Investment is considered to be “critical to the mobile sector”400 with mobile communications described as a capex-hungry business401. Both the representatives of MTN and Vodacom emphasized in the public hearings that infrastructure competition is important in the mobile communications sector since South African customers consider network coverage (i.e. quality of the network) in their decision about which network provider to choose.402 “So, we compete on 2 fronts. We compete on infrastructure and we compete on pricing and obviously, we compete on quality and service and so on.”403 (Mr Joosub, Vodacom) “The important point I want to make here Dr Mncube is that infrastructure competition matters”404 (Mr Motsa, MTN) “A key dimension through which MNOs have compete(d) is through investments in infrastructure, improving the capacity, coverage and quality of their networks to cope with exponential growth in demand”405 (Mr Motsa, MTN)

117
372. However, as explained by the CEO of Vodacom himself building sites is “frightfully expensive”406 and requires huge capital investments. This he explains is because rentals are extremely high, especially if landlords know that they have a key site.407 Having access to large amounts of capital is therefore critical to mobile operators’ abilities to build their network infrastructure.
373. Vodacom and MTN are better able to invest in expensive network infrastructure compared to Cell C and Telkom by stint of their ability to re-invest profits that were the product of market power before Cell C and Telkom entered. According to the RIA, this makes Vodacom and MTN more likely to “win this battle” of infrastructure competition.408
374. In the public hearings for the Data Inquiry, both Vodacom and MTN indicated that they have reinvested their profits into capex (infrastructure): “We spend most of our money in capex, we spend far more on capex than on dividends in the last four years we have spent over 40-billion-rand building the network.”409 (Mr Motsa, MTN) “Vodacom has, over the last five years, invested over R 40 billion (i.e., two-thirds of its post-tax return) into the provision of mobile services in South Africa…”410 (Vodacom’s written submission)
375. In fact, early in its presentation at the Public Hearings, Vodacom described a virtuous circle where “increases in usage enable the licensees to continue to invest in upgrading and expanding networks”. This improves network coverage and quality, which in turn attracts new customers to the network and increases usage.411 Elsewhere, Vodacom noted that investment in coverage is often done ‘ahead of the curve’.412 “The MNOs in South Africa continuously make significant investments in their networks in order to improve their network coverage and quality. As noted in the introduction, operators make initial investments that allow them to deploy networks with a given quality
406 Vodacom’s presentation at the public hearings held on 17-19 October 2018. See Day 2 transcripts, p. 9407 Vodacom’s presentation at the public hearings held on 17-19 October 2018. See Day 2 transcripts, p. 11408 RIA’s presentation for the public hearings, 17 October 2018, Slide 15409 MTN’s presentation at the public hearings held on 17-19 October 2018. See Day 2 transcripts, p. 86.410 Vodacom’s submission dated 15 October 2018 (Confirmed as non-confidential on 29 March 2019), p. 3411 Vodacom’s presentation to the Public Hearings, 18 October 2018, Slide 2412 Vodacom’s presentation at the public hearings held on 17-19 October 2018. See Day 2 transcripts, p. 6413 Vodacom’s submission dated 15 October 2018 (Confirmed as non-confidential on 29 March 2019), p.7414 This contradicts the assertion by Vodacom that “there is currently strong infrastructure-based competition between the four MNOs” Source: Vodacom letter (non-confidential version) dated 30 November 2017 (In Cliffe Dekker Hofmeyer’s letter head), p.13, para. 1.5.1.1415 MTN’s presentation at the public hearings held on 17-19 October 2018. See Day 2 transcripts, p. 107
and coverage. Customer demand responds to these investments which lead to increases in usage, which may enable further investment by operators into network upgrades and expansion. It is clear from the evidence presented above, and from the continued investments operators (and in particular Vodacom) have made, that customers in South Africa value and consider network coverage when deciding on their network provider, and that this factors into operators’ investment decisions.” 413
376. MTN’s CEO in South Africa himself admitted that there are only really two strong competitors when it comes to infrastructure competition in South Africa – Vodacom and MTN.414 “…and then I go to the next point, why do I see this industry as competitive, its competitive for me at two level both from an infrastructure and also at a service. Let me start with the infrastructure, there are six players but to be honest with you there are two strong players, it’s us and the red guys.” 415
377. This is borne out by the number of sites owned by each operator in 2018 as shown in Table 19 below.

118
378. In 2018, MTN owned more than [] the number of sites of Cell C and Telkom Mobile. Furthermore, Vodacom owned more than [] the number of sites of Cell C and Telkom Mobile.
379. Vodacom and MTN had already gained access to the majority of their sites by the time Cell C and Telkom Mobile entered the market. Vodacom had already obtained access to 27.3% of all its sites as of March 2018 when Cell C entered the market (November 2001) and 45.4% when Telkom Mobile entered the market (October 2010).416 MTN had already obtained access to [] of all its 2G sites as of December 2017 when Cell C entered the market (November 2001).417
380. When asked about whether it has a first-mover-advantage in terms of being able to fund capex from past profits, Vodacom’s CEO suggested that Vodacom’s superior infrastructure can instead be attributed to its decision making. For example, it chose to invest heavily in South Africa whereas a competitor (presumably MTN who entered early and at a similar time to Vodacom) chose to enter more markets.418 The figure below shows the capital intensity (capex as a percentage of revenue) of the four mobile operators. It is a metric commonly reported in the annual reports of the four operators and according to the CEO of MTN is a “lead indicator for market share acquisition”.419
381. The figure shows that the capital intensity of Cell C and Telkom Mobile have generally kept pace and in many cases exceeded the rate
416 Vodacom’s annual report for the year ended March 2003, p.36; Vodacom’s annual report for the year ended 31 March 2011, p.32; Vodacom’s annual report for year ended March 2018, p.10417 MTN’s annual report for the year ended December 2001, p.2; MTN’s response to RFI, 7 September 2018, Annexure G418 Vodacom’s presentation at the public hearings held on 17-19 October 2018. See Day 2 transcripts, p.11419 MTN’s presentation at the public hearings held on 17-19 October 2018. See Day 2 transcripts, pp. 125-126420 Telkom’s presentation at the public hearings held on 17-19 October 2018. See Day 2 transcripts, p. 144
of investment relative to income of the larger mobile operators. The graph also shows that Telkom Mobile’s capital intensity is higher than that of Cell C and in 2012 exceeded 100%. It is possible that Telkom invested revenues from its fixed business into its mobile business, thereby giving it a slight advantage over Cell C when it entered the mobile market in 2001.
382. Despite having higher levels of capital intensity than the incumbent operators, small operators are simply unable to invest capital in absolute terms at the same pace as large operators given the small size of their revenue streams, which is considerably higher. This is shown in Figure 48 below, which presents the revenue and capital expenditure of each mobile operator’s mobile business in South Africa.
383. Cell C and Telkom are essentially playing catch up in infrastructure competition, where Vodacom and MTN have had a large head start. A high level of capex intensity will not necessarily result in new operators gaining market share in the future. This sentiment was expressed succinctly by Telkom in the Public Hearings: “And if you look at what Telkom Mobile has 15 spent in terms of capex, you know we spend in excess of 11 billion rand in capex over the last few years that we have been in. But we’ve been able to only get for about 5% so it is not entirely correct to attribute the success simply to investment”. 420
384. The difficulty in ‘catching up’ in terms of infrastructure competition and coverage with MTN and Vodacom may partly explain why Cell
Table 19: Number of mobile sites per operator (2018)
Sources: Vodacom submission, 18 April 2019; MTN submission, 18 April 2019; Cell C submission, 18 April 2019; Telkom submission, 18 April 2019
Number of owned sites
Vodacom (November) []
MTN (December) []
Cell C (June) []
Telkom Mobile (March) []

119
Figure 47: Capital intensity of mobile operators (2001-2018)
Source: Revenue and capital expenditure data was obtained from the annual reports of Vodacom (years ended 31 March 2004, 2006, 2008, 2010, 2011, 2013, 2015-2018), MTN (years ended 31 December 2002-2004, 2006, 2009, 2011-2015, 2017-2018), and Telkom (years ended 31 March 2012, 2014, 2016, 2018). Capital intensity data for Cell C from 2013-2017 was obtained from Cell C Annual Results Presentation for the year ended 31 December 2017. Cell C data for 2018 was calculated from revenue and capital expenditure data in Blue Label Telecoms unaudited results, 30 November 2018.Notes: (i) Vodacom and Telkom’s financial years end in March. Thus, their data is reflected for the year prior to the year in which their results are reported. Cell C and MTN’s financial year end is in December. (ii) Revenue streams and capital expenditure only relates to South Africa in the case of MTN and Vodacom. (iii) Revenue streams and capital expenditure only relate to Telkom Mobile operations and not its fixed line operations. (iv) The figure contains the most recent data available for each financial year. In the case of discrepancies in numbers across annual reports, figures from the most recent annual reports were taken.
Figure 48: Revenue and capital expenditure of mobile operators (2017)
Sources: Annual report of Vodacom year ended 31 March 2018, p.47; Annual report of MTN year ended 31 December 2018, pp.9, 17 and Annual report of Telkom year ended 31 March 2018, pp.45, 49. Capital expenditure data for Cell C was obtained from Cell C Annual Results Presentation for the year ended 31 December 2017, Slide 27. Total revenue for Cell C was obtained from Blue Label Telecoms unaudited results, 30 November 2018, Slide 19. Notes: (i) Vodacom and Telkom’s financial years end in March. Thus, their data is reflected for the calendar year prior to the year in which their results are reported. Cell C and MTN’s financial year end is in December. (ii) revenue streams and capital expenditure only relates to South Africa in the case of MTN and Vodacom. (iii) revenue streams and capital expenditure only relate to Telkom Mobile operations and not its fixed line operations.

120
C only reported its first annual profit in 2017, despite being in operation for 17 years421. It may also explain why Telkom Mobile (previously 8ta) has struggled to gain traction.422
Scale benefits
385. The implication of there being large fixed costs from building and operating a network is that new entrants who have not yet achieved sufficient scale in terms of subscriber numbers have a higher average cost of service than larger incumbent operators.423 As explained by
421 Mahlaka, R. (23 August 2018) “Blue Label defends its investment in Cell C”, in MoneyWeb, available at: https://www.moneyweb.co.za/ news/companies-and-deals/blue-label-defends-its-investment-in-cell-c/ [Accessed 4.4.2019]422 Editor of MoneyWeb, “8ta struggles in competitive market”, in MoneyWeb, available at: https://www.moneyweb.co.za/news/ companies-and-deals/blue-label-defends-its-investment-in-cell-c/ [Accessed 4.4.2019]423 Telkom submission (Non-confidential version) dated 17 November 2017, p. 34424 Cell C’s presentation at the public hearings held on 17-19 October 2018. See Day 2 transcripts, p. 177425 Cell C’s presentation at the public hearings held on 17-19 October 2018. See Day 2 transcripts, p.179426 Cell C’s presentation at the public hearings held on 17-19 October 2018. See Day 2 transcripts, p.179427 Cell C’s presentation at the public hearings held on 17-19 October 2018. See Day 2 transcripts, p.174
Cell C, this makes it difficult for them to price aggressively (they need to maintain margins to recover their fixed costs) and so attract customers from Vodacom and MTN.424
386. In the public hearings, Cell C presented the ICASA network cost model for 2016-2020 which it developed for the call termination rate regulations. It presented the cost of a hypothetical large operator comparable to Vodacom and MTN and a hypothetical small operator with sub-1Ghz spectrum, comparable to Cell C. This is copied in the figure below.
387. Based on this analysis, Cell C showed that the average network unit cost of a large operator is approximately 33% lower than that of a small operator. The large operators have a “significant scale advantage arising from the greater market share”425. It is only if and when later entrants are able to reach minimum efficient scale, can they compete effectively. According to Cell C, this is 20-25% of revenue market share for 3G networks and over 25% for 4G and 5G networks.426
Advantageous site locations
388. Submissions received by the Inquiry allege that Vodacom and MTN have a first-mover advantage in relation to obtaining access to the best sites for their RAN equipment. As far as the inquiry is aware, no parties have put up evidence to the contrary. Further, their access to prime sites and land is allegedly exclusive and on a long-term basis.427 The Inquiry’s view is that it is relatively uncontroversial that first movers would take premium sites and this would provide an advantage.
Figure 49: ICASA’s cost model (cost per data megabyte in 2017)
Source: Cell C’s submission to the public hearings, October 2018, Slide 21

121
389. Based on data obtained from annual reports, it appears that Vodacom and MTN’s site network already provided coverage to the majority of the population when Cell C entered the market in 2001 and by extension Telkom Mobile in 2011. In December 2002, just over a year after Cell C entered the market, MTN’s 2g network infrastructure already covered approximately 93% of the population.428 In March 2011, just five months after Telkom Mobile entered the market, Vodacom’s 2g network infrastructure covered 99.5% of the population and its 3g network infrastructure covered 74% of the population429. This evidence suggests that the incumbent mobile operators already had sites in densely populated areas that enabled them to provide wide population coverage when Cell C and Telkom Mobile entered the market. Therefore both MTN and Vodacom had a head start in obtaining access to sites.
390. This advantage is considered to be significant for a number of reasons. Firstly, the supply of suitable sites is constrained especially in urban areas.430 There is the added problem that if sites are too close to existing sites, it may result in interference or network management issues.431 Secondly, as mentioned above, access to sites, especially on prime land, is expensive.432 MTN and Vodacom managed to acquire access to many of their premium sites when they only had to compete with only one another for those sites. Now, there are four operators competing for prime land, thereby raising the rents that may be extracted by land owners. Thirdly, new municipal restrictions make further site acquisitions more onerous and result in significant delays.433 In the public hearings, Vodacom’s CEO noted that approvals can take up to two years in certain parts of the country.434 As a result of the aforementioned, entrants may be forced into using less suitable sites thereby disadvantaging them relative to Vodacom and MTN. Where entrants have been able to co-locate on Vodacom and
428 MTN’s Annual Report for the year ended December 2002, p.3429 Vodacom’s Annual Report for the year ended 31 March 2011, pp.32, 48430 Telkom’s submission dated 15 October 2018 (Confirmed as non-confidential on 29 March 2019), p. 19431 Vodacom’s presentation at the public hearings held on 17-19 October 2018. See Day 2 transcripts, p.21432 Vodacom’s presentation at the public hearings held on 17-19 October 2018. See Day 2 transcripts, pp. 9, 11433 Telkom and Vodacom’s presentation at the public hearings held on 17-19 October 2018. See Day 2 transcripts, p. 174 (Telkom) & p.21 (Vodacom); Also see Telkom’s submission (non-confidential version) dated 17 November 2017, p. 36434 Vodacom’s presentation at the public hearings held on 17-19 October 2018. See Day 2 transcripts, p.11435 Telkom’s submission (non-confidential version) dated 17 November 2017, p. 36436 Telkom and Cell C’s presentations at the public hearings held on 17-19 October 2018. See Day 2 transcripts, p.144 (Telkom) and p.175 (Cell C)437 Vodacom’s Annual Report for the year ended 31 March 2003, p. 6; MTN’s Annual Report for the year ended December 2001, p.27438 Vodacom’s Annual Report for the year ended 31 March 2003, p. 28439 SIM penetration rates are the number of active mobile SIM cards per 100 people. It may exceed 100% as users may have multiple SIM cards.440 Vodacom’s Annual Report for year ended 31 March 2011, p.9; MTN’s Annual Report for the year ended December 2010, p.46441 MTN’s annual report as of 31 December 2018 (See Data Sheet online). The same information is not publically available for Vodacom.
MTN’s sites, they will get an inferior position on towers.435
391. This problem would be mitigated if incumbents were willing to share their network infrastructure. However, as discussed below in relation to competition in the wholesale market, there is evidence that incumbent owners of network infrastructure limit access to their sites in a number of ways which includes reserving the best space on a mast and thus giving competitors an inferior position on their towers thereby degrading the quality of competitors’ mobile services.
Sticky contract customers
392. As the only competitors in the mobile segment between 1994 and 2001, Vodacom and MTN only had to compete with one another to acquire new customers. Based on the submissions of Telkom and Cell C, this made customer acquisition easier compared to when three and then four operators competed for customers. Their head start in the voice market enabled them to build a base of “sticky” customers before the entry of Cell C and Telkom Mobile in November 2001 and October 2010 respectively. 436Vodacom and MTN had already recorded SIM penetration rates of 16.6% and 24.2% respectively in 2001 when Cell C entered the market. In Vodacom’s 2003 annual report (year ended 31 March 2003), just a year and a half since Cell C entered the market,437 it was noted that: “Most of the developed market already have cell phones, so the objective in the short to medium-term must be to retain the customers it already has, and to incentivise and attract new customers”438. SIM penetration rates exceeded 100% in 2010 when Telkom Mobile entered the market (107% and 105% for Vodacom and MTN respectively).439 440 MTN’s most recent data on SIM penetration show that it was 172% in December 2018.441

122
393. Contract customers in the mobile segment are considered to be relatively “sticky” due to brand loyalty and/or customer inertia.442 These customers are also seen as important for an operator as they are typically high spend customers and provide a consistent revenue base. Vodacom and MTN had a head start in developing their brand and brand loyalty. The initial lack of number portability also ensured customers of all types were stickier in a desire not to lose their mobile number. These reasons alone would have made it difficult for late entrants Cell C and Telkom Mobile to attract contract subscribers already on the Vodacom and MTN networks.
394. Historically, this problem has been exacerbated by the strategic conduct of Vodacom and MTN.
394.1. High penalties for early termination of contracts. Customers are arguably locked into contracts where switching costs such as exit penalties are levied. Vodacom for example typically has two
442 RIA’s submission dated 11 October 2018, par. 7443 Telkom’s submission (non-confidential version) dated 17 November 2017, p. 35; Telkom’s presentation at the public hearings held on 17- 19 October 2018. See Day 2 transcripts, p. 174444 Churn is calculated by dividing the annualised number of disconnections during the period by the average monthly customers during the period.445 Vodacom’s annual report year ended 31 March 2017, p. 10446 Telkom’s 2018 annual report, p.32447 Cell C’s submission dated 26 July 2018, Annexure 11B
year contract durations with financial penalties for early termination.443 This may have contributed to its relatively low churn rates444 among contract customers as shown in the table below. In fact, the table shows that churn rates for Vodacom’s contract customers declined to 4.2% in the 2017 financial year (year end 31 March 2017), the last year for which churn rates are available in Vodacom’s annual reports. This suggests that it is getting more difficult for competitors of Vodacom to attract its post-paid customers. In its 2017 annual report, Vodacom’s CEO’s statement included the following: “We added 218 000 contract customers during the year, and improved loyalty, evidenced in the low contract churn of 4.2%...” (own emphasis)445. In contrast, Telkom Mobile recorded a post-paid churn rate of 12% in the same year446 and Cell C [].447
394.2. High termination rates. As customers will often purchase both mobile voice
and data services, barriers created in the voice market have implications for
Figure 50: Vodacom’s churn rates for contract customers (year ended 31 March 2001- 31 March 2017)
Source: Vodacom annual reports year ended 31 March 2003, 2004, 2006, 2008, 2011-2017. Notes: The figure contains the most recent data available for each financial year. In the case of discrepancies in numbers across annual reports, figures from the most recent annual reports have been used.

123
the data services market. MTRs in South Africa – the payment that one operator makes to another when a call terminates on its network - have been relatively high especially since the entry of Cell C (MTRs increased from R0.20 in 1994 to R1.25 in anticipation of Cell’s entry in 2001). High termination rates favour incumbent operators with more subscribers as more calls would be terminated on their networks relative to later entrants.448 This according to Telkom gave the dominant operators 20 years’ free cash “which essentially amongst other things, enabled them to be able to invest. And meet the customers’ requirements with regards to coverage and quality”. 449
394.3. Large on-net off-net price differentials.
Large operators set on-net prices very low in order to promote club effects. This encourages customers to stay with operators that contain most of their social network. Since Vodacom and MTN capture the majority of mobile customers in the country, they are likely to be favoured most often.450 In 2013, Cell C laid a complaint about this conduct with the Competition Commission, alleging that Vodacom and MTN engaged in excessive pricing, inducement, and margin squeeze. The complaint was not referred as it did not meet the evidentiary burden of the Act. Nonetheless, the Commission found that the price differentials between on-net and off-net calls have impeded the ability of late entrants to be effective competitors. As a result, the Commission engaged with ICASA about potential regulatory interventions to help make the market more competitive.451
395. However, number portability has greatly enabled more switching to occur and this is at least evident in high levels of prepaid churn in the market. Also, the rapid expansion of demand for data products for devices rather than combined with voice subscriptions also represents potential less sticky markets.
448 Telkom’s submission (non-confidential version), dated 17 November 2017, p. 35; Telkom’s submission to the Public Hearings (Confirmed as non-confidential on 29 March 2019), 15 October 2018, p. 20449 Telkom’s presentation at the public hearings held on 17-19 October 2018. See Day 2 transcripts, p. 144450 Telkom’s submission to the Public Hearings (Confirmed as non-confidential on 29 March 2019), 15 October 2018, p. 20451 Competition Commission’s press statement, 18 April 2017, available at: http://www.polity.org.za/article/cc-competition-commission- decides-not-to-prosecute-vodacom-and-mtn-following-cell-cs-complaint-2017-04-18 [Accessed 4.4.2019]452 Telkom’s presentation at the public hearings held on 17-19 October 2018. See Day 2 transcripts, p. 144453 Telkom written submission to the Public hearing (Confirmed as non-confidential on 29 March 2019), 15 October 2018, p.22; Telkom’s submission dated 17 November 2017 (non-confidential version), p. 31 454 Frontier Economics report (Non-Confidential version) in Vodacom’s submission 30 November 2017, p. 12
Growth in general also permits challenger networks to target new customers rather than purely focusing on converting existing ones. However, in the context where the challenger networks are constrained in other ways, such opportunities may not be converted into actual market share growth.
More favourable spectrum assignment
396. Historical spectrum assignments have made it difficult for later entrants to compete on an equal footing with incumbents. Telkom has not been assigned any spectrum below 1GHz. Until the 900MHz band was extended internationally, Cell C had also not been assigned spectrum below 1Ghz. The lack of sub 1GHz spectrum serves to raise the costs of network development of Cell C initially and Telkom in general since one needs to build more sites that are closer to one another.452 Based on a submission by Econex to ICASA in 2016, [] sites are required to provide coverage over an urban area of 2000km2 with 900MHz spectrum whereas [] sites are required to provide the same coverage using 1800MHz spectrum (the lowest frequency spectrum assigned to Telkom). BRG on behalf of Telkom estimate that using 1800MHz spectrum would require [] more in capex relative to the use of sub 1GHz spectrum.453 The lack of sub 1GHz may have limited the ability of Cell C to compete when it entered the market and it likely continues to impede Telkom. This contradicts Vodacom’s assertion that spectrum is fairly assigned.454
6.3. Wholesale markets
397. Later entrants and retail service providers generally rely on the wholesale supply of infrastructure and other services from first-mover incumbents for the supply of their own services. This reliance may be to a greater or lesser extent, and may change over time, but these challengers will nonetheless be reliant in order to compete effectively downstream against the first-mover incumbents. This situation clearly results in an incentive problem, namely that incumbents have no real incentive to offer wholesale services, or do to so on

124
competitive terms where they are required to, in order to assist others to challenge them. It is only under quite exceptional market circumstances that this may not be the case. It is for this very reason that wholesale markets are frequently regulated and doing so is seen as one of the less intrusive means to try fix retail level competition.
398. The problems around strategic behaviour by first-mover incumbents to reduce competition in the mobile market was self-evident in the area of MTRs where excessively high rates severely hindered the later entrants in competing for voice customers. That is now regulated at cost-based levels.
399. Access to facilities such as sites and towers has been another persistent complaint. Facilities leasing was regulated by ICASA in 2010 which improved access, but complaints have persisted around strategic denials and uncompetitive pricing. We have dealt with this in the previous section as it is also wrapped up with the issue of passive infrastructure sharing as a means to reduce costs to the whole industry. In so doing we concur with the direction DTPS is taking, namely to regulate wider access at cost-orientated levels.
400. This sub-section picks up two wholesale markets which have not received attention yet, namely national roaming agreements between vertically integrated mobile operators and the facilitation of retail level competitors in the form of MVNOs. Unsurprisingly, both are a source of complaints and concerns within the industry, and have been the subject of submissions to the Inquiry. However, unlike the two wholesale issues of termination and facilities leasing, neither of these are the subject of current regulatory initiatives. Retail service provider competition is, however, seemingly one of the rationale’s behind the WOAN (along with lowering shared infrastructure costs) where the strategy seems to be to create a wholesale platform for such competitors rather than to regulate access to incumbents.
455 Lefèvre, C. B. (2008). Mobile Network Sharing. 8th ITU Global Symposium for Regulators 2008, Discussion paper, Module 2, Section 6.5.9456 GSMA (2012). Mobile Infrastructure Sharing, p. 15, para. 3.5.1. Available at: https://www.gsma.com/publicpolicy/wp-content/up loads/2012/09/Mobile-Infrastructure-sharing.pdf [Last viewed on 27 August 2018]457 Meddour, D., Rasheed, T. and Gourhant, Y. (2011) On the Role of Infrastructure sharing for Mobile Network Operators in Emerging Markets, 2.3. Computer Networks, 55(7), p. 1576-1591.458 Mattioli, R. and Dekker, M. (2013) National Roaming for Resilience, National roaming for mitigating mobile network outages. European Union Agency for Network and Information Security, p. 9. [Online]. Available at: https://www.enisa.europa.eu/publications/national- roaming-for-resilience/at_download/fullReport [Last viewed on 17 September 2018]459 Gligorijević, M., Bošković, M. and Maksimović, A. (2017) The Role and Importance of the “National Roaming” in Emergencies, NBP – Journal of Criminalistics and Law, 2017(1), p. 111-125, p. 114. [Online]. Available at: https://scindeks-clanci.ceon.rs/data/pdf/0354- 8872/2017/0354-88721701111G.pdf [Last viewed on 13 September 2018]
6.3.1. Assessment of roaming agreements
401. The Data Inquiry received submissions in respect of the concerns some of the smaller mobile operators have made in respect of roaming agreements. The crux of the concerns raised is that there exists a significant bargaining power imbalance between operators that require roaming at a wholesale level in order to provide data services at the retail level and the operators that can feasibly provide national roaming. This bargaining power imbalance is exacerbated by the alleged effective exclusivity of the roaming agreements. The result, they argue, is a number of unfavourable contract terms that impede the ability of smaller operators to compete at the retail level. In terms of the old roaming agreements that had been in place until recently, this includes the prohibitively high prices, the refusal to provide seamless handover, and the prioritisation of own network traffic over the roaming operator’s network traffic. A full treatment of these submissions, as well as responses made by Vodacom and MTN are contained in appendix G.
402. Roaming is a form of network sharing, where a subscriber of one mobile operator’s network is able to use another mobile operator’s network when outside of the geographical coverage of their own mobile operator’s network.455 National roaming occurs between mobile operators within the same country code.456 In this way, an operator is able to virtually extend its geographic coverage by leveraging off another mobile operator’s network coverage.457
403. To establish a roaming connection when a subscriber enters another mobile operator’s network where their own network does not have coverage, the mobile device locates the nearest base station of the visited operator network and sends a request for connection.458 The connection request is forwarded by the base transceiver station to the base station controller, which then forwards the request to the mobile switching centre of the visited mobile operator.459 The mobile switching centre identifies the subscriber’s mobile operator and
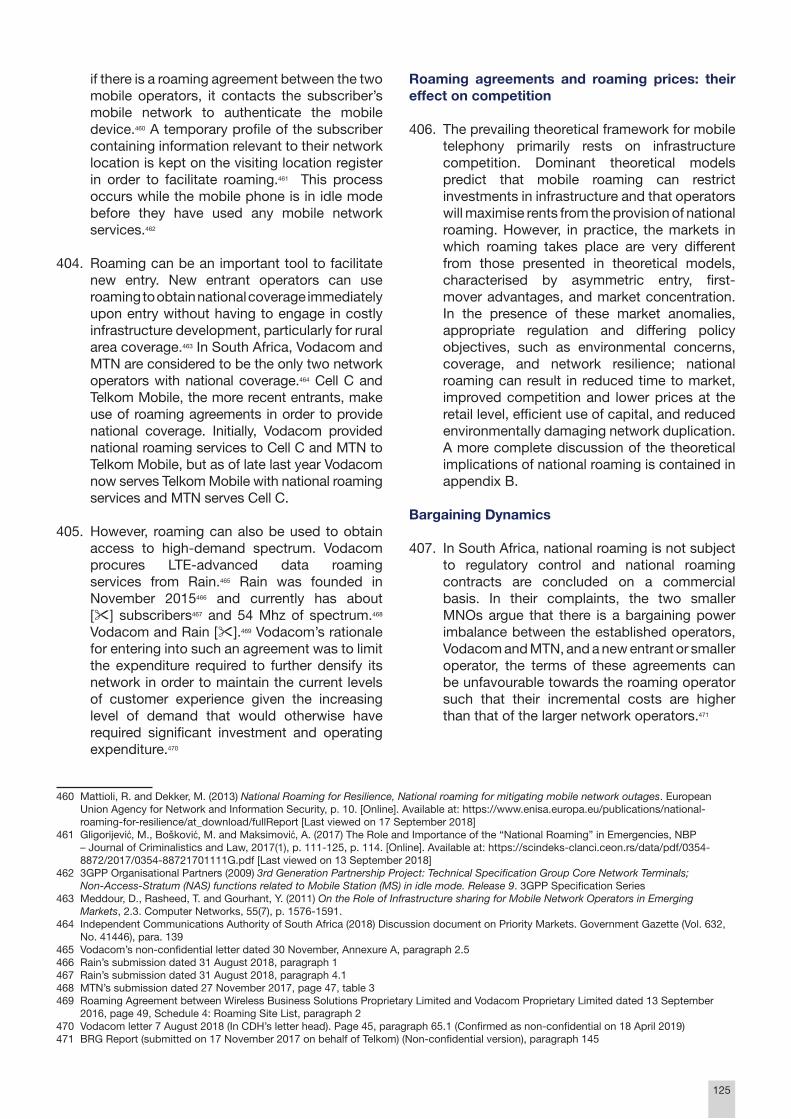
125
if there is a roaming agreement between the two mobile operators, it contacts the subscriber’s mobile network to authenticate the mobile device.460 A temporary profile of the subscriber containing information relevant to their network location is kept on the visiting location register in order to facilitate roaming.461 This process occurs while the mobile phone is in idle mode before they have used any mobile network services.462
404. Roaming can be an important tool to facilitate new entry. New entrant operators can use roaming to obtain national coverage immediately upon entry without having to engage in costly infrastructure development, particularly for rural area coverage.463 In South Africa, Vodacom and MTN are considered to be the only two network operators with national coverage.464 Cell C and Telkom Mobile, the more recent entrants, make use of roaming agreements in order to provide national coverage. Initially, Vodacom provided national roaming services to Cell C and MTN to Telkom Mobile, but as of late last year Vodacom now serves Telkom Mobile with national roaming services and MTN serves Cell C.
405. However, roaming can also be used to obtain access to high-demand spectrum. Vodacom procures LTE-advanced data roaming services from Rain.465 Rain was founded in November 2015466 and currently has about [] subscribers467 and 54 Mhz of spectrum.468 Vodacom and Rain [].469 Vodacom’s rationale for entering into such an agreement was to limit the expenditure required to further densify its network in order to maintain the current levels of customer experience given the increasing level of demand that would otherwise have required significant investment and operating expenditure.470
460 Mattioli, R. and Dekker, M. (2013) National Roaming for Resilience, National roaming for mitigating mobile network outages. European Union Agency for Network and Information Security, p. 10. [Online]. Available at: https://www.enisa.europa.eu/publications/national- roaming-for-resilience/at_download/fullReport [Last viewed on 17 September 2018]461 Gligorijević, M., Bošković, M. and Maksimović, A. (2017) The Role and Importance of the “National Roaming” in Emergencies, NBP – Journal of Criminalistics and Law, 2017(1), p. 111-125, p. 114. [Online]. Available at: https://scindeks-clanci.ceon.rs/data/pdf/0354- 8872/2017/0354-88721701111G.pdf [Last viewed on 13 September 2018]462 3GPP Organisational Partners (2009) 3rd Generation Partnership Project: Technical Specification Group Core Network Terminals; Non-Access-Stratum (NAS) functions related to Mobile Station (MS) in idle mode. Release 9. 3GPP Specification Series463 Meddour, D., Rasheed, T. and Gourhant, Y. (2011) On the Role of Infrastructure sharing for Mobile Network Operators in Emerging Markets, 2.3. Computer Networks, 55(7), p. 1576-1591.464 Independent Communications Authority of South Africa (2018) Discussion document on Priority Markets. Government Gazette (Vol. 632, No. 41446), para. 139465 Vodacom’s non-confidential letter dated 30 November, Annexure A, paragraph 2.5466 Rain’s submission dated 31 August 2018, paragraph 1467 Rain’s submission dated 31 August 2018, paragraph 4.1468 MTN’s submission dated 27 November 2017, page 47, table 3469 Roaming Agreement between Wireless Business Solutions Proprietary Limited and Vodacom Proprietary Limited dated 13 September 2016, page 49, Schedule 4: Roaming Site List, paragraph 2470 Vodacom letter 7 August 2018 (In CDH’s letter head). Page 45, paragraph 65.1 (Confirmed as non-confidential on 18 April 2019)471 BRG Report (submitted on 17 November 2017 on behalf of Telkom) (Non-confidential version), paragraph 145
Roaming agreements and roaming prices: their effect on competition
406. The prevailing theoretical framework for mobile telephony primarily rests on infrastructure competition. Dominant theoretical models predict that mobile roaming can restrict investments in infrastructure and that operators will maximise rents from the provision of national roaming. However, in practice, the markets in which roaming takes place are very different from those presented in theoretical models, characterised by asymmetric entry, first-mover advantages, and market concentration. In the presence of these market anomalies, appropriate regulation and differing policy objectives, such as environmental concerns, coverage, and network resilience; national roaming can result in reduced time to market, improved competition and lower prices at the retail level, efficient use of capital, and reduced environmentally damaging network duplication. A more complete discussion of the theoretical implications of national roaming is contained in appendix B.
Bargaining Dynamics
407. In South Africa, national roaming is not subject to regulatory control and national roaming contracts are concluded on a commercial basis. In their complaints, the two smaller MNOs argue that there is a bargaining power imbalance between the established operators, Vodacom and MTN, and a new entrant or smaller operator, the terms of these agreements can be unfavourable towards the roaming operator such that their incremental costs are higher than that of the larger network operators.471

126
408. This bargaining power imbalance arises for a number of reasons in the South African context. Mobile network licenses are granted on a national basis, so there is a national market for the provision of wholesale roaming services. There are generally a small number of suppliers of wholesale roaming services in a country. In South Africa, only two networks, Vodacom and MTN, have national coverage. Thus, the provision of wholesale roaming services in South Africa is highly concentrated.
409. From an infrastructure perspective, there are significant barriers to entry of which availability of spectrum features most prominently. This limits the number of providers of wholesale roaming services. In addition, even when a new entrant is able to obtain spectrum, as Cell C, Telkom and Rain have done, the sequential issuing of licenses creates second-mover disadvantages for these new entrants. The new entrant will have low coverage as it develops its network and will face the higher cost of this investment without enjoying the concomitant profits that the first-movers enjoyed by virtue of being the only providers of mobile services at the downstream.
410. Cell C has argued that ICASA has not fulfilled the requirements of section 43(8) of the ECA obliging the regulator to “prescribe a list of essential facilities”.472 The essential facilities argument is relevant if a competing firm does not realistically have the ability to duplicate a facility that it requires to provide a service.473 Cell considers national roaming to be a critical form of access for new entrants, as they do not have the accumulated capital that first movers have, as a result of servicing the market with fewer competitors, to build a high quality national network. While it may be argued that a new entrant will eventually be required to duplicate the facility, a full roll out of a national network would take a significant amount of time during which the new entrant will not be able to attract subscribers. Delays in obtaining full coverage would significantly increase the cost of attracting subscribers, which would delay securing the required revenue to maintain the viability of the operator.
411. Furthermore, the extent of the bargaining power that a host operator will have relative to the roaming entrant is tempered solely by the availability of outside options for the provision of
472 The Competition Act, no.89 of 1998 defines an ‘essential facility’ as “an infrastructure or resource that cannot reasonably be duplicated, and without access to which competitors cannot reasonably provide goods or services to their customers.”473 Atiyas, I & Doğan, P. (2007) When good intentions are not enough: Sequential entry and competition in the Turkish mobile industry. Telecommunications Policy, 31(no issue number): 502-523 [online]. Available at: http://research.sabanciuniv.edu/4797/2/Atiyas_dogan_Tr_ mobile.pdf [Last viewed on 4 April 2019]474 BRG Report (submitted on 17 November 2017 on behalf of Telkom) (Non-confidential version), paragraph 145475 Cell C’s submission dated 15 August 2018, Annexure 47, page 8, paragraph 47.3 (Confirmed as non-confidential on 18 April 2019)476 Cell C’s submission dated 15 August 2018, Annexure 47, page 8, paragraph 47.3 (Confirmed as non-confidential on 18 April 2019)
national roaming. In South Africa, there are only two operators that can provide national roaming, which already limits the availability of outside options. Due to capacity constraints as a result of spectrum shortages, it is also not possible for one of the providing operators to host both Cell C and Telkom on their network. Thus, if either Cell C or Telkom already has an agreement with either Vodacom or MTN, then the other roaming operator will only have one national operator that it can deal with.
412. The wholesale price that is set for roaming has an impact on the costs of the roaming operator at the retail level. According to Telkom, due to the bargaining power imbalance exists between established operators and a new entrant or smaller operator, the terms of roaming agreements can be unfavourable towards the roaming operator such that their incremental costs are higher than that of the larger network operators.474 If the price of roaming is set at higher than the incremental cost of roaming to the host network, then it is only possible for a roaming operator to effectively compete with the host operator if the roaming operator is more efficient than the host operator at the retail level. This efficiency and increased competition will not, however, result in lower prices for retail services, due to the high price of roaming. While there will be an incentive for the roaming operator to invest in expanding its own network due to the high price of roaming, the roaming operator will not be accumulating profits from its downstream efficiency that will be required to invest in expanding its network.
Outcomes for old agreements
413. According to Cell C, even the last permutation of the roaming agreement that it had in place with Vodacom was restrictive and inhibited Cell C’s ability to compete. The reasons that Cell C provides is that the wholesale price of the service was too high, the contract did not include 4G, and a floor charge is included that effectively tied Cell C to using the roaming agreement with Vodacom.475 While the issue of seamless handover had been resolved, it had not been provided for most of the duration of Cell C’s prior roaming relationship with Vodacom. As a result, Cell C’s network quality is perceived negatively by customers476

127
414. Cell C contends that [].477 [].478 Cell C proposed [].479 Vodacom responded [].480 []. 481 This was deemed to be [].482
415. Cell C indicated that [].483
416. In terms of LTE services, Cell C had not concluded an agreement with Vodacom and Cell C indicates that it would be too expensive to obtain these services via roaming agreement, which would preclude Cell C from making promotional or cheaper data services available in the areas where it roams on Vodacom’s network, as these would be loss-making units.484 Thus, Cell C is only able to provide promotional or cheaper data services in areas where it has its own network, which prevents Cell C from growing its subscriber base and market power.485
417. Telkom considers the wholesale market for national roaming in South Africa to be an unregulated duopoly.486 [].487
477 Cell C’s submission dated 15 August 2018, Annexure 47, page 1, paragraph 47.1478 Cell C’s submission dated 15 August 2018, Annexure 47, page 1, paragraph 47.1479 Cell C’s submission dated 15 August 2018, Annexure 47, page 1, paragraph 47.1480 Cell C’s submission dated 15 August 2018, Annexure 47, page 1, paragraph 47.1481 Cell C’s submission dated 15 August 2018, Annexure 47, page 1, paragraph 47.1482 Cell C’s submission dated 15 August 2018, Annexure 47, page 1, paragraph 47.1483 Cell C’s submission dated 15 August 2018, Annexure 47, page 8, paragraph 47.3484 Cell C’s submission dated 24 November 2017, (Non-confidential version), paragraph 4.5485 Cell C’s submission dated 24 November 2017, (Non-confidential version), paragraph 4.5486 Telkom’s submission dated 17 August 2018, page 50, paragraph 138 (Confirmed as non-confidential on 18 April 2019)487 Telkom’s submission dated 17 August 2018, page 50, paragraph 139488 Telkom’s submission dated 17 August 2018, page 50, paragraph 135.1 and 135.2 (Confirmed as non-confidential on 18 April 2019)489 Telkom’s submission dated 17 August 2018, page 50, paragraph 135.3490 Telkom’s submission dated 17 August 2018, page 50, paragraph 135.4491 Telkom’s submission dated 17 August 2018, page 50, paragraph 135.4492 Telkom’s submission dated 17 August 2018, page 50, paragraph 136 (Confirmed as non-confidential on 18 April 2019)493 Rain’s submission dated 31 August 2018, Annexure B1, p. 3494 Rain’s submission dated 31 August 2018, Annexure B1, p. 3
418. In terms of cost levels, Telkom provided a comparison of the roaming and self-provision. National roaming costs will be lower than self-provision costs at low traffic levels, but higher at high traffic levels.488 [].489 [].490 [].491 Finally, a roaming operator will have a limited pricing options that take advantage of different costs and demand during peak and off-peak times, due to the constant marginal cost of roaming.492 Telkom indicated that [].
419. The table below presents the latest comparable national roaming charges of the old agreements between Cell C and Vodacom, and Telkom and MTN. In addition, the roaming charges of Vodacom and Rain are also presented. Given the reciprocity of the agreements between Vodacom and Rain, it is anticipated that there is less of an asymmetry in the bargaining power between the two parties. It is further anticipated that rent-seeking on the part of Rain will be less apparent.
420. Drawing a comparison between the roaming charges of these new agreements with the roaming charges agreed between Vodacom and Rain is complicated by the fact that while both the Cell C/MTN agreement and the Telkom/Vodacom agreement [], the Vodacom/Rain
agreement []. While the Vodacom/Rain agreement [].
421. However, according to Rain’s [].493 Thus, it is possible to calculate [].494 []
Table 20: Roaming charges comparison
Source: Vodacom/Cell C: Cell C’s submission on 26 July 2018, Annexure 32 MTN/Telkom Mobile: MTN’s submission on 31 July 2018, Annexures F1 to F4 Rain/Vodacom: Rain’s submission on 31 August 2018, Annexure D
Provider Customer Termination date Coverage FeesVodacom Cell C [] [] []
MTN Telkom Mobile [] [] []
Rain (WBS) Vodacom [] [] []
Table 21: Effective roaming rate per MB in the Vodacom/Rain roaming agreement using June 2018 access fees
Unit threshold [] [] Total roaming fee per MB
[] [] [] []

128
422. It is apparent from the two tables above that the roaming charges imposed by Vodacom and MTN on Cell C and Telkom Mobile are [] than the roaming charges imposed by Rain on Vodacom. The roaming fee per MB according to the Cell C/Vodacom roaming agreement is [] that of the Vodacom/Rain roaming agreement and according to the Telkom/MTN roaming agreement, the roaming fee is [] that of the Vodacom/Rain roaming agreement.
423. In addition to the cost implications, [].495 [].496 [].497
424. Telkom’s data services were available over its own 2G and 3G networks, where they had been deployed and had adequate capacity, but also in other areas over MTN’s network via Telkom’s roaming agreement.498 4G data services were only provided over Telkom’s own network, as the roaming agreement with MTN did not include 4G services.499 Thus, at the time, [].500
425. Cell C argued that the []. While Rain maintain that the roaming agreement in place with Vodacom is non-exclusive,501 [].502 However, that is not to say that Rain would be required to exclusive provide roaming services to Vodacom.
Outcomes for new agreements
426. In May 2018, Cell C announced that it had entered into a roaming agreement with MTN.503 As of November 2018, Cell C indicated that it had completed the implementation of its roaming agreement with MTN.504 However, Cell C will continue to roam on Vodacom’s 2G and 3G networks, as it will still require coverage of the entire country and the agreement with
495 Telkom’s letter dated 13 July 2018 (in Nortons Inc letter head), paragraph 41496 Telkom’s letter dated 13 July 2018 (in Nortons Inc letter head), paragraph 42497 Telkom’s letter dated 13 July 2018 (in Nortons Inc letter head), paragraph 42498 BRG Report (submitted on 17 November 2017 on behalf of Telkom) (Non-confidential version), paragraph 100499 BRG Report (submitted on 17 November 2017 on behalf of Telkom) (Non-confidential version), paragraph 100500 Telkom’s submission dated 13 July 2018 (in Nortons Inc letter head), paragraph 42501 Rain’s submission dated 31 August 2018, paragraph 10.3.1.3502 Rain’s submission dated 31 August 2018, Annexure D, Schedule 5, paragraph 2.1503 Cell C (29 May 2018) Cell C Concludes New Roaming Agreement with MTN, [online]. Available at: https://www.cellc.co.za/cellc/news room-detail/Cell-C-concludes-new-roaming-agreement-with-MTN [accessed on 15 April 2019]504 Tech Central (13 November 2018) Cell C customers now roaming on MTN, [online]. Available at: https://techcentral.co.za/cell-c- customers-now-roaming-on-mtn/85139/ [Accessed on 12 April 2019]505 Cell C’s submission dated 8 February 2019, para. 21.1506 Cell C’s submission dated 8 February 2019, Annexure 21.5, p. 2, para. D507 Cell C’s submission dated 8 February 2019, Annexure 21.5, p. 2, para. G(ii)508 Cell C’s submission dated 8 February 2019, Annexure 21.5, p. 2, para. G(ii)509 Cell C’s submission dated 8 February 2019, para. 21.4510 Cell C’s submission dated 8 February 2019, Annexure 21.5, p. 2, para. 3.3.2.2.1511 Cell C’s submission dated 8 February 2019, Annexure 21.5, p. 2, para. 3.3.2.3.2512 Cell C’s submission dated 8 February 2019, para. 21.2513 Cell C’s submission dated 8 February 2019, Annexure 21.5, p. 25, para. 5.1.2514 Cell C’s submission dated 15 August 2018, Annexure 47, page 8, paragraph 47.3 (Confirmed as non-confidential on 18 April 2019)515 Cell C’s submission dated 15 August 2018, Annexure 47, page 8, paragraph 47.3516 Cell C’s submission dated 8 February 2019, Annexure 21.5, p. 2, para. 3.3.5.2
Vodacom is of a fixed term.505 According to the agreement, Cell C [].506 In particular, Cell [].507 [].508
427. Cell C will roam on MTN’s network in areas that have been defined in the agreement.509 The agreement specifies that [].510 [].511
428. One of the key features of this new contract, [].512 According to the agreement, [].513 It should be noted that while seamless handover had been a long-standing issue between Cell C and Vodacom, it had been resolved in later roaming agreements with Vodacom.. 514
429. In terms of the latest agreement between Vodacom and Cell C, which will still be in place even as the agreement with MTN is rolled out, Cell C noted several outstanding issues:
429.1. The price of roaming is too high; and
429.2. The floor charge [].515
430. It is clear with the promulgation of the new roaming agreement with MTN, []. Furthermore, the new agreement [].516
431. Unlike the agreement that Cell C has in place with Vodacom, the current agreement with MTN []. []. The overall rate table for data is summarised in the contract as follows:

129
432. [].517
433. [].
434. In November 2018, Telkom concluded a new roaming agreement and a facilities leasing agreement with Vodacom that would come into full effect from June 2019.518 The two main issues that Telkom raised regarding its existing roaming agreement with MTN, [].519 In terms of price,
517 Cell C’s submission dated 8 February 2019, Annexure 21.5, Annexure D, Table I518 ITWeb (7 November 2018) Vodacom, Telkom sign multi-billion-rand roaming agreement, [online]. Available at: https://www.itweb.co.za/ content/G98YdqLx1kEqX2PD [accessed on 14 April 2019]519 Telkom’s letter dated 13 July 2018 (in Nortons Inc letter head), paragraph 41520 Telkom’s submission dated 17 August 2018, page 50, paragraph 135.3521 Telkom’s submission dated 17 August 2018, page 50, paragraph 135.4522 Telkom’s submission dated 11 January 2019, para. 10523 Telkom’s submission dated 14 December 2018, Vodacom Telkom Roaming Agreement, Schedule 1, para. 2524 Telkom’s submission dated 14 December 2018, Vodacom Telkom Roaming Agreement, Schedule 2, para. 1525 Telkom’s submission dated 14 December 2018, Vodacom Telkom Roaming Agreement, Schedule 2, para. 2
Telkom indicated []520 and there was [].521
435. A key departure in the new agreements is that []. Telkom attributes this change to the fact that [].522 The new agreement with Vodacom also provides Telkom [].523
436. The pricing structure of the roaming agreement [].524 [].525 [] need to be considered. These are presented in the table below
437. [].
438. The average roaming fee in the Cell C/MTN roaming agreement is []. As already calculated in the assessment of the old roaming agreements and presented again in the table above, the average roaming fee according to the Vodacom/Rain agreement was []. [].
Preliminary views
439. It is clear from the discussion above that national roaming is an important tool to facilitate entry of new operators and accelerate
effective competition. However, under the regime of commercially negotiated national roaming agreements, an asymmetric bargaining position exists between the providers and customers of national roaming, with the customers being at a significant disadvantage for a number of reasons, such as capacity constraints and concentration at the wholesale level. The result of this asymmetry is that the terms of the concluded agreements are likely to be disadvantageous to national roaming customers.
Table 22: Overall rate table for the roaming agreement between MTN and Cell C
Source: Cell C’s submission dated 8 February 2019, Annexure 21.5, Annexure D, Table A
Option [] [] Average price per MB
[] [] [] []
[] [] [] []
[] [] [] []
Table 23: Variable roaming rate for the roaming agreement between Vodacom and Telkom
Source: Telkom’s submission dated 14 December 2018, Vodacom Telkom Roaming Agreement, Schedule 2, para. 5
Component Unit 1 Dec 18 – 30 Nov 19
1 Dec 19 – 30 Nov 20
1 Dec 20 – 30 Nov 21
1 Dec 21 – 30 Nov 22
1 Dec 22 – 31 Mar 24
[] [] [] [] [] [] []
[] [] [] [] [] [] []
[] [] [] [] [] [] []
Unit threshold [] [] Total roaming fee per MB
[] [] [] []
Table 24: Effective roaming rate per MB in the Vodacom/Rain roaming agreement using June 2018 access fees

130
440. Small roaming operators have argued that the cost of roaming that they have faced in the past has been higher than the incremental cost of providing of the same service on their own networks. Indeed, it is apparent that the charges faced by Cell C and Telkom [] than those that are charged by Rain to Vodacom, []. This has been the case for both the old agreements and the new agreements. Furthermore, small roaming operators had not been able to obtain seamless handover for past agreements, which have had a negative impact on the quality of data services that these operators could provide. These issues have been particularly pronounced for Telkom, which has the smallest network and [] and is, thus, more dependent on national roaming to be an effective competitor.
441. Given the importance of roaming in ensuring effective competition between incumbents and new entrants and the weaknesses that have been identified in past national roaming agreements and the price differentials observed when the bargaining power between parties is different in both the new and old agreements, it is apparent that some direction is needed in guiding the future of national roaming in South Africa. This is particularly the case where smaller challenger networks face an infrastructure investment disadvantage which serves to perpetuate concentration and limit price competition in the market as discussed in the mobile retail section.
441.1. The first limitation these place on price-based competition in the industry is by degrading the quality of the network experience to subscribers of the challenger networks which makes it more difficult for challenger networks to attract and retain subscribers on the basis of price decreases. This makes price decreases less successful and therefore also less profitable.
441.2. In addition, as the costs are variable beyond a minimum fee, more aggressive pricing results in generating a larger operational cost for the challenger networks. This is because the increased volumes that result from subscribers increasing usage or switching from other networks will generate more roaming charges. This is in contrast to the largely fixed cost structure faced by the roaming provider.
526 [] submission, 7 June 2018, p.2527 [] submission, 17 August 2018, p.4528 Telkom’s non-confidential submission to the Inquiry, 17 November 2017, par. 64529 Afrihost’s presentation to the public hearings held on 17-19 October 2018. See Day 3 Transcripts, p.5. Note that Afrihost did refer to itself as a light MVNO for data.530 [] submission, 17 August 2018, p.5; [] submission, 7 June 2018, p.3; [] Submission, 22 August 2018, p.6
Ultimately this makes price decreases less profitable too, especially if the effective retail rate is below the cost of roaming.
442. More cost-reflective and higher quality roaming arrangements would seem to be one means of overcoming the investment disadvantage and enabling greater price competition outside of the national coverage aspect. This is because it may enable more aggressive pricing financially but also technically, as their own networks may not be degraded if subscribers off-load onto roaming networks at cost-orientated rates. It also reduces the network quality difference, enabling price reductions to be more effective at drawing away subscribers from other networks.
6.3.2. Assessment of MVNO arrangements
443. MVNOs operate at a retail level and may be completely reliant on the network infrastructure of the MNO, although there are different types of MVNOs including full MVNOs and intermediate/light MVNOs. Also related to MVNOs are branded resellers.
443.1. A full MVNO is in full control of all the services and products it offers (e.g. []526,[]527) and operates its own core network and purchases a limited set of wholesale mobile services.
443.2. A light or intermediate MVNO purchases a broad set of mobile network services including access to the core network. It will however control marketing and sales as well as back-office processes and value-added services.528
443.3. Branded resellers merely provides its brand and sometimes its distribution channel. Examples of branded resellers in South Africa are Afrihost529, RSAWEB and Axxess.
444. Entry at a retail level should be much easier than at the wholesale level due to far lower requirements in terms of infrastructure. MNOs require access to radio access infrastructure and spectrum which are acquired at a significant capital cost.530 They also face the risk

131
of delayed or even denied access to sites for building tower and masts.531 In contrast, MVNOs use the infrastructure of MNOs and use the free capacity on their network. Their capital costs are not considered to be a material obstacle to new entrants in the market.532
445. In comparison to roaming, technically there should be more options for potential MVNOs to secure wholesale supply which suggests it may be more competitive. However, in practice, of the MNOs in the market, we understand that, outside of branded resellers, only Cell C has given access to MVNOs such as [].533 From this evidence alone, it is apparent that MNOs face a disincentive to open up their wholesale networks to new entrants at the retail/services level.
445.1. In essence, the MVNO using an MNO’s network infrastructure would also compete against the retail operation of the same MNO. Therefore it would likely take some of the retail customers of the MNO, thus impacting the MNO’s profits negatively. Whether an MNO provides access to MVNOs depends on whether the benefits of greater sales by the MVNOs (and the benefit at a wholesale level to the MNO from greater revenue and lower unit costs) exceeds the costs of providing access to MVNOs including the costs at a retail level from having its own customers cannibalised.
445.2. Even in the case where a MNO does provide access, there may still be a disincentive to provide truly competitive wholesale rates that might reduce the profitability of its own downstream retail operation. Submissions from MVNOs allege that charges for network services by MNOs are high and negatively impact the margins that can be earned by MVNOs, thereby threatening the long-term viability of their businesses.534 In some cases, wholesale prices offered by MNOs to MVNOs are above their retail prices, for example, in data.535 As such, MVNOs submit that they often cannot compete on an equal footing with the retail operation. The lack of outside
531 [] submission, 17 August 2018, p.5532 [] submission, 17 August 2018, p.6533 However, we understand that MTN and Vodacom have been approached by MVNOs in the past. See the [], 22 August 2018, p.5.534 [] submission, 17 August 2018, p.7; [] submission, 7 June 2018, p.3; [] Submission, 22 August 2018, p.7535 [] submission, 17 August 2018, p.7536 Vodacom non-confidential letter dated 30 November 2017 (In Cliffe Dekker Hofmeyer’s letterhead), p.13, para. 1.5.1.1
options for the MVNO access provider exacerbates this problem.
446. Unsurprisingly, within this context the MVNOs,
while growing, are largely insignificant in the market, focusing on niche segments. MVNOs together comprise just 1.8% of the mobile market in South Africa based on subscriber numbers. This barely supports the notion that MVNOs “enable and enhance competition in the mobile retail market” as contended by Vodacom.536 Thus, even though entry at a retail level should be far easier than at a wholesale level (where more infrastructure and extensive networks are needed), the presence of vertical integration and its impact on MNOs’ incentives, mean that barriers to entry at the wholesale level are effectively transferred down to the retail market by making entry more difficult and less effective at this level of the value chain. Therefore, competition downstream in the retail market is limited by vertical integration and large barriers to entry upstream.
447. As discussed earlier in this report, the intention for the WOAN is that it operates at a wholesale level, with functional separation between it and any related retail operation. This may have a significant impact on the market as it would allow more entry and possibly more effective entry. The WOAN, which would effectively operate only at a wholesale level, would not have the same conflicting incentives as vertically integrated MNOs. Instead, it would have a clearer incentive to offer competitive access at a wholesale level, which would enable entrants to be more competitive at the retail level, which in turn would drive greater revenues for the WOAN itself. Thus, the WOAN may represent a significant change in the market structure at the wholesale level of the market which will result in greater levels of competition in the retail market. This may not be the case however, if the WOAN RAN operation is ultimately operated by an existing MNO, unless that MNO is effectively regulated in respect of wholesale access and pricing.
448. In fact, the experience of the Telkom settlement, whereby separation of the wholesale and retail operations of Telkom along with commitments to non-discrimination was enforced, has been

132
regarded as a great success. This is both by other market participants to the Inquiry such as the ISPA537 as well as Telkom itself538. It appears that the settlement has contributed to greater entry at a retail/services level as well as falling prices at a wholesale level539. A similar separation of wholesale and retail in mobile markets has the potential to result in significant benefits for consumers and increased competition.
6.4. Preliminary Findings
449. Based on the evidence before the Inquiry, we find that there is considerable scope to improve price competition in the mobile data services market.
449.1. The retail market has remained stubbornly concentrated despite the entry of two challenger networks over time. Vodacom has a share in mobile services more generally and mobile data services specifically that exceeds the thresholds used in the Competition Act for a conclusive determination of dominance. MTN has constantly skirted around the threshold level where there is a rebuttable presumption of dominance. This is despite the challenger networks rolling out extensive infrastructure, engaging in more aggressive pricing strategies and seeking to market extensively in an effort to build a greater data and subscriber share.
449.2. The pricing analysis concurs that these two operators are to a large extent able to price independently of the challenger networks.
449.2.1. On headline data prices, Cell C has historically been more aggressive and yet the two larger networks found it profitable to not follow their pricing downwards – Vodacom especially but also MTN. As a result, it seems that Cell C has recently determined that it cannot win sufficient share by lowering prices and has proceeded to raise them back upwards towards the two larger networks. More recently, it has been the turn of Telkom Mobile
537 ISPA’s submission dated 1 November 2017, p.2538 Telkom’s submission (non-confidential version) dated 17 November 2017, p.37539 Telkom’s submission (non-confidential version) dated 17 November 2017, p.37
to be aggressive on pricing, dropping headline rates well below its rivals. However, the larger networks, especially Vodacom, have not sought to respond with lower headline prices themselves. Even though MTN and Vodacom account for a large share of the overall subscriber base, price benchmarking exercises are often based on the cheapest prices available (Typically Cell C or Telkom) and still show that South Africa performs poorly relative to other countries.
449.2.2. Whilst the two largest operators claim to respond in other ways, such as short-validity bundles and untransparent and selective free data and promotions, the evidence on overall revenue per GB shows that there is still a large gulf between what they are able to effectively charge inclusive of all these items and what the challenger networks effectively charge for prepaid data.
449.2.3. Furthermore, as outlined in the section on pricing structure, the Inquiry is of the view that the strategy of offering free or promotional data rather than reducing headline pricing serves to undermine greater levels of price competition within the market. This is because there is a complete lack of transparency to consumers as to actual effective prices paid, which is important to make informed switching decisions. In addition, the greater price responsiveness of marginal consumers is not transmitted to the benefit of less responsive inframarginal consumers given the tendency to more personalised pricing strategies. The very structure of pricing therefore perpetuates a market where price competition

133
plays a lessor role. As also noted previously, these pricing strategies have also turned out to be anti-poor, as better pricing to larger volume, wealthier consumers is not transmitted to poorer consumers and thereby enabling these consumers to be exploited.
449.3. The resilience of the apparently dominant positions lends credence to the submissions suggesting certain market features serve to perpetuate the first mover advantages of the two incumbents, Vodacom and MTN. The market features which seem to play more of a role, in line with expectations from economic theory, are the following:
449.3.1. The far greater ability of the incumbents to fund the substantial capital expenditure requirements of mobile networks to improve network quality and bring in new services nationally. The first-mover positions that enabled a larger subscriber base combined with higher profit margins from being able to price independently of the challenger networks, means that the incumbents can both outspend on absolute levels by considerable margins, and also largely fund such capex out of retained earnings. In contrast, the challenger networks with smaller and less profitable customers are not able to fund to the same level, in part because they need to do so through shareholder equity or debt funding. The constant battles Cell C has had with its debt levels and equity refinancing over an extended period are reflective of precisely this challenge for the newer networks. Telkom Mobile has had the benefit of a parent company with other business lines, but it is not unconstrained as to the levels of capex it is able to deploy.
449.3.2. The greater scale built through the first-mover advantage provides other benefits to the incumbents, namely a lower unit cost base than the challenger networks. This means that challenger networks are less able to impose a real pricing constraint on the larger networks as the challenger networks are constrained as to how low they are able to price before they make operating losses. In the context of funding capex in the arms race against the larger incumbents, this constraint is even more binding. As a result, the weakened financial and network quality position of the challenger networks also serves to weaken price competition in the market. Whilst the challenger networks will occasionally engage in more aggressive pricing to try grab more market share, this becomes financially unsustainable if there is not a sufficient subscriber response. The outcome is that the challenger networks have to resort to softer price competition in order to protect their financial viability – as would seem to be the case with Cell C’s more recent price increases outlined above. Furthermore, if the challenger networks are successful in moving material numbers of subscribers across, then their network is liable to degrade in quality given capacity constraints. As a result, the poor subscriber experience then results in many switching back to the incumbents and so any gains are temporary unless the networks can find ways to rapidly expand capacity.
449.3.3. The stickiness of more valuable contract customers, more favourable site locations and spectrum assignments are also factors that have played into the hands of first-mover

134
networks historically, albeit that their role or effect may have reduced over time.
450. The findings in the retail market do also point towards potential problems in the wholesale markets. This is because later entrants (and retail service providers such as MVNOs) generally rely on the wholesale supply of infrastructure and other services from first-mover incumbents for the supply of their own services. Whilst this provides an opportunity to provide challenger networks with some of the benefits acquired by incumbents simply from being the first-mover, the reality is that it is rarely in the interests of the incumbents to provide access, or to do so on fair and reasonable terms. This was evident with termination rates, but is also evident in other areas where there is no current effective regulation.
450.1. Wholesale provision of facilities leasing is one such area which is subject to ongoing complaints and where only access is regulated, and even then not necessarily enforced stringently. This was the subject of the previous section.
450.2. Another area is wholesale roaming arrangements to achieve national coverage for challenger networks. The bargaining dynamics in respect of these arrangements clearly favour the incumbent first-movers as the only ones with national coverage, as there are not really many outside options for the challenger networks. Furthermore, as the challenger networks desperately require such roaming agreements to be able to offer a national service, the incumbents have less need to contract which places them in a strengthened bargaining position. The evidence on historical agreements is consistent with these inequitable bargaining positions, with high minimum payments required, high marginal rates, poor roaming quality through lack of seamless handover and denial of roaming for new data service lines.
450.3. A third area where wholesale markets have visibly failed is in providing wholesale network access for the purposes of retail competitors in the form of MVNOs. This is an area where the incumbent networks have not been active, and only one network – Cell C
– has emerged as a supplier of such services. Whilst technically there may be more scope for wholesale competition for such services as all four networks may be potential options rather than the two for national roaming, it is apparent that practically this has not been the case. Given the refusal of three networks to offer wholesale MVNO deals, this has left the option of making use of a single provider for those firms looking to launch MVNOs. This is not the kind of market scenario which results in competitive pricing. As a result, MVNOs are simply not a material feature of the South African market and have remained as niche operations designed to provide benefits to support retention of other customer bases.
451. The provisional findings are not necessarily surprising given that these markets have been the subject of numerous competition complaints and regulatory lobbying, as well as the findings on price benchmarking pointing to high prices relative to a range of peers on the continent and globally. This is especially in the context where the same operators price considerably lower in other operating countries where they lack the same market power and fill the role of challenger networks there. It would seem that the only stakeholders that believe competition to be sufficient are those that hold the first-mover incumbency advantage and hence stand to lose from conceding as much.

135
452. The overwhelming focus of submissions made to the Inquiry focused on mobile data services, which is unsurprising given that mobile data coverage is effectively universal and it is the means through which most consumers get data services. The submissions on fixed line were sparse, and maybe because much of the focus was on reducing data prices to poorer consumers, where the lack of fixed line infrastructure in those communities meant many stakeholders deemed it less relevant. As outlined in the submissions, fixed data services are estimated to provide services to only 5% of the population, compared to mobile services at around 50%.
453. However, as recognised by ICASA in its Priority Market Review, limited supply may also be a symptom of competition issues in that value chain and therefore warrant closer inspection.540 The international pricing comparisons reviewed in Section 3 also showed that fixed data prices were high compared to other countries. In terms of concerns, aside from concerns expressed about the pricing of Telkom’s IP Connect and access to ducts and poles, the general comments were that many aspects of the value chain were relatively competitive. Refer to appendix D for a summary of these submissions.
454. However, the Inquiry remains interested in the fixed line supply of data services and the potential role it can play in reducing data prices more generally and to poorer consumers more specifically.
454.1. One reason for this interest is that fixed line supply remains the backbone in the supply of not just household and business access, but also public data
540 ICASA (2018) Findings Document on Priority Markets: Inquiry in Electronic Communications Sector, p. 29 available at https://www.icasa. org.za/uploads/files/findings-document-priority-markets-inquiry.pdf541 Similar sentiments around pervasiveness to provide constraints were expressed in a recent EU case where the extent of constraint placed by Wi-Fi on mobile was explored. The court stated that “In order to be substitute to mobile broadband services, the Wi-Fi services would need to provide smooth handover (so that the service is provided seamlessly when mobile), and national coverage, to replicate that of the mobile network, which is not the case for the Wi-Fi services that are currently available in Germany”. Case M.7018- Telefonica Deutschland/ E-Plus
services such as public Wi-Fi or even community networks. These represent alternative sources of data service, and therefore have the potential to provide cheaper (or even free) data services at different geographic places and/or different points in the day to consumers. This is in part because that infrastructure is frequently cheaper for large data volumes given costs are largely fixed and sunk.
454.2. Cheaper prices are important in themselves, but also this infrastructure can be an alternative source of competitive pressure on mobile data services to bring those prices down. This is largely because fixed line services are typically provided through Wi-Fi at the point of use, and hence available for smartphones to connect to. However, such competitive pressure is only likely to occur if these services are far more pervasive (to give more opportunity for off-load), and if they also have reach into poorer communities which currently have no options outside of mobile and which are being exploited as a result.541
455. The Inquiry is of the view that one cannot focus exclusively on trying to fix mobile competition as a solution to high data prices, and therefore considers that efforts to extend the reach of alternative infrastructure such as fixed line or fixed wireless into poorer areas, even if only in the form of public Wi-Fi, remains an important solution to high data prices now and in the future. This section seeks to set out what the Inquiry believes may be behind the supply gap of fixed services into poorer communities, laying the foundation for provisional recommendations as
7. FIXED LINE SUPPLY GAP

136
to possible strategies to address such gaps. In addition, it also explores the concerns around IP Connect pricing as ensuring low prices for fixed data services is critical if it is to play a role. Access to ducts and poles is already addressed in the section on cost drivers and facilities access above.
456. Given the lack of submissions in this regard, the Inquiry has based this discussion primarily on its own research and the Commission’s casework. The focus is primarily on fibre rollout given there is no new investment in ADSL, and on business models for both fibre-to-the-home and public Wi-Fi which need to be in place alongside infrastructure. In order to plug this gap in the submission process, the Inquiry seeks to make use of the next phase following the publication of this report to solicit the views of stakeholders as to why they believe a supply gap for such services exist, whether extending the services to lower income communities is indeed useful in addressing high prices and what solutions may present themselves to unlock the extension of this alternative infrastructure if useful.
7.1. Value chain and business models
7.1.1. The value chain
457. At the infrastructure layer, fibre infrastructure used to provide fixed line data services is generally segmented into 4 (four) levels namely; international, national, metro and access layer, or “last mile”. It is the last two that interest the Inquiry the most, as it is these two where a supply gap typically exists and especially in poorer communities.
457.1. International fibre infrastructure network – connects South Africa to rest of the world and in particular the global Internet. There are a number of undersea cables542 and this is considered by ICASA in its priority market review to be relatively competitive such that it is not a priority for a market review.543
542 This layer of connectivity comprises 5 (five) submarine-laid fibre optic cable namely; West Africa Cable System (WACS), Eastern African Submarine Cable System, better known EASSy, SAT-3 and/SAFE, Seacom, and offering multiple terabits of bandwidth.543 ICASA (2018) Findings Document on Priority Markets: Inquiry in Electronic Communications Sector, pg 45 available at https://www.icasa. org.za/uploads/files/findings-document-priority-markets-inquiry.pdf544 This layer of connectivity consists of a few large providers and consortiums, namely Telkom (Openserve), the NLD consortium (MTN, Neo tel, SANRAL and Vodacom in partnership), Broadband Infraco, Fibreco and DFA.545 ICASA (2018) Findings Document on Priority Markets: Inquiry in Electronic Communications Sector, pg 33-34 available at https://www. icasa.org.za/uploads/files/findings-document-priority-markets-inquiry.pdf546 This layer of connectivity consists of multiple providers, including Telkom (Openserve), Link Africa, Liquid Telecoms, Fibre Co, Metro Fibre, DFA, Vodacom and MTN amongst others.547 This layer of connectivity consists of multiple providers, including Telkom, Vumatel, MTN, Vodacom, Cool fibre, Seacom, Metro Fibre, Frogfoot among others.
457.2. National fibre infrastructure network – also referred to as long haul, national fibre comprises of high capacity fibre transmission links between cities and towns. There are a number of operators active544 especially on the high traffic routes. ICASA had identified this market and that of metro fibre as priorities for review namely due to there often being a single supplier on thinner, more rural routes which may be a concern, rather than the high traffic routes where more operators are active.545
457.3. Metropolitan fibre (Backhaul) infrastructure network – When a national fibre link lands in a city or large town, the traffic is then carried to a point which is closer to the customer. This is achieved through metropolitan area networks which typically use fibre or microwave links, also known as backhaul networks. In essence, the metro fibre backhaul connects the last mile infrastructure to larger switches and aggregation points in a metropolitan area. There are a few suppliers of metro fibre, including the MNOs supplying their own needs.546 ICASA had identified this market for a priority review due to the limited number of operators especially in smaller cities.
457.4. Last mile fibre infrastructure network – In order for end customers to connect to the Internet or other telecommunication services, an access layer, or “last mile”, is needed. Last mile operators roll out their fibre infrastructure networks to residential houses and/or estates, generally referred to as FTTH, and to businesses, generally referred to as FTTB. This is the final, or last-mile, connectivity leg between the individual customer and the telecommunication service provider or local exchange. There are a number of active firms currently rolling out FTTB and FTTH networks547 and this was not considered a priority market by ICASA.

137
458. At the retail service layer, the customer will ultimately be purchasing Internet access which is a service that sits on top of the data infrastructure. The customer may either be a household or a business.
458.1. For households and small business premises, the ISPs will typically contract with the customer directly to charge for the service, inclusive of the local and metro fibre, as well as the Internet connection. The ISP will charge an installation to provide the Wi-Fi routers and for running infrastructure from the street into the premises. This is typically a competitive service layer with scores of providers.548 The ISPs will purchase the underlying infrastructure from the last mile fibre provider, who will typically themselves contract with the metro fibre provider to bill a flat fee for carriage of traffic to and from the location to the ISP’s data centre.
458.2. For larger businesses, the relationship may be more complex as the service provider may be providing a range of services and subject to service level agreements. This service may be directly contracted by the infrastructure provider who is more willing to engage directly with large individual businesses.
458.3. Public Wi-Fi is defined to include an unsecured Wi-Fi service provided to the public whether in a private premise (e.g. a restaurant or shopping mall) or in a public space (e.g. government office, public service bus terminal or park). For public Wi-Fi providers, it is not too different to the ISP model whereby the provider will typically be an ISP and will contract on a wholesale basis with the infrastructure providers. They will also install the premises equipment, which may be relatively simple if it is a small premise such as a restaurant, but it may also be more complex if it is an entire shopping mall or transport node. The business models are also more varied, from the straightforward service costing to cost-sharing and other models.
7.1.2. Backhaul and last mile infrastructure
459. The key economic feature for both fibre
548 SADV, RSAWeb, Vodacom, MWEB, MTN, Telkom, Afrihost, Cell C, Vox etc.
backhaul and last mile infrastructure is that it involves large fixed and sunk costs to put the infrastructure in place, but negligible variable costs to provide data transmission services over that infrastructure once it is in place (as opposed to the Internet service which is a variable cost). Furthermore, this investment needs to be made upfront prior to contracting and generating revenue from customers. This has a number of implications for how the market operates:
459.1. First, there are large upfront capital requirements to deploy a network, in particular because there is often a long time to market from inception, planning and rollout to securing customer revenue. Furthermore, initial customer demand may be inadequate to recover costs and the operator needs to take a long-term view that over time more customers will come forward to make the investment profitable. This does mean that the number of operators will be more limited.
459.2. Second, ensuring a demand for the project from the start is essential in order to warrant the investment on the basis it will make a return.
459.2.1. For metro fibre, the majority of demand comes from the MNOs themselves, providing backhaul to base stations, as well as the wholesale and corporate clients of other Telco’s such as Telkom or the large ISPs. The backhaul in the case of large ISPs is from corporate customers to the large datacentres dotted around the major metro areas. The implication is that MNOs and Telco’s that generate their own demand are in the best commercial position to invest in metro fibre, which is what we observe. It is more risky for third parties that need to secure contracts from independent customers and this is evident in few such operators emerging. The main third party remains Dark Fibre Africa (DFA) which operates on an open access model for dark fibre, albeit that

138
some municipalities have made such investments to support their own demand and that of citizens.
459.2.2. For last mile FTTH and FTTB, there is a consideration of the likely demand in an area for a fibre product as against the likely costs. The factors that may be considered include the incomes of the area (affordability and demand for large data packages)549, density of the population550 and proximity to metropolitan backhaul551. As a result of income levels in particular, there has been no rollout of fibre into lower income areas in South Africa despite certain FTTH providers toying with potential business models for these areas.552
459.3. Third, for last mile there is typically limited scope for multiple providers in one area resulting in localised monopolies and first-mover advantages in what has been term a “land grab”.
459.3.1. This is because there is a large fixed cost to rollout throughout an area, the ability to satisfy the entire demand by one operator and a limit to the number of customers in an area. This may also be due to regulatory restrictions, such as the “dig-once” policy outlined below that some municipalities adopt. It is only where customer take-up might be very high that the total revenue available in an area may support the costs of two networks. This is particularly the case with business areas where revenue per customer may be much higher, and take up is universal.
459.3.2. In contrast, for metro fibre which aggregates from numerous
549 Wealthier areas will have more households with sufficient disposable income to afford a fibre product and likely demand the large volumes of data for content or other services.550 A denser population means a lower cost to reach each household or business.551 Metro backhaul is typically priced on distance and therefore the proximity to the connection point will impact on ongoing costs and hence the price to consumers.552 For instance, Vumatel has mooted a potential business model for Alexander township in Johannesburg but the Inquiry understands that it has yet to act on it. See https://mybroadband.co.za/news/fibre/257195-vumatels-100mbps-township-fibre-project-has-started.html
areas, there is more scope for duplication of infrastructure in large metropolitan areas, which we observe in practice. In fact, some cities like Cape Town have even invested in their own fibre backhaul which is provided to third parties and presumably also serves the needs of the city services too. However, smaller secondary cities and towns still lack sufficient demand to support multiple providers and hence what we observe is that Telkom Openserve will typically be the only operator given its historical incumbency around copper backhaul infrastructure.
459.4. Fourth, there are network effects in metro fibre and even last mile infrastructure which provides a cost advantage to the larger and more established incumbents. Specifically, the incremental investment cost is low to add additional connections to the core network. This means that there are lower customer requirements to making that investment, and hence it is more likely to be justifiable than a new entrant which faces higher costs.
460. Rolling out physical infrastructure also requires engagement with numerous regulatory hurdles that need to be overcome, which also tend to favour incumbents and deep pockets:
460.1. ICASA licencing regulations requires that any firm or individual seeking to provide network infrastructure requires approval from ICASA. This could either take the form of national individual licences or regional class licences which have less stringent requirements. The Inquiry understands that no new individual licences have been granted since 2010 and that the hurdles required for an individual licence approval are significant.
460.2. Once in possession of the appropriate licence, infrastructure suppliers have to receive approval from municipalities

139
(wayleaves) as well as from the relevant authority if entering a gated estate or business-park. In addition, depending on the municipality, a fibre build may require approval from water and electricity providers; road agencies; environmental agencies; etc. Municipalities have also increased the cost of acquiring such wayleaves, including large deposits per trench, and have in many instances restricted the digging of multiple trenches under a so-called ‘dig-once’ policy. Aerial fibre is cheaper and quicker to roll out, but requires access to poles from the municipality (electricity poles).
460.3. The existing telephone poles and copper ducts of Telkom Openserve enables it to bypass some of the regulatory requirements and also enable it to rollout faster and cheaper than rivals where this infrastructure is already in place. The Inquiry understands that Telkom Openserve does not provide access to these ducts and poles currently.
7.1.3. ISP and public Wi-Fi business models
461. The business model for the ISP service level to individual homes and businesses is relatively simple once the infrastructure is in place:
461.1. The ISP will typically contract directly with the customer for a monthly service, which may be differentiated by speed and total monthly cap on data volumes (or uncapped). The ISP will then purchase the wholesale fibre transmission from the last mile and metro fibre provider, to secure data transmission between the premises and the ISP data centre. This wholesale fee will be included in the ISP charges to the customer. In the case of Openserve as the last mile provider, ISPs will pay for the handover service at a national level through the product called IP Connect for ADSL services. These charges incorporate national aggregation of the traffic rather than permitting localised access to those networks. As a result, there are numerous complaints as to the price levels for this service which we discuss in more detail below.
461.2. These charges will depend on the service purchased. For larger business customers, there are typically service level agreements that are more stringent
than those for small businesses and households, and more than Internet services may be part of the package.
461.3. Given that the ISPs do not need to invest large amounts of capital into infrastructure, and most of their costs are variable not fixed (wholesale fees to the infrastructure providers, data centre presence and peering), entry is far easier than at the infrastructure level. As a result, there are literally hundreds of ISPs active in the market and this level of the value chain is highly competitive.
462. The public Wi-Fi business models are generally more varied relative to the ISP models above, but also more complex where a service provider wishes to provide access to multiple sites nationally or control access to individual users. On the purely technical system requirements front:
462.1. The first additional complexity is that the service provider needs to design and build out Wi-Fi infrastructure at the business premises or public location. This may be relatively simple if it is a small premise like a restaurant, or a service area at a government office, but increases in complexity if it extends to larger premises or even open air areas. This customer premises equipment and its design will vary depending on the quality of service targeted.
462.2. Connecting the site to the Internet involves the same contracting with infrastructure providers to transmit data to and from the site to the ISP presence at a nearby data centre. Different levels of service (speed and volumes) requires consideration of the flow of people and their likely demand, as well as the costs involved for the provider. This would affect the infrastructure and ISP capacity and costs.
462.3. If the service provider wishes to control the extent of free data provided to individuals, or require payment for a premium data service, then the service provider would need to build a subscriber management system and pay wall at the back end of the service within the ISP functions at the data centre. For instance, the City of Cape Town offers 50 MB free data daily to the public but

140
requires registration and Tshwane runs a similar model. On a commercial basis, AlwaysOn offers a limited period of free access and subscription service for use beyond that across multiple sites nationally.
462.4. If the service provider wishes to provide access through multiple sites, then these can be configured to transmit to a single ISP at a single or various data centres. This becomes more complex if the service provider wishes to provide services through Wi-Fi hotspots operated by other service providers, as this would require not only contracting for access, but also configuration to direct a specific customer to their ISP and not that of the host.
463. In terms of business models for public Wi-Fi, there would seem to be a number of options for how premises or public institutions may seek to contract and pay for the service.
463.1. At the simplest level, a business or government institution may simply contract a service provider to provide the technical service and pay the service provider for the costs of that service. The contract may stipulate the quality of service desired in order to control the costs. Public institutions providing free public Wi-Fi may seek to find funders for these costs outside of their own budget. For instance, the City of Tshwane states that their public Wi-Fi is made possible by Project Isizwe which is a global non-profit organisation dedicated to providing free Internet in Africa.553
463.2. There may also be cost-sharing models, where the service provider is given opportunities to generate revenue for itself through operating the Wi-Fi at the premises which defray some, or all, of the expenses. This may include the ability to offer a premium paid-for service alongside the free service, or generate advertising revenue and/or data for sale. This has often been the model historically in hotels and airports.
463.3. The Inquiry understands that contracting has typically been exclusive for host premises because the premise owners do not want duplicate customer
553 http://www.tshwane.gov.za/Pages/WIFI.aspx
premises equipment in place. This may also be demanded where cost-sharing models are in place to provide greater assurances that the service provider is able to secure revenue. In this respect, it has similarities to the last mile fibre land-grabs, but with the exception that it would be easier to switch providers at points in the future given the lower levels of investment in customer premises equipment and private ownership of the premise. However, the Inquiry understands that service providers may contract with each other for access to each other’s Wi-Fi hotspots, in much the same way that site-sharing or roaming on mobile networks operate. However, this would seem to be more likely amongst larger and more equally sized networks as there would be mutual benefits to contracting insofar as accessing a larger number of sites. It seems less likely with smaller operators.
464. These different business models are best illustrated through a few examples:
Private Free and Paywall services
465. The Telco’s and some third parties such as AlwaysOn (Dimension Data) offer a limited free service to consumers at multiple sites nationally and then a pay wall service for extended use.
465.1. For instance, AlwaysOn operates just over 2200 hotspots in the country, mainly in shopping malls. AlwaysOn offers customers limited free Wi-Fi access to cover basic internet usage and thereafter customers can either buy a Wi-Fi subscription valid for 30 days once off or buy a monthly Wi-Fi subscription. Below we tabulate the costs of Wi-Fi subscription offered by Always On. It would seem that the provision of some free Wi-Fi may be based on some sort of cost-sharing contracting model that AlwaysOn has with the premises in which it provides hotspots.
465.2. Telkom also offers Wi-Fi paywalls for both its customers and those that are not Telkom customers (general public). Anyone can use 30 minutes free Wi-Fi at any of Telkom’s hotspots and there is also an option to buy bundles at R15 for 30 minutes and R25 for an hour. Telkom has

141
the most Wi-Fi hotspots in the country (just over 5500 hotspots) but again these are mainly in shopping malls. 555 There are other smaller Wi-Fi paywall providers and their Wi-Fi hotspots are also mainly located in shopping malls and similar locations.
Public Free and Pay Wall Wi-Fi
466. A number of metropolitan cities have started to offer limited free Wi-Fi to residents at public premises throughout the city, including government service offices, transport nodes and public spaces.
466.1. Tshwane’s free Wi-Fi is claimed to be the largest of its kind on the continent. It has 780 sites across open public spaces, educational institutions, schools, clinics and libraries. It provides 500MB free data per day per user at a claimed average speed of 15MBps. It states that over 1.6m unique devices have accessed the network since its inception.
466.2. The City of Cape Town operates free public Wi-Fi of 50MB per day at 100 city-run buildings (clinics, administration buildings, cash offices and the traffic department) and in some parks, namely the Company Gardens. It is apparently rolling out free Wi-Fi at certain public transport interchanges (Langa, Nyanga,
554 AlwaysOn [Online]. Available at https://www.alwayson.co.za/wifi.aspx [Accessed 18 March 2019] 555 Telkom. [Online]. Available at https://secure.telkom.co.za/today/shop/personal/plan/telkom-wifi-60-minutes-bundle/ [Accessed 26 March 2019].556 See http://www.capetown.gov.za/Local%20and%20communities/Get-online/Public-WiFi-Zones/Public-WiFi-across-the-City
Uitsig, Valhalla Park, Athlone, Atlantis and the City Centre) and on MyCiti buses.556 The City also offers a SmartCape library service whereby registered library users get 45 minutes use free daily on library computer terminals, but can also pre-purchase Wi-Fi for the use of 100MB per month.
7.1.4. Specific concerns raised with Openserve’s IP Connect
467. Telkom Openserve is the largest provider of last mile fixed line broadband services nationally, built on its historic position as the monopoly provider prior to 2005. This incorporates a substantial number of legacy technology ADSL lines and a growing volume of FTTH / FTTB lines based on new rollout of fibre, often on existing aerial poles or ducts used previously for copper services. As such, Telkom Openserve remains the largest provider of last mile fixed broadband infrastructure nationally. Telkom Openserve does provide access to this infrastructure on a wholesale basis to third party ISPs which may then contract with the customer directly.
468. As outlined above, the other providers of FTTH that have entered the “land grab” have tended to operate on an open access basis too. However, given their lack of vertical integration, they have tended to charge a wholesale price either for access to the last mile only, with ISPs then free to contract themselves for metro backhaul to their data centres, or a combined last-mile and
Wi-Fi data plan Price500 MB Once-off valid for 30 days R29
1GB Once-off valid for 30 days R49
2GB Once-off valid for 30 days R99
3GB Once-off valid for 30 days R139
5GB Once-off valid for 30 days R229
10GB Once-off valid for 30 days R349
500 MB Monthly subscription R19
1GB Monthly subscription R29
2GB Monthly subscription R59
3GB Monthly subscription R89
5GB Monthly subscription R149
10GB Monthly subscription R289
Table 25: AlwaysOn Wi-Fi prices
Source: AlwaysOn 554

142
metro backhaul wholesale price to the nearest data centre.
469. The essential complaint about Telkom Openserve is that ISPs are not able to access
557 IP Connect “refers to the links and throughput (bandwidth) which allows ISPs access to the network of ADSL and Fibre last-mile connections. IP Connect is the only means for connecting to last mile ADSL and Fibre networks that enable end users to connect to broadband networks in order to receive value added internet packages.” Internet Solution’s submission (non-confidential) dated 12 October 2018, p. 7, para. 3.1.558 Telkom (Openserve) IP Connect [Online].Available at : http://openserve.co.za/open/media/downloads/Openserve_eBrochure_IPConnect. pdf [Accessed 18 March 2019]559 IP Connect refers to the links and throughput (bandwidth) which allows ISPs access to the network of ADSL and Fibre last-mile connections. IP Connect is the only means of connecting to last mile ADSL and Fibre networks that enable end users to connect to broadband networks in order to receive value added internet packages 560 Internet Solution’s submission (non-confidential) dated 12 October 2018, p. 7, para. 4.1561 “Telkom not only surpasses the 45% mark, but is actually a monopoly in the market for IP Connect insofar as ADSL is concerned. When it comes to last mile fibre solutions, Openserve controls access, via IP Connect, to at least 45% of the last mile fibre infrastructure.” Internet Solution’s submission (non-confidential) dated 12 October 2018, p. 7, para. 4.1 562 Internet Solutions’ submission (non-confidential version) dated 12 October 2018, p. 8, para. 4.4 563 Internet Solutions’ submission (non-confidential version) dated 12 October 2018, p. 5, para. 3.6. 564 Afrihost presentation to the data market inquiry public hearings dated 11 November 2018, slide 2
their last mile at this level of disaggregation, but rather can only access these connections at a national aggregation point through a wholesale product called IP Connect.557 This is depicted in the graphic below.
470. The national aggregation is said to make access to the last mile ADSL lines of Telkom Openserve particularly expensive, as ISPs may be paying for legacy infrastructure and unnecessary national aggregation. The specific submissions were as follows:
470.1. Internet Solutions submits that “it is common cause that Telkom, through a subsidiary Openserve controls ADSL access via IP Connect559 as Telkom owns the ADSL network in the country. Telkom is the only operator with last mile copper infrastructure and does not allow any other company direct access to its network.”560 Internet Solutions further submits that Telkom is dominant in an ADSL market. 561
470.2. In light of this, Internet Solutions submits that fixed data prices are high because of high prices for IP Connect.562 Internet Solutions further submits that “currently the cost of national IP Connect bandwidth is five times more expensive than connecting to Europe on undersea cable system” (emphasis added).563 Afrihost shares the same view and submits that fixed data prices are higher in South Africa because of the high price charged by Openserve for IP Connect.564
471. During the public hearings, Telkom responded to the allegations that the IP Connect product offered by its subsidiary (Openserve) is excessively priced. Telkom firstly argued that it is not correct to compare the price of IP Connect to other products offered by the likes of Vumatel
Figure 51: IP Connect
Source: Openserve 558

143
and that the market does not understand the cost drivers of IP Connect. Telkom makes two arguments in the public hearings:
471.1. Firstly, Telkom states that “Telkom is a national network, so obviously the costs of our network inputs costs are far higher. You also have a legacy network which layers in a fixed cost overhead”565. Essentially Telkom argues here that due to its legacy national network, its cost base is different to others and its national pricing approach must cover all of its costs.
471.2. Secondly, Telkom argues that the prices of IP Connect have decreased significantly over time and this was achieved by implementing efficiency measures. Specifically, Mr Maseko, the CEO of Telkom argued during the public hearings that “IP Connect prices have been coming down over the last few years, I think if I am not mistaken those prices have come down by about 80%, 90%. They continue to come down”.566 Mr Maseko further explains that IP Connect prices came down at a cost, the staff compliment was 22 000 when he started at Telkom and now Telkom’s staff compliment is around 12 000.567 Telkom also indicated that more price decreases for IP Connect were in the pipeline at the time of the hearings.568
472. Telkom was also requested to respond in writing to the allegations that the IP Connect product offered by its subsidiary (Openserve) is excessively priced. In response, Telkom continued to [] 569 and then in terms of more [].570
7.2. Assessment and key findings
473. There is little doubt to the Inquiry at least that focusing efforts exclusively on mobile costs and competition in order to bring down high data prices is a suboptimal strategy. Insufficient competition amongst mobile operators has been a persistent concern for decades, proving difficult to change effectively through interventions and also dependent on competitor firm performance. Furthermore, the mobile cost
565 Telkom’s presentation at the public hearings held on 17-19 October 2018. See Day 2 transcripts, p.164-165, line 3-11. 566 Telkom’s presentation at the public hearings held on 17-19 October 2018. See Day 2 transcripts, p.165, line 16-17 567 Telkom’s presentation at the public hearings held on 17-19 October 2018. See Day 2 transcripts, p.165, line 20-21 568 Telkom’s presentation at the public hearings held on 17-19 October 2018. See Day 2 transcripts, p.165, line 15-16 569 Telkom’s submission dated 01 March 2019, p.18, para. 48 - [] 570 Telkom’s submission dated 01 March 2019, p.19-20, para. 50-51. Telkom further adds that []
structure does not seem to currently lend itself to cost-effective supply and pricing of very large or uncapped data bundles, and therefore may only effectively serve particular types of needs such as those of people on the move.
474. The assessment of the Inquiry is that government needs to pursue the development of alternative infrastructures to those of mobile if it is truly going to see low competitive data prices to all citizens. Fixed line, including public Wi-Fi, remains a potentially attractive proposition for the following reasons:
475. The cost structure lends itself to cheaper prices for large data consumption which is where the market will move once it becomes more affordable. It therefore represents a potential future source of competitive data pricing as demand grows. Indeed, if business models such as Vumatel’s R89 uncapped option for Alexandra can get off the ground then it would completely transform the data environment even for lower income households.
476. Fixed line is often providing backbone support for free public Wi-Fi (or other similar alternative infrastructure such as fixed-wireless) which is becoming far more pervasive in many more developed jurisdictions. Again, the cost structure of fixed lends itself to such services where total volumes may be large within a public space across many users. As the usage is free at certain points in a consumer’s day where they are in these locations, this has the effect of lowering total expenditure on data services overall for consumers even if they are paying for data at other points in their day.
477. In addition, generating more mobile off-load points for consumers enables them to make choices about which service to use in the instance they have an alternative infrastructure. Enabling this choice then permits consumers to be more responsive to mobile pricing levels, at least for parts of the day, which can only bring more competitive pressure on mobile operator prices. In this way, one can bring more competition to mobile even if fixing competition amongst mobile operators remains difficult.
478. However, in our assessment it also seems evident that the legacy of apartheid and

144
the economic characteristics of fixed line infrastructure means that this market has, and will continue to, primarily service wealthy, historically white, urban areas absent some form of intervention. In this respect, the market is failing lower income and rural households which most need the benefit of lower data prices, and has probably resulted in these consumers being exploited by mobile operators as was found above in the discussion on mobile data pricing structure.
478.1. The apartheid legacy meant that there existed a fixed line copper-based service through aerial poles or underground ducts in former whites only residential areas. This legacy infrastructure has enabled the more immediate provision of ADSL broadband services by Telkom Openserve to these residential areas at low incremental cost. In addition, the duct and pole infrastructure provides the basis of rapid and lower cost fibre rollout by Openserve into these same residential areas, making the deployment of FTTH in these areas far more likely. In contrast, the residential areas of historically disadvantaged South Africans generally lack this legacy infrastructure, making it far more costly to roll out such services in those areas. This includes not just the last mile, but also the metro fibre backhaul as apartheid spatial planning has resulted in lower income areas being spatially separate and far from business districts and wealthier suburbs. This in turn makes such investment far less likely and requiring investment from both backhaul and FTTH providers.
478.2. Aside from the cost of rollout, it is apparent that even for FTTH service providers that lack the legacy infrastructure of Openserve, the primary targets for FTTH roll out are the wealthy suburbs given that there is likely to be a better investment case in these areas. This is because for the largely fixed investment to make a return, the FTTH provider needs to be able to sign up sufficient households in an area. Wealthy areas have more households that a) have income levels sufficiently high to make FTTH affordable, b) are likely to already have data devices (tablets, smartphones, computers and smart TVs), and c) have the demand for high data usage
applications which FTTH lends itself to services such as video streaming subscriptions. All things equal, the higher costs of providing infrastructure would still make the investment case less likely. In addition, lower incomes which makes fibre less affordable and more limited given the current demand for data hungry applications mean that fewer households will likely demand the service, reducing the investment case for rollout to these areas.
478.3. Even the rollout of public Wi-Fi has favoured the wealthy and has been insufficient in terms of coverage to give even those consumers numerous off-load opportunities. It would seem that public Wi-Fi outside of some metro government offerings has been limited largely to restaurants and shopping malls in wealthier areas. This is likely to be the case because there is more benefit to shops and restaurants providing such free services if it assists in attracting wealthier customers which have smart devices and may choose where to go based on the availability of as public Wi-Fi service. The revenue and margins at such establishments are also more likely to support covering the cost of a free Wi-Fi service. In addition, establishments in lower income areas are unlikely to have the option of a lower priced fixed service to provide public Wi-Fi to their customers if the basic infrastructure is not in place in those areas to begin with. The lack of rollout by local government exacerbates the lack of public Wi-Fi access for lower income consumers as commuter and public service points outside of private businesses are unserved by public Wi-Fi.
479. Whilst there are some sporadic efforts at free public Wi-Fi through some metro governments and speculation on potential business models for township areas (located closer to business areas), it is self-evident to the Inquiry that this is far too limited and highly unlikely to result in market reach to the vast majority of low income and rural areas. The market is therefore unlikely to itself correct for this vast disparity in alternative infrastructure access for lower income consumers relative to wealthier ones absent some form of intervention and action.

145
480. It would seem to the Inquiry that if this is to change, then there are broadly two aspects of the market which require intervention. These are addressing the cost of infrastructure rollout to these areas and identifying innovative business models to provide affordable packages to low income individuals at home or free services in public.
480.1. As noted above, the cost of infrastructure rollout is large in general for fixed line services due to the costs of trenching and the sunk fixed costs incurred upfront. However, the apartheid legacy has resulted in a market failure whereby this cost is considerably more for historically disadvantaged areas relative to wealthier, former white areas. This applies to both backhaul and last mile infrastructure. Any strategy to address the market failure and support the extension of such services into lower income and smaller rural towns will need to find a means to reduce these costs. Cost reduction is important for another reason, namely that it reduces the hurdle requirements on the demand side to support the investment decision to rollout into those areas.
480.2. As the infrastructure also lends itself to localised monopolies, and is currently dominated by Telkom Openserve, not just the underlying costs of such infrastructure need to be reduced, but also there needs to be sufficient market and countervailing constraints such that these positions are not exploited through high pricing.
480.2.1. This seems less likely in terms
of new investments into lower income areas as the incentive is more likely to keep prices at a level which makes the service affordable to such consumers. As a result, infrastructural pricing may be constrained by the target market.
480.2.2. This may be more likely for wealthier areas and existing Openserve infrastructure where there is more scope for extracting some rents at least from third party ISPs. These
incentives and the evolving market structure need to be carefully monitored in this regard.
480.3. As also noted above, the cost structure of fixed line lends itself to large volume packages at reasonable, but still higher absolute prices (lower per GB pricing).
480.3.1. For FTTH this presents challenges as the absolute minimum monthly pricing to make services affordable to lower income households may still be uneconomic to support the investment decision. Innovation is therefore going to be required to make such services available and for businesses to invest in rollout.
480.3.2. For free public Wi-Fi the challenge is likely to be different. The potential demand from a broader customer base in a public area may be sufficient to support the monthly service fees. However, funding this from a government perspective is likely to be challenging at a time of tight budget constraints at all levels of government. This too is going to require some innovation in business models in order to draw in private funding and lower the cost of service to government.
481. Given that there have not been extensive submissions on these areas, the Inquiry invites commentary on all aspects of developing the alternative infrastructure into lower income and public areas. This includes diagnosis of the source of failure, potential solutions to unlocking such infrastructure, and whether doing so is likely to assist in reducing data prices. Upon receiving submissions, the Inquiry will expand this analysis and update this sub-section in the final report. In the meantime, the Inquiry has provided some provisional recommendations which it also invites stakeholders to comment on.
146
482. The Commission’s recommendations are informed by the assessment of the level and structure of data prices, as well as the diagnosis of what factors may be driving up costs or inhibiting competition. The recommendations also take into account the current policy, legislative and regulatory context, including existing initiatives to change legislation and assign spectrum. In addition, the public hearings and written submissions provided a forum for interested parties, including the operators themselves, to provide suggestions on how to address high prices for mobile data services, or for low income consumers more generally. These have also been taken into account by the Commission in formulating recommendations.
483. The Commission has identified a provisional package of recommendations that seek to provide a combination of some immediate relief to high prices, especially for low income consumers, along with initiatives to improve mobile price competition and offer greater alternatives to consumers for data services over the medium term. These include:
483.1. Reductions in headline prices to current average effective rates for data bundles, coupled with a reduction in sub-1GB data bundle prices to within a 25% of the 1GB bundle on a per MB basis. This will lock into listed prices any current promotional and free data offers, address the perverse pricing structure that penalises low income consumers of smaller data bundles, and bring about greater price transparency that would assist price-based competition. This is coupled with more targeted relief on educational data usage through ensuring a consistent industry-wide approach to the zero-rating of content from public benefit organisations and educational institutions. If these cannot be achieved on a voluntary basis then regulatory coordination around either legislative, regulatory or enforcement action is recommended.
483.2. This should then be followed by the urgent assignment of high demand spectrum and cost-orientated access to a broader range of facilities to reduce infrastructure costs, factors which the operators themselves consider to be behind higher prices. However, that assignment should be contingent upon commitments to pass on the cost savings operators say will be realised, through lower data prices. Spectrum assignment should also be contingent upon additional commitments that assist in extending affordable access, such as free public Wi-Fi in lower income areas and commuter routes.
483.3. An intermediate programme would look to find means to enhance price-based mobile competition. This would include moving national roaming agreements towards more cost-orientated pricing levels to enable smaller networks to be more aggressive on price without being penalised with roaming losses. It would also include opening up to retail-based competition through wholesale network access to MVNOs and fairer pricing levels to these and other resellers. Functional or accounting separation of the network from the retail operations for the larger networks may be desirable in support of such wholesale access. Reform to the legislative and/or regulatory framework in the sector is also desirable if the past impediments to wholesale regulation are to be avoided going forward.
483.4. An intermediate programme should also incorporate support for the development of alternative infrastructure for the provision of data services in lower income areas and secondary cities and towns nationally. This will enable greater mobile off-load opportunities to potentially cheaper alternatives, including free public Wi-Fi, which not
8. PROVISIONAL RECOMMENDATIONS

147
only reduces overall costs of data but can bring some additional competitive pressure on mobile pricing. Under the lead of the DTPS, it is recommended that government seek to crowd in private provision of free public Wi-Fi in innovative ways, and use that process to also extend fixed line infrastructure into lower income areas. This should be supported by other initiatives to reduce the cost of rollout, such as the proposed rapid infrastructure deployment that accelerates wayleave permissions and the use of municipal facilities such as poles for aerial fibre.
484. We proceed to discuss these initiatives in more detail below.
8.1. Immediate actions on retail price structure and level
485. The Commission believes that the structure and approach to retail data pricing that has emerged in the mobile data market serves to inhibit competition and perpetuate high pricing to low-income consumers in particular.
485.1. As long as the operators continue to impose large, unjustified differences in the price per MB between low volume prepaid data packages and the higher volume pre-paid and/or post-paid packages, lower prices to wealthier, large volume customers that might respond with greater usage will not transmit into better prices to lower income, lower usage customer. Lower income, lower usage subscribers are also disproportionately exposed to punitive out-of-bundle (OOB) rates, exacerbating the price differences realised in practice.
485.2. In addition, as long as the operators focus more on opaque promotional pricing and less on adjusting headline prices downwards, lower pricing to more price responsive consumers will not transmit into lower prices for other, less price responsive consumers.
486. In short, the stated shift to more personalised pricing in South Africa would appear to be having the perverse effect of rewarding wealthier consumers to the detriment of poorer ones. In a developmental context, this type of pricing and its socio-economic consequences cannot be justified.
571 It is not clear at this stage whether ICASA’s work will result in the abolishment of OOB rates or further reductions.
487. It would also seem that addressing the structure of prices directly may provide an important means to bring about immediate relief on data prices to low-income consumers and the facilitation of more price-based competition amongst operators, which ultimately will address price levels overall. The fact that Vodacom’s pricing across its operations on the continent shows South Africa performs poorly for prepaid but less so for post-paid, suggests that addressing price structure and differences can bring data prices to lower income consumers down.
Submissions
488. A number of submissions proposed interventions to address retail price structures that either collectively raise prices or needlessly penalise low income consumers. We briefly deal with these below, but more detail is contained in the appendices.
488.1. Several propositions were made by stakeholders suggesting that regulations must be imposed to (i) limit (or eliminate) the spread between low-volume and high-volume data bundles rates, and to (ii) limit (or eliminate) the spread between pre-paid and post-paid data bundles rates.
488.2. Another concern raised by stakeholders such as Amandla.mobi and the DGMT is that poor consumers buy data bundles in small sizes and are prone to high OOB rates as their data gets depleted quickly. A solution proposed by stakeholders to remedy this problem was the abolishment of OOB rates. The MNOs mentioned that they have made strides in reducing OOB rates over the years and the industry is moving in the right direction with regard to this issue. The MNOs also indicated that ICASA was doing some work to deal with OOB rates (End-User and Subscriber Service Charter Amendment Regulations of 2018 were ultimately effected on 28 February 2019) and that this process of ICASA would further benefit consumers regarding these rates.571
488.3. Zero-rating of some applications, especially those that are run by public benefit organisations (PBOs), was suggested by stakeholders as a solution
148
to reduce the impact of high data costs on low-income consumers. All MNOs agreed with this idea and they indicated that they are already actively involved in the zero-rating of some applications and some content such as content provided by academic institutions.
488.4. Related to zero-rating, MMA referred in its submissions to the idea of providing low-speed (also referred to as low bitrate) data for free as proposed in an article by Steve Song in 2015. In the article, Song calls for MNOs to offer low-bitrate generic zero-rating to consumers by offering free 2G services for example. The idea behind Song’s proposal is that not all internet users require faster internet and “even very tiny amounts of data can be enormously valuable”572 to some users.573 MNOs are not in favor of this idea as they view 2G services as less than optimal and as a technology that is not in their long term plans. However, there may be opportunities to develop this idea in another form.
Provisional Recommendations
Commitment to change retail pricing structure and approach
489. The Commission recommends that mobile operators voluntarily commit to reduce headline tariff levels to the average effective level of charges inclusive of occasional free data and promotions amongst subscribers to the different data bundles.
489.1. This will ensure that the lower average rates are available to all subscribers, all of the time, such that reductions to more price sensitive subscribers are transmitted to less price sensitive subscribers. The greater transparency of pricing will also promote better price-based competition amongst operators.
489.2. This does not prevent promotional or free data offers in future. However, the Commission also recommends that pricing be more transparent, with consumers informed of the effective price they paid for data each month
572 https://manypossibilities.net/2015/11/zero-rating-a-modest-proposal/573 Song argues that a proposition like this is more strategic as it would ensure that everyone has at least some connectivity as opposed to some percentage of the population getting fast internet. Song estimates that offering “free 2G data to all would consume less than 1% of the design capacity of the international submarine cables landing in South Africa.” (https://manypossibilities.net/2015/11/zero- rating-a-modest-proposal/).
given bundle expiry, OOB use and free data.
490. The Commission recommends that MNOs also voluntarily commit to changing the structure of retail pricing by reducing the price of sub-1GB prepaid data bundles such that price differences between smaller volume and larger volume bundles, as well as between prepaid and post-paid, are reduced to levels that are objectively justified and socially defensible.
490.1. As a provisional recommendation, the Inquiry is of the view that bundles smaller than 1GB are reduced in price to be within 25% of the average effective 1GB bundle price (inclusive of free and promotional data offers) on a per MB basis. This factors in that cost differences are likely to be negligible whilst still providing some differentiation to incentivise greater use.
490.2. In addition, the Commission recommends that OOB data rates are also reduced to objectively justifiable and socially defensible levels. A provisional recommendation is that the same maximum difference of 25% relative to in-bundle rates may be appropriate for similar reasons.
Absent commitments, regulators to coordinate on intervention
490.3. In the absence of such voluntary commitments, the Commission recommends that the Commission work closely with ICASA (and the DTPS) to collectively act upon market interventions that would achieve this outcome. The regulators already have a Memorandum of Understanding and the Commission is of the view that they should coordinate their efforts in order to find the most effective means of addressing retail price levels and structure. The range of possible interventions may include the following:
490.3.1. The DTPS makes use of the current process to amend the ECA to put in place legislative constraints on the extent of

149
price differentiation (per MB) between different data bundle sizes and requirements to increase price transparency;
490.3.2. ICASA makes use of its End-User and Subscriber Service Charter Regulations to put in place regulations that seek to place similar restrictions on pricing practices of the MNOs, and/or make the assignment of high demand spectrum conditional upon doing so;
490.3.3. The Commission use its enforcement powers to investigate dominant MNOs for excessive pricing to low-income consumers.
Formalise and regulate the zero-rating of PBOs
490.4. The Commission recommends that the zero-rating of PBO content, including that of educational institutions, be formalised and subject to regulation, which may include self-regulation. This is in order to ensure a consistent and broad application, both in terms of levels and criteria for zero-rating, across the industry.
490.4.1. The recommendation is made in the context where the Commission finds that at the moment zero-rating is a) voluntary, b) subject to different levels and criteria across MNOs which are not always transparent or the subject of objective standards, and c) where differences in treatment may impact on PBOs themselves.
8.2. Addressing cost drivers: spectrum and facilities leasing
491. Whilst there is consensus that unassigned HDS needs to be assigned, there have been continued delays in doing so. This process lies within the domain of the DTPS and ICASA, and the primary recommendation from the Commission is that this process is given immediate priority and brought to conclusion
574 A4AI submission dated 01 November 2017, p. 3575 A4AI submission dated 01 November 2017, p. 3576 A4AI submission dated 01 November 2017 , p. 3577 MTN submission dated 27 November 2017 (Non-Confidential version), p. 51
soon in line with the President’s call last year to aid economic growth and recovery.
492. Similarly, there is a need for more urgency around the wholesale facilities leasing regulations that would reduce costs and speed up the deployment of infrastructure. The Commission recommends this is accelerated under the current ECA so that it is not subject to further delays from the redrafting and submission of the Amendment Bill on the ECA.
Submissions
493. We do not repeat the many submissions on the need to release spectrum in this section. However, it is apposite to be reminded that delays in spectrum assignment have real economic costs and it is for this reason urgency is required.
493.1. First, spectrum has an impact on access to data and data prices. A4AI submits that spectrum is an important resource sustaining the operations of the mobile industry and submits that there is extensive literature regarding the relationship between spectrum allocation and broadband access.574 A4AI also submits that the research by GSMA and NERA shows that consumers pay lower prices for data in countries where the costs of acquiring spectrum is lower.575 A4AI further submits that the high cost of spectrum auctions can increase MNOs operational costs.576
493.2. Second, spectrum also contributes to the GDP of the country. In this regard, MTN states that “the ongoing delay in the allocation of additional spectrum, both the high demand spectrum and digital divide spectrum has significant implications for data pricing, availability of data, National Treasury and broader economic development”577. MTN refers to research by Plum Consulting on behalf of GSMA in 2011 that estimated that releasing additional spectrum early in South Africa would increase GDP by R78 billion, increase subscribers by 7.6 million, create an additional 1 million jobs and increase tax revenue by R16 billion per annum by 2020. The same study also estimated that a 5-year delay

150
in releasing this spectrum from 2014 to 2019 could result in the reduction of R355 billion in GDP and R70 billion in tax revenue.578 The impact of spectrum on GDP is also highlighted by the Report for the GSM Association (2013) which states that “spectrum has a prominent contribution to economic growth, albeit with difference varying from one industry to another”.579
Recommendations
Finalise the policy direction on the assignment of HDS and the assignment process at ICASA
493.3. The Commission recommends that DTPS finalise the policy direction in respect of the assignment of spectrum as a matter of extreme urgency. Until this is done, ICASA cannot proceed with developing a spectrum assignment approach in line with the policy direction. This process is not contingent upon the new ECA Amendment Bill and therefore can proceed immediately. In addition, efforts to conclude the digital migration process also need priority if the spectrum is ultimately to be made available upon assignment.
493.4. In terms of the policy direction around the WOAN, the Commission recommends that the DTPS ensures that there is a workable commercial model in place for the WOAN such that it has reasonable prospects of rollout and success. In particular, the DTPS should consider what the financial and commercial requirements are for success, not just the technical requirements.
HDS assignment process to support competition and affordable access
493.5. The Commission recommends that once the policy direction is finalised, ICASA prioritise the immediate development of an assignment approach in line with that policy and commence the assignment process within the current financial year.
493.6. The Commission further recommends that the assignment approach adopted by ICASA is pro-competitive insofar as it supports the assignment of
578 Plum Consulting on behalf of GMSA (2011) The benefits of releasing spectrum for mobile broadband in Sub-Sharan Africa.579 Report for the GSM Association (2013) The Socio-economic Impact of Allocating Spectrum for Mobile Broadband Services in China.
HDS in a manner that will enable challenger networks and the WOAN itself to be competitive and not just the maximisation of revenues. This requires consideration as to the relative share and bands in which spectrum is assigned to different networks. Such pro-competitive measures may include spectrum caps on larger operators, asymmetric assignment and the set asides for new entrants such as the WOAN.
493.7. The Commission further recommends that any assignment of spectrum is contingent upon commitments to pass through the anticipated cost decreases to lower final prices for data. As MNOs have argued that the cause of high prices are high costs from a lack of spectrum, they should be prepared to make such commitments. Commitments on price decreases could also be a consideration in the qualification or adjudication rounds.
493.8. In addition, ICASA should use the assignment of spectrum to impose other obligations on MNOs which support the development of more affordable mobile access and/or alternative infrastructure. These would need to extend beyond simple mobile coverage and speed requirements which address supply and not the affordability gap. Whilst these may reduce revenue generated from the sale, it would achieve a far more important objective, namely that of enhancing actual access and usage. In particular, ICASA should consider a range of options such as:
493.8.1. Commitments to drop headline prices to effective price levels and adjust the pricing of smaller data bundles relative to larger data bundles if such voluntary commitments have not already been made;
493.8.2. Commitments to provide free Wi-Fi at a specified number of key commuter routes or public spaces in lower income areas and of a particular minimum standard;

151
493.8.3. Commitments to extend fibre backbone networks into lower income and rural communities on an open access and cost-orientated basis to support other data services.
Wholesale facilities access regulations
493.9. The Commission further recommends that the shift to regulating cost-orientated and mandated access for passive infrastructure facilities is given priority and fast-tracked by the DTPS and ICASA. The Commission recommends divorcing passive infrastructure regulation from the broader initiative around wholesale open access under the Amendment Bill as this is likely to take considerable time. It not only requires passing new legislation, but then also envisages an 18 month process for ICASA to develop regulations. Specifically, the Commission makes the following recommendations:
493.9.1. ICASA make use of the powers already available to it in terms of Chapter 8 of the existing ECA to regulate cost-orientated pricing of facilities and mandate access based on technical criteria only, strongly enforced through the Compliance and Complaints Committee within ICASA. To the extent this requires updating the Facilities Leasing Regulation of 2010, then this is given priority within the current financial year.
493.9.2. Furthermore, ICASA should use those powers to extend such facilities access to ducts and poles for backhaul and last mile fibre rollout. These are backbone facilities for mobile services, but are also access infrastructure for alternative data services that needs greater development.
493.9.3. The DTPS and ICASA then separately engage around the amendments to the ECA and subsequent regulations which may be more far-reaching than the current powers. In so doing, the Commission recommends
that the DTPS and ICASA limit active infrastructure sharing to areas with maximum benefit (large cost reductions from moving from passive to active infrastructure sharing) and minimal risk (of reduced infrastructure competition and anti-competitive information exchange).
Commission to continue engagement throughout the HDS assignment and facilities access processes
493.10. The Commission recommends that the Commission must be engaged on the HDS policy and assignment process, as well as the development of facilities leasing legislation and regulations, at DTPS and ICASA outside of the Inquiry process. The precise policy and assignment processes for these two initiatives are yet to be determined and therefore this Inquiry is unable to comment on any specific design elements that emerge as they are developed even if it has outlined above the broad principles to be applied. However, such engagement on detailed design is important if they are to achieve pro-competitive outcomes and lower costs. The Commission is best placed to do so.
8.3. Enhancing competition: Wholesale mobile roaming and MVNOs
494. The Commission is of the view that there is an imbalance in bargaining power around the negotiation of national roaming agreements, resulting in terms that serve to disadvantage challenger networks relative to the first mover networks that have achieved national coverage. Historically at least, these roaming agreements restricted the quality of service by excluding seamless handover, limited access to the latest technology on the network for many years, and were claimed to have pricing levels that were sometimes even above effective retail pricing levels.
494.1. This served to limit price-based competition in the industry by degrading the quality of the network experience to subscribers of the challenger networks which makes it more difficult for challenger networks to attract and retain subscribers on the basis of price

152
decreases. This makes price decreases less successful and therefore also less profitable.
494.2. In addition, as the costs are variable beyond a minimum fee, more aggressive pricing results in generating a larger operational cost for the challenger networks. This is because the increased volumes that result from subscribers increasing usage or switching from other networks will generate more roaming charges. This is in contrast to the largely fixed cost structure faced by the roaming provider. Ultimately this makes price decreases less profitable too, especially if the effective retail rate is below the cost of roaming.
494.3. Whilst new agreements have been negotiated which reduce costs and enhance both service (in terms of seamless handover) and access (to 4G network capacity), the Commission is of the view that roaming arrangements with the smaller networks most likely still reflect the imbalance in bargaining dynamics.
495. The lack of active competition for MVNOs and persistent complaints from ISPs on the price of wholesale data are also indicative that this wholesale market is not functioning optimally and there is scope for improvement. This is reinforced by the fact that policy-makers have felt the need to establish a WOAN in order to support more retail-based competition. Any improvement in this area feeds through to enhanced competition by retail service providers as an additional source of pricing pressure.
Improvements in wholesale roaming and access terms towards cost-oriented levels
496. The Commission recommends that roaming agreements need to move towards more cost-orientated pricing levels along with immediate access to newer technologies as they become available (such as 5G in future) until such time as the smaller networks catch up on an infrastructure basis.
496.1. This is because not only will the smaller networks be dependent on national roaming for some time, but cost-competitive access to a larger network helps the smaller networks overcome the
infrastructure investment disadvantage that perpetuates concentration and more limited price-based competition in the market. In particular, it enables more aggressive pricing financially but also technically, as their own networks may not be degraded if subscribers off-load onto roaming networks at cost-orientated rates. It also reduces the network quality difference, enabling price reductions to be more effective at drawing away subscribers from other networks.
497. The Commission also recommends that the failure of operators to compete for MVNO arrangements also needs to be addressed, along with the level of wholesale pricing to resellers more generally. Whilst the WOAN has been proposed as one means to address this market failure, voluntary commitments to improve the terms of access amongst existing operators in the short-term is still most likely required as a more immediate solution whilst the WOAN gets established. This would prove even more important in the event that the WOAN is not pursued as a policy solution to enhanced retail service provider competition.
Regulatory action failing voluntary adjustments
498. The Commission recommends more regulatory scrutiny and potentially action at the wholesale level of the industry in the event there are no voluntary commitments to improve the terms of wholesale access.
499. The Commission also recommends that if the regulatory route is deemed to be necessary, that there are further potential enhancements to the regulatory regime which might make it more effective going forward.
499.1. First, some form of functional and/or accounting separation may be required of the larger networks if there is to be greater transparency as to the costs of the radio access network (RAN) and core network relative to the retail services. Such separation may also provide more appropriate incentives to the network layer to engage in fairer access pricing to third parties relative to the operator’s own retail division. These are certainly some of the lessons from the Telkom settlement agreement with the Commission which is widely perceived to have had a transformative impact on

153
wholesale infrastructure access in fixed line.
500. Second, the history of failure to engage in necessary wholesale regulation, not just of mobile but also fixed line markets, which has resulted in entrenched concentration strongly suggests that reform to the legislative and/or regulatory framework is most likely required if the institutions are to deliver on this type of regulatory action going forward.
500.1. It would seem that not only are the preconditions for regulatory action under section 67 of the Electronic Communications Act (ECA) unnecessarily onerous, but they may also serve to limit the degree of collaboration between regulators. For instance, there would seem to be no basis currently on which ICASA could regulate based on findings by the competition authorities, either in market inquiries or as a result of enforcement action.
500.2. More effective means of inter-regulator collaboration would strengthen regulatory oversight, enforcement and regulation in these markets. The current process to amend the ECA presents an opportunity to bring about such changes.
8.4. Development of alternative infrastructure for data services
501. The Commission believes that the development of alternative infrastructure to mobile in poorer areas is an essential component of any long-term solution to high data prices in South Africa. Not only will it provide off-load opportunities for free or at lower prices, but it will also provide an additional point of competitive pressure on mobile prices if there is a more pervasive presence. This is deemed necessary as the mobile market may remain concentrated for some time. As the provision of free public Wi-Fi by government can only be part of that solution given the likely cost implications, the development of alternative business models is also necessarily a requirement for ensuring such infrastructure is effectively utilised.
580 MMA’s presentation at the public hearings held on 17-19 October 2018. See Day 1 transcripts, p. 86, line 23-24581 A4AI’s presentation at the public hearings held on 17-19 October 2018. See Day 3 transcripts, p. 61, line 21-25582 A4AI’s presentation at the public hearings held on 17-19 October 2018. See Day 3 transcripts, p. 63, line 11-12583 A4AI’s presentation at the public hearings held on 17-19 October 2018. See Day 3 transcripts, p. 71, line 14-17
502. The Commission therefore makes provisional recommendations as to how the development of alternative infrastructure may be facilitated. However, given that paucity of submissions on this particular theme, the Inquiry would also welcome more submissions on both the bottlenecks and solutions to unlocking alternative data service infrastructure such that these recommendations can be enhanced.
Relevant submissions
503. Whilst most of the submissions focused on how to reduce mobile data prices directly, there were some submissions which focused on how one might reduce data prices through the development of alternative infrastructure services that would be available to lower income consumers in particular.
503.1. Some stakeholders suggested that, just like water and electricity, data services are a basic need and there should be free basic data for all citizens. The submissions advocate for the provision of free public access to internet at government sites such as schools, libraries, and health facilities as minimum standards (500MB per person per day) for the provision of free internet access. For instance, MMA argued “that free Wi-Fi access should be regarded as a basic municipal service and this should then be run as a public utility.”580
503.2. A4AI and MMA suggested that the high cost of data for low-income consumers can also be addressed by considering innovative ideas such as community networks. A4AI specifically stated that “focusing on public access solutions including community networks and the allocation of spectrum for such networks is one way that we can begin to close the gaps for the unconnected right now in South Africa.”581 A4AI indicated that it is aware of one such network in the village of Mankosi in the Eastern Cape.582 A community network, as explained by A4AI, is “a co-op model where the community comes together to apply for the licence to operate a network and every household […] is […] considered a shareholder or a member.”583 Members
154
of the co-op are trained to be able to run the project and provide connectivity (such as a telephone line or access to Wi-Fi). A4AI estimates that it costs roughly R100 000 (one hundred thousand Rand) to establish a community network connecting approximately 3000 (three thousand homes) if there is a nearest town through which it can gain access.584 MMA indicated that it has a similar initiative called Shikamoto which it has set up for a childhood development centre in the East Rand.585 MMA also indicated that a network of this nature is not very expensive to establish but the benefits are enormous.
Provisional Recommendations
Development of backbone infrastructure to support alternative data services in low income areas
504. The Commission recommends that the DTPS and ICASA fast-track the intended rapid infrastructure deployment strategy embodied in the White Paper and Amendment Bill for the ECA. Such legislative and regulatory changes facilitate acquiring wayleaves and the use of municipal infrastructure (such as poles) which will reduce the costs of and accelerate such infrastructure rollout. The intention is to provide a conducive environment to address the lack of infrastructure in lower income areas and secondary cities and towns.
505. The Commission also recommends that government make use of its own demand for services as a means to provide the base customer demand to support the investment case for such infrastructure, especially in smaller cities and towns. Government should also consider the use of incentives, financial or other, to lower the effective costs for such infrastructure build, making the investment case more likely. The DTPS is best placed to drive this initiative.
506. As discussed under the assignment of spectrum, the Commission also recommends that ICASA give consideration to using the licensing of high demand spectrum to impose obligations on MNOs to fund and facilitate the extension of fibre backhaul and last mile infrastructure to commuter and public spaces in low income areas where these do not exist. This is likely to complement the extension of fibre to the base
584 A4AI’s presentation at the public hearings held on 17-19 October 2018. See Day 3 transcripts, p. 71, line 14-24585 MMA’s presentation at the public hearings held on 17-19 October 2018. See Day 1 transcripts, p. 90, line 6-7
stations of these operators in support of higher broadband speeds in any event, or be natural extensions of the existing backhaul and FTTH rollout.
Development of free and/or pay-wall public Wi-Fi in low income areas (commuter routes and public spaces).
507. The Commission recommends that local and national government deliberately support the development of free public Wi-Fi in low income areas specifically.
507.1. For maximum impact, the Commission recommends that these need to be in areas where there is a greater flow of people, including commuter points (e.g. train stations, taxi ranks) and public spaces (e.g parks, shopping areas, government service offices).
507.2. The Commission also recommends that a single national department, namely the DTPS (or DOC in future), take ownership of and champion such an initiative. This is necessary if there is to be coordination across layers of government and the initiative driven forward.
508. Given this is a costly exercise, the Commission recommends that government explore suitable means to extend the reach of such a programme and draw in private and/or donor funds. Once more, the DTPS (or DOC in the future) should take ownership and champion such an initiative. In particular:
508.1. The Commission recommends government should seek to crowd in private provision of public Wi-Fi transmission equipment and services by making available government and public spaces at no cost to private firms wishing to provide equipment and/or services.
508.2. The Commission recommends government should also seek to innovate with the telecommunications and tech community around potential business models that may incentivise private provision of free or even paid-for services with a far more extensive footprint. Such models are already being explored locally and globally, and may include:

155
508.2.1. A basic free service alongside premium pay-wall models, where a provider is willing to provide a basic, bit-rate constrained service for free but with the option of exclusively offering a premium paid-for service.
508.2.2. Advertising-based models where the private funder of the free Wi-Fi service earns a return through selling targeted advertising to consumers making use of the service, or use of the data generated in other ways.
508.2.3. Pay-wall models where users may subscribe to Wi-Fi services across multiple sites and geographic areas from a single subscription. These will often offer more cost-effective data rates despite being paid-for.
509. The Commission also recommends that the DTPS consider the contractual and regulatory provisions necessary to support such innovations. This may include ensuring open access where pay-wall services are provided in order to facilitate broad geographic footprints, but also potentially exclusive access where there is an agreement to provide free services in return for other revenue opportunities. In addition, the Commission recommends that the DTPS use this process to also facilitate the participation of SMEs and firms owned by historically disadvantaged persons where appropriate in the supply chain.
509.1. The Commission recommends that in areas where private models are not viable, government seek to itself fund a basic service for free or draw in donor funding. These are likely to be in the poorest areas and in this manner government can support a more inclusive data market.
510. At this stage the Commission has insufficient information in order to determine if there is a valid concern with the Openserve IP Connect pricing levels or not, and will therefore engage in more detail with Openserve on its pricing in the next phase in order to reach a final conclusion on that issue. The Inquiry will also
seek to get a better understanding of why this service cannot be unbundled to promote competition for backhaul services. If the pricing is found not to be cost-orientated, or if there is needless bundling which hinders lower final prices for ADSL in lower income communities in particular, then the Commission will explore recommendations as to how to address it.

156
9.1. Value Chain
511. Telecommunications services are used by end-users (individual customers and business customers) for the remote transmission of voice, texts, data, sound and images, etc. over either fixed line telephony or mobile telephony as we explain in detail below.586 Telecommunications services consumed by end-users can be classified under three broad categories, namely voice, SMS and data services.
512. Voice services allow voice to be transmitted from a device of one user to the device of another user through mobile telephony, fixed line telephony or voice over internet protocols (VoIP). Voice services enable end-users to talk to each other remotely and timelessly. Users of mobile telephony can also send short text messages (SMSs) to other users, with a maximum of 160 characters. The messages are buffered by the network operator until the recipient’s phone is switched on. 587
513. Data services enable connection to the internet. End-users require data services to access information from millions of content providers and websites globally such as Google, YouTube, Facebook, Instagram, Netflix; software vendors such as Microsoft, Apple, and Google; and local and international content providers such as online news platforms (e.g. Media 24 and BBC); banks, etc.588 The use of these platforms by consumers essentially drives data demand.
514. Users access content from these platforms using suitable devices such as smartphones, routers, and dongles (which enable a personal computer, such as a laptop, to access data services).589 Content from these platforms
586 Institut national de la statistique (13 October 2016) Definitions: Communication Services. [Online]. Available at: https://www.insee.fr/en/metadonnees/definition/c1933. [last viewed on 10 April 2019]587 Thornton et al. (2006) Telecommunications Law in South Africa. STE Publishers: Johannesburg, p. 78588 ECN submission dated 1 November 2017 (Non-confidential version), p. 11, para. 1589 Telkom’s submission dated 17 November 2017 (Non-confidential version), p. 16, para. 54590 Telkom’s submission dated 17 November 2017 (Non-confidential version, p. 18, para. 7591 MTN’s submission dated 27 November 2017 (Non-confidential version), p. 6, para. 2.1592 MTN’s submission dated 27 November 2017 (Non-confidential version), p. 6, para. 2.2
is provided over the internet. The Internet is a global system of inter-linked computer networks.590 Users need their devices to connect with this largely fixed network that provides connection to content platforms to allow them access to content. Data services provide this connection between users and the network.591
515. The network largely consists of fixed infrastructure built by individual network operators such as Vodacom, MTN, Cell C, Telkom as well as players such as DFA, Liquid Telecom, Broadband Infraco, and Fibreco. Networks can also be built by consortia of network operators.
516. Network operators in South Africa are connected to network operators in the rest of the world through undersea cable systems in most cases. This allows users in South Africa to access content provided by content providers from the rest of the world.592 The network is basically the main upstream input to the provision of data services and is made available to internet service providers (ISPs) on a wholesale basis. ISPs provide retail data services to end-users in turn.
517. Figure 52 below depicts the structure of the South African telecommunications industry in the form of a value chain.
518. As shown in the figure and consistent with ICASA’s discussion document, there are three broad layers in the telecommunications value chain. The upstream layer comprises the network infrastructure owned by network operators. The middle layer comprises service providers who require access from the operators’ infrastructure as they usually
9. APPENDIX A: VALUE CHAIN AND IDENTIFICATION OF MARKETS

157
lease infrastructure in bulk from operators. The downstream layer deals with the retail of communication services.593 Each of these levels of the supply chain is characterised by a multitude of ancillary services that may or may not be relevant for the purposes of this inquiry.
9.1.1. Upstream infrastructure layer
519. The upstream layer includes network infrastructure, such as mobile sites, ducts, poles and dark fibre. This layer also includes both active and passive elements of the RAN. It also includes radio frequency spectrum, an essential input into any wireless communications network.594 This section gives a brief explanation of what a network infrastructure is and how it is used to provide internet services.
593 ICASA’s discussion document also identified these three layers in the telecommunications value chain.594 Telkom’s submission dated 17 November 2017 (Non-confidential version), p. 3, Figure 5595 Located at Mtunzini in KwaZulu-Natal, or Melkbosstrand and Yzerfontein close to Cape Town
520. The Internet is a global system of inter-linked computer networks. The link starts from the international fibre infrastructure network layer, wherein submarine cables connect to different countries and continents. Thereafter, the national fibre infrastructure network carry the internet traffic from the submarine landing stations595 to people across South Africa. When a national fibre link lands in a city or large town, the traffic is then carried to a point which is close to the customer. This is achieved through metropolitan area networks which typically use fibre or microwave links. In order for end customers to connect to the internet or other telecommunication services, access layer, or “last mile” layer is needed.
Figure 52: Telecommunications sector value chain
Source: Own construction based on submissions from Telkom, MTN, Vodacom, and ECN

158
521. In order for a user of one network to access content from / or communicate with a user of another network, these networks have to be interconnected. If for example, a user located in Pretoria wishes to access content from a webpage hosted in the United States of America (USA), the user would need to invoke international connection, domestic (national transit) connection, and local (“last mile”) connection.596 We explain each of these connections briefly in turn.
International connectivity (undersea cables)
522. South Africa is connected to the rest of the world through five undersea cables597 as well as in certain cases satellite.598 These are SAT-3599, Wasc600, Seacom601, SAFE602 and EASSy603. Undersea cable operators allow fixed and mobile operators to provide high speed, cheaper and more reliable international connectivity to subscribers.604
523. Each of the cable systems that land in South Africa are owned by a consortium of companies, ranging from a relatively small number of stakeholders (Seacom, 5 shareholders), to the 29 shareholders in the EASSy cable.605 Except Seacom, all the submarine cables that land in South Africa are owned by consortiums that consist largely of telecommunications companies.606 MTN, Vodacom, Telkom, and Liquid Telecom all have stakes in submarine cable systems. Seacom is owned by an independent five-member consortium that does not include any network operator.607 Below is a list of the undersea cables that currently land in South Africa and their owners.
596 MTN’s submission dated 27 November 2017 (Non-confidential version), p. 6-8597 MTN’s submission dated 27 November 2017 (Non-confidential version), p. 6, para. 2.2.1598 Vodacom also indicated that terrestrial cable systems used for cross-border transmission should form part of international transmission infrastructure. See Vodacom’s submission to ICASA’s Priority Markets study. Annexure D, p. 3599 SAT-3’ stands for South Atlantic 3. This submarine cable links England, Portugal and Spain to South Africa.600 ‘Wasc’ (West African Submarine Cable) forms part of a submarine cable system comprising itself and SAT-3. The SAT-3/Wasc system that links England, Portugal and Spain to South Africa has termination points in some West African coasts.601 The SEACOM cable serves the east and west coasts of Africa and it extends into Europe and the Asia-Pacific via Mumbai, India. In South Africa, it terminates in Mtunzini, KwaZulu-Natal (KZN).602 ‘SAFE’ stands for South Africa Far East. It links Melkobosstrand (South Africa) to Penang (Malaysia).603 ‘EASSy’ stands for Eastern Africa Submarine Cable System. This submarine cable connects South Africa to countries in East Africa. It runs from Mtunzini, in KZN, to Port Sudan, in Sudan.604 ECN’s submission dated 1 November 2017 (Non-confidential version), p. 14-15, para. 3605 Mybroadband.co.za. Available on: https://mybroadband.co.za/news/broadband/106353-here-is-who-controls-the-internet-in-south- africa.html. [Accessed on 06 July 2018]606 MTN’s submission dated 27 November 2017 (Non-confidential version), page 6, paragraph 2.2.1607 Mybroadband.co.za. [Online]. Available on: https://mybroadband.co.za/news/broadband/106353-here-is-who-controls-the-internet-in- south-africa.html. [Accessed on 06 July 2018]608 Many Possibilities (July 2017) African Undersea Cables. [Online]. Available at: https://manypossibilities.net/african-undersea-cables/. [Last viewed on 10 April 2019]609 Many Possibilities (July 2017) African Undersea Cables. [Online]. https://manypossibilities.net/african-undersea-cables/. [Last viewed on 10 April 2019]
523.1. The Seacom cable serves the east and west coasts of Africa and it extends into Europe and the Asia-Pacific via Mumbai, India. In South Africa, it terminates in Mtunzini, KwaZulu-Natal (KZN). Seacom is owned by five shareholders, namely Industrial Promotion services (25%), VenFin Limited of Kenya (25%), Herakles Telecom LLC based in New York (25%), Convergence Partners (12.5%) and Shanduka Group (12.5%). 608
523.2. EASSy’ stands for Eastern Africa Submarine Cable System. This submarine cable connects South Africa to countries in East Africa. This cable runs from Mtunzini, in KZN, to Port Sudan, in Sudan. It is 90% African owned although that ownership is underwritten by a substantial investment by Development Financial Institutions including the World Bank. South African investors in EASSY include Telkom, Vodacom, MTN, and Neotel in addition to number of other operators from Botswana, Somalia, Djibouti, Nigeria, Lesotho, Burudi, Kenya, Mozambique, Uganda, Tanzania, Mauritius, Sudan, and Zimbabwe. India, Britain, United Arab Emirates, France, Saudi Arabia, Comoros, Madagascar, and Zanzibar.609
523.3. The South Atlantic 2 (SAT-3)/ West African Cable System (WACS) system that links England, Portugal and Spain to South Africa has termination points in some West African coasts is owned Telkom, Vodacom, MTN, Neotel, Broadband Infraco, Cable & Wireless, Portugal Telecoms, Congo Telecoms
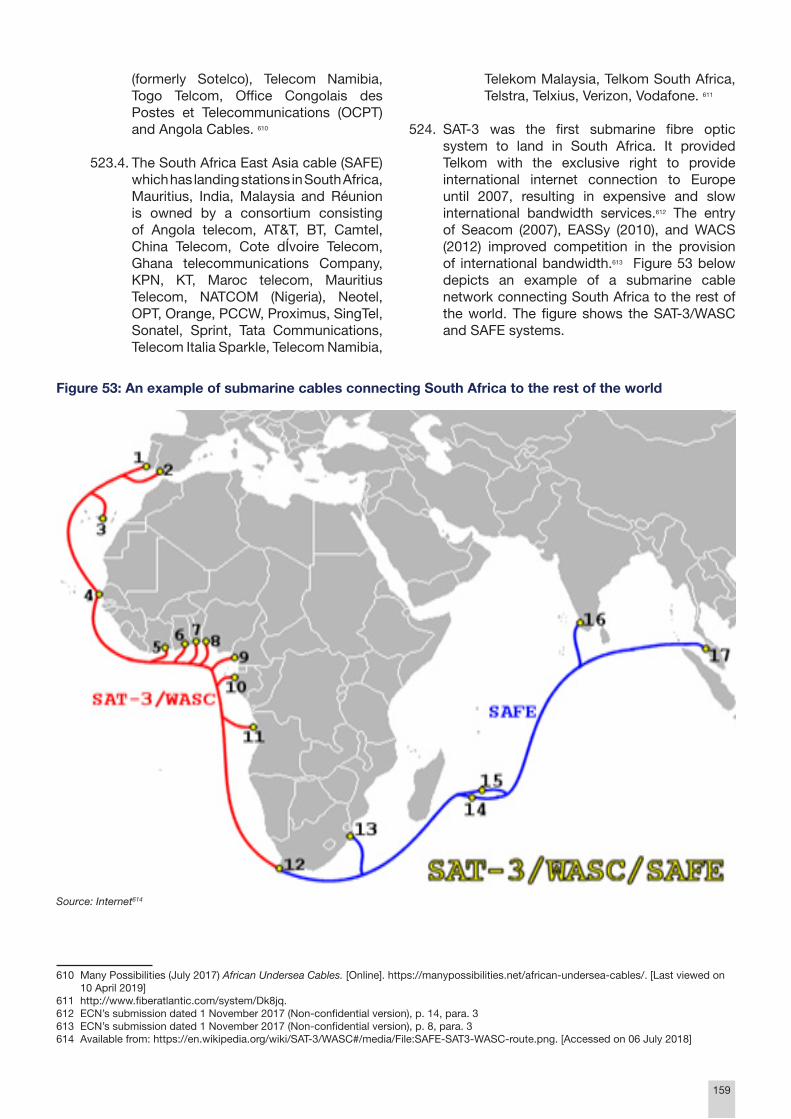
159
(formerly Sotelco), Telecom Namibia, Togo Telcom, Office Congolais des Postes et Telecommunications (OCPT) and Angola Cables. 610
523.4. The South Africa East Asia cable (SAFE) which has landing stations in South Africa, Mauritius, India, Malaysia and Réunion is owned by a consortium consisting of Angola telecom, AT&T, BT, Camtel, China Telecom, Cote dÍvoire Telecom, Ghana telecommunications Company, KPN, KT, Maroc telecom, Mauritius Telecom, NATCOM (Nigeria), Neotel, OPT, Orange, PCCW, Proximus, SingTel, Sonatel, Sprint, Tata Communications, Telecom Italia Sparkle, Telecom Namibia,
610 Many Possibilities (July 2017) African Undersea Cables. [Online]. https://manypossibilities.net/african-undersea-cables/. [Last viewed on 10 April 2019]611 http://www.fiberatlantic.com/system/Dk8jq.612 ECN’s submission dated 1 November 2017 (Non-confidential version), p. 14, para. 3613 ECN’s submission dated 1 November 2017 (Non-confidential version), p. 8, para. 3614 Available from: https://en.wikipedia.org/wiki/SAT-3/WASC#/media/File:SAFE-SAT3-WASC-route.png. [Accessed on 06 July 2018]
Telekom Malaysia, Telkom South Africa, Telstra, Telxius, Verizon, Vodafone. 611
524. SAT-3 was the first submarine fibre optic system to land in South Africa. It provided Telkom with the exclusive right to provide international internet connection to Europe until 2007, resulting in expensive and slow international bandwidth services.612 The entry of Seacom (2007), EASSy (2010), and WACS (2012) improved competition in the provision of international bandwidth.613 Figure 53 below depicts an example of a submarine cable network connecting South Africa to the rest of the world. The figure shows the SAT-3/WASC and SAFE systems.
Figure 53: An example of submarine cables connecting South Africa to the rest of the world
Source: Internet614

160
525. The landing stations (termination points) of submarine cables are based in coastal areas. The landing stations serve as the connection points between the international networks and domestic networks. [].615 This view echoes ECN’s submission that since the entry of Seacom, EASSy and WACS, the cost of international data services has plummeted.616 Stakeholders who made submissions to the inquiry did not raise any concerns regarding international connectivity.
526. Domestic networks consist of national backhaul networks and local (“last mile”) networks and we explain each of these in turn.
527. In addition to the already existing cables, ICASA’s Discussion Document states that there are a number of additional submarine cables projects with South African connections in the process of being planned and completed in the near future. These include:
615 Telkom’s submission to the commission dated 13 July 2018616 ECN’s submission dated 1 November 2017 (Non-confidential version), p. 8, para. 3617 MTN’s submission dated 27 November 2017 (Non-confidential version), p. 7, para. 2.2.2618 Mybroadband.co.za. Fibre in SA: An eye-opener. [Online]. Available at: https://mybroadband.co.za/news/broadband/42651-fibre-in-sa-an- eye-opener.html. [Last viewed on 30 November 2018]
527.1. the ACE cable, which will eventually connect Europe to Africa;
527.2. the South Athlantic Express Cable (SAex), which will connect South Africa to South and North America; and
527.3. the BRICS cable, which will connect South Africa to Russia and Brazil.
National fibre networks
528. These are also referred to as long haul and they are national networks that connect major population centres (transmission links between cities and towns) and also connect to the termination points of submarine cables.617 Figure 54 below depicts Neotel’s backhaul network as a high level example of a national backhaul network in South Africa. 618
Figure 54: Example of a national backhaul network
Source: mybroadband.co.za. 618

161
529. Telkom and Liquid Telecom (formerly Neotel) appear to be the two main players active in the space of national backhaul in South Africa.619 MNOs and other infrastructure providers have built alternative national backhaul networks.620 MTN, Vodacom, and Liquid Telecom have partnered in developing the so called National Long Distance (NLD) network which saw 700km of fibre being lit up in February 2013 with the companies aiming to roll out a 5,000km network across the country.621 FibreCo has recently been purchased by Seacom622, having previously been owned by a joint venture
619 Mybroadband.co.za. [Online]. Available on: https://mybroadband.co.za/news/broadband/106353-here-is-who-controls-the-internet-in- south-africa.html. [Accessed on 06 November 2018]620 MTN’s submission dated 27 November 2017 (Non-confidential version), p. 7, para. 2.2.2621 Mybroadband.co.za. [Online]. Available at: https://mybroadband.co.za/news/broadband/106353-here-is-who-controls-the-internet-in- south-africa.html. [Accessed on 06 July 2018]622 Competition Commission, Weekly Media Statement, 19 February 2019623 Mybroadband.co.za. Available on: https://mybroadband.co.za/news/broadband/106353-here-is-who-controls-the-internet-in-south- africa.html. [Accessed: 06/07/2018].624 ECN’s submission dated 1 November 2017 (Non-confidential version), p. 14, para. 2625 ECN’s submission dated 1 November 2017 (Non-confidential version), p. 14, para. 2626 ECN’s submission dated 1 November 2017 (Non-confidential version), p. 14, para. 2627 ICASA’s Priority Markets Discussion Document, p. 43, para. 87
that also includes Convergence Partners and Dimension Data, with Cell C also having had a stake. FibreCo has a 2,000km long network connecting Johannesburg, Bloemfontein, East London, and Cape Town.623
530. ICASA, in its discussion document produced as part of the Priority Markets Inquiry, showed than Telkom remains the largest player in national transmission services. The table below provides ICASA’s estimate of the national fibre services market shares in 2017.
531. An operator’s network is not part of the internet if is not exchanging traffic with other operators’ networks. The role of exchanging traffic between operators is played by Internet Exchanges. ISPA ran South Africa’s major internet exchanges namely, the Johannesburg Internet Exchange (JINX), the Cape Town Internet Exchange (CINX) and the Durban Internet Exchange (DINX)624 In addition to ISPA, there are two independent internet exchanges operated by Teraco and its peering partner NAPAfrica with points of presence in Isando (Johannesburg) and Newlands (Cape Town)625. Although internet exchanges play an integral role in the data services value chain, market
participants have not raised any issues about them while in ECN’s view, “this element of the market is operating efficiently and there has been significant expansion in … capacity in South Africa over the last decade.”626
Metropolitan fibre networks
532. This consists of fibre that provides connection between local sites within high-density urban and sub-urban areas and metropolitan points of presence, normally providing high speed broadband connections.627 These fibre networks are often leased out to others companies by networks providers such as DFA.
CompetitorNational fibre
Distance Share
Telkom 75,000 73%
Link Africa - 0%
Broadband Infraco 14,923 14%
Liquid Telecom (Formerly Neotel) 3,000 3%
Dark Fibre Africa 1,057 1%
MTN 3,000 3%
Vodacom 3,000 3%
FibreCo 2,539 2%
Total 103,019 100%
Table 26: Estimated national fibre infrastructure market shares
Source: Priority markets discussion Document, page 44, Table 2

162
Local (or “Last mile”) connectivity
533. The ultimate connection between users and the internet may be by fixed or wireless means. While this infrastructure may be “close” to the user geographically, it still represents part of the upstream layer of infrastructure.
Fixed connection
534. The provision of communication services such as voice, internet, and other communication services over fixed line requires the presence of a fixed line network infrastructure. This fixed line infrastructure can comprise a variety or combination of technologies including, inter alia, fibre, copper or wireless technologies. The end-user can make use of these services through multiple devices such as telephones, smartphones, computers, laptops, tablets, etc. which enable connection to a local or home network. This local network is then connected from the end-user to a local exchange628. The connection between the end-user’s local network and the local exchange is known as the access layer, or “last mile” of the infrastructure.
535. Telkom is said to be the biggest fixed line operator followed by Liquid Telecom which provides services over fixed and wireless local loop (WLL), LTE and fibre to both enterprise and residential customers.629 MNOs and Telkom (through Openserve, its wholesale business) together with an increasing number of smaller internet service providers (ISPs) such as MWEB, Vumatel, Vox, Frogfoot, Link Africa, TTConnect, 123net, SA Digital Villages, GreenCom, MetroFribre Networx, Octotel, Comtel and many others, also provide fibre connections to customer premises.
Mobile connection
536. A mobile network consists of two main components namely the Core Network and the RAN. “The Core Network is the intelligent part of the network which manages call connections; manages connectivity through routing; provides mobility management, national and international roaming; manages
628 An exchange consists of networking devices that, inter alia, split different types of network traffic such as voice and data and take net work traffic from many different network users and aggregate it into a single high speed link or signal for transmission further upstream in the network629 MTN’s submission dated 27 November 2017 (Non-confidential version), p. 8, para. 2.2.3.2-2.2.3.3630 MTN’s submission dated 27 November 2017 (Non-confidential version), p. 10, para. 2.2.3.9631 MTN’s submission dated 27 November 2017 (Non-confidential version), p. 10, para. 2.2.3.9632 MTN’s submission dated 27 November 2017 (Non-confidential version), p. 10, para. 2.2.3.10633 There are three more operators that are licensed to use spectrum, namely Liquid Telecom (Formerly Neotel) and Rain (formerly WBS and/ or iBurst), and Cloudseed. Rain is a mobile data-only operator. Cloudseed’s spectrum is currently not in use as it has no subscribers.
the overall quality of communication; provides supporting functionality including the collation and processing of charging data generated by network nodes; also provides back office functionality such as hosting the subscriber database, billing, customer management, retail and wholesale services; and also provides operational functionality.”630 It consists of grid of high-capacity telecommunication facilities that convey telephone calls and data across an MNO’s own network, and to networks of other MNOs, national backhaul, international undersea cables, and the internet.631
537. The RAN enables connectivity between mobile devices and the Core Network. It consists of an antenna and a base station. Using specific frequencies of radio waves, the base station sends and receives radio signals through antennae to enable connectivity with mobile devices within its transmitting of receiving range (known as a ‘cell’).632 A RAN is constructed in sites which can consist of purpose-built masts or existing raised structures such as buildings or shopping malls. The site can be owned by the MNO or leased from land or building owners. Sites and site infrastructure can be used by or single mobile operator or can be shared with other operators with only up to three operators being the feasible number of operators who can share a tower. MNOs can build their own towers or can lease towers from companies that specialise on building and renting out towers such as the American Tower Company (ATC).
538. The connection between the end-user and the RAN and subsequently the core network occurs via radio frequency spectrum, commonly known as spectrum. Telkom, Vodacom, MTN, Cell C are the four major MNOs with licences to use spectrum in South Africa.633 The need to obtain a licence spectrum before operating a mobile network effectively means that the market is limited to the five licenced operators until a licence can be issued to a new entrant.
539. The infrastructure described above has the capability to carry communication services such as voice, SMS and broadband that

163
originate from each network operator that is part of the internet. These services are attached to the infrastructure. The network infrastructure serves as an input into the provision of these services. Internet service providers who do not own internet infrastructure seek access to the internet infrastructure and the communication services that flows in the infrastructure at wholesale prices.
540. Wholesale customers, such as ISPs typically require connection to physical infrastructure together with transit which enables them to provide communication services (i.e. voice, SMS, and data services) to end-users at retail prices.
9.1.2. Wholesale of network services
541. Wholesale of network services refers to network access granted to service providers who do not own any network infrastructure or have limited network infrastructure. Clients who seek network services enter into a business contract with a network operator to obtain connectivity that enables them to provide communication services downstream. The wholesale of mobile network services and fixed network services need to be treated separately as we discuss below.
Mobile wholesale network services
542. Mobile operators in South Africa are vertically integrated and do not separate their wholesale and retail services.634 This means that they are the owners of the mobile network and also provide services at the retail level to end consumers throughout the country. However other operators, such as Cell C and Telkom Mobile, have limited geographical coverage with their own networks. In order to provide services to end-users across a larger area, these operators roam on the networks of operators with a wider geographical coverage such as Vodacom and MTN.
543. The second way in which wholesale services can be sold at a wholesale level is through
634 ECN’s submission dated 1 November 2017 (Non-confidential version), p. 10, para 7a635 Telkom’s submission dated 17 November 2017 (Non-confidential version), p. 17, para. 64636 Telkom’s submission dated 17 November 2017 (Non-confidential version), p. 17, para. 64637 ECN’s submission dated 1 November 2017 (Non-confidential version), p. 10, para 7b638 Telkom’s submission dated 17 November 2017 (Non-confidential version), p. 17, para. 65639 Vodacom.co.za. Business: APN. [Online]. Available at: https://www.vodacombusiness.co.za/business/solutions/mobile-and-voice/apn. [Last viewed on 10 April 2019]640 Small Business.chron.com. What Is the Diffefrence Between APN Vs. VPN? [Online]. Available at: https://smallbusiness.chron.com/ difference-between-apn-vs-vpn-38815.html. [Last viewed on 10 April 2019]
granting access to MVNOs. An MVNO is a mobile communications services provider that does not own the mobile network infrastructure over which it provides services to its customers and vary from full MVNOs which operate their own core network and purchase a limited set of wholesale services to light MVNOs which do not have their sales and billing operations and therefore purchase a broad range of mobile services, including access to the core network.635 An MVNO enters into a business agreement with an MNO to obtain communication services in bulk at wholesale rates, then sets retail prices independently. MVNO access is suitable for a mobile operator which does not own any RAN infrastructure and instead purchases an entire mobile service from an MNO on a wholesale basis.636 The largest MVNO operators in South Africa are Virgin Mobile, Pep Mobile, Red Bull Mobile, and FNB Mobile all of which operate on Cell C’s network.637 ECN’s view is that the other mobile operators - Vodacom, MTN, and Telkom, do not offer MVNO access because they want to completely own relationships with customers.
544. Another, albeit ambiguous, way to offer wholesale services is RAN sharing. RAN sharing occurs when operators share active and/ or passive elements of the RAN, such as antennas, feeder cables, and radio cabinets.638
545. A fourth service called reverse billed APN is available at the wholesale level. This is a value added data service that allows employees of corporates to access the organisation’s network, key applications and information, conveniently and securely from virtually anywhere in the world.639 APNs let users connect their cellphones to an organizations’ network over the network of an MNO or a particular wireless provider’s network.640 When this service is sold to re-sellers (at the wholesale level), a mode of delivery called reverse billing is used (as opposed to subscriber billing in the case where it is sold at a retail level directly to corporates), which allow wholesale customers to aggregate their own customer tariff and provide white-
164
labelled mobile data services to their end-users.641
546. A few of the larger traditional fixed internet service providers have negotiated wholesale data access to the MNO’s networks. Large fixed ISPs such as Internet Solutions, Vox Telecom, RSAWeb, Afrihost and ECN utilise these reverse billed APN services to provide white-labelled mobile data services to their end-users. Vodacom stated that its average revenue from the resale of data through an APN is immaterial in relation to its other services. We did not receive any other submissions or concerns in relation to this service during the course of the inquiry.
Fixed wholesale network services
547. Network operators provide ISPs with access to the fixed networks required to reach their end-users.642 This allows them to provide services to end-users643 without having to construct an entire network. Fixed access networks provide the so called “last mile” connectivity which links national network providers to end-users.644 ISPs are effectively granted access to operators’ international networks, national fibre networks, local fibre networks, and local copper networks at wholesale prices. They then on sell communication services to end-users using copper, ADSL, or fibre as transmission mechanisms.645
9.1.3. Retail data services
548. The downstream end of the value chain entails the sale of communications services to end-users through mobile or fixed networks. The five mobile operators are vertically integrated and sell communication services directly to end-users. They can also make use of service providers, such as the now defunct Nashua Mobile to sell communication services on their behalf at a commission. MVNOs, through the networks of their parent networks, also sell communication services to customers.
549. Telkom had been a state monopoly provider of fixed line services until a second national
641 Vodacom.co.za. Business: APN. [Online]. Available at: https://www.vodacombusiness.co.za/business/solutions/mobile-and-voice/apn. [Last viewed on 10 April 2019]642 ECN’s submission dated 1 November 2017 (Non-confidential version), p.15, para. 4643 Telkom’s submission dated 17 November 2017 (Non-confidential version), p. 17, para. 66644 ECN’s submission dated 1 November 2017 (Non-confidential version), p. 17645 MTN’s submission dated 27 November 2017 (Non-confidential version), p. 8, para. 2.2.3.1. Also see ECN’s submission dated 1 November 2017 (Non-confidential version), p. 11-12646 The Competition Commission v Telkom SA SOC Ltd, Tribunal Case No.: 11/CR/Feb04647 Competition Commission vs Telkom SA SOC Limited, Tribunal Case No.: 55/CR/Jul09; 73/CR/Oct09 and 78/CR/Nov09
operator, Neotel, started operating in 2007. Telkom is vertically integrated and provides upstream fixed line infrastructure to downstream suppliers who utilise fixed line infrastructure to deliver value added network services to end-users. Telkom also provided this downstream service. In February 2004, the Commission referred a matter to the Tribunal charging Telkom of abusing its monopoly p[position by excluding competing value added network service providers from the downstream value added network services market in contravention of section 8(b), 8(c) and 8(d)(i)646 of the Competition Act No.89 of 1998 (“the Act”). In 2009, the Commission referred further (consolidated) allegations against Telkom for contravention of section 8(a) and 9(1)(a) in addition to the aforementioned conducts.647
550. In July 2012, the Commission and Telkom reached a settlement agreement in relation to the Competition Commission vs Telkom SA SOC Limited, Tribunal Case No.: 55/CR/Jul09; 73/CR/Oct09 and 78/CR/Nov09 case whereby Telkom made a number of commitments including functional separation between the supply of upstream fixed line infrastructure and the supply of downstream managed network services, pricing programs outlining how prices of upstream products would be determined as well as committed price reductions in certain products over an agreed period of time.
551. Since the structural separation of the business of Telkom, there has been entry of retailers in the fixed segment with companies such as Vox, MWEB, and Internet Solutions, now offering retail fixed (through fibre and ADSL) communication services to customers in competition with Telkom. MNOs have also entered this market and are gradually growing their foothold.
9.2. Identification of broad markets for the assessment
552. This section identifies the markets relevant to the analysis conducted in the remainder of this report. It is important to note that for the purposes of a market inquiry, we are not required
165
to engage in a formal market definition process or identify the ‘relevant markets’ as in other investigations such as a prohibited practice investigation under Section 8 of the Act. This is not a requirement for market inquiries in terms of Chapter 4A, nor is it a requirement to understand the factors that drive prices and where and what remedies may be justified.
553. While we utilise the principles of market definition assessments where possible, and draw on other market definition work (whether that of ICASA, other cases, or other competition authorities, for instance), this is only to assist in our understanding of the nature of competition and the particular markets or segments relevant for the Inquiry. Essentially we identify markets or segments where firms compete directly for customers to the extent required to understand the nature of competition and the level of competition between players.
554. As detailed already in this report, the telecommunications industry is characterised by a complex and integrated value chain with a number of inputs and markets at each stage which are ultimately involved in providing the products that are present at a retail level. Thus our assessment in this section focuses on markets or market segments that relate to the specific concerns and/or conduct identified in the Summary of Submissions section above.
9.2.1. ICASA’s priority markets inquiry
555. As a starting point, we consider the broad markets defined by the ICASA in the course of its Priority Markets Inquiry. ICASA undertook the Priority Markets Inquiry in order to:
555.1. identify markets and/ or market segments in the electronic communications sector that are susceptible to ex ante regulations; and
555.2. determine which of the identified markets should be prioritised for market reviews and potential regulation in terms of section 67(4) of the Electronic Communications Act, 2005 (Act No. 36 of 2005) (“ECA”).648
556. The priority markets inquiry attempted to identify markets at a broad level and decided which of these should be prioritised for further reviews.
648 ICASA Priority Markets Discussion Document, p. ii, para. 2649 Priority Markets Discussion Document, p. 17, para. 10650 Gazette No 40945, Volume 624, General Notice No. 485 of 2017
ICASA would conduct a market review for each broad market identified and prioritised and as part of the market review it would conduct a deeper market definition assessment. This is shown in the following quotation from the ICASA discussion document which states that the market identified would be the broadest possible market definition and that the markets may ultimately be defined more narrowly. “Markets are deliberately identified as broader than the narrowest possible market definitions in order to provide a collective of connected market segments that may form the logical basis for a market review. It is neither necessary nor useful at the prioritisation stage to engage in an exercise of identifying the narrowest possible markets.”649
The process of ICASA’s Priority Markets Inquiry
557. On 30 June 2017, ICASA published a notice in the Gazette650 indicating its intention to conduct an inquiry in terms of section 4B(1)(a) of the Independent Communications Authority of South Africa Act, 2000 (Act No. 13 of 2000) (“ICASA Act”), the purpose of which is stated above. The inquiry was conducted in four phases (namely Phase I – Market Study, Phase II – Discussion Document, Phase III – Public Hearings and Phase IV – Findings Document).
558. As part of Phase I, the Authority published a questionnaire requesting information and opinions from stakeholders (including the general public) to inform its market study. The purpose of the questionnaire was to gather information on which markets and market segments are prone to ex-ante regulation and those that ICASA may prioritise for market reviews in future.
559. In Phase II, ICASA published a Discussion Document on 16 February 2018 on which it identified a list of sixteen (16) broad markets and market segments which the Authority found, following Phase I, are prone to ex ante regulation. Table 26 below lists the sixteen broad markets and market segments that ICASA identified as part of Phase II of its inquiry. The Authority then held public hearings on 7 June 2018, i.e. Phase III of the Inquiry, wherein stakeholders orally submitted their views and opinions on the broad markets and market segments it identified during the course of Phase II.
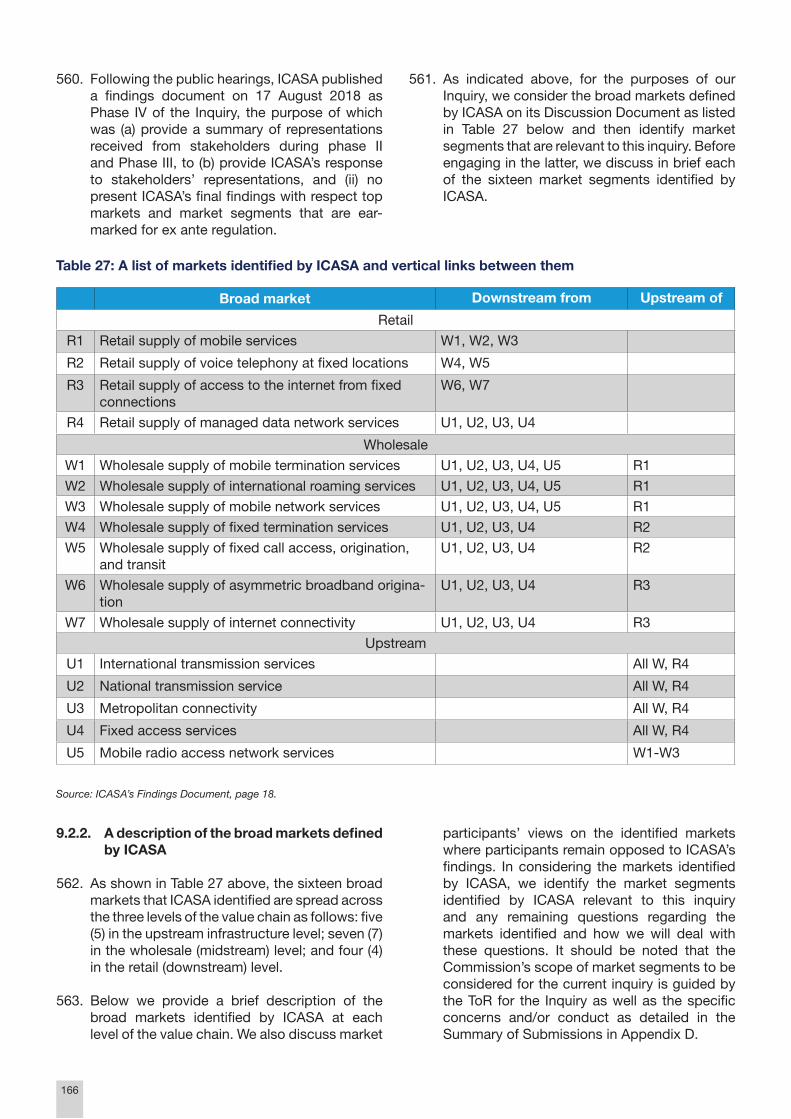
166
560. Following the public hearings, ICASA published a findings document on 17 August 2018 as Phase IV of the Inquiry, the purpose of which was (a) provide a summary of representations received from stakeholders during phase II and Phase III, to (b) provide ICASA’s response to stakeholders’ representations, and (ii) no present ICASA’s final findings with respect top markets and market segments that are ear-marked for ex ante regulation.
561. As indicated above, for the purposes of our Inquiry, we consider the broad markets defined by ICASA on its Discussion Document as listed in Table 27 below and then identify market segments that are relevant to this inquiry. Before engaging in the latter, we discuss in brief each of the sixteen market segments identified by ICASA.
9.2.2. A description of the broad markets defined by ICASA
562. As shown in Table 27 above, the sixteen broad markets that ICASA identified are spread across the three levels of the value chain as follows: five (5) in the upstream infrastructure level; seven (7) in the wholesale (midstream) level; and four (4) in the retail (downstream) level.
563. Below we provide a brief description of the broad markets identified by ICASA at each level of the value chain. We also discuss market
participants’ views on the identified markets where participants remain opposed to ICASA’s findings. In considering the markets identified by ICASA, we identify the market segments identified by ICASA relevant to this inquiry and any remaining questions regarding the markets identified and how we will deal with these questions. It should be noted that the Commission’s scope of market segments to be considered for the current inquiry is guided by the ToR for the Inquiry as well as the specific concerns and/or conduct as detailed in the Summary of Submissions in Appendix D.
Broad market Downstream from Upstream of
Retail
R1 Retail supply of mobile services W1, W2, W3
R2 Retail supply of voice telephony at fixed locations W4, W5
R3 Retail supply of access to the internet from fixed connections
W6, W7
R4 Retail supply of managed data network services U1, U2, U3, U4
Wholesale
W1 Wholesale supply of mobile termination services U1, U2, U3, U4, U5 R1
W2 Wholesale supply of international roaming services U1, U2, U3, U4, U5 R1
W3 Wholesale supply of mobile network services U1, U2, U3, U4, U5 R1
W4 Wholesale supply of fixed termination services U1, U2, U3, U4 R2
W5 Wholesale supply of fixed call access, origination, and transit
U1, U2, U3, U4 R2
W6 Wholesale supply of asymmetric broadband origina-tion
U1, U2, U3, U4 R3
W7 Wholesale supply of internet connectivity U1, U2, U3, U4 R3
Upstream
U1 International transmission services All W, R4
U2 National transmission service All W, R4
U3 Metropolitan connectivity All W, R4
U4 Fixed access services All W, R4
U5 Mobile radio access network services W1-W3
Table 27: A list of markets identified by ICASA and vertical links between them
Source: ICASA’s Findings Document, page 18.

167
564. Our discussion below of the broad markets identified by ICASA is divided into the three levels of the value chain (as reflected in Table 27 above): retail, wholesale and upstream.
Broad markets segments identified by ICASA at the retail (downstream) level
565. ICASA identified four (4) broad market segments in the retail level of the value chain corresponding to the labels R1 to R4 in Table 27 above. Broadly, ICASA separated mobile retail market segments from fixed retail market segments on the basis that these technologies are unlikely to place a competitive constrain on each other from both the demand and supply-side, nor are they likely to do so in the near future.651 From the demand side, the authority pointed out that mobile networks provide the benefit of mobility which is something that cannot be replicated by fixed-line or fixed-wireless services. From the supply-side, the authority stated that entry into mobile operations by fixed line operators is limited due to regulatory constraints, including spectrum licensing, as well as the significant time and costs required to roll out a RAN. The Authority briefly described each of the identified retail market segments as follows:
565.1. Retail market R1, i.e. the retail supply of mobile services, includes the retailing of mobile voice, data, and SMS services, delivered across all mobile network technologies, to all customer-types nationally.652
565.2. Retail market R2, i.e. the retail supply of voice telephony at fixed locations, entails the retailing of voice access and origination (receiving and making voice calls) over the fixed-line PSTN653 (public switched telephone network) controlled by Telkom, and managed VoIP services delivered over fixed-line and fixed-wireless broadband connections (including those of Liquid Telecom), throughout the country. 654
565.3. Retail market R3, i.e. the retail supply of access to the internet from fixed connections, includes the retailing of access services to all customer types via various access technologies, including
651 ICASA Priority Markets Discussion Document, p. 70. Appendix 1, para. 5652 ICASA Priority Markets Discussion Document, p. 70. Appendix 1, para. 3653 Originally a network of fixed analog telephone systems, operated by a national telephony operator.654 ICASA Priority Markets Discussion Document, p. 73. Appendix 1, para. 12655 ICASA Priority Markets Discussion Document, p. 73. Appendix 1, para. 21656 ICASA Priority Markets Discussion Document, p. 73. Appendix 1, para. 27
narrowband, asymmetric broadband and leased lines at a national level. 655
565.4. Retail market R4, i.e. the retail supply of managed data network services, includes the business-to-business sale of managed data network services over leased lines and any similar high-bandwidth access technologies. These services enable corporate customers to connect all their sites and business applications in various geographic locations to enable the communication and data exchange. The offering of these services id national in geographic scope.656
566. Save for objections from Vodacom, and Telkom, all market participants who responded to the Discussion Document in relation to retail market segments agreed with ICASA that the retail markets identified in the table above are a true reflection of the broadest markets at the retail level of the value chain.
567. Vodacom’s main objection in this regard related to ICASA’s omission of over-the-top-services (“OTT”). Vodacom stated that OTT services should be explicitly included in the downstream level as part of a broad market for the retail supply of mobile services. ICASA however disagreed with this suggestion, stating that it had previously determined that OTT services do not fall within the same market as retail mobile services as these services are on top of existing retail mobile services. The Authority further argued that OTT services cannot constrain mobile data services.
568. Telkom argued for a much broader market than the list of broad markets identified by ICASA. Telkom argued that fixed line network services face competitive constraints from both fixed wireless and mobile wireless network services and, hence suggested a broader market that includes all three. ICASA noted Telkom’s suggestion but pointed out that arguments presented by Telkom regarding the comparative speeds and pricing of fixed and mobile services in South Africa do not necessarily demonstrate that these are substitutes. As a result, the Authority maintained that fixed and mobile network services should be in separate markets.

168
569. We are also of the view that mobile and fixed line network services do not constrain each other to any significant degree if it all. This view is based on responses to the CfS as detailed in the summary of submissions in Appendix D. The Summary of Submission section shows that many stakeholders do not view mobile data services and fixed line data services as part of the same market because mobile services offer subscribers the benefit of mobility, a feature that fixed services do not possess. Moreover, as detailed in the Summary of Submissions section, fixed data services have limited coverage (approximately 5% penetration) compared to mobile services (almost 100% penetration).
570. Telkom’s basis for including fixed and mobile services is that many consumers have cancelled their fixed line subscription and rely completely on mobile networks for their data services (see summary of submissions section above). We are of the view that this suggest that if a constraint is present, it is only one directional, with mobile services placing a constraint on some fixed products while the converse is not true due to functional differences such as mobility as alluded to above.
571. Other submissions we received argue that even from a technical perspective, mobile and fixed services are constructed and delivered differently, which explains price differences between the two (see Summary of Submissions section above).
Retail market segments relevant to the current market inquiry
572. For the purpose of the current inquiry, the Commission will consider the following retail market segments:
572.1. R1 – the Retail supply of mobile services, and;
572.2. R3 – the Retail supply of access to the internet from fixed connections.
573. The basis of this choice is that, market segments R1 and R3 include data services, which are at the centre of the current inquiry. In addition, as detailed in the Summary of Submissions section above, market participants have raised concerns in relation to these market segments. Although market segment R4 has data aspects, we do not consider it further in our assessment
657 Telkom’s submission dated 17 November 2017 (Non-confidential version), p. 2-3, para. 7
because it does not entail the provision of data to customers, but refers to “the provision of value-added data services, such as Virtual Private Networks … usually to business customers”657 (emphasis added). In addition, stakeholders did not raise any concerns about this market segment.
574. We will also not consider market segment R2 any further because we did not receive any concerns from market participants in relation to it in addition to the fact that this market segment only relates to the making and receiving of voice calls over fixed lines, and does not have any relation with the delivery of data services at the retail level.
Broad markets identified by ICASA at the wholesale (midstream) level
575. At the wholesale level ICASA’s discussion document proposed seven (7) broad market segments corresponding to the labels W1 to W7 in Table 27 above. ICASA described each of the proposed market segments as follows:
575.1. Wholesale market W1, i.e. the wholesale of mobile termination services, includes the wholesale supply of termination services for voice calls and SMS’s to a mobile location that terminate on each MNO’s network inside South Africa. ICASA suggested that this market should be segmented into wholesale voice and wholesale SMS termination and that SMS or voice that terminate within South Africa should be considered separately from those terminating internationally.
575.2. Wholesale market W2, i.e. the wholesale supply of international mobile roaming services, includes the provision by South African-licensed MNOs to foreign MNOs of access, origination, and termination services, such that foreign MNOs can offer voice, data, and SMS services to their customers while those customers are inside South Africa.
575.3. Wholesale market W3, i.e. the wholesale supply of mobile network services, includes the wholesale supply by MNOs of mobile network services that may be demanded by any customer type. The mobile network services typically demanded at the wholesale level include voice, data, SMS, and access point

169
name (“APN”) services. The Authority noted that this market may potentially be segmented by service type, with the potential segments being voice, data, SMS, and APN services. ICASA based this view on the notion that these services can be demanded separately at the wholesale level as opposed to the typical case at the retail level where they are often demanded as a bundle.
575.4. Wholesale market W4, i.e. the Wholesale supply of fixed termination services, includes the wholesale supply of termination services for voice calls to a fixed location that terminate on each ECS/ECNS licensee’s network who provides such services inside South Africa. The Authority suggested that services terminating from international locations should be separated from those terminating from within South Africa.
575.5. Wholesale market W5, i.e. the wholesale supply of fixed call access, origination and transit, includes the wholesale supply of fixed call access (over narrowband access lines, origination and transit services via the PSTN. ICASA stated that fixed call access, origination, and transit services are typically demanded as a bundle at the wholesale level. The Authority further argued that the provision of these services is independent of the infrastructure over which it is provided, hence the sale of this bundle does not include access to any infrastructure.
575.6. Wholesale market W6, i.e. the wholesale supply of asymmetric broadband origination, includes the wholesale supply of asymmetric broadband origination services, via fixed-line or fixed-wireless technologies, and also includes any backhaul services that are required to allow interconnection between the wholesale provider and its customers(s).
575.7. Wholesale market W7, i.e. the wholesale supply of Internet connectivity, includes the wholesale provision of internet connectivity via peering or transit arrangements, or via commercial reseller arrangements.
658 Telkom’s submission dated 17 November 2017 (Non-confidential version), p. 18, para. 71659 Telkom’s submission dated 17 November 2017 (Non-confidential version), p. 18, para. 71
575.7.1. Peering occurs between ISPs (same tier) which exchange traffic, commonly on a settlement-free basis (but can also be paid for, i.e. commercially reseller agreements).658
575.7.2. Transit is a (typically metered) service offered by Tier 1 ISPs that enables small ISPs (Tier 2 and 3) to access the global internet by transiting over their networks.659
575.8. ICASA noted that in a context of a market review, it would be necessary to consider the possible segmentation of this market by customer-type, i.e. the tier at which an internet provider sits will determine whether it enters into peering or transit arrangements.
576. ICASA did not receive any objections in relation to the wholesale fixed markets (those mentioned under W4, W5, W6, W7) it identified. With respect to wholesale mobile market segments (those mentioned under W1, W3 above), market participants argued that all the markets identified by ICASA should be considered as components of a broader wholesale mobile network services market. In addition, it was suggested to ICASA that upstream market segment U5 (mobile radio access network services) described below be brought down and be included as part of the broad wholesale market. It was further argued that such broad market should include both passive network infrastructure and active RAN sharing, notwithstanding that the latter is currently not permitted by law.
577. ICASA agreed with market players in this regard and found it appropriate to identify a broad mobile wholesale market that includes mobile network services, MVNO access services (to both full and light MVNOs) and national roaming. Further, in line with the approach of including facilities as discussed below, ICASA found it appropriate to include passive infrastructure and active RAN sharing as part of the broad wholesale mobile market segment. The Authority however indicated when conducting a market review, it would be necessary to consider whether there should be further segmentation of this market.

170
578. Thus ICASA and market participants are in agreement with each other on the boundaries of this identified broad market segment, and the Commission does not have any reasons to identify a broader market. The Commission will therefore conduct its analysis on the basis of the broad market segment as identified by ICASA. However, since the Commission received specific concerns in relation to national roaming services and passive infrastructure sharing, these segments will be considered closely in the current inquiry.
Wholesale market segments relevant to the current inquiry
579. On the basis of the foregoing, the Commission will consider the following markets in its analysis by virtue of them being important for the delivery of both mobile and fixed-line data services:
579.1. W1 – Wholesale supply of mobile termination services,
579.2. A new W3 – the wholesale supply of mobile services which now includes, MVNO access, national roaming, passive RAN sharing and active RAN sharing.
579.3. W6 – wholesale supply of asymmetric
broadband origination, and
579.4. W7 – wholesale supply of internet connectivity.
580. Although market segment W2, i.e. the wholesale supply of international roaming services, is an input into the retail supply of mobile services including data (market R1), we do not consider it any further in our analysis because it does not have an impact on the delivery of data services to South African consumers by South African MNOs. This is as, by definition, it is a roaming services provided to international MNOs to enable them to deliver services to their customers when they are in South Africa. Market segments W4 and W5 on the other hand are inputs into the retail supply of voice telephony over fixed locations (R2), and therefore do not affect the retail supply of data services. In addition to these markets not having a direct impact on the delivery of data services, we did not receive any complaints from market participants regarding them.
Broad markets identified by ICASA in the upstream level
581. ICASA identified five (5) broad market segments at the upstream level corresponding to the labels U1 to U5 in Table 27 above. This level of the value chain includes all markets in which individual network services (access/connectivity and transmission services) are purchased by licensed service providers as inputs into the provision of the wholesale and/ or retail services described above. ICASA briefly described the identified market segments at this level of the value chain as follows:
581.1. Upstream market U1, i.e. International transmission services, includes the wholesale provision of international transmission services via leased lines and any other international transmission technology at a national level. The main transmission technologies used to deliver these services are fibre-optic cable (sub-marine and terrestrial), satellite, and microwave links. The Authority noted that the different technologies could possibly constitute separate markets if considered in the context of a market review.
581.2. Upstream market U2, i.e. National transmission services, includes the wholesale provision of national leased line services that provide high-bandwidth connectivity between distant locations (e.g. different cities) within South Africa. The market includes dark fibre capacity, as well as managed and unmanaged data transmission services over lit fibre. The Authority indicated that in the context of a market review, this segment can be disaggregated such that dark fibre and lit fibre constitute separate markets. ICASA further suggested that this market is national in geographic scope.
581.3. Upstream market U3, i.e. Metropolitan connectivity, includes the wholesale provision of connectivity between local sites within high-density urban and sub-urban areas and metropolitan points of presence, which are located within high-bandwidth ring-networks surrounding each metropolitan area in South Africa. ICASA suggests that this market

171
includes dark fibre660, whether managed or not. Just like in market segment U3 above, the Authority noted the possibility of dark fire and lit fibre (and within lit fibre, managed and unmanaged) being separate markets in the context of a market review.
581.4. Upstream market U4, i.e. Fixed access services, entails the wholesale provision of local access services or last mile connectivity at a fixed location, enabled by fixed-line, or fixed-wireless technologies (including microwave technology), to customers of all types. ICASA stated that this market should be segmented into wholesale local access and wholesale high quality access. The former refers to the connection between a customer’s local loop and the nearest exchange, primarily used by households and small businesses. The latter on the other hand refers to the wholesale services that allow access via the terminating segments of leased lines irrespective of the technology used to provide leased or dedicated capacity. These services are typically used by larger businesses or MNOs. ICASA indicated that further segmentation between fixed-line and fixed wireless access technologies should be considered in the contest of a potential market review.
581.5. Upstream market U5, i.e. Mobile radio access network services, entails the wholesale provision of RAN based services as distinct from the wholesale supply of mobile services making use of the entire mobile network (including core network). The Authority suggested that this segment should include national roaming services by a licensed MNO to other MNOs that lack the required RAN capacity in certain (mostly rural) areas. The Authority further argued that this segment may also include the provision of active RAN sharing services as well as national RAN access for potential MVNOs that invest in their own network.
660 Dark Fibre or unlit fibre refers to unused fibre (i.e. no service runs in it). The owner of the fibre generally leases it out to another party to manage and use it for the provision of communication services.661 ICASA’s Findings Document, p. 22, section 4.2.1.5662 ICASA’s Findings Document, p. 22, section 4.2.1.1663 ICASA’s Findings Document, p. 22, section 4.2.1.3664 ICASA’s Findings Document, p. 22, section 4.2.2
582. In its Discussion Document, ICASA had not included facilities as one of the broad upstream market segments. Although market participants generally agreed with the markets the upstream markets identified by ICASA in the Discussion Document, some called for the inclusion of facilities as one of the market segments in the upstream (or wholesale) level of the value chain. For example, Liquid Telecom specifically “stated that the upstream market for access services (U4) should include facilities such as co-location, wires, poles and ducts.”661 Similarly, Vodacom stated that “there should either be a separate market for ducts and poles or duct and pole access should be included in the markets for wholesale local access, national transmission and metropolitan connectivity.”662 Cell C is also of the view that facilities should have formed part of the identified markets.663
583. In light of the views expressed by market participants on relation to facilities, ICASA ultimately found it appropriate to include facilities in the broad upstream market segments as doing so “will allow for a complete review of the markets, including the identification of bottlenecks and the determination of whether or not regulatory interventions that go beyond the Facilities Leasing Regulations are required.”664
Broad upstream market segments relevant to our inquiry
584. For the purpose of the current inquiry, the Commission will therefore consider the following upstream market segments:
584.1. Upstream market U2, i.e. National transmission services,
584.2. Upstream market U3, i.e. Metropolitan connectivity,
584.3. Upstream market U4, i.e. Fixed access services; and
585. The basis for this choice is that, as indicated in Table 27 above, all these market segments are inputs in to the provision of retail data services. As discussed in sub-section 9.1.1 above, market participants did not raise concerns regarding international transmission

172
services (market U1) while some indicated that this segment is competitive. Hence we do not consider it any further in our analysis despite it being relevant for the delivery of data services. In line with the new approach of including the sharing of passive RAN and active RAN as part of the wholesale of mobile network services which was welcomed by stakeholders, upstream market U5 now forms part of the wholesale markets as discussed above.
9.3. Identified markets relevant to the inquiry
586. A number of the markets identified by ICASA and discussed above are relevant to the inquiry in that they directly influence the retail price of data for consumers. This includes both the actual retail markets but also the wholesale and upstream markets which are ultimately inputs for retail markets.
587. In terms of mobile data the following markets play a role in the ultimate retail pricing observed:
587.1. Retail market R1 – Retail supply of mobile services,
587.2. Wholesale market W1 – Wholesale supply of mobile termination services,
587.3. New wholesale market W3 – Wholesale supply of mobile services, which now includes MVNO access, national roaming, passive RAN sharing and active RAN sharing.
587.4. Upstream market U2 – National Transmission services,
587.5. Upstream market U3 – Metropolitan connectivity,
587.6. Upstream market U4 – Fixed access services.
588. In terms of fixed date the following markets play a role in the ultimate retail pricing observed:
588.1. Retail market R3 – Retail supply of access to the internet from fixed connections,
588.2. Wholesale market W6 – Wholesale supply of asymmetric broadband origination,
588.3. Wholesale market W7 – Wholesale supply of internet connectivity,
588.4. Upstream market U2 – National Transmission services,
588.5. Upstream market U3 – Metropolitan connectivity, and
588.6. Upstream market U4 – Fixed access services.
173
589. A modern telecommunications market has become a critical part of a modern society665. At its core telecommunications connect people locally, regionally, nationally and globally. It has been and continues to be a fundamental contributor to economic growth, inclusivity and development666. It is the embodiment of being part of a globalised world where it serves as the platform for communication and knowledge sharing. Improved telecommunications will enable platforms for “economic enterprise, active citizenship and social engagement and innovation. It will connect public administration to the active citizen; promote economic growth, development and competitiveness; drive the creation of decent work; underpin nation-building and strengthen social cohesion; and support local, national and regional integration”667 It is therefore imperative that telecommunications markets operate efficiently, continue to grow and innovate, and where products are affordable and accessible for all people, and in achieving these objectives the prevailing view is that more competition in telecommunications is critical668. It has the potential to create efficiencies, bring prices down, improve customer service, encourage infrastructure investment and promote innovation.
590. This Appendix paints a high-level picture of competition in telecommunications markets and by so doing provides insights into competitive dynamics particular to telecommunications that in turn inform the analysis conducted within this assessment. Three aspects are discussed below:
590.1. Key features of telecommunications markets that affect competition.
665 Computer Science and Telecommunications Board (CSTB). (2006). “Renewing U.S. Telecommunications Research.” Committee on Tele communications Research and Development, National Research Council, Washington, D.C.: The National Academies Press.666 Department of Communications. 2013. South Africa Connect: Creating Opportunities, Ensuring Inclusion- South Africa’s Broadband Policy. 20 November 2013; Jamison, M. (2012). “Methods for Increasing Competition in Telecommunications Markets”. Public Utility Research Center, University of Florida.667 Department of Communications. 2013. South Africa Connect: Creating Opportunities, Ensuring Inclusion- South Africa’s Broadband Policy. 20 November 2013668 European Commission, (2016). “Connected Continent for a Future-Proof Europe”. EPSC Strategic Notes, Issue 19, 25 July 216.
This explores areas that characterise telecommunications markets such as high fixed costs of infrastructure, economies of scale, high barriers to entry, vertical integration, operational interdependencies and resource constraints.
590.2. Competition concerns that commonly arise in telecommunications markets. Given the key features of telecommunications markets and case precedent in telecommunications markets, we detail the common competition concerns that arise in these markets.
590.3. Types of remedies that can potentially be used to address competition concerns. Given the typical competition concerns in telecommunications markets, there is a body of knowledge on how such concerns can be addressed, particularly from a regulatory standpoint, in order to ameliorate anti-competitive outcomes and create welfare enhancing benefits.
10.1. Key features of telecommunications
markets
591. This sub-section looks at key features of telecommunications markets including high fixed costs and how it affects competition; historical state ownership of telecommunication companies; vertical integration and how infrastructure-based and service-based competition differ; product differentiation and product pricing; operational dependencies between different service providers; network effects; how first-mover advantage reaffirms
10. APPENDIX B: ECONOMICS OF TELE-COMMUNICATIONS MARKETS AND INTERVENTION

174
favourable outcomes for incumbents; and market dynamics characterised by constantly changing markets.
10.1.1. High fixed costs
592. Telecommunications markets are characterised by high fixed costs669 and sunk costs670.671 High fixed costs markets are often characterised by economies of scale and scope672. Economies of scale exist in situations where average costs decline with increases in output673 whereas economies of scope exist when it is less expensive for a single company to produce two or more products than for two or more companies to produce them separately674. For instance, in telecommunications markets, firms sell both voice and data products. Both economies of scope and scale mean lower average costs as fixed costs can be shared across different products and increased volumes of any given product. Economies of scale increase barriers to entry and expansion as potential entrants or smaller competitors need to attract sufficient scale in order to reduce average fixed costs and be competitive with the incumbent operator675.
593. Telecommunications markets is often viewed as reflecting certain features of a natural monopoly676. A natural monopoly occurs where
669 European Commission, (2016). “Connected Continent for a Future-Proof Europe”. EPSC Strategic Notes, Issue 19, 25 July 216., p.8); ACCC, (2017). “Domestic mobile roaming declaration Inquiry”. Australian Competition and Consumer Commission, October 2017.p.113); and New Zealand Commerce Commission (2016) Competition in the fixed and mobile telecommunications markets, p.5670 A sunk cost is the cost of a production activity that is so specialized that it cannot be easily used for other purposes (Sharkey, W. (1982). “The Theory of Natural Monopoly”. Cambridge: Cambridge University Press, p. 37).671 Jamison, M. (2012). “Methods for Increasing Competition in Telecommunications Markets”. Public Utility Research Center, University of Florida.672 Jamison, M. (2012). “Methods for Increasing Competition in Telecommunications Markets”. Public Utility Research Center, University of Florida.P.3. European Commission, (2016). “Connected Continent for a Future-Proof Europe”. EPSC Strategic Notes, Issue 19, p.6).673 Kahn, Alfred E. (1988). “The Economics of Regulation: Principles and Institutions”. Cambridge: The MIT Press (Reissue Edition). p.124)674 Panzar, J.C., and Willig, R.D. (1981). “Economies of Scope.” American Economic Review, 71(2): 268-72.675 Jamison, M. (2012) Methods for Increasing Competition in Telecommunications Markets. Public Utility Research Center, University of Florida., p.34); CCRED (2014) Review of economic regulation of the telecommunications sector, p.4676 Kovecevic, D. Krajnovic, A & Cicin-Sain, D (2016) Market Analysis of the Telecommunications Market- The Case of Croatia: 161- 175.677 Jamison, M. (2012). Methods for Increasing Competition in Telecommunications Markets. Public Utility Research Center, University of Florida, p.28.678 For example, NERSA regulates Eskom, the power utility in South Africa.679 GSMA (2015) Spectrum for new entrants, lessons learned [Online] Available at: https://www.gsmaintelligence.com/research/?file=3f4ec 58d593cdd88d2a7e71995e82733&download [Accessed 20 November 2018]680 Posner, R.A., (1999) Natural Monopoly and its regulation. Cato Institute. p.4681 A deadweight loss is a loss of economic efficiency that can occur when equilibrium for a good or a service is not achieved.682 Lazer, D. & Mayer-Schonberger, V. (2001) Governing Networks, Telecommunication Deregulation in Europe and the United States. Brook J International, 27, p. 819683 Deregulation is a substantial decrease or elimination of government regulation over an industry. In South Africa, there is a telecommunica tions regular who amongst other functions issues licenses to telecommunications and broadcasting service providers. 684 Lazer, D. & Mayer-Schonberger, V. (2001) Governing Networks, Telecommunication Deregulation in Europe and the United States. Brook J International, 27, p. 819685 Lexology.2017. Telecoms in Brazil. Available at: https://www.lexology.com/library/detail.aspx?g=d0e143c5-7a5e-43df-8bf5- 272204d3cf01 [Accessed, 20 August 2018]686 CCSA, (2017). “Impact Assessment of the Settlement Agreement Order between Competition Commission SA and Telkom SA SOC Ltd.” Internal impact assessment.687 Telestra. 2018. Telegrams to tablets, explore our history timeline. [Online]. Available at: https://www.telstra.com.au/aboutus/our-company/ past [Accessed, 17 August 2018]
one firm can meet market demand more efficiently and at lower cost than multiple firms677. Natural monopolies are typically characterised by high infrastructure costs, economies of scale and high barriers to entry. As such natural monopolies often tend to be regulated as public utilities such as energy and railway markets678. Furthermore, there is a limitation in natural resources needed to provide services. For instance in telecommunications markets, the availability of spectrum and mobile sites may limit entry679. Natural monopolies, are typically associated with a transfer of “wealth from the consumers of a product to owners of the firm selling it”680, a cost to society in the form of deadweight loses681, high (monopoly) prices and inefficiencies.
594. Historically, telecommunications markets have been considered a public utility. For instance, the EU telecommunications markets has been seen as a natural monopoly and was regulated as a public utility before 1980682. Telecommunications markets, however, have become deregulated683 in many regions across the world, presumably indicating the markets could no longer be described as a true natural monopoly and/or that a lack of competition more broadly led to adverse outcomes. For instance deregulation took place in Europe684, Brazil685, South Africa686, Australia687 and New
175
Zealand688. Following deregulation there has typically been entry into the market place. For instance, Neotel was licensed and entered as a competitor of Telkom in South Africa689; Brazil privatised its telecommunications markets in 1998 and currently has four major service providers690; Telstra faced competition in the form of Optus and TPG in Australia691; and Telecom faced competition in the form of New Zealand Vodafone692. For instance, countries typically have at least three mobile services providers, with some having four or more.693
10.1.2. Presence of state owned enterprises
595. As discussed in the previous subsection, historically telecommunications markets was treated as a natural monopoly in which the SOEs were regulated as public utilities. SOEs enjoyed state support through regulation which enabled their monopoly status694 e.g. by not licencing potential competitors. Subsequently, SOEs have been able to invest into telecommunications infrastructure with little threat from competitors. Following deregulation, many SOEs were privatised (as was in the case of South Africa, Spain, Brazil, Australia, and New Zealand) and started to face competition from newly licensed entrants. These newly privatised SOEs are considered incumbents in the market as they have existing infrastructure which effectively gives them a cost advantage over new rivals who have not benefited as a state sponsored monopoly. Nonetheless, entry has applied competitive pressure on these incumbents which have
688 Spark New Zealand. 2018. Our heritage. [Online]. Available at: https://www.sparknz.co.nz/about/about-spark/Heritage/ [Accessed, 17 August 2018].689 CCSA, (2017) Impact Assessment of the Settlement Agreement Order between Competition Commission SA and Telkom SA SOC Ltd. Internal impact assessment.690 Lexology (2017) Telecoms in Brazil. [Online]. Available at: https://www.lexology.com/library/detail.aspx?g=d0e143c5-7a5e-43df-8bf5- 272204d3cf01 [Accessed, 20 August 2018]691 ACCC (2018) Communications Market Study. Australian Competition and consumer Commission. April 2018.692 New Zealand Commerce Commission (2016) Competition in the fixed and mobile telecommunications markets693 New Zealand Commerce Commission (2016) Competition in the fixed and mobile telecommunications markets, p. 3.694 However, state ownership of the fixed line incumbent limits the independence of markets regulation. See Waverman, L., & Koutrompis, P. (2011) Benchmarking Telecommunications Regulation, Telecommunications Policy, 35695 ACCC (2018) Communications Market Study. Australian Competition and consumer Commission. April 2018; CCRED (2014) Review of economic regulation of the telecommunications sector, p. 4; also see BRG report in Telkom’s submission dated 17 November 2017696 For instance, Telstra in Australia still has a market share of approximately 50% and in South Africa Telkom’s market has declined from 90% in 2007-2012 to 75% in 2016 (See ACCC, 2018, p.22 and CCSA, 2017, p.55).697 Peitz, M (2005) Asymmetric Regulation of Access and Price Discrimination in Telecommunications. Journal of Regulatory Economics, 28: p. 327-343.698 Jamison, M. (2012) Methods for Increasing Competition in Telecommunications Markets. Public Utility Research Center, University of Florida, p. 2. MNO’s in South Africa such as MTN, Vodacom, Cell C and Telkom, are also vertically integrated. One will find a similar situation in other jurisdictions as well such as New Zealand and Australia.699 Jamison, M. (2012) Methods for Increasing Competition in Telecommunications Markets. Public Utility Research Center, University of Florida, p. 30700 Double marginalization relates to mark-ups applied at various levels of the value chain.701 Jamison, M. (2012) Methods for Increasing Competition in Telecommunications Markets. Public Utility Research Center, University of Florida, p.28. p. 32-34702 European Commission, (2016) Connected Continent for a Future-Proof Europe. EPSC Strategic Notes, Issue 19, 25 July 216; also see CCSA (2017) Impact Assessment of the Settlement Agreement Order between Competition Commission SA and Telkom SA SOC Ltd. Internal impact assessment.
lost market share, improved product offerings, invested in infrastructure and reduced prices695. Despite entry and declining market shares, incumbents, particularly in fixed services, still enjoy their first mover advantage and have a disproportionately higher market share696. Therefore, in markets where there was previous state ownership of the incumbent firm, market shares appear to be asymmetrically distributed in favour of the incumbent. 697
10.1.3. Vertical integration and separation, infrastructure-based and service-based competition
596. Telecommunications markets have traditionally been dominated by firms that are vertically integrated698. Vertical integration relates to firms which are involved in more than one stage of value chain (e.g. the upstream and the downstream)699. Reasons offered in favour of vertical integration includes reduction of transaction costs, technological interdependencies between upstream and downstream factors of production and the avoidance of double marginalisation700,701. Despite these potential efficiencies, vertical integration can create competition issues particularly where the vertically integrated firm has market power in the upstream (discussed later). Furthermore, there has been an increasing number of non-vertically integrated service-based providers entering the market in the downstream market such as MVNOs and VANS702. These market players depend on upstream services or access such as access to
176
telecommunication infrastructure or roaming to provide services.
597. The notion of the essential facilities doctrine703 in telecommunications704 arises from downstream competitors needing access to infrastructure-based services which may be unreasonable to duplicate due to resource constraints705, the high cost of infrastructure and sunk costs706. The World Trade Organisation defines an essential facility as “facilities of a public telecommunications transport network or service that: (a) are exclusively or predominantly provided by a single or limited number of suppliers; and (b) cannot feasibly be economically or technically substituted in order to provide a service”707. “An essential facilities doctrine specifies when the owner(s) of an “essential” or “bottleneck” facility must provide access to that facility, at a reasonable price708”. For example, it might specify when a railroad must be made available on reasonable terms to a rival rail company, similarly it might specify when telecommunications infrastructure should be made to competing service providers. Essential facility issues can arise in several instances such as local fixed line loops, building access, mobile network towers, and telephone numbers709. Notably, the essential facilities doctrine might advocate that practical interventions such as infrastructure sharing address potential environmental and competition concerns710.
598. The provision of telecommunications services can be delineated into infrastructure-based competition in the upstream and service-based competition in the downstream. Infrastructure-based competition relates to competing by investing in high cost infrastructure in the upstream. For instance, a firm might want to
703 The Competition Act, no.89 of 1998 defines an ‘essential facility’ as “an infrastructure or resource that cannot reasonably be duplicated, and without access to which competitors cannot reasonably provide goods or services to their customers.”704 Jamison, M. (2012) Methods for Increasing Competition in Telecommunications Markets. Public Utility Research Center, University of Florida, p.20; OECD, (1996). The Essential Facilities Concept. OECD Roundtable Discussions. [Online] Available at: http://www.oecd.org/ competition/abuse/1920021.pdf [Accessed 3 November 2018]705 For example, limitations in available spectrum may limit infrastructure roll-out and there may be a shortage of mobile site space.706 Jamison, M. (2012) Methods for Increasing Competition in Telecommunications Markets. Public Utility Research Center, University of Florida, p. 28707 World Trade Organization (1996) [Online] Available at: http://www.wto.org/english/tratop_e/serv_e/telecom_e/tel23_e.htm [Accessed 20 August 2018].708 OECD, (1996) The Essential Facilities Concept. OECD Roundtable Discussions [Online] Available at: http://www.oecd.org/competition/ abuse/1920021.pdf [Accessed 3 November 2018].709 Jamison, M. (2012) Methods for Increasing Competition in Telecommunications Markets. Public Utility Research Center, University of Florida, p. 28. p. 21710 GSMA (no date) Mobile Infrastructure Sharing 711 ACCC, (October 2017) Domestic mobile roaming declaration Inquiry. Australian Competition and Consumer Commission712 European Commission, (2016) Connected Continent for a Future-Proof Europe. EPSC Strategic Notes, Issue 19, p. 4713 See: https://ec.europa.eu/digital-single-market/en/infrastructure-and-service-based-competition [Accessed: 20 August 2018].714 Jamison, M. (2012). “Methods for Increasing Competition in Telecommunications Markets”. Public Utility Research Center, University of Florida, p. 9
differentiate itself by investing in infrastructure and technologies that can potentially improve on coverage, speed, consistency and volume of telecommunication services711. As such a firm can lay down infrastructure in under serviced areas to increase coverage or invest in new generation technology such as 5G to increase speeds and data volume, etc. The widely held view is that the more competition at the upstream infrastructure level there is, the more infrastructure is likely to be invested712.
599. Service-based competition relates to retail offerings that downstream competitors offer to end consumers and can be a function demand-side considerations such as price, quality of service provision (including customer support713) and differentiated product offerings. Demand-side considerations that may restrict competition include switching costs, network effects and lack of customer information714. Compared to the upstream infrastructure-based level of the value chain which experiences high costs, entry into downstream service-based level is easier as there are lower fixed costs, as firms may require only limited infrastructure. Firms may also engage in service-based competition by spending significantly on marketing and advertising campaigns to improve brand recognition and attract potential customers. Increased service-based competition is likely to result in cheaper price offerings, increased differentiated product offerings, more aggressive marketing campaigns, better customer services and better distribution of products.
600. Service-based competition is argued to promote competition in the short-run whereas infrastructure, or network, competition is argued to promote competition in the long-run

177
and is likely to be more beneficial to overall competitiveness715. Furthermore the OECD argues that, “The ultimate goal of many policy makers and regulators has been to achieve full infrastructure competition, including the local loop. However, service-based competition, that is, without entrants having their complete own infrastructure and thus leasing some facilities and services from incumbent operators, has been seen as an intermediate step towards infrastructure competition.716” Therefore, service-based competition can be seen as a step towards achieving infrastructure-based competition which is important for driving new telecommunication innovations such as 5G.
10.1.4. Product differentiation and pricing
601. Telecommunications markets are characterised by product offerings that are highly differentiated. Service providers compete for market share by offering differentiated product in the form of varying network capabilities, handsets and various service bundles717 that satisfy an array of consumer’s needs. The ACCC (2017) notes that when assessing whether effective competition exists in a relevant market, behavioural factors including product differentiation is considered718. For instance, where networks differ from each other in terms of coverage, technology and quality, more choice for consumers and more competitive tension exists between operators719.
602. Service providers can also compete on price where relative prices are likely to be more transparent for similar product offerings. Prices in telecommunications are likely to be determined by a combination of supply and demand factors720. A common pricing principal used in telecommunications to determine prices is the Ramsey pricing principal. The Ramsey pricing principal argues that pricing at marginal cost may not compensate firms sufficiently to cover total costs. Therefore, the firm recoups its total costs by raising the price of those product offerings which have lower
715 Garcia, J.M., and T. Kelly, (2016) The Economics and Policy Implications of Infrastructure Sharing and Mutualisation in Africa. World Development Report 2016, p. 45716 OECD, (2013) Broadband Networks an Open Access. OECD Digital Economy Papers, No. 218, OECD Publishing, Paris, p. 10. [Online]. Available at: http://dx.doi.org/10.1787/5k49qgz7crmr-en [Accessed on 14 September 2018]717 New Zealand Commerce Commission (2016) Competition in the fixed and mobile telecommunications markets, p. 3718 ACCC, (2017) Domestic mobile roaming declaration Inquiry. Australian Competition and Consumer Commission, October 2017, p. 98719 ACCC, (2017) Domestic mobile roaming declaration Inquiry. Australian Competition and Consumer Commission, October 2017, p. 2720 For instance supply and demand factors was a contributor to price of telecommunications in Uganda (see Mayoka and Musa (2012).721 OECD, (2004) Access Pricing in Telecommunications. OECD Roundtable Discussions Report, 2004.722 OECD, (2004) Access Pricing in Telecommunications. OECD Roundtable Discussions Report, 2004. p28723 CCRED (2014) Review of economic regulation of the telecommunications sector, pg.102).724 Hoffler, F. (2005) Monopoly Prices Versus Ramsey-Boiteux Prices: Are they “similar”, and: Does it matter?” Max Planck Institute for Re search on Collective Goods, p. 2725 Jamison, M. (2012) Methods for Increasing Competition in Telecommunications Markets. Public Utility Research Center, University of Florida, p.10
elasticity of demand (or relatively inelastic demand)721.
603. Under the Ramsey pricing principal it is often more efficient, if feasible, to charge a two-part price, rather than charge a single price (equal to average cost) for a service722. Given that telecommunications markets are characterised by highly differentiated products, Ramsey pricing suggests that it may be efficient to engage in differentiated pricing for product offerings as they are likely to experience varying elasticities of demand. As such Ramsey pricing principals have been applied to termination rate regulation723 as well as being a pricing model that explains different off-net and on-net voice pricing724.
10.1.5. Operational interdependencies
604. Telecommunications markets are characterised by operational interdependencies which include interdependencies between competitors and firms at various layers of the value chain. Interdependencies between competitors include interconnection. During a voice call, the caller makes use of his or her own networks infrastructure. The receiver of the call may use another network provider in which its infrastructure is also used to connect the call. The receiver’s network provider then typically charges an interconnection (or termination) rate to the network provider for the use of its infrastructure. Thus the provision of a voice service by an operator to its customers is reliant on other operators. Interdependencies may also occur at different levels of the value chain, for instance, it may include access to roaming services and access to infrastructure.
10.1.6. Network effects
605. “Network effects occur when the value of a service to an individual customer depends on the number of other customers who use the service”725. For example, assume that a

178
service provider introduces a new method of texting that is incompatible with all other texting technologies. The more people using this network, the more valuable it becomes as there are more people to connect with. Conversely, if there are no other people using this network, usage of the network has little value as one cannot connect. There are two types of network effects namely: direct network effects and indirect network effects726. Direct network effects occur when an increase in usage directly leads to an increase in the value of the service. Indirect network effects occur when an increase in usage of the service leads to the production of valuable complementary services. For instance, when an increase in the number of Android operated devices sold is complemented with an increase in software applications that can be used on Android. A major characteristic relating to network effects is that a firm needs to develop critical mass in order to attract more customers, and it may create market conditions where the winner takes all.727 Additionally, a larger subscriber base can lower average costs creating a positive cycle for the firm that has established sufficient critical mass.
606. The notion of network effects in telecommunications often arise with respect to difference in on-net and off-net pricing. Network effects create what is called a “club effect” in which customers buy into the same network as friends and family in order to make cheaper on-net voice calls728. Similarly, the concept of network effect can extend into other aspects of telecommunications market
726 Jamison, M. (2012) Methods for Increasing Competition in Telecommunications Markets. Public Utility Research Center, University of Florida, p.11727 Jamison, M. (2012) Methods for Increasing Competition in Telecommunications Markets. Public Utility Research Center, University of Florida, p.11728 For instance, in Croatia, the dominant telecom firm, Hrvatski Telekom, is typically chosen by friends and family who want to stay in touch. See Kovecevic, D. Krajnovic, A & Cicin-Sain, D. (2016) Market Analysis of the Telecommunications Market- The Case of Croatia, p. 161- 175729 Jamison, M. (2012) Methods for Increasing Competition in Telecommunications Markets. Public Utility Research Center, University of Florida730 Jamison, M. (2012) Methods for Increasing Competition in Telecommunications Markets. Public Utility Research Center, University of Florida. p. 9731 Jamison, M. (2012) Methods for Increasing Competition in Telecommunications Markets. Public Utility Research Center, University of Florida. p. 1732 Jamison, M. (2012) Methods for Increasing Competition in Telecommunications Markets. Public Utility Research Center, University of Florida. p. 45733 Jamison, M. (2012) Methods for Increasing Competition in Telecommunications Markets. Public Utility Research Center, University of Florida. p. 73734 New Zealand Commerce Commission (2016) Competition in the fixed and mobile telecommunications markets, p. 12735 Global Competition Review (2018) Japan scrutinizes mobile market. [online: https://globalcompetitionreview.com/article/1171189/ japan-scrutinises-mobile-markets?gator_td=B61RwyILbOJOr1Oq1Cqcr6Y26lZvn9o6juQNmmFN%2bFaJtI%2bp4oB zJDhLMxJjbuJ%2f1mtGmLo3fKXmYk50oDvGfVe9hCiuzttcAgExpiUGW4GQQLR8tekajbd05elpwwDPmnRRqCEQRDj%2fy7p1HVx7f bAS%2bJeleqrRC8k2dKgE148o%2f%2fe2cHNLx4OIYZm6mvLTINzti4pcSEEordsHWC%2bt3g24UpzNxZxQB2da9Ic8jIsuMAPG1JJTING MPhtl8%2bsU [Accessed: 28 August 2918]736 Jamison, M (2012) Methods for Increasing Competition in Telecommunications Markets. Public Utility Research Center, University of Florida; Muck, J. & Heimeshoff, U (2012) “First Mover Advantages in Mobile Telecommunications: Evidence from OECD Countries”, Dusseldorf Institute for Competition Economics Discussion Paper, no. 71, p. 2
including app-based instant message services such as WhatsApp, social network sites such as Facebook and newsfeeds such as Twitter.
10.1.7. Switching costs
607. Consumers in telecommunications markets experience switching costs or stickiness to switching729. Switching costs are costs that a customer or an alternate supplier must incur, be it monetary or effort (e.g. relearning skills), in order to switch suppliers730. Effectively switching costs discourage customers from changing suppliers731, even if they are offering products at better prices and terms. As such, switching costs can limit competition by create barriers to switching by making it more costly for a service provider to take a customer from a rival than for the rival to retain the customer732. Examples that typically affect switching costs in telecommunications markets include number portability and fixed contracts. Number portability relates to the ability of the consumer to keep his or her own phone number while switching network providers. Costless and seamless number portability can reduce switching costs and improves competition between service providers733. Fixed contracts for post-paid telecommunications services can restrict switching as they lock in customers for a set period (e.g. two years) and they could be costly to cancel734, for example in Japan735.
10.1.8. First mover advantage
608. First mover advantage is an important feature to consider in telecommunications markets736. It is

179
often advantageous to have an early presence in a market, setting oneself up as an incumbent737. The majority of economics, management and marketing studies find empirical support for the existence of first mover advantages738 which enable pioneering firms to set prices above competitive levels and thus gain excessive profits739. Firms that enter early in the market can establish a customer base which increases the firm’s likelihood of surviving a price war that might ensue following the entrance of rivals740, this is particularly true in industries where there are high fixed costs741. Furthermore, the first mover advantage affects the cost position of both incumbents and entrants742. For instance in telecommunications, this cost position can be used by the incumbent to earn additional profits depending on how termination rates are regulated.743 Another first mover advantage is that incumbents can secure scarce resources or at least put rivals at a cost disadvantage when they try to secure access to these resources744. For instance, there may be limited access to building infrastructure for fibre optics or limited numbers of high sites of optimal position for infrastructure in rolling out wireless networks745. Other first mover advantages include: technological leadership resulting from learning by doing; the imposition of switching costs on customers; and the cost incurred by customers resulting from having to learn about new entrants before purchasing from them746.
609. Studies on market share dynamics provide strong evidence that market leadership often persists for a long time, much longer than standard economic theory predicts747. For instance, in a number of jurisdictions such
737 Jamison, M. (2012) Methods for Increasing Competition in Telecommunications Markets. Public Utility Research Center, University of Florida, p.18738 Muck, J. & Heimeshoff, U (2012) First Mover Advantages in Mobile Telecommunications: Evidence from OECD Countries, Dusseldorf Institute for Competition Economics Discussion Paper, no. 71, p. 2739 Haucap, J., and Dewenter, R (2006) First-Mover Vorteile im Schweizer Mobilfunk. Discussion Paper Nr. 56, University of Hamburg740 Shapiro, C & Varian, H (1999), Information Rules: A Strategic Guide to the Network Economy. Boston, Harvard Business School press, p. 29-32741 Jamison, M. (2012) Methods for Increasing Competition in Telecommunications Markets. Public Utility Research Center, University of Florida, p.18742 Muck, J. & Heimeshoff, U (2012) First Mover Advantages in Mobile Telecommunications: Evidence from OECD Countries, Dusseldorf Institute for Competition Economics Discussion Paper, no. 71, p. 2743 Dewenter, R (2007) “First mover advantages in mobile telecommunications: the Swiss case”. In: L. Benzini, P. Geoffron (eds.): Competition and regulation with asymmetries inmobile markets. Paris: Quantifica Publishing744 Jamison, M (2012) Methods for Increasing Competition in Telecommunications Markets. Public Utility Research Center, University of Florida, p.19745 Jamison, M (2012) Methods for Increasing Competition in Telecommunications Markets. Public Utility Research Center, University of Florida, p.19746 Lieberman, M & Montgomery, D (1988) First-mover Advantages. Strategic Management Journal, 4: 41-58.747 Sutton, J (2007) Market Share Dynamics and the Persistence of leadership debate. The American Economic review, 97: 222-241.748 Muck, J. and Heimeshoff, U. (2012) First Mover Advantages in Mobile Telecommunications: Evidence from OECD Countries”, Dusseldorf Institute for Competition Economics Discussion Paper, no. 71. p.3.749 Darji, R., Mkwanazi, S. & Njisane, Y. (2016) Disruptive Technologies in Telecommunications, Broadcasting and Transport sectors (Competition Commission Working paper).750 Darji, R., Mkwanazi, S. & Njisane, Y. (2016) Disruptive Technologies in Telecommunications, Broadcasting and Transport sectors (Competition Commission Working paper), p. 2
as Iceland, Hungary, Germany and Australia telecommunication incumbents have had the highest market shares for a number of years following the deregulation of state-sanctioned monopolies748. This is despite entry and market share growth for new entrants. These observations demonstrate that incumbents typically enjoy first mover advantages and might indicate limitations for smaller competitors to gain market share.
10.1.9. Market dynamics in telecommunications markets
610. Telecommunications markets are dynamic meaning that it is constantly changing particularly in terms of innovation and technology. As such new innovations in this markets have the potential to become disruptive749. “Disruptive technologies are new technologies that significantly alter the way businesses and industries operate. The introduction of a disruptive technology in any market may force traditional businesses to alter the way that they approach their business, risk losing market share or risk becoming irrelevant.750 ” This means that disruptive technologies change the way firms compete. For instance, over-the-top (“OTT”) services such as WhatsApp, Messenger and Skype have come to be viewed as cheaper and realistic alternatives to traditional voice and messaging services.
611. General themes that are often heard in telecommunications markets include issues such as: convergence, big data, internet of things (IoT), and cloud computing. Convergence is a broad term used to describe

180
the convergence of various types of technology onto the same platform (e.g. video, voice, data)751 or the convergence of fixed and mobile devices (e.g. hybrid devices)752. Big data relates to massive volumes of both structured and unstructured data which is so large it is difficult to process using traditional database and software techniques753. IoT is a system of interrelated computing devices, mechanical and digital machines, objects, animals or people that have the ability to transfer data over a network without requiring human-to-human or human-to-computer interaction754. Cloud computing is designed to move the computing and storage functionality of the end-user device into the network755. All these demand-based changes in computing are likely to drive change in the demand for data which will crucially depend on access to the highest quality telecom infrastructure756. This will impact on infrastructure-based competition. For instance, the roll-out of 5G technology is underway in some jurisdictions in order to increase the speed and volume at which data is transferred757.
10.2. Competition issues in telecommunications
612. This sub-section focuses on the features of telecommunications and how they translate into competition issues in this market. It links market structure, high fixed costs, first mover advantage and network effects and how this affects barriers to entry and expansion, concentration and market conduct.
10.2.1. Barriers to entry and expansion
613. Telecommunications markets are known to feature high barriers to entry and expansion758. Barriers to entry and expansion relate to restrictions on entry and expansion due to number of market factors including high costs,
751 OECD (2015) The Development of Fixed Broadband Networks”, Working Paper on Communication Infrastructures and Services Policy, p. 13752 New Zealand Commerce Commission (2016) Competition in the fixed and mobile telecommunications markets, p. 31 and ACCC (2018, p. 13)753 See https://www.webopedia.com/TERM/B/big_data.html [Accessed: 23 August 2018]754 See https://internetofthingsagenda.techtarget.com/definition/Internet-of-Things-IoT [Accessed: 23 August 2018].755 OECD (2015) The Development of Fixed Broadband Networks, Working Paper on Communication Infrastructures and Services Policy, p. 10756 European Commission, (2016) Connected Continent for a Future-Proof Europe. EPSC Strategic Notes, Issue 19, p. 1757 ACCC (2018) Communications Market Study. Australian Competition and consumer Commission. April 2018758 Jamison, M. (2012) Methods for Increasing Competition in Telecommunications Markets. Public Utility Research Center, University of Florida; Mondliwa,P (2016). Barriers to entry in telecoms. CCRED Policy Brief. 759 Jamison, M. (2012) Methods for Increasing Competition in Telecommunications Markets. Public Utility Research Center, University of Florida.760 ICN (2006) ICN Merger Guidelines Workbook- Prepared for the Fifth Annual ICN Conference. p.55.761 For instance FICA requirements in South Africa.762 CCRED (2014) Review of economic regulation of the telecommunications sector763 New Zealand Commerce Commission (2016) Competition in the fixed and mobile telecommunications markets, p.13764 ICN (2006) ICN Merger Guidelines Workbook- Prepared for the Fifth Annual ICN Conference. p.55.
regulation, strategic behaviour by incumbents, etc. which can limit a market from achieving competitive outcomes. Entry and expansion are important drivers of competition and can result in reducing prices and improving quality of services.
614. Barriers to entry and expansion exist due to the features of telecommunications markets including high infrastructure costs, first mover advantage, network effects and sticky switching behaviour759. The ICN categorises these barriers as follows: absolute barriers, structural barriers, economies of scale and strategic advantages760. These are discussed in more detail below:
614.1. Absolute barriers relates to barriers that could legally deny a potential entrant entry or make it practically impossible to expand its scope of operations. It often involves government regulations that can deter entry or expansion or make it difficult for customers to switch761. In telecommunications markets this can apply to the licensing of firms and the administration of spectrum between rivals or potential entrants762,763.
614.2. Structural barriers arise from market conditions that entail high and sunk costs, network effects and an incumbents control the means of production e.g. a scarce resource764. As previously noted, telecommunications markets are characterised by these features. Furthermore, structural barriers based on high and sunk costs give rise to economies of scale. This means that incumbents that have already invested in infrastructure have lower marginal costs, whereas new entrants and small rivals have a large cost component to overcome to develop their own

181
infrastructure. In order to cover their high infrastructure costs a minimum viable scale is needed to make entry and expansion profitable765.
614.3. Strategic advantages result from an incumbent’s first mover advantage over potential entrants and small rivals in telecommunications markets766. For instance, a first mover is most likely able to secure access to the best mobile sites. Furthermore, first movers would have incurred considerable sunk costs used for R&D and advertising expenditure767. This creates reputational benefits such as brand loyalty768 which might limit customer switching in response to cheaper price offerings. Strategic advantages can enable an incumbent to leverage its first mover advantage and market power to engage in market conduct that could be potentially anti-competitive. For instance, it could price aggressively or engage in margin squeeze that cause small rivals to exit the market769; engage in tying and bundling770 of data, voice and handset packages; restrict customer switching by locking them into long-term contracts with high cancelation fees771; induce customers into contracts by subsidizing handsets772; deny access to infrastructure, roaming
765 ICN (2006) ICN Merger Guidelines Workbook- Prepared for the Fifth Annual ICN Conference. p.55.766 ICN (2006) ICN Merger Guidelines Workbook- Prepared for the Fifth Annual ICN Conference. p.56.767 New Zealand Commerce Commission (2016) Competition in the fixed and mobile telecommunications markets, p. 15768 ICN (2006) ICN Merger Guidelines Workbook- Prepared for the Fifth Annual ICN Conference. p.56.769 ICN (2006) ICN Merger Guidelines Workbook- Prepared for the Fifth Annual ICN Conference. p.56.770 ICN (2006) ICN Merger Guidelines Workbook- Prepared for the Fifth Annual ICN Conference. p.56.771 Global Competition Review (2018) Japan scrutinizes mobile market. [Online: https://globalcompetitionreview.com/article/1171189 japan-scrutinises-mobile-markets?gator_td=B61RwyILbOJOr1Oq1Cqcr6Y26lZvn9o6juQNmmFN%2bFaJtI%2bp4o zJDhLMxJjbuJ%2f1mtGmLo3fKXmYk50oDvGfVe9hCiuzttcAgExpiUGW4GQQLR8tekajbd05elpwwDPmnRRqCEQRDj%2fy7p1HVx7 bAS%2bJeleqrRC8k2dKgE148o%2f%2fe2cHNLx4OIYZm6mvLTINzti4pcSEEordsHWC%2bt3g24UpzNxZxQB2da9Ic8jIsuMAPG1JJTIN MPhtl8%2bsU. [Accessed: 25 August 2918]772 Asai, S. (2010) Competition in the Japanese Cellular Phone Market. Keio Communication Review, No.32773 For instance an MNO can hold influence over the MVNO and restrict its ability to compete or push it into a niche where it does not threaten the MNO’s core business. (See New Zealand Commerce Commission (2016) Competition in the fixed and mobile telecommunications markets, p. 15).774 New Zealand Commerce Commission (2006, p.15); ACCC (2018, p.5); Lee and Lee (2006); Kovecevic, D. Krajnovic, A & Cicin-Sain, D (2016) Market Analysis of the Telecommunications Market- The Case of Croatia, p. 161- 175775 Asai, S. (2010) Competition in the Japanese Cellular Phone Market. Keio Communication Review, No.32 2010; Kovecevic, D. Krajnovic, A & Cicin-Sain, D (2016) Market Analysis of the Telecommunications Market- The Case of Croatia, p. 161- 175776 Kovecevic, D. Krajnovic, A & Cicin-Sain, D (2016) Market Analysis of the Telecommunications Market- The Case of Croatia, p. 161- 175777 ICN (2006) ICN Merger Guidelines Workbook- Prepared for the Fifth Annual ICN Conference. p.31778 ICN (2006) ICN Merger Guidelines Workbook- Prepared for the Fifth Annual ICN Conference. p.16779 The Competition Act, no.89 of 1998780 Sung, N. and Kwon, M. (2011) An Empirical Analysis of the State of Competition in OECD Mobile Wireless Markets, 22nd European Re gional ITS Conference, p. 2-3 Muck, J. and Heimeshoff, U. (2012) First Mover Advantages in Mobile Telecommunications: Evidence from OECD Countries, Dusseldorf Institute for Competition Economics Discussion Paper, no. 71, p.2781 Sung, N. and Kwon, M. (2011) An Empirical Analysis of the State of Competition in OECD Mobile Wireless Markets, 22nd European Re gional ITS Conference, p. 4782 Muck, J. and Heimeshoff, U. (2012) First Mover Advantages in Mobile Telecommunications: Evidence from OECD Countries, Dusseldorf Institute for Competition Economics Discussion Paper, no. 71. p. 2
and wholesale access or refuse to offer access on fair and non-discriminatory terms773.
10.2.2. Market concentration
615. Telecommunications markets are characterised as markets that are often highly concentrated774 which typically tends to oligopolistic competition775 particularly in the upstream markets776. Market concentration is determined by market shares, concentration ratios or the Herfindahl-Hirschman Index (“HHI”)777 and is widely held as an indicator of market power778. A firm with market power has the ability “to control prices, or to exclude competition or to behave to an appreciable extent independently of its competitors, customers or suppliers.779” Therefore, the extent to which market power is present in telecommunications markets is important in determining how firms can engage in anti-competitive conduct.
616. Observations based on 24 OECD countries between 1990 and 2009 indicate that market shares in telecommunications markets have declined due to deregulation, entry and competition780. For instance, HHIs have declined from 4,436 in 1999 to 3,589 in 2009, and incumbents have lost a market share of 10.3% on average781. However, market shares have stabilised over time782 with substantial

182
changes in market share rankings being uncommon783. Average market shares are still high with HHI concentrations between 2000 and 5000784 which indicate highly concentrated markets785. Furthermore, market shares in most instances would be asymmetrically distributed in favour of incumbents due to their first mover advantage786. Relatively high and unchanging market share rankings therefore indicate that telecommunications markets are characterised by firms having a degree of market power787.
617. There is an argument that high concentration is important for investment in infrastructure deployment. The European Commission notes that there is no case precedent that supports the argument that reduced competition is needed to stimulate investment, nor is there convincing evidence that higher levels of concentration are associated with more or better infrastructure in telecommunications markets788. There are examples where higher degrees of market power slows growth in infrastructure deployment. For example, the EC points out that US telecom companies were allowed to enjoy a significant amount of market power according to a forbearance policy, and slid from being the 10th ranked OECD country for fixed broadband penetration in 2003 to 16th place in 2014789. On balance it appears that arguments support the notion that high levels of concentration are not necessary for investment deployment.
10.2.3. Market conduct
618. Market conduct concerns arise when firms use their market power790 to distort competition in their favour. Often this takes the form of “abuse of market power” also known as “abuse of dominance”791. The term “abuse of dominance”
783 Sung, N. and Kwon, M. (2011) An Empirical Analysis of the State of Competition in OECD Mobile Wireless Markets, 22nd European Re gional ITS Conference, p. 2784 Sung, N. and Kwon, M. (2011) An Empirical Analysis of the State of Competition in OECD Mobile Wireless Markets, 22nd European Re gional ITS Conference, p. 2.785 ICN (2006, p.37) notes that HHI concentrations above 2000 are likely to raise competition concerns.786 Authors own observations.787 The ICN (2006, p.34) notes that market shares among market participants that varies considerably over a relatively short time period might be suggestive of a competitive situation where no firm has market power; conversely, the persistence of a more rigid pattern over a period of time may be indicative of a situation of market power.788 The EC argues that if users pay higher charges and companies make more profit, there is no guarantee that these profits will be reinvested in new infrastructure. European Commission (2016: 4)789 European Commission, (2016). “Connected Continent for a Future-Proof Europe”. EPSC Strategic Notes, Issue 19, p. 4790 The Competition Act, no.89 of 1998 defines the “market power” as “the power of a firm to control prices, or to exclude competition or to behave an appreciable extent independently of its competitors, customers or suppliers”. 791 Section 7 of the Competition Act, no.89 of 1998 notes that a firm with market power is dominant.792 Section 8, The Competition Act, no.89 of 1998.793 Jamison, M. (2012) Methods for Increasing Competition in Telecommunications Markets. Public Utility Research Center, University of Florida., p.36 to 47.794 This terminology is typically used in the US, EU and South Africa (O’Donoghue. & Padilla, 2006, p.407).795 O’Donoghue, R. & Padilla, A. (2006) The Law and Economics of Article 82 EC. Hart Publishing, Oxford and Portland, 2006. p.407
has legal meaning as some forms of market conduct may be an illegal act prohibited by competition law as it creates a substantial lessening of competition792. Other forms of anti-competitive market conduct may distort and reduce competition without necessarily being a prohibited abuse of dominance. Given the features of telecommunications markets, potential exclusionary anti-competitive market conduct that can be found includes outright refusals to deal such as denying access to infrastructure and roaming services; constructive refusals to deal such as providing access to infrastructure on unfair and discriminatory terms; predatory pricing, cross-subsidization or margin squeeze; coordination793; and excessive pricing. These types of conduct are discussed below:
618.1. Outright and constructive refusals to deal applies794 to the essential facilities doctrine wherein infrastructure cannot be reasonably duplicated i.e. industries (or parts thereof) that are historically considered natural monopolies795. In telecommunication a rival may need access to a firm’s infrastructure, wholesale access or roaming services. The rival may be a downstream competitor or a vertically integrated competitor needing access to key inputs on fair and non-discriminatory terms. Failure to get fair and non-discriminatory access may erode a rival’s ability to compete effectively against a firm. Case precedent on refusals to deal in telecommunications include the following:
618.1.1. Verizon Communications Inc. v. Law Offices of Curtis V. Trinko,

183
LLP796 (“Trinko”). The Trinko case relates to a controversial US Supreme Court decision that deliberates over two notions namely, “refusal to deal” and “essential facility” doctrine797. The alleged conduct related to Verizon refusing to provide AT&T with reasonable access to its systems and support operations, thereby impairing AT&T’s ability to provide a competitive service.
618.1.2. European Commission v. Deutsche Telekom798. The EC fined Slovak Telekom and its parent Deutsche Telekom for refusing to supply its competitors unbundled access to its local loops and for engaging in margin squeeze strategies on some competitors799.
618.2. Margin squeeze is a form of vertical foreclosure that can be considered a constructive refusal to deal800. Margin squeeze typically take place where a dominant firm in the upstream is vertically integrated with downstream operations. Such a firm can thus squeeze the margins of its downstream rivals by setting “an “excessive” upstream price, a “predatory” downstream price, or cross-subsidising downstream losses through upstream profit.801” Case precedent on margin squeeze in telecommunications includes:
618.2.1. Konkurrensverket v TeliaSonera Sverige AB802. The Swedish Market Court ruled that the telecom operator TeliaSonera abused its dominant position by engaging in margin squeeze in the broadband market during the period April 2000–
796 Legal Information Institue, Cornell University Law School (2004) Verizon Communications Inc. v. Law Offices of Curtis V. Trinko, LLP [Online] Available at: https://www.law.cornell.edu/supct/html/02-682.ZS.html [Accessed 22 October 2018].797 Candeub, A. (2005) Trinko and re-grounding The Refusal to Deal Doctrine. University of Pittsburgh Law Review, Vol. 66, p. 821798 European Commission (2014) Slovak Telekom- Case AT.39523. Commission Decision.799 See http://europa.eu/rapid/press-release_IP-14-1140_en.htm [Accessed: 28 August 2018]800 O’Donoghue, R. & Padilla, A (2006) The Law and Economics of Article 82 EC. Hart Publishing, Oxford and Portland, p. 303 & 321801 O’Donoghue, R. & Padilla, A. (2006) The Law and Economics of Article 82 EC. Hart Publishing, Oxford and Portland, 2006, p.321802 See:http://curia.europa.eu/juris/document/document.jsf?text=&docid=81796&pageIndex=0&doclang=en&mode=lst&dir=&occ= first&part=1&cid=272304 [Accessed 29 August 2018].803 Online: https://eur-lex.europa.eu/legal-content/EN/TXT/HTML/?uri=CELEX:62012CJ0295&rid=1 [Accessed 29 August 2018].804 O’Donoghue, R. & Padilla, A. (2006) The Law and Economics of Article 82 EC. Hart Publishing, Oxford and Portland, 2006. Chapter 5, p.321805 O’Donoghue, R. & Padilla, A. (2006) The Law and Economics of Article 82 EC. Hart Publishing, Oxford and Portland, 2006. Chapter 5, p.321
January 2003. It was found that the difference between the sale prices of ADSL products intended for wholesale users and its own sales price for services offered to end-users was not sufficient to cover its downstream costs which it had to incur in order to distribute broadband services to its end-users.
618.2.2. Telefónica S.A. and Telefónica de Espaħa S:A:U: v European Commission803. The Court of Justice of the European Union upheld a decision made by the European Commission to fine Telefonica for abusing its dominance in the Spanish market by engaging in margin squeeze conduct. Similar to the TeliaSonera case, Telefonica had charged wholesale broadband access prices to downstream rivals in a way that it did not allow them to compete with Telefónica’s own downstream operations.
618.3. Other market conduct that affect telecommunications markets includes predatory pricing, excessive pricing and coordination. Predatory prices relates to a dominant firm engages in an exclusionary conduct by pricing below a relevant cost threshold such that it causes a smaller rival to exit a market or prevents a potential rival from entering a market804. Excessive pricing relates to an “exploitative abuse” by a dominant firm leveraging its market power by charging prices in excess of the economic value of a given product805. It results in a direct loss of social welfare. Coordination relates to an agreement or concerted practice between horizontal rivals not to compete by fixing the price of product,

184
allocating markets and collusive tendering806. Coordination therefore has the potential to yield monopoly prices as customers have agreed not to compete. Cases that hold elements of predation, excessive prices, coordination and other anti-competitive conduct are as follows:
618.3.1. The Competition Commission of South Africa vs Telkom SOC Limited807. The Competition Commission and Telkom reached a Settlement Agreement which was ratified by the Competition Tribunal to functionally separate its wholesale and retail business following a number of complaints by internet service providers. The main allegation was that Telkom engaged in exclusionary conduct by engaging in margin squeeze which involved elements of charging excessive prices to customers for some services; refusing to give competitors access to an essential facility when it is economical feasible to do so; and selling services by forcing the buyer to accept a condition unrelated to the contract (i.e. tying)808.
618.3.2. MCI Communications Corp. v.American Telephone & Telegraph Co809. MCI was rewarded damages against AT&T after alleging that MCI engaged in various forms of anticompetitive conduct including predatory pricing, denial of interconnections, and unlawful tying810.
618.3.3. European Commission vs Telefonica and Portugal Telecom. The EC fined both
806 See Competition Act, 1998 no.89. Section 4(1). 807 Case number: 016865.808 Online: http://www.compcom.co.za/wp-content/uploads/2014/09/Commission-reaches-settlement-agreement-with-Telkom.pdf [Accessed 29 August 2018].809 Online: https://supreme.justia.com/cases/federal/us/512/218/ [Accessed 29 August 2018]810 Online: https://law.justia.com/cases/federal/appellate-courts/F2/708/1081/330445/ [Accessed 29 August 2018].811 Case AT.39839.812 Jamison, M. (2012) Methods for Increasing Competition in Telecommunications Markets. Public Utility Research Center, University of Florida, p. 48813 BEREC (no date) Common Position on Best Practice in Remedies on the Market for Wholesale Broadband Access, BoR (12) 128814 OECD (2011) Report on Experiences with Structural Separation. OECD Reports, p. 9-10815 OECD (2011) Report on Experiences with Structural Separation. OECD Reports, p. 9-10816 OECD (2011) Report on Experiences with Structural Separation. OECD Reports, p. 9-10
Telefonica and Portugal Telecom for coordinating a “non-compete” agreement in a Stock Purchase Agreement entered into by these companies in relation to the acquisition by Telefónica of sole control over the Brazilian mobile services operator, Vivo Participações811.
10.3. Common remedies to address competition issues
619. Over and above regulating market conduct through antitrust enforcement, competition issues can be remedied through certain interventions whether in the context of a remedy in competition law setting or by a regulator. The purpose of such remedies is to create market outcomes such that “prices, output, service quality, service innovation, and the like are closer to what we would experience were markets fully competitive812”. We discuss the following categories of remedies that are common in many jurisdictions: structural and functional separation, network sharing, and regulating wholesale access to telecommunications813.
10.3.1. Structural and functional separation
620. In regulated infrastructure industries, “structural separation typically divides a formerly integrated company into competitive and non-competitive parts. The crux of separation is not merely a wholesale/retail divide; rather, the objective is to isolate only those assets that cannot be replicated814. The OECD notes that separation typically takes the form of partial separation such as accounting separation or functional separation (operational separation) or structural separation which implies a change of ownership.815 Stronger remedies such as structural separation are intended to change the incentives of a firm whereas behavioural remedies are intended to change specific firm behaviour with various forms of functional separation achieving an outcome in between816.

185
Structural remedies can range from weak (e.g. accounting separation) to strong (change in ownership). Cave (2006)817 notes that there are six degrees of functional separation, based on the relative strength of its effectiveness, ranging from creation of a wholesale division; virtual separation; business separation; business separation with localised incentives; business separation with separate governance arrangements; and legal separation involving separate legal entities under the same ownership.
621. A number of countries have experienced functional separation in their telecommunications market including Australia, Italy, New Zealand, UK, Italy818 and South Africa amongst others. Furthermore, several OECD countries have structural remedy measures under national law specifically for telecommunications819. The USA experienced structural separation when AT&T relinquished its control over the Bell Operating Companies in 1982. This separation resulted in AT&T becoming the official service provider for long distance telephone calls, whereas independent Bell Operating Companies became the regional supplier of telephone calls820.
10.3.2. Network sharing
622. The EC argues that network sharing can lead to more sustainable market competition and can be effective in reducing rivals costs (in the case of co-location). It notes that through “private-private partnerships i.e. co-investment or network sharing, can help to de-risk infrastructure investments and lead to more sustainable market competition which is not so dependent on regulation – a sort of infrastructure-based competition on a single network and co-location can improve onto issues pertaining to investment in infrastructure and reducing investment costs for rivals821”. Network sharing takes on various forms sharing infrastructure including site sharing, mast (tower) sharing, RAN sharing, network roaming
817 Cave, M. (2006) Six Degrees of Separation: Operation Separation as a Remedy in European Telecommunications Regulation. 64 Communications and Strategies (4th quarter 2006), p. 1- 15818 OECD (2011) Report on Experiences with Structural Separation. OECD Reports, p. 68-84819 OECD (2011) Report on Experiences with Structural Separation. OECD Reports, p. 17820 Online:https://web.archive.org/web/20090112213916/http://www.celtnet.org.uk:80/telecos/AT&T-Bell-4.php [Accessed 29 August 2018]821 European Commission, (2016) Connected Continent for a Future-Proof Europe. EPSC Strategic Notes, Issue 19, 25 July 216, p. 5822 GSMA (no date) Mobile Infrastructure Sharing, p.12823 Co-location is the co-existence of radio transmission and reception equipment at sites controlled by other providers. (New Zealand Commerce Commission, (2006) A Review of Cellular Mobile Market Entry Issues, 10 October 2006, p. 32 824 GSMA (no date) Mobile Infrastructure Sharing, p.12825 GSMA (no date) Mobile Infrastructure Sharing, p.20826 GSMA (no date) Mobile Infrastructure Sharing, p.20827 BEREC (no date) Common Position on Best Practice in Remedies on the Market for Wholesale Broadband Access, BoR (12) 128, p.6
and core network sharing822. Site sharing, involving the co-location of sites823, is perhaps the easiest and most commonly implemented form of sharing824.
623. Network sharing is increasingly being favoured by policy makers in the EU. The EU has consistently ruled in favour of permitting passive network sharing and national roaming under the caveat that competition rules are respected825. The GSMA lists several positive outcomes that are derived from network sharing which include: optimisation of scarce resources and positive environmental impacts; decreases in the duplication of investment, and reducing capital and operational expenditure; positive incentives to roll out into underserved areas; improved quality of service, particularly in congested areas; product and technological innovation as operators compete on service differentiation; increased consumer choice as entry and expansion become easier; and reductions in wholesale and retail prices for mobile services826. As such regulation is advocated for some aspects of network sharing. For instance, the Body of European Regulators for Electronic Communications (“BEREC”) advocates that national regulators should impose obligations regarding the provision of co-location on a cost-oriented basis under clear rules and terms827.
10.3.3. Remedies most commonly used in wholesale markets
624. As previously discussed, access to wholesale markets on fair and non-discriminatory terms is a pertinent driver of competition in telecommunications markets. The following sub-section looks at remedies in that are commonly applied to wholesale telecommunications markets including access and interconnection; transparency; non-discrimination, accounting separation and price control.

186
10.3.4. Access to wholesale markets
625. Remedies pertaining to access can be facilitated by regulatory intervention and “can reduce barriers to entry by reducing sunk costs that an entrant may need to incur, providing on an economical basis the essential resources that are needed to provide service, reducing the need to raise financial capital and improve cash flows, overcoming exclusive rights to specific technologies, and diminishing the scale and scope economies that an entrant may need to achieve to be commercially viable”828. For instance, mandating the unbundling of networks have been shown to increase entry829. Furthermore, “the lack of availability of wholesale access on reasonable terms may constrain access seekers from entering the mobile services market and providing nationwide coverage”830. Regulators, such as BEREC, have advocated best practice in remedies that deal with wholesale broadband access. For instance, BEREC notes that national regulators should ensure regulations that assure “reasonable certainty of ongoing access on reasonable terms in order to give competitors confidence to enter the market831”. Furthermore, BEREC notes that operators with substantial market power “may have an incentive to deny access by either charging excessive prices and/or delaying development/implementation of new products and services that are feasible and reasonable832”. To remedy this BEREC advocate that national regulators impose remedies on the ladder of investment principle833. In addition BEREC advocates infrastructure competition at the deepest level to reduce barriers to entry834.
10.3.5. National roaming
626. There are seven broad motives for MNOs to conclude network sharing agreements of any sort:
626.1. Cost savings
626.2. Efficient utilisation of capital and other resources
828 Jamison, M. (2012) Methods for Increasing Competition in Telecommunications Markets. Public Utility Research Center, University of Florida. p. 59829 Jamison, M. (2012) Methods for Increasing Competition in Telecommunications Markets. Public Utility Research Center, University of Florida, p. 59830 New Zealand Commerce Commission, (10 October 2006) A Review of Cellular Mobile Market Entry Issues, p.38831 BEREC (no dated) Common Position on Best Practice in Remedies on the Market for Wholesale Broadband Access, BoR (12) 128, p.3832 BEREC (no date) Common Position on Best Practice in Remedies on the Market for Wholesale Broadband Access, BoR (12) 128, p.3833 The ladder consists of access products at specific access points and wholesale products to reach these access points834 BEREC (no date) Common Position on Best Practice in Remedies on the Market for Wholesale Broadband Access, BoR (12) 128, p.3
626.3. Reduce time to market
626.4. Resilience
626.5. Extension of network coverage
626.6. Environmental factors
627. In the context of an oligopolistic market which characterises mobile telephony, independence of MNOs is important to maintain effective competition. Network cooperation of any form necessarily weakens the independence of MNOs and can weaken competition between them. However, in the absence of a full-on merger, network sharing can be viewed as a more competitive alternative that results in similar efficiencies with a greater likelihood that these efficiencies will be passed onto consumers.
628. The relevant competition framework for mobile telephony primarily rests on infrastructure competition. The operation of infrastructure requires strong investment incentives to build and operate networks. The general theoretic consensus is that network sharing reduces the incentive to invest in mobile infrastructure. Theoretical models demonstrate that under unconstrained roaming, MNOs will avoid duplicating infrastructure and maximise rents from roaming. Furthermore, when operators are symmetric, only colluding operators will have an incentive to conduct roaming agreements.
629. However, these models are very far away from the market scenarios in which sharing occurs. One such scenario is the case of asymmetric market entry where roaming can generate investment incentives. First-movers are given the opportunity to recoup the costs of investment by having exclusive access to the market, which allows them to extract profits above competitive levels. Second movers do not have exclusive access to the market and cannot necessarily self-finance investment through supernormal profits. As previously discussed, roaming allows a second mover to provide a national service while its network has not yet been fully developed. While this does

187
not necessarily completely compensate for the competitive advantage of a first mover, it does allow effective competition to be achieved sooner. The second-mover can generate a higher cash flow than it would have been otherwise able to generate while still building a network, which gives the operator a higher self-financing leeway for its own network investment and generates positive investment incentives. This can be further incentivised from a regulatory perspective by introducing limits to the availability of roaming over time.
630. Whether roaming can be pro-competitive is highly dependent on which operators enter into roaming agreements. In a market with three operators, a roaming agreement between the dominant operator and the second largest operator will be detrimental to the third operator and result in overall weaker competition.
631. As far as other policy objectives are concerned, roaming improves network coverage and saves on environmental resources that would otherwise be depleted due to network duplication. The lower costs that can be achieved with roaming can result in lower end-user prices and increased service quality depending on the competition dynamics within a market and the regulatory framework.
632. Furthermore, whether roaming has a net benefit is also dependent on the rate that the second-mover operator pays for the service. In a symmetric setting, where reciprocal roaming occurs, both operators will have an incentive, in the absence of regulation, to enjoy extra rents from roaming.835 The degree to which these operators appropriate these rents are affected by the relative bargaining power of the operators.836 In an asymmetric setting, where there is unidirectional roaming, the operator providing the roaming service will have an incentive to appropriate rents from the roaming operator and the bargaining power is tempered solely by the availability of outside options for the provision of roaming.
633. An efficient price will be equal to the marginal cost to the host operator’s network of providing the roaming service. This is equal to the incremental
835 Fabrizi, S & Wertlen, B (2003) Roaming in the Mobile Internet: when coverage sharing agreements call for regulation. DFAEII Working Papers 2003-09, University of the Basque Country - Department of Foundations of Economic Analysis II. [Online]. Available at: https://core.ac.uk/download/pdf/6440789.pdf [Last accessed on 3 April 2019]836 Fabrizi, S & Wertlen, B (2003) Roaming in the Mobile Internet: when coverage sharing agreements call for regulation. DFAEII Working Papers 2003-09, University of the Basque Country - Department of Foundations of Economic Analysis II. [Online]. Available at: https://core.ac.uk/download/pdf/6440789.pdf [Last accessed on 3 April 2019]837 Sandbach, J. (2009), National Roaming Pricing in Mobile Networks, in Telecommunication Markets: Drivers and Impediments by Brigitte Preissl, Justus Haucap and Peter Curwen (eds). 249-264, Physica-Verlag HD.
cost of the additional traffic generated by the roaming operator’s network traffic on the host’s operator’s network. This price will be lower than the incremental cost of the same traffic were it to be hosted on the roaming operator’s own network. This is because the roaming operator would have had to expand its network in order to host this traffic, whereas the host operator would either expand existing capacity or simply utilise existing capacity.
634. The rate that is set in a roaming agreement has an effect on the incentives to invest in infrastructure at the upstream. A new operator faces a choice in each location that it decides to operator in to either roam on an incumbent network or build its own network. When the price of roaming on another network is lower than the incremental cost of expanding its network, the new operator will opt to roam rather than invest in network infrastructure and operations at the upstream level. This would result in the complete investment burden of network infrastructure lying with the host network in the areas where the new operator chooses to roam on the host operator’s network. If the roaming operator only chooses to roam in more rural areas and self-build in urban areas, then the roaming operator will be at a cost advantage compared to the host operator, as the cost of investing in infrastructure is high compared to the incremental cost of expanding network capacity in rural areas.837
635. However, even if the price is set at the average cost of traffic on the host operator’s network, the new operator still has an incentive to focus network investment in locations where the incremental cost of network roll-out is lower than the average cost of traffic on the host operator’s network. This is likely to occur in locations with a high population density, such as urban areas. In all other areas, the new operator will opt to roam on the host operator’s network. As such, the new operator will effectively achieve a lower average cost of traffic than the host operator by “cream skimming” lower cost areas for network infrastructure development, while roaming in the rest of the areas.

188
636. The Efficient Component Pricing Rule (“ECPR”) sets a roaming price that will leave the host’s profits unaltered by the roaming agreement. Thus, the roaming price will equal the incremental cost of the roaming traffic on the host network plus the host operator’s foregone profit of not utilising this capacity for its own traffic. As such, only an equally or more efficient new entrant than the host operator would be able to successfully compete in the market. In a market with significant scale economies, this can be an unreasonable expectation of a new entrant that also suffers second-mover disadvantages. This method does not consider whether the existing retail prices are efficient and there is no incentive to reduce retail prices as a result of increased competition due to the anchoring of the roaming price to the retail price.
637. The competitive equality criterion, however, sets a roaming price that will only allow an efficient new entrant to achieve the same profitability as the first mover operator. It does so by considering the geographical cost structure of the host operator. As the new entrant expands its network and roaming traffic shifts further to more remote areas, the unit cost will rise. Thus, the new entrant will be incentivised to consistently self-build even while roaming as the roaming price rises to account for costlier areas. However, this presumes that the duplication of network infrastructure is desirable. Theoretical models suggest that non-cooperative investments in the wholesale market, operators may even overinvest.838 Furthermore, much like the ECPR price, the competitive equality criterion requires that the second mover operator be as or more efficient than the first mover operator at the retail level.
10.3.6. Access pricing and non-discrimination
638. Wholesale access remedies can take the form of provision of services on fair and non-
838 Stühmeier, T. (2012) Roaming and Investments in the Mobile Internet. Heinrich‐Heine‐Universität Düsseldorf, Department of Economics, Düsseldorf Institute for Competition Economics (DICE), Discussion Paper [online]. Available at: https://www.econstor.eu/bitstream/10419/56463/1/046_Stuehmeier.pdf [Last viewed on 1 April 2019]839 Jamison, M. (2012) Methods for Increasing Competition in Telecommunications Markets. Public Utility Research Center, University of Florida. p. 59840 Lee, D. and Lee, D. (2006) Estimating consumer surplus in the mobile telecommunications market: The case of Korea”. Telecommunications Policy 30 (2006) 605–621841 BEREC (no date) Common Position on Best Practice in Remedies on the Market for Wholesale Broadband Access”, BoR (12) 128, p.18842 BEREC (no date) Common Position on Best Practice in Remedies on the Market for Wholesale Broadband Access”, BoR (12) 128, p.18843 BEREC (no date) Common Position on Best Practice in Remedies on the Market for Wholesale Broadband Access”, BoR (12) 128, p.18844 BEREC (no date) Common Position on Best Practice in Remedies on the Market for Wholesale Broadband Access”, BoR (12) 128, p.18845 BEREC (no date) Common Position on Best Practice in Remedies on the Market for Wholesale Broadband Access”, BoR (12) 128, p.19846 BEREC (no date) Common Position on Best Practice in Remedies on the Market for Wholesale Broadband Access”, BoR (12) 128, p.19847 Jamison (2012) Methods for Increasing Competition in Telecommunications Markets. Public Utility Research Center, University of Florida, p.62
discriminatory terms and prices839. Two areas of focus would be regulating access prices and offering wholesale services on non-discriminatory terms.
638.1. Before engaging in access price regulation, consideration needs to be given to how this might affect incentives to invest. For instance, Lee and Lee (2006) demonstrates how facility-based competition brings lower price and increases price as opposed to government controlled prices and regulated entry840. Furthermore, when considering access price regulation, national regulators need to incentivise both efficient investment and sustainable competition841. BEREC advocates that wholesale access prices be fair and transparent such that rivals can compete with operators having substantial market power on a level playing field842. In some instances, national regulators should require explicit pricing obligations on operators with significant market power843. BEREC notes that “Price control obligations can be implemented in different degrees, ranging from a requirement for prices to be cost-oriented and subject to rate approval through to specific charge controls such as a price cap, retail minus etc.844”. Furthermore, the national regulator should determine the appropriate costing methodology in setting wholesale access prices845. Lastly, the effective price granted by the operators with significant market power should not be discriminatory and should be offered to all operators that meet the established conditions846.
638.2.“Non-discriminatory access to essential facilities is important for the development of competition.847” However, operators with significant market power have

189
an incentive to discriminate in favour of their own downstream arms848. As such wholesale access may not be of reasonable and comparable quality with those provided by operators to their own downstream businesses. Therefore, national regulators should impose a general obligation of non-discrimination849. This can be done by requiring operators with significant market power to enter Service Level Agreements (“SLAs”) that have a clearly defined level of service850. SLAs should cover specific service areas and should be compiled in such a way that it ensures maximum transparency and comparability of the terms provided by operators to alternative operators and their downstream arm851. These SLAs could be made available to all relevant wholesale customers852.
10.3.7. Transparency
639. “Many jurisdictions require that telecommunications prices be made publically available”853 which can foster more competition854. For instance, the New Zealand Ministry of Economic Development “concluded that disclosure of agreements fosters competition by informing the market about the terms and conditions for access to the incumbent’s network”855. Also one of the recommendations flowing from the Japanese market inquiry into mobile telecommunications recommended that MNOs should improve transparency and impartiality when setting fees by engaging in routine discussions with telecommunications experts856. BEREC notes that operators with significant market power generally do not provide sufficient clarity or transparency on the terms and conditions of access. Furthermore, transparency concerns
848 BEREC (no date) Common Position on Best Practice in Remedies on the Market for Wholesale Broadband Access”, BoR (12) 128, p.4849 BEREC (no date) Common Position on Best Practice in Remedies on the Market for Wholesale Broadband Access”, BoR (12) 128, p.7850 BEREC (no date) Common Position on Best Practice in Remedies on the Market for Wholesale Broadband Access”, BoR (12) 128, p.13851 BEREC (no date) Common Position on Best Practice in Remedies on the Market for Wholesale Broadband Access”, BoR (12) 128, p.13852 BEREC (no date) Common Position on Best Practice in Remedies on the Market for Wholesale Broadband Access”, BoR (12) 128, p.13853 Jamison (2012) Methods for Increasing Competition in Telecommunications Markets. Public Utility Research Center, University of Florida, p.57854 Jamison (2012) Methods for Increasing Competition in Telecommunications Markets. Public Utility Research Center, University of Florida, p.57855 Jamison (2012) Methods for Increasing Competition in Telecommunications Markets. Public Utility Research Center, University of Florida, p.57856 Global Competition Review (2018): Japan scrutinizes mobile market. [online]. https://globalcompetitionreview.com/article/1171189/ japan-scrutinises-mobile-markets?gator_td=B61RwyILbOJOr1Oq1Cqcr6Y26lZvn9o6juQNmmFN%2bFaJtI%2bp4oB zJDhLMxJjbuJ%2f1mtGmLo3fKXmYk50oDvGfVe9hCiuzttcAgExpiUGW4GQQLR8tekajbd05elpwwDPmnRRqCEQRDj%2fy7p1HVx7f bAS%2bJeleqrRC8k2dKgE148o%2f%2fe2cHNLx4OIYZm6mvLTINzti4pcSEEordsHWC%2bt3g24UpzNxZxQB2da9Ic8jIsuMAPG1JJTING MPhtl8%2bsU857 BEREC (no date) Common Position on Best Practice in Remedies on the Market for Wholesale Broadband Access”, BoR (12) 128, p.10858 BEREC (no date) Common Position on Best Practice in Remedies on the Market for Wholesale Broadband Access”, BoR (12) 128, p.11859 The most severe is ownership separation, followed by structural separation, then operational or functional separation.860 Jamison (2012) Methods for Increasing Competition in Telecommunications Markets. Public Utility Research Center, University of Florida, p.64861 Jamison (2012) Methods for Increasing Competition in Telecommunications Markets. Public Utility Research Center, University of Florida, p.66862 Jamison (2012) Methods for Increasing Competition in Telecommunications Markets. Public Utility Research Center, University of Florida, p.66
arise where operators have preferential access to certain key information compared to their rivals which give them a strategic advantage. As such the BEREC advocates that national regulators require operators with significant market power to “provide clarity of terms and conditions of access (including those relating to relevant ancillary services) by publishing a Reference Offer (RO)857” with key elements being approved by the national regulator. Furthermore, BEREC advocates that national regulators should require operators with significant market power “to make certain information available to all operators (publicly or on request) within a reasonable period of time. Such information should include the result of Key Performance Indicators (KPI) measurements … and planned future changes to the SMP operator’s network architecture as far as they are relevant to network access (e. g. future points of access) and which might affect the provision of services”858.
10.3.8. Accounting separation
640. There are four basic approaches859 to separating competitive or potentially competitive services from apparently non-competitive operations in which accounting separation is the least severe form860. Accounting separation “is an attempt to control cross-subsidization by separating an operator’s accounting costs and revenues for non-competitive operations from those that are for competitive operations”861 e.g. having separate accounts for wholesale and retail business862. This can make the ability of screening anticompetitive conduct such as margin squeeze easier to determine as separate accounts allows more transparency regarding possible cross-subsidization.

190
641. In conducting an inquiry into data services and the potential drivers of prices for data services, an important element to consider is the policy, legislative and regulatory environment in which the telecommunications sector operates. Policy, legislation and regulation are likely to impact almost every facet of the sector more broadly, and therefore data and other related services more specifically. Legislation and regulation directly impacts the behaviour of firms and consumers in the market. In terms of the framework for the assessment in terms of this Inquiry, legislation and regulation can impact both the level and nature of competition between market players, and the costs faced by players in the industry. Thus it is essential to consider the legislative and regulatory environment and also, where necessary, the extent to which this environment contributes to the attainment of policy goals.
642. The importance of understanding the legislative and regulatory environment within the sector is further underpinned by the nature of recommendations called for by the ToR of the Inquiry. While there is room for other types of recommendations, the ToR specifically states that recommendations may be to government (and thus of a legislative nature where some of these functions lie with the government) or to the sector regulator (and thus of a regulatory nature). In terms of effecting change in the sector to satisfy the objectives of the Inquiry in terms of the ToR, legislative and regulatory changes will be essential.
643. This appendix does not serve as a complete review or assessment of the policy, legislative and regulatory environment in South Africa. The telecommunications sector is complex and thus the relevant legislation and regulation is extensive and far-reaching. This appendix, and the Inquiry more broadly, considers only those aspects of the environment that may be directly relevant to the question of data prices in South
863 DTPS.gov.za (2018) Constitutional Mandates, [Online] Available at: https://www.dtps.gov.za/index.php?option=com_content&view= article&id=12&Itemid=165 [Accessed 18 June 2018]
Africa and the assessment thereof in terms of the ToR.
644. The sector is also an ever-changing area, driven by technological developments and innovations that could not always be foreseen by law makers or regulators. There is thus a constant flux in the environment, and thus the assessment also takes account of legislative and regulatory changes that could potentially be effected.
645. Therefore, this appendix provides an overview of the relevant policy, legislative and regulatory features of the sector and the relevant aspects thereof. Firstly, the sector’s important present-day policy, legislation and regulations relevant to the Inquiry are discussed. Secondly, the key role players within the telecommunications sector are discussed as well as their respective powers. Finally, the latest policy, legislative and regulatory developments in South Africa are addressed within their relevance to the Inquiry.
11.1. Policy, legislation and regulations
646. South Africa’s telecommunications industry is founded by key policy, legislation and regulation which govern the sector. These sections are discussed respectively below.
11.1.1. Policy
647. The South African Government has implemented various policies and development plans in which it emphasises key policy objectives and goals for the broader ICT sector. In order to achieve the country’s socio-development goals, core ICT policies are adopted with the aim to support the Government’s vision of “robust, reliable, affordable and secure ICT services”.863 The sector’s key policy objectives focus mainly on the provision of high-speed and affordable broadband access via the efficient use of underlying infrastructure, which will contribute
11. APPENDIX C: POLICY, LEGISLATIVE AND REGULATORY ENVIRONMENT

191
to economic growth.864 Below we discuss two policies relevant to the Inquiry’s work. These are the NDP and the National Broadband Policy, SA Connect.
The National Development Plan
648. The NDP865, published in 2011, represents an important policy document and long term development plan for South Africa. The NDP has the broad aim, for the country as a whole, of eliminating poverty and reducing inequality by 2030, with these goals being realised by an “active citizenry”, the growth of an inclusive economy, the need to improve capabilities and the capacity of the state, as well as the promotion of leadership and partnerships throughout society.866 Within the NDP’s wide-ranging framework, the milestone of making high-speed broadband internet universally available at competitive prices reflects the relevance of the Inquiry into the costs of data services in South Africa.867
649. The NDP speaks specifically to the ICT sector where it defines the context for ICT policy and its contribution to the country’s development. The NDP specifically identifies the high cost of telecommunications as a major hindrance to development. According to the NDP, this high cost stems from inefficient infrastructure provision and a lack of affordable and competitive prices. With respect to broadband services, the NDP focuses on both affordability and access goals. National access to broadband services, at competitive prices, is emphasized throughout the NDP and its stated goal by 2030 is to “… make high-speed broadband Internet universally available at competitive prices” (our emphasis).868
The National Broadband Policy: “SA Connect”
650. The broadband goals set out in the NDP are expressed further within South Africa’s National Broadband Policy, SA Connect.869.
864 ICASA (16 February 2018) Discussion document. Appendix 2: Government Policy Objectives. Government Gazette No. 41446865 National Planning Commission (2011) National Development Plan 2030: Our Future- make it work’ (“NDP”). p. 190866 National Planning Commission (2011) National Development Plan 2030: Our Future- make it work’ (“NDP”) Executive Summary. p. 14867 National Planning Commission (2011) National Development Plan 2030: Our Future- make it work’ (“NDP”) Executive Summary. p. 24868 National Planning Commission (2011) National Development Plan 2030: Our Future- make it work’ (“NDP”), p. 34869 Department of Communications (20 November 2013) South Africa Connect: Creating Opportunities, Ensuring Inclusion- South Africa’s Broadband Policy.870 The term “broadband”, as defined in SA Connect, is “…an ecosystem of high capacity, high speed and high quality electronic networks, services, applications and content that enhances the variety, uses and value of information and communications for different types of users.” Section 7, p. 18871 DOC (20 November 2013) South Africa Connect: Creating Opportunities, Ensuring Inclusion- South Africa’s Broadband Policy, p. 3872 DOC (20 November 2013) South Africa Connect: Creating Opportunities, Ensuring Inclusion- South Africa’s Broadband Policy, p. 13873 SA Connect policy uses the Statistics SA Census 2012 measure of internet access, defined as “households where at least one member had access to or used the Internet either at home, work, place of study or Internet café”.874 DOC (20 November 2013) South Africa Connect: Creating Opportunities, Ensuring Inclusion- South Africa’s Broadband Policy, p. 18
The challenge of broadband870 in South Africa is the lack of available, affordable and reliable communication services which characterise modern economies.871 The policy is centred on four pillars which aim to close the gap between the current status of broadband in South Africa and the seamless broadband network envisioned by 2030. These pillars include ‘digital readiness’, ‘digital development’, ‘digital future’ and ‘digital opportunity’, with the area of ‘digital readiness’ covering market competition and goals to remove policies that constrain competitiveness. SA Connect highlights the context of high communication costs in South Africa, as well as how this impedes the country’s competitiveness and development. The stated objective of SA Connect is “affordable broadband available nationally to meet the diverse needs of public and private sector users both formal and informal, consumers and citizens”872 (emphasis added).
651. In accordance with the broader vision of the NDP, the 2020 Vision of the policy includes targets for affordability of broadband. In particular, it requires that by 2020, 100% of South Africans will have access to broadband services at 2.5% or less of the population’s average monthly income. The policy further identifies specific broadband targets to meet its overall objective of high quality, affordable and universally available broadband. In the context of South Africa, a key issue is the user experience of broadband services. The broadband targets are therefore framed primarily according to “Broadband access in Mbps user experience” where “broadband access” is defined according to a household measure (and not according to individual use) and Megabits per second (Mbps) refers to the minimum average broadband speed.873
652. The policy’s initial target is to offer 90% broadband access at a minimum average speed of 5Mbps by 2020, and 50% broadband access at a minimum average speed of 100Mbps.874 In

192
addition to the policy target for 2020, SA Connect aims to offer 100% broadband access by 2030 at a minimum average speed of 10Mbps, and 80% access at 100Mbps by the same year.875 The policy’s staggered percentages towards achieving universal access by 2030 also include access and speed targets for public sector facilities, in addition to those for schools and health facilities.876 The provided minimum average targets listed in the broadband policy are subject to annual reviews, and could be supplemented by ICASA with quality of service standards.877
The National Integrated ICT Policy White Paper
653. Published in October 2016, and subsequently approved by Cabinet, the ICT White Paper878 details the overarching policy framework for the economy’s transformation into an inclusive and innovative digital and knowledge society.879 As an extension of the strategies within the NDP and SA Connect, the White Paper contains interventions to reinforce fair competition and facilitate innovation in the converged sector environment, as well as policies to protect the open internet and address the digital divide. The role of fair competition and universal service and access is emphasized in the framework.
654. The White Paper highlights the broad policy objective as the creation of “A people-centered, development-orientated and inclusive digital society”.880 This objective has been divided into the following sub-objectives, as relevant to the Inquiry: “Equality: All South Africans must have affordable access to communications infrastructure and services and the capacity and means to access, create and distribute information, applications and content in the language of their choice. Accessibility: Services, devices, infrastructure and content must be accessible for all sectors of the population, including persons with disabilities, so that all can equally enjoy and benefit from communication services… …Innovation and Competition: Innovation, fair competition and equitable treatment
875 DOC (20 November 2013) South Africa Connect: Creating Opportunities, Ensuring Inclusion- South Africa’s Broadband Policy, p. 18876 DOC (20 November 2013) South Africa Connect: Creating Opportunities, Ensuring Inclusion- South Africa’s Broadband Policy, p. 19877 DOC (20 November 2013) South Africa Connect: Creating Opportunities, Ensuring Inclusion- South Africa’s Broadband Policy, p. 19878 Released on October 2016. Government Gazette no. 40325.879 DTPS (3 October 2016) National Integrated ICT Policy White Paper, p. 3, p. 1.2880 DTPS (28 September 2016) National Integrated ICT Policy White Paper, p. 11881 Pater, D. & Hurst, R (2017) National Integrated ICT Policy White Paper- Africa Analysis View.882 Fuesgen, I. (2017) EU Chamber of Commerce and Industry in Southern Africa- Policy and Regulatory Alert: Summary on the White Paper.883 Net neutrality is the principle of treating all data equally in terms of user, content, platform, website, attached equipment or communication mode- ITU. https://www.itu.int/en/wcit-12/Documents/WCIT-background-brief11.pdf
of all role players must be facilitated to ensure a range of quality services are available to end-users and audiences… …Open Access: Regulatory intervention should wherever possible be based on open access principles to ensure maximised, efficient and full-leveraged use of available infrastructure and services, through encouraging infrastructure sharing, spectrum re-farming, optimal interconnections, balanced with the need for fair returns on investment.” (emphasis added)
655. These policy objectives show a clear alignment to consumer welfare as a policy focus within the vision of a prosperous, integrated sector. The affordability of communications services in South Africa, along with the recognition for enhanced market competitiveness, is a recurring policy theme within which the Inquiry establishes its significance and relevance.
656. In line with these policy objectives, the White paper proposes requirements for the sector in order to realign key policies with the country’s development goals. One of the main requirements concern the creation of a national open access wholesale network (WOAN) using the current high-demand spectrum.881 The WOAN, as described by the DTPS, would form from a public-private sector-owned and managed consortium, and would consist of all entities interested in participating. WOAN participants could include ECS and ECNS license holders, infrastructure companies, ISPs, OTT players, MVNO’s, private equity investors as well as small, medium and micro-enterprises (SMME’s).882
657. The policy’s requirements further include: the creation of an open access environment that provides access to essential facilities, infrastructure sharing, and wholesale/retail separation; the introduction of net neutrality883; the facilitation of rapid infrastructure deployment through the reduction of red tape; the creation of a separate regulatory authority for the broadcasting market; and the creation of a new entity to manage the Universal Service

193
Fund (instead of this function residing with ICASA).884
11.1.2. Legislation
658. This section provides an overview of the key relevant legislation for the Inquiry and the relevant elements thereof.
The Electronic Communications Act (as amended)
659. The primary legislation regulating the electronic communications industry in South Africa is the ECA. In contrast to the preceding Telecommunications Act of 1996, the ECA sought to move the sector from what could be described as a more protectionist state, in that it protected the incumbent fixed line operator, to one governed by pro-competitive legislation.885 As convergence886 legislation, the ECA promotes the merging of the broadcasting and telecommunications sectors and provides the legal framework for convergence of these sectors.887 The primary object of the Act is to “provide for the regulation of electronic communications in the Republic in the public interest”.888 The ECA covers the main issues of licensing, access, infrastructure rights, frequency management and assignment, markets and competition as well as universal service within the sector.
660. A broad interpretation of the objects of the Act889 relate to consumer welfare as the act necessitates the provision for accessible, affordable and quality communications services for all South Africans. These objects emphasise the relevance and importance of the Inquiry’s focus on the question of data prices and consumer affordability in South Africa and the assessment of the state of competition in the market, according to the ToR. The relevant objects of the Act, as referred to, are:
884 Pater, D. & Hurst, R. (2017) National Integrated ICT Policy White Paper- Africa Analysis View.885 Ellipsis (2012) Overview of electronic communications regulation in South Africa. [Online]. Available at: http://www.ellipsis.co.za/wp- content/uploads/2012/03/Overview-of-Electronic-Communications-Regulation-in-South-Africa-2012.pdf [Accessed on 9 June 2018]886 Telecommunications Law in South Africa, by Lisa Thornton, defines convergence in the communication industry to apply to “the blurring of the lines between information services, the technologies or media used to carry services and the entities that provide services or technologies” (p. 25)887 ICASA website- Constitutional Mandates, The Electronic Communications Act, No.36 of 2005 (ECA) as amended.888 The Electronic Communications Act 36 of 2005, Government Gazette No. 28743. 18 April 2006. Section 2.889 The Electronic Communications Act 36 of 2005, Government Gazette No. 28743. 18 April 2006. Section 2.890 Ellipsis (2014) Overview of the ECA Act 1 of 2014. [Online]. Available at: http://www.ellipsis.co.za/wp-content/uploads/2014/04/Over view-of-the-Electronic-Communications-Amendment-Act-1-of-2014.pdf [Accessed on 13 March 2018]891 Irvine, H. & Granville, L. (2014) Who to Call? - Concurrent Competition Jurisdiction in the South African Electronic Communications Sector (Working draft). [Online]. Available at: http://webcache.googleusercontent.com/search?q=cache:QjN8MeivGCMJ:www.compcom. co.za/wp-content/uploads/2014/09/CONFERENCE-PAPER-WORKING-DRAFT-140809-Irvine-and-Granville.doc+&cd=1&hl=en&ct= clnk&gl=za [Accessed on 13 March 2018]892 The ICASA Act 13 of 2000. Government Gazette No.893 The ICASA Amendment Act 2 of 2014, Government Gazette No. 37537, 7 April 2014.
“…(c) promote the universal provision of electronic communications networks and electronic communications service and connectivity for all;… (f) promote competition within the ICT sector; (g) promote an environment of open, fair and non-discriminatory access to broadcasting services, electronic communication networks and to electronic communication services;… (m) ensure the provision of a variety of quality electronic communications services at reasonable prices; (n) promote the interests of consumers with regard to the price, quality and the variety of electronic communications services…” (emphasis added)
661. The Electronic Communications Amendment Act 1 of 2014 (“the Amendment Act”) came into effect on 21 May 2014. The main objects of the Amendment Act, amongst others, were to align the Act with broad-based black economic empowerment initiatives, to refine licensing issues, to make further provisions towards ensuring effective competition and to remove regulatory bottlenecks in the industry.890 The amended ECA served to improve the licensing and service licensing framework in South Africa, as well as to clarify the role and importance of the Competition Act in its application to the electronic communications industry, and also emphasise the active role competition authorities should have in promoting and policing this sector.891
The ICASA Act (as amended)
662. The ICASA Act 13 of 2000 (“the ICASA Act”)892, as amended893, was created to establish the communications sector regulator, ICASA. The primary object of the ICASA Act is to “…establish an independent Authority which is to-
662.1. regulate broadcasting in the public interest and to ensure fairness and a

194
diversity of views broadly representing South African society, as required by section 192 of the Constitution;
662.2. regulate telecommunications in the public interest; and
662.3. achieve the objects contemplated in the underlying statutes.” (emphasis added)
663. The ICASA Act sets out the regulator’s functions, powers and duties conferred upon it. Under the ICASA Act, the above-stated objectives of the national regulator are aligned to the national policy focus on consumer interests and thereby aligned to the Inquiry’s focus on prices for data services in South Africa. In general, the policy and legislation concerning broadband services incorporates the recurrent goals of regulating for consumer and public interest, as well as consumer access and affordability, which emphasise a policy framework in which consumers (and all South Africans) are a priority.
664. In order to provide for further clarify on the powers and duties of the regulatory authority and to ensure accountability, the ICASA Amendment894 was published at the same time as the ECA Amendment Act (described above) which allowed for consistent legislation across the ICT sector.895
The Competition Act 89 of 1998
665. The Competition Act of 89 of 1998 legislates against anti-competitive practices such as collusion and cartels.896 Section 82 of the Competition Act includes the role of co-jurisdiction that the Competition Commission and Competition Tribunal play with ICASA in relation to competition matters within the electronic communications environment.897 As per the Competition Act, the Competition Commission is responsible for the “investigation, control and evaluation of restrictive practices, abuse of dominant position, and mergers”898.
666. The purpose of the Competition Act, which speaks well to the relevance of the Inquiry’s objectives, is “…to promote and maintain
894 The ICASA Amendment Act 2 of 2014, Government Gazette No. 37537, 7 April 2014.895 Ellipsis. Overview of the ICASA Amendment Act 2014, p. 1896 The Competition Act 89 of 1998.897 The Competition Act 89 of 1998. Section 82898 Competition Commission website (2018) Available at: http://www.compcom.co.za/ [Accessed on 29 June 2018]899 Memorandum of Agreement entered into between the Competition Commission and ICASA (para 1.1). Government Gazette No. 23857. 20 September 2002.900 Memorandum of Agreement entered into between the Competition Commission and ICASA (para 2.1). Government Gazette No. 23857. 20 September 2002.901 Fourie,H., Granville, L. and Theron,N. (2018) Regulatory ambiguity and policy uncertainty in South Africa’s telecommunications sector. ERSA working paper 729. [Online]. Available at: https://econrsa.org/system/files/publications/working_papers/working_paper_729.pdf [Accessed on 18 June 2018]
competition in the Republic in order-666.1. to promote the efficiency, adaptability
and development of the economy;666.2. to provide consumers with competitive
prices and product choices;666.3. to promote employment and advance
the social and economic welfare of South Africans;
666.4. to expand opportunities for South African participation in world markets and recognise the role of foreign competition in the Republic;
666.5. to ensure that small and medium-sized enterprises have an equitable opportunity to participate in the economy; and
666.6. to promote a greater spread of ownership, in particular to increase the ownership stakes of historically disadvantaged persons.” (emphasis added)
667. The above-mentioned objects of the Competition Act indicate its overarching goal to enhance and maximise consumer welfare by efficiently allocating resources, while furthering socio-economic objectives in South Africa. As an Inquiry initiated within the framework of South Africa competition law, it is necessary that the Inquiry fit within these objectives and support the broader aims of consumer welfare for all South Africans. The Inquiry’s relevance is particularly emphasised in Section 2(b) of the Competition Act, as the Inquiry deals with the question of data prices in South Africa.
668. The interactions between ICASA and the Competition Commission are governed by the Memorandum of Agreement (MoA)899, established in 2002. The agreement details which of the two bodies is responsible for certain matters, and how issues of jurisdiction overlap should be dealt with. The MoA states that ICASA retains jurisdiction over specific complaints related to telecommunications licences or legislation and broadcasting matters900, while the Competition Commission is to handle allegations of anti-competitive market conduct, such as a telecoms player abusing a dominant position or engaging in restrictive practices.901
195
11.1.3. Regulation
669. In order to achieve effective competition in South Africa’s telecommunications market, effective regulation for efficient and equitable delivery of communications services is required. The present-day sector regulations, relevant to the Inquiry, are briefly discussed in the sections below.
The ECA Regulations
670. The ECA came into force on 19 July 2006 to regulate electronic communications in South Africa. The effect of the ECA is that the 1996 Telecommunications Act and the majority of the 1999 Broadcasting Act were repealed and new licence categories were introduced for both broadcasting and electronic communications to facilitate the growing convergence both within and between these sectors. The ECA, as such, provides for the regulation and the convergence of electronic communications, their networks and the broadcasting services.
671. A detailed institutional framework is contained in the ECA, which includes the creation of the telecommunications regulatory authority (ICASA). It contains the regulations by ICASA, where the regulator may make regulations with regard to, amongst others, the control of radio frequency spectrum902, unfair competition, determining markets upon which pro-competitive conditions may be imposed and the ones that have ineffective competition903. The ECA’s legal framework for telecommunications in South Africa includes regulations for licensing, competition policy, quality service, interconnection, scarce resources management, universal service, tariffs regulation, penalties and sanctions, and dispute resolution.904 The ECA provisions for electronic communications licensing and fees, broadcasting and postal services and spectrum assignment and fees are briefly discussed below.
Electronic Communications licensing and fees
672. The ECA and the ICASA Act have established the mandate for ICASA to grant licences to electronic communications operators
902 The Electronic Communications Act 36 of 2005, Government Gazette No. 28743. 18 April 2006. Chapter 2 Section 4(1)(d).903 The Electronic Communications Act 36 of 2005, Government Gazette No. 28743. 18 April 2006. Chapter 10, Section 67 (1) to (5).904 World Bank (2008) Telecommunications- Laws, regulations and licences. [Online]. Available at: https://ppp.worldbank.org/public- private-partnership/sector/telecom/laws-regulations#south_africa [Accessed on 10 November 2018]905 ICASA website- Electronic Communication. Available at: https://www.icasa.org.za/pages/telecommunications [Accessed on 10 November 2018]906 ICASA website- About us. Available at: https://www.icasa.org.za/pages/about-us [Accessed on 10 November 2018]
and service providers, to monitor licensee compliance with licence terms and conditions, to develop regulations, to plan and manage radio frequency spectrum, and to protect consumers.905 ICASA issues both ECNS and ECS licences on Class and Individual bases. A Class ECNS (C-ECNS) licence is offered to operators working within a limited geographic area, around the size of a district or municipality. Commercial entities operating at a provincial or national level would apply to ICASA for an Individual ECNS licence (I-ECNS), only after ICASA receives a policy direction from the Minister of Communications. ICASA may then issue an ITA for all interested parties.
Broadcasting and postal services
673. South Africa’s ICT sector is linked to its broadcasting and postal components. The ECA therefore promotes convergence in the broadcasting, broadcasting signal distribution and telecommunications sectors, and provides the legal framework for convergence of these sectors. The ECA provides that ICASA develops regulations for the broadcasting industry, issues licences to service providers, plans and manages the radio frequency spectrum, and protects consumers against poor-quality services.906
674. In order to award and administer broadcasting licences, ICASA works within the framework of the following laws and regulations, as well as their amendments: the Electronic Communications Act, No. 36 of 2005; the Broadcasting Act, No.4 of 1999; the Postal Services Act, No.124 of 1998; the Processes and Procedures Regulations for Class Licences, 2010; and the Standard Terms and Conditions Regulations for Class Licences, 2010.
Spectrum assignment and fees
675. An assignment of frequency is the awarding of a radio frequency spectrum licence to a user in terms of Chapter 5 of the ECA. The ECA provides that no signal may be transmitted or received by radio without the requisite spectrum license issued by ICASA, with the exception of those frequency banks designated as license-exempt. Such a license is required in addition

196
to any service licence that ought to be obtained for providing a service through the use of radio frequency spectrum.
676. The awarding of frequency licences is a competence held by ICASA. To date ICASA has followed a first-come-first-served basis but it will shortly finalise regulations setting out the mechanisms to be employed in assigning frequency in bands where demand exceeds supply (or ‘high-demand’ spectrum bands). Such assignments will only occur after an ITA has been issued by ICASA. Spectrum is awarded on a technology-neutral basis subject to the allocation set out in the National Radio Frequency Plan (NRFP).907
The ICASA Act regulations
677. The ICASA Act provides for the establishment of ICASA and that the regulator be independent and impartial.908 The ECA was promulgated simultaneously with the promulgation of ICASA Act as the regulator has a key function to play in the interpretation and implementation of the ECA. The ECA and the ICASA Act provide for the regulation of electronic communications and postal matters in the public interest.909
ICASA Call Termination Regulations 2014
678. The final Call Termination Regulations were published by ICASA in September 2014910 and served as a tool by which to regulate the cost of provision of services and introduce pro-competitive terms and conditions in the wholesale call termination market. The Call Termination Regulations, as a form of wholesale access regulations, include the Call Termination Rates (CTRs) relating to both mobile and fixed termination rates.911 The imposition of termination rates in a proportionate manner involved the creation of a glide-path as a measure of price control. The current glide path, which was due to expire on 30 September 2017, was introduced in 2014. These regulations therefore hold relevance to the Inquiry due to their effect of the cost of service provision by operators, which then could potentially affect the prices charged for
907 Ellipsis (2013) Overview of electronic communications regulation in South Africa. Available at: http://www.ellipsis.co.za/wp-content/up loads/2013/01/Overview-of-Electronic-Communications-Regulation-in-South-Africa-20131.pdf [Accessed on 9 November 2018]908 The ICASA Act 13 of 2000. Chapter 2, Section 3. Government Gazette No909 The ICASA Act 13 of 2000. Chapter 1, Section 2. Government Gazette No910 Call Termination Regulations, 2014, pursuant to Section 67(8) of the ECA No.36 of 2005 (as amended). Notice of 2014.911 Termination rates refer to the rates which operators charge each other to carry calls between their networks.912 DTPS (2016) Government Gazette No. 39781. 4 March 2016.913 Notice of intention to conduct an inquiry to identify priority markets in the ECA. Government Gazette No. 40945. 20 June 2017.914 Notice of intention to conduct an inquiry to identify priority markets in the ECA. Government Gazette No. 40945. 20 June 2017.915 Notice of intention to conduct an inquiry to identify priority markets in the ECA. Government Gazette No. 40945. 20 June 2017.
data services included in their products and services.
The 2016 DTPS Policy Directive to ICASA
679. In March 2016, the Minister of Telecommunications and Postal Services (“MoTPS”) issued a policy directive to ICASA concerning the prioritisation of broadband markets for a market review, with the aim of achieving effective competition in the market and the reduction of data costs.912 On the basis of key policy documents, namely the NDP and SA Connect, the MoTPS instructed ICASA, in terms of section 3(2) of the ECA 2005, to start an inquiry defining relevant markets and prescribe regulations to ensure effective competition in broadband markets.
680. The policy directive resulted in ICASA publishing a notice of its intention to conduct an inquiry to determine the priority markets in the electronic communications sector in terms of section 67(4) of the ECA and section 4B (1)(a) of the ICASA act, as amended.913 The aim of the Inquiry was to identify markets and/or market segments in the electronic communications sector that are susceptible to ex ante regulation, and determine which of these markets should be prioritised for market review and potential regulation in terms of section 67(4) of the ECA following the conclusion of the inquiry. 914
Conclusion of the ICASA Inquiry into Priority Markets in the Electronic Communications Sector
681. The Inquiry into Priority Markets in the Electronic Communications Sector was conducted in four phases. The first phase involved a market study to obtain information and opinions from market participants and stakeholders. The second phase of the inquiry consisted of the publication of a discussion document informed by the stakeholder information submitted during the market study and other research or benchmarking exercises that may have been conducted.915 Public hearings on the discussion document were held on 7 June 2018 as part of the inquiry’s third phase, where stakeholders

197
made oral representations to ICASA. These stakeholders include Cell C, Telkom, MTN, Vodacom, ISPA and Liquid Telecom.916 The final output and fourth phase of the Inquiry involved the publication of the findings document of the inquiry, listing which markets have been identified as generally prone to ex ante regulation and which have been identified as priority markets for ICASA to review.
682. ICASA published a notice917 on the conclusion of the inquiry into priority markets in the electronic communications sector in terms of sections 4B of the ICASA Act, read with section 67(4) of the ECA. ICASA’s inquiry findings, in summary, indicated that the ‘Wholesale fixed access’ market, the ‘upstream infrastructure’ market and the ‘mobile services’ market should be prioritised for potential market reviews. The wholesale fixed access market includes the wholesale supply of asymmetric broadband origination, fixed access services and relevant facilities. The upstream infrastructure markets incorporate national transmission services and metropolitan connectivity and relevant facilities. The mobile services market covers the retail market for mobile services and the wholesale supply of mobile network services, including relevant facilities.918 The Inquiry has taken account of the work of ICASA in this regard, its conclusions919 and the submissions made by stakeholders to ICASA.
The DTPS draft Policy Direction to ICASA on unassigned spectrum
683. In September 2018, the DTPS issued an invitation to provide written comments on the proposed policy direction to ICASA on licensing of unassigned high demand spectrum.920 The purpose of the proposed policy direction is to direct ICASA to urgently consider the licensing of unassigned high demand spectrum to the WOAN and to other licensees. The Draft Policy Direction reflects the wording in the relevant sections of the ECA Bill 2018.
916 Conclusion of the Inquiry into Priority Markets in the Electronic Communications Sector. Government Gazette No. 41847.17 August 2018.917 Conclusion of the Inquiry into Priority Markets in the Electronic Communications Sector. Government Gazette No. 41847.17 August 2018.918 Conclusion of the Inquiry into Priority Markets in the Electronic Communications Sector. Government Gazette No. 41847.17 August 2018.919 Conclusion of the Inquiry into Priority Markets in the Electronic Communications Sector. Government Gazette No. 41847.17 August 2018.920 Invitation to provide written comments on proposed policy and policy directions to the authority on licensing of unassigned high demand spectrum. Government Gazette No. 41935. 27 September 2018.921 Ellipsis (2018) Overview: the proposed policy and policy directions on the WOAN and licensing of unassigned high- demand spectrum. [Online]. Available at: https://www.ellipsis.co.za/wp-content/uploads/2018/10/ellipsis-overview-draft-policy- directions-on-the-WOAN-and-spectrum-october-2018.pdf [Accessed on 20 October 2018]922 Telecommunications and Postal Services on ITA settlement agreement. Gov.za/speeches.923 The Competition Act 89 of 1998. Section 78924 Data Services Market Inquiry- Terms of Reference, Government Gazette (No. 41054) on 18 August 2017.
684. The MoTPS intends to direct ICASA to issue an ITA in respect of an ECNS licence and spectrum licences for the provision of WOAN services, taking into account the outcomes of the study conducted by the Council for Scientific and Industrial Research (CSIR) on the spectrum requirements of the WOAN and the provisions of the finalised policy direction.921 At the end of the public consultation process, and a consideration of the final policy directions issued by the MoTPS, ICASA will commence the licensing process for the assignment of high demand spectrum.922
The Competition Act regulations
685. The regulations relevant to the Inquiry, within Section 78 of the Competition Act, stipulates: “…The Minister, by notice in the Gazette, may make regulations that are required to give effect to the purposes of this Act.” 923
686. In addition to the Competition Act regulations as described above, Section 43B9(1) of the Act states that: “The Competition Commission, acting within its functions set out in section 21(1), and on its own initiative, or in response to a request from the Minister, may conduct a market inquiry at any time…”
687. These provisions of the Competition Act are relevant to the Inquiry as they lay the legal basis for the Inquiry and guide the regulatory parameters of the Inquiry’s scope and objectives, as detailed in the ToR.924
11.2. Key players in the sector
688. There are a number of key players in the policy, legislative and regulatory environment of the sector. These players have a variety of roles, responsibilities and powers, which are described in brief below.

198
The DOC
689. The Department of Communications (DOC), previously headed by Ms Nomvula Mokonyane, is responsible for the country’s overarching communication policy and strategy, information dissemination and publicity, and the branding of South Africa locally and abroad.925 In a cabinet reshuffle announcement on 22 November 2018, President Cyril Ramaphosa appointed Ms Stella Ndabeni-Abrahmans as the new Minister of Communications and appointed Ms Nomvula Mokonyane as the Minster of Environmental Affairs.926
690. The old DOC was split into the new DOC and the DTPS by a proclamation published by then president Jacob Zuma, as announced on 25 May 2014.927 This has subsequently changed, as the cabinet reshuffle involved the announcement of the consolidation of the DOC and the DTPS into a single MoC under the new Minister Stella Ndabeni-Abrahams. The President noted in his announcement that the two departments would report to the new ministry, but would still remain separate departments until after the 2019 National and Provincial elections.928 The DOC exercises oversight over various entities including ICASA, South African Broadcasting Corporation (SABC), Government Communication and Information System (GCIS), Brand South Africa, Media Development and Diversity Agency (MDDA) and the Film and Publication Board.929
The DTPS
691. The DTPS is currently headed by the Minister of Communications Ms Stella Ndabeni-Abrahams, who, as noted above, was named head of the department in a cabinet reshuffle by President Cyril Ramaphosa on 22 November 2018.930 The President’s announcement included the move of previous DTPS minister, Dr Siyabonga Cwele, to the Department of Home Affairs, while Robert Nkuna remains the Director General of
925 DOC (2017) About us. [Online]. Available at: www.doc.gov.za. [Accessed on 19 June 2018] 926 South African Government (2018) Media Statements- President Cyril Ramaphosa on changes to Cabinet, 22 November 2018. [Online]. Available at: https://www.gov.za/speeches/statement-changes-cabinet-22-nov-2018-0000. [Accessed on 27 February 2019]927 Proclamation by the President of the Republic of South Africa, Government Gazette No. 37839, 15 July 2014928 South African Government (2018) Media Statements- President Cyril Ramaphosa on changes to Cabinet, 22 November 2018. [Online]. Available at: https://www.gov.za/speeches/statement-changes-cabinet-22-nov-2018-0000. [Accessed on 27 February 2019]929 DOC (2017). [Online]. About us. Available at: www.doc.gov.za [Accessed on 19 June 2018]930 South African Government (2018) Media Statements- President Cyril Ramaphosa on changes to Cabinet, 22 November 2018. [Online]. Available at: https://www.gov.za/speeches/statement-changes-cabinet-22-nov-2018-0000. [Accessed on 27 February 2019]931 DTPS (2017) [Online]. About the Department. Available at: https://www.dtps.gov.za/index.php?option=com_content&view= article&id=132&Itemid=102. [Accessed on 18 June 2018]932 DTPS (2017) Portfolio Organisations [Online]. Available at: https://www.dtps.gov.za/index.php?option=com_content&view= article&id=229&Itemid=105. [Accessed on 18 June 2018]933 The Electronic Communications Act 36 of 2005, Government Gazette No. 28743. 18 April 2006 (section 4)
the DTPS. The department has core functions, derived from its constitutional mandate, which include the following: to develop telecommunications policies and legislation for accelerated and shared economic growth; to ensure the development of robust, reliable, secure and affordable ICT infrastructure to meet the needs of the people; to contribute to the development of an inclusive information society; to contribute to e-skilling the nation; to strengthen ICASA in order to enable it to regulate the sector in the public interest; to enhance the capacity of, and exercise oversight over, SOEs; and to fulfil South Africa’s continental and international responsibilities in the ICT field.931
692. As part of its portfolio structure, the DTPS exercises oversight over the following entities: Universal Service and Access Agency of South Africa (USAASA); South Africa Post Office (SAPO); Sentech; Nemisa; Broadband Infraco; SITA; and Telkom Shareholding.932 The Department ensures that the public entities function effectively and efficiently by facilitating the alignment of all corporate strategic plans to reflect the outputs and outcomes as outlined in government priorities and mandates.
693. Both the DTPS and the DOC supervise the telecommunications, media, broadcasting and information technology sector in South Africa. The powers of the MoC, regarding telecommunications regulation include, inter alia, the power to issue policy direction to ICASA, to initiate and participate in certain licensing processes, and to approve radio regulations and other regulations made by ICASA in terms of section 4 of the ECA.933 Policy directions issued by the Ministers in terms of the ECA must be consistent with the objects of the ECA set out in section 2 of the Act. The Ministers may make ministerial policies on a number of national policy matters that apply to the communications sector, most notably radio frequency spectrum, universal access and access policy. Further areas within their responsibility include the

199
country’s obligations under international treaties and conventions, and other policies necessary for the relevant legislation.934
ICASA
694. ICASA is the independent communications regulator, established and governed by the ICASA Act.935 In terms of the South African Constitution, ICASA is a Chapter 9 institution (an institution which supports democracy) and is an entity under the MoC. The overarching object for the regulator, as contained in the ECA936 and the ICASA Act937, is the regulation of the telecommunications industry in the public interest to ensure fairness, as also required by Section 192 of the Constitution938. Subsidiary objects include ensuring the provision of a wide range of telecommunication services, stimulating and supporting economic growth, stimulating investment in the communications sector, promoting competition within the ICT sector, and protecting the interests of telecommunications users and consumers.939
695. ICASA has the main responsibility of regulating the telecommunications, broadcasting and postal industries in the public interest and ensuring affordable, high quality services for all South Africans.940 ICASA is also responsible for issuing licenses to telecommunications and broadcasting service providers, enforcing regulatory compliance, protecting consumers from unfair business practices and poor quality services, hearing and deciding on disputes and complaints brought against licensees, and managing the effective use of radio frequency spectrum.941
696. ICASA, as governed by the relevant Acts, may make recommendations to the MoC on policy matters and amendments to the ICASA Act and the Broadcasting Act 1999942, which concur
934 Boda, R., Strachan, W & Manyala, M (2017) Telecoms and Media, South Africa. ENSafrica-Getting the Deal Through. [Online]. Available at: https://gettingthedealthrough.com/area/39/jurisdiction/2/telecoms-media-south-africa/. [last viewed on 10 April 2019]935 The ICASA Act 13 of 2000,as amended, Government Gazette No. 28945. 22 June 2006.936 The Electronic Communications Act 36 of 2005, Government Gazette No. 28743. 18 April 2006. Chapter 2, Section 4.937 The ICASA Act 13 of 2000,as amended, Government Gazette No. 28945. 22 June 2006.938 The Constitution of the Republic of South Africa, 1996 (Act 108 of 1996). Section 192.939 Thornton, L., Carrim,Y & Mtshaulana, P. (2006) Telecommunications Law in South Africa. STE Publishers. Pg 110.940 ICASA (2017) Our Mandate- Policy Mandate. [Online]. Available at: https://www.icasa.org.za/pages/our-mandate [Accessed on 18 June 2018]941 ICASA (2017) Our Mandate- Policy Mandate. [Online]. Available at: https://www.icasa.org.za/pages/our-mandate [Accessed on 18 June 2018]942 The Broadcasting Act (Act 4 of 1999)943 ICASA. Our Mandate. [Online]. Available at: https://www.icasa.org.za/pages/our-mandate [Accessed on 12 July 2018]944 ICASA Strategic Plan for fiscal years 2016-2020. [Online]. Available at: https://www.icasa.org.za/uploads/files/201620Strategic.pdf [Accessed on 12 July 2018]945 The relevant sectors include the electronic communications sector, the broadcasting sector and the postal sector.946 ICASA Strategic Plan for fiscal years 2016-2020. [Online]. Available at: https://www.icasa.org.za/uploads/files/201620Strategic.pdf. [Accessed on 12 July 2018]947 ICASA’s USAF regulations. Government Gazette No.31499. 10 October 2018948 Michalson, L. (2006) Guide to the Electronic Communications Act 30 of 3006. [Online]. Available at: https://www.michalsons.com/blog/ guide-to-the-electronic-communications-act-2006/175. [Accessed on 18 June 2018]
with the objects of these Acts to promote development in the broadcasting sector. In relation to the MoTPS, ICASA can make recommendations to that Minister on policy matters and amendments to the ECA and the Postal Services Act 1998, in accordance with the objects of these acts to promote development in the electronic transactions, postal and electronic communications sectors. Although not bound by them, ICASA must consider ministerial policies and policy directions.943
697. Section 34 of the Constitution describes ICASA as a licensing body, a regulator and a quasi-judicial body because it licenses, regulates, adjudicates and issues sanctions in the sector.944 In summary, the legislation described above empowers ICASA to regulate the relevant sectors945 in the public interest, to grant licenses, to monitor licensee compliance with licence terms and conditions, to develop regulations for the sectors, to plan and manage radio frequency spectrum and to protect consumers of these services.946
USASSA
698. The USAASA was established under the ECA to promote the goals of universal access and universal service in the under-serviced areas of South Africa. All licensees in the sector are required to contribute to the Universal Service and Access Fund (USAF).947 Part of the responsibilities of USAASA include collecting contributions from licensees and funding and implementing projects to promote universal service provision.948
The Competition Commission
699. The telecommunications industry is subject to the same economic forces as other industries, the most relevant of which is competition.

200
As per the South African Competition Act 89 of 1998, the Commission is responsible for the “investigation, control and evaluation of restrictive practices, abuse of dominant position, and mergers”.949 While ICASA is regarded as having ex ante regulatory powers, in that it acts to prevent future anti-competitive conduct, the Competition Commission and Competition Tribunal have ex-post regulatory powers. This form of regulation involves detecting, investigating and prosecuting offenders, as well as responding to specific complaints or instances of anti-competitive conduct.
700. The Competition Commission and ICASA both act under a MoA950 established in 2002, which details the way the entities will deal with each other in their respective investigations, evaluations and analyses of mergers and acquisitions, and complaints related to telecommunication and broadcasting matters.951 Broadly, the MoA describes ICASA as dealing with contraventions of telecommunications and broadcasting licence conditions and legislation, while the Commission focuses on complaints about restrictive horizontal and vertical practices and abuse of dominance.952
701. The competitive effects of telecommunications transactions and their related impact on economic growth are influenced by the regulatory environment that governs the sector. The key role players in South Africa’s ICT sector and their respective powers would support the objectives of the Inquiry in that its recommendation be directed to those most suited to deal with the relevant issues arising from the Inquiry. For the Inquiry, specific benefits to consumers - like lower prices, innovation and a wider range of choices in the Data Services market, are important.953 Clear regulations from government and the ministers are crucial for setting clear rules that determine the sector’s regulatory regime and creating a competitive market with all its associated benefits, while the industry regulator is currently
949 The Competition Act 89 of 1998950 Memorandum of Agreement entered into between the Competition Commission and ICASA, para.1.1 Government Gazette No. 23857. 20 September 2002.951 Memorandum of Agreement entered into between the Competition Commission and ICASA, para.1.1 Government Gazette No. 23857. 20 September 2002.952 Fourie,H., Granville, L. and Theron,N (2018) Regulatory ambiguity and policy uncertainty in South Africa’s telecommunications sector. ERSA working paper 729. [Online]. Available at: https://econrsa.org/system/files/publications/working_papers/working_paper_729.pdf [Accessed on 18 June 2018]953 Data Services Market Inquiry- Terms of Reference, Government Gazette (No. 41054) on 18 August 2017954 Frontier Economics report in Vodacom’s submission to ICASA dated 10 October 2017, p. 23 (Confirmed as non-confidential on 4 April 2019)955 MTN’s submission dated 27 November 2017 (Non-confidential version)956 MTN’s submission dated 27 November 2017 (Non-confidential version), p. 5957 Cell C submission dated 24 November, (Non-confidential) p. 8-9958 MMA’s submission dated 1 November, p. 3
empowered (under the relevant Act) to deal with the Inquiry’s recommendations related to spectrum management and licensing issues.
11.3. Regulatory issues
702. While each stakeholder appears to recognise and support the potential benefits to the sector from the White Paper and the ECA Bill, there are various concerns raised by stakeholders regarding the regulatory regime for the sector. According to Vodacom, the role and purpose of ‘ex-ante’ regulation by ICASA represents a secondary option for supporting competition in the sector, as it views infrastructure-based competition as the optimal solution in this regard.954 Similarly MTN submits that excessive regulatory intervention raises the costs for MNOs and could decrease operators’ incentives to continue investing in expanding consumer access to information.955 Regulation, as MTN describes, should instead be targeted to efficiency and lowering the cost to communicate, particularly for low-income consumers. MTN also highlights an important piece of regulation, currently not finalised, as the allocation of additional spectrum to MNOs in order to allow them to compete more effectively and thereby improve access to mobile data services, at even lower costs.956
703. Cell C adds that its concern with sector regulation is the lack of certainty around regulations, particularly in the delineation of roles and implementation by regulatory players.957 This lack of co-ordination and clarity, according to Cell C, further entrenches existing structural imbalances in the sector. MMA, an NGO with the objective of promoting human rights and democracy through the media, warns that suggestions to split ICASA and close USAASA in order to create a new regulator could undermine ICASA and bring further instability to the ICT sector.958 In addition to these regulatory concerns raised, ISPA also submits its view that regulation must be for maximum effect. Above 90% of the

201
population, it states, has access to broadband services and given that the majority of internet connections are mobile, the correct regulatory focus would be on the affordability gap within the local mobile market for internet services.959
704. In its submission, the local foundation DG MT acknowledges the importance of regulation that is capable of addressing the high cost of data, and in this sense it proposes that regulators consider ‘zero-rating’ mobile data costs associated with accessing information, tools and applications provided by PBOs. DGMT submits that zero-rating, which is aligned to the expertise of mobile networks, “…is a cost-effective way to provide those 30.4 million South Africans, currently living under the poverty line, with essential mobile data access.”
705. Right2Know, a non-profit advocacy organisation established in 2010, raised a point of regulatory focus for policy makers going forward. It submits that when investigating the advantages and disadvantages to current and future policy, regulators should focus on the “lived experience” when assessing an individual’s cost to communicate.960 The “lived experience” relates to how mobile phone users experience mobile phone ownership, access to mobile communications, and the cost of this ownership and access. Right2Know further advocates that future policies in the sector should explicitly consider the needs of mobile communication users with low monthly household incomes.
The Wholesale Open Access Network
706. The insertion of Chapter 3A into the ECA Bill makes provision for the issuing of ECNS licences and radio frequency spectrum licences to the WOAN. While some operators view the model as a creation of a more level playing field for all participants, most point to a need for clearly defined WOAN principles. Market participants have shared their views regarding the plans to introduce the WOAN, which generally include uncertainty and skepticism regarding how the WOAN will function and whether it is the appropriate model to achieve the desired policy objectives in South Africa.
959 ISPA’s submission dated 1 November 2017, p. 3960 Right2Know’s submission dated 1 November 2017961 Frontier Economics report in Vodacom’s submission to ICASA dated 10 October 2017, p. 30 (Confirmed as non-confidential on 4 April 2019)962 MTN’s submission dated 27 November 2017 (Non-confidential version), p. 43963 MTN’s presentation dated 27 November 2017 (Non-confidential version), p. 44964 ECN’s submission dated 1 November 2017, (Non-confidential version) p. 31965 MWEB’s submission dated 1 November 2017966 ICASA Discussion document. Government Gazette No. 41446. Appendix 2, p. 90
707. According to its submission, Vodacom indicates that the WOAN could be damaging for the mobile market by distorting competition, as it favours the WOAN over existing operators.961 The uncertainty surrounding the WOAN, Vodacom notes, will disincentive investors and result in worse outcomes for consumers. Aligned to Vodacom’s views on the WOAN, MTN points to the lack of evidence that WOANs are successful in delivering on the promises of better coverage or lower prices for consumers.962 Additionally, MTN states that the Operators Forum (which is made up of Vodacom, MTN, Cell C, Telkom, Multisource Telecom and Neotel) had engaged with government on the White Paper proposals, particularly regarding the WOAN. The Bill’s latest content (the time of MTN’s submission), however, shows (according to MTN) a lack of regard for industry submissions and input on the ICT White Paper. 963
708. ECN submits that the National ICT policy White Paper and the proposals for a WOAN set out therein acknowledge the issue of the lack of available spectrum. ECN states it is also clear that the proposal for a WOAN is a highly contentious and increasingly-politicised issue, with ongoing litigation between the Minister and ICASA.964 According to MWEB, [].965
Infrastructure and supply-side issues
709. The ICT White Paper places a particular focus on access and infrastructure supply-side issues. The policy highlights the infrastructure-based challenges in the provision of broadband, which include ineffective competition, supply bottlenecks, infrastructure duplication, and the inefficient use of scarce resources.966 These infrastructure and supply-side issues are also contained within submissions to the Inquiry, discussed in brief below.
710. In its submission, Vodacom indicates that access to existing duct and pole infrastructure would help to reap the benefits of additional mobile spectrum. Providing alternative operators with this access (to ducts and poles) would, according to Vodacom, incentivise competitive investment by significantly reducing the cost of network roll-out. Infrastructure access,

202
according to its submission, would make it more viable for operators to build their own backhaul instead of relying on other operators to provide it.967
711. MTN submits that in addition to the binding spectrum constraint, operators face numerous demand and supply factors which hinder improvements of access to data services, especially for low-income consumers in South Africa.968 According to MTN, the supply side factors have a significant impact on the cost of providing data services. MTN’s submission notes various supply side cost factors like energy pricing, battery theft and vandalism at base station sites, as well as the increasing infrastructure replacement and upgrade costs. MTN indicates that wayleave applications are also costly and time consuming, adding to supply side costs for operators.969
712. ECN further states that one of the main causes of higher data prices in South Africa is that ICASA failed to regulate competition in the wholesale and retail mobile data services as required by Chapter 10 of the Electronics Communications Act (“ECA”).970 Telkom submits that wholesale mobile network services (roaming, RAN sharing, access) are not fully regulated, but are subject to commercial considerations, specifically the Facilities Leasing Regulation of 2010 which obliges all ECNS-licensed operators to lease facilities. ECN notes that the price that may be charged by the facility owner has not, however, been regulated. This is also acknowledged by Telkom, who submits that access seekers are disadvantaged by no regulation of the price if the wholesale market is not working effectively971. Cell C shares a similar view and submits that although the ECA obliges licensees to share their facilities in terms of Chapter 8 of the ECA, the price that may be charged by the owner of the facilities has not been regulated, even though there is scope to implement such a framework.972
967 Frontier Economics report in Vodacom’s submission to ICASA dated 10 October 2017, p39 (Confirmed as non-confidential on 4 April 2019)968 MTN’s submission dated 27 November (Non-confidential version), p. 52969 MTN’s submission dated 27 November (Non-confidential version), p. 52970 ECN’s submission dated 1 November 2017, (Non-confidential version) p. 6.971 BRG Report (submitted on 17 November 2017 on behalf of Telkom) (Non-confidential version), p. 27 & 32972 Cell C’s submission dated 24 November, (Non-confidential) p. 13973 ECA Amendment Bill. Government Gazette No. 41261, 17 November 2017974 The Bills include: Ikamva National e-Skills (iNeSI) Bill; Postal Services Amendment Bill; Digital Development Fund Bill; ICT Sector Com mission and Tribunal Bill; Electronic Communications Amendment Bill; Electronic Communications and Transactions Amendment Bill; South Africa Post Office SOC Ltd Amendment Bill; State Information Technology Amendment Bill; and State ICT Infrastructure Bill.975 Parliamentary Monitoring Group (2017) Proposed legislation emanating from National Integrated ICT Policy White Paper with Minister (Committee Meetings). [Online]. Available at: https://pmg.org.za/committee-meeting/25176/ [Accessed on 27 July 2018].
11.4. Policy, legislative and regulatory developments
713. The ECA ushered in substantial change from the previous Telecommunications Act and aligned the sector’s regulation with international best practice. The dynamic nature of the ICT sector constantly places it under review and development. Within this context, this section provides an overview of the relevant proposed and upcoming changes to ICT legislation and regulation, the main regulatory concerns raised in the submissions to the Inquiry, and an overview of the key issues in the ICT sector.
Current policy, legislative and regulatory initiatives
714. In terms of the relevant proposed changes to ICT legislation and regulation, the section below covers the Electronic Communications Amendment Bill, ICASA Call Termination Regulations, the Broadcasting Digital Migration Process, ICASA’s End-User and Subscriber Service Charter regulations, the recent settlement agreement between DTPS and ICASA, and the draft International Mobile Telecommunications Roadmap for South Africa.
The Electronic Communications Amendment Bill
715. In order to balance the interests of all stakeholders in the ICT sector, and give effect to the ICT White Paper, new legislation and amendments to existing legislation were required, where this section covers those changes captured in the draft Electronic Communications Amendment Bill (“Amendment Bill”).973 The draft Amendment Bill, published on 17 November 2017 for public comment, represents one of nine new and draft bills974 proposed by the DTPS in a phased approach for processing the proposed legislation and implementing the ICT White Paper. 975

203
716. The new Communications Minister, Stella Ndabeni-Abrahams, withdrew the Amendment Bill on 12 February 2019 after meeting with the Portfolio Committee on Telecommunications and Postal Services.976 The decision to withdraw the Bill stems from the recent department reconfiguration as well as issues raised in the report of the Committee on the Bill, which require further consultations and consequently could have resulted in Parliament being unable to finalise the Bill during the remainder of the current term.977 Despite the recent withdrawal of the Amendment Bill, this section covers to the main issues proposed in the Bill as it remains one of the priority Bills identified within the DTPS and an indication of the department’s direction for tackling issues within the ICT sector.
717. Following receipt of comments from the public, the amended version of the Bill (which has been approved by the Cabinet) was published in the Government Gazette on 31 August 2018 and tabled before Parliament in October 2018. This section highlights some of the key issues addressed in the proposed legislation as well as the amendments following from the public comment process.
718. The aim of the Amendment Bill is to facilitate services-based competition, eliminate infrastructure duplication and encourage transformation within the ICT sector. In addition to these aims, the Amendment Bill seeks to address supply side challenges to create an inclusive, people-centered and developmental digital society.978 The Amendment Bill appears to be, for the most part, a translation of the provisions of the White Paper into legislation. These provisions primarily concern spectrum and institutional arrangements, rapid infrastructure deployment, open access, the WOAN and universal access and service, which are discussed further below.
976 DOC (12 February 2019) Media statements- Minister Stella Ndabeni-Abrahams withdraws Electronic Communications Amendment Bill977 DOC (12 February 2019) Media statements- Minister Stella Ndabeni-Abrahams withdraws Electronic Communications Amendment Bill.978 ECA Amendment Bill, draft. 2017. [Online]. Available at: https://pmg.org.za/call-for-comment/622/. [Last viewed on 10 April 2019]979 Ellipsis (2017) Overview of the Draft ECA Bill 2017, p. 2. [Online]. Available at: https://www.ellipsis.co.za/wp-content/uploads/2017/12/ Overview-EC-Amendment-Bill-2017.pdf. [Accessed on 18 June 2018]980 ECA Amendment Bill. Government Gazette No. 41261, 17 November 2017. Chapter 5, Section 34A981 ECA Amendment Bill. Government Gazette No. 41261, 17 November 2017. Chapter 5, Section 34A982 ECA Amendment Bill. Government Gazette No. 41261, 17 November 2017. Chapter 5, Section 30 to 34983 ECA Amendment Bill. Government Gazette No. 41880, 31 August 2018. Chapter 5, Section 31 (e)984 “Radio frequency spectrum trading” is inserted to mean the transfer or transfer of control, re-sale, leasing or sub-letting of spectrum rights by a licensee to a third party.985 “Radio frequency spectrum sharing” is inserted to mean a collaborative effort which allows radio frequency spectrum licensees allocated spectrum in the same or adjacent bands to harmonise their spectrum to enhance the utilisation of the radio frequency spectrum.986 “Radio frequency spectrum refarming” is inserted to mean the reuse of an assigned frequency band for a different technology.
Spectrum and institutional arrangements
719. The ECA Bill, in line with the National ICT Policy White Paper, proposes certain changes to the way in which the Act provides for managing radio frequency spectrum. The Bill transfers many of ICASA’s current functions to the Department and the Minister, where ICASA would be required to comply with ministerial policies and directions relating to spectrum.
720. Under a new section 29A, and as contemplated in section 34A, the Minister will be responsible for establishing two new spectrum management bodies within the DTPS, namely the National Radio Frequency Spectrum Planning Committee and a National Radio Frequency Spectrum Division.979 The purpose of the National Radio Frequency Spectrum Planning Committee, according to section 34A within Chapter 5, is to ensure fairness and equitable distribution of radio frequency spectrum, and must consist of representation from relevant Government stakeholders.980 The National Radio Frequency Spectrum Division will be responsible for the coordination of the planning committee’s work.981
721. Chapter 5 of the ECA, which deals with radio frequency spectrum, is amended to clarify the function of the Minister with regard to the role of planning and allocating spectrum, as well as the role of ICASA in administering and managing spectrum assignment, and its role of issuing licenses and monitoring and enforcing the use of spectrum.982 Further amendments to Chapter 5 of the Act include the introduction of the ‘use-it-or-lose-it principle, where ICASA will be entitled to withdraw a spectrum licence if the licensee fails to use assigned radio frequency spectrum for a period of two years.983 Another insertion describes ICASA’s ability to amend a radio frequency spectrum licence if it approves an application for spectrum trading984, spectrum sharing985 or spectrum refarming986.

204
722. According to Section 31B of the Act, ICASA will be allowed to develop spectrum trading regulations for non-high-demand spectrum, which will permit trading in this spectrum. These regulations are to cover, among other things, the prevention of hoarding spectrum licenses and a requirement that a transferring licensee must have utilised the spectrum in the previous year to prevent the bypassing of the use-it-or-lose-it principle.987 Provision is made for the Minister to issue policy direction to ICASA on the trading of spectrum and spectrum use rights where these aspects relate to the fulfillment of national objectives.988
723. Spectrum sharing, as stated in Section 31C will be allowed subject to ICASA’s approval, with the approval being dependent on the sharing of spectrum having no negative effect on competition or it constituting the trading of spectrum. The ECA Bill also states, within Section 31C, that ICASA is required to develop spectrum sharing regulations that provide the criteria for spectrum sharing.989
724. Within Section 31D, ICASA must approve the refarming of licensed spectrum by spectrum licensees.990 As with spectrum sharing, approval of spectrum refarming will not be granted if it negatively affects competition. Within a refarmed spectrum band, existing universal service and/or access obligations on other licensees must be equally applied, which also applies to licence fees. The Bill states that ICASA is required to develop the regulations for spectrum refarming.
725. The Bill facilitates the trading of licensed spectrum and does not retain the previous Bill’s prohibition of trading high demand spectrum. Radio spectrum sharing (of both high demand and non-high demand spectrum) is provided for in the Bill, subject to certain restrictions and obtaining approval from ICASA. The provisions for spectrum re-farming [].991 The []. The latest bill excludes the []. 992
987 ECA Amendment Bill. Government Gazette No. 41261, 17 November 2017. Chapter 5, Section 31B988 ECA Amendment Bill. Government Gazette No. 41261, 17 November 2017. Chapter 5, Section 31B989 ECA Amendment Bill. Government Gazette No. 41261, 17 November 2017. Chapter 5, Section 31C990 ECA Amendment Bill. Government Gazette No. 41261, 17 November 2017. Chapter 5, Section 31D991 DTPS submission dated 18 September 2018 (in response to Competition Commission letter dated 31 August 2018)992 DTPS submission dated 18 September 2018 (in response to Competition Commission letter dated 31 August 2018)993 DTPS (2016) National Integrated ICT Policy White Paper- 3 October 2016994 Ellipsis (2015) Rapid deployment of electronic communications facilities. [Online]. Available at: https://www.ellipsis.co.za/rapid- deployment-of-electronic-communications-facilities/. [Accessed on 20 July 2018]995 Ellipsis (2017) Overview of the Draft ECA Bill 2017, p. 2. [Online]. Available at: https://www.ellipsis.co.za/wp-content/uploads/2017/12/ Overview-EC-Amendment-Bill-2017.pdf [Accessed on 18 June 2018]
Rapid Infrastructure deployment
726. The numerous permissions and approvals that builders of communication networks require before network roll-out are seen as a major hindrance to the efficient deployment of electronic communications networks in South Africa. This obstacle is recognised within Section 21 of the ECA relating to the development of guidelines for the rapid deployment of electronic communications facilities. The ICT White Paper defines Rapid Deployment of ICT “…as the process of gaining access to and using property, including buildings and land such as waterways, roads, railways, footpaths and tunnels for the deployment of electronic communications networks with an emphasis to reduce the time between application process and the actual deployment of infrastructure.”993 The Rapid Deployment Policy therefore seeks to simplify and minimize the period from the time of application for wayleaves and permits to the issuance thereof, which would decrease the cost and time involved in infrastructure deployment and thereby further policy efforts to address the costs to communicate in South Africa. 994
727. 725. were initially drafted in 2005, they have since been revised and amended by the Electronic Communications Amendment Act 1 of 2014 and again currently within the latest revisions to the Act. The ECA Bill contains extensive revisions to Chapter 4 of the Act, as it proposes deletions of some sections and the insertion of 16 new sections, namely sections 20A to 20P. These insertions set out a new institutional structure and detail the rights and obligations of ECNS licensees, landowners, municipalities, landlords, tenants and customers. These rights and obligations concern the way licensees deploy their networks and facilities on public and private land in respect of approvals for rights of way and the granting of wayleaves.995
728. Within the Bill’s revisions on institutional structure, the roles and responsibilities apportioned to the Minister include: to provide
205
oversight over the implementation of rapid deployment; to hold communication with all responsible parties; and to establish a Rapid Deployment National Coordinating Centre (NCC) and a Rapid Deployment Steering Committee. The new statutory structures included in the Bill, namely the Rapid Deployment National Coordinating Centre and a Rapid Deployment Steering Committee, will oversee and ensure coordination of activities and processes for rapid deployment of networks and facilities.996
729. The NCC will provide the central coordination of activities and processes for rapid deployment, including its relationship with SIP15997 and local municipalities. The NCC and the Committee will set out dispute resolution procedures and wayleaves, as well as approval procedures. The coordination of planning and ICT infrastructure roll-out at a municipal level is apportioned to both of these entities, as well as setting out the requirements for single-trenching for the deployment of fibre.998 The NCC will interface with local municipalities to fast track right of way and wayleave proposals to support rapid deployment of networks and facilities.
730. In totality, the revisions in the Act cover the following aspects999: ECNS licensees’ right to enter and use property; the requirements for ‘adequately served’ locations; the proposed definition of ‘essential facilities’; the access to high sites for radio-based systems (where these sites are defined as “any structure or feature, constructed or natural, including buildings, which is suitable for radio-based systems”); access to trenches, government infrastructure and buildings; the provisions of new property developments and buildings; the application process and procedure for network deployment; fees, charges and levies involved in infrastructure deployment; the apportionment of roles and responsibilities in supporting rapid infrastructure deployment; and the relevant rapid deployment regulations.1000
996 ECA Amendment Bill. Government Gazette No. 41880, 31 August 2018. Chapter 4997 Strategic Integrated Project (SIP) 15: Expanding Access to Communication Technology.998 Schuman, R., Edmunson, K., Lewis, S., Matambo, R. & Stucke, W. (2015) Development of a Rapid Deployment Policy for Electronic Communications infrastructure (Discussion Paper). Analysis Mason.999 ECA Amendment Bill. Government Gazette No. 41880, 31 August 2018. Chapter 41000 Ellipsis (2017) Overview of the Draft ECA Bill 2017, p. 2. [Online]. Available at: https://www.ellipsis.co.za/wp-content/uploads/2017/12/ Overview-EC-Amendment-Bill-2017.pdf [Accessed on 18 June 2018]1001 ECA Amendment Bill. Government Gazette No. 41880, 31 August 2018. Chapter 81002 DTPS (2017) Presentation- Electronic Communications Amendment Bill. [Online]. Available at: https://www.ellipsis.co.za/wp-content/ uploads/2017/11/Presentation-ECA-Bill-Final-04122017.pdf [Accessed on 19 July 2018]1003 ECA Amendment Bill. Government Gazette No. 41880, 31 August 2018. Chapter 81004 The amendment seeks to oblige electronic communications network service licensees to provide wholesale open access upon request.1005 ECA Amendment Bill. Government Gazette No. 41880, 31 August 2018. Chapter 81006 ECA Amendment Bill. Amendment of section 43 of Act 36 of 20051007 Ellipsis (2017) Overview of the Draft ECA Bill 2017, p. 12. [Online]. Available at: https://www.ellipsis.co.za/wp-content/uploads/2017/12/ Overview-EC-Amendment-Bill-2017.pdf [Accessed on 18 June 2018]
Open Access
731. General open access principles, within the ECA, are defined to mean “providing wholesale open access to electronic communications networks on terms that are effective, transparent and non-discriminatory”.1001 These principles, and the resulting regulations, are broadly aimed at addressing the legacy of access and cost related issues in the sector, often described as a result of ineffective competition within the infrastructure market, infrastructure sharing bottlenecks, duplication of infrastructure, and inefficient use of scarce resources.1002
732. Within this policy context, Chapter 8 of the ECA, which previously dealt with electronic communications facilities leasing, currently relates to the obligations to provide wholesale open access.1003 In the Open Access section of the Bill, it creates the obligation1004 that all ECNS licensees provide open access to electronic communications facilities at a wholesale level along the following principles: active infrastructure sharing; cost-orientated pricing; access to its electronic communications network or electronic communications facilities (as prescribed by ICASA); and specific network and population coverage targets.1005
733. Open access to networks or facilities must be non-discriminatory among comparable types of networks or facilities and not be of a lower technical standard and quality than that provided by the licensee to itself or to an affiliate1006. An important regulatory intervention to still occur is the wholesale open access regulations to be drafted by ICASA within an 18 month period after the Electronic Communications Amendment Act comes into effect. These open access regulations will cover, among others, the terms and conditions for the different open access categories (such as a ECNS licensee, a vertically-integrated entity or a deemed entity) and the procedures and time frames for negotiating, concluding and implementing wholesale open access agreements.1007

206
734. The latest Bill states that all ECNS licensees, except ECNS licensees that provide broadcasting signal distribution or multi-channel distribution services, must provide wholesale open access (on a cost-oriented pricing basis), upon request to: any other person licensed in terms of the ECA; and persons providing services pursuant to a licence exemption in accordance with the terms and conditions of a wholesale open access agreement entered into between the parties, in accordance with the general open access principles, except in case of technical inability.1008 The obligation of an ECNS licensee to provide access to its network is therefore now made subject to technical ability. The Authority can perform a number of actions to resolve unwillingness or technical inability to provide access. []. 1009
735. In addition to the open access requirements, an ECNS licensee that is determined a vertically integrated operator by ICASA in the wholesale access regulations must implement accounting separation in a manner to be prescribed by ICASA. An ECNS licensee that is determined a ‘deemed entity’ by ICASA in the wholesale open access regulations must also comply with the wholesale open access principles on its network including active infrastructure sharing, adhering to prescribed wholesale rates, and realising specific network and population coverage targets. Within 18 months of the commencement of amendments to the ECA, as contemplated in the latest Bill, ICASA must prescribe wholesale open access regulations which must, among other things, identify vertically integrated operators, describe accounting separation procedures for vertically integrated entities and provide guidance on determining whether an entity is a ‘deemed entity’. [].1010
Wireless Open Access Network (WOAN)
736. Chapter 3A of the Bill proposes an insertion to provide for the issuing of an ECNS licence and radio frequency spectrum licenses to the
1008 Webber Wentzel (September 2018) E-Alert: Update on the draft Electronic Communications Amendment Bill- key issues. [Online]. Available at: http://www.webberwentzel.com/wwb/content/en/page160?oid=66411&sn=Detail&pid=160 [Last viewed on 10 April 2019]1009 DTPS submission dated 18 September 2018(in response to Competition Commission letter dated 31 August 2018)1010 DTPS submission dated 18 September 2018(in response to Competition Commission letter dated 31 August 2018)1011 ECA Amendment Bill. Government Gazette No. 41880, 31 August 2018. Chapter 3A1012 Ellipsis (2017) Overview of the Draft ECA Bill 2017, p. 1. [Online]. Available at: https://www.ellipsis.co.za/wp-content/uploads/2017/12/ Overview-EC-Amendment-Bill-2017.pdf [Accessed on 18 June 2018]1013 Ellipsis (2017) Overview of the Draft ECA Bill 2017, p. 1. [Online]. Available at: https://www.ellipsis.co.za/wp-content/uploads/2017/12/ Overview-EC-Amendment-Bill-2017.pdf [Accessed on 18 June 2018]1014 RIA (2018) After Access, the state of ICT in South Africa. [Online]. Available at: https://researchictafrica.net/after-access-south-africa- state-of-ict-2017-south-africa-report_04/. [Accessed on 3 October 2018] 1015 RIA (2018) After Access, the state of ICT in South Africa. [Online]. Available at: https://researchictafrica.net/after-access-south-africa- state-of-ict-2017-south-africa-report_04/. [Accessed on 3 October 2018]
WOAN, in order to provide wholesale electronic communications network services on an open access basis.1011 The Minister must consider incentives that may be granted to the WOAN and will initiate the licensing process by issuing a policy direction to ICASA in terms of section 5(6) for it to publish an ITA. 1012
737. The WOAN will be required to provide wholesale open access to its networks and facilities, to provide for active infrastructure sharing (that includes but is not limited to national roaming, RAN and enabling MVNOs for voice and data based on the latest generation of technologies, to adopt cost-based pricing, to allow ICASA-prescribed network or facility access and to comply with network and population coverage targets.1013
738. The WOAN is envisaged as a creator of broadband access using all available high-demand spectrum and would allow new service-layer operators to enter the market and increase competition.1014 The WOAN will represent a public-private sector-owned and managed consortium and will consist of entities that are interested in participating in the WOAN. The incentives for the WOAN, as stated in the 2017 Amendment Bill include: reduced or waived fees; access to rights of way and public infrastructure, as well as public electronic communications facilities through government facilitation; and the allocation of funds to construct or extend an electronic communication network in under-services areas.1015
739. The Bill specifies that ICASA can only proceed to assign licences for high-demand spectrum not assigned to the WOAN once the following conditions are met: the WOAN is functional; the licensee has procured a “minimum of 30% capacity or such higher capacity as determined by the Authority, in the WOAN for a period determined by the Authority”; and universal service and/or access obligations have been imposed “and such obligations are complied

207
with in rural and under-serviced areas before the assigned spectrum may be used in other areas by the licensee”.1016
740. The Bill further states that ICASA must, within 24 month of the commencement of the finalised Amendment Act, conduct an inquiry as contemplated in section 4B of the ICASA Act and make recommendations to the Minister “on the terms and conditions, as well as the time frame, under which the exclusively/ individually assigned high demand spectrum not assigned to the WOAN, must be returned to the Authority, taking into account policy, market developments and extent of availability of open access networks”.1017
741. The Bill includes a number of provisions inserted to avoid unintended consequences for competition and specifically includes the requirements for a WOAN licence applicant. All applicants for the WOAN must take the form of a consortium of persons who must have not less than 30% equity ownership by persons from historically disadvantaged groups. If any member of the consortium applying for the WOAN service licence provides electronic communications services, ICASA must require functional separation between such electronic communications services and the member’s participation in the WOAN, which must be provided by and independently operating business entity. The Bill also requires that an applicant: must be a consortium of persons that participate voluntarily; must comply with the empowerment requirements specified in the ITA; may not be dominated or controlled by any single entity; may not be a public entity under the Public Finance Management Act; may not have members in the consortium that either separately or collectively possess a market share of more than 50% in electronic communications services; and must provide for effective participation by targeted groups, including woman, youth and persons with disabilities.1018
742. The Bill indicates that ICASA does not have to make recommendations to the Minister anymore and can determine the incentives for the WOAN (where the type of incentives to be
1016 ECA Amendment Bill. Government Gazette No. 41261, 17 November 2017. Section 31E(5)(a)-(c), p. 511017 ECA Amendment Bill. Government Gazette No. 41261, 17 November 2017. Section 31E(6), p. 51-521018 Ellipsis 2018 EC Amendment Bill overview.1019 ECA Amendment Bill. Government Gazette No. 41880, 31 August 2018. Chapter 4, section 31E1020 ECA Amendment Bill. Government Gazette No. 41880, 31 August 2018. Chapter 4, section 31E1021 Ellipsis (2017) Review of USAO framework. [Online]. Available at: https://www.ellipsis.co.za/review-of-universal-service-and-access- obligation-usao-framework/ [Last viewed on 10 April 2019]1022 Electronic Communications Amendment Bill. Government Gazette No. 41880, 31 August 2018. Chapter 4, section 31A.
1023 Ellipsis (2017) Review of USAO framework. [Online]. Available at: https://www.ellipsis.co.za/review-of-universal-service-and-access-
considered have also changed). Clause 31E of the new Bill provides for the assignment of unassigned high demand spectrum not assigned to the WOAN, to other licensees on certain conditions, such as the procurement of capacity in the WOAN.1019 The section also provides that ICASA must conduct an inquiry on currently assigned high demand spectrum, at least 24 months before the expiry of the relevant radio frequency spectrum licences, and make recommendations to the Minister on the terms and conditions that may apply to such licenses as a condition for the renewal thereof. The Minister is then required to issue a policy direction to ICASA regarding such terms and conditions, no later than 3 months before the licences expire.1020
Universal Access and Service
743. The Government has increasingly devoted attention to the divide between urban and rural areas, a key issue in addressing those sections of the population left out of the information society. With regards to the Universal Access and Service Obligations (USAOs)1021 of radio frequency licensees, ICASA must impose these obligations (on both existing and new radio frequency licensees) after consultation with USAASA and approval by the Minister. The Bill indicates these obligations must be comparable across licensees in similar spectrum bands, and must include the obligation for licensees to report annually on their compliance. These compliance reports will be publicly available – and ICASA must evaluate compliance annually as a condition of renewal of the licence(s).1022
744. ICASA initiated the review of USAOs of licensees in 2008 and 2009, with the intention of amending the obligations to account for changed circumstances in the market. In February 2017, ICASA invited the public to comment on proposals by Sentech, WBS and Telkom regarding the amendment of the USAOs imposed on them under the licenses issued to them by ICASA. A year later, in February this year ICASA invited the public to comment on an application filed by Telkom on 16 November 2017 for the amendment of its USAOs.1023 These
208
obligations are still required by ICASA and are yet to be defined in the legislature.
ICASA Call Termination Regulations
745. On 13 February 2018, ICASA issued a briefing note as a further step towards finalising its latest review of the regulatory framework for call termination. The briefing note covers the aspect of asymmetry in mobile and fixed wholesale voice call termination. The purpose of the briefing note is to offer clarity regarding the principles in relation to asymmetry following the review process of the 2014 call termination conditions (seen as pro-competitive) imposed on licensees. ICASA has extended its current call termination glide path for 12 months while it performs a new cost study to determine new termination rates.
746. Future changes to MTRs could hold cost implications for the provision of mobile services, which could thereby potentially affect how operators apportion these costs towards the pricing of their data offering and services. According to the current regulations, Vodacom and MTN will continue to charge R0.13 for calls from other networks to connect to their subscribers, while Cell C and Telkom are presently allowed to charge R0.19. The conditions imposed by ICASA on licensees in 2014 are still relevant at present.
The Broadcasting Digital Migration Process
747. The Broadcasting Digital Migration process was initiated in South Africa in 2006 and is essentially defined as the process of migrating from the use of analogue forms of broadcasting to digital broadcasting.1024 The main advantage of the migration (or switchover) from an analogue television signal to a Digital Terrestrial Television (DTT) signal (as is prescribed to countries by ITU) is that it allows for the radio frequencies that were previously used for analogue broadcasting services to be freed up and released for mobile telecommunications services.
obligation-usao-framework/ [Last viewed on 10 April 2019]1024 Broadcasting Digital Migration Policy. Government notice No. 31408. 8 September 2008 1025 ITWeb (2018) ‘Budget: DOC outlines plans for digital migration’. [Online]. Available at: https://www.itweb.co.za/content/KBpdg7pPk6W7LEew [Accessed on 14 March 2018]1026 ITWeb (2018) Budget: DOC outlines plans for digital migration. Available at: https://www.itweb.co.za/content/KBpdg7pPk6W7LEew [Accessed on 14 March 2018]1027 The End-User and Subscriber Services Charter Amendment Regulations, Notice 233 of Government Gazette 41613. 7 May 2018.
748. A more broad aim and benefit of the switchover to digital is to advance existing technologies in order to improve universal access and thereby close the ‘digital divide’.1025 Digital broadcasting, in addition to freeing up valuable frequencies, can also contribute to addressing South Africa’s developmental challenges, such as information gaps and employment creation. Accordingly, broadcasting digital migration has been identified as a national priority, and ties in with government’s policy objectives around the costs of communicating in South Africa.
749. ITU affiliate countries, including South Africa, have agreed to the initial deadline for the switchover as 17 June 2015. This deadline for South Africa’s digital migration has been extended to June 2019.1026 In terms of meeting the latest deadline, the Department of Communications and the Minister have indicated that a DTT war room has been established to implement the migration project and the intentional deadline. In July 2018, the Minister of Communications, Nomvulva Mokonyane, announced the appointment of a 12-member Broadcasting Digital Migration Advisory Council to advise her on the DTT plan. The council will also oversee the countdown to the first planned switch-off in the Free State by December 2018, accompanied by the promotion of the uptake of DTT by South Africans. The council members will stay in office until analogue switch-over for the whole country has been completed. The DTT delivery model is currently being reviewed to expedite Analogue Switch-Off (ASO). Analogue viewers are those without a satellite dish or a decoder. Details of the revised model and the date for ASO will be released after consultation with Cabinet.
ICASA End-User and Subscriber Service Charter Regulations
750. ICASA published its amended End-User and Subscriber Service Charter Regulations1027 on 7 May 2018. The End-user and subscriber service charter amendment regulation of 2016 was precipitated by general concerns of the public regarding unfair business rules imposed by licensees in the provision of data services to consumers. These new regulations within the

209
ECA aim to prevent bill shocks for consumers of voice/SMS services and data services, due to obscure OOB charges and other unfavourable terms affecting consumers.1028
751. Service providers are prohibited, under the new regulations, from charging subscribers for OOB data usage without prior subscriber consent. This is to ensure that consumers are not defaulted to OOB data charges, which are higher than in-bundle charges. The regulations require all licensees to provide an option to consumers to roll over unused data, in order to prevent consumers losing unused data which is the current practice. All licensees are required to provide an option to consumers to transfer data to another subscriber on the same network.1029 The new regulations would also require licensees to send notifications on usage depletion to consumers when their usage is at 50%, 80% and 100% depletion levels to allow consumers to monitor their usage and spend on communication services.1030
752. Following court action by Cell C, where the operator filed an urgent application at the High Court on 6 June 2018 to seek a postponement of the implementation of the regulations, ICASA at the time decided to defend the matter on that basis that it is required, in terms of its legislative mandate. The review application came against the backdrop of Cell C and MTN requesting an extension of the date of implementation of the Regulations which was 8 June 2018. Cell C had requested a six month extension to comply with the Regulations. ICASA had resolved to postpone the effective date until the matter has been heard by the Court. During the intervening period licensees were not penalised for non-compliance.
1028 The End-User and Subscriber Services Charter Amendment Regulations, Notice 233 of Government Gazette 41613. 7 May 2018.1029 ICASA website- https://icasa.org.za.live.flowroot4.flowsa.net/news/2018/announcement-of-final-end-user-and-service-subscriber- charter-regulations1030 ICASA website- https://icasa.org.za.live.flowroot4.flowsa.net/news/2018/announcement-of-final-end-user-and-service-subscriber- charter-regulations1031 ICASA website. ICASA, Cell C and MTN reach a settlement on the matter relating to implementation of End-User and Subscriber Service Charter Regulations. 2018. Available at: https://www.icasa.org.za/news/2018/icasa-cell-c-and-mtn-reach-a-settlement-on-end-user-and- subscriber-service-charter-regulations Accessed on 16 November 2018.1032 ICASA website. ICASA, Cell C and MTN reach a settlement on the matter relating to implementation of End-User and Subscriber Service Charter Regulations. 2018. Available at: https://www.icasa.org.za/news/2018/icasa-cell-c-and-mtn-reach-a-settlement-on-end-user-and- subscriber-service-charter-regulations Accessed on 16 November 2018.1033 Joint Statement: Minister Dr. Siyabonga Cwele and the Council of ICASA agree to settle the spectrum court challenge and to initiate the licensing of unallocated high demand spectrum. 26 September 2018. Available at: https://www.dtps.gov.za/index.php?option=com_ content&view=article&id=760:minister-dr-siyabonga-cwele-and-the-council-of-icasa-agree-to-settle-the-spectrum-court-challenge-and- to-initiate-the-licensing-of-unallocated-high-demand-spectrum&catid=13&Itemid=138 [Accessed on 12 November 2018]1034 South African Government (September 2018) President Cyril Ramaphosa: Economic stimulus and recovery plan speech. Available at: https://www.gov.za/speeches/president-cyril-ramaphosa-economic-stimulus-and-recovery-plan-21-sep-2018-0000 [Accessed on 12 November 2018]
753. During November 2018, this matter between ICASA, Cell C and MTN was resolved as the parties reached a settlement on the matter relating to the implementation of the End-User and Subscriber Service Charter Regulations.1031 The settlement terms include the fact that the End-User and Subscriber Service Charter Regulations be implemented from 28 February 2019. ICASA’s CEO, Willington Ngwepe, has stated that the certainty on the effective date of the regulations is welcomed as the regulations are important in that they provide relief to consumers by prescribing minimum standards of services in terms of which licensees are compelled to allow data roll-over, data transfer and to cease the automatic charging of OOB rates.1032
Settlement agreement between DTPS and ICASA
754. The former Minister of Telecommunications and Postal Services Dr Siyabonga Cwele and the Council of ICASA have agreed to settle the court matter involving the ITA which was issued on 15 July 2016 for the allocation of high demand spectrum.1033 The settlement agreement will see ICASA cancelling the initial ITA and the Minister withdrawing its legal challenge. The settlement follows President Cyril Ramaphosa’s call to “initiate the process for the allocation of high-demand radio spectrum to enable licensing” which was made on 21 September 2018 as part of the announcement of the economic stimulus and economic recovery plan.1034
755. The joint statement goes on to state that the Minister intends to direct ICASA to issue an ITA, accept and consider applications for ECNS licenses and radio frequency spectrum licences for unassigned high demand spectrum not reserved for assignment to the ECNS that provide wholesale open access. ICASA will commence the licensing process for the

210
assignment of high demand spectrum at the end of the public consultation process, and after considering the final policy and policy directions issued by the Minister.1035
Draft International Mobile Telecommunications (IMT) Roadmap for South Africa
756. On 9 November 2018, ICASA published a new draft roadmap for International Mobile Telecommunications (IMT) in South Africa, available for public comment, within the context of preparing for an auction of spectrum in the 700Mhz, 800MHz and 2.6GHz band in 2019 or 2020.1036 The increasing demand for mobile broadband in South Africa indicates the requirement for more mobile broadband bandwidth capacity, in general, but specifically for universal mobile broadband coverage in many rural areas which are best served by deploying lower frequencies that propagate further. The ITU has identified frequency bands that could be used for IMT, which is primarily intended for mobile broadband.1037
757. The Radio Frequency Migration Plan 2013 identified which of these IMT bands (between 450 and 3600 MHz) could be deployed in South Africa based on the 2013 National Radio Frequency Plan (NRFP). The 2013 NRFP has since been replaced by the draft Frequency Migration Plan 2018 and the NRFP 2013 has been replaced by NRFP 2018. The deployment of IMT bands is driven by the need to ensure that mobile broadband plays its role in achieving the ‘broadband for all’ objectives, which is included in the targets of South Africa’s broadband policy, SA Connect. 1038
1035 Joint Statement: Minister Dr. Siyabonga Cwele and the Council of ICASA agree to settle the spectrum court challenge and to initiate the licensing of unallocated high demand spectrum. 26 September 2018. Available at: https://www.dtps.gov.za/index.php?option=com_ content&view=article&id=760:minister-dr-siyabonga-cwele-and-the-council-of-icasa-agree-to-settle-the-spectrum-court-challenge-and- to-initiate-the-licensing-of-unallocated-high-demand-spectrum&catid=13&Itemid=138 Accessed on 12 November 2018.1036 Ellipsis regulatory solutions. https://www.ellipsis.co.za/roadmap-for-international-mobile-telecommunications-imt-in-south-africa/1037 Draft International Mobile Telecommunications (IMT) for South Africa. 9 November 2018. Gazette No 42021 (General Notice No.683).1038 Draft International Mobile Telecommunications (IMT) for South Africa. 9 November 2018. Gazette No 42021 (General Notice No.683).1039 Draft International Mobile Telecommunications (IMT) for South Africa. 9 November 2018. Gazette No 42021 (General Notice No.683).
758. A key part of this IMT roadmap, concerns the deployment of the 700MHz and 800MHz digital dividend bands that is still currently occupied by analogue and DTT. The DOC have appointed a team to prioritise DTT implementation in order to release the 700 and 800MHz spectrum for IMT. Essential services, particularly in context of South Africa, which are connected to the release of IMT spectrum include enhanced mobile broadband and the evolution of IoT services and applications. The IMT Roadmap summarised the ITU perspective on IMT, the SADC perspective on IMT, the SA Connect targets and the related issue of universal service and obligations.1039

211
759. Following the publishing of the ToR, the Commission published a formal CfS on 20 September 2017. The CfS invited submissions from any interested stakeholders on a number of issues flowing from the ToR as well as any other issue relevant to the Inquiry and data prices more broadly. The Commission publicised this CfS in media releases and sent invitations to approximately 82 stakeholders inviting submissions. The Commission received 16 submissions from stakeholders in response to the CfS.
760. Subsequent to the Commission receiving these submissions, and through the course of the Inquiry, the Commission received a number of other submissions and information both from stakeholders that responded to the CfS as well as other stakeholders identified by the Commission during the course of the Inquiry.
761. In addition, the Commission released a notice regarding Public Hearings on the 18th of September 2018 informing the public of the hearings and inviting stakeholders to participate making written submissions by 11 October 2018. The Commission received submissions (including presentations) from 16 stakeholders and the public hearings were held from the 17th to the 19th of October 2018.
762. This appendix is structured as follows:
762.1. Firstly, we present a summary of all submissions made in response to the CfS, which included submissions by 16 stakeholders.
762.2. Secondly, we present a summary of all submissions made in relation to the public hearings held by the Commission. Submissions and presentations were made by 16 stakeholders.
1040 Certain stakeholders did not allow the Commission to publish their submissions. These include: MWEB (its submission in response to the CfS) and DTPS (its submission in response to the CfS).
762.3. Thirdly, we detail any further concerns identified in the course of the Inquiry from information submitted and consultations with stakeholders.
12.1. Submissions received in response to the
CfS
763. This sub-section provides a summary of the submissions made in response to the Commission’s CfS published on 20 September 2017. The CfS was discussed in more detail in Section 1.2 above, and it is available on the Commission’s website. To the extent that the reader needs further detail on a submission made to the Commission in this regard, non-confidential versions of most submissions can be found on the Commission’s website1040. These non-confidential versions of submissions were made available for review and further comment on the Commission’s website on 13 September 2018.
764. Submissions were made by the following stakeholders:
764.1. MTN is a mobile operator and it offers voice, data and digital services to consumers. Its business include unified communications, security as a service, managed networks, cloud services, software as a service and enterprise mobility.
764.2. Telkom is a leading communications service provider in South Africa and on the African continent. It offers business, residential and payphone customers a wide range of services and products, including fixed-line subscription and connection services, fixed-line traffic services, interconnection services, fixed-line data centre operations and internet services, e-commerce, mobile
12. APPENDIX D: SUMMARY OF SUBMISSIONS AND KEY CONCERNS
212
communication services and other services. 1041
764.3. Vodacom is a leading African communications company providing a wide range of communication services, including mobile voice, messaging, data, financial and converged services to over 103 million (including Safaricom) customers.1042
764.4. Cell C is a cellular telecommunications company, it provides mobile services in South Africa. It offers voice, data and messaging services.
764.5. ECN is a wholly owned subsidiary of Reunert Limited and offers a broad set of cost effective voice, data and hosted services to meet their customers ever growing technological needs.
764.6. amandla.mobi1043 is an independent, community advocacy organisation with over 131,000 members that seeks to build a more just and “people-empowered Mzansi”. 1044
764.7. A4AI is the world’s broadest technology sector coalition working to drive down the cost of internet access in less developing countries.
764.8. ISPA is a South African non-profit company and recognised internet representative body, facilitating exchange between the different independent internet service providers, ICASA, other government structures, operators and other service providers in South Africa.
764.9. MMA is a non-profit organisation (“NGO”) that has been monitoring the media since 1993 and its aim is to promote the development of a free, fair, ethical and critical media culture in South Africa and the rest of the continent.
764.10. The Right2Know Campaign (“Right2Know”) is a coalition of organisations and activists across South Africa focusing on issues of information
1041 Telkom. Company Profile. [Online]. Available at http://www.telkom.co.za/about_us/company_profile.html. [Accessed 03 March 2019]1042 Vodacom. Profile. [Online]. Available at http://www.vodacom.com/company-profile.php. [Accessed 03 March 2019]1043 We have focused our summary on the formal submission by amandla.mobi and did not include individual comments collected from 44,726 signatures substantiating people’s experience on data prices on the Commission’s website.1044 Amandla.mobi. About. Available at: https://www.amandla.mobi/about. [Accessed 03 March 2019]
access, secrecy, surveillance media and communication and freedom of expression.
764.11. DG MT is a South African grant-making foundation committed to developing the potential of people in South Africa and connectivity opportunity is one of their focus area.
764.12. Tarifica is a leading provider of telecommunications pricing information for close to four decades.
764.13. Broadband Infraco was established in terms of the Broadband Infraco Act, No. 33 of 2007. The Company has a statutory mandate to extend the provision of access to electronic communications, including but not limited to under-developed and under-serviced areas through the provision of (a) electronic communications network services; and (b) electronic communications services.
764.14. Mr Kuziva Muzondo in his personal capacity.
765. The purpose of this summary of submissions is to summarise all the key points made by stakeholders under different themes in line with the issues identified in the ToR. In some instances, the submissions are dealt with in more detail in other sections, particularly where a more detailed assessment of the claims made is necessary.
12.1.1. Outcomes in the South African market 766. This sub-section provides a summary of the
submissions regarding outcomes in the South African market. Outcomes in this instance refers to the pricing and quality of telecommunications products at a retail level in the South African data market. A number of submissions argue that prices are competitive in the fixed data market and that fixed data prices have decreased over time. In contrast, some submissions argue that prices are not competitive in the mobile market and mobile data prices are high.
767. The CfS said that South Africa’s data prices are higher than many other countries and the

213
CfS asked for submissions on this, however few submissions were received with respect to this element. Only Vodacom and MTN made submissions that pricing and quality outcomes are more competitive than what is perceived. Vodacom firstly argues that a pricing assessment of data only offerings is difficult and artificial because the price of data is offered within bundled service offerings [].1045 Vodacom and MTN further highlight that conducting a cross-country study on prices is complicated. Notwithstanding this, Vodacom is of the view that available evidence shows that, when taking quality into account, South Africa performs well on pricing outcomes as compared to other African countries. MTN also argues that mobile connectivity is far more affordable in South Africa than in many other African countries. These views are, however, not supported by other stakeholders who made submissions on this matter. In this regard, a number of submissions are of the view that South Africa performs relatively poorly as compared to other countries in terms of price and quality.
768. Below is a summary of the submissions regarding outcomes in the South African market.
Fixed data price outcomes
769. Telkom submits that over the last three years, fixed data prices have decreased. For instance, the price of Telkom’s 10Mbps uncapped product was R999 in 2015 and in August 2017, Telkom reduced the selling price by 20% to R799.1046 Further, Telkom submits that the competitive dynamics in the fixed data market have improved in recent years in that there are a lot of Internet Service Providers (ISPs).1047 Telkom further submits that many ISPs own their networks and operate a variety of business models, “ranging from vertically integrated network operators, such as Telkom and Liquid Telecom, to smaller ISPs which
1045 Vodacom letter (non-confidential version) dated 30 November 2017 (In Cliffe Dekker Hofmeyer’s letter head), p. 2, para. 4.11046 Telkom’s submission (non-confidential version) dated 17 November 2017, p. 23, para. 951047 Telkom’s submission (non-confidential version) dated 17 November 2017, p. 4, para. 211048 Telkom’s submission (non-confidential version) dated 17 November 2017, p. 4, para. 211049 Telkom’s submission (non-confidential version) dated 17 November 2017, p. 4, para. 231050 Telkom’s submission (non-confidential version) dated 17 November 2017, p. 4, para. 231051 MWEB’s submission dated 01 November 2017, p. 1, para. 9.11052 Light user profile is defined categorised as Post-paid Data only and Pre-paid data only. Post-paid light user profile is someone who uses 500MB of data per month on 3G or better speeds. Pre-paid light user is someone who uses 250MB of data per month on 3G or better speeds.1053 Heavy user profile is defined categorised as Post-paid Data only and Pre-paid data only. Post-paid heavy user profile is someone who uses 8GB of data per month on 4G. Pre-paid heavy user is someone who uses 4GB of data per month on 4G.1054 Tarifica’s submission dated 01 November 2017, introduction note and p. 221055 MTN’s submission (non-confidential version) dated 27 November 2017, p. 4, para. 1.81056 MTN’s submission (non-confidential version) dated 27 November 2017, p. 29, para. 3.16
purchase network services on a wholesale basis from other operators”.1048
770. Telkom further submits that there has been a significant improvement in the provision of business data services and “the changes in the provision of wholesale fixed network services have reduced the barriers to entry and expansion in the supply of business data services”.1049 Telkom further adds that technological developments have further reduced the cost of supplying data services to business customers1050.
Mobile data price outcomes
771. MWEB also submits [] 1051
772. Tarifica submits that in the light-user1052 profiles, especially the data-only profiles, all three mobile operators offer competitive prices, however for heavy-user profiles1053, prices are expensive and differ greatly between MNOs. Overall, Tarifica is of the view that the post-paid mobile market is providing good value for money and the value delivered to end-users is on par with major markets. Notwithstanding this, Tarifica submits that there is scope for improvement in the pre-paid segment, especially in the moderate and heavy user categories.1054
773. MTN is of the view that outcomes have improved significantly in recent years. In this regard, MTN submits that in the last five years, data volume on MTN’s network has increased 18 times, “while MTN’s data prices have fallen by 85% over this same period, and 4G LTE handset prices that it has imported have fallen by 86% over the last three years”.1055 In addition, MTN submits that over the last two years, MTN has reduced data effective rates by more than 55% because of value packed post-paid offers, “as well as affordably priced hourly, daily, weekly and monthly prepaid data bundles”.1056

214
Mobile data prices compared to international prices
774. Vodacom submits that, in the mobile market (the largest part of Vodacom’s business) [].1057 [] customers “make use of offerings that combine voice, messaging (SMS) and data”.1058 Based on this, Vodacom argues that an appropriate analysis of the pricing level of data, as a stand-alone offering is challenging and artificial given that data is priced within bundled service offerings. In addition, Vodacom states that it is difficult to conduct a cross-country price analysis of data prices because important factors such as differences in the service quality, coverage and spectrum-related issues are different between countries.1059
775. Vodacom further argues that benchmarking mobile data prices is difficult and it should ideally take into account disparities in economic and geographic factors across countries. According to Vodacom, “most countries have many mobile tariffs, with pricing promotions regularly being added and updated”.1060 Given this, Vodacom argues that the effective price that a consumer will pay for data services is determined by how a consumer uses a tariff plan taking into account the specific pricing promotions, “which is difficult to fully capture in a cross-country comparison”.1061 Vodacom also advises that non-price outcomes such as speed and coverage should be considered and it is also important to be aware that these non-price outcomes can significantly differ “both across countries and over time”.1062 Lastly, Vodacom argues that “the difficulties in developing meaningful comparisons are significantly enhanced as the size of the comparator group increases. This is because the variation in economic and geographical factors becomes more acute when considering
1057 Vodacom letter dated 30 November 2017 (In Cliffe Dekker Hofmeyer’s letterhead), p. 2, para.4.11058 Vodacom letter dated 30 November 2017 (In Cliffe Dekker Hofmeyer’s letterhead), p. 2, para.4.11059 Vodacom letter (non-confidential) dated 30 November 2017 (In Cliffe Dekker Hofmeyer’s letterhead), p. 2, para.4.11060 Frontier Economics (30 November 2017) Assessing key outcomes in the market for mobile data services in South Africa (non-confidential version), p. 131061 Frontier Economics (30 November 2017) Assessing key outcomes in the market for mobile data services in South Africa (non-confidential version), p. 51062 Frontier Economics (30 November 2017) Assessing key outcomes in the market for mobile data services in South Africa (non-confidential version), p. 131063 Frontier Economics (30 November 2017) Assessing key outcomes in the market for mobile data services in South Africa (non-confidential version), p. 61064 Frontier Economics (30 November 2017) Assessing key outcomes in the market for mobile data services in South Africa (non-confidential version), p. 21-251065 Frontier Economics (30 November 2017) Assessing key outcomes in the market for mobile data services in South Africa (non-confidential version), p. 251066 Frontier Economics (30 November 2017) Assessing key outcomes in the market for mobile data services in South Africa (non-confidential version), p. 251067 Frontier Economics (30 November 2017) Assessing key outcomes in the market for mobile data services in South Africa (non-confidential version), p. 41068 Frontier Economics (30 November 2017) Assessing key outcomes in the market for mobile data services in South Africa (non-confidential version), p. 25.
a wider sample of countries at very different stages of development, both in terms of the evolution of telecommunications market and the wider economy”.1063
776. Notwithstanding the aforementioned challenges with cross-country price benchmarking, Vodacom submits that South African headline prices are better than other African countries. In this regard, Vodacom cites studies conducted by ICASA and RIA and argues that without taking into account non-price factors, prices are typically lower in South Africa than the average for African countries. Vodacom states that the ICASA price benchmarking study shows that prices in South Africa for 1GB and 2GB bundles are on par with those of comparator countries. According to Vodacom, a recent ICASA study comparing the cheapest 500MB tariff for selected African countries shows that South Africa is ranked 14th out of the 19 countries that were part of this comparison.1064
777. Vodacom further states that the 2017 Value for Money Index conducted by RIA “which compares the value of the contents of a bundle with the bundle price”1065 ranked South Africa 10th out of 35 African countries. Vodacom further submits that RIA’s most recent study into cheapest headline prices for a monthly 1GB data basket ranked South Africa 28th out of 50 African countries.1066 According to Vodacom, these studies are also supported by comprehensive data sets from ITU and GSMA “which shows that prices in South Africa are often among the lowest priced in the sample of all African countries and typically below the sample average”1067. For instance, Vodacom submits that the ITU study of a standard 500MB prepaid basket ranked South Africa 14th out of 39 African countries included in the study.1068

215
In addition, Vodacom submits that the GSMA pricing index value for 41 African countries shows that amongst African countries, “South Africa is consistently ranked amongst the cheapest in Africa”1069, and when compared to a wider set of international benchmarks, South Africa is on par with the overall sample.1070
778. MTN submits that many factors can cause international price benchmarking analysis to produce biased results. Further, MTN submits that “choosing the correct selection of countries, that would adequately account for this vast array of factors including demand, population, demographics, socio-economic factors and geography is likely to be very challenging”1071. In addition, MTN highlights that “it may be difficult to appropriately compare the range of different bundles available in different countries”1072 and it is also difficulty to establish whether or not prices in comparator countries are competitive.1073 Further, MTN argues that costing factors such as the demand distribution of customers as well as the geographical environments in which MNOs provide services can also differ significantly within a given country and across different countries.1074
779. MTN argues that one way to control for some of the cost differentials is by comparing the affordability of mobile data services in each country. In this regard, MTN cites GSMA Mobile Connectivity Index which “takes the minimum cost of low usage (100MB), medium usage (500MB) and high usage (1GB) tariff and calculates prices as a proportion of Gross National Income (GNI) per capita”.1075 MTN argues that using this method, South Africa data prices are better than many African countries (in that they are more affordable).1076 MTN also submits that the World Bank and ITU have released recent studies that address handset affordability1077, their studies show that
1069 Frontier Economics (30 November 2017) Assessing key outcomes in the market for mobile data services in South Africa (non-confidential version), p. 25.1070 Frontier Economics (30 November 2017) Assessing key outcomes in the market for mobile data services in South Africa (non-confidential version), p. 27.1071 MTN’s submission (non-confidential version) dated 27 November 2017, p. 34, para. 3.321072 MTN’s submission (non-confidential version) dated 27 November 2017, p. 34, para. 3.351073 MTN’s submission (non-confidential version) dated 27 November 2017, p. 34, para. 3.361074 MTN’s submission (non-confidential version) dated 27 November 2017, p. 34, para. 3.421075 MTN’s submission (non-confidential version) dated 27 November 2017, p. 34, para. 3.46-3.471076 MTN’s submission (non-confidential version) dated 27 November 2017, p. 34, para. 3.471077 Handset affordability is based on the cheapest available handset in each market which is at least 3G enabled1078 MTN’s submission (non-confidential version) dated 27 November 2017,p.37, para 3.491079 MWEB’s submission dated 01 November 2017, p. 11080 Frontier Economics (30 November 2017) Assessing key outcomes in the market for mobile data services in South Africa (non-confidential version), p. 7 1081 MTN’s submission (non-confidential version) dated 27 November 2017, p. 36, para. 3.391082 A4AI’s submission dated 01 November 2017, p. 41083 Tarifica’s submission dated 01 November 2017, p. 221084 DTPS’s submission dated 03 November 2017, p. 2
compared to other African countries, handset prices in South Africa are far more affordable.1078
780. MWEB however [].”1079
Mobile data non-price outcomes
781. In relation to non-price outcomes, Vodacom submits that South Africa’s mobile data market is delivering good outcomes. According to Vodacom, “average download and uploads speeds are far above other African countries”.1080
782. MTN shares similar views and submits that when considering aspects of network quality, such as mobile data downloads speeds, South African consumers enjoy better download speeds than other consumers in many African countries.1081
783. Contradictory views are held by A4AI and Tarifica regarding South Africa’s non-pricing performance relative to other countries. In this regard, A4AI submits that the global average internet speed is 6.1mbps while South Africa has an average internet speed of 4.8mbps, albeit only Kenya has a higher internet speed in Africa than South Africa.1082 Tarifica’s report also shows that in both pre and post-plans categories, data heavy profiles in South Africa perform the worst relative to other markets.1083
784. DTPS submits that according to the [] 1084
Mobile and fixed data non-price outcomes
785. Telkom is of the view that there has been an improvement in speed and data service quality (in relation to both fixed and mobile data) over time. In this regard, Telkom states that the average speed was 2-3 mbps in 2014 and it increased to 6-7 mbps in 2017. According to Telkom, fixed data average actual download

216
speed reached an average of 6.9 mbps at the beginning of 2017, mobile data average download speed on the other hand was 6.7 mbps at the beginning of 2017.1085
12.1.2. Market definition and competition dynamics
786. This sub-section provides a summary of all
submissions regarding market definition and competitive dynamics in the South African data market. Some stakeholders are of the view that mobile data services are a constraint to fixed mobile data services while others are of the view that the two types of data services do not constrain each other. Similarly, market participants are not in agreement regarding the competitive dynamics of fixed and mobile data services markets. Vodacom in particular is of the view that infrastructure based competition is key and that is already happening in the mobile data market.
787. Below is a summary of all the submissions regarding market definition and competition dynamics.
788. Vodacom submits that “data is sold within three main markets, namely the mobile retail market, the fixed retail broadband internet access market and the leased line internet access market”.1086 However, Telkom disputes the assertion that mobile and fixed data services are not in the same market and submits that fixed broadband service services are tightly constrained by the mobile broadband plans available. According to Telkom, “the technical performance of broadband services provided to consumers over fixed and mobile networks in South Africa is very similar”1087 and many consumers have cancelled their fixed line subscription and now access data services exclusively using mobile devices.1088
1085 Telkom’s submission (non-confidential version) dated 17 November 2017, p.3 and 201086 Vodacom letter (non-confidential version) dated 30 November 2017 (In Cliffe Dekker Hofmeyer’s letter head), p. 1, para.2.2)1087 Telkom’s submission (Non-confidential version) dated 17 November 2017, p.401088 Telkom submission Non-confidential dated 17 November 2017, p. 401089 ECN submission, Non-confidential dated 01 November 2017, p. 261090 ECN submission, Non-confidential dated 01 November 2017, p. 261091 Vodacom letter (non-confidential version) dated 30 November 2017 (In Cliffe Dekker Hofmeyer’s letter head), p.1, para.2.31092 ECN’s submission (Non-confidential version) dated 01 November 2017, p. 171093 ECN’s submission (Non-confidential version) dated 01 November 2017, p. 171094 Telkom’s submission (Non-confidential version) dated 17 November 2017, p. 371095 This is understood to refer to the settlement agreement in the context of the Competition Commission vs Telkom SA SOC Limited, Tribunal Case No.: 55/CR/Jul09; 73/CR/Oct09 and 78/CR/Nov09 case whereby Telkom made a number of commitments including functional separation between the supply of upstream fixed line infrastructure and the supply of downstream managed network services, pricing programs outlining how prices of upstream products would be determined as well as committed price reductions in certain products over an agreed period of time.1096 Telkom’s submission (non-confidential version) dated 17 November 2017, p. 37-381097 Telkom’s submission (non-confidential version) dated 17 November 2017, p. 43
789. ECN shares contrary views and submits that fixed data services and mobile data services are not in the same market. According to ECN, mobility is a key differentiator between mobile and fixed data services, “fixed data services have and will continue to have a limited footprint”1089 and from a technical perspective, fixed and mobile services are constructed and delivered differently which impacts prices. 1090
790. In relation to competitive outcomes, Vodacom is of the view that there are competition issues in the fixed data market.1091 ECN however shares a contrasting view and submits that fixed Electronic Communications Service (“ECS”) market has been competitive post the liberalisation of SA telecommunications market in 2009. ECN‘s view is on the basis that “there are more than 1 000 individual ECS licensees in South Africa”1092 and they compete with each other.1093
791. Telkom also argues that “the competitive landscape in respect of the provision of fixed consumer data services has changed dramatically in recent years”.1094 In addition, Telkom submits that there has been growth in the fixed broadband market due to the settlement agreement between Telkom and the Commission1095, functional separation of Telkom wholesale and retail divisions (resulting in the creation of Openserve) and growing competition at the infrastructure (wholesale and retail fibre) level and services level of the value chain.1096
792. Telkom submits that over the last three years, only Telkom Mobile has significantly reduced mobile data prices while other MNOs have not reduced data prices. Telkom submits that this potentially shows that there are competition issues in the mobile broadband market.1097
217
793. Vodacom is of the view that the mobile market in which data is sold is competitive.1098 Vodacom also states that “there is currently strong infrastructure-based competition between the four MNOs”.1099 Vodacom further states that notwithstanding differences in market shares, there is competition amongst MNOs across a wide range of dimensions including prices, coverage, data speeds, innovation and customer service. According to Vodacom, MNOs do not have market power because spectrum is fairly assigned to all the MNOs, MNOs have an option to “replicate each other’s’ coverage by extending their own network coverage”1100, MNOs are always making substantial investments in order to maintain their market shares and “smaller operators exert a stronger competitive constraint than is suggested by market shares alone”.1101
794. Vodacom further submits that “there are also a number of commercially negotiated national roaming and Mobile Virtual Network Operator (“MVNO”) deals in South Africa, which enable and enhance competition in the mobile retail market”.1102 Furthermore, Vodacom further adds that during roaming negotiations, “Cell C and Telkom can increase their bargaining power by a) self-building and suspend roaming once they have achieved national coverage, b) split roaming between various providers [something Cell C has mentioned as a consideration], c) offer to procure roaming from only one provider, and d) select to roam in certain geographic areas and self-build in others.”1103 Furthermore, Vodacom adds that “with Rain’s entry, the number of operators providing roaming have now increased to three, increasing the options available further”.1104
795. MTN shares a similar view and submits that “the provision of mobile connectivity and in particular mobile data services in South Africa is highly competitive”.1105 MTN‘s argument is on the basis that MNOs have made substantial investments in order to improve the quality and the coverage of their networks, MNOs connections quality have considerably improved over time, data usage volume has exponentially risen, average mobile data prices have decreased significant
1098 Vodacom letter (non-confidential version) dated 30 November 2017 (In Cliffe Dekker Hofmeyer’s letter head), p. 1, para. 2.31099 Vodacom letter (non-confidential version) dated 30 November 2017 (In Cliffe Dekker Hofmeyer’s letter head), p.13, para. 1.5.1.11100 Frontier Economics (30 November 2017) Assessing key outcomes in the market for mobile data services in South Africa (non-confidential version), p.12 1101 Frontier Economics (30 November 2017) Assessing key outcomes in the market for mobile data services in South Africa (non-confidential version), p.121102 Vodacom letter dated 30 November 2017 (In Cliffe Dekker Hofmeyer’s letterhead), (Non-confidential version) p.13, para. 1.5.1.11103 Cliffe Dekker Hofmeyr on behalf of Vodacom, Non-confidential letter dated 30 November 2017, p. 14, para. 2.111104 Cliffe Dekker Hofmeyr on behalf of Vodacom, Non-confidential letter dated 30 November 2017, p. 15, para. 2.121105 MTN submission (Non-confidential) dated 27 November 2017, p. 211106 MTN submission (Non-confidential) dated 27 November 2017, p. 211107 MTN‘s presentation at the public hearings held on 17-19 October 2018. See Day 2 transcripts, p.1071108 MTN‘s presentation at the public hearings held on 17-19 October 2018. See Day 2 transcripts,p.107-108
and MNOs are constantly competing to offer consumers the best quality network and the best retail offering.1106
796. MTN further argues that the market is competitive at both levels; infrastructure and at the service level. At the infrastructure level, Vodacom argues that “there are six players but to be honest with you there are two strong players, it’s us and the red guys. However, even in an infrastructure level we can compete I am using an example with Cell C that roamed with the red guys for 18 years and the they didn’t just walk into with us, there was a process, there was competition, there was pricing negotiations and they found a better deal with the yellow network. I will go to Telkom; Telkom is with us today but every time we have to be negotiating with Telkom ton stay with us. I go further on the ISPs with Afrihost, but Afrihost moved just to get Rain so we are losing customers just at an infrastructure into Rain. You look at the MVNOs FNB is not with MTN I think Shameel mentioned the point that Standard bank is shopping around I was not aware that they settled with Cell C but let’s say they have but these guys they go around looking for the best deal but the cost is a cost. I do not believe that we can squeeze anything we are doing it every day so that this guy can deliver the maximum capacity at a lowest price and that lowest price is not just for MTN is it’s also for the guy that wants to use the service”.1107 Regarding the service level, MTN argues that “Telkom guys are able to sell a gig for 99 rand a month, I go to MTN we are able to sell 50 megs for the poor for only two rands, I go to the Cell C people they are selling a gig or 1.2 where they combine Facebook and WhatsApp for 17 rands. There is a lot of differentiation all you do is you run your assimilations and the they tell you what the customers respond to and the you basically speak to your engineers what you can deliver and then you talk to the accounts last and then you deliver so at the infrastructure level and the service level, I would be worried if all the prices where the same then I would say there is no competition at a service level you look at the prices that the Rain is charging they price so low that they ran out of capacity by the way again there is spectrum coming again and then…let me stop there.”1108

218
12.1.3. Barriers to entry and expansion
797. This sub-section provides a summary of all the submissions regarding barriers to entry and expansion. The majority of the stakeholders are of the view that there are high barriers to entry and expansion (at least for mobile data services). Stakeholders have also identified spectrum as a barrier to entry and expansion, although spectrum more broadly will also be dealt with in more detail in other sections. Below is a summary of all the submissions regarding barriers to entry and expansion.
798. In relation to the fixed data services market, ECN submits that there are low barriers to entry because there are more than 1000 ECNS licensees who can compete in the provision of ECNS. ECN however highlights that in reality it is the biggest and the best-funded ECNS operators with access to limited resources who are dominant ECNS providers. Based on this, ECN is of the view that the fixed data market is competitive and dynamic, at least relative to the mobile data services market.1109
799. Contrary to the fixed data services market, ECN submits that barriers to entry in the provision of mobile ECNS are high because only six ECNS operators have been assigned GSM and other high-demand spectrum. The second barrier identified by ECN is the capital required by operators in order to build a national mobile ECNS network. Based on this, ECN is of the view that there is less competition in the market that needs it the most (or the market in which South Africa needs it the most).1110
800. According to MWEB, []. 1111
801. Telkom submits that it has proven challenging for new mobile operators to enter the mobile broadband market and successfully challenge Vodacom and MTN.1112 According to Telkom, this shows that there is a lack of effective competition in the provision of mobile broadband services. Further, Telkom submits that new mobile entrants face substantial barriers to entry and expansion which limit their ability to complete with incumbent operators
1109 ECN submission (Non-confidential) dated 01 November 2017, p. 21 & 251110 ECN submission (Non-confidential) dated 01 November 2017, p. 21 & 251111 MWEB submission dated 01 June 2017, p. 1-31112 Telkom submission (non-confidential) dated 17 November 2017, p. 331113 Telkom submission (non-confidential) dated 17 November 2017, p. 34-351114 Telkom submission (non-confidential) dated 17 November 2017, p. 341115 Telkom submission (non-confidential) dated 17 November 2017, p. 351116 Telkom submission (non-confidential) dated 17 November 2017, p. 351117 Cell C submission (non-confidential) dated 24 November 2017, p. 14
because amongst others; costs of building and operating the network are high, there is a lack of suitable sites for RAN infrastructure and customers do not easily switch networks.1113 Telkom further states that although roaming agreements can be concluded to mitigate some of the challenges faced by a new entrant, “the terms of these roaming agreements can be unfavourable to entrants or smaller operators with limited bargaining power and could mean that their incremental costs are higher than those of the large mobile network operators, putting them at a commercial disadvantage”1114.
802. Telkom further argues that given that many customers purchase both mobile voice and data services, factors that create barriers to entry in voice services can potentially create barriers to entry in mobile broadband. According to Telkom, “mobile termination rates in South Africa have historically been high. This has made it hard for new mobile operators to compete in voice and this has, in turn, had a negative indirect impact on their competitiveness in mobile broadband”1115. Telkom also highlights that number portability also affects competition in mobile markets and if implemented incorrectly, it may not be able to assist smaller operators in expanding their operations as subscribers are reluctant to change their number if they switch their network.1116
803. Cell C submits that “new entrants wishing to enter the market will likely struggle to gain access to existing infrastructure on reasonable terms, as Cell C has struggled since its launch”1117. This is on the basis that at the time Cell C entered the market in 2001, only Vodacom and MTN were licensed to provide mobile services. Cell C however concluded a national roaming agreement with Vodacom which allowed Cell C to offer mobile services throughout the country even though at that time Cell C did not have its own network in most areas in South Africa. Cell C however highlights that the ECA or otherwise does not regulate the terms of the roaming agreements. In addition, Cell C states that its roaming agreement with Vodacom does not include LTE roaming and Cell C anticipates that it will be very expensive to obtain the LTE

219
roaming services.1118 Given this, Cell C is not in a position to offer promotional or cheaper data in many of the areas in which it roams on Vodacom’s network because “it will make a loss from the first megabyte of data consumed on Vodacom’s network”1119. Accordingly, Cell C submits that its promotional or cheaper data services are limited to a smaller base (i.e. customers in non-roaming areas) and this has prevented Cell C’s growth in terms of subscriber base and market power.1120
804. DTPS shares [].1121
805. The DTPS further emphasise []”. 1122
12.1.4. Market structure, market power and potential anticompetitive behaviour
806. This sub-section provides a summary of the submissions relating to market structure, market power and anticompetitive behaviour. The submissions indicate that the market is largely dominated by two incumbents who have market power. Submissions also identified some anticompetitive behaviours prevalent in this market. Some of the identified anticompetitive behaviour is that retail data tariffs are lower than wholesale data tariffs, resellers are not able to compete with the pricing of mobile operators, the market is dominated by two MNOs, possible collusion amongst MNOs, site sharing difficulties as well as ‘club-effect’ concerns.
807. Below we summarise these submissions.
808. Telkom states that the industry value chain mainly consists of four primary layers. The first layer is the upstream layer which includes network infrastructure services, such as mobile sites, ducts, poles and dark fibre. Radio spectrum and wholesale internet access also form part of this upstream layer. The second layer “is wholesale network services provided by both mobile and fixed networks. These offer connectivity, between points in the network,
1118 Cell C submission (Non-confidential) dated 24 November 2017, p. 13-141119 Cell C submission (Non-confidential) dated 24 November 2017, p. 141120 Cell C submission (Non-confidential) dated 24 November 2017, p. 141121 DTPS submission dated 03 November 2017, p. 6-71122 DTPS submission dated 03 November 2017, p. 71123 Telkom submission (non-confidential) dated 17 November 2017, p.31124 Telkom submission (non-confidential) dated 17 November 2017, p.2-31125 DTPS submission dated 03 November 2017, page 31126 ECN submission (non-confidential) dated 01 November 2017, p. 271127 Telkom submission (non-confidential) dated 17 November 2017, p. 111128 Right2Know submission dated 01 November 2017, p. 51129 MWEB submission dated 01 November 2017, p. 31130 Cell C submission (non-confidential) dated 24 November 2017, p. 2-31131 Cell C submission (non-confidential) dated 24 November 2017, p. 5
to other licensed operators on a wholesale basis”1123. The third layer includes handsets, devices and customer premises equipment, which is the point of technical interface between customers and the network. The last layer involves retail data services encompassing broadband access, data services, leased lines and managed data services.1124
809. DTPS submits that [].1125
810. ECN shares similar views and submits that there is no doubt that Vodacom is dominant in the provision of retail mobile data services as its market share is greater than 45% and MTN is likely to account for between 35%-45% of the market share.1126
811. Telkom also submits that the incumbents, Vodacom and MTN dominate the market and collectively Vodacom and MTN have [] of mobile subscribers and [] mobile data revenue market shares.1127
812. Right2Know also submits that the telecommunications sector is dominated by a few companies and the nature of the market is oligopolistic.1128
813. MWEB submits that [].1129
814. Cell C submits that in the South African MNO market, two incumbent MNOs are dominant on any measure. According to Cell C, MTN and Vodacom have national coverage, whereas Cell C and Telkom Mobile are reliant on roaming services from Vodacom and MTN respectively because they do not have national coverage.1130 Cell C further states that Vodacom and MTN‘s market shares have not changed significantly between 2012 and 2016, together Vodacom and MTN have more than 90% market share based on revenue.1131
815. ECN submits that “the mobile network operators are vertically-integrated, and they have priced

220
wholesale data tariffs well above retail data tariffs”.1132
816. MWEB submits that []. 1133
817. According to Right2Know, the communication sector also acts like a cartel in that costs (prices) are high by world standards.1134 A similar view is shared by amandla.mobi who submits that the dominance of MTN and Vodacom is creating an environment conducive for possible collusive behaviour. amandla.mobi further states that Vodacom and MTN‘s dominance “has allowed them to keep the price of data high, while creating the illusion of competition through promotions that don’t change the fact that they are making enormous profits without competing the price of data down”1135. DG MT also submits that “it would appear that mobile networks are taking advantage of poorer South Africans by charging them disproportionately high rates”1136. DG MT further states that while mobile operators appear to reduce data prices through special offers, the specials are complicated and are often temporary in nature.1137
818. DTPS [].1138
819. Telkom highlights the challenges of site-sharing and submits that small operators struggle to conclude site-sharing agreements, this view is on the basis that “larger mobile operators can deny requests for tower sharing on a number of grounds including lack of spare space”1139. According to Telkom, in instances where site-sharing has been agreed, the sites are at inferior locations or “at unfavourable heights on towers (i.e. at points lower than other antennas)”.1140
820. Cell C submits that a club effect is created “when a licensee charges less to call on-net (within the same network) than to call off-net (to a different network)”.1141 Cell C adds that “subscribers are encouraged to subscribe to the same network to benefit from the lower on-net calls- calls that
1132 ECN submission (non-confidential) dated 01 November 2017, p. 341133 MWEB submission dated 01 November 2017, p. 21134 Right2Know submission dated 01 November 2017, p. 111135 amanda.mobi submission dated 02 November 2017, p. 31136 DG MT submission, dated 31 October 2017, p. 21137 DG MT submission dated 31 October 2017, p. 21138 DTPS submission dated 03 November 2017, p. 3-41139 Telkom submission (Non-confidential) dated 17 November 2017, p. 311140 Telkom submission (Non-confidential) dated 17 November 2017, p. 321141 Cell C submission (Non-confidential) dated 24 November 2017, p. 9-101142 Cell C submission (Non-confidential) dated 24 November 2017, p. 101143 Cell C submission (Non-confidential) dated 24 November 2017, p. 101144 Cell C submission (Non-confidential) dated 24 November 2017, p. 121145 Cell C submission (Non-confidential) dated 24 November 2017, p. 12
take place within a community or a club. By reducing on-net prices only, the club increases in size”.1142 According to Cell C, “the increase in their subscriber base results in an increase in their economies of scale and scope”1143, whereas a smaller operator such as Cell C does not have economies of scale and scope. Cell C also submits that other examples of exclusionary behaviour of the incumbents include conduct regarding access to infrastructure and national roaming.1144 Cell C further submits that “while such strategic behaviour has mostly been evident in the voice market, this market power can also be leveraged into data markets by the incumbents with market power”.1145
12.1.5. Spectrum
821. This sub-section provides a summary of the submissions regarding spectrum assignment in South Africa. Stakeholders have identified spectrum as an essential input in the provision of mobile data services in South Africa. Stakeholders also submit that South African mobile operators have far less spectrum assignment than their international counterparts. Some stakeholders however dispute the argument that more spectrum equates to lower prices. Spectrum is however dealt with in more detail in a separate section above.
822. Below is a summary of all the submissions regarding spectrum assignment in South Africa.
823. According to Telkom, mobile or other wireless networks require access to spectrum in order to be operational and shortages of spectrum raise mobile operators’ costs of providing network coverage. Telkom further submits that lower frequency spectrum is advantageous (provides further range and penetration) and is asymmetrically assigned to Vodacom, MTN and Cell C, while it has not been assigned any low-frequency spectrum. Telkom further states that lower frequency spectrum is therefore also

221
important in providing mobile data services in rural areas.1146
824. Cell C shares similar views and submits that both low- and high-frequency spectrum is important in order to provide national coverage in the most efficient, least costly manner and to ensure that high-speed broadband services are available to all South African citizens. Cell C further argues that “an operator should be licensed to use frequency in both the low and high bands within its network”.1147 Cell C also argues that all the MNOs (except Telkom Mobile) are capacity constrained and they are unable to meet the growing demands on their networks. Cell C further submits that MNOs capacity can be increased by either acquiring more spectrum or by building more network infrastructure.1148
825. Cell C further submits that important differences remain in the spectrum assignments of the MNOs. Specifically, Cell C submits that “Both the MTN and Cell C assignment in the 900MHz band are not contiguous”.1149 According to Cell C, “in some cases this means that the later of the spectrum bands assigned is not situated immediately next to the existing spectrum bands assigned and the spectrum cannot be bundled together for LTE use”.1150 Cell C further adds that “the bundling of spectrum for the provision of standard LTE services can only be done where the spectrum assigned is contiguous.”1151 Cell C further argues that “this results in difficulties in network equipment having to be differently configured for each band, and this results in higher costs to Cell C. This is a recognised factor in assessing competitive disadvantages in mobile telecommunications.”1152
826. A4AI shares a similar view and submits that spectrum is an important resource sustaining the operations of the mobile industry and submits that there is extensive literature regarding the relationship between spectrum allocation and broadband access. A4AI further cites research by GSMA and National Economic
1146 Telkom submission (Non-confidential) dated 17 November 2017, p. 18,30,311147 Cell C response to information request dated 24 November 2017 (non-confidential), Annexure B, p. 221148 Cell C submission (Non-confidential) dated 24 November 2017, p. 16- 171149 Cell C submission to the Commission (non-confidential) dated 24 November 2017, Annexure B, p. 221150 Cell C submission to the Commission (non-confidential) dated 24 November 2017, Annexure B, p. 221151 Cell C submission to the Commission (non-confidential) dated 24 November 2017, Annexure B, p. 221152 Cell C submission to the Commission (non-confidential) dated 24 November 2017, Annexure B, p. 221153 A4AI submission dated 01 November 2017, p. 31154 MTN submission (Non-confidential) dated 27 November 2017, p. 37, 46, 47, 48.1155 MTN submission (Non-confidential) dated 27 November 2017, p. 481156 MTN submission (Non-confidential) dated 27 November 2017, p. 481157 MTN submission (Non-confidential) dated 27 November 2017, p. 481158 MTN submission (Non-confidential) dated 27 November 2017, p. 50
Research Associates (“NERA”) which shows that consumers pay lower prices for data in countries where the costs of acquiring spectrum is lower. A4AI further submits that the high cost of spectrum auctions sales can escalate the cost of operations for MNOs.1153
827. A similar view is shared by MTN who submits that availability of spectrum across different bands is crucial for MNOs in the provision of data services. In addition, MTN also argues that the lack of additional spectrum has resulted in the most constrained MNOs (Vodacom and MTN) having to substantially increase their capital expenditure in order to expand the capacity of mobile networks to continue meeting the increasing growth in demand, while increasing network quality. MTN further submits that SA MNOs have far less spectrum assigned to them than many of their foreign counterparts. MTN also points to the fact that in South Africa, spectrum has been assigned to six operators while only three operators have been assigned similar spectrum in several countries.1154 MTN further argues that SA MNOs are further faced with “less fixed infrastructure and less potential to offload mobile data onto WI-FI or other fixed solutions, the spectrum constraints faced by SA MNOs are even more acute”.1155
828. Using the spectrum to subscriber share ratio, MTN also highlights that in South Africa, MTN and Vodacom have an under allocation of spectrum while Telkom, Cell C and other smaller players have an over allocation of spectrum.1156 MTN also claim that the lack of spectrum has led to much higher levels of investment for MTN and Vodacom and “resulting in higher costs and prices that would otherwise have been enjoyed”1157. MTN states that in 2017 alone, it invested in an additional 1,500 sites at a cost of around R7.9 billion and the majority of these sites (at the least 60%) were built in order to increase capacity rather than improving quality. Accordingly, MTN argues that “many such sites could be avoided if new spectrum was available”1158.

222
829. MTN also caution that “the ongoing delay in the allocation of additional spectrum, both the high demand spectrum and digital divide spectrum (as entrenched in the amendments proposed in the ECA Bill), has significant implications for data pricing and availability, National Treasury and broader economic development”.1159 In this regard, MTN cites a study conducted by Plum Consulting on behalf of GSMA in 2011 which estimated that releasing additional spectrum early in South Africa would increase GDP by R78 billion, increase subscribers by 7.6 million, create an additional 1 million jobs and increase tax revenue by R16 billion per annum by 2020. The same study also estimated that a 5-year delay in releasing this spectrum from 2014 to 2019 could results in the reduction of R355 billion in GDP and R70 billion in tax revenue.1160 Furthermore, MTN submits that “if additional spectrum could be released, by way of illustration if digital spectrum alone were released, speeds up to 300Mbit/s could be available immediately, which would deliver significant quality improvements to users”1161. MTN argues that spectrum limitation is now a serious concern and regulators must intervene to solve the spectrum constraint in order to allow MNOs to increase coverage and to decrease the costs of mobile connectivity.1162
830. Vodacom also points to the importance of spectrum and explains “the total amount of spectrum available as well as the type of spectrum in use plays a pivotal role in determining the cost and the quality of the mobile data services that MNOs are able to offer within their Radio Access Network (RAN)”.1163 Vodacom further explains that both low-frequency and high-frequency spectrum is important. According to Vodacom, “low-frequency transmissions can travel greater distance before losing their integrity, and can pass through dense objects more easily. Higher frequency spectrum, on the other hand, has poorer propagation properties but can carry more data and can therefore reduce the cost of expanding capacity”.1164
1159 MTN submission (Non-confidential) dated 27 November 2017, p. 511160 MTN submission (Non-confidential) dated 27 November 2017, p. 511161 MTN submission (Non-confidential) dated 27 November 2017, p. 50-511162 MTN submission (Non-confidential) dated 27 November 2017, p. 491163 Frontier Economics report (Non-confidential) in Vodacom’s submission dated 30 November 2017, p. 331164 Frontier Economics report (Non-confidential) in Vodacom’s submission dated 30 November 2017, p. 33-341165 Frontier Economics report (Non-confidential) in Vodacom’s submission dated 30 November 2017, p. 341166 Frontier Economics report (Non-confidential) in Vodacom’s submission dated 30 November 2017, p. 351167 Frontier Economics report (Non-confidential) in Vodacom’s submission dated 30 November 2017, p. 36-371168 Frontier Economics report (Non-confidential) in Vodacom’s submission dated 30 November 2017, p. 371169 Frontier Economics report (Non-confidential) in Vodacom’s submission dated 30 November 2017, p. 371170 MWEB submission dated 01 June 2017, p. 4
831. Vodacom’s views align with those of MTN. In this regard, Vodacom submits that MNOs in South Africa currently have more limited spectrum that operators in other countries. According to Vodacom, South African operators only have access to 900MHz, 1800MHz and 2100 MHz bands while operators in many other countries have access to additional spectrum suitable for delivering 4G data services (800MHz, 2600MHz and 700MHz)1165. According to Vodacom, South Africa will end up with even less spectrum (per mobile user) if there are any further delays in releasing new spectrum. Vodacom also argues that “limited access to spectrum already appears to be giving rise to capacity constraints, which in turn will drive up costs”.1166 Vodacom further highlights that the benefit of releasing spectrum include faster deployment of 4G/5G technologies which will increase quality of mobile data services and decrease the costs, increase data speeds, bring lower latency and increase reliability.1167 Furthermore, Vodacom argues that releasing more high frequency spectrum will allow MNOs to “increase capacity to meet the growing demand for data, especially in urban areas”.1168 According to Vodacom, releasing more spectrum will increase competition in the wholesale market. In addition, Vodacom argues that “the benefits of additional spectrum would be further enhanced by increased investment in fixed infrastructure for use as mobile backhaul”1169 (MNOs partly rely on microwave backhaul). The increased investment in fixed infrastructure for use as mobile backhaul is understood in the context that additional spectrum will increase the demand for data and as such there will be an increase in investment in replacing microwave backhaul because the demand is higher.
832. MWEB submits that [].1170
833. The importance of spectrum is further highlighted by ECN who submits that radio frequency spectrum is required in order to provide wholesale mobile data network services and that without access to spectrum, MNOs will

223
not be able to provide mobile data services.1171 ECN also states that the argument that more spectrum equates to lower prices can be disputed. In this regard, ECN submits that there are three compelling counter-considerations to the argument raised by MNOs. Firstly, ECN states that the argument by MNOs that they are unable to reduce the costs of providing data because they are spectrum constrained is not shown in their pricing models.1172 According to ECN, it is expected that given the scarcity of spectrum, the heaviest users of data will be “charged more to try and prevent large consumption and allow management of the constrained resource”.1173 Currently the unit cost of data decreases as more data is purchased. Secondly, ECN argues “that the underlying principle behind future deployment of 5G networks involves densifying the mobile network by bringing access points/ base stations closer to consumers, so the densification is any event part of the strategic plans of the operators”1174. Lastly, ECN argues that “the mobile network industry is driven by the need to reduce costs, leading to substantial increase in infrastructure sharing across the industry. Increasingly it is widely accepted that this includes sharing of elements of the radio access network itself”1175.
834. A similar view that more spectrum does not necessary equate to lower prices is shared by ISPA. In this regard, ISPA submits that the spectrum scarcity argument (i.e. that a lack of spectrum is the basis for MNOs’ inability to reduce data costs) is contrasted by the fact that it is cheaper to buy large bundles of data than small bundles of data. ISPA further submits that there is a shortage of spectrum only in certain parts of metro areas and in certain frequency bands.1176
12.1.6. Data coverage and access
835. This sub-section provides a summary of the submissions regarding data coverage and access in South Africa. Three main issues in relation to data coverage and access are
1171 ECN submission (Non-confidential) dated 01 November 2017, p. 311172 ECN submission (Non-confidential) dated 01 November 2017, p. 31-321173 ECN submission (Non-confidential) dated 01 November 2017, p. 321174 ECN submission (Non-confidential) dated 01 November 2017, p. 321175 ECN submission (Non-confidential) dated 01 November 2017, p. 321176 ISPA submission dated 01 November 2017, p. 31177 MWEB submission dated 01 November 2017, p. 41178 A4AI submission dated 01 November 2017, p. 31179 DTPS submission dated 03 November 2017, p. 101180 ECN submission (Non-confidential) dated 01 November 2017, p. 241181 Telkom submission (Non-confidential) dated 17 November 2017, p. 31182 Frontier Economics report (Non-confidential) in Vodacom’s submission dated 30 November 2017, p. 11 1183 Frontier Economics report(Non-confidential) in Vodacom’s submission dated 30 November 2017, p. 7
identified by stakeholders: South Africa’s overall coverage is better than most African countries, coverage in rural areas is limited and fixed data networks have limited reach as compared to mobile data networks. The submissions are summarised below.
836. MWEB submits [].1177
837. A4AI also submits that coverage to rural areas and unserved communities should be prioritised and the options to ensure rural coverage should be a mix of options “beyond the traditional licensed spectrum to include unlicensed spectrum (e.g, WiFi, TV White spaces, etc,,) and other emerging technologies”1178. DTPS submits that [].1179
838. In relation to the coverage of fixed data network and mobile data networks, ECN submits that fixed line penetration is approximately 5% compared to 100% mobile penetration and “most South Africans only have access to mobile data services”1180. Telkom shares the same view and submits that with only around 1.1 million subscribers, fixed broadband services coverage is more limited than mobile broadband coverage. In contrast, mobile broadband services cover 99% of the population within coverage of 3G or 4G broadband networks.1181
839. Vodacom highlights the importance of mobile data services and submits that 99% of the South African population have access to mobile data services supplied by the competing infrastructures of the four MNOs.1182 Vodacom further submits that South Africa’s 3G coverage is the highest in Africa. Further, Vodacom submits that South Africa’s 3G coverage is even considerably higher that some developed countries such as Canada, Ireland, Germany, Finland and Sweden. Vodacom further states that South Africa’s 4G coverage is also better than the average for African countries. In addition, Vodacom submits that the “take up of mobile data services in South Africa is the second highest in Africa.” 1183

224
840. MTN shares similar views and submits that when considering non-price factors such as network coverage, in particular mobile data network coverage, and even 4G network coverage, MNOs in South Africa have higher coverage than other MNOs in many African countries.1184
841. Contradictory views are held by A4AI. In this regard, A4AI submits that their own ADI (the Index assess countries on infrastructure and access) ranked South Africa “9th out of 27 African countries in terms of access; it ranks 6th out of 27 in terms of infrastructure”.1185
12.1.7. Regulation and legislation 842. This sub-section provides a summary of
submissions pertaining to the issues of legislation and the regulatory framework for data services in South Africa. A number of stakeholders submit that the prevailing high data prices in South Africa are as a result of regulatory failures. Some market participants have also shared their views regarding plans to introduce the Wireless Open Access Network (“WOAN”), and market participants are sceptical that the introduction of WOAN will achieve the desired results in South Africa.
843. The submissions regarding legislation and regulation are summarised below.
844. According to MWEB, [].1186 ECN further states that one of the main causes of higher data prices in South Africa is that ICASA has failed to regulate competition in the wholesale and retail mobile data services as required by Chapter 10 of the Electronics Communications Act (“ECA”).1187 Telkom further submits that wholesale mobile network services (roaming and RAN sharing) are not fully regulated but are subject to commercial considerations. A case in point, according to Telkom, is the Facilities Leasing Regulation of 2010 which obliges all ECNS licensees to lease facilities, however there is no price regulation. According to Telkom, the lack of price regulation “can leave access seekers at a disadvantage if the wholesale market is not working effectively”.1188
1184 MTN submission (Non-confidential) dated 27 November 2017, p. 351185 A4AI submission dated 01 November 2017, page 21186 MWEB submission dated 01 November 2017, p.31187 ECN submission (Non-confidential) dated 01 November 2017, p. 61188 Telkom submission (Non-confidential) dated 17 November 2017, p.27, 321189 Cell C submission (Non-confidential) dated 24 November 2017, p. 13 para. 4.2-4.31190 Frontier Economics report (Non-confidential) in Vodacom’s submission dated 30 November 2017, p. 34-35, 391191 Cell C submission (Non-confidential) dated 24 November 2017, p. 14 para. 4.71192 Cell C submission (Non-confidential) dated 24 November 2017, p. 14 para. 4.7
845. Cell C shares similar views and submits that although there is an obligation by the ECA for licensees to share their facilities in Chapter 8, there is no price regulation even though section 47 of the ECA provides that “The Authority may prescribe regulations establishing a framework for the establishment and implementation of wholesale rates applicable to specified types of electronic communications facilities and associated services taking into account the provisions of Chapter 10”.1189
846. Vodacom submits that given that mobile backhaul represents a significant proportion of total network costs for MNOs, access to fibre backhaul at an efficient cost is important. According to Vodacom, there are two ways of accessing fibre backhaul at an efficient cost, either by renting capacity from other operators on fair and reasonable terms or by using Telkom’s ducts and poles to roll out their own networks. Given the importance of fibre backhaul, Vodacom submits that improving access to fibre backhaul in particular, through the implementation of duct and poles access regulation, will be vital to ensure that the potential benefits of additional spectrum can be fully realised.1190
847. Cell C submits that ICASA has failed to fulfil the requirements of section 43(8) of the ECA which obliges it to “prescribe a list of essential facilities”1191 and provide a list of examples of essential facilities. Cell C states that this is in the context of Section 43(8A) of the ECA which govern requests for essential facilities to promote efficient use of electronic networks and services. According to Cell C, Section 43(8A) (b) of the ECA further states that “all electronic communications network service licensees receiving requests [for access to essential facilities] are required to agree on non-discriminatory terms and conditions of a facilities-leasing agreement”.1192
848. Cell C further highlights that the “ECA gives certain rights to electronic communications network services licensees (i.e. those licensees authorised to build, operate and maintain electronic communications networks) to enter on certain types of land and to construct their

225
network facilities including in underground pipes, over bridges, across waterways and under streets”.1193 The ECA however requires the DTPS to direct ICASA to develop regulations for obtaining permits, authorisations, or approvals to deploy network infrastructure across public and private land. Cell C further submits that “the time periods prescribed for the directions and the regulations (even under the more recent National Policy) have long since passed”.1194
849. Cell C further submits that there are several companies that have entered the market to provide infrastructure only (not services). These include ATC, DFA and Vumatel Pty Ltd, all these are licenses with the exception of ATC. According to Cell C, given that “ATC does not fall within ICASA’s jurisdiction and on the other hand, ICASA has also not regulated prices for access to infrastructure even where licensees are concerned, an entity in control of an essential facilities can set prices for access without reference to anyone”.1195
850. Telkom submits that although “number portability and call termination regulations are not specific to mobile broadband services”1196, they however affect competition in the overall mobile retail sector. Accordingly, Telkom argues that these regulations have implications on data services.1197
851. ECN submits that the proposal for a WOAN is a highly “contentious and increasingly-politicised issue, with ongoing litigation between the Minister and ICASA as well as recent indications that National Treasury favours an auction of available high-demand spectrum”.1198 We note however, as indicated this dispute between DTPS and ICASA has been settled.
852. MTN submits that the report by GSMA raises questions regarding the WOANs and also shows that WOANs do not provide better coverage as envisaged or offer lower prices for consumers. MTN further submits that the GSMA report also shows that most WOANs “have failed to even
1193 Cell C submission (Non-confidential) dated 24 November 2017, p. 15, para. 4.81194 Cell C submission (Non-confidential) dated 24 November 2017, p. 14-15, para. 4.81195 Cell C submission (Non-confidential) dated 24 November 2017, p. 16, para 4.121196 Telkom submission (Non-confidential) dated 17 November 2017, p. 421197 Telkom submission (Non-confidential) dated 17 November 2017, p. 421198 ECN submission (Non-confidential) dated 01 November 2017, p. 311199 MTN submission Non-confidential, dated 27 November 2017, p. 431200 MTN submission Non-confidential, dated 27 November 2017, p. 431201 MTN submission (Non-confidential) dated 27 November 2017, p. 441202 MTN submission (Non-confidential) dated 27 November 2017, p. 441203 MTN submission (Non-confidential) dated 27 November 2017, p. 44-451204 MTN submission (Non-confidential) dated 27 November 2017, p. 51205 MTN submission (Non-confidential) dated 27 November 2017, p. 51206 MTN submission (Non-confidential) dated 27 November 2017, p.13
be implemented”1199. According to MTN, of the five countries where WOAN was proposed, it has only been rolled out in one country.1200 In addition, MTN submits that the Operators Forum (comprising of Cell C, MTN, Vodacom, Multisource Telecom, Neotel and Telkom) had a meeting with government regarding the proposals in the White Paper and made several recommendations, specifically in relation to the WOAN. The recommendations made include that “the WOAN should be privately owned, with a level of 30% to 51% BBBEE ownership, and no operator should acquire a controlling share; the operators should keep the spectrum that has already been allocated to them, at least until those license expire; the operator would commit to purchase at least 30% of the WOAN’s capacity for the first 8-15 years; the operators should retain the right to compete on infrastructure, service and network services and would be allowed to make available access to infrastructure and other required facilities to the WOAN at commercial and non-discriminatory prices”.1201 MTN states that after a further meeting, it was agreed that the “operators would keep their spectrum licenses until they expire in 2028, and in turn, the operators would purchase at least 30 percent of the capacity created by the WOAN”.1202 MTN however submits that the first ECA Bill of 2017 proposed the exact opposite of the agreement.1203
853. MTN further submits that “economic regulation must be targeted at the obstacles to efficiency; in particular the specific bottlenecks in the provision of better quality and cheaper (mobile) data services”1204. According to MTN, the one particular regulatory intervention needed is allocating more spectrum to MNOs in order “to allow them to compete even more effectively, and provide greater access to mobile data services, at even lower costs”.1205 MTN further submits that excessive regulatory interventions “would harm incentives for further investments in mobile data services, which would harm competition and consumers, in particular, the poorest and most vulnerable consumers”1206.

226
854. MMA also submits that “there are suggestions of splitting the regulator (ICASA) and closing Universal Service and Access Agency of South Africa (‘USAASA’) and establishing a new regulator”1207. MMA warns that ICASA would be undermined by such actions and the ICT sector will also be destabilised.1208
855. ISPA is of the view that regulation must be for maximum effect and given that “most broadband connections are already mobile and more than 90% of the population has access to a broadband service offered over a mobile network service, there is an affordability gap rather than an access gap”.1209
12.1.8. Impact of high data prices on low-income population
856. This sub-section provides a summary of submissions regarding the impact of high data prices on the low-income population in South Africa. Most of the stakeholders are of the view that high data prices have negative impact on low-income consumers in South Africa and that low-income consumers are paying more for data services than high income consumers. These submissions are summarised below.
857. The impact of high data prices on the low-income population is highlighted by Mr Kuziva Muzondo who submits that because of high data prices, people in rural areas are unable to access educational information sources such as Udemy, EDX, Coursera, CodeFreeCamp, Code Academy, etc.1210
858. DG MT also submits that “while government spends tens of billions of Rand to install an ever-expanding fixed data network to provide South Africans with internet access at clinics, schools and other selected nodes, the majority of South Africans will not be able to afford access to the internet in the safety and comfort of their own homes for decades to come, and thus not be able to use critical information and use critical tools that help to uplift a new generation”1211.
1207 MMA submission dated 01 November 2017, p. 31208 MMA submission dated 01 November 2017, p. 31209 ISPA submission dated 01 November 2017, p. 21210 Kuziva Muzondo (Non-confidential) submission dated 31 October 2017 1211 DG MT submission dated 31 October 2017, p. 21212 DG MT submission dated 31 October 2017, p. 21213 DG MT submission dated 31 October 2017, p. 21214 DG MT submission dated 31 October 2017, p. 21215 amanda.mobi submission dated 02 November 2017, p. 1-21216 Right2Know submission dated 01 November 2017, p. 121217 Abrahams, L. & Pillay, K. 2015, The Lived Costs of Communications. A R2K & Link Centre Research Project. [Online]. Available at: http://pmg-assets.s3-website-eu-west-1.amazonaws.com/160921R2K-lived-cost-communications.pdf [Accessed on 18 June 2018]1218 Right2Know submission dated 1 November 2017, p. 7
Further, DG MT submits that the majority of the population are not able to afford basic online information, tools and applications that could help their development.1212
859. DG MT further highlights that “it would appear that Mobile Networks take advantage of poorer South Africans by charging them disproportionately high rates”.1213 In this regard, DG MT submits that “wealthier individuals that qualify for post-paid contracts pay approximately half the cost of prepaid users for 1GB of mobile data and receive even greater discounts when purchasing more data. Poorer individuals, who pay R12/30 MB (equal to R400/GB) often pay 10-30 times more for their data than wealthier individuals that, for example, can afford to buy 100GB of data (valid for 1 year ) at a time for R15/GB”.1214 amandla.mobi shares similar views and submits that low income consumers are paying unreasonably higher prices for data and low income consumers are also not benefiting from competition. Further, amandla.mobi submits that “consumers who are using small data bundles or using ‘out of bundle’ may be paying 50 times what richer consumers are paying”.1215
860. Right2Know also submits that due to the prevailing distortions in market conditions, prepaid customers who in most instances are poor are cross-subsidising wealthier post-paid customers who pay far less for each MB of data or minute of airtime. Given this, Right2Know argues that mobile communications users with household income below R6 400 per month should be explicitly included in the agenda for communication policy and economic regulation.1216
861. In addition, Right2Know submits that the cost of communication has often only been understood in quantitative terms where a certain monetary amount is applied to the cost of accessing the internet or making a phone call. Based on the research conducted by the LINK Centre1217, Right2Know suggests1218 that

227
this method neglects to factor in the “lived cost” of communications in urban South Africa.
862. According Right2Know, the “lived cost” research “sought to understand how mobile phone users experience ownership of mobile phones, access to mobile communications and the cost of ownership and access”.1219 By taking into account a measure of “lived cost”, the research shows that “poor and working class South Africans struggle to pay for basic communications and can scarcely even begin to imagine access to next generation networks that offer high speed internet”.1220
863. MTN submits that in order to improve access to connectivity, especially for low-income customers, MTN has launched various initiatives such as partnering to provide zero-rated access to mobile banking apps, and offering free access to university e-learning applications and websites.1221
12.1.9. Potential remedies for perceived high data costs in South Africa
864. This sub-section provides a summary of all
submissions regarding potential remedies for perceived high data costs in South Africa. Some of the proposed remedies include requesting MNOs to prove that there are justifications in providing larger data bundles cheaper than smaller data bundles, creating a fair and competitive market, creating a WOAN and assignment of more spectrum to MNOs.
865. The submissions regarding potential remedies for perceived high data costs in South Africa are summarised below.
866. According to amandla.mobi, the relative costs of providing data in small quantities in comparison to the cost of providing data in larger quantities should be interrogated and operators should prove that it is more costly to provide small data bundles. Operators should also prove that these additional costs are proportionate to the difference in pricing. Furthermore, amandla.mobi argues that operators should disaggregate
1219 Right2Know submission dated 1 November 2017, p. 71220 Right2Know submission dated 1 November 2017, p. 71221 MTN (non-confidential) submission Non-confidential dated 27 November 2017, p. 41222 amanda.mobi submission dated 02 November 2017, p. 4-51223 DG MT submission dated 31 October 2017, p. 2-31224 DG MT submission dated 31 October 2017, p. 31225 DG MT submission dated 31 October 2017, p. 31226 DPTS submission dated 03 November 2017, p. 51227 DPTS submission dated 03 November 2017, p. 71228 ECN (non-confidential) submission dated 01 November 2017, p. 161229 ECN (non-confidential) submission dated 01 November 2017, p. 24
their profits from voice, SMS and data both in and out-of-bundle.1222
867. DG MT offers possible solutions of remedying the perceived high data costs in South Africa especially for poor and low-income consumers; firstly DG MT proposes that accessing information, apps and tools provided by registered PBOs should be made available free of any data charges. The second proposal is aligning prepaid data prices to post-paid mobile data prices. Thirdly, is the alignment of the equivalent cost per GB irrespective of the size of the data package bought, for instance, 5GB of data which costs R300 should be R60 per GB regardless of the size of data package bought. The fourth proposal by DG MT is requiring that all data bundles are valid for at least 3 months. The fifth proposal made by DG MT is that users should be notified when 50%, 75% and 90% of their data is used. The sixth proposal made by DG MT is that OOB rates be at a maximum of 200% of bundled rates.1223 The seventh proposal made by DG MT is the introduction of a “5 year plan whereby mobile data prices are reduced to R15/GB (equivalent to some of the best 2017 data offers)”1224, regardless of the volume of data purchased at a time or whether prepaid or post-paid. Lastly, DG MT proposes that prepaid mobile data offerings and data bundles be made consistent, clear to understand and comparable between mobile operators.1225
868. According to the DTPS, [].1226
869. In addition, the DTPS further states [].1227
870. ECN submits that in relation to fixed data services, the functional separation of Telkom wholesale and retail operations in 2015 created an even playing field and helped to promote competition in the fixed line market.1228 In addition, ECN submits that given that the majority of the population only have access to mobile data services, addressing the high cost (price) of mobile data is more important than addressing the cost (price) of fixed data services.1229

228
871. MMA requests that “the Commission also make recommendation regarding digital literacy and digital citizenship. Not only are these essential life skills but they should be seen and understood to be key responsibility of those who provide the data services”.1230 A4AI submits that their income inequality analysis revealed that market-driven solutions (via MNOs) will not ensure that data is accessed to all (including low-income groups).1231 In addition to the market-driven solutions, A4AI advocates that “there must also be a focus on public access solutions to complement existing connectivity options, including community networks and the allocation of spectrum for such networks, where feasible.”1232
872. In addition, A4AI submits that “forward-looking policy and spectrum regulations therefore have a key role to play in ensuring an even and competitive playing field for spectrum, fair and reasonable pricing, with priorities for coverage realistically set to include marginalised communities”1233. Firstly, A4AI proposes that forward-looking policy and spectrum regulations should “facilitate the setting of reasonable/ fair market prices for spectrum that encourage competition and are not prohibitive for operators and users”1234. Secondly, there should be “innovative use of spectrum, such as unlicensed spectrum, to close coverage gaps to advance affordable access, whether by supporting community networks or partnering to develop new technologies”.1235 Thirdly, forward-looking policy and spectrum allocation should “challenge operators to share infrastructure both within and outside the sector (e.g., share with power, energy and transportation sectors) with objective, transparent and fair guidelines”1236.Fourthly, A4AI proposes that forward-looking regulation and spectrum allocation should “encourage flexibility in the use of spectrum (i.e. spectrum trading or refarming but with greater emphasis on ensuring efficient utilisation of the spectrum without compromising on the quality of service to consumers)”.1237 A4AI also proposes that there should be a mechanism to monitor that the gains made by spectrum prices are transferred to consumers in the pricing of data, that spectrum is reasonably
1230 MMA submission dated 01 November 2017, p. 81231 A4AI submission dated 01 November 2017, p. 21232 A4AI submission dated 01 November 2017, p. 21233 A4AI submission dated 01 November 2017, p. 31234 A4AI submission dated 01 November 2017, p. 31235 A4AI submission dated 01 November 2017, p. 31236 A4AI submission dated 01 November 2017, p. 41237 A4AI submission dated 01 November 2017, p. 41238 A4AI submission dated 01 November 2017, p. 41239 Right2Know submission dated 01 November 2017, p. 7
priced with priorities for coverage realistically set to include marginalised communities. Lastly, A4AI proposes that the South African government should develop a detailed plan for “allocating spectrum sufficient to meet projected increases in demand, with a clear timeline for implementation.”1238
873. Right2Know submits that when investigating the advantages and disadvantages of current and future policy, regulators should focus on the “lived experience” when assessing an individual’s cost to communicate.1239
12.2. Submissions received for the public hearings
874. This sub-section provides a summary of submissions made either as written submissions, or oral submissions during the public hearings held from the 17th to the 19th of October 2018. To the extent that the reader needs further detail on a submission made to the Commission in this regard, presentations can be found on the Commission’s website.
875. Submissions were made by a number of stakeholders, including the following who previously made submissions in response to the CfS and are described briefly above in paragraph 764: MTN, Telkom, Vodacom, Cell C, amandla.mobi, Right2Know, DG MT, Media Monitoring Africa, ISPA and A4AI. The following stakeholders who did not previously make submissions in response to the CfS also made submissions during the public hearings:
875.1. ANC is a national liberation movement. It was formed in 1912 and is the Republic of South African’s governing political party. It has been the ruling party of the post-apartheid South Africa on the national level, beginning with the election of Nelson Mandela in the 1994 election.
875.2. ICASA is an independent regulatory body of the South African government, established in 2000 by the ICASA Act to regulate both the telecommunications and broadcasting sectors in the public interest.

229
875.3. RIA is a non-profit think tank that conducts public-interest research on ICT policy and regulation that responds to national, regional and continental needs.
875.4. Afrihost is a South African internet service provider providing a number of services, including ADSL broadband, fibre, fixed wireless, mobile and web hosting.
875.5. DTPS is a national government department and is mandated to create a vibrant ICT (“ICT”) sector that ensures that all South Africans have access to robust, reliable, affordable and secure ICT services. It is responsible for both telecommunications and ICT more broadly as well as postal services.1240
875.6. Internet Solutions is a South African internet service provider that operates throughout Africa, and offers a variety of data centre, cloud, and internet services.
876. Similar to the summary of submissions in response to the CfS, the purpose of this summary of submissions is to summarise all the key points made by stakeholders under different themes in line with the issues identified in the notice for public hearings. In some instances, the submissions will be dealt with in more detail in other sections, particularly where a more detailed assessment of the claims made is necessary.
12.2.1. Are data prices in South Africa (whether mobile, fixed or other) higher than they ought to be?
877. In the invitation to make submissions to the public hearings, stakeholders were requested to make submissions on whether data prices in South Africa (whether mobile, fixed or other) are higher than they ought to be. A number of submissions were received with respect to this element. Most of the submissions are in relation to mobile data prices and few submissions relate to fixed data prices. It appears common cause across the stakeholders that data prices are higher than they ought to be. Most stakeholders point to competition issues in the sector. Vodacom and MTN point to issues such as spectrum which are said to result in higher prices. Even where firms have not answered this question in their submissions, or only
1240 See https://www.dtps.gov.za/index.php?option=com_content&view=article&id=132&Itemid=102 [Accessed 26 July 2018]
focused on the level of competition, the next section on the causes of higher shows that all stakeholders believe prices are too high as all stakeholders make submissions in this respect.
878. Similar to the previous submissions in response to the CfS, only Vodacom and MTN made submissions that data prices in South Africa are more competitive than what is perceived. In line with the previous submission, Vodacom is still of the view that comparing data prices across different countries is difficult given that data prices are influenced by many factors. Notwithstanding this, Vodacom submits that its own data prices (effective price per MB) have reduced significantly over the last few years and when compared to comparable countries, South Africa’s headline data prices are on par with comparable countries. MTN submits that taking into account the current conditions of the South African market, data prices are competitive. Telkom also argues that international price benchmarking studies have fundamental methodological challenges and as such it is difficult to make firm conclusions based on benchmarking studies. Notwithstanding this, Telkom is of the view that Tarifica international price benchmarking analysis shows that because the mobile data market is not competitive, data prices in South Africa are higher than what they could have been. In line with the submissions in response to the CfS, the majority of the other submissions are also of the view that South Africa performs relatively poorly as compared to other countries in terms of price.
879. Below we summarise all the submissions regarding this element.
880. Vodacom is of the view that comparing data prices across different countries is difficult because data prices are influenced by many factors. Given this, Vodacom submits that the Commission should interpret studies which compares data prices across different countries with caution. As indicated above, Vodacom made a similar submission in response to the CfS. In addition, Vodacom submits that its own data prices (effective price per MB) have reduced significantly over the last few years and when compared to comparable countries, South Africa’s headline data prices are on par with those countries. Vodacom further states that information obtained from ICASA shows that between 2015 and 2017, the average price

230
per MB of data for the sector decreased by 45%1241.
881. Vodacom further argues that factors such as coverage, quality of service and speeds must be taken into account when data outcomes are analysed in South Africa. Again, this submission is in line with Vodacom’s previous submission in response to the CfS. In this regard, Vodacom states that consumers consider factors such as quality and better network coverage when selecting a network. Given this, Vodacom argues that South African MNOs are always investing in their networks in order to improve their network coverage and quality.1242
882. When comparing non-pricing factors such as speeds, coverage and latency, Vodacom argues that South Africa is performing better than other countries. In this regard, Vodacom cites the GSMA Index which includes factors such as infrastructure, affordability, customer readiness and content. According to Vodacom, the 2017 GSMA Index regarding mobile connectivity ranked South Africa the 3rd best African country. Vodacom adds that when comparing other factors such as coverage, mobile speeds and latency, South Africa performs well compared to other African countries, other OECD states and rest of the BRICS countries.1243 This submission is also in line with Vodacom’s previous submission in response to the CfS.
883. Telkom shares a similar view and argues that international price benchmarking studies have fundamental methodological challenges and as such it is difficult to make strong conclusions based on benchmarking studies.1244 The first methodological challenge highlighted by Telkom is that “most international benchmarking studies construct pre-defined user profiles which specify monthly consumption levels for voice, SMS and data services (bundled together or separately) , and then find the lowest-cost tariff plan or bundle offer from each operator in each country that satisfies the minimum requirements of each pre-defined user profile”1245. Telkom states that the major shortcoming of this approach is that these
1241 Vodacom’s submission (non-confidential) 15 October 2018, p. 5, 9, 10 & 111242 Vodacom’s submission (non-confidential) dated 15 October 2018, p. 71243 Vodacom’s submission (non-confidential) dated 15 October 2018, p. 15-161244 Telkom’s submission (non-confidential) dated 15 October 2018, p. 91245 Telkom’s submission (mom-confidential) dated 15 October 2018, p. 101246 Telkom’s submissions dated 15 October 2018 (non-confidential), p. 101247 Telkom’s submissions dated 15 October 2018 (non-confidential), p. 101248 Telkom’s submissions dated 15 October 2018 (non-confidential), p. 101249 Telkom’s submission dated 15 October 2018 (non-confidential), p. 91250 Telkom’s submission dated 15 October 2018 (non-confidential), p. 18
profiles may not take into account the diverse usage patterns across different countries and “may overlook important categories of consumer behaviour”1246. Secondly, Telkom argues that international studies often focus on headline prices which can differ from effective price usage costs for various reasons. The third issue raised by Telkom is that the selection of countries to which to compare South African data prices will always be subjective to a certain degree and it is difficult to ensure that all chosen countries are valid if a large number of countries are included in the sample. The fourth issue is that it is difficult to control for diverse non-price factors across different countries which impact the prices of data. The last issue highlighted by Telkom is that studies often provide snapshots of results in time and those results might not reflect changes in dynamics and other factors if those studies are not updated. Telkom warns that “studies that provide only a snapshot in time do not cater for this and may as a result lead to mistaken conclusions”1247.
884. Telkom further submits that the results of the two international studies made available on the Commission’s website, the Tarifica Report as well as the Frontier Economic Report submitted on behalf of Vodacom should be interpreted with caution because they did not address the aforementioned methodological challenges1248. Furthermore, Telkom is of the view that the two reports “do not support a conclusion that the prices of MTN and Vodacom are comparable to a relevant set of global comparators, i.e. that they are not high by international standards”1249. In conclusion, Telkom submits that Tarifica international price benchmarking analysis shows that because the mobile data market is not competitive, data prices in South Africa are higher than what they could have been. According to Telkom, South Africa’s position is mainly caused by the high prices charged by Vodacom and MTN given that “Tarifica calculated average scores for each country, which is the weighted average of operator scores with market shares as weights”.1250
885. 883. MTN is of the view that taking into account the current conditions of the South

231
African market, data prices are competitive.1251 The basis for this as the CEO of MTN South Africa, Mr. Godfrey Motsa argued, is that prices in South Africa are not higher than prices in neighbouring countries such as Lesotho, Swaziland and Botswana. Mr. Motsa argued that although prices in Mozambique are lower than in South Africa, MNOs in Mozambique perform poorly in terms of quality, coverage and penetration.1252 He further suggested that the prices prevailing in South Africa cannot be seen to be unaffordable because “we have increased penetration with these prices, we have increased traffic on these prices, we have increased coverage on 4G and on 3G with these prices and we are still able to push over five million smart devices every year to the market with these prices.”1253
886. MTN further submits that South Africa is rated an African leader when compared to other countries in terms of data and device affordability. MTN further submits that excluding the non-comparable small islands of Mauritius and Seychelles, South Africa is an African leader in ICT and broadband outcomes.1254
887. Right2Know shares a contrasting view and submits that even when adjusted for cost of living, data prices in South Africa are amongst the highest in the world. Right2Know further adds that a research conducted by Tarrific found that contract data prices in South Africa are the second most expensive amongst BRICS countries. In a sample of comprising BRICS countries as well as Kenya and Australia, Right2Know states that Tarrific found that average contract data prices in South Africa are “134% more expensive than the cheapest prices in the group”1255. Right2Know further adds that 1GB of data is R11 in India, R22 in Nigeria, R71 in Ghana, R24 in Russia, R98 in Tanzania while 1GB of data costs R149 in South Africa.1256
888. RIA shares a similar view and submits that as per the RAMP Index, “the cost of data in
1251 MTN’s PowerPoint presentation (non-confidential) at the public hearings, dated 18 October 2018, slide 51252 MTN’s presentation at the public hearings held on 17-19 October 2018. See Day 2 transcripts, p. 921253 MTN’s presentation at the public hearings held on 17-19 October 2018. See Day 2 transcripts, p. 92, line 23-261254 MTN’s PowerPoint presentation at the public hearings, dated 18 October 2018, slides 8 and 91255 R2K submission for the public hearings, p. 21256 R2K submission for the public hearings, p. 31257 RIA’s submission dated 11 November 2018, p. 51258 RIA’s submission dated 11 November 2018, p. 51259 RIA’s submission dated 11 November 2018, p. 51260 RIA’s submission dated 11 November 2018, p. 61261 A4AI presentation at the public hearings dated 11 November 2018, slide 31262 Right2Know’s presentation at the public hearings held on 17-19 October 2018. See Day 3 transcripts, p. 601263 DTPS presentation to the data inquiry public hearings dated 15 October 2018, slide 101264 DTPS presentation to the data inquiry public hearings dated 15 October 2018, slide 101265 DTPS presentation to the data inquiry public hearings dated 15 October 2018, slide 10
South Africa is very high as compared to other African countries.”1257 ”Compared with other African countries, South Africa performs poorly, coming 35th out of 49 African countries”1258. RIA further states that “the cost of cheapest 1GB of data in South Africa is USD 8.28 (ZAR 99) as of Q3 2018, is seven times the cost of the cheapest 1 GB data in Egypt (USD 1.13), and nearly three times the cost of the same data in Ghana, Kenya and Nigeria.”1259 RIA further states that South African consumers pay on average double for a 1GB of data than other consumers in comparative countries.1260
889. A4AI states that South Africa is ranked 7th out of the top ten African countries as per the 2017 ADI.1261 A4AI further states that South Africa has a lower ADI of data when compared to its peers.1262
890. DTPS is also of the view that data prices in South Africa are higher when compared to other countries. In this regard, DTPS states that according to ICASA’s Benchmark report, “in terms of the 500MB data bundle, Vodacom South Africa charges $7.35 for this bundle whilst Egypt Vodafone charges the lowest price at $0.84 and Vodacom Tanzania charges $2.25 for the same data bundle size”.1263 In relation to 1GB data, DTPS submits that the ICASA Benchmark report revealed that “Vodacom SA charges the highest at $11.06, charges $1.12 in Egypt and $2.77 in Nigeria”.1264 DTPS further states that the ICASA report showed that a similar pattern is observed for a 2GB data bundle prices. In this regard, DTPS states that the report shows that Vodafone Egypt charges $2.02 for 2GB of data compared to $16.47 charged by Vodacom South Africa, “Vodacom South Africa charges 815.4% more for a 2GB data bundle than what Vodafone Egypt charges”.1265
891. ICASA also acknowledges that “there is an inherent difficulty in choosing benchmark countries that are sufficiently similar to South Africa in terms of population density, number

232
of operators, geography and topology, energy, labour and other input costs, network traffic volumes etc.”1266 Notwithstanding this, ICASA states that it has conducted benchmarking exercise regarding data prices and factors such as market structure, legislative frameworks and spectrum assignment were taken into account. ICASA’s study revealed that prices of data offered by MNOs in South Africa are not the highest when compared to SADC and BRICS countries. According to ICASA, South African MNOs such as Vodacom and MTN charge South African consumers higher prices for data than what they (the same firms) charge in other countries in which they operate.1267 For instance, when comparing the price of a 2GB data bundle across some countries MTN operates, MTN “charges the highest rate for 2GB data bundle in Cyprus at $27.15, with MTN SA charging $19.42 (R260)1268”, followed by Botswana priced at $19.33 and Ghana at $7.10.1269 According to ICASA, “the lowest rates charged for 2GB data bundles are in Liberia, Iran and Afghanistan, with rates charged at, at $0.40, $0.23 and $5.76 respectively”.1270 For the same 2GB of data, the study found that MTN charges South African consumers 8343.5% more for data than consumers in Iran. The study also found that “Vodacom charges the highest rate for 2GB data bundle in SA at $18.49, followed by Lesotho at $11.32 and the lowest rate charged for 2GB data bundles are in Egypt at $2.02”1271. For the same 2GB of data, ICASA states that Vodacom charges South Africa consumers 815.4% more than it charges Egyptian consumers for 2GB data bundle.1272
892. The ANC shares the same view and submits that “the prices for the data bundles for Vodacom and MTN in South Africa are expensive when compared those which they offer in other countries in which they operate”.1273
893. Afrihost is of the view that fixed data prices are higher in South Africa than they ought to be because of the high price charged by Openserve for the wholesale IP Connect product. Afrihost also submits that albeit that they have not conducted sufficient research in the mobile
1266 ICASA presentation to the data inquiry public hearings dated 15 October 2018, slide 71267 ICASA presentation to the data inquiry public hearings dated 15 October 2018, slide 71268 ICASA presentation to the data inquiry public hearings dated 15 October 2018, slide 101269 ICASA presentation to the data inquiry public hearings dated 15 October 2018, slide 101270 ICASA presentation to the data inquiry public hearings dated 15 October 2018, slide 101271 ICASA presentation to the data inquiry public hearings dated 15 October 2018, slide 101272 ICASA presentation to the data inquiry public hearings dated 15 October 2018, slide 111273 ANC Presentation to the data market inquiry public hearings, slide 61274 Afrihost presentation to the public hearings dated 11 November 2018, slides 2 and 4.1275 Internet Solutions submission (non-confidential) dated 11 October 2018, p. 31276 Vodacom’s submission (non-confidential) dated 15 October 2018, p. 17
market, it appears that mobile data prices are also overpriced, partly because mobile operators offer retail packages at rates below wholesale prices which makes it impossible for resellers to compete with MNOs.1274 Internet Solutions shares the same view and submits that “due to the excessive pricing of IP Connect, ISPs are finding it difficult to effectively roll out broadband to end users at affordable rates in a profitable and sustainable model”.1275
12.2.2. To the extent that data prices in South Africa are higher than they ought to be, what are the factors that drive these outcomes?
894. Most of the submissions regarding this element are in relation to the mobile data market. Stakeholders are of the view that high mobile data prices are caused by a variety of factors that could be considered as regulatory failures, cost factors or competition failures. The regulatory issues highlighted include delays in assigning high demand spectrum and lack of sufficient measures to ensure rapid deployment of mobile infrastructure. The cost factors submitted by stakeholders include inputs costs and volatility in the exchange rates. Stakeholders are also of the view that the mobile market is concentrated and is dominated by Vodacom and MTN, and this lack of competition has resulted in elevated data prices.
895. Fewer submissions were received regarding the fixed data market and it was submitted that high data prices in the fixed market are caused by the high price of the IP Connect product of Openserve (Telkom).
896. Below we summarise all the submissions regarding this element.
897. According to Vodacom, although data prices in South Africa have decreased in the last couple of years, “it has identified a number of factors which, if addressed, could result in further reductions in mobile data prices”1276. The first issue identified by Vodacom is the lack of execution on the digital migration and

233
the assignment of high demand spectrum. Secondly, Vodacom is of the view that the failure of the regulatory framework for gaining access to ducts and poles has prevented data prices reducing even further. Thirdly, Vodacom highlights that “the lack of sufficient measures to ensure rapid deployment of mobile infrastructure”1277 as another issue preventing the reduction of data prices. Lastly, Vodacom submits that “there is a lot of uncertainty in the mobile sector in South Africa due to the potential amendments of the Electronic Communications Act (ECA)”1278, if this is not resolved soon, this could deter MNOs from investing going forward.1279 Vodacom also points that it is not only costs or regulatory factors that are causing high data prices but there are also competition issues in the market. In this regard, Vodacom states that “some entities like Telkom who have a lot more access to spectrum and because they have got bigger chunks of spectrum for historical reasons having been part of government.”1280 “That said, they do not have access to low-frequency spectrum […]”1281.
898. MTN shares similar views and submits that the key factors causing data prices to be higher in South Africa include lack of spectrum assignment, volatility in the exchange rates, cost factors as well as regulatory factors.1282 In relation to the exchange rate volatility, MTN submits that their own estimates show that a 100 cents depreciation of the Rand against the US Dollar increases their operational costs by around R600 million. Some of the costs incurred by MTN relevant to data prices include electricity prices, costs of batteries used in sites and costs of guarding sites.1283
899. According to Telkom, data prices in South Africa are higher because the market is concentrated and it is dominated by Vodacom and MTN. Accordingly, Telkom states that MTN and Vodacom enjoyed first mover advantages; they were able to attract customers with limited competition, they were able to achieve economies of scale and they were also able
1277 Vodacom’s submission (non-confidential) dated 15 October 2018, p. 171278 Vodacom’s submission (non-confidential) dated 15 October 2018, p.281279 Vodacom’s submission (non-confidential) dated 15 October 2018, p.281280 Vodacom’s presentation at the public hearings held on 17-19 October 2018. See Day 2 transcripts, p. 221281 Vodacom’s presentation at the public hearings held on 17-19 October 2018. See Day 2 transcripts, p. 221282 MTN’s PowerPoint presentation to the public hearings, dated 18 October 2018, slide 191283 MTN’s presentation at the public hearings held on 17-19 October 2018. See Day 2 transcripts, p. 90, 911284 Telkom’s submission (non-confidential) dated 15 October 2018, p. 191285 Telkom’s submission (non-confidential) dated 15 October 2018, p. 19-221286 Telkom’s submission (non-confidential) dated 15 October 2018, p. 191287 Telkom’s submission (non-confidential) dated 15 October 2018, p. 20 -211288 Telkom’s submission (non-confidential) dated 15 October 2018, p. 221289 Telkom PowerPoint presentation to the public hearings dated, 18 October 2018, slide 81290 Cell C PowerPoint presentation to public hearings, dated 18 October 2018, slide 13
to acquire the best mobile sites. In addition, Telkom states that certain factors ensured that the “South African market has been slow to change since the entry of the third and fourth operators”.1284
900. The factors listed by Telkom in this regard include customer “stickiness”, an ineffective wholesale market and asymmetries in spectrum assignment.1285 Customer stickiness “refers to the tendency of mobile customers, particularly those of long-terms contracts, to stick with their existing network provider, even if they are aware of more competitive offers somewhere”.1286 Ineffective wholesale market refers to uncompetitive wholesale access (national roaming) and difficulties in negotiating site access arrangements.1287 Asymmetries in spectrum assignment relates to the fact that Telkom is the only MNO not assigned spectrum below 1 GHz. In this regard, Telkom states that is it “estimated that [] would be required to provide coverage to a 2,000 km2 urban area with 900MHz spectrum, while [] would be required to provide the same coverage using 1800 MHz spectrum- the lowest-frequency spectrum assigned to Telkom currently”1288. Asymmetries in spectrum assignment was also raised as a major concern by Telkom in response to the CfS.
901. In addition, Telkom states that all elements of the ecosystem contribute to the price of data including devices, distribution and retail channels for devices and airtime, network equipment, taxes as well as equipment and device costs.1289
902. Cell C shares a similar view and submits that data prices in South Africa are higher than they ought to be because the South African mobile data market is a duopoly characterised by limited competition between Vodacom and MTN. Cell C further states that “Vodacom and MTN are unlikely to push each other in strong competition- only improvements in Cell C’s competitiveness can improve competition”1290.

234
Cell C further states that Cell C and Telkom have attempted to gain market shares and improve competition in this market but certain factors inhibited them. These factors include “the poor quality of national roaming available, lack of access to / high cost of suitable sites and being hampered by smaller-scale translating into higher long-run unit costs”.1291 Cell C also states that certain regulatory failures (lack of regulation around facilities leasing, lack of intervention regarding call termination rates, and lack of coordination regarding rapid deployment) mainly by ICASA have contributed to market failure.1292
903. RIA also submits that the lack of competition is one of the causes of high data prices in South Africa. According to RIA, although there are a lot of MVNOs operating in South Africa, there are only four MNOs operating. This is in contrast to countries such as Brazil and Nigeria that have 8 MNOs each while Cambodia and Ghana have 5 and 7 MNOs respectively.1293 In this regard, RIA argued that the mobile sector is dominated by the two incumbents (Vodacom and MTN) and “despite smaller players (Cell C and Telkom) adopting a number of competitive strategies they have failed to gain substantial market share”1294. In addition to lack of competition, “other factors leading to high cost of data in South Africa include input costs, which are affected by lack of stability of Rand/USD exchange rate, and regulatory issues surrounding the allocation of spectrum”1295.
904. ISPA is also concerned that ICASA as the regulator has not been able to change the status quo. According to ISPA, one of the main reasons that ICASA has not been able to change the status quo is because it does not have the relevant expertise “to take on the Vodacom’s and the MTN’s of the world in dealing with issues like mobile data.”1296. ISPA is also of the view that “there are clear indications of competitive failure in the market for wholesale mobile data services.”1297 ISPA based this argument on ICASA’s analysis of five-year price trends for mobile data presented in Parliament on 10
1291 Cell C PowerPoint presentation to public hearings, dated 18 October 2018, slide 141292 Cell C PowerPoint presentation to public hearings, dated 18 October 2018, slide 25, 28, 29 and 301293 RIA submission dated 11 November 2018, p. 101294 RIA PowerPoint presentation to the public hearings, slide 111295 RIA submission dated 11 November 2018, p. 101296 ISPA‘s presentation at the public hearings held on 17-19 October 2018. Transcript of the data market inquiry public hearings 17 October 2018, p. 1291297 ISPA PowerPoint presentation submitted for purposes of the public hearings. Slide 2.1298 ISPA PowerPoint presentation submitted for purposes of the public hearings. Slide 12.1299 ANC presentation submitted for purposes of the public hearings. Slide 10.1300 Right2Know submission to the Competition Commission of South Africa public hearings, p. 41301 Right2Know submission to the Competition Commission of South Africa public hearings, p. 4.1302 DTPS presentation to the data market inquiry public hearings dated 19 October 2018, slide 8.
October 2018 which ISPA claims do not reflect a competitive market for mobile data. ISPA also suggested that Cell C and Telkom Mobile’s experience in competing on price does not reflect a competitive market for mobile data.1298
905. The ANC also pointed out the lack of competition in the mobile markets as one of the factors leading to high prices in South Africa. In this regard, the ANC pointed out what is labelled as an “untransformed market structure” dominated by Vodacom and MTN (while Telkom and Cell C struggling to compete effectively) as one of the causes for high data costs.1299
906. Right2Know also submits that the answer regarding the causes of high data in South Africa will be included in the submissions to the inquiry and may include “the inordinate delay in the release of high demand spectrum for mobile broadband, the failure of universal service policies and practices to provide affordable broadband access to the poor, the decline in the use of mobile voice services and the increasing dependence of mobile operators on data for growth and income and the failure of the Independent Communications Authority of South Africa (ICASA) to timeously undertake a market inquiry into mobile data services as a basis for regulating wholesale price of data”1300. Right2Know also submits that other factors that may be causing data prices to be high include “the inordinate delay in the digital broadcasting migration to free up high demand spectrum below 1GHz that is suitable for rural mobile coverage, the failure to implement infrastructure sharing with respect to broadband networks, the disarray and shambolic conduct of a captured state, unable to implement policy effectively and in the interest of citizenry and the failure of the current proportional representation system to hold political representatives directly to account for their decisions and actions - a democratic deficit.”1301
907. The DTPS shares similar views and submits that causes of high data prices in South Africa include inadequate competition, duplication of infrastructure and spectrum allocation.1302

235
908. ICASA is of the view that there are many factors that may be the cause of data prices in South Africa being higher than they ought to be. In this regard, ICASA states that this Inquiry as well as Market Reviews to be conducted by ICASA should investigate the exact causes of high data prices in South Africa. Notwithstanding this, ICASA states that other research shows that some of the causes of high data prices include radio frequency spectrum availability, right of way, geographic factors, access to network infrastructure, market structure, market player behaviour, economic conditions, technological factors as well as policy and regulatory framework.1303 ICASA during the public hearings also highlighted that factors such as spectrum availability, rapid deployment of infrastructure, economic conditions (e.g. energy costs, labour costs, access to capital lending and the cost of that capital) and market structure might be the main causes of high data costs in South Africa. ICASA was however still of the view that the exact causes of high data prices in South Africa will be determined by this Inquiry as well as the Market Reviews to be conducted by ICASA.1304
909. In relation to the fixed data market, Afrihost is of the view that fixed data prices are higher in South Africa because of the high price charged by Openserve for IP Connect1305 1306. Internet Solutions shares the same view and submits that high fixed data prices are caused by high prices for IP Connect.1307
910. The MNOs also mentioned the cost of devices, especially smart phones, as one of the main drivers of data cost in South Africa. The intuition behind this point is that the devices that are used to access data services are expensive (starting from around R499 according to MTN) and customers (especially low income customers) do not afford to buy these devices. As a result, operators have to subsidise these devices to increase affordability, which in turn will increase data usage and the use of the capacity and coverage invested on by the MNOs.1308 Vodacom also argues “now, when you look at pricing, you
1303 ICASA presentation to the data market inquiry public hearings dated 15 October 2018, slide 13.1304 ICASA’s presentation at the public hearings held 17-19 October 2018. Transcript of the data market inquiry public hearings 19 October 2018, page 110-111.1305 IP Connect refers to the links and throughput (bandwidth) which allows ISPs access to the network of ADSL and Fibre last-mile connections. IP Connect is the only means of connecting to last mile ADSL and Fibre networks that enable end users to connect to broadband networks in order to receive value added internet packages.1306 Afrihost presentation to the data market inquiry public hearings dated 11 November 2018, slide 31307 Internet Solutions submission (non-confidential) dated 12 October 2018, p. 31308 MTN’s presentation at the public hearings held 17-19 October 2018. Transcript of the data market inquiry public hearings 19 October 2018, p. 87, line 14-18.1309 Vodacom’s presentation at the public hearings held 17-19 October 2018. Transcript of the data market inquiry public hearings 19 October 2018, p.171310 Vodacom’s presentation at the public hearings held 17-19 October 2018. Transcript of the data market inquiry public hearings 19 October 2018, p.17
must accept there is a recovery of the phone price built into the 2-year contract”. Vodacom further states that “So, these things also play in the price part because if you are charging R1000 a month, a big portion of that in some cases, as much as 60% of that is just to recover the cost of the phone. So, you have got to say R600 for the phone and R400 for the actual service”1309 Further, Vodacom argues that the weaker the Rand relative to the US Dollar (Dollar), the higher the cost of importing devices. Vodacom also argues that the exchange rate volatility affect not only device prices, but also the cost of building the network imported.1310
12.2.3. How can these factors be effectively remedied?
911. Similar to the above elements, most of the submissions regarding this element are in relation to the mobile data market. Some of the proposed solutions to reduce high mobile data prices include the assignment of high demand spectrum, limiting the spread between small and larger bundle prices, implementation of structural separation of MNOs wholesale and retail divisions, implementation of an effective duct and pole regime, regulated wholesale access and licensing of the WOAN in a manner that enables it to act as a wholesale partner to operators.
912. In relation to the fixed data market, stakeholders are of the view that reducing the cost of IP Connect is one way of reducing fixed data costs and ultimately prices.
913. Below we summarise all the submissions regarding this element.
914. Vodacom proposes four solutions in order to reduce mobile (and fixed) data prices in South Africa. The first proposed solution is the assignment of high demand spectrum to those that will make the best use of it as a matter of urgency. Secondly, Vodacom proposes that an effective duct and pole access intervention

236
needs to be implemented. Thirdly, Vodacom submits that measures should be put in place to ensure rapid deployment of infrastructure. Lastly, Vodacom submits that greater certainty should be provided regarding the amendments to the ECA, especially in relation to spectrum and open access.1311
915. MTN also submits that releasing spectrum will cause data prices to decrease, this point was emphasised by MTN CEO during the public hearings when he stated that “prices are going to go down when we get spectrum, they are going down at the moment but with the spectrum, they will go do faster and we will be loved again.”1312
916. Telkom submits that regulated mobile wholesale access (encompassing national roaming), regulated site sharing and spectrum assignments are the pro-competitive intervention “required to remedy the situation and improve market outcomes”.1313 In relation to awarding spectrum, Telkom caution that the assignment thereof should be equitable to avoid entrenching the dominance of Vodacom and MTN and worsening the disadvantage of the small firms. Telkom gave an example of equitable spectrum assignment as follows:
916.1. “[…] for existing holders of spectrum, it’s important that you determine who has what. And if the objective is to encourage competition, what we therefore (sic) need to ensure is that those that already have can’t get more of what they have. Because if the point of departure is that mobile is dominant and within a dominant mobile there’s a 75% dominance by Vodacom and MTN. And by giving them even more spectrum you are entrenching the dominance and if that dominance is entrenched, it means that in the long term there (sic) will not be effective competition […] so what it means is that we (sic) will probably have
1311 Vodacom’s written submission in response to the Commission’s invitation for comments on the Data Market Inquiry and Public Hearings dated 15 October 2018, p. 29 (Non-confidential version)1312 MTN’s presentation at the public hearings held on 17-19 October 2019. See Day 2 transcripts, p. 1031313 Telkom’s submission dated 15 October 2018 (non-confidential), p. 231314 Telkom presentation at the public hearings held on 17-19 October 2019. See Day 2 transcripts, p.168, line 5-241315 Cell C’s presentation at the public hearings held on 17-19 October 2019. See Day 2 transcripts, p. 205, line 9-121316 Cell C’s presentation at the public hearings held on 17-19 October 2019. See Day 2 transcripts, p. 205, line 9-121317 Cell C’s PowerPoint presentation to the public hearing, dated 18 October 2018, slide 441318 Competition Commission (2017) Media statement: Competition Commission decides not to prosecute Vodacom and MTN, following Cell C’s complaint. [Online] Available at: http://www.compcom.co.za/wp-content/uploads/2017/01/Cell-C.pdf [Accessed 12 December 2018]1319 Cell C’s PowerPoint presentation to the public hearing, dated 18 October 2018, slide 441320 Cell C’s PowerPoint presentation to the public hearing, dated 18 October 2018, slide 441321 Cell C’s PowerPoint presentation to the public hearing, dated 18 October 2018, slide 44
to get sub one gig spectrum and they don’t get sub one gig (sic) spectrum. But we have 2 300 spectrum, they don’t have. It means that we can’t (sic) have more of 2 300 and they have less of it so, so, so it is to really make sure that it’s a very proportional equitable distribution of spectrum […] So that’s broadly what amongst other things what we mean about an equity-based distribution of spectrum.”1314
917. Cell C on the other hand argued that “Spectrum is only a small portion of what needs to be done,”1315 but what the industry needs in order to bring down the price of data is good regulation that will support the reduction of input costs and infrastructure costs.1316 Cell C further proposes several actions required in order to remedy market failure. Firstly, Cell C states that spectrum should be awarded to all licensees in a manner that does not favour the dominant operators. The second proposal is that a WOAN must be licensed “in a manner that enables it to act as a wholesale partner to operators”.1317 Cell C also proposes that a proper study of the electronic communications market should be conducted, policy goals should be aligned, the on-net off-net complaint previously lodged by Cell C with the Commission1318 should be revisited and a “3-year glide path to phase in OOB regulation to soften the effect on market revenues”1319 should be introduced.1320 The sixth recommendation is that barriers for accessing facilities leasing should be removed in order to ensure that there is access to infrastructure. Lastly, Cell C submits that the provision of roaming by dominant operators should be regulated.1321
918. Amandla.mobi also made recommendations in order to remedy high data prices in South Africa. The first is introducing regulations in order to “limit the spread of pricing between small and large data bundles and also to limit the spread of pricing between contract and

237
pre-paid customers”.1322 Secondly, amandla.mobi proposes that OOB pricing should be abolished. Thirdly, amandla.mobi is of the view that operators should be required to provide and publish data on volumes of purchases of data at their different bundle sizes and price points. Lastly, amandla.mobi submits that an affordability index should be developed in order to avoid measuring affordability using average incomes.1323
919. Right2Know also made several recommendations in order to reduce high data prices in South Africa. The first recommendation is that wholesale and mobile divisions of the mobile operators should be structurally separated. The second recommendation is that ICASA and regulatory bodies need to ensure that data prices are reduced to match the socio-economic needs of South Africans. Thirdly, Right2Know advocates that affordable data and airtime be provided to all South Africans. The fourth recommendation is that there should be universal communications and free SMS services as well as a free basic amount of data and airtime to be provided to citizens. The fifth recommendation is that ICASA should regulate cost of data and airtime to stop profiteering. The sixth recommendation is that prepaid data should not subsidise post-paid users, data bundles should not expire and that mobile operators must improve their quality of service. Lastly, Right2Know recommends that a range of numbers that are free should be increased to include children’s schools and hospitals.1324
920. RIA also provides six recommendations in order to ensure that data prices decrease in South Africa. Firstly, RIA recommends that, as per the ICT White Paper, the Digital Economy and Society Advisory Council should be established.1325 Secondly, there should be an assessment of the “implementation of SA Connect, identify the factors contributing to the failure to meet 2016 target and likely 2020”1326. Thirdly, RIA recommends that there should be a rationalisation of SOEs and ensure that they do not compete with each other. The fourth recommendation is that ICASA should conduct
1322 Amandla.mobi presentation to the data market inquiry public hearings, slide 91323 Amandla.mobi presentation to the data market inquiry public hearings, slide 91324 Right2Know presentation to the Competition Commission of South Africa data market inquiry public hearings, slide 111325 RIA’s submission to the public hearings dated 11 November 2018, p. 181326 RIA’s submission to the public hearings dated 11 November 2018, p. 191327 RIA’s submission to the public hearings dated 11 November 2018, p. 191328 RIA’s submission to the public hearings dated 11 November 2018, p. 18-191329 RIA’s submission to the public hearings dated 11 November 2018, p. 201330 RIA’s submission to the public hearings dated 11 November 2018, p. 201331 DG MT presentation to the data market inquiry public hearings, slides 15-16
market reviews and ensure that the market is competitive. The fifth recommendation is that in order to support “rapid deployment of broadband, the regulator needs to create a mandatory rights of way regime, and commercially-incentivised tower zoning and infrastructure”.1327 The sixth recommendation by RIA is that there should be effective and regulated infrastructure sharing.1328 The seventh recommendation is that the spectrum policy should be reviewed “to ensure more optimal co-existence of licensed and unlicensed spectrum that will optimise spectrum for diverse needs in the country, but which will prioritise affordable access to communications”.1329 Lastly, RIA recommends that clarity should be provided regarding the WOAN and “there is enough unassigned spectrum available currently, to entertain a hybrid model that both assigns high-demand spectrum to existing licensees and to a consortium of network operators for wholesale open access purposes.”1330
921. The DG MT states that given the income inequality prevalent in South Africa, the poorest population will still not be able to access the internet even if data prices were halved across the board. Given this, the DG MT proposes three pro-poor strategies to expand access to digital information. Firstly, the DG MT proposes that all mobile data services offered by registered PBOs should be zero-rated. Secondly, specific pricing strategies (such as ensuring that unit price of pre-paid and contract data is the same, unit price of the bundle is the same, data rolling over for at least three months etc.) must be implemented and market failures should be addressed. Lastly, the DG MT proposes that “government should provide a full account of the real costs and benefits of universal service and socio-economic development obligations imposed on network operators”.1331
922. MMA highlights that access to information lies at the heart of the issue and has immediate impact on data costs. In this regard, MMA submits that universal access is key and provides a seven-point plan to achieve universal access. The plan encompasses the implementation of free public

238
access to the internet at government sites and zero-rated access to government websites and data. MMA also proposes that free Wi-Fi access be regarded as a basic municipal service, minimum standards for the provision of free internet access should be set and each citizen be provided a daily tranche or free internet access. Lastly, MMA recommends that the introduction of a digital literacy programme in education curricula and for the (South Africa Human Rights Commission) SAHRC and other oversight bodies to monitor and report progressive realisation of internet access.1332
923. ISPA submits that there should be an intervention in the wholesale mobile market, more specifically dominant providers of wholesale mobile data services should be obliged to offer open access to their networks on a non-discriminatory basis and vertically-integrated incumbents should be functionally separated.1333
924. A4AI proposes that infrastructure and resource sharing should be promoted to reduce industry costs and strategies should be developed to encourage innovative uses of spectrum.1334 A4AI is also of the view that innovative solutions like community owned networks should be considered.1335
925. The DTPS submits that some of the policy and regulatory measures that can be implemented to reduce data costs include finalising End-User & Subscriber Service Charter Regulations, the finalisation of the Commission’s Data Market Inquiry and ICASA conducting market reviews.1336 Further, the DTPS submits that “the majority of provisions under the ECA for example in one way or another in our view contributes to the reduction of costs in general”1337. In this regard, the DTPS submits that intervention such as rapid deployment, introduction of the WOAN and regulating the roaming costs, starting off in the SADC region as per the ECA are intended to drive down data prices.1338
1332 MMA presentation to data market inquiry public hearings, slides 5 to 71333 ISPA submission to the data market inquiry public hearings dated 11 October 2018, p. 71334 A4AI data market inquiry public hearings presentation, slide 101335 A4AI presentation at the public hearings held on 17-19 October 2018. See Day 3 transcripts, p. 661336 DTPS presentation to the data market Inquiry public hearings dated 19 October 2018, slide 111337 DTPS presentation at the public hearings held on 17-19 October 2018. See Day 3 transcripts, p. 931338 DTPS presentation at the public hearings held on 17-19 October 2018. See Day 3 transcripts, p. 94-951339 ANC Presentation to the data market inquiry public hearings presentation, slide 221340 Afrihost presentation to the public hearings dated 11 November 2018, slide 3.1341 Internet Solutions presentation at the public hearings held on 17-19 October 2018. See Day 3 transcripts, p. 331342 MNOs’ presentations at the public hearings held on 17-19 October 2018. See Day 2 transcripts, p. 51,109,159 and 198
926. The ANC made two main policy recommendations in this regard. Firstly, it recommends that new operators should be licensed in order to improve competition. The second recommendation provided by the ANC is the implementation of the policy framework including “Broadband Policy to ensure universal access to broadband by all”.1339
927. Afrihost states that it is easy to remedy the excessive price of IP Connect, where it notes that Openserve must reduce the price of IP Connect to a reasonable cost plus model as soon as possible.1340 Internet Solutions shares the same view and submit that “… should the IP Connect prices drop, that more consumers can have access to better ADSL services; cheaper prices and it could be more in frequencies across the country than it is today”1341.
12.2.4. What is the impact of data prices and access to data more broadly on lower-income customers, rural customers, small business and the unemployed? How important are affordable data prices for these customers?
928. Most of the stakeholders are of the view that high data prices have a negative impact on low-income consumers and that low-income consumers are paying more for data services than high-income consumers. Stakeholders are also of the view that it is important for lower-income customers, rural customers, small business and the unemployed to afford data prices because access to data allows them to participate in the mainstream economy. These submissions are in line with previous submissions in response to the CfS.
929. The submissions regarding this element are summarised below.
930. There is a consensus among the MNOs that low-volume data bundles are more expensive than high-volume bundles; there is a disparity between the price of low-volume data bundles and high-volume data bundles on a per gigabyte basis.1342

239
931. Vodacom states that the “ICT Policy White Paper (‘the White Paper’) has highlighted the importance of ensuring that all citizens have access to adequate connectivity in order to ensure that they are able to participate fully in the economy and society and to avoid the digital divides emerging”1343. Vodacom is therefore of the view that improvements in mobile technology must also be enjoyed by those living in poor and rural areas. In this regard, Vodacom highlights that it has introduced measures to ensure that data is affordable. These include offering data bundles at lower rates with short validity periods, offering promotional bundles that allow customers to purchase data at lower prices than standard bundles, offering micro-bundles and allowing customers to opt for tariffs which allow them to access zero-rated services.1344
932. MTN states that although data from Stats SA shows that consumers (rich or poor) do not spend most of their income on communication, “the current data prices are not coming down and driving the cost of living for poor South Africans”.1345 “Poor people in this country do not have the capacity to afford data like us or like most of us in this room”1346. MTN further states that in order to assist the poor, they have introduced “steppa” devices (smartphone and tablet) “for the most vulnerable”1347 South Africans. Our understanding is that consumers who purchase these steppa devices are charged an OOB rate of 29c.1348 MTN also states that the poor are also able to buy 50 MB of data from MTN for only R2.1349 MTN also highlights that they spend over one billion Rand subsidising smart phones (that are able to use data services) sold at Pep Cell and Ackermans because they know “that people cannot afford the phones and it’s a way of helping the poor”1350.
933. Telkom states that given that most of the population use mobile devices to access data, it is common cause that most South Africans, especially lower-income consumers, rural
1343 Vodacom’s submission dated 15 October 2018, p. 32 (Non-confidential version)1344 Vodacom’s submission dated 15 October 2018, p. 33-37 (Non-confidential version)1345 MTN’s presentation at the public hearings held on 17-19 October 2018. See Day 2 transcripts, p. 801346 MTN’s presentation at the public hearings held on 17-19 October 2018. See Day 2 transcripts, p. 911347 MTN’s presentation at the public hearings held on 17-19 October 2018. See Day 2 transcripts, p. 881348 MTN’s presentation at the public hearings held on 17-19 October 2018. See Day 2 transcripts, p. 891349 MTN’s presentation at the public hearings held on 17-19 October 2018. See Day 2 transcripts, p. 841350 MTN’s presentation at the public hearings held on 17-19 October 2018. See Day 2 transcripts, p. 881351 Telkom’s submission dated 15 October 2018, p. 25 (Non-confidential version)1352 Telkom’s submission dated 15 October 2018, p. 27 (Non-confidential version)1353 Amandla.mobi’s presentation at the public hearings held on 17-19 October 2018. See Day 1 transcripts, p. 6-71354 The less connected (De Lanerolle et al, 2017) are those who are dependent on mobile phones and mobile networks for internet access and who live on or below median incomes, and who, evidence suggests, are buying data in very small packages.1355 Amandla.mobi presentation to the data market inquiry public hearings, slides 4-71356 Right2Know presentation to the public hearings, slide 9
customers, small business and the unemployed are concerned about high mobile data prices in South Africa.1351 Furthermore, Telkom states that lower income consumers are further “disproportionately penalised by incumbents’ pricing practices such as high pricing of small data bundles, high premium for prepaid data compared to post-paid rates and high out-of-bundle rates”1352.
934. According to Amandla.mobi, those that cannot afford or have no access to data are excluded from a lot of things, for instance the process of applying for school placement in Gauteng is now done online. In addition, amandla.mobi states that low-income consumers purchase small bundles and are therefore paying a premium. It is well documented that, per megabyte, they are paying much higher prices for data.1353 Amandla.mobi further states that the research conducted on the ‘less connected’1354 based on Izolo mobile diaries’ research sample shows that the less connected are buying airtime and data in small quantities, the less connected consume airtime and data in small quantities, the less connected pay a ‘poverty premium’ for mobile data, the less connected limit their experience online, and the less connected have connections that are “frugal and fragile”1355.
935. Right2Know shares the same view and submits that lower-income, rural customers, small business and the unemployed are disproportionately affected by the high cost of data in South Africa. Right2Know further states that this group will benefit the most from being connected. Right2Know also highlights that for income categories between R500 and R2000, “…loss of economic opportunities experienced by the inability to communicate can have strong negative effects on households”.1356 According to Right2Know, it is important for data to be affordable because it allows households to conduct tasks that would otherwise require extra money and time such as applying for jobs, receiving offers,

240
banking, crime prevention and work-related transactions.1357
936. RIA also submits that their survey shows that the cost of communication in South Africa is unaffordable for low income consumers. In addition, RIA states that half of those that are not connected are low income consumers.1358
937. DG MT also states that poor consumers are paying 10 to 30 times more for their data than the wealthiest consumers. This is because prepaid bundles cost almost twice as much as post-paid contracts, smaller bundles cost a lot compared to bigger bundles and poorer people are more likely to run out of data and use the OOB data rates.1359 DG MT is of the view that affordable data prices would spark innovation, reduce the cost of social innovation, and provide the critical basic education needed for children.1360
938. The ANC also states that high data prices prevent low-income consumers from accessing the internet, finding job opportunities, participating in supply chain opportunities and accessing government services. The ANC also adds that reduced data prices would allow the poor to communicate with each other and also allow them to participate in the mainstream economy.1361
939. A4AI states that because of high income inequality in South Africa, the poorest 20% of the population would spend 19% of their monthly income in order to purchase 1GB of data while the top 20% of income earners spend less than 1% of their income on the same 1GB of data.1362
940. The DTPS also states that high data prices have significantly increased the cost to communicate, especially for poor consumers.1363
12.2.5. Submissions on pro-poor remedies
941. In order to help mitigate the detrimental effect of high data costs on low income consumers and to bridge the price spread between low-volume consumers and high-volume
1357 Right2Know presentation to the public hearings, slide 91358 RIA’s presentation at the public hearings held on 17-19 October 2018. See Day 1 transcripts, p.251359 DG MT’s presentation at the public hearings held on 17-19 October 2018. See Day 1 transcripts, p.64-651360 DG M’s presentation at the public hearings held on 17-19 October 2018. See Day 1 transcripts, p. 661361 ANC’s presentation at the public hearings held on 17-19 October 2018. See Day 3 transcripts, p.43, 45 1362 A4AI’s presentation at the public hearings held on 17-19 October 2018. See Day 3 transcripts, p. 581363 DTPS presentation to the data market inquiry public hearings dated 19 October 2018, slide 81364 Right2Know presentation at the public hearings held on 17-19 October 2018, slide 111365 DGMT presentation at the public hearings held on 17 -19 October 2018, slide 151366 DGMT presentation at the public hearings held on 17 -19 October 2018, slide 15-181367 Amandla.mobi presentation at the public hearings held on 17 – 19 October 2018, slide 9
consumers, stakeholders making presentations at the public hearings proposed a number of remedies. For the purposes of this section, we only consider remedies dealing with the issue of higher prices for low-income consumers relative to higher-volume consumers. The following are the remedies we considered:
942. Right2Know suggest the following remedies are necessary to assist poor consumers:1364
942.1. Communications must be universal. i.e. communications services must be available everywhere and affordable to all;
942.2. All SMS’s should be free as they costs operators nothing to transmit;
942.3. Free basic airtime and data for all, just like water and electricity; and
942.4. Bundles should not expire if unused.
943. DGMT suggests that “we must start to implement specific, pro-poor strategies to expand access to digital information.”1365 Such strategies include1366:
943.1. Zero-rating mobile data costs for services provided by PBOs and government.
943.2. Address market failure and address specific pricing strategies to stop poorer consumers being disadvantaged.
943.2.1. Make the unit price of pre-paid and post-paid the same;
943.2.2. Ensure the same unit price for all bundles, regardless of size;
943.2.3. Data should roll over for at least 3 months; and
943.3. Require that pre-paid mobile data offerings and data bundles are consistent, clear, easy to understand and comparable between mobile networks.
944. Amandla.mobi submits the following:1367
944.1. Regulate to limit the spread of pricing between large and small data bundles;
944.2. Regulate to limit the spread between pre-paid and post-paid customers;

241
944.3. Abolish OOB pricing;944.4. Require operators to provide and publish
data on volumes of purchases of data at their different bundle sizes and price points; and
944.5. Develop new price and affordability indices that take account of sachet pricing and avoid measures of affordability that use average incomes.1368
945. MMA submits the following remedies:1369
945.1. Free public access to internet at government sites such as schools, libraries, health facilities, etc.;
945.2. Zero-rated access to government websites and data;
945.3. Free Wi-Fi access should be regarded as a basic municipal service;
945.4. Minimum standards for the provision of free internet access (i.e. minimum allocation per person per day, e.g. 500MB per person daily); and
945.5. Setting up of community networks controlled by community members.
946. The A4AI submits as follows:1370
946.1. Focus on innovative public access solutions including community networks
947. The MNOs did not propose remedies that deal directly with the issue of pricing to low-volume consumers relative to high-volume consumers. They instead proposed remedies to deal with the broad challenges faced by the telecommunications industry with the idea that if such challenges are addressed, data prices will decline to the benefit of all consumers, including the poor. Such remedies are discussed in various sections of the report. However, they mentioned that they are doing a lot to help poorer consumers get data prices at lower rates through initiatives such as dynamic pricing or private pricing.
948. MTN for example submits that the industry is moving away from traditional pricing and is
1368 Amandla.mobi presentation at the public hearings held on 17 – 19 October 2018, slide 9 1369 MMA’s presentation slides for the public hearings, dated 19 October 2018, slide 5-6.1370 A4AI presentation at the public hearings held on 17 -19 October 2018, slide 8.1371 MTN’s presentation at the public hearings held on 17-19 October 2018. See Day 2, p. 108 (line21-25) - Page 109 (line 1-4)1372 MTN’s presentation at the public hearings held on 17-19 October 2018. See Day 2 transcripts, p.103, line 18-201373 MTN’s presentation at the public hearings held on 17-19 October 2018. See Day 2 transcripts, p.111, line 231374 MTN’s presentation at the public hearings held on 17-19 October 2018. See Day 2 transcripts, p.111 (line 23-24)-page 112 (line 1-5)1375 Telkom’s presentation at the public hearings held on 17-19 October 2018. See Day 2 transcripts, p.163, line 14-251376 Vodacom’s presentation at the public hearings held on 17-19 October 2018. See Day 2 transcripts, p. 53 (line 21-25)-page 54 (line 1-6)1377 MTN’s presentation at the public hearings held on 17-19 October 2018. See Day 2 transcripts, p. 112, line 10-111378 A public benefit organisation (PBO) can be a trust, a company (a not-for-profit company in terms of the new Companies Act) or another association registered with the South African Revenue Service (SARS) in terms of Section 30(1) of the Income Tax Act, No 58 of 1962.
increasingly leaning towards private prices which they claim gets 80% of their bottom end customers paying less for data services. In this regard, MTN stated that: “[…] we really believe that moving forward we are going the private pricing”1371 […] “the people at the bottom 80% of the spenders (sic) get the lowest effective rate today on the MTN network”1372 MTN did not, however, provide any evidence to support this claim.
949. Absent proposal of further remedies by MNOs on the question at hand, the panel for the public hearings invited comments from the MNOs on remedies proposed by stakeholders who made submissions on the 18th of October 2018. We discuss the MNOs’ submissions below.
950. Some stakeholders advocated for the elimination of price discrimination or the price spread between low-volume and high-volume data bundles. All the MNOs did not agree with this proposal on the basis that users are not the same. Some users are heavy users and some are light users and hence the pricing must be different. MTN for example argued that “it would be a very dangerous idea”1373 because it would not be fair to charge the same price to a student doing his homework and researching on Google as a person streaming content on You Tube.1374 Telkom used the same analogy as MTN in its argument.1375 Vodacom also argued that regulating retail prices would create less flexibility in competition and that it would limit the ability of MNOs to offer short validity data bundles at lower prices to customers, 80% of which are choosing such options.1376 The latter point was echoed by MTN who stated that “if you have a flat rate you would not be able to offer the ten rand a gig to the most vulnerable customers.”1377
951. Another proposal made by stakeholders, notably DGMT, on how to help poor consumers pay less for data was the zero-rating of certain applications, especially those run by PBOs.1378 All MNOs agreed with this idea and all, except Telkom, indicated that they already

242
have a multitude of customers under this category. MTN for example stated that it has many customers in the PBO category and has policies to zero-rate content for educational institutions.1379 Similarly, Vodacom states that zero-rating is necessary and they are open to it. They already zero-rate university content, jobs and educational sites.1380 By the same vein Cell C agreed with the idea of zero-rating and stated that it is doing a good job in this regard by zero-rating the IP addresses of universities. However, Cell C suggest that caution needs to be exercised in zero-rating such that MNOs do not zero-rate just any application, but there must be logic behind it in the sense that it is commercially viable. For example, Cell C suggests that it makes less sense to zero-rate some OTTs such as Facebook and WhatsApp who benefit a lot in advertising revenue. Cell C’s argument is in line with the suggestion of zero-rating PBOs. Telkom is also amenable to zero-rating of PBOs.1381
952. Related to zero-rating, MMA advocated for the idea of proving low speed (also referred to as low bitrate) data for free as proposed in an article by Steve Song in 2015. In the article, Song calls for MNOs to offer low-bitrate generic zero-rating to consumers by offering free 2G services for example. The idea behind Song’s proposal is that not all internet users require faster internet and “even very tiny amounts of data can be enormously valuable”1382 to some users.1383 MNOs are not in favor of this idea as they view 2G services as less than optimal and as a technology that is not in their long term plans. Below is a summary of the MNOs’ comments regarding this proposal:
953. Telkom stated that:
953.1. “The less-than-optimal user experience, low speed and relatively high cost of providing data over the 2G network makes the proposal of providing free 2G data expensive. Furthermore, Telkom has only approximately 250,000 2G-only customers remaining on its mobile network. This is out of a base
1379 MTN’s presentation at the public hearings held on 17-19 October 2018. See Day 2 transcripts, p. 113, line 5-151380 Vodacom’s presentation at the public hearings held on 17-19 October 2018. See Day 2 transcripts, p. 54, line17-181381 Telkom presentation at the public hearings held on 17-19 October 2018. See Day 2 transcripts. P. 163, line 6-81382 Song,S. (25 November 2015) Zero-Rating: A Modest Proposal. [Online]. Available at: https://manypossibilities.net/2015/11/zero- rating-a-modest-proposal/ [Last viewed on 11 April 2019]1383 Song argues that a proposition like this is more strategic as it would ensure that everyone has at least some connectivity as opposed to some percentage of the population getting fast internet. Song estimates that offering “free 2G data to all would consume less than 1% of the design capacity of the international submarine cables landing in South Africa.” (https://manypossibilities.net/2015/11/zero- rating-a-modest-proposal/).1384 Telkom’s submission dated 01 March 2019, p. 25, para. 64 (Para.62 – 67 confirmed as non-confidential on 29 March 2019).1385 MTN’s submission dated 01 March 2019, p.13, para. 18.3 (Para.18.1 – 18.3 confirmed as non-confidential 25 March 2019).
of approximately 5.6 million customers. Telkom’s strategy is to switch off its 2G network as soon as possible and to redeploy the spectrum for 3G and 4G/LTE services. 2G is not seen as a long term viable network option, as it does not efficiently utilise spectrum which is a scarce resource. This is a trend common amongst many operators which need to utilise spectrum efficiently.”1384
954. MTN stated that it –
954.1. “[…] considers 2G to be an inappropriate technology to drive data adoption, as this will result in a poor customer experience and is likely to constrain data usage. 2G technology is an inefficient technology and does not allow for a reliable access to data services and would further constrain MNOs’ ability to a plan and roll out new more efficient technologies, which would create far more capacity and substantially lower unit costs. A more efficient method of addressing issues with access to internet service would be to further facilitate network capacity expansion and competition, by encouraging spectrum allocation […].”1385
955. Cell C submission argued as follows:
955.1. “We recognise the importance of providing access to affordable data and the role it can play in economic development […]. However, the proposal to offer low-speed, free data access to customers will not help achieve this goal. Although 2G can be used for instant messaging, web browsing is more data-intensive and requires access to better technologies such as 3G or 4G.
955.2. There are also constraints from a technical perspective. While the fixed costs of building a greenfield deployment is highest for 4G, lower for 3G and lowest for 2G, the variable costs for building a greenfield deployment would be highest for 2G, lower 3G and lowest for 4G.
243
[…] A massive influx of traffic on the 2G network will therefore have a significant cost implication for MNOs, as this is the most expensive means of providing data services [...]
955.3. Additionally, MNOs are already spectrum-constrained and will face further capacity constraints if a large portion of their spectrum is to be used solely for 2G. it will also limit the extent to which an MNO can re-farm its spectrum in order to adapt to the changing market dynamics.
955.4. The use of the 2G network to offer free data to a large portion of the population will also run counter to government’s policy objectives as set out in SA Connect, which aims to have a connection speed of 5 Mbps for 90% of the population and 100 Mbps for 50% of the population by 2020. […] 2G rates are between 150 Kbps and 384 Kbps.
955.5. There is a further concern that such a policy would entrench the dominance of the incumbent MNOs. It is likely that consumers will prefer to use the free 2G network of the incumbents due to better coverage and quality offered by their networks. In the event that a customer eventually chooses to (sic) for using a superior technology (3G/4G), the burden to switch to another MNO might be too high and may cause a customer to remain with the incumbent.
955.6. In Sum, the proposed policy will have little benefits for consumers and will have potentially large negative impacts on consumers and MNOs, while detracting from the goals currently set out by policymakers.”1386
956. Vodacom submitted that it does not support any remedy that would require it to provide access to all data services for free other than just those with a clear social benefit. Vodacom states the following, amongst others, as reasons for rejecting this remedy:
956.1. “Impact on investment. […] MNOs would have a poor incentive to roll-out networks into rural areas where incomes are typically on average low
1386 Cell’s submission dated 28 February 2019, p. 28-29. item 30 (Non-confidential as claimed in CC7 on 28 February 2019)1387 Vodacom’s submission dated 22 February 2019, p.19-20, para. 22.3 (Para. 22.1 – 22.3.2.3 confirmed as non-confidential on 4 April 2019)
[…] The remedy will undermine the overall confidence that MNOs have in the regulatory environment, which could have a knock-on impact for investment, including investment into more advanced technologies going forwards […] because when deciding whether to make investments in the future, operators would rightfully be concerned that they will face intrusive remedies once the investments have been made.
956.2. Impact on capacity constraints. […] the Vodacom network is capacity constrained, especially for services offered using the 2G spectrum. Whilst the Competition Commission assume that only a fraction of Vodacom’s network capacity will be affected this would not be the case in reality. If a service is provided for free, then one can expect usage do drastically increase. This will place an additional constraint on Vodacom’s network and it would have a negative impact on network quality.
956.3. Inefficient use of spectrum. […] A remedy imposed on the services enabled through 2G spectrum will slow down MNOs ability to re-farm spectrum for use for 3G and 4G […], Ultimately, it may delay MNOs’ ability to switch off 2G networks. Market distortion: Obliging an operator to offer services for free will force the other operators competing in the same market to also offer the services for free which will impact negatively on customer choice and competition. For example, smaller operators may as a result suspend their service in these areas or to these customers.”1387
957. It appears from the above that a policy that would oblige MNOs to offer free low bitrate for free would be opposed by operators, and there may potentially be unintended consequences from such a policy.
12.3. Other issues identified during the course of the Inquiry
958. In this sub-section, we detail any further issues identified by the Commission during the course of the inquiry, whether through subsequent submissions or information provided by
244
stakeholders, information provided by new stakeholders identified by the Commission, or through the Commission’s own analysis of information provided or obtained by the Commission.
959. In a report by Frontier Economics on behalf of Vodacom submitted to ICASA’s Priority Markets Inquiry, Vodacom submits that there is no infrastructure based competition or competition based on passive access products because Telkom has an alleged dominant position for the majority of fixed infrastructure. Given Telkom’s dominance in this market, there is a perception that lack of infrastructure based competition or lack of competition based on passive access products has led to poor outcomes in the fixed data market. In this regard, it is submitted that only about 2.6% of the population is using fixed broadband (only 0.4% is using fibre to the premises), average mobile broadband speed is higher than the average fixed broadband speed and fixed data prices were 1.46 more in 2016 as compared to 2015.1388
960. The same report by Frontier Economics states that [].1389
961. The third issue identified is that ICASA has not fulfilled the requirements of section 43(8) of the ECA which obliges it to “prescribe a list of essential facilities and list of examples of essential facilities is given.”1390
962. Vodacom submits that “providing alternative operators with access to existing duct and poles infrastructure would help to incentivise competitive investment by significantly reducing the costs of network roll-out”1391. Vodacom further submits that ICASA should draw upon the experience of EU countries, where passive infrastructure has been introduced, such as the UK, Spain and Portugal.1392
1388 Frontier Economics report in Vodacom’s submission to ICASA dated 10 October 2017, p. 87-93 (Confirmed as non-confidential on 4 April 2019)1389 Frontier Economics report in Vodacom’s submission to ICASA dated 10 October 2017, p. 77. 1390 Cell C submission dated 24 November 2017 (non-confidential), para 4.7, p. 141391 Frontier Economics report in Vodacom’s submission (non-confidential) dated 30 November 2017, p. 371392 Frontier Economics report in Vodacom’s submission (non-confidential) dated 30 November 2017, p. 371393 Frontier Economics report in Vodacom’s submission (non-confidential) dated 10 October 2017, p. 100
963. The fifth issue is that the DOC/DTPS has previously recognised that greater-infrastructure based competition would be beneficial in South Africa’s fixed market. Given this, in 2007, the DOC “set a deadline of 01 November 2011 for the introduction of Local Loop Unbundling (“LLU”) - it expected that 80% of Telkom’s networks would have been opened to rivals by 2011. However as of August 2017, the final LLU regulations are yet to be enacted”.1393 The understanding is that LLU entails opening up existing “last-mile” infrastructure, in this case the copper lines that connect people’s homes to Telkom’s network to other telecommunications service providers.

245
964. The majority of submissions have held that data prices in South Africa are too high, particularly when compared against prices observed internationally. It is only Vodacom and MTN that have taken an opposing view on this aspect or at least cast some doubt on the seemingly widely held view that data prices in South Africa are too high and the relevance of international price comparison studies for the debate more broadly. In this appendix, we cover these views in more detail, and address the arguments made with respect to international price comparisons.
965. In terms of such views, the Inquiry received submissions from both MTN and Vodacom:
965.1. MTN provided its submissions in response to the Commission’s request for information on 27 November 2017. It also made submissions in the context of the Data Inquiry Public Hearings on 15 October 2018. Finally, MTN also answered questions about prices in South Africa relative to other countries during the Hearing proceedings on 18 October 2018.
965.2. Vodacom made submissions on this aspect based on a report by Frontier Economics dated 30 November 2017, which has been retained by Vodacom. This report was prepared in response to the Commission’s request for information at the beginning of the data inquiry. Vodacom also submitted another report dated 10 October 2017 which was originally submitted to ICASA in the context of its priority markets review. Since then, Frontier has responded to two requests for further information on the analysis contained in their 30 November 2017 report. Frontier responded to the first request on 14 September 2018 and it responded to the second request on the 8 October 2018. Vodacom and MTN also made submissions to the Data Inquiry
Public Hearings on 15 October 2018 which dealt with price benchmarking. They also answered questions about price comparisons during the Hearing proceedings on 18 October 2018.
966. This appendix predominantly addresses the arguments made in Frontier’s 30 November 2017 report. However it also draws on MTN’s submissions as well as Vodacom’s other submissions to the Data Inquiry. In particular, the appendix addresses the following key claims:
966.1. Existing benchmarking studies show that prices in South Africa are not materially worse than those observed in other African countries.
966.2. Based on the GSMA MCI, South Africa is a top performer in terms of value for money.
966.3. Based on price relative to GDP per capita, South Africa fares better than many (MTN’s view) or most (Vodacom’s view) African countries
966.4. South Africa performs well relative to its GDP per capita compared with a wider international sample of countries.
Price comparison studies show South Africa is not pricing materially worse than other countries in Africa
967. Frontier (and Vodacom) has attempted to cast some doubt on the relevance and reliability of the results of international price comparison exercises.
967.1. However, despite pointing out the methodological difficulties associated with existing benchmarking studies in Vodacom’s submission to the Inquiry, Frontier reports on the results of existing ICASA and RIA studies of prices. It
13. APPENDIX E: DETAILED DISCUSSION OF VODACOM AND MTN SUBMISSIONS ON
COMPARATIVE PRICE LEVELS

246
states that they “do not imply that prices in South Africa are persistently and materially higher than those observed in other African countries”1394 In particular, the following results were reported on:
967.1.1. It reported, based on an ICASA comparison among SADC countries, that “South Africa’s prices are below the average for 1GB and 2GB bundles”.1395
967.1.2. It reported, based on RIA reports, that “South Africa is generally towards the cheaper end of all (African) countries, particularly on measures that do not focus on single prices. For example, for the 2017 Value for Money Index (VMI), which compares the value of the contents of a bundle with the bundle price, South Africa is the 10th cheapest of 35 African countries”1396.
968. This is contrary to the findings by the Commission based on its own review of RIA and ICASA studies. A careful consideration of the most relevant evidence from price comparison/benchmarking studies is presented by the Inquiry in Section 3.2 above. What this shows, and what we show here, is that despite Frontier stating that prices in South Africa are not higher than those observed in other African countries, the evidence presented by Frontier itself suggests otherwise. It shows that South Africa does have higher data prices than in a number of other countries in Africa.
968.1. Based on the ICASA data Frontier presented for the second quarter of 2016, prices for a 1GB bundle are higher for the three largest operators in South Africa (Vodacom, MTN and Cell C) than in five of the twelve SADC countries shown (i.e. Mauritius, Malawi, Tanzania, Mozambique, Lesotho). Similarly, of the ten SADC countries presented, the
1394 Frontier Economics report in Vodacom’s submission (non-confidential version) dated 30 November 2017, p. 211395 Frontier Economics report in Vodacom’s submission (non-confidential version) dated 30 November 2017, p. 221396 Frontier Economics report in Vodacom’s submission (non-confidential version) dated 30 November 2017, p. 251397 Frontier Economics report in Vodacom’s submission (non-confidential version) dated 30 November 2017, p. 231398 Frontier Economics report in Vodacom’s submission (non-confidential version) dated 30 November 2017, p. 241399 Frontier Economics report in Vodacom’s submission (non-confidential version) dated 30 November 2017, p. 251400 Frontier Economics report in Vodacom’s submission (non-confidential version) dated 30 November 2017, p. 211401 ICASA (October 2017), Bi-annual report on the analysis of tariff notifications submitted to ICASA for the period 1 January 2016 to 30 June 20171402 Frontier Economics report in Vodacom’s submission (non-confidential version) dated 30 November 2017, p.23, Footnote 28
three largest South African operators’ prices for a 2GB bundle are higher than in four other SADC countries (Tanzania, Malawi, Mauritius, and Mozambique) and broadly on par with one of them (Zambia).1397 Furthermore, Frontier itself notes that in a later study covering 1 January 2016 until 30 June 2017, South Africa was only ranked 14 of 19 African countries for the cheapest prepaid 500MB tariffs. In other words, thirteen other African countries had cheaper minimum tariffs for 500MB bundles than in South Africa.1398
968.2. Based on the RIA results presented by Frontier, 27 African countries offered cheaper 1GB data bundles than in South Africa in the second quarter of 2017 and 22 African countries offered more expensive data bundles.1399 South Africa was ranked tenth in terms of value for money on its cheapest 1GB data basket which means that 9 countries of 35 scored provided better value than it.
969. Frontier’s conclusion that “…existing studies from ICASA and RIA that look at headline mobile data prices in African countries do not imply that prices in South Africa are persistently and materially higher than those observed in other African countries”1400 is therefore misleading.
970. It also appears that Frontier selectively presented only the most favourable results from the ICASA and RIA analyses it reviewed, with a number of key observations omitted:
970.1. ICASA Bi-annual report 1 January 2016 to 30 June 2017: ICASA reported that 13 African countries out of 26 offered lower minimum 1GB data bundle prices than in South Africa.1401 This finding was not reported by Frontier even though this report was referenced elsewhere by Frontier.1402
970.2. RIA RAMP report Q2 2017: The report showed that compared to “some of
247
the most dynamic telecommunications markets in Africa”, namely Egypt, Tanzania, Ghana, Nigeria and Kenya, South Africa has the most expensive minimum price for a 1GB data bundle. Furthermore, it showed that amongst 13 SADC countries, five countries had less expensive minimum prices for 1GB of data than South Africa.1403,1404 Both pieces of evidence were not reported by Frontier even though they were presented in the two documents referenced by Frontier1405.
970.3. RIA website Q1 2017: Frontier presented a comparison of the prices of voice and SMS baskets across 48 African countries.1406 However, given that the basket does not include data, the results of this comparison are less relevant for the Inquiry. In Figure 6 of Frontier’s 30 November 2018 report in which this analysis is reported, Frontier explicitly notes that the second column refers to a basket of 30 voice calls and 100 SMSs per month.1407
971. Frontier also looks at price comparison studies that attempt to take into account quality factors. In this respect, Frontier presented RIA’s results of the comparison of value for money on its cheapest 1GB data basket in the second quarter of 2017. The results show that South Africa scores 10th of 35 African countries. The Commission has two remarks in relation to these results.
971.1 Frontier’s reporting on RIA’s VMI is by no means a conclusive comparison on value for money. It divides the summed value of bundled airtime (in USD), voice minutes, SMSs and data by the monthly basket price inclusive of tax. However, as indicated by Frontier itself, there are other factors that are also important for determining value-for-money such as network speed, coverage and customer service.1408
1403 The same information was left out when Frontier reported on RIA’s October 2017 presentation, titled “Data pricing trends in South Africa – PPC presentation by Research ICT Africa”1404 RIA (2017) “SA data prices static for two years but consumers not flocking to cheapest product offering” Policy Brief no. 3, footnote 1391405 Frontier Economics report in Vodacom’s submission (non-confidential version) dated 30 November 2017, pp. 24-25, Figure 6 and Foot note 351406 Frontier Economics report in Vodacom’s submission (non-confidential version) dated 30 November 2017, p.24, Figure 61407 Frontier Economics report in Vodacom’s submission (non-confidential version) dated 30 November 2017, p.24, Figure 61408 Frontier Economics report in Vodacom’s submission (non-confidential version) dated 30 November 2017, p.131409 RIA RAMP VMI Africa comparison webpage, [Online]. Available at: https://www.researchictafrica.net/ramp/ramp_vmi_africa.php [Accessed 20.09.2017]1410 Frontier Economics report in Vodacom’s submission (non-confidential version) dated 30 November 2017, p.6; Frontier report (submitted to ICASA) in Vodacom’s submission, 10 October 2017, (Confirmed as non-confidential on 4 April 2019) p.581411 Frontier Economics report in Vodacom’s submission (non-confidential version) dated 30 November 2017, p.46
971.2. In order for it to have obtained the VMI ranking for South Africa, Frontier would have to have accessed the RAMP VMI webpage1409, which contains both South Africa’s ranking relative to 34 other countries in Africa as well as the ranking of three operators in South Africa. South Africa’s 10th place ranking is based on Telkom Mobile’s price, the cheapest in the country. The value for money indices of the other much larger operators were 71-85% worse than Telkom Mobile, a company that accounted for a small fraction of the market in 2017. If instead, the VMI score of Vodacom, the largest operator in the market, was used South Africa would rank 24th of the 35 African countries although this is in relation to each comparator countries’ lowest price relative to speed. This ranking might change should Vodacom’s prices be compared with the prices of the largest operators across Africa, which would be a fairer comparison.
972. Based on its review of the RIA and ICASA studies, Frontier suggests that prices in South Africa could be expected to be higher than in other African countries on the basis of better non-price outcomes such as quality. Therefore, the results of the RIA and ICASA studies are particularly good.1410
973. On the basis of the above, it appears that Frontier has misrepresented the results of the ICASA and RIA research. Contrary to its claims, South Africa has higher data prices than many countries in Africa.
Based on GSMA Mobile Connectivity Index, South Africa is a top performer in terms of value-for-money
974. In order to account for quality differences across countries, Frontier has presented the GSMA MCI which it says measures value-for-money.1411
248
Among African countries, South Africa is ranked second after Mauritius in Africa on this measure. Based on a broader sample of 150 countries across the world, its score is also in line with that predicted by its GDP per capita.1412 Frontier use this to make the conclusion that South Africa performs well relative to the rest of Africa and in line with the rest of the world “when taking into account non-price factors to derive ‘value for money’ measures for mobile data services…”1413.
975. However, further investigation of the MCI shows that it cannot be interpreted as a value-for-money measure. Based on the GSMA report outlining the methodology behind the compilation of the MCI, the MCI measures the enablers of mobile internet connectivity, where mobile internet connectivity may be defined as the percentage of the population connected to the internet via mobile devices. The purpose of the index is to help the mobile industry and other stakeholders on where to focus action to drive increased mobile internet adoption1414. Thus the index is more about access to and usage of mobile internet, rather than value-for-money.
976. The higher the score, the better the enabling environment is for mobile internet connectivity.1415 The index is comprised of four enablers namely infrastructure, affordability, consumer readiness, and content and services. Each enabler is made up of a number of dimensions, which are constructed by aggregating one or more indicators.
977. These enablers, dimensions, and indicators, as well as the weights assigned to them, are presented in the table below.
978. Based on the table below as well as GSMA’s publication setting out the methodology behind the compilation of the MCI, it is clear that it is not a ‘value for money’ measure as indicated by Frontier.
1412 Frontier Economics report in Vodacom’s submission (non-confidential version) dated 30 November 2017, p.301413 Frontier Economics report in Vodacom’s submission (non-confidential version) dated 30 November 2017, p.211414 State of Mobile Internet Connectivity 2018, 3 September 2018, available at: https://www.gsma.com/mobilefordevelopment/programme/ connected-society/state-of-mobile-internet-connectivity-2018/ [Accessed 5 October 2018]1415 As any index, the numbers are ordinal; they express relative value rather than value in and of themselves (i.e. nominal).1416 Mobile Connectivity Index: Methodology report, July 2018, p.2-31417 The dimensions and indicators which make up the MCI could potentially be used to compare value for money or ‘value for affordability’ across countries. Given that GSMA does not provide the underlying non-normalised data for the MCI, this is currently impossible1418 MTN’s presentation in the Data Services Market Inquiry Public Hearings, 15 October 2018, Slides 9 and 10; Vodacom’s submission (non-confidential version), 15 October 2018, p.141419 MTN also indicated that the ITU Development Index and Economist Inclusive Internet Index measure ICT and broadband performance. It
is similarly difficult to show that the mean years of schooling, secondary enrolment ratios, and tertiary gross enrolment ratios which form part of the ITU Development Index reflect the performance of the ICT and broadband sector. Further, linking urban electricity access, rural electricity access, level of literacy, years of schooling, privacy regulations, and female STEM education plans in the Economist Inclusive Internet Index have a tenuous link to performance in the ICT and broadband sector.
978.1. Firstly, GSMA has never referred to the MCI as a value for money index. In fact, it was never intended for that purpose.
978.2. Secondly, it is an input index rather than an output index. It intends to measure and understand why people are not using mobile internet services rather than the intensity of mobile internet usage.1416
978.3. Thirdly, it does not measure the quality of mobile internet in each country, although some of the indicators of which it is comprised do measure these aspects. For example, consumer readiness (which includes the female literacy rate) and content and services (which includes the number of mobile apps in local languages) have got little to do with the quality of data services offered by mobile data operators in each country.
979. Based on the aforementioned, Frontier’s use of the MCI to argue that South Africa faces better value for money relative to other countries is unfounded.1417
980. In their submission to the Data Inquiry hearings on 15 October 2018, both Vodacom and MTN referred to the GSMA MCI as an index measuring the performance of the mobile sector1418. Again, the MCI is considered by GSMA to be an input index which compares how enabling the environment is for the use of mobile internet services across countries. Mobile operators have little or no influence over important components of the index such as basic skills (e.g. adult literacy rate) and gender, both of which comprise 12.5% of the MCI. Therefore, using this index to compare performance of the mobile sector across countries is also not accurate.1419

249
Enabler Dimension Indicator Original unit of measurement Source
Infrastructure (25%)
Network coverage (30%)
2G network coverage (20%) % population covered ITU
3G network coverage (40%) % population covered GSMA Intelligence
4G network coverage (40%) % population covered GSMA Intelligence
Network performance (30%)
Mobile download speeds (33%) MbpsOokla’s Speedtest Intelligence
Mobile upload speeds (33%) MbpsOokla’s Speedtest Intelligence
Mobile latencies (33%) MillisecondsOokla’s Speedtest Intelligence
Other enabling infrastructure (20%)
International bandwidth per user (30%) Bits per second ITU
Number of secure servers (30%)Secure servers per 1 million people
World Bank
Access to electricity (30%) % of population with access SEforALL
Number of Internet exchange points (IXPs) (10%)
IXPs per 10 million people Packet Clearing House
Spectrum (30%)
Digital dividend spectrum (45%) MHz per operator GSMA Intelligence
Other spectrum below 1 GHz (20%) MHz per operator GSMA Intelligence
Spectrum in bands 1-2 GHz (35%) MHz per operator GSMA Intelligence
Affordability (25%)
Mobile tariffs (25%)
Cost of entry usage basket (100 MB) (40%)% of monthly GDP per capita
Tarifica
Cost of medium usage basket 500 MB) (40%)% of monthly GDP per capita
Tarifica and ITU
Cost of high usage basket (1 GB) (20%)% of monthly GDP per capita
Tarifica
Handset price (25%)
Cost of entry-level handset (100%) % of annual GDP per capita Tarifica, Strategy Analytics
Inequality (25%)
Gini-coefficient (100%) Index value (1-100) World Bank
Taxation (25%) Cost of taxation (50%) Cost of tax as a % of TCMO GSMA
Cost of mobile-specific taxation (50%)Cost of mobile-specific taxes as a % of TCMO
GSMA
Consumer readiness (25%)
Basic skills (50%)
Adult literacy rate (25%)% of literate adult population (above 15 years old)
UN
School life expectancy (25%) Years UN
Mean years of school (25%) Years UN
Tertiary enrolment rate (25%) % UN
Gender equality (50%)
Gender literacy ratio (25%) Female/male ratio UN
Gender years of schooling ratio (30%) Female/male ratio UN
Gender bank account ratio (25%) Female/male ratio World Bank Global Findex
Gender labour participation ratio (10%) Female/male ratio ILO
Gender GNI per capita ratio (10%) Female/male ratio UN
Content and services (25%)
Local relevance (50%)
TLDs per capita (20%)Number of domains per person
ZookNIC
E-government services (20%)Index value (0=worst, 1=best)
UN
Mobile social media penetration (30%) % population We are Social
Mobile application development (30%)Number of mobile apps developed per person
Appfigures
Availability (50%)
Number of apps in national language (50%)Number of mobile apps available in national language(s)
Appfigures, GSMA Intelligence and Ethnologue
Average % population that can use each app in the top 400 for the country
Appfigures, GSMA Intelligence and Ethnologue
Table 28: Composition of the GSMA MCI
Source: Mobile Connectivity Index: Methodology report, July 2018, pp. 5-7, 17-18. Notes: Weights are provided in brackets. All the indicators per dimension are weighted such that the weights add up to 100% for each dimension. All the dimensions per enabler are weighted such that the weights add up to 100% per enabler. All the enablers are weighted by 25% to obtain the overall mobile connectivity score.
250
Based on price relative to GDP per capita, South Africa fares better than many (MTN’s view) or most (Vodacom’s view) African countries
981. Vodacom (via Frontier) compares prices as a percentage of GDP per capita across African countries to show that South Africa is “consistently ranked amongst the cheapest in Africa”.1420 This is based on GSMA index data, which it notes “allows for a more comprehensive comparison of prices across countries”. The GSMA data compares prices relative to GDP per capita across a range of data usage categories (entry, medium and high).
982. MTN is more conservative in its assessment; it indicates that ‘affordability’ measures show that “affordability tariffs enjoyed by South African subscribers are typically far better than those available in many putative comparator countries in Africa” (emphasis added).1421 This is based on GSMA affordability index data as well as ITU prices divided by GDP per capita. It argues that by considering the ‘affordability’ of mobile data services in each country, one can attempt to account for cost differences relevant to mobile data services across countries.1422
983. The Inquiry tried to replicate Frontier’s analysis using the GSMA database. It was unable to do so and as a result followed up with Vodacom and Frontier Economics on 30 August 2018. Frontier made a number of revisions based on apparent changes to the GSMA database between their original assessment and when it redid its analysis in September 2018. It also submitted a comparison amongst African countries using 2017 data which had become available.1423
984. 974. Frontier sent the Inquiry1424 as well as Frontier’s interpretation of the pricing data1425,South Africa ranked second best in terms of prices among 44 African countries for the entry basket (100 MB) in 2017, where a higher index score implies a better (lower) price. It had the fourth best price for the medium basket (500 MB) and third best price for the high basket (1 GB). This is not too different from 2016, when the data shows that South Africa
1420 Frontier Economics report in Vodacom’s submission (non-confidential version) dated 30 November 2017, p.251421 MTN Submission (non-confidential version) dated 27 November 2017, p.371422 MTN Submission (non-confidential version) dated 27 November 2017, p.371423 Frontier’s submission dated 14 September 2018 (Confirmed as non-confidential on 18 April 2019)1424 Frontier’s submission dated 14 September 2018, Figure 7 (Confirmed as non-confidential on 18 April 2019)1425 Frontier Economics report in Vodacom’s submission (non-confidential version) dated 30 November 2017, p. 6-81426 Frontier Economics report in Vodacom’s submission dated 30 November 2017, p.311427 In its recent written submission for the hearings, Frontier interpreted the GSMA price index data more accurately. Its interpretation of GSMA price index comparisons in this case involved referring to “prices as a % of GDP per capita”. Source: Vodacom’s submission (non-confidential version) dated 15 October 2018, p.45
had the fourth best price for the entry basket, second best price for the medium basket and third best price for the high basket. The figures provided by Frontier are shown below.
985. The Inquiry has three broad objections to this data analysis (which are discussed in further detail below). Firstly, Frontier conflates GSMA’s affordability index with prices. Secondly, affordability indices have limited probative value for the purposes of the Inquiry. Thirdly, both Frontier and Vodacom fail to adequately justify why African countries are relevant comparators to South Africa.
Frontier conflates GSMA’s affordability index with prices
986. Frontier has repeatedly conflated the GSMA affordability index, which is based on dividing prices by GDP per capita, with headline data prices. For example, in referring to GSMA’s affordability index, it noted that “only two African countries (Mauritius and Egypt) identified as having consistently lower prices for mobile data when compared using the GSMA’s mobile price index dataset” 1426 (own emphasis).
987. However, price and price divided by GDP per capita are not one and the same. Two countries with the same data prices could have different prices divided by GDP per capita based on differences in GDP per capita between them. A better interpretation of this GSMA data would be to describe it as attempting to measure affordability, or more accurately (because of some of the problems outlined below), prices as a percentage of GDP per capita.1427
Affordability indices such as the GSMA have limited probative value in the Inquiry
988. The Inquiry has a number of concerns with relying on affordability measures such as the GSMA affordability indices which is essentially calculated by dividing data prices by GDP per capita. Firstly, they appear to be highly correlated with a country’s GDP per capita. Secondly, South Africa’s ranking does not necessarily depict the reality in terms of mobile

251
Figure 55: GSMA affordability indices - Entry (100MB), Medium (500MB), High (1GB) baskets (2016-2017)
Source: Frontier’s submission on 14 September 2018, (Confirmed as non-confidential on 18 April 2019), Figure 7

252
data affordability for most South African citizens due to inequality.
989. Affordability indices may be driven by GDP per capita more than prices. Figure 56 below shows GDP per capita (PPP) in 2017 for each country in Africa using World Bank data.
990. Based on the figure below, countries with high GDP per capita tend to rank higher than those with low; seven of the ten countries with the highest GDP per capita (PPP) in Africa were also repeatedly ranked among the ten best African countries for each of the three usage baskets (See Figure 55). These countries are Mauritius, Botswana, Libya, Algeria, South Africa, Tunisia, and Egypt.1428 Therefore, South Africa’s high rankings on the basis of the GSMA affordability indices may be partially accounted for by its relatively high GDP per capita (i.e. the denominator) which is the fifth highest in Africa.
991. Another concern the Inquiry has regarding the use of measures such as the GSMA indices is that South Africa’s ranking may not necessarily depict the reality in terms of mobile data
1428 The remaining three countries with the top ten highest GDP per capita levels in Africa are Gabon, Namibia, and Swaziland. 1429 This has been acknowledged in other research. Based on an article by Hernan Galperin for example (2010): “per-capita GDP, extensively used in the literature, is an average of limited value, especially for countries with high levels of inequality in income distribution. Source: Hernan Galperin, 2010, “Tariffs and the affordability gap in mobile telephone services in Latin America and the Caribbean”, in Regional Dialogue on the Information Society1430 The World Bank reported in April 2018 that South Africa has the worst Gini Coefficient in the world. Source:http://www.engineeringnews. co.za/article/extreme-inequality-is-constraining-south-african-investment-and-growth-2018-04-10 [Accessed 1 October 2018]
1431 Gillwald, A., and Mothobi, O. 13 February 2018, “Measuring digital inequality in SA”, An RIA presentation to the WEF Internet for All Data Working Group, available at: https://researchictafrica.net/wp/wp-content/uploads/2018/02/2018_State-of-ICT-in-South-Africa-Demand- side-indicators-and-pricing.pdf [17.08.2018]; RIA’s response to the Commission’s information request, 27 August 2018
affordability for most South African citizens due to inequality. GDP per capita is a proxy for the income of a typical member of the population of a country. As it is an average, it will be an overestimate where there are high levels of inequality.1429 South Africa has one of the highest levels of inequality in the world and the highest in Africa.1430 As a result, GDP per capita is likely to overestimate the income of a typical South African and therefore also the affordability of mobile data in the country. Comparing prices as a proportion of GDP per capita between South Africa and countries with less income inequality than in South Africa such as those in the rest of Africa is therefore an unfair comparison. Data prices will appear relatively affordable in South Africa compared to other African countries but may in fact be unaffordable for the majority of the South African population.1431 In fact, Mr Godfrey Motsa, the CEO of the MTN South Africa, noted this in his verbal submission at the Data Inquiry hearings: “the current data prices makes South Africa unaffordable to many especially the rural and lower income South Africans again the conclusion from our side is that if you have
Figure 56: GDP per capita (PPP) 2017
Source: Frontier’s submission on 14 September 2018

253
to look at the African context South Africa is actually a leading country when it comes to affordability based on average income. However, everybody knows that South Africa is many countries in one, we talk average and then we hide the effects of the extreme income inequality in the country so that is why for me the discussion should go beyond just are you better than Swaziland, are you better than Lesotho, are you better than Nigeria it has to go beyond that even though that also brings a lot of complexities around how you start doing the bench marks.”1432
992. On the basis of the above, the inquiry believes that affordability measures such as the GSMA indices have limited probative value for the Inquiry and as such little emphasis is placed on them.
Focus on African countries not justified
993. Frontier has not provided a justification for why it has focussed on comparing South Africa’s data prices and affordability to other African countries. In particular, it has not attempted to show that countries in Africa are similar to South Africa in terms of the quality of data services they provide or the underlying costs facing them. In fact, Frontier has repeatedly noted its belief that “South Africa outperforms other African countries on non-price outcomes”1433. Furthermore, it indicated in its original submission that: “…neither the more developed OECD nor the less developed African countries are an ideal comparator for South Africa, unless we take into account differences in income”.1434 Despite this, Frontier has focused on comparing South Africa against other African countries. In fact, in the public hearings, the CEO of Vodacom noted: “I don’t think we should be comparing ourselves to just the best in Africa, but we should be comparing ourselves to the best in the world”1435.
1432 MTN’s presentation at the public hearings held on 17-19 October 2018. See Day 2 Transcript, p.801433 Frontier Economics report in Vodacom’s submission (non-confidential version) dated 30 November 2017, p.321434 Frontier Economics report in Vodacom’s submission (non-confidential version) dated 30 November 2017, p.411435 Vodacom’s presentation at the public hearings held on 17-19 October 2018. See Day 2 Transcript p.361436 Frontier report in Vodacom’s submission (non-confidential version) dated 30 November 2017, p. 17 1437 Frontier did include BRICS comparisons in the report it submitted to ICASA (Confirmed as non-confidential on 4 April 2019), 10 October 2017, p.63-651438 Frontier also did not consider consumption information with respect to Africa. The Inquiry recognised however that this may be because of data unavailability; CISCO consumption data is not publically available for most African countries whereas it is for BRICS.
994. In its initial report for the Competition Commission, Frontier chose not to compare the prices of BRICS countries with that of South Africa. Its reasoning was that because Brazil had a GDP per capita (PPP$) of $23 000 in 2016 and an annual average growth rate of 1% over the last five years whereas India has a GDP per capita (PPP$) of $7 000 and annual average growth rate of 6.9%, comparing South Africa to a BRICS average was deemed to be ‘challenging’. 1436 1437
995. Frontier does not appear to have presented a justification for dismissing a comparison of BRICS countries on this basis. Firstly, Frontier does not explain why annual average GDP per capita growth rates would matter for a comparison of data prices and/or affordability. Secondly and more importantly, Frontier found it appropriate to compare data prices in African countries where GDP per capita also varies widely. For example, GDP per capita in Liberia was $826 (PPP) per annum in 2017 whereas GDP per capita in Mauritius was $22 279 (PPP) in the same year1438. There was a smaller difference in the GDP per capita of the richest BRICS country (Russia - $25 533 PPP) and the poorest BRICS country (India - $ 7 056 PPP) in 2017.
996. Frontier’s assessment lacks a justification for why it considered other African countries to be appropriate comparators to South Africa only. It also did not provide a sound reason for why a comparison with other BRICS countries is not suitable.

254
South Africa performs well relative to its GDP per capita compared with a wider international sample of countries
997. Frontier took a different approach to comparing data prices and affordability across a wider international sample of countries. In recognition of variations in economic and geographic factors across all these countries, Frontier attempted to compare data prices and affordability in relation to countries’ relative stages of development as measured by GDP per capita. Frontier used a simple regression of prices and affordability indices on GDP per capita using an ordinary least squares estimation method. It then estimated predicted values for each country’s prices and affordability based on the assumption that one, there is a linear relationship between prices/affordability and GDP per capita, and two, that only differences in GDP per capita explain the variation in data prices across countries. Frontier then compared South Africa’s prices to the predicted prices generated by the model to assess whether it is higher or lower than ‘expected’. Based on this, Frontier showed that South Africa’s prices/affordability are better or in line with what one would predict based on the statistical relationship between price/affordability and GDP per capita across countries.1439 It was only in the case of the 500 MB mobile data basket where prices were higher than ‘expected’ but since the relationship between prices and GDP per capita was not statistically significant in that case, Frontier disregarded this result. The results showing Frontier’s analysis based on updated GSMA and ITU data on 30 August 2018 are presented in the figures below.
1439 Frontier Economics report in Vodacom’s submission (non-confidential version) dated 30 November 2017, pp. 4, 6, 27-28, 42-451440 Frontier Economics report in Vodacom’s submission (non-confidential version) dated 30 November 2017, p. 151441 Frontier Economics report in Vodacom’s submission (non-confidential version) dated 30 November 2017, p. 15
998. In the subsections that follow, the Inquiry will highlight the problems with the analysis undertaken by Frontier by showing that: (i) Frontier did not have a theoretical basis for the relationship between prices and GDP per capita, (ii) Frontier contradicts itself in relation to the direction of the statistical relationship between these two variables, (iii) the strong statistical relationship between affordability and GDP per capita is obtained by design and is spurious, and (iv) there are serious methodological problems with the approach used to compare South Africa to the broad sample of countries.
Frontier did not have a theoretical basis for anchoring its analysis around the relationship between prices and GDP per capita
999. In its report submitted for the Commission’s Data Inquiry, Frontier indicated that “Demand for mobile services, and therefore prices, will be dependent on income which in turn depends on how well developed a country’s economy is”.1440 The argument goes that because higher income countries are likely to have higher penetration of smartphones and thus higher demand for data services, one can expect a higher quality of data services offered which will in turn result in higher headline prices in these countries. In contrast, in countries where data is still in its ‘nascent stage’, one might expect to see lower prices for data services to encourage customers to migrate from traditional handsets to smartphones.1441
Table 29: BRICS countries GDP/capita (PPP $), growth rates, consumption per user
Sources: World Bank website, available at: https://data.worldbank.org/indicator/NY.GDP.PCAP.PP.CD [Accessed 21.09.2018]; CISCO website, available at: https://www.cisco.com/assets/sol/sp/vni/forecast_highlights_mobile/#~Country [Accessed 21.09.2018]; World Bank website, available at: https://data.worldbank.org/indicator/SP.URB.TOTL.IN.ZS [Accessed 21.09.2018]
GDP/capita (PPP $) (2017)
Compound average growth rates (2013-2017)
Data consumption per user (MB) (2016)
Russia 25 533 (111/161) -0.54% 2 939
China 16 807 (91/161) 6.33% 949
Brazil 15 484 (89/161) -0.62% 878
South Africa 13 498 (82/161) 1.12% 564
India 7 056 (54/161) 6.09% 393

255
Figure 57: Data affordability comparisons between South Africa and an international sample of countries on the GSMA database (2017)
Source: Frontier analysis using GSMA data in Frontier’s submission, (Confirmed as non-confidential on 18 April 2019), 1 September 2018, Figures 16, 4, and 5
Note: Higher scores imply lower prices
Figure 58: Data price comparisons between South Africa and an international sample of countries on the ITU database, 2016
Source: Frontier analysis using ITU data in Frontier’s submission, (Confirmed as non-confidential on 18 April 2019), 1 September 2018, Figures 8 and 9
Note: Lower scores imply lower prices. Note that the 500MB basket is a prepaid handset basket whereas the 1GB data basket is mobile broadband basket for computer-based access.

256
1000. Frontier referred to “a number of studies” showing that income is an important driver of demand for mobile services and as such is likely to have an effect on mobile market outcomes in a given country, including mobile prices.1442 Although Frontier referred to “a number of studies”, it only referenced one, namely a report by Kalba1443, which in fact did not support Frontier’s claims.
1000.1. Firstly, the Kalba paper referenced refers to the relationship between income per capita and mobile phones rather than mobile data services.
1000.2. Secondly, it shows that rather than there being a high correlation between a country’s income level and demand for mobile phones, the relationship between the two variables is more complex. In particular, income and mobile phone penetration is positively correlated at lower income-levels but the relationship is more tenuous at high-income levels 1444
1000.3. Furthermore, the authors state that: “whether the income level “determines” mobile adoption, affects it but is not determinative due to other influences, or is simply correlated with adoption remains open for discussion”.1445
1000.4. Finally, the study does not appear to discuss the impact of penetration rates on mobile phone prices. In fact, it is dedicated to discussing the factors that explain mobile penetration rates.1446
1442 Frontier Economics report in Vodacom’s submission (non-confidential version) dated 30 November 2017, p. 16, 401443 Kalba, K. 2008. “The Global adoption and Diffusion of Mobile Phones”. [Internet]. Available at: http://www.pirp.harvard.edu/pubs_pdf/ kalba/kalba-p08-1.pdf [Accessed 14 September 2018]1444 When the Commission asked Frontier to provide a page reference to the Kalba article where it shows that there is a positive and linear relationship between country’s GDP per capita levels and ‘mobile penetration’, Frontier referenced Figure 4-2, which showed the relationship between the two variables for emerging markets only. It did not and could not reference what they had claimed Kalba stated in their November 2017 report, which is that there is a positive relationship between GDP per capita and ‘mobile penetration’ in general and not only for a subset of emerging markets. Furthermore, Kalba argues repeatedly that the relationship between countries’ GDP per capita and mobile adoption is no longer clear cut. For example, he states “the relationship between income and adoption is increasingly residual” and “the declining role of GDP per capita in mobile adoption is difficult to deny” in the same section of the report as Figure 4-2. Kalba, K. 2008. “The Global adoption and Diffusion of Mobile Phones”, [Internet]. Available at: http://pirp.harvard. edu/pubs_pdf/kalba/kalba-p08-1.pdf [Accessed 18. 09.2018], pp.21-221445 Kalba, K (2008) “The Global adoption and Diffusion of Mobile Phones”, [Online]. Available at: http://pirp.harvard.edu/pubs_pdf/kalba/ kalba-p08-1.pdf [Accessed 18. 09.2018], p.231446 Kalba, K (2008) “The Global adoption and Diffusion of Mobile Phones”. [Online]. Available at: http://pirp.harvard.edu/pubs_pdf/kalba/ kalba-p08-1.pdf [Accessed 18. 09.2018], pp.21-221447 Frontier’s additional submission, 8 October 2018, p.2 (Confirmed as non-confidential on 18 April 2019)1448 Kalba, K (2008) “The Global adoption and Diffusion of Mobile Phones”. [Online]. Available at: http://pirp.harvard.edu/pubs_pdf/kalba/ kalba-p08-1.pdf [Accessed 18. 09.2018], p.211449 Manuel Castells, Mireia Fernández-Ardèvol, Jack Linchuan Qiu, and Araba Sey, Mobile Communication and Society: A Global Perspective (Cambridge, Mass.: The MIT Press, 2007), 10; H. Gruber and F. Verhoven, The Evolution of Markets Under Entry and Standards Regulation: the Case of Global Mobile Telecommunication? International Journal of Industrial Organization, 2001, p.371450 Manuel Castells, Mireia Fernández-Ardèvol, Jack Linchuan Qiu, and Araba Sey, Mobile Communication and Society: A Global Perspective (Cambridge, Mass.: The MIT Press, 2007), 35
1001. When the Commission asked Frontier to provide the other studies which show that income is an important driver of demand for mobile services, Frontier referenced Footnote 9 in the Kalba article1447. The articles are referenced by Kalba in order to illustrate that some authors continue to mistakenly assume there is a relationship between GDP per capita and mobile penetration. In particular, he notes: “The above heterogeneous pattern notwithstanding, the literature continues to treat income per capita as the lead indicator of a country’s mobile phone penetration level. However, the relationship between income and adoption is increasingly residual; that is, it applies to increasingly lower bands of the income scale. As noted above, the relationship is becoming more tenuous at the high-income level.1448” Frontier referred the Commission to these articles without adding the proviso that they were contradicted in the Kalba report.
1002. Again, the two referenced studies – namely that of Castells et al (2007) and Gruber and Verhoven (2001), explain mobile-phone penetration rather than mobile data prices.1449 Furthermore, in the case of Castells et al (2007), the authors indicated that although initially a country’s GDP affects its ability to adopt wireless technology, poorer countries may in fact be more enthusiastic adopters of mobile technology. This will especially be the case where these countries have poor fixed line infrastructure.1450 The same is expressed in the article by Gruber and Verhoven (2001) who found that although countries with high GDPs per capita tend to be more advanced in adopting mobile phones, the effect diminishes

257
over time given that prices of technology tend to decline.1451 Therefore, even amongst these articles, the relationship between GDP per capita and mobile penetration is not clear cut.
1003. When the Inquiry asked Frontier to clarify the relationship between data prices and GDP per capita, Frontier offered two other ways in which GDP per capita may impact on data prices besides via higher demand.1452 Firstly, it indicated that higher income countries may benefit from greater scale economies. This will presumably have the effect of lowering costs and therefore prices as well. Secondly, it indicated that higher income countries are likely to have higher labour costs, which would then push up unit costs and hence prices. On this basis, it is “not possible to predict how prices are likely to vary across different countries on the basis of one factor”.1453 In other words, Frontier itself has indicated that it cannot explain the mechanism through which income per capita affects data prices and cannot provide an answer as to which direction the relationship between these two variables go This is in contradiction to the view it expressed in its original submission to the Inquiry in November 2017 (as described in paragraph 999 above).
Contradictions in the direction of the relationship between data prices and GDP per capita
1004. In its initial report for the Data Inquiry, Frontier appears to contradict itself a number of times with regards to the relationship between GDP per capita and data prices. This illustrates confusion on the part of Frontier as to the direction of the relationship of these two variables. Its confusion is partly owing to Frontier conflating data affordability and data prices, as discussed above. Nonetheless, Frontier also presents contradictory evidence regarding the direction of the relationship using the same source of data (ITU price data).
1005. In its original report, Frontier indicated that there is a positive relationship between income per capita and data prices.1454 The higher the income
1451 H. Gruber and F. Verhoven, The Evolution of Markets Under Entry and Standards Regulation: the Case of Global Mobile Telecommunication? International Journal of Industrial Organization, 2001, p. 371452 Frontier Economics’ submission dated 8 October 2018, p.1 (Confirmed as non-confidential on 18 April 2019)1453 Frontier Economics’ submission dated 8 October 2018, p.1 (Confirmed as non-confidential on 18 April 2019)1454 Frontier Economics report in Vodacom’s submission (non-confidential version) dated 30 November 2017, p.151455 Frontier Economics report in Vodacom’s submission (non-confidential version) dated 30 November 2017, p.151456 Frontier report in Vodacom’s submission (non-confidential version) dated 30 November 2017, p. 271457 Frontier Economics report in Vodacom’s submission (non-confidential version) dated 30 November 2017, p. 251458 Frontier Economics report in Vodacom’s submission (non-confidential version) dated 30 November 2017, p. 43-441459 Frontier Economics report in Vodacom’s submission (non-confidential version) dated 30 November 2017, p. 271460 Frontier Economics’ submission dated 14 September 2018, pp.4-5, Figure 1 (Confirmed as non-confidential on 18 April 2019)
per capita of a country, the higher is the demand and the higher will be the prices of data.1455
Conflating data affordability and prices
1006. Because it conflates data prices and affordability, Frontier contradicts the notion that there is a positive relationship between data prices and GDP per capita on two occasions.
1007. Frontier first contradicts the notion of a positive relationship between income per capita and data prices in relation to its comparison of data prices as a percentage of income per capita among African countries as measured by the GSMA affordability indices. In particular, it indicated that the results of the GSMA affordability index comparison reflects the fact that South Africa is at “a more advanced stage of development than many other African countries”.1456 However, its comparison with other African countries showed (incorrectly) that South Africa “is consistently ranked amongst the cheapest in Africa”1457 This suggests that Frontier believes there is a negative relationship between data prices and countries’ level of development.
1008. Based on the GSMA price index, Frontier shows data prices as a percentage of GNI per capita are negatively correlated with GNI per capita.1458 Frontier incorrectly interpreted this to mean that: “…a country with higher average per capita income tends to have cheaper mobile data prices (measured as a percentage of GNI per capita), all else the same”1459 therefore contradicting the notion that there is a positive relationship between data prices and income per capita. In a later response to the Inquiry’s request for further information, Frontier further illustrated that the relationship between data “price scores” (data prices as a percentage of GDP per capita) and income per capita is statistically significant.1460
1009. However, the relationship between data affordability (price divided by GNI per capita) and GNI is negative by design and potentially spurious. Of course there will be a negative

258
relationship between the y-axis in which data prices are divided by GDP per capita and the x-axis which is GDP per capita.1461 Unfortunately, the Inquiry team cannot confirm this definitively since the underlying data upon which the GSMA affordability indices are based are not publicly available.
Contradictory relationship direction based on ITU price data in 2016
1010. Frontier presented scatter plots of prices and GDP per capita for an international sample of countries based on 2016 ITU price data which first supported and then in a later submission contradicted the notion that data prices are positively correlated with income per capita.
1010.1. Frontier plotted the prices of a 500MB prepaid handset basket and a 1GB mobile broadband computer-based basket against income per capita. The plot showed that GNI per capita and prices of a 500MB basket and 1GB basket are slightly positively correlated.1462 Based on the Frontier report, the relationship between prices and GNP per capita is statistically significant for both baskets.1463 Therefore, the higher the income per capita of a country, the higher are data prices. This supports Frontier’s claims that countries’ income and data prices are positively correlated.1464 However, as pointed out in a footnote, the relationship between “ITU’s unadjusted headline prices in USD and average income is weaker than what we observe for the GSMA pricing data”.1465
1010.2. In a recent response to a request for further information from the Commission, Frontier showed the opposite with updated GDP per capita and ITU data as of 31 August 20181466. Contrary to its previous submission, there are weak negative
1461 Frontier recognises that this may be the reason for the high degree of correlation between these two indicators although it does not attribute the direction of the relationship to this reason. Source: Frontier Economics report in Vodacom’s submission (non-confidential version) dated 30 November 2017, p. 42, Footnote 621462 Frontier Economics report in Vodacom’s submission (non-confidential version) dated 30 November 2017, p. 451463 Frontier Economics report in Vodacom’s submission (non-confidential version) dated 30 November 2017, p. 44, Footnote 631464 Frontier Economics report in Vodacom’s submission (non-confidential version) dated 30 November 2017, p. 151465 Frontier Economics report in Vodacom’s submission (non-confidential version) dated 30 November 2017, p.44, Footnote 631466 Frontier Economics’ submission dated 14 September 2018, Figures 8-9 on p.9 of Annex with updated CC Inquiry report charts (Confirmed as non-confidential on 18 April 2019)1467 Frontier Economics’ submission dated 14 September 2018, Figure 1 on pp.4-5 (Confirmed as non-confidential on 18 April 2019)1468 Note that there is a mistake on p.5 of Frontier’s submission on 14 September 2018 (Confirmed as non-confidential on 18 April 2019). The coefficient on the “ITU_log of 500MB (PPP)” variable ought to be negative and not positive as shown.1469 Frontier was not able to provide more clarity on what exactly changed between the two ITU datasets (for example, which countries were added).
correlations between GDP per capita and data prices. Furthermore, only the correlation between the 1GB data price and GDP per capita is statistically significant.1467 The lack of statistical significance between the 500MB data price and GDP per capita suggests that income per capita cannot explain the variation in the data price of a 500MB basket. Furthermore, the magnitude of the relationship between data prices and income per capita is small. A one percent increase in GDP per capita results in a 0.04% decrease in the price of a 500MB basket and a one percent increase in GDP per capita leads to a 0.14% decrease in the price of a 1GB basket1468.
1011. In other words, Frontier showed In other words, Frontier showed both a positive and a negative relationship using the same sources, namely data prices from the ITU and income per capita from the World Bank for 2016. The only difference was that the data was extracted nearly a year apart and GNI per capita was replaced with GDP per capita data from the World Bank.1469 This illustrates that the direction of the relationship between GDP per capita and data prices is not clear at all based on the ITU data presented. The strong statistical relationship between affordability and GDP per capita is found by design and is thus potentially spurious
1012. Even if the direction of the relationship between underlying data prices and GDP per capita is indeed negative, it is unlikely that the relationship between them is as large as suggested by the regression results and scatter plots using the GSMA affordability data. This is again because affordability is calculated by dividing data prices by income per capita and so will be highly negatively correlated with income per capita by design and potentially spurious.

259
1013. As already mentioned, it is not possible to show that the magnitude of the relationship using the GSMA data is overinflated since the underlying data is not publicly available and the data has been presented in normalised form so that all values lie between 0 and 100. However, what the Inquiry can do is to show what happens to the magnitude of the relationship between GDP per capita and ITU data prices when data prices are divided by GDP per capita.
1014. The table below shows the statistical relationship between (headline) data prices
from ITU and GDP per capita when headline prices are used (first column) and compares it with the relationship when ITU prices are expressed as a percentage of GDP per capita and so in essence captures affordability (as per GSMA data that Frontier has used in its analysis). The figures below the table are a visual representation of how closely the predicted line fits the data when headline prices are used (left) compared with when headline prices are expressed as a percentage of GDP per capita (right).
1015. Table 30 shows that whereas previously there was only a statistically significant negative relationship between data prices for the 1GB basket and GDP per capita, there are statistically significant negative relationships between the prices of both the 500MB and 1GB data baskets as a percentage of GDP per capita, and GDP per capita. Furthermore, the coefficients are larger which implies a larger negative relationship between affordability of the two baskets and GDP per capita. In both cases, a 1% increase in GDP per capita is
associated with just over a 1% decrease in affordability of both data baskets. Therefore, dividing data prices by GDP per capita improves the significance and magnitude of the statistical relationship with GDP per capita.
1016. The figures plotting affordability against GDP per capita above show that the data points are less dispersed around the fitted line when prices are divided by GDP per capita with respect to both data baskets. The figures also provide a visual representation of the stronger
Table 30: Regression coefficients of ITU prices and prices/GDP per capita on log GDP per capita (2016)
Sources: ITU data from Frontier (Confirmed as non-confidential on 18 April 2019), received on 14 September 2018Notes: t-values in parenthesis; *** p-value<0.01, ** 0.01<p-value<0.05, * 0.05<p-value<0.1; the 500MB ITU basket is a prepaid handset basket whereas the 1GB ITU data basket is mobile broadband basket for computer-based access.
ITU Prices ITU Prices/GDP per capita500 MB basket -0.0405 (-0.81) -1.04*** (-20.88)
1 GB basket -0.140*** (-3.53) -1.14*** (-28.79)
Figure 59: Comparison of the relationship between ITU 500MB basket prices and GDP per capita when headline prices are used (left) and when prices are expressed as a % of GDP per capita (2016)
Sources: ITU data from Frontier (Confirmed as non-confidential on 18 April 2019), received on 14 September 2018Notes: The 500MB ITU basket is a prepaid handset basket whereas the 1GB ITU data basket is mobile broadband basket for computer-based access.

260
negative relationship between affordability and GDP per capita compared with prices and GDP per capita. Inferring from the results of this analysis, it is likely that the GSMA affordability indices may exhibit such strong statistically significant negative relationships by design and the underlying headline prices may not show the same. Thus the assertion by Frontier of a strong relationship between affordability and GDP per capita is misleading.
There are serious methodological problems with the method used to compare South Africa to a broad sample of countries
1017. In order to compare data prices and affordability indices in South Africa to an international sample of countries, Frontier used a simple regression of prices/affordability indices on GDP per capita using an ordinary least squares estimation method. It then estimated predicted values for each country’s prices or affordability based on the assumption that one, that there is a linear relationship between prices/affordability and GDP per capita, and two, that only differences in GDP per capita explain the variation in data prices across countries. Frontier then compares South Africa’s prices to the predicted prices generated by the model to assess whether it is higher or lower than ‘expected’.
1018. The Commission has a number of concerns with Frontier’s particular approach to comparing data prices in South Africa with data prices internationally.
1470 Frontier report in Vodacom’s submission (non-confidential version) dated 30 November 2017, p. 311471 Vodacom’s presentation at the public hearings held on 17-19 October 2018. See Day 2 Transcript, p.36
1019. Firstly, the approach taken by Frontier to compare South Africa’s prices to a wider international sample of countries is used to show that: “South Africa performs broadly in line with the sample average on headline prices, when taking into account differences in income levels across countries”.1470 The implication is that as long as data prices in South Africa are broadly in line with the sample average or lower, they are not a cause for concern. The Inquiry does not agree that data prices in South Africa ought only to be ‘average’ as opposed to one of the better countries, or at least compared to an average or predicted price in order to understand whether there could be a concern. The CEO of Vodacom Mr Shameel Joosub conceded this in the Data Inquiry hearings when asked whether we should be comparing ourselves to an average or the best particularly in relation to Africa: “That said, I think it’s fair to say we should be comparing ourselves towards the best? I don’t think we should be comparing ourselves to just the best in Africa, but we should be comparing ourselves to the best in the world”1471 (emphasis added).
1020. Secondly, as has already been explained in detail above, Frontier has been unable to convincingly establish: (a) that they are basing their analysis on an established theoretical relationship between GDP per capita and data prices, (b) through what mechanism GDP affects data prices, (c) whether there is a statistically significant and noteworthy empirical relationship between GDP per capita
Figure 60: Comparison of the relationship between ITU 1GB basket prices and GDP per capita when headline prices are used (left) and when prices are expressed as a % of GDP per capita (2016)
Sources: ITU data from Frontier (Confirmed as non-confidential on 18 April 2019), received on 14 September 2018Notes: The 500MB ITU basket is a prepaid handset basket whereas the 1GB ITU data basket is mobile broadband basket for computer-based access.

261
and data prices, and (d) whether the direction of the empirical relationship is based on statistical analysis. On this basis, Frontier has not been able to justify its reliance on the relationship between prices and GDP per capita to obtain predicted prices.
1021. Finally, the regression results suffer from bias caused by missing explanatory variables that are correlated with GDP per capita. A low level of urbanisation for example has the potential to raise the costs associated with widespread data coverage. Countries that are less urbanised tend to also be less economically developed. Therefore, some of the variation in prices attributed to GDP per capita in the simple regression may partly have been caused by urbanisation. The entire effect would thus have been incorrectly attributed to GDP per capita whereas urbanisation and other relevant variables may be the actual cause for at least some of the variation in prices/affordability indices. The problem with using one variable to explain the variation in countries’ data prices was confirmed by Frontier itself when answering the Commission’s questions about the discrepancies in the data it presented. In particular, it noted the following: “...there are a wide range of supply-side and demand-side factors affecting the price of mobile services”1472 “It is therefore not possible to predict how prices are likely to vary across different countries on the basis of one factor, such as economies of scale, in isolation.”1473 “We believe it is consistent with our view that the different factors correlated with high income (such as economies of scale, and higher demand for mobile services) may have opposing effects on price levels.”1474 “In comparing prices across countries it is important to control, as much as possible, for factors which can influence the demand and supply of mobile services. For example, an increase in a factor (such as average income) which has a positive relationship with the demand for mobile services could be expected, all else the same, to lead to higher equilibrium prices for mobile services in a given country.
1472 Frontier Economics’ submission dated 8 October 2018, p.1 (Confirmed as non-confidential on 18 April 2019)1473 Frontier Economics’ submission dated 8 October 2018, p.1 (Confirmed as non-confidential on 18 April 2019)1474 Frontier Economics’ submission dated 8 October 2018, p.2 (Confirmed as non-confidential on 18 April 2019)1475 Frontier Economics’ submission dated 8 October 2018, p.2 (Confirmed as non-confidential on 18 April 2019)1476 Vodacom’s submission (non-confidential version) dated 15 October 2018, p.501477 Vodacom’s submission (non-confidential version) dated 15 October 2018, pp.17-18
However, as set out in Q1, this is only likely to be one of many factors which influences mobile data prices.” 1475
1022. In its written submission for the Data Inquiry hearings, Vodacom used a multi regression analysis on GSMA data as opposed to the simple regression analysis it had previously done using just GDP per capita as an explanatory variable. Based on this analysis, it found that “the actual price index score in South Africa for mobile data services is above the expected price score. This means that the prices (emphasis added) in South Africa for mobile data are below expected levels given the characteristics of the country”.1476 Notwithstanding the erroneous reference to “prices” rather than affordability approximated by the price index score, the Commission again has further concerns about Frontier’s methodology.
1022.1. Frontier offered no explanation for its choice of explanatory variables. Affordability of each of the three data baskets were regressed on GDP per capita, population density, access to electricity, school expectancy, the unemployment rate, and year. It did not include the quality and cost factors readily available in the GSMA MCI Index that it had previously referred extensively to. Vodacom had earlier in its submission specifically indicated that the lack of digital spectrum has increased costs and prices in South Africa1477. This information is contained on a cross-country basis in the GSMA MCI dataset yet was not included in Frontier’s multi regression analysis. Other cross-country information in the GSMA MCI database also available to Vodacom which could have affected prices include international internet bandwidth, the number of servers per 1 million people, the number of IXPs per 10 million people, 2G 3G and 4G coverage, download and upload speeds, and mobile latencies.
1022.2. Vodacom showed statistically significant negative correlations between population density, GDP
262
per capita, access to electricity, and number of school years expected given enrolment rates and the prices divided by GDP per capita as measured by the GSMA affordability indices. On this basis, the more dense the population, the better is its access to electricity, the higher its GDP per capita1478, and the better its school expectancy, the lower are prices.1479 However, given that the GSMA affordability index is essentially data prices divided by GDP per capita, this result is likely to be driven at least in part by the positive relationship between GDP per capita and these four variables. For example, higher GDP per capita countries tend to have higher population densities, electricity access and school expectancy. As a result, those countries are also likely to have a negative relationship with prices divided by GDP per capita. Having access to the same analysis using the ITU price data would have helped clarify if there is indeed a statistical relationship between data prices and these explanatory variables. Unfortunately, Vodacom only presented the results using the GSMA data in this instance.
1023. Vodacom presented the above analysis for 2014-2017 in order to show actual affordability relative to predicted affordability over time. The following can be gleaned from the trends in data affordability.1480
1023.1. The affordability of the entry basket in South Africa did not improve as much as it was predicted to improve between 2014 and 2016. It improved more than it was predicted to improve between 2016 and 2017.
1023.2. The affordability of the medium basket in South Africa did not improve as much as expected over the entire 2014-2017 period.
1023.3. The affordability of the high basket did not improve as much as it was predicted to improve between 2014 and 2015. It improved at roughly the same rate that
1478 This confirms the direction of the statistical relationship found between GDP per capita and data prices as a percentage of GDP per capita in Frontier Economics report in Vodacom’s submission (non-confidential version) dated November 2017. See paragraph 960. 1479 Vodacom’s submission (non-confidential version) dated 15 October 2018, pp.47-481480 Vodacom’s submission (non-confidential version) dated 15 October 2018, Figure 33-35, pp.49-501481 Esselaar, S., Gillward, A., and Stork, C. October 2017, “Analysis instead of summation: Why indices are not enough for ICT policy and regulation”, in SSRN Electronic Journal, p.18
it was predicted to improve between 2015 and 2016. Finally, South Africa’s 1 GB data price improved more than it was predicted to improve between 2016 and 2017.
1024. Besides the methodological problems discussed above, changes in affordability may be driven by changes in income per capita – and other economic events that affect countries’ GDP per capita1481 - rather than changes in data prices. Therefore, one ought to be careful about using GSMA affordability indices to show how the change in data prices in South Africa compares with changes in data prices in other countries around the world.
Conclusion on international comparisons
1025. There is a lack of a theoretical basis for a relationship between data prices and GDP per capita. Because there are a number of ways in which GDP per capita may affect data prices, the expected direction of the relationship is also unclear. The data presented by Frontier reflects the lack of clarity about the relationship; there are many contradictions about the direction of the relationship throughout the report. Furthermore, based on price data from the ITU, this relationship is not large. Therefore, comparing South Africa’s actual prices to the predicted price based on a linear statistical relationship between data prices and GDP per capita is inappropriate.
1026. Furthermore, as conceded by the CEO of Vodacom himself, prices in South Africa ought to be compared with the best in the world as opposed to an average. Frontier’s findings that South Africa performs relatively well cannot be relied on and there is thus certainly no basis to claim that there is no concern with data prices in South Africa (especially prepaid data prices).

263
1027. This appendix provides background information on the importance of spectrum and the various approaches to its assignment. In addition, it provides a snapshot of the current spectrum assignment in South Africa amongst the mobile and fixed ECNS licensees.
14.1. What is spectrum and why is it important?
1028. Radio waves are a form of electromagnetic radiation which, like visible light or infrared, make up one portion of the entire spectrum. Depending on their frequency, radio waves can pass through solid objects and travel long distances. As such, radio waves are useful for mobile communications, broadcasting and many other wireless applications.1482 Radio frequency spectrum “includes the range of electromagnetic waves called radio waves which are generated by transmitters and received by antennas or aerials”.1483
1029. Radio frequency spectrum “is used for a wide range of purposes ranging from keeping people safe (military and police), in touch through mobile phones, on course through GPS devices, entertained through radio, television broadcasting, online through Wi-Fi and mobile broadband among others”.1484 The majority of the spectrum is allocated to government and industrial uses such as satellite communications, maritime communication and navigation, military and national security systems, aviation systems and air traffic control, weather radar and radio astronomy.1485 Spectrum is however a scarce resource in that
1482 GSMA (2011) Spectrum Handbook – Understanding the Basics of Spectrum Policy for Mobile Telecommunications, p. 41483 BBC (2006) The Spectrum and Its Uses – A simple guide to the radio spectrum, p. 41484 GSMA (2011) Spectrum Handbook – Understanding the Basics of Spectrum Policy for Mobile Telecommunications, p. 61485 GSMA (2011) Spectrum Handbook – Understanding the Basics of Spectrum Policy for Mobile Telecommunications, p. 71486 GSMA (2011) Spectrum Handbook – Understanding the Basics of Spectrum Policy for Mobile Telecommunications, p. 51487 GSMA (2011) Spectrum Handbook – Understanding the Basics of Spectrum Policy for Mobile Telecommunications, p. 51488 GSMA (2011) Spectrum Handbook – Understanding the Basics of Spectrum Policy for Mobile Telecommunications, p. 5-61489 BBC (2006) The Spectrum and Its Uses – A simple guide to the radio spectrum, p. 41490 Electromagnetic spectrum is the term used by scientists to describe the entire range of light that exists (earthsky.org). The electromagnetic spectrum covers electromagnetic waves that ranges in frequencies from below one hertz to above 1025 hertz (Wikipedia)1491 The GSMA spectrum primer series – Introducing radio spectrum, p. 131492 1 GHz means one billion waves per second. 300 GHz is 300,000,000 KHz.1493 BBC (2006) The Spectrum and Its Uses – A simple guide to the radio spectrum, p. 51494 BBC (2006) The Spectrum and Its Uses – A simple guide to the radio spectrum, p. 5
there are a limited number of frequency bands, and ever increasing demand for their use, and thus the proper management of it, like any scarce resource, is critical.
1030. Devices that are used for communication purposes that make use of digital radio transmissions are designed to operate in the same manner, “a transmitter generates a signal that contains encoded voice, video or data at a specific radio frequency, which is radiated by an antenna or aerial into the environment”.1486 The signal is broadcast into the environment and “a small proportion is captured by the antenna of the receiving device which decodes the signal”.1487 For instance, when making a mobile call, the voice of the caller is firstly converted by the handset into digital data which is then transmitted to the network operator’s nearest tower or base station via radio, “which is further transmitted to another base station serving the recipient’s location, and then transmitted further to the recipient’s phone, which converts the signal back into audio through earpiece”.1488
1031. Radio frequency spectrum1489 forms a small part of the entire electromagnetic spectrum1490, and covers the range from 10 kHz1491 to 300 GHz1492. Bandwidth “is the range of frequencies that a signal occupies in the spectrum”1493. In general, more bandwidth is required to transmit more information. For instance, “an FM radio station might broadcast on the 92.9 MHz frequency, but requires 0.3 MHz bandwidth (300 KHz) which is the spectrum between the 92.8 and 93 MHz frequencies (inclusive).1494”
14. APPENDIX F: SPECTRUM
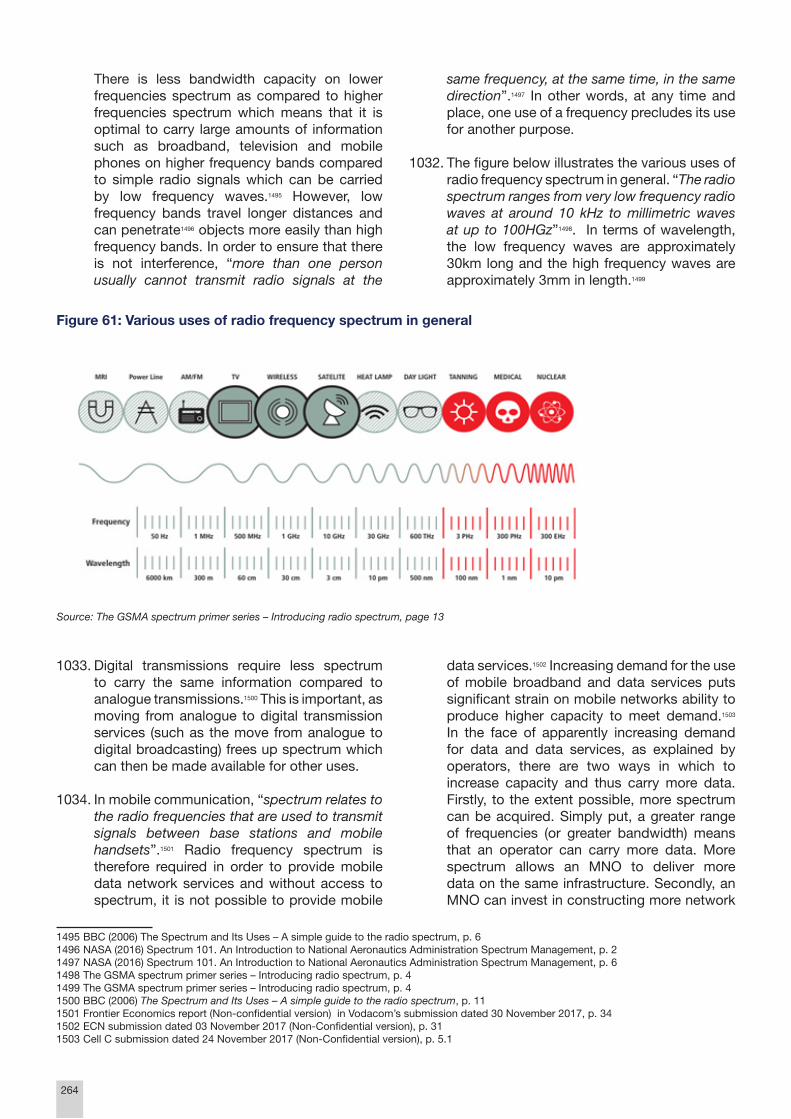
264
There is less bandwidth capacity on lower frequencies spectrum as compared to higher frequencies spectrum which means that it is optimal to carry large amounts of information such as broadband, television and mobile phones on higher frequency bands compared to simple radio signals which can be carried by low frequency waves.1495 However, low frequency bands travel longer distances and can penetrate1496 objects more easily than high frequency bands. In order to ensure that there is not interference, “more than one person usually cannot transmit radio signals at the
1495 BBC (2006) The Spectrum and Its Uses – A simple guide to the radio spectrum, p. 61496 NASA (2016) Spectrum 101. An Introduction to National Aeronautics Administration Spectrum Management, p. 21497 NASA (2016) Spectrum 101. An Introduction to National Aeronautics Administration Spectrum Management, p. 61498 The GSMA spectrum primer series – Introducing radio spectrum, p. 41499 The GSMA spectrum primer series – Introducing radio spectrum, p. 41500 BBC (2006) The Spectrum and Its Uses – A simple guide to the radio spectrum, p. 111501 Frontier Economics report (Non-confidential version) in Vodacom’s submission dated 30 November 2017, p. 341502 ECN submission dated 03 November 2017 (Non-Confidential version), p. 311503 Cell C submission dated 24 November 2017 (Non-Confidential version), p. 5.1
same frequency, at the same time, in the same direction”.1497 In other words, at any time and place, one use of a frequency precludes its use for another purpose.
1032. The figure below illustrates the various uses of radio frequency spectrum in general. “The radio spectrum ranges from very low frequency radio waves at around 10 kHz to millimetric waves at up to 100HGz”1498. In terms of wavelength, the low frequency waves are approximately 30km long and the high frequency waves are approximately 3mm in length.1499
1033. Digital transmissions require less spectrum to carry the same information compared to analogue transmissions.1500 This is important, as moving from analogue to digital transmission services (such as the move from analogue to digital broadcasting) frees up spectrum which can then be made available for other uses.
1034. In mobile communication, “spectrum relates to the radio frequencies that are used to transmit signals between base stations and mobile handsets”.1501 Radio frequency spectrum is therefore required in order to provide mobile data network services and without access to spectrum, it is not possible to provide mobile
data services.1502 Increasing demand for the use of mobile broadband and data services puts significant strain on mobile networks ability to produce higher capacity to meet demand.1503 In the face of apparently increasing demand for data and data services, as explained by operators, there are two ways in which to increase capacity and thus carry more data. Firstly, to the extent possible, more spectrum can be acquired. Simply put, a greater range of frequencies (or greater bandwidth) means that an operator can carry more data. More spectrum allows an MNO to deliver more data on the same infrastructure. Secondly, an MNO can invest in constructing more network
Figure 61: Various uses of radio frequency spectrum in general
Source: The GSMA spectrum primer series – Introducing radio spectrum, page 13

265
infrastructure.1504 Simply put, the more masts/towers an MNO has, the more capacity it has to deliver data, and thereby investing in new tower infrastructure would increase capacity, as would investment in backhaul and other network infrastructure where there may be bottle necks. Unless otherwise indicated, in this report, any reference to ‘spectrum’ can be understood to refer to the spectrum used, or potentially used, for mobile communication.
1035. In telecommunications, “mobile networks
provide two-way communications for users, with the transmission from mobile devices to base stations within a cellular network (referred to as the uplink), and transmission from the base station to devices (referred to as the downlink)”1505. Base stations “are the tower sites that host the radio antennae that transmit voice and data traffic”.1506 The provision of two-way wireless voice services was the main reason mobile networks were originally designed, however mobile networks are now also providing data services given the exponential growth in the use of mobile devices. This has led to the introduction of 2G, 3G and 4G/LTE systems over time.1507
1036. 2G systems allowed some data to be transmitted via cellular networks, and they were initially introduced in order to allow customers to use short messaging services (SMS) “before a wider range of mobile data services became possible”.1508 2G networks however struggled to handle the quantum of data traffic that had to be carried by mobile networks and “so third generation or 3G systems were developed to provide high bit-rate services needed for the transmission of high-quality images and video, as well as higher speed internet browsing over cellular networks”.1509 Work began on LTE around 2010 “as the basis for fourth-generation (4G) mobile systems”1510 due to the significant increase in data traffic over the period 2000 to 2011 and the need for greater capacity.1511
1504 Cell C submission dated 24 November 2017 (Non-Confidential version), para. 5.21505 Cell C submission dated 24 November 2017 (Non-Confidential version), Annexure B, p. 201506 Cell C submission dated 24 November 2017 (Non-Confidential version), Annexure B, p. 201507 Cell C submission dated 24 November 2017 (Non-Confidential version), Annexure B, p. 20-211508 Cell C submission dated 24 November 2017 (Non-Confidential version), Annexure B, p. 211509 Cell C submission dated 24 November 2017 (Non-Confidential version), Annexure B, p. 211510 Cell C submission dated 24 November 2017 (Non-Confidential version), Annexure B, p. 211511 Cell C submission dated 24 November 2017 (Non-Confidential version), Annexure B, p. 211512 Telkom submission dated 17 November 2017 (Non-Confidential version), p. 31, para.1311513 Telkom submission dated 17 November 2017 (Non-Confidential version), p. 31, para.1311514 Cell C submission dated 24 November 2017 (Non-Confidential version), Annexure B, p. 241515 Telkom submission dated 17 November 2017 (Non-Confidential version), p. 31-32 1516 Jorn Kruse (2012) Competition in Mobile Communications and the Allocation of Scarce Resources: The Case of UMTS. Economic Advisory Group Telecommunications, DG Competition.1517 National Integrated ICT Policy White Paper
1037. MNOs are not able to offer complete services if they do not have access to adequate spectrum to do so. Telkom states that it cost “[] more in capex to provide coverage in the 2,000 km2 urban area using 1800 MHz spectrum rather than sub-1GHZ frequency spectrum.”1512 Telkom further submits that “similar estimates have been made for the UK market by Ofcom, the UK telecoms regulator”1513. Having frequency only at the high range or low range of the available spectrum is thus not optimal. In this regard, Cell C submits that both low- and high-frequency spectrum is important in order to “provide national coverage in the most efficient and least costly manner and to ensure that high-speed broadband services are available to all South African citizens”.1514 Telkom submits that mobile or other wireless networks require access to spectrum in order to be operational and that “the assignment of spectrum is a key factor that affects a mobile operator’s costs, coverage, quality and ultimately, competitiveness”.1515 Kruse (2002) states that “the amount of available spectrum also influences significantly the production costs of a cellular operator”1516. It is clear that access to different spectrum bands has an impact on the services offered by MNOs as well as the costs of those services offered. The impact of spectrum assignment on costs means that competition in the mobile telecommunication market is directly affected by spectrum frequency assignment and the regulation thereof.
1038. As explained above, spectrum is a finite resource and there is a greater demand for some spectrum bands than others given the different characteristics of high- and low-frequency bands. These bands are commonly referred to as ‘high demand’ spectrum bands. According to the ICT Integrated White Paper, high demand spectrum “refers to spectrum where (1) demand for access to the radio spectrum resource exceeds supply, or (2) radio spectrum is fully assigned”.1517 The
266
determination of the level of demand for certain spectrum bands can be undertaken by understanding the growth projections of the market. For instance, in the mobile broadband market, the level of demand for certain bands of spectrum can be determined by predicting/ forecasting the increase in demand for devices that support new technology.1518 In South Africa, high-demand spectrum is understood to refer to the lower (e.g. 700 MHz, 800 MHz) and higher (e.g. 2.6 GHz) frequency ranges. Some of these frequency bands have yet to be assigned (bands within the 700 MHz, 800 MHz and 2.6 GHz ranges) and these are referred to as “unassigned high-demand spectrum”.
1039. The importance of high demand spectrum is highlighted by Vodacom who submits that “low-frequency spectrum transmissions can travel greater distance before losing their integrity, and can pass through dense objects more easily. Higher frequency spectrum, on the other hand, has poorer propagation properties but can carry more data and therefore reduce the cost of expanding capacity”.1519 Cell C argues that “an operator should be licensed to use frequency in both the low and high bands within its network”.1520
1040. Thus the assignment of the currently unassigned high-demand spectrum can potentially have a substantial impact on the unit-costs and quality of an operator’s network and therefore the competitiveness of the operator. Therefore the assignment of currently unassigned spectrum has the potential to result in both pro-competitive and anti-competitive effects.
1041. Spectrum also has an impact on access to data and data prices. A4AI submits that spectrum is an important resource sustaining the operations of the mobile industry and submits that there is extensive literature regarding the relationship between spectrum allocation and broadband access.1521 A4AI also submits that the research by GSMA and NERA shows that consumers pay lower prices for
1518 National Integrated ICT Policy White Paper1519 Frontier Economics report (Non-Confidential version) in Vodacom’s submission dated 30 November 2017, p. 33 -341520 Cell C submission dated 24 November 2017 (Non-Confidential version), Annexure B “Technical1521 A4AI submission dated 01 November 2017, p. 31522 A4AI submission dated 01 November 2017, p. 31523 A4AI submission dated 01 November 2017, p. 31524 MTN submission dated 27 November 2017 (Non-Confidential version), p. 511525 Plum Consulting on behalf of GMSA (2011) The benefits of releasing spectrum for mobile broadband in Sub-Sharan Africa.1526 Report for the GSM Association (2013) The Socio-economic Impact of Allocating Spectrum for Mobile Broadband Services in China.1527 Myers, G (2013) The innovative use of spectrum floors in the UK 4G auction to promote mobile competition. Centre for analysis and regulation. Discussion paper No.74. p. 2.1528 Hazlett, T & Munoz, R (2009) A Welfare Analysis of Spectrum Allocation Policies. RAND Journal of Economics 40: 424-454 (426 & 427).
data in countries where the costs of acquiring spectrum is lower.1522 A4AI further submits that the high cost of spectrum auctions can increase MNOs operational costs.1523
1042. Spectrum also contributes to the GDP of the country. In this regard, MTN states that “the ongoing delay in the allocation of additional spectrum, both the high demand spectrum and digital divide spectrum has significant implications for data pricing, availability of data, National Treasury and broader economic development”.1524 MTN refers to research by Plum Consulting on behalf of GSMA in 2011 that estimated that releasing additional spectrum early in South Africa would increase GDP by R78 billion, increase subscribers by 7.6 million, create an additional 1 million jobs and increase tax revenue by R16 billion per annum by 2020. The same study also estimated that a 5-year delay in releasing this spectrum from 2014 to 2019 could result in the reduction of R355 billion in GDP and R70 billion in tax revenue.1525 The impact of spectrum on GDP is also highlighted by the Report for the GSM Association (2013) which states that “spectrum has a prominent contribution to economic growth, albeit with difference varying from one industry to another”.1526
1043. Spectrum is thus a critically important issue, it has an impact, or at least a potential impact, on the costs of providing data services, the price of data and the GDP of the county.
14.2. Approaches to spectrum assignment and considerations
1044. Radio frequency spectrum, the range of frequencies over which radio communication is possible,1527 represents a finite and valuable national resource with the potential to decrease the costs of operators and improve competition in the data services market.1528 The importance of spectrum has been highlighted in recent years due to the growth in mobile broadband demand and the subsequent apparent

267
spectrum scarcity in certain frequency bands and geographical locations.1529 The importance of spectrum is also clear from the submissions received by the Inquiry (discussed above in more detail) and the experience of ICASA’s earlier attempt to auction licences for the unassigned spectrum, which faced litigation. Following the President’s recent call to “initiate the process for the allocation of high-demand radio spectrum to enable licensing”1530, and ICASA and the DTPS having entered into a settlement agreement concerning their prior impasse over the licensing process for the assignment of spectrum,1531 the process of assigning unassigned high-demand spectrum began with the release of the draft Policy Direction1532 which sets out, in a draft form, the necessary direction on how the spectrum should be assigned and how much spectrum the WOAN would require to be sustainable.
1045. There are two stages involved in managing spectrum and authorising its use, namely the allocation stage and the assignment stage. In brief, spectrum allocation determines what blocks of frequencies are used for what specific purpose (e.g. military, maritime or mobile telecommunications uses) and under what operational and technical rules.1533 This stage involves broad decisions on spectrum use at the global and regional ITU radio communication conferences, where national spectrum regulators prepare their own allocations and restrictions on spectrum use. The assignment stage, comes after spectrum allocation, where the rights to use particular sections of spectrum are authorised with the issuance of license to a particular user or users.1534 In the context of the Inquiry and given the value of unassigned high-demand spectrum1535 the potential impact of assigning such spectrum, as well as the submissions received regarding spectrum, it is
1529 European Commission (2009) Radio Spectrum Policy Group report on Assignment and Pricing methods- Conclusions (RSPG09-298).1530 ICASA (2018) DTPS Minister Dr.Siyabonga Cwele and the Council of ICASA agree to settle the Spectrum Court Challenge (26 September 2018). [Online]. Available at: https://www.icasa.org.za/news/2018/dtps-minister-dr-siyabonga-cwele-and-the-council-of-icasa-agree-to- settle-the-spectrum-court-challenge [Accessed on 20 January 2019]1531 ICASA (2018) DTPS Minister Dr.Siyabonga Cwele and the Council of ICASA agree to settle the Spectrum Court Challenge (26 September 2018). [Online]. Available at: https://www.icasa.org.za/news/2018/dtps-minister-dr-siyabonga-cwele-and-the-council-of-icasa-agree-to- settle-the-spectrum-court-challenge [Accessed on 20 January 2019]1532 Proposed policy and policy directions to the authority on licensing of unassigned high demand spectrum. Government Gazette, No. 41935. 27 September 20181533 Spectrum National Academies of Sciences, Engineering, and Medicine. 2015. A Strategy for Active Remote Sensing Amid Increased Demand for Radio Spectrum. Washington, DC: The National Academies Press.1534 ICT Regulation Toolkit. Radio Spectrum Management, Section 5. [Online]. Available at: http://www.ictregulationtoolkit.org/toolkit/5.1.5 [Accessed on 4 November 2018]1535 High-demand spectrum refers to spectrum where demand for access to the radio spectrum resource exceeds supply (National Integrated ICT Policy White paper, 2016). In South Africa, unassigned high demand spectrum refers to the low-range, network coverage spectrum (700Mhz and 800Mhz) and high range, network capacity spectrum (2.6Ghz) that has not been assigned.1536 ITU (2016) Assignment and use of radio spectrum- Policy Guidelines and Economic Aspects (Infrastructure), p.101537 ITU (2016) Assignment and use of radio spectrum- Policy Guidelines and Economic Aspects (Infrastructure), p.521538 McHenry, G (2014) WSRD Workshop IV MIT- The Economics of Spectrum Sharing Considerations, Slide 4
important that the Inquiry consider the various approaches to spectrum assignment and the regulation of its use within an economy more broadly.
1046. In this section, we consider these issues in more detail. Firstly, we consider the objectives of spectrum assignment, the impact of policy and how this may inform the approach to assignment and management of spectrum. Secondly, we consider the methods by which spectrum is assigned (such as auctions) and how the chosen method may be influenced by the objectives. Thirdly, we consider the approach to the management and use of spectrum assignments (i.e. once spectrum has been assigned).
14.2.1. Objectives shape the approach to spectrum assignment
1047. The overall approach to spectrum assignment is driven by a country’s objectives. In particular, the choice of approach to spectrum assignment is typically driven by policy considerations and the policy context more broadly,1536 and therefore countries employ a range of spectrum assignment approaches. No single approach is likely to be appropriate for every country given the variation in policy objectives and constraints faced, and the real world differences in the state of telecommunications sectors. The broader policy objectives naturally influence the specific objectives for spectrum assignment and how best to promote those objectives using the tools available (or the best combination thereof).1537 Spectrum assignment decisions should naturally maximise the likelihood of achieving policymakers’ goals1538. As the ITU notes, “any effort to plan future use and economic valuation of the radio spectrum must start by formulating the national economic

268
and social development targets that are to be achieved by spectrum assignments”1539.
1048. Thus when defining the approach to spectrum assignment and the ultimate use of spectrum, countries would naturally be guided by their economic and social development objectives.1540 In most cases, “the primary goal of spectrum policy and spectrum auctions should be economic efficiency- that is, putting the spectrum to its best use” (emphasis added)1541. As the ITU notes, economic efficiency in the distribution of spectrum is achieved when the spectrum is used to generate the maximum net benefits to society.1542 In adopting an approach for assigning spectrum, it appears that governments can set out to achieve any one (or a combination) of a number of objectives such as promoting competition or more competitive outcomes, supporting social welfare, access or coverage goals, or generating government revenue. We discuss the three broad categories of objectives below.
1049. Firstly, spectrum assignment can be used to promote or influence competition in telecommunication markets and therefore the pricing of services. Spectrum is a critical resource that can impact firms’ ability to enter and compete in markets, and different approaches may have different results for competition. The various considerations related to the competition aspects of spectrum assignment are further described below.
1049.1. The availability (quantity) of spectrum, the price paid to acquire spectrum as well as the kind of spectrum, are key factors in the competitive success of a mobile operator.1543 Competition in telecommunications markets can generally be supported when sufficient spectrum is assigned to a number of operators.1544 The assignment of an adequate amount of spectrum can therefore affect the level of competition and efficiencies for operators and the mobile sector as a whole. The amount of spectrum, its price and the number of
1539 ITU (2016) Assignment and use of radio spectrum- Policy Guidelines and Economic Aspects (Infrastructure), p.471540 ITU (2016) Assignment and use of radio spectrum- Policy Guidelines and Economic Aspects (Infrastructure), p.461541 Crampton, P, Kwerel, E., Rosston, G., & Skrzypacz, A (2011) Using Spectrum Auctions to Enhance Competition in Wireless Services, SIEPR Discussion Paper No. 10-015, S167.1542 ITU (2012) Economic aspects of spectrum management. SM Series, Spectrum Management, p. 161543 Kruse, J (2002) Competition in Mobile Communications and the Allocation of Scarce Resources: the Case of UMTS, p. 21544 GSMA (2016) Best practices in mobile spectrum licensing, p. 111545 Vodacom submission dated 7 August 2018, para. 8.71546 Ofcom (2017) Award of the 2.3 and 3.4 GHz spectrum bands- Competition Issues and Auction Regulations, p. 351547 Ofcom (2017) Award of the 2.3 and 3.4 GHz spectrum bands- Competition Issues and Auction Regulations, p. 39
firms required for effective competition must therefore be key considerations in spectrum assignment.
1049.2. Asymmetry in firms’ spectrum assignments can also inhibit or promote competition between firms. The licencing of spectrum is often conducted in an environment where there is an asymmetry between market incumbents and entrants – in contrast to entrants, the incumbent(s) might have advantages such as more spectrum, network infrastructure and an existing customer base. In Vodacom’s submission to the Data Inquiry, []1545. While the possibility that asymmetric spectrum allocations could have competitive and social welfare benefits is recognised in industry research, the concern regarding spectrum distribution is the extent to which asymmetry in spectrum could lower the intensity of competition. Ofcom, the UK communications regulator, views a highly asymmetric spectrum holding by any single operator, as a potential threat to competition.1546 In this respect, Ofcom defines spectrum safeguards. The safeguard caps for spectrum holdings generally involve an MNO with more than about 40% of spectrum in the future and (or) an MNO with below 10-15% of spectrum, or both.1547 The upper limit suggests that too much spectrum with a single operator can confer increased market power, while the lower limit suggests that if an MNO’s spectrum holding is too low relative to its rivals it cannot compete effectively or foster competition in the market. In addition to the quantity of spectrum holdings, the type of spectrum or spectrum quality can also affect firms’ competitive ability. In Telkom’s submission to the Data Inquiry public hearings, it notes that later entrants should be assigned the lower-frequency sub-1Ghz spectrum to

269
ensure all operators compete equally in the development of new networks. 1548
1049.3. In wireless communication services, where high barriers to entry are common, national regulatory authorities aim to encourage entry by new market players or expansion of smaller players via the spectrum assignment process.1549,The approach to spectrum assignment has the potential to foster new market entry and, in the case of spectrum auctions, to encourage participation in the assignment process. For example, using a sealed bid auction format instead of an open, ascending bid format increases the ability of an entrant to outbid an incumbent as it limits some of the advantages that stronger bidders have over weaker bidders in open auctions.1550
1049.3.1. The manner in which spectrum is licenced can be managed by regulatory tools in a way that facilitates the achievement of certain objectives and desired outcomes such as new entry or market expansion. In this regard, the World Bank has made a submission to the Data Inquiry on its research covering the instruments available to create favourable assignment outcomes including encouraging market entry and preventing the aggregation of spectrum rights by incumbents.1551 These instruments include spectrum set-asides, spectrum caps and band plans. When set-asides are used within an auction format, their aim is to remove the incumbent from the bidding process in order to guarantee that a new entrant gets the set-aside spectrum, as a block of spectrum is reserved for a certain type of bidder, like a smaller operator, a new player, minorities or SMMEs. This auction instrument has been used in Canada and the US where it proved effective in improving auction participation.1552
1548 Telkom’s submission dated 13 September 2018 (non-confidential), p. 241549 Madden, G., Bohlin, E., Tran,T, & Morey, A (2013) Spectrum Licensing, Policy Instruments and Market Entry. Review of Industrial Organization, Vol. 44 (3): 277-298.1550 A-Focus AB & DotEcon Ltd (2004) The use of auctions in spectrum assignment, p. 141551 World Bank (2018) Competition and regulatory issues in the allocation and assignment of spectrum in South Africa. Draft for discussion.1552 World Bank (2018) Competition and regulatory issues in the allocation and assignment of spectrum in South Africa. Draft for discussion.1553 Myers, G. (2013) The innovative use of spectrum floors in the UK 4G auction to promote mobile competition. Centre for analysis and regulation. Discussion paper No.741554 DTPS (2016) National Integrated ICT Policy White Paper- 28 September 2016, p. 71
1049.3.2. In terms of facilitating entry into the assignment process, spectrum caps could restrict the amount of the spectrum that a firm is permitted to acquire or the total post-assignment holdings allowed.1553 Caps used in spectrum auctions could apply to an individual spectrum band or to a category of radio frequencies. Another regulatory tool for licencing spectrum is the idea of band plans which slice radio spectrum into blocks and divide these blocks by geographical areas.
1049.3.3. In using spectrum assignment to promote competition, governments and regulators often consider the particular market structure of the industry and which market structure changes could best serve government objectives. The entry barriers, pricing and high market shares within telecommunications markets often leads to the existence of a number of strong, vertically integrated operators and biased competition dynamics, as discussed in Appendix B. Given these competition concerns, which are prevalent in telecommunication markets, governments have also considered a different policy approach of “open access” in spectrum assignment to promote competition. This policy approach has been proposed in South Africa, where the ICT Policy White Paper is concerned with competition and how spectrum policy and the approach to spectrum can influence competition outcomes. Within the ICT Policy White Paper “open access” is referred to as “…a scenario where wholesale access is provided to electronic communications network infrastructure or services on terms that are reasonable, effective, transparent and non-discriminatory”.1554
1049.3.4. As part of an open access regime, countries could implement different network structures, such as a single wholesale network (SWN) or a WOAN

270
to potentially facilitate more coverage and more service-based competition. In South Africa, the government has proposed the creation of the WOAN as the method of implementation to achieve the open access objectives outlined in the ICT Policy White Paper and the Electronic Communications Act. These open access models differ from the usual circumstance where spectrum is granted to vertically integrated operators on an exclusive basis, as they instead provide network services on a wholesale basis in line with certain open access principles, such as transparency, non-discrimination and the shift of focus towards service-based competition.1555
1050. Secondly, spectrum assignment can support social welfare and access or coverage goals. Access to radio frequency spectrum is regulated by regulatory authorities that determine the use of certain spectrum bands and provide certain rights to licensed and unlicensed users. These regulatory authorities make decisions in the public interest with the aim of enhancing societal benefit and general welfare. Authorities often aim to improve rural connectivity and access by including coverage obligations in the spectrum assignment approach.1556 Increasing consumer demand for services in the mobile environment means that more spectrum needs to be available in the future. Spectrum assignment in the short term, therefore, holds implications for competitive dynamics in the long term, with authorities increasingly considering how the evolution of next-generation technologies (such a 5G) would influence the outcomes from spectrum assignment 1557
1051. Thirdly, when assigning spectrum licences, the process chosen can also be used to generate revenues for government and has been identified as an additional objective when awarding spectrum.1558 There are, however, costs to using spectrum assignment as a way to raise revenue for the fiscus. Maximising government revenue via auctions, for example,
1555 DTPS (2016) National Integrated ICT Policy White Paper- 28 September 2016, p. 401556 GSMA (2016) Best practices in mobile spectrum licensing, p. 111557 Ancans, G., Bobrovs, V., Ancans, A, & Kalibatiene, D. (2016) Spectrum Considerations for 5G Mobile Communication Systems. Procedia Computer Science 104: p. 509-5161558 GSMA (2016) Best practices in mobile spectrum licensing, p. 111559 GSMA (2016) Best practices in mobile spectrum licensing, p. 121560 GSMA (2016) Best practices in mobile spectrum licensing, p. 1131561 DTPS (2016) National Integrated ICT Policy White Paper- 28 September 2016, p. 82
may conflict with the goal of creating a competitive market for wireless services and could diminish post-auction competition and efficiency.1559
1052. What is clear from the discussion of the three categories of objectives above is that the approach to spectrum assignment may be designed to address a variety of objectives. In some cases objectives and the approach chosen may be interdependent – for example the use of an open access approach to spectrum is said to achieve both coverage and competition objectives. In other cases, the objectives and approaches maybe less aligned. For example, maximising fiscal revenues through an auction may not have the greatest positive impact on competition. The chosen approach should depend both on the objective as well as the particular market structure and context.1560 In South Africa, the ICT White Paper outlines one of the main objectives for spectrum assignment as ensuring the efficient use of spectrum in order to maximise the economic, cultural and social benefits for South Africans.1561 Ultimately the objectives and approach should also inform the particular method chosen to assign spectrum, which we turn to below.
14.2.2. Spectrum assignment methods
1053. The most common spectrum assignment methods fall within three main categories: command and control models (or administration-based models), market-orientated models, and common-use models. These categories and the various assignment methods within these categories are discussed, as well as the advantages and concerns involved in each and a reference to country experience where applicable.
Command and control spectrum assignment methods
1054. In its most traditional form, the command and control method of spectrum assignment means that administrations are responsible for both the international frequency allocations

271
and the decisions regarding the precise use of the spectrum bands and the users allowed to use the bands in a country.1562 These models are not market-based and involve granting usage licences within a primary market, which is organised on the basis of administrative arrangements. The most common command and control spectrum assignment methods include the first-come-first-served method, lotteries and “beauty contests” (also known as comparative processes), discussed further below.
1055. First-come-first-served (FCFS) is a traditional and simple method used during early development when spectrum had not yet become a scarce resource.1563 Blocks of spectrum may be assigned to eligible seekers on the first-come-first served basis, where eligibility criteria may be set, and no further requests are accommodated once the available spectrum is exhausted.1564 Some members of the European Union have in the past used the FCFS basis of spectrum assignment for mobile radio licences.1565 With the FCFS method, spectrum assignment in mobile communications often allowed the incumbent monopolies to receive the available spectrum. The FCFS method is generally time-efficient in terms of the speed of procedures involved, but it can lead to speculation1566 (where the spectrum is not used for a productive purpose) and a lack of revenue generation, and the technical competence of the firm that is awarded the spectrum cannot always be determined through the assignment process.1567
1056. Using a lottery method, the spectrum is assigned to licensees who are selected at random from among all competing spectrum applicants.1568 Lotteries are non-discriminatory and transparent and incur low transaction costs. This method is considered a quick and
1562 Selek, Y.K (2008) From Command and Control Methods to Flexible Spectrum Management: comparing Turkey with other markets. Master’s dissertation thesis. [Online]. Available at: https://www.btk.gov.tr/uploads/thesis/from-command-and-control-methods-to- flexible-spectrum-management-comparing-turkey-with-other-markets.pdf [Accessed on 4 November 2018]1563 Kruse, J (2002) Competition in Mobile Communications and the Allocation of Scarce Resources: The Case of UMTS, p. 81564 Devi, A.J, Lalith, T & Nawaz, G.M.K (2011) Methods for spectrum assignment, pricing and access in Dual Technologies. IJCAES, Vol 1 (1), p. 491565 Jilani, S. A (2015) Spectrum Allocation Methods: Studying Allocation through Auctions. Journal of Economics, Business and Management, 3(7): p. 7431566 Speculation in this context refers to bidders who have no or only a low use value of the spectrum and buy it only to later resell to bidders with a higher use value. See Cramton, P. & Ockenfels, A. (2017) The German 4G Spectrum Auction: Design and Behaviour. The Economic Journal, 127, p. 3171567 Jilani, S. A. (2015) Spectrum Allocation Methods: Studying Allocation through Auctions. Journal of Economics, Business and Management, 3(7): p. 742-7451568 Devi, A.J, Lalith, T & Nawaz, G.M.K. (2011) Methods for spectrum assignment, pricing and access in Dual Technologies. IJCAES, Vol 1 (1), p. 491569 Kruse, J. (2002) Competition in Mobile Communications and the Allocation of Scarce Resources: The Case of UMTS, p. 91570 ITU (2012) Economic aspects of spectrum management. SM Series, Spectrum Management, p. 201571 Valetti, T. & Prat, A (2000) Spectrum Auctions Versus the beauty Contests: Costs and Benefits, p. 161572 Global System for Mobile Communications- GSM is a standard developed by the European Telecommunications Standards Institute to describe the protocols for second-generation digital cellular networks used by mobile devices such as tablets.
economical method of assigning spectrum, but also comes with serious drawbacks. Lotteries fail to assign spectrum to those who value it the most (except by chance) and they can result in significant transaction costs. Lotteries suffer from the same concerns as the FCFS method in that they generate no revenues, except if fees are attached to the assigned licences, and can also lead to speculation. Lotteries are the least efficient assignment method for spectrum as there is no way to ensure that the awarded firm has the technical competence to use the license in a beneficial way. In the USA, lotteries have been used in a number of smaller digital markets which allowed the regulatory agency to issue licences quickly and reliably, avoiding legal fights and expenses.1569
1057. The third variation of command and control methods of spectrum assignment is the beauty contest or comparative process. This process generally involves the formal comparison of the qualifications of each of the competing spectrum applicants based on established criteria.1570 These criteria typically include more general aspects such as financial resources, reliability and investment in research, as well as specific requirements relating to population coverage, quality of service, speed of implementation, pricing, technology and competitiveness.1571
1058. In a beauty contest, the spectrum management authority is able to determine the best suited applicant to use the spectrum and then award the licence. Beauty contests have been used in Europe to award GSM licences 1572as well as 3G mobile licences. This assignment method can allow for the inclusion of multiple policy and societal objectives, as well as being more suited to markets with a low expected number of competitors for the spectrum. These comparative processes can, however,
272
be resource-intensive, time consuming and also fail to generate any revenues. Additionally, beauty contests are often heavily contested due to the decision process being subjective and opaque.1573
Market-orientated spectrum assignment methods
1059. Market-based approaches to spectrum assignment have become the most widely implemented methods in use today, which can be applied at the primary stage of issuing spectrum licences, via auctions, and at the secondary level through spectrum trading (discussed below). The market-oriented assignment method covered in this section is the use of an auction, where attracting market entry and preventing collusion are central factors in designing an auction.1574 In the context of spectrum assignment, an auction represents a contest for a spectrum licence, which is awarded via price bidding among competing spectrum applicants.
1060. Auctions are popular as they allow the market, and not policymakers, to determine the optimal assignment of spectrum, while guaranteeing that the applicants (the operators) are charged a market-related price for the valuable resource.1575 This section briefly discusses the main categories of auctions and country examples where applicable, the variations of types of auctions, the non-price elements of auction design as well as the general benefits and drawbacks of auctions.
1061. The two main categories of auctions are the
ascending auction (also called the English auction or Multiple Round auction) and the sealed-bid or Vickery auction.1576 In the ascending model, the price of the product rises progressively as competitors bid and the final price the winner pays is determined when there are no more bids offered. The Dutch auction is a reverse of the ascending auction, as it is a
1573 European Commission (2009) Radio Spectrum Policy Group report on Assignment and Pricing methods- Conclusions (RSPG09-298), p. 111574 Klemperer. P (2002) How (Not) to Run Auctions: the European 3G Telecom Auctions. [Online]. Available at: http://www.nuffield.ox.ac.uk/ Economics/papers/2002/w5/runauction.pdf [Accessed on 17 January 2019]1575 Robb, G (2017) Spectrum policy for competition and development: a comparative study of approaches and outcomes in Africa (3rd Annual Competition & Economic Regulation ACER Conference), p. 31576 Robb, G (2017) Spectrum policy for competition and development: a comparative study of approaches and outcomes in Africa (3rd Annual Competition & Economic Regulation ACER Conference), p. 31577 ITU (2016) Assignment and use of radio spectrum- Policy guidelines and Economic aspects, p. 10-121578 ITU (2016) Assignment and use of radio spectrum- Policy guidelines and Economic aspects, p. 111579 Robb, G (2017) Spectrum policy for competition and development: a comparative study of approaches and outcomes in Africa (3rd Annual Competition & Economic Regulation ACER Conference), p. 41580 ACMA (2018) The ACMA’s auction capability. [Online]. Available at: https://www.acma.gov.au/Industry/Spectrum/Radiocomms-licensing/ Spectrum-licences/the-acmas-auction-capability [Accessed on 14 January 2019]1581 Bichler, M., Gretschko, V. & Janssen, M. (2017) Bargaining in Spectrum Auctions: A Review of the German Auction in 2015, p. 11582 Bichler, M., Gretschko, V. & Janssen, M. (2017) Bargaining in Spectrum Auctions: A Review of the German Auction in 2015, p. 1
descending auction starting from a high price. Ascending auctions have the main advantage of a transparent process and the spectrum gets awarded to the competitor who values it the most. This approach can, however, favour the larger operators with more money, facilitate collusion and also discourage entrants from participating in the bid. 1577
1062. The second category is the sealed-bid auction, which involves bidders tendering simultaneous sealed bids in a single round and the winner pays the price corresponding to the highest offer (sealed-bid first price auction) or the price of the second-highest bid (sealed-bid second price auction).1578 The benefit of this method is that it prevents collusion on bidder preferences and encourages more auction participants, which could result in a final price that is lower than in an ascending auction. Some auction structures combine a mixture or variant of these categories, such as the Anglo-Dutch auction which combines the ascending and sealed-bid auctions.1579
1063. These auction categories and their many variations have resulted in multiple round auction formats for the assignment of spectrum being structured as either a Simultaneous Multi-Round Auction (SMRA) or a Combinatorial Clock Auction (CCA). The SMRA format allows bidders to bid on multiple individual lots at the same time, where an individual lot is a specific frequency band in a specific geographic area.1580 The auction process in a SMRA involves multiple spectrum lots being auctioned, with participants bidding on each lot until there is only one bidder left where the highest bidder on each lot wins the spectrum. A benefit to the SMRA is auction simplicity and transparency as bidders learn the minimum bid price for a license in a new auction round.1581 This auction style was used in the 2015 German auction of 700MHz, 900MHz and 1800MHz spectrum bands.1582 The SMRA does, however, come with potential drawbacks,

273
including bidders behaving collusively or bidders ending up with non-contiguous blocks of spectrum. Additionally, the winning bidder could end up paying a price for the winning bid that exceeds its intrinsic value (known as the winner’s curse), although this would be seen as a successful outcome if the objective of the auction was revenue generation.1583
1064. As one of the multiple round auction formats, the CCA is a price clock-based auction for spectrum assignment which was developed to address some of the SMRA shortcomings, as participants are allowed to bid for combinations of lots with one bid rather than individual lots.1584 The auction proceeds with a “clock” process where, in each bidding round, the value of a lot of spectrum is increased and bidders indicate if they would pay the price displayed in that round.1585 A CCA then involves an assignment phase where the winning bidders pay the second highest price of the winning bid, called the Second Price Rule, to ensure they pay no more than the minimum price needed to win the spectrum.1586 In a CCA, only if a bidder wins the bid do they get the blocks of spectrum they want, and they are not left with standalone spectrum that does not meet its valuation as part of the whole. The CCA therefore incentivises bidders to bid the full value for the spectrum. It is the auction format most likely to result in spectrum being assigned to those who value it most, as well as ensuring that the winners pay a competitive price.
1065. An example of using the CCA format is the 4G spectrum auctions in the UK, which were designed as a CCA with spectrum floors to facilitate new market entry, as well as spectrum caps to avoid highly asymmetric post-auction distribution of spectrum.1587 Ofcom, the UK regulator, decided to impose spectrum floors and caps to deal with the UK’s competition
1583 RIA (2013) Debating Spectrum- Spectrum Auctions for Beginners. Available at: https://researchictafrica.net/2013/12/03/spectrum- auctions-for-beginners/ [Accessed on 14 January 2019]1584 ACMA (2012) Combinatorial clock auction. [Online]. Available at: https://www.acma.gov.au/theACMA/combinatorial-clock-auctions- reallocation-acma [Accessed on 14 January 2019]1585 RIA (2013) Debating Spectrum- Spectrum Auctions for Beginners. [Online]. Available at: https://researchictafrica.net/2013/12/03/ spectrum-auctions-for-beginners/ [Accessed on 14 January 2019]1586 Bichler, M., Gretschko, V. & Janssen, M. (2017) Bargaining in Spectrum Auctions: A Review of the German Auction in 2015, p. 271587 Myers, G. 2013. The innovative use of spectrum floors in the UK 4G auction to promote mobile competition. Centre for analysis and regulation. Discussion paper No.74, p. 31588 Myers, G. 2013. The innovative use of spectrum floors in the UK 4G auction to promote mobile competition. Centre for analysis and regulation. Discussion paper No.74, p. 41589 Myers, G. 2013. The innovative use of spectrum floors in the UK 4G auction to promote mobile competition. Centre for analysis and regulation. Discussion paper No.74, p. 41590 European Commission. 2009. Radio Spectrum Policy Group report on Assignment and Pricing methods- Conclusions (RSPG09-298), p. 81591 European Commission (2009) Radio Spectrum Policy Group report on Assignment and Pricing methods- Conclusions (RSPG09-298), p. 91592 Hazlett, T., Munoz, R & Avanzini, D (2012) What really matters in Spectrum Allocation Design. Northwestern Journal of Technology and Intellectual Property, Volume 10 (3), p. 93-1241593 World Bank (2018) Competition and regulatory issues in the allocation and assignment of spectrum in South Africa. Draft for discussion, p. 39
concerns. In this case, the spectrum floor referred to the flexible reservation of portfolios of spectrum for either a new entrant or the smallest national mobile operator at the time.1588 Spectrum floors are considered more flexible than set-asides as the different portfolios of spectrum (the “floors”) can be reserved for different bidders and the choice of reserved spectrum does not involve regulatory judgement (as with set-asides), but instead makes use of market information from bidder valuations1589.
1066. Although the price bid is the ultimate selection criterion, non-price aspects or preferences can be incorporated into the auction design by setting minimum or admission criteria for the spectrum applicants.1590 The admission criteria for auctions often involve key aspects related to the applicants, such as their capability and reliability, and the authorisation or coverage obligations and technology requirements.1591 In addition to the admission criteria, designing the auction can be a complex task due to regulators trying to achieve multiple goals through a spectrum auction. For example, in Demsetz auctions bidding is allowed in the form of price schedules (rather than payments), where the aim is to prevent ex post monopolistic behaviour by awarding a licence to the firm that bids the lowest user fee or rate at which the firm would sell services to consumers. 1592
1067. An auction’s design can include bidder credits to remedy competitive issues, such as entry barriers, where a class of bidders gets subsidized by being offered a discount on the winning bid. In the US, more than 42% of all cellular licenses from 1997 to 2014 were bought using small bidder credits to promote economic opportunity and competition.1593 The main advantages of spectrum auctions in general include

274
the generation of public value in the form of auction revenue, the optimisation of spectrum and efficient assignment, the promotion of a more competitive telecommunications market, market transparency, and a relatively fast assignment procedure.1594
1068. While auctions have the potential to bring efficiency to the market in the right circumstances, they can also come with certain drawbacks which should be considered in the auction design. The main area of concern in auctions is their potential impact on competition, particularly where there exists limited or no competition in the market.1595 These concerns relate both to the auction process itself and auction outcomes. During the auction process, participants could behave anti-competitively by reaching price-fixing arrangements or tacitly colluding through the use of bids to signal their preferences for the division of available lots of spectrum.1596 High auction reserve prices could limit a competitive auction process by limiting participation. Additionally, the literature on spectrum auctions stresses the incumbent’s incentives to outbid its rivals (whether new entrants or smaller players) in the auction process.1597 These incentives are a direct by-product of operators’ dominant market positions and arise from the incumbent aiming to preserve its rents earned and protect its rents against increased competition by rival operators. The incentive to outbid its rivals also stems from the incumbent’s superior ability to monetize spectrum on its larger mobile customer base and leverage scale and scope economies.1598
1069. Another potential concern of auction outcomes is an inflated spectrum price that could limit the licensee’s ability to invest in further networks and coverage. Moreover, an auction could result in the incumbent, who has more financial resources than smaller players, obtaining the most valuable spectrum bands which increases their dominance and further
1594 ITU (2016) Assignment and use of radio spectrum- Policy guidelines and Economic aspects, p. 111595 ITU (2016) Assignment and use of radio spectrum- Policy guidelines and Economic aspects, p. 141596 European Commission (2009) Radio Spectrum Policy Group report on Assignment and Pricing methods- Conclusions (RSPG09-298), p. 101597 Philippe,J. & Moldovanu, B (2003) An economic perspective on auctions. Economic Policy, Volume 18 (36), p. 268-3081598 Sevy, D & Duquesne, G (2018) Possible competition effects of the Swiss 5G spectrum auction under its proposed design, p. 21599 Ellipsis (2018) Econex Comments on select aspects of the EC Amendment Bill (for Telkom). [Online]. Available at: https://www.ellipsis. co.za/wp-content/uploads/2018/03/ECONEX-ECA_Bill_2017.pdf [Accessed on 18 January 2019]1600 ICASA issued the ITA for high-demand spectrum in the 700MHz, 800MH and 2.6GHz bands, with four lots of spectrum being made available, namely lot B, C, D and E. Available at: https://techcentral.co.za/wp-content/uploads/2016/07/40145_15-7_Icasa.pdf (Government Gazette No. 40145. Notice 438. 15 July 2016).1601 Cell C submission dated 24 November 2017, (Non-confidential) para 5.31602 Dippon, C.M (2009) Regulatory Policy Goals and Spectrum Auction Design- Lessons from the Canadian AWS Auction (NERA consulting), p. 211603 Dippon, C.M (2009) Regulatory Policy Goals and Spectrum Auction Design- Lessons from the Canadian AWS Auction (NERA consulting), p. 21
entrenches existing market concentration.1599 In 2016 the DTPS and spectrum licensees, including Cell C, objected to ICASA’s ITA to the auction of high demand spectrum in South Africa. The DTPS argued that ICASA should not have proceeded with the spectrum auction until a policy directive was issued, while Cell C had opposed the auction due to the high reserve price of R3bn for each lot of spectrum.1600 Cell C had also explained that the spectrum lots were not equally valuable, as some lots had certain advantages over others, and the auction approach would entrench dominant players’ market power as they could outbid smaller operators to secure the most valuable spectrum.1601
1070. An example of how spectrum auction design can result in unintended negative outcomes is the 2008 Advanced Wireless Services (AWS) auction, where Industry Canada (the regulatory body responsible for spectrum auctions) had the aim of promoting market entry to increase competition. In order to realise this, Industry Canada classified a subset of bidders as entrants who received preferential treatment in the auction through spectrum set-asides (exclusively for entrants) and mandatory roaming and tower sharing.1602 In this case, however, not all possible outcomes or side effects of its preferential treatment had been considered and the AWS auction revealed that preferential treatment comes with risks of market distortion, particularly when applied to competitive environments. The regulator found that incumbents had an incentive to pay a premium for spectrum to prevent entry, thus essentially exploiting spectrum as an entry barrier. 1603
1071. In licensing spectrum, the process chosen has the potential to influence competition in the market for data, both negatively and positively. Competition issues, particularly in relation to the market power of incumbents, could arise when spectrum is licenced using command

275
and control methods, although it is more prevalent with market-based processes where dominant players are better able to acquire spectrum due to their superior resources and capabilities.1604 Assignment approaches to spectrum are, however, also able to remedy competition issues if used appropriately and can therefore positively impact competition in the market for data services.
Spectrum commons approach to spectrum assignment
1072. The first two spectrum assignment categories cover methods which formally involve the assignment to, or licensing of, spectrum to individual users.1605 In contrast to the command and control method and the market-orientated models, the spectrum commons approach is based on open sharing of spectrum among users who meet some general conditions related to the authorisation of equipment used.1606 The Federal Communications Commission (FCC) in the US has applied a spectrum commons approach to its 2.4 GHz band, used by numerous unlicensed consumer and industrial devices such as microwaves and cordless phones1607. The commons approach, also called ‘licence exemption’, does not guarantee interference-free operation as licences are not assigned by the regulatory authority or the market, but generally left to users and their equipment to avoid interfering with each other.1608
1073. Notwithstanding the main advantages of the commons approach, which include entry facilitation and technological experimentation, the main limitation of this assignment method is the risk that the commons becomes overused and degraded by interference. Governments also face a loss of fiscal revenue from the commons approach. Within a review on the relevant and practical approaches to spectrum assignment, the limitations of the commons approach, and the long-standing legislative and
1604 GSMA (2016) Best practices in mobile spectrum licensing, p. 51605 Wellenius, B & Neto, I. (2007) Managing the Radio Spectrum: Framework for Reform in Developing Countries, p. 331606 European Commission. (2009) Radio Spectrum Policy Group report on Assignment and Pricing methods- Conclusions (RSPG09-298), p. 61607 Weiser, P.J & Hatfield, D.N. (2005) Policing the Spectrum Commons, p. 663. [Online]. Available at: http://ir.lawnet.fordham.edu/flr/vol74/ iss2/12 [Last viewed on 11 April 2019]1608 Wellenius, B & Neto, I. (2007) Managing the Radio Spectrum: Framework for Reform in Developing Countries, p. 331609 ICT Regulation Toolkit: [Online]. Available at: http://www.google.co.za/url?sa=t&rct=j&q=&esrc=s&source=web&cd=2&ved=2ahUKEw jzjc2M-43fAhV5QxUIHWQWB2sQFjABegQICRAC&url=http%3A%2F%2Fwww.ictregulationtoolkit.org%2Faction%2Fdocument%2F download%3Fdocument_id%3D3275&usg=AOvVaw2hTb7nS0L4-w4lrDPaesBY [Last viewed on 11 April 2019]1610 Abrahams, L., Kedama, Y., Naidu, E. & Pillay, K. (2014) Regulating radio-frequency spectrum to advance the digital economy: Issues of economic regulation for the electronic communications sector. Link centre, University of the Witwatersrand, Johannesburg, p. 261611 Ellipsis Regulatory Solutions (2016) Radio Frequency Spectrum Policy 2016. [Online]. Available at: https://www.ellipsis.co.za/wp-content/ uploads/2016/10/9.2-Radio-Frequency-Spectrum-Policy.pdf [Accessed on 7 November 2018]1612 ITU (2016) Assignment and use of radio spectrum- Policy guidelines and Economic aspects, p. 16
regulatory approach to spectrum assignment, make it unsuitable (or at least irrelevant) for the assignment of high-demand spectrum in South Africa.
14.2.3. Spectrum usage and post-assignment considerations
1074. The assignment of spectrum is not the only consideration for the regulator, as usage and rights to the assigned spectrum – that is, after spectrum is actually assigned – are also important considerations for governments and regulators. After the spectrum is assigned, whether through a command and control approach or a market-based method, it is crucial for the government and the regulator that the assigned spectrum is used in the most economically efficient and socially optimal way, along with any further considerations for the post-assignment environment.
1075. In terms of using assigned spectrum efficiently, regulators are currently interested in the introduction of spectrum trading and the development of secondary markets.1609 Spectrum trading means that users are allowed to transfer their spectrum rights obtained in the primary market (either by auction or other assignment methods) to other users via trading as the secondary mechanism.1610 The transfer of spectrum rights could entail the re-sale, leasing or sub-letting of spectrum by a licensee to a third party, whether on a stand-alone basis or as part of a business that is being purchased.1611 Spectrum trading could aid economic efficiency in the market as it provides an opportunity to potentially solve primary market issues of underutilised or undervalued spectrum assignments while increasing market awareness of spectrum value.1612
1076. Country experiences support the idea that secondary markets that allow for flexible licence use and licence reconfiguration are important aspects in spectrum trading that

276
encourage supply and demand for underused spectrum.1613 Spectrum trading is allowed in some Latin American countries (like Guatemala, Chile, Uruguay, Mexico), European countries (Denmark, Spain, United Kingdom, Finland), and North American countries (United States and Canada). 1614
1077. However, while there is a credible case for spectrum trading, it does come with certain potential disadvantages and risks. If spectrum frequencies can be resold or leased by the licensees this has the potential to undo all the objectives of the primary approach to assigning spectrum. For instance, if the concern of a simple auction was that the incumbent might win the best (or all) of the spectrum, this concern would still remain for a secondary sale or auction of spectrum by the private licensee. Thus to the extent that the policy maker is justified in regulating and controlling the scarce resource that is spectrum to start with, it is equally justified in regulating secondary trading of spectrum rights. 1615
1078. However, given that there may be some benefits in correcting any market failures from the primary assignment of spectrum or any changes in external factors which make the primary assignment no longer sufficiently efficient, it would appear that some provision for trading may be appropriate.1616 Such a provision would, however, require further regulatory provisions not necessarily covered in the initial regulatory framework. Another potential drawback of spectrum trading includes the risk that competition could be distorted by prices arising from the secondary market which are significantly different from those prices paid in the primary market.1617
1079. The secondary market mechanism could also result in speculative manoeuvres associated with the accrual of unused spectrum.1618 In some countries a “use it or lose it” rule is applied to spectrum licences to avoid these distortionary effects (such as the hoarding of spectrum rights of use). The rule generally states that
1613 ITU (2016) Assignment and use of radio spectrum- Policy guidelines and Economic aspects, p. 161614 ITU (2018) ICT-Eye database. [Online]. Available at: https://www.itu.int/net4/itu-d/icteye/CountryProfile.aspx [Accessed on 8 November 2018]1615 OECD (2005) Secondary Markets for Spectrum: Policy Issues, OECD Digital Economy Papers, No. 95, p. 371616 OECD (2016) Broadband Policies for Latin America and the Caribbean- A Digital Economy Toolkit, Chapter 3, p. 771617 Marcus, S., Net, L., Scanlan, M. & Stumpf, U. (2005) Towards more flexible Spectrum Regulation. Wik Consult Study, p. 541618 ITU (2016) Assignment and use of radio spectrum- Policy guidelines and Economic aspects, p. 161619 Ellipsis Regulatory Solutions (2016) Radio Frequency Spectrum Policy 2016. [Online]. Available at: https://www.ellipsis.co.za/wp-content/ uploads/2016/10/9.2-Radio-Frequency-Spectrum-Policy.pdf [Accessed on 7 November 2018] 1620 ECA Bill 2018. Section 31 (e)1621 ITWeb (2015) Telecoms consolidation to continue despite MTN-Telkom deal’s death. [Online]. Available at: https://www.itweb.co.za/ content/nG98Yd7L4LR7X2PD [Accessed on 18 January 2019]1622 ITU (2016) Assignment and use of radio spectrum- Policy guidelines and Economic aspects, p. 171623 ITU (2008) GSR Discussion Paper- Spectrum Sharing. [Online]. Available at: https://www.itu.int/ITU-D/treg/Events/Seminars/GSR/GSR08/ discussion_papers/Spectrum_Sharing_web.pdf [Accessed on 8 December 2018]
assigned spectrum shall not remain unused for a certain period, otherwise it must be returned to the regulator.1619 In South Africa, the proposed amendments to the ECA included the “use it or lose it” principle in that a radio frequency spectrum licensee can have its licence withdrawn by ICASA if the assigned spectrum is not used for a period of two years.1620
1080. Related to spectrum trading and its regulation is the treatment of spectrum assignments in merger transactions. Another way to ‘buy’ spectrum would be for a firm to purchase another firm that is assigned spectrum – indeed this was the view of some commentators in the recently abandoned Vodacom-Neotel and MTN-Telkom transactions, where gaining access to more spectrum was a central competition concern.1621 Consequently, to the extent that the policy makers have any concerns with spectrum that is regulated in the primary assignment of spectrum (such as measures to prevent asymmetric assignment or spectrum accrual), these concerns should be considered in the case of mergers as well. In simple terms, there is a clear concern that mergers could result in spectrum allocations that may entrench or create market power and thus result in anti-competitive effects.
1081. Current market dynamics across the globe, with spectrum demand increasing and frequency bands becoming more congested, make dynamic spectrum sharing another consideration for possibly mitigating capacity constraints and encouraging more efficient use of assigned spectrum. Broadly, spectrum sharing relates to granting more than one spectrum user the possibility to use a given frequency band, which often depends on regulatory actions to monitor and structure the simultaneous usage.1622 The techniques of sharing spectrum can be administrative, technical and market-based; and spectrum can be shared in several dimensions (time, space and geography).1623 Spectrum sharing could be uncoordinated or coordinated. Wi-Fi is an example of uncoordinated spectrum

277
sharing, where coordinated forms include TV white spaces, spatial sharing between entities, priority sharing (such a licensed shared access) and cognitive radio.1624
1082. Spectrum sharing can be viewed as a useful public policy as it makes more spectrum efficiently available for internet access, mobile communications and the future business of connecting devices and sensors to the internet.1625 Spectrum sharing is significant because it allows relatively rapid and affordable increases in communications spectrum, without the time and expense of relocating existing users or traditional assignment methods. Various models of spectrum sharing exist, of which the common ones are discussed below. These sharing models include unlicensed spectrum, a combination of spectrum from various licensed operators, the use of software-defined radio and cognitive radio systems, the use of small cells, and the use of combining networks.1626
1083. Establishing spectrum bands for common use is a frequently used model of spectrum sharing, where the use of the bands is free and regulated on technical restrictions and equipment approval to limit service interference. The combination of spectrum from various licensed operators would entail frequency bands assigned for cooperative use in restricted geographic areas. New Zealand has “licensed spectrum parks” where the park allows shared use of a band of spectrum to promote efficient assignment and innovative spectrum usage. The parks also enable smaller players to offer regional and local services without paying high prices typical in auctions. It seems that the use of small cells could also provide an option for operators to make more intensive use of their spectrum in order to meet rising data traffic.1627 The term “small cells” can refer to low-powered radio access nodes that help provide service to both indoor and outdoor areas, and can improve the range and capacity of networks in densely populated urban areas1628 that cannot be sustained by macro cells which usually cover larger rural
1624 Kim G. (16 November 2015) What is spectrum sharing, and why does it matter? [Online]. Available at: https://spectrumfutures.org/what- is-spectrum-sharing-and-why-does-it-matter/ [Last viewed on 11 April 2019].1625 Kim G. (16 November 2015) What is spectrum sharing, and why does it matter? [Online]. Available at: https://spectrumfutures.org/what- is-spectrum-sharing-and-why-does-it-matter/ [Last viewed on 11 April 2019].1626 ITU (2016) Assignment and use of radio spectrum- Policy guidelines and Economic aspects, p. 191627 Ofcom (2017) Award of the 2.3 and 3.4 GHz spectrum bands- Competition Issues and Auction Regulations, p. 51628 RCRWirelessNews (2016) Small cells: Backhaul difficulties and a 5G future. [Online]. Available at: https://www.rcrwireless.com/20160711/ network-infrastructure/small-cells-tag31-tag99 [Accessed on 5 December 2018]1629 A macrocell is a cell used in cellular networks in order to provide radio coverage and high-efficiency output to a large area of mobile network access (definition from Techopedia. [Online]. Available at: https://www.techopedia.com/definition/2950/macrocell [Accessed on 5 December 2018]1630 ITU (2016) Assignment and use of radio spectrum- Policy guidelines and Economic aspects, p. 191631 DTPS (2016) National Integrated ICT Policy White Paper- 28 September 2016, p. 77
areas.1629 Spectrum can also be shared when networks are combined. Cellular technologies and Wi-Fi that operate in different spectrum bands could be combined to host an increase in wireless traffic. Wi-Fi locations could mean less mobile internet costs for cellular networks, as well as less capital investment in mobile networks and faster internet speeds.1630
1084. In the context of rising demand for mobile services and constraints in the availability of a scarce resource like spectrum, it is clear that how spectrum is assigned and ultimately regulated in terms of usage is critical and can have far reaching effects on the industry, particularly for competition. Spectrum assignment thereby provides national authorities and regulators with an opportunity to promote competition. While we have covered a number of different approaches to spectrum assignment and the regulation of spectrum usage, what is apparent is that the approach chosen by the regulator or policy maker ultimately depends on what a country’s objectives are. Moreover, it is evident from the above section, including the approaches of other countries, that current and future competition considerations may be a key factor in policy objectives. Internationally, it is a common feature of spectrum policies or approaches to allow for new entrants or to strengthen smaller players, or to avoid the strengthening of market incumbents. Thus the use of spectrum, which is a national asset,1631 to address competition concerns (to the extent that such concerns exist) would appear to be appropriate.
14.3. Spectrum assignment in South Africa
1085. The section below explores how spectrum is managed globally, assigned in South Africa and which government institution is responsible for spectrum assignment. The section further explores spectrum assignment to different stakeholders who make use of spectrum as well as the outstanding spectrum bands which are still available to be assigned to MNOs.

278
1086. ITU is a global body (falling under the United Nations) responsible for global allocation of spectrum among other things.1632 The allocation of spectrum is done mainly through the Radio Regulations which regulate the allocation and the usage of spectrum across different countries. “The main part of the Radio Regulations lies in its Article 5, the Table of Frequency Allocations, which specifies which radio communication services may be used in which part of the spectrum. These allocations are made in order to ensure that the services allocated in any particular frequency band can be used by various countries in an equitable manner without harmful interference through regulatory procedures and associated technical criteria”.1633 Since 1979, through the ITU World Radio Conferences, the Radio Regulations have been regularly updated and revised in order to keep pace with the “rapid expansion of existing systems and new, spectrum-hungry advanced wireless technologies”.1634 The ITU World Radio Conferences are held every three to four years, the next one will be held in Egypt from the 28 of October 2019 to 22 November 2019.1635
1087. ICASA “is the official regulator of the South African communications, broadcasting and postal services sectors. ICASA develops regulations for the communications, broadcasting and postal services sectors, issues licences to telecommunications and broadcasting service providers, and monitors licensee compliance with rules and regulations. It also plans and manages the radio frequency spectrum”.1636 Therefore, currently mobile spectrum in South Africa is assigned by ICASA.
1088. ICASA sought to assign spectrum in a symmetrical way when it initially licensed spectrum to MNOs. MTN and Vodacom were licensed spectrum in 1993, Cell C was assigned spectrum in 1997 and Telkom was licensed spectrum in 2011. While Cell C was assigned spectrum after MTN and Vodacom, it states that it currently has an almost equal assignment of spectrum to other MNOs.1637 However, Cell
1632 ITU. Online [Available] https://www.itu.int/en/about/Pages/default.aspx [Accessed 24 January 2019]1633 ITU News Magazine page 13. [Online]. Available at: https://www.itu.int/en/itunews/Documents/2016-05/2016_ITUNews05-en.pdf. [Accessed 24 January 2019]1634 ITU News Magazine page 13. [Online]. Available at: https://www.itu.int/en/itunews/Documents/2016-05/2016_ITUNews05-en.pdf [Accessed 24 January 2019]1635 ITU. [Online]. Available at: https://www.itu.int/en/ITU-R/conferences/wrc/Pages/default.aspx [Accessed 24 January 2019]1636 ICASA. [Online]. Available at: https://www.icasa.org.za/pages/about-us-1 [Accessed on 09 September 2018].1637 Cell C submission dated 24 November 2017 (Non-confidential version), Annexure B, p. 221638 Cell C submission dated 24 November 2017 (Non-confidential version), Annexure B, p. 221639 Cell C submission dated 24 November 2017 (Non-confidential version), Annexure B, p. 221640 Frontier Economics report (Non-confidential version) in Vodacom’s submission dated 10 October 2017, p. 351641 Frontier Economics report (Non-confidential version) in Vodacom’s submission dated 10 October 2017, p. 31-32
C submits that important differences remain in the spectrum assignments to the MNOs. Specifically, Cell C submits that “both MTN and Cell C’s assignment in the 900MHz band are not contiguous”1638. According to Cell C, “in some cases this means that the later of the spectrum bands assigned is not situated immediately next to the existing spectrum bands assigned and the spectrum cannot be bundled together for LTE use”.1639 That is, the bundling of spectrum for the provision of standard LTE services can be done only where the spectrum assigned is contiguous.
1089. In South Africa, mobile operators currently only have access to the frequencies that were originally assigned to them for use by 2G and 3G networks (900MHz, 1800MHz and 2100MHz bands) “whilst in many other countries, operators already have access to additional spectrum which is suitable for the delivery of 4G data services-in particular, the 800MHz and 2600MHz bands, and in some cases also 700MHz.”1640 It is understood that some operators have re-farmed (re-purposed) spectrum to provide LTE on their networks such as Vodacom and MTN who have re-farmed 1800MHz spectrum in 2012 to roll out their respective LTE networks.1641
1090. As earlier stated, spectrum is also distinguished by whether it falls within the low or high frequency bands. Low frequency spectrum such as 700MHz or 800MHz has a greater range and therefore networks which are deployed using this type of spectrum are less costly to roll out because they require the construction of fewer base stations. Although lower frequency spectrum is important to be able to provide broadband services to rural areas, spectrum in these two bands is not yet available for use by MNOs in South Africa as a previous attempt by ICASA to auction the spectrum through the ITA in 2016, which was ultimately halted in the courts. An impasse between the DTPS and ICASA regarding the ITA has subsequently been resolved and DTPS has issued a draft Policy Direction on 27 September

279
2018 for ICASA to issue the ITA. According to Vodacom, South African MNOs only have access to 900MHz, 1800MHz and 2100 MHz bands while operators in many other countries have access to additional spectrum suitable for delivering 4G data services (700 MHz, 800MHz, and 2600MHz).1642 High frequency spectrum such as 2600MHz or 2.6GHz offers good speed but it is not possible to cover significant distances using this spectrum because of its physical characteristics. This spectrum is better suited to networks situated in urban areas where more base stations are necessary to ensure sufficient capacity for larger demand. From the submissions, it appears that this band is currently available to be assigned to licensees.1643
1091. Further to the aborted ITA, it must be noted that frequencies in the 700 MHz and 800 MHz ranges remain caught up in broadcasting and “will become fully available only after TV broadcasting has migrated out of them”1644. As stated earlier, digital transmissions require less spectrum to carry the same information compared to analogue transmissions.1645 This is important, as moving from analogue to digital transmission services (such as the move from analogue to digital broadcasting) frees up spectrum which can then be made available for other uses such as mobile telephony and wireless broadband. In light of this, “the 2006
1642 Frontier Economics report (Non-confidential version) in Vodacom’s submission dated 10 October 2017, p. 341643 Cell C submission dated 24 November 2017 (Non- Confidential version), Annexure B, p. 24; Frontier Economics report (Non-confidential version) in Vodacom’s submission dated 30 November 2017, p. 8; MTN submission dated 27 November 2017 (Non-Confidential version), p. 461644 Telkom submission dated 17 November 2017 (Non-Confidential version), p. 31, para. 1311645 BBC (2006) The Spectrum and Its Uses – A simple guide to the radio spectrum, p. 111646 Government Gazette, No. 958, 08 September 2008. Department of Communications: “Broadcasting Digital Migration Policy”.1647 Government Gazette, No. 958, 08 September 2008. Department of Communications: “Broadcasting Digital Migration Policy”.1648 Cell C submission dated 24 November 2017 (Non-Confidential version), Annexure B, para. 1.51649 The assignment of 2x11MHz to Vodacom within the 900MHz band means that Vodacom has two assignments of 11MHz each within the 900MHz band which may be contiguous or not. If contiguous they essentially lie next to each other for instance 900MHz-911MHz and 912MHz-922MHz.1650 Telkom submission dated 17 November 2017 (Non-Confidential version) , p. 30, Table 7
Regional Radio communication Conference resolved to switch from analogue to digital broadcasting services by 2015”.1646 Following this decision, a process known as “digital migration” was supposed to migrate South Africa’s broadcasting sector from an analogue based system to digital broadcasting, which requires less spectrum. “The radio frequency spectrum freed-up through the digital migration process, often referred to as ‘digital dividend’”1647 are the frequencies 700 MHz and 800 MHz ranges that are valuable for mobile services. However this process has yet to be completed despite a number of delays due to the costs and logistics involved.
1092. Ultimately, it appears that a range of frequency bands is optimal for MNOs, including both higher and lower frequency bands. Cell C states that “in order to provide national coverage in the most efficient and least costly manner and to ensure that high-speed broadband services are available to all of South Africa’s citizens, an operator should be licensed to use frequency in both the low and high bands within its network”1648.
1093. The table below summarises the different spectrum frequency assignments to MNOs in South Africa.
Table 31: Spectrum Assignment to major MNOs in South Africa
Source: Telkom submission to the inquiry 1650
Band Vodacom MTN Cell C Telkom Liquid
TelecomRain
850 MHz - - - - 2x4.92 MHz -
900 MHz 2x11 MHz1649 2x11 MHz 2x11 MHz - - -
1800 MHz 2x12 MHz 2x12 MHz 2x12 MHz 2x12 MHz 2x12 MHz 2x12 MHz 1x10 MHz
2100 MHz 2x15 MHz1x5 MHz
2x15 MHz1x10 MHz
2x15 MHz 2x15 MHz1x20 MHz
- -
2300 MHz - - - 1x60 MHz - -
3500 MHz - - - 2x14 MHz 2x28 MHz -

280
1094. As per the above table, there is an asymmetry in the assignment of spectrum to MNOs in South Africa, however currently the spectrum licencing scheme does not allow the spectrum licenced to be used by another unlicensed user while such spectrum is not in use.1651 Telkom states that the fact that it has been assigned no spectrum below 1 GHz curtails its ability to build an efficient network. 1652
1095. The unassigned high demand spectrum bands include the so-called network coverage spectrum (i.e. 700 MHz and 800 MHz) and the so-called network capacity spectrum (i.e. 2.6 MHz) and the DTPS has issued a draft Policy Direction to ICASA on licensing this unassigned high demand spectrum.1653 More specifically, the breakdown of the spectrum that ICASA attempted to auction in 2016 is as follows:
1095.1. 2x30MHz in the 700MHz band (703Mhz-733 Mhz/758-788Mhz);
1095.2. 2x25Mhz in the 800Mhz band (796-801Mhz/837-842MHz);
1095.3. 2x70MHz and 1 x 25 MHz in the 2.6 GHz band (2500-2570 MHz/ 2620-29690Mhz and 2595-2615MHz)1654.
1651 Abrahams, L., Kedama, Y., Naidu, E. & Pillay, K (2014) Regulating radio-frequency spectrum to advance the digital economy: Issues of economic regulation for the electronic communications sector. Link centre, University of the Witwatersrand, Johannesburg, p. 221652 Telkom submission dated 17 November 2017 (Non-Confidential version), p. 31, Table 71653 Government Gazette, No. 41935, 27 September 2018. Department of telecommunications and Postal Services: “Invitation to provide written comments on proposed policy and policy directions to the Authority on licensing of unassigned high demand spectrum”.1654 Government Gazette, No. 40145, 15 July 2018. Independent Communications Authority of South Africa: “Invitation to Apply For A Radio Frequency Spectrum License to Provide Mobile Broadband Wireless Access Service For Urban and Rural Areas Using the Complementary Bands, 700 MHZ, 800MHz and 2.6GHz””.1655 Government Gazette, No. 41512, 23 March 2018. Independent Communications Authority of South Africa: “Regulations on the Use of Television White Spaces”.1656 See https://www.is.co.za/about-us/press-releases/tv-white-spaces-a-gamechanger-for-rural-internet-rollout/. [Accessed 23 January 2018]1657 See https://www.is.co.za/about-us/press-releases/tv-white-spaces-a-gamechanger-for-rural-internet-rollout/. [Accessed 23 January 2018]
1096. In addition to the unassigned high demand spectrum, there is a possibility that additional spectrum might be available if the ITU World Conference allocates more spectrum to South Africa. Further, ICASA has published the regulations regarding the use of Television White Spaces (“TVWS”). TVWS is defined as “the unused frequencies within the radio frequency band 470MHz to 694 MHZ, excluding the Radio Astronomy sub-band 606 MHz to 614 MHz.1655” As per the ICASA regulations, the frequency band 470 MHz to 694 MHz has been allocated to TVWS, excluding the radio astronomy sub-band 606 MHz to 614 MHz. ICASA regulations specify “the requirement for a national reference geolocation spectrum database (the GLDB) that has a list of primary users and where they are using their channels in various parts of the country”1656. This regulation is beneficial to MNOs as ICASA has granted non-exclusive use of this desirable spectrum. TVWS is beneficial because it has desirable properties for MNOs since such spectrum can travel further and penetrate buildings more easily.1657

281
15.1. Operator views on national roaming
1097. In this section, a summary is provided of the submissions and concerns that were submitted to the Data Inquiry in relation to national roaming.
1098. Telkom holds that national roaming is an inferior substitute – both from a technical and cost-related point of view – to utilising one’s own network.1658 Telkom advanced a number of arguments supporting the notion that utilising one’s own network is superior to roaming from the technical point of view:
1098.1. The first argument is that it []. There are two reasons advanced for this: (1) []; and (2) []. 1659
1098.2. The second argument is that the roaming operator may not be able to secure the provision of all services from the host operator by commercial agreement and, thus, cannot provide these services its customers while they are roaming on the host network.1660
1098.3. The third argument is that the roaming
operator is not able to influence the network design, which limits the operator’s ability to differentiate itself from the host networ. 1661
1099. From a cost-related point of view, Telkom notes a number of features. The cost structure of national roaming [].1662 The cost of roaming is [].
1658 Telkom’s submission on 17 August 2018, p. 47, para. 130 (Confirmed as non-confidential on 18 April 2019)1659 Telkom’s submission on 17 August 2018, p. 47, para. 132.11660 Telkom’s submission on 17 August 2018, p. 48, para. 132.2 (Confirmed as non-confidential on 18 April 2019)1661 Telkom’s submission on 17 August 2018, p. 48, para. 132.3 (Confirmed as non-confidential on 18 April 2019)1662 Telkom’s submission on 17 August 2018, p. 48, para. 1331663 BRG report in Telkom’s submission dated 17 November 2017 (submitted as Non-confidential on 15 June 2018), p.151664 Telkom’s submission on 17 August 2018, p. 37, para. 92 (Confirmed as non-confidential on 18 April 2019)1665 Telkom’s submission on 17 August 2018, p. 37, para. 93 (Confirmed as non-confidential on 18 April 2019)1666 Telkom’s submission on 17 August 2018, p. 37, para. 94 (Confirmed as non-confidential on 18 April 2019)1667 Telkom’s submission on 17 August 2018, p. 37, para. 95 (Confirmed as non-confidential on 18 April 2019)1668 Telkom’s submission on 17 August 2018, p. 37, para. 96 (Confirmed as non-confidential on 18 April 2019)1669 Telkom’s submission on 17 August 2018, p. 37, para. 97 (Confirmed as non-confidential on 18 April 2019)1670 Telkom’s submission on 17 August 2018, p. 37, para. 104 (Confirmed as non-confidential on 18 April 2019)1671 BRG report in Telkom’s submission dated 17 November 2017, para. 63 p.17 (submitted as Non-confidential on 15 June 2018)
1100. In the value-chain for data services, Telkom considers national roaming to fall under mobile wholesale network services.1663 Telkom posits that there are generally five barriers to entry in the supply of roaming: access to spectrum, access to sites, national coverage requirements, economies of scale, and a limited potential customer base with high switching costs.1664 Spectrum is a scarce resource and necessary for the provision of roaming services.1665 Sites are required to locate RAN equipment, which is necessary for the provision of roaming services.1666 Telkom considers the minimum scale of entry for roaming to be national.1667 The exception here, of course, would be Rain, which provides roaming services to Vodacom.Achieving sufficient scale reduces unit costs as network utilisation improves.1668 The customer base for wholesale roaming services is limited to other mobile operators and the operator’s own retail division, while the pool of other mobile operators is likely to be further limited to those operators that do not have their own national network.1669 Furthermore, Telkom note that the use of national roaming services introduces another barrier to entry for the new entrant at the retail level: namely, that the roaming entrant will have difficulty matching the service quality of, and be able to differentiate itself from, the operator on whose network it roams.1670
1101. National roaming is secured through agreements by MNOs that have limited geographical coverage with their own network1671. According to Telkom, it is very unlikely that a new entrant could enter the retail market with a fully-built
15. APPENDIX G: NATIONAL ROAMING
282
national network..1672 As such, As such, access to wholesale roaming services is required by the new entrant to compete effectively1673
1102. Similarly, Cell C note that national roaming is a vital component of a competitive market, as new entrants are afforded a period during which it may roam on the network of a more established licensee, which was the case when Cell C entered the market in 2001.1674 This allows the new entrant to provide coverage until they can establish themselves and eventually spend the requisite level of capital to build a national service of a high quality.1675 Telkom concurs with this view by stating that domestic roaming arrangements allow new entrants, which have not yet achieved sufficient scale, to mitigate their higher average cost of service due to the high fixed costs of building and operating a network by rolling out national coverage before
1672 Telkom’s submission on 17 August 2018, p. 39, para. 100 (Confirmed as non-confidential on 18 April 2019)1673 Telkom’s submission on 17 August 2018, p. 39, para. 100 (Confirmed as non-confidential on 18 April 2019)1674 Cell C submission on 24 November 2017 (Non-confidential version), p 13, para. 4.41675 Cell C submission on 24 November 2017, Annexure A, (Confirmed as non-confidential on 3 April 2019) para 3.5.3, p. 341676 BRG report in Telkom’s submission dated 17 November 2017, (Non-confidential version) p. 34, para. 1451677 Vodacom letter dated 30 November 2017(Non-confidential) (In Cliffe Dekker Hofmeyer’s letterhead), p.13, para. 1.5.1.11678 Cell C submission on 24 November 2017, (Non-confidential version), p.2-3. para. 1.31679 Cell C submission on 24 November 2017, (Non-confidential version), p.13 para. 4.51680 Cell C submission on 15 August 2018, Annexure 47, p. 1, para. 47.11681 Cell C submission dated 24 November 2017, Annexure A (Confirmed as non-confidential on 3 April 2019) p. 48, question 131682 Cell C submission dated 15 August 2018, Annexure 47, p. 1, para. 47.11683 Cell C submission dated 15 August 2018, Annexure 47, p. 1, para. 47.11684 Cell C submission dated 15 August 2018, Annexure 47, p. 1, para. 47.11685 Cell C submission dated 13 July 2018, Annexure 33, para. 3.8.11686 Telkom’s submission dated 13 July 2018, Econex (2016) ‘ICASA Invitation to Apply (ITA) for spectrum – impact on competition in telecoms markets in South Africa’, p.8, para. 3.1.2 (Confirmed as non-confidential on 18 April 2019)1687 Telkom’s submission dated 13 July 2018, Econex (2016) ‘ICASA Invitation to Apply (ITA) for spectrum – impact on competition in telecoms markets in South Africa’, para. 3.1.2 (Confirmed as non-confidential on 18 April 2019)
they have built sites nationally.1676 This view is shared by Vodacom that considers the presence of commercially negotiated national roaming agreements enhances and enables competition at the retail level. 1677
1103. MTN and Vodacom provide national coverage, whereas Cell C and Telkom Mobile do not have national networks and are, thus, dependent on roaming services from Vodacom and MTN, respectively.1678 In 2001, Vodacom and MTN were the only licensed operators providing mobile cellular services and by concluding a national roaming agreement with Vodacom, Cell C was able to operate as the third national operator notwithstanding the fact that it had not built its own network throughout most of the country.1679 [].1680 The coverage areas for Cell C roaming on Vodacom’s 3G network and 2G network are presented in the respective figures below:
1104. While Cell C concluded an agreement with Vodacom, [].1681 [].1682 [].1683 However, notwithstanding the [].1684 This is in contrast with [].1685
1105. Similarly, Telkom Mobile concluded a national roaming agreement with MTN. In addition to being a new entrant, Telkom has the
additional disadvantage of only having access to higher frequency spectrum bands, 1800 MHz and higher.1686 Higher frequency spectrum bands require more base stations to cover a particular geographic area, which expands the capital requirements of providing adequate coverage1687. Furthermore, sub-1GHz spectrum is effective for providing network coverage
Figure 62: Cell C’s coverage areas for roaming on Vodacom’s 3G network
[]
Source: Cell C’s submission on 29 August 2018, appendix 32.2

283
inside buildings, which means Telkom is required to utilise roaming agreements to provide coverage indoors.1688 In this regard, Telkom has been able to offer national mobiles services, covering 99% of the population, by way of building its own sites in certain location and roaming on MTN’s network in other locations.1689 In principle, roaming can be supplied by any mobile operator over its own network, but, in practice, national roaming services are primarily supplied by Vodacom and MTN as the two largest operators and the only operators with national coverage.1690
1106. According to Telkom, these agreements are not subject to any regulatory control and are concluded on a commercial basis.1691 Given the bargaining power imbalance that is likely to exist between established operators and a new entrant or smaller operator, the terms of these agreements can be unfavourable towards the roaming operator such that their incremental costs are higher than that of the larger network operators.1692 However, MTN argued that small players have countervailing buyer power in that there is an outside option in the form of Vodacom as an alternative provider of roaming services.1693 Indeed, MTN indicated that when Cell C entered the market, they approached both Vodacom and MTN to negotiate prices.1694 While MTN also mentioned that they have to
1688 Telkom’s submission dated 13 July 2018 (letter to the Inquiry), p.10, para. 43 (Confirmed as non-confidential on 18 April 2019)1689 BRG report in Telkom’s submission dated 17 November 2017, para. 97 and 98(submitted as Non-confidential on 15 June 2018)1690 BRG report in Telkom’s submission dated 17 November 2017, para. 113(submitted as Non-confidential on 15 June 2018)1691 BRG report in Telkom’s submission dated 17 November 2017, para. 114(submitted as Non-confidential on 15 June 2018)1692 BRG report in Telkom’s submission dated 17 November 2017, para. 145(submitted as Non-confidential on 15 June 2018)1693 MTN‘s presentation at the public hearings held on 17-19 October 2018. See Day 2 transcripts, p.1071694 MTN‘s presentation at the public hearings held on 17-19 October 2018. See Day 2 transcripts, p.1071695 MTN‘s presentation at the public hearings held on 17-19 October 2018. See Day 2 transcripts, p.1071696 Vodacom’s submission dated 30 November 2017, p. 14, para. 2.11 (Confirmed as non-confidential on 18 April 2019)1697 Vodacom’s submission (Non-confidential) dated 30 November 2017, p. 15 para. 2.121698 Cell C submission dated 24 November 2017, Non-confidential version, para. 4.101699 Cell C submission dated 13 July 2018, Annexure 33, para. 3.8.3.4
negotiate constantly with Telkom to keep their roaming traffic on MTN’s network,1695 they do not mention whether Telkom also approached Vodacom and whether there was an actual competitive process involved in the negotiations. Vodacom argued that “Cell C and Telkom can increase their bargaining power by a) self-building and suspend roaming once they have achieved national coverage, b) split roaming between various providers [something Cell C has mentioned as a consideration], c) offer to procure roaming from only one provider, and d) select to roam in certain geographic areas and self-build in others.”.1696 Furthermore, Vodacom argued that the entry of Rain has expanded the options for wholesale roaming services, this is not the case for national coverage of all services.1697 As such, Rain does not represent a substitute for Vodacom and MTN.
1107. Cell C explained using information contained in documentation received from ICASA that Vodacom was able to conclude a national roaming agreement with Rain, whereby Rain would have access to Vodacom’s national network at almost the same price for which Vodacom is provided roaming on Rain’s network, which only extends to the borders of Gauteng.1698 [].1699
Figure 63: Cell C’s coverage areas for roaming on Vodacom’s 2G Network
[]
Source: Cell C’s submission on 29 August 2018, appendix 32.2

284
1108. Cell C holds that this amounts to an attempt by Vodacom to acquire valuable spectrum via third party licensee and under current legislation, spectrum-sharing, trading or leasing is not permitted.1700 The terms under which Rain acquired access to Vodacom’s sites has been on a more favourable basis than the terms received from Vodacom for the same service and for the same sites.1701
1109. Cell C alleges that [].1702 According to Cell C, [].1703 In this way, [].1704 Cell C argued that [].1705 [].1706 Furthermore, [].
1110. In exchange, [].1707 [].1708
1111. ICASA has not fulfilled the requirements of section 43(8) of the ECA obliging the regulator to “prescribe a list of essential facilities”. Furthermore, the absence of regulation regarding national roaming means that new entrants, such as Cell C and Telkom Mobile, have to negotiate terms of access on a commercial basis, which are unlikely to be favourable.1709 Indeed, without countervailing bargaining power, [].1710 In this regard, Cell C is of the view that price regulation be instituted, where the national roaming price be set at no higher than the regulated MTR without conditions, such as floor payments.1711
1112. In Cell C’s submission in terms of ICASA’s priority market study, Cell C noted that in 2001, when Cell C entered the market, Vodacom was the only licensee that would offer roaming to Cell C, but only did so on punitive terms, some of which are still in place today.1712
1700 Cell C submission dated 24 November 2017, Non-confidential version, para. 4.10 and 4.111701 Cell C submission dated 24 November 2017, Non-confidential version, para. 4.111702 Cell C submission dated 13 July 2018, Annexure 33, para. 1.51703 Cell C submission dated 13 July 2018, Annexure 33, para. 1.61704 Cell C submission dated 13 July 2018, Annexure 33, para. 1.61705 Cell C submission on 13 July 2018, Annexure 33, para. 5.11706 Cell C submission on 13 July 2018, Annexure 33, para. 5.21707 Cell C submission on 13 July 2018, Annexure 33, para. 1.61708 Cell C submission on 13 July 2018, Annexure 33, para. 1.7 and 1.81709 Cell C submission on 24 November 2017, Annexure A, (Confirmed as non-confidential on 3 April 2019) para 3.5.31710 Cell C submission on 15 August 2018, Annexure 47, para. 47.11711 Cell C submission on 24 November 2017, Annexure A, (Confirmed as non-confidential on 3 April 2019) para 3.5.41712 Cell C submission on 24 November 2017, Annexure A, (Confirmed as non-confidential on 3 April 2019) para 3.5.11713 Cell C submission on 24 November 2017, Annexure A, (Confirmed as non-confidential on 3 April 2019) para 3.5.21714 Cell C submission on 13 July 2018, Annexure 33, para. 3.8.5.21715 Cell C submission on 13 July 2018, Annexure 33, para. 3.8.5.31716 Cell C submission on 15 June 2018, Annexure 2, para. 2 (Confirmed as non-confidential on 18 April 2019)1717 Cell C submission on 15 June 2018, “Seamless Handover Requirement Scope between Cell C and Vodacom, 9 October 2013, para. 11718 Cell C submission on 15 June 2018, Annexure 2, para. 2 (Confirmed as non-confidential on 18 April 2019)1719 Cell C submission on 15 June 2018, Annexure 2, para. 5 (Confirmed as non-confidential on 18 April 2019)1720 Cell C submission on 13 July 2018, Annexure 33, para. 3.8.5.41721 Cell C submission on 13 July 2018, Annexure 33, para. 3.8.5.61722 Cell C submission on 13 July 2018, Annexure 33, para. 3.8.5.81723 Rain’s submission on 31 August 2018, para. 10.2.11724 Rain’s submission on 31 August 2018, para. 10.2.11725 Rain’s submission on 31 August 2018, para. 10.2.11726 Rain’s submission on 31 August 2018, para. 10.2.21727 Cell C submission on 13 July 2018, Annexure 33, para. 4.71728 Cell C submission on 13 July 2018, Annexure 33, para. 4.1
1113. One of the issues with its agreement with Vodacom was their unwillingness to provide “seamless handover” of calls between Vodacom and Cell C’s network1713 [].1714 This is because [].1715 The customer connects to the Vodacom network, not Cell C. In 2013, Cell C prepared an initial implementation document detailing the technical requirements for seamless handover between Cell C and Vodacom in both directions.1716 At a high-level, [].1717 Thus, Cell C illustrated that .it is not necessarily a complex undertaking and that it can take place.1718 However, Vodacom had failed to provide seamless handover to Cell C. 1719
1114. On the other hand, Vodacom is [].1720 [].1721 Furthermore, it is not apparent to the [].1722 However, Rain indicated that the reason for this is that there is a difference between Rain’s network and old 2G architectures.1723 The latter requires roaming traffic to first be conveyed to the roaming provider’s core before being handed over to the roaming customer’s core.1724 As such, Vodacom’s roaming traffic is conveyed from Rain’s RAN to the nearest interconnection point between the two networks before being handed off to Vodacom’s core.1725 Rain has argued [].1726
1115. Cell C’s [].1727 As such, Cell C alleges that []. 1728

CONTACT PERSON
Jason AproskiePrincipal Economist
Economic Research BureauCompetition Commission South Africa

T: +27(0) 12 394 3200 / 3320F: +27(0) 12 394 0166
E: [email protected]: www.compcom.co.za
The DTI Campus, Mulayo (Block C)77 Meintjies Street, Sunnyside, Pretoria
Private Bag x23, Lynnwood Ridge 0040, South Africa
competition commissionsouth africa
competition regulation for a growing and inclusive economy