Embed Size (px)
Citation preview

Data Quality Issues:Traps & Pitfalls
Ashok Kolaskar
Vice-Chancellor
University of Pune, Pune 411 007. India

Cancer cell growth appears to be related to evolutionary development of plump fruits and vegetables
• Large tomatoes can evolve from wild, blueberry-size tomatoes. The genetic mechanism responsible for this is similar to the one that proliferates cancer cells in mammalians.
• This is a case where we found a connection between agricultural research, in how plants make edible fruit and how humans become susceptible to cancer. That's a connection nobody could have made in the past.
Cornell University News, July 2000

Size of Tomato Fruit
•fw2.2: A Quantitative Trait Locus (QTL) key to the Evolution of Tomato Fruit Size. Anne Frary (2000) Science, 289: 85-88
Single gene, ORFX, that is responsible for QTL has a sequence and structural similarity to the human oncogene c-H-ras p21.
Fruit size alterations, imparted by fw2.2 alleles, are most likely to be due to the changes in regulation rather than in sequence/structure of protein.

Genome Update: Public domain
• Published Complete Genomes: 59– Archaeal 9– Bacterial 36– Eukaryal 14
• Ongoing Genomes: 335– Prokaryotic 203 – Eukaryotic 132
Private sector holds data of more than 100 finished & unfinished
genomes.

Challenges in Post-Genomic era: Unlocking Secretes of quantitative variation
• For even after genomes have been sequenced and the functions of most genes revealed, we will have no better understanding of the naturally occurring variation that determines why one person is more disease prone than another, or why one variety of tomato yields more fruit than the next.
• Identifying genes like fw2.2 is a critical first step toward attaining this understanding.

Value of Genome Sequence Data
• Genome sequence data provides, in a rapid and cost effective manner, the primary information used by each organism to carry on all of its life functions.
• This data set constitutes a stable, primary resource for both basic and applied research.
• This resource is the essential link required to efficiently utilize the vast amounts of potentially applicable data and expertise available in other segments of the biomedical research community.

Challenges
• Genome databases have individual genes with relatively limited functional annotation (enzymatic reaction, structural role)
• Molecular reactions need to be placed in the context of higher level cellular functions
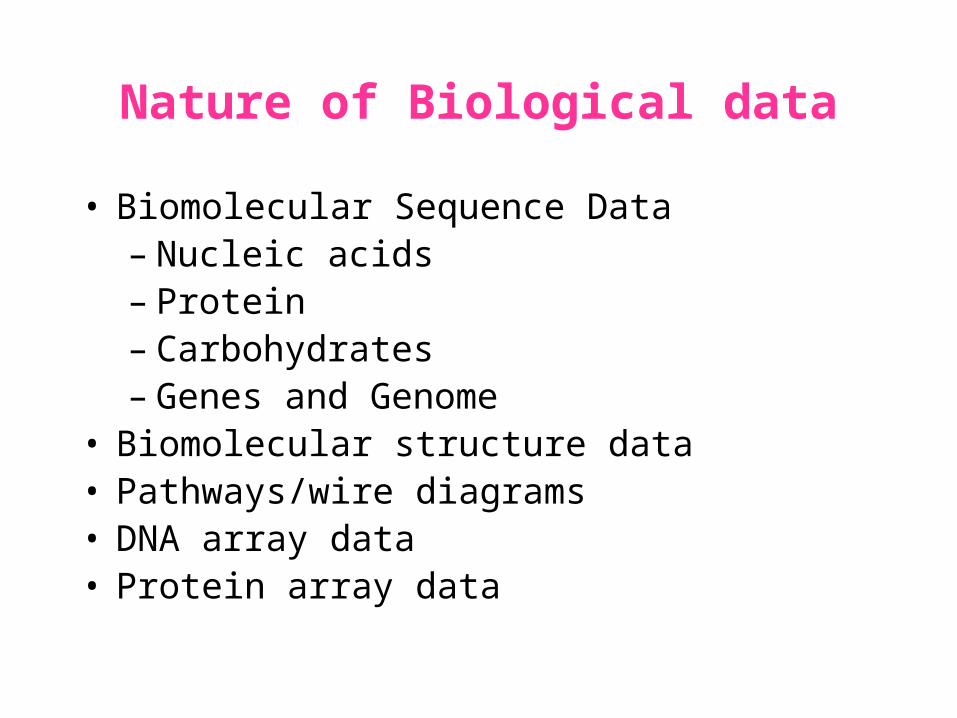
Nature of Biological data
• Biomolecular Sequence Data– Nucleic acids – Protein– Carbohydrates– Genes and Genome
• Biomolecular structure data• Pathways/wire diagrams• DNA array data• Protein array data

Bioinformatics Databases• Usually organised in flat files• Huge collection of Data • Include alpha-numeric and pictorial data• Latest databases have gene/protein expression data
(images)Demand• High quality curated data• Interconnectivity between data sets• Fast and accurate data retrieval tools
– queries using fussy logic • Excellent Data mining tools
– For sequence and structural patters

What is CODATA?
• CODATA is the committee on Data for Science and Technology of the International Council of Scientific Unions.
• It was established in to improve the quality, reliability, processing, management and accessibility of data for science and technology.
• CODATA Task Group on Biological Macromolecules has recently surveyed quality control issues of archival databanks in in molecular biology

Task Group on Biological Macromolecules
E. E. Abola A. Bairoch W. C. Barker S. Beck
D. A. Benson H. Berman G. Cameron C. Cantor
S. Doubet T.J.P. Hubbard T. A. Jones G.J. Kleywegt
A.S. Kolaskar A. Van Kuik A. M. Lesk H. –W. Mewes
D. Neuhaus F. Pfeiffer L.F. TenEyck R.J. Simpson
G. Stoesser J. L. Sussman Y. Tateno A. Tsugita
E. L. Ulrich J. F. G. Vliegenthart

Quality Control Issues
• The quality of archived data can, of course, be no better than the data determined in the contributing laboratories.
• Nevertheless, careful curation of the data can help to identify errors.
• Disagreement between duplicate determinations is as always, a clear warning of an error in one or the other.
• Similarly, results that disagree with established principles may contain errors.
• It is useful, for instance, to flag deviations from expected stereochemistry in protein structures, but such ``outliers'' are not necessarily wrong.

QCI contd..
• The state of the experimental art is the most important determinant of data quality.
• Quality control procedures provide the second level of protection. Indices of quality, even if they do not permit error correction, can help scientists avoid basing conclusions on questionable data.

Typical Databank record Journey from Entry to Distribution
A. Sequence in journal publication; nucleic acid sequence not found in EMBL data library
• Data input: sequence and journal information keyboarded three times
• Data verification: different keyboardings compared
• Release of data: directly after verification sequences were added to the public dataset
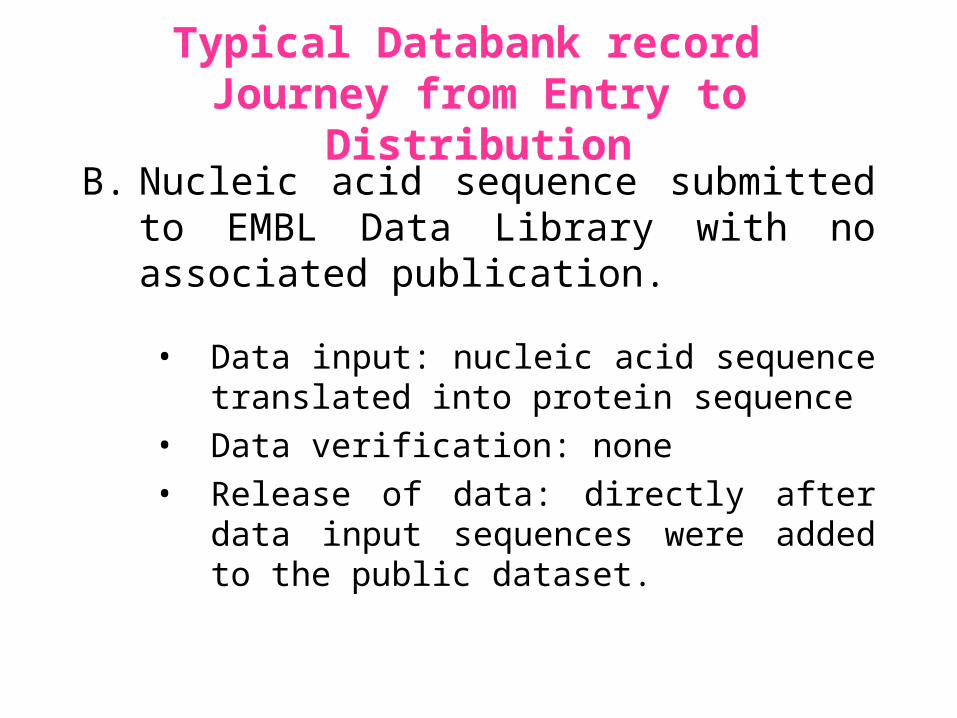
Typical Databank record Journey from Entry to Distribution
B. Nucleic acid sequence submitted to EMBL Data Library with no associated publication.
• Data input: nucleic acid sequence translated into protein sequence
• Data verification: none• Release of data: directly after data input
sequences were added to the public dataset.

Typical Databank record Journey from Entry to Distribution
C. Nucleic acid sequence submitted to EMBL Data Library with associated publication: protein sequence displayed in paper.
• Data input: nucleic acid sequence translated into protein sequence
• Data verification: sequence and journal information keyboarded once; comparison of translation with published sequence.
• Release of data: directly after verification sequences were added to the public dataset

Typical Databank record Journey from Entry to Distribution
D. Nucleic acid sequence submitted to EMBL Data Library with no associated publication: protein sequence NOT displayed in paper:
• Data input: nucleic acid sequence translated into protein sequence
• Data verification: journal information keyboarded once; comparison of journal information
• Release of data: directly after verification sequence were added to the pubic dataset.

Errors in DNA sequence and Data Annotation• Current technology should reduce error rates to as low as
1 base in 10000 as every base is sequenced between 6-10 times and at least one reading per strand.
• Therefore, in a procaryote, error of 1 isolated wrong base would result to one amino acid error in ~10-15 proteins.
• In human genome gene-dense regions contain about 1 gene per 10000 bases, with average estimated at 1 gene per 30000bases.
• Therefore, corresponding error rate would be roughly one amino acid substitution in 100 proteins.
• But large scale error in sequence assembly can also occur. Missing a nucleotide can cause a frameshift error.

DNA data …
• The DNA databases (EMBL/ GenBank/ DDBJ) carry out quality checks on every sequence submitted.
• No general quality control algorithm is yet in widespread use.
• Some annotations are hypothetical because they are inferences derived from the sequences.– Ex. Identification of coding regions. These inferences
have error rates of their own.

Policies of PIR
• Entries in the PIR database are subject to continual update, correction, and modification. At least 20-25 % of entries are updated during each quarterly release cycle.
• Every entry added or revised is run through a battery of checking programs. Some fields have controlled vocabulary and others are linked in way that can be checked. For example, enzymes that are identified by EC number are required to have certain appropriate keywords; scientific and common names for an organism are required to be consistent.

Policies of PIR contd..
• Features are checked for the identity of the amino acids involved, e.g., disulfide bonds must involve only Cys residues.
• Standards list and auxiliary database used in the checking procedures include database for enzymes, human genes, taxonomy, and residue modifications and standard lists for journal abbreviations, keywords, super family names, and some other fields.

Indices of quality maintained by the databank
When data from different sources are ‘merged’ into a single entry, any difference in the reported sequences are explicitly shown unless they are too extensive.

Policies of SWISS-PROT
• An annotated protein sequence database established in 1986 and maintained collaboratively, since 1987, by the Department of Medical Biochemistry of the University of Geneva and the EMBL Data Library.
• SWISS-PROT is curated protein sequence database which strives to provide a high level of annotations, a minimal level of redundancy, integration with other databases, and extensive external documentation.

SWISS-PROT
• Contributors provide: Sequence (99.9% translated from the DNA database), bibliographic references. Cross reference to DNA database.
• Databank staff adds: Annotations, keywords, feature table, cross-reference to DNA database.
• Processing of an entry from point of arrival through to distribution:– Sequence, References, Annotations.

Yeast genome dataDifferent Centre announce different
numbers on the same day!• MIPS: http://www.mips.biochem.mpg.de• SGD: http://genome-www.stanford.edu• YPD: http://www.proteome.com
Total proteins• MIPS: 4344 ORFs• YPD: 6149 out of these 4270 were reported to be
characterized experimentally.• MIPS: 6368 ORFs
» Out of these about 178 correspond to small proteins of length < 100.

Yeast genome ..
• In brief, because of different definitions of ‘unknown’ or ‘hypothetical’ and ‘uncoding’ or ‘questionable’ ORFs, the number of yeast proteins of which the function remains to be identified is estimated to be 300 (the Cebrat ‘uncoding’) or 1568 (the MIPS ‘hypothetical’) or 1879 (the YPD ‘unknown’).

Annotation of Genome Data•In general, annotation of bacterial genomes is more complete and accurate than that of eukaryotes. •The types of errors that tend to appear are entries with frame shift sequencing errors, which lead to truncation of predicted reading frames or even double errors leading to a mistranslated internal fragment.•Small genes, indeed any small functionally important sequences, are likely to be missed, as they may fall below statistically significant limits. •In higher organisms, identifying genes is harder and, in consequence, database annotation is more dubious. Experimental studies can improve the annotations more dubious. •Alternative splicing patterns present a particular difficulty.

Annotation of Human Genome
• In contrast, the sequence of the human genome is being determined in many labs and its annotation varies from nothing, for certain regions, to gene predictions that are based on different methods and that reflect different thresholds of accepted significance.
• Therefore the annotation of DNA sequences must be frequently updated and not frozen. It is a challenge for databanks to find ways to link primary sequence data to new and updated annotations.

Quantitating the signals from DNA arrays
• A linear response that covers two or three orders
of magnitude is often needed to detect low and
high copy number transcripts on the same array.
• In cases where this is not possible it may be
necessary to scan the chip at different wave
lengths, or to amplify the signal with an immune
sandwich on top of the bound sample.

Standardization of DNA microarrays • Comparison of data obtained from independent arrays
and from different laboratories requires standardization. Both the Affymetrix chips and the custom made cDNA chips use different methods for standardization.
• The Affymetrix chips have approximately 20 probes per gene and standardization is either based on the expression level of selected genes, like actin and GAPDH, or on a setting of the global chip intensity to approximately 150 units per gene on the chip.
• In this way, chip data from different experiments can be compared to each other.
• In out hands, the data obtained with the two standardization methods differ only by approximately 10 % (unpublished observations).

Samples for expression monitoring
• The analysis of relatively homogenous cell populations (cloned cell lines, yeast, etc.) has proven much simpler than the analysis of tissue biopsies as the latter often contain many cell types (epithelial, endothelial, inflammatory, nerve, muscle, and connective tissue cells) that are present in variable amounts.
• Standardization may require microdissection of the tissue to isolate specific cell types, although the number of cells needed for the assay is well above a million. Sampling of specific cell types using laser capture microdissection (LCM) can be a time-consuming task, and given that mRNA is prone to degradation the processing time must be kept to a minimum.

Quantitation of Protein array data
• Even though there are several tools available for the quantitation of protein spots, there is at present no available procedure for quantitating all of the proteins resolved in a complex mixture.
• Part of the problem lies in the large dynamic range of protein expression, lack of resolution, post-translational modifications, staining behavior of the protein as well as in the fact that many abundant proteins streak over less abundant components interfering with the measurements.
• At present, fluorescent technology seems to be way ahead; as with the fluorescence stain Sypro Ruby there is a linear response with respect to the sample amount over a wide range of abundance.
• Quantitative fluorescence measurements can be performed with CCD-Camera based systems as well as with laser scanner systems.

Gene expression profiling techniquesChallenges & Perspectives
• A major challenge in the near future will be to define a base line for the normal gene expression phenotype of a given cell type, tissue or body fluid.
• This is not a trivial task, however, as it will require the analysis of hundreds or even thousands of samples.

Current Limitations of Gene expression profiling techniques
• Technical problems associated with the analysis of expression profiles derived from tissues that are composed of different cell types
• Lack of procedures for identifying targets that lie in the pathway of disease
• Need for Bioinformatics tools for rapidly assessing the function of the putative targets,
• The latter is so for paramount importance to the pharmaceutical industry as the identification of disease deregulated targets alone is not sufficient to start costly drug screening process.

Protein ArraysStatistical issues in data collection phase
Within labsSignal to noise ratio• quantifying and making as high as possible• identifying and controlling sources of variability• reproducibilityBetween Labs• Inter lab variability and biases• ReproducibilityTends to have been ignored in the excitement ? Cost ?• really obvious/big effectsBecomes important when dealing with more subtle effectsLab effects and scanning effects• Needs systematic designed experiments to quantify sources of variation.• Strategies for optimizing and monitoring processes

Protein ArraysStatistical issues-data analysis phase
• What’s being done now- visualization of data as an image- Clustering of rows and columns to interpret arrays
• Some limitations- Visualizations tend to be of raw expression data- Methods tend to ignore structure on rows-genes
and columns-samples- Methods involove rectangular clusters- Genes usually restricted to lie in one cluster

Protein ArraysStatistical issues-data analysis phase contd..
• What's needed?- Other ways of visualizing the data which can also use
information about rows and columns- Local clustering which is not restricted to “rectangles”- Genes in more than one cluster- Clustering with prior information- Analysis of experimental designs where the response is
a vector of microarray data- Dimension reduction- Methods for finding associations between large number
of predictor and response variables

Quality Control Issues related to 3-D structure data determined using X-rays
• The reported parameter called the `B-factor' of each atom describes its effective size, and for proteins it should be treated as an empirical value.
• Because every atom contributes to every observation, it is difficult to estimate errors in individual atomic positions.
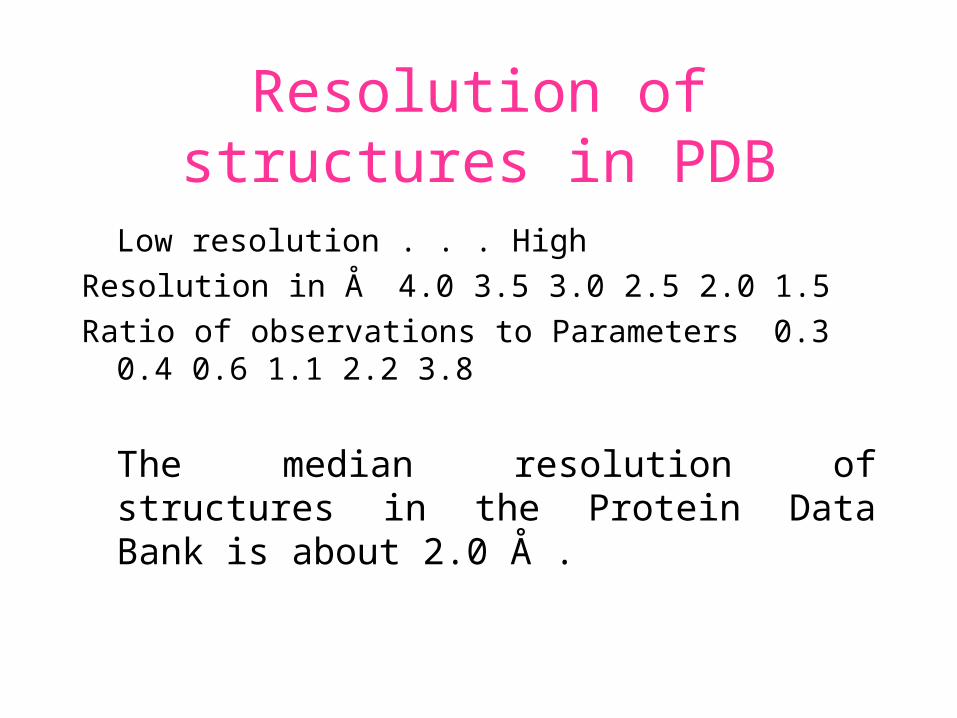
Resolution of structures in PDB
Low resolution . . . High
Resolution in Å 4.0 3.5 3.0 2.5 2.0 1.5
Ratio of observations to Parameters 0.3 0.4 0.6 1.1 2.2 3.8
The median resolution of structures in the Protein Data Bank is about 2.0 Å .

R-factor contd..• The R-factor measures how well the model fits the
data. If the set of observed X-ray intensities is Fo, and the corresponding predicted intensities calculated from the model are Fc, the R-factor is defined as |Fo – Fc| /|Fo|. (The set of F's may contain a list of tens of thousands of numbers.)
• For high resolution models values around 0.18±0.22 are good. For low resolution studies, however, `good' R-factor values may be obtained even for models that are largely or entirely wrong. A more sophisticated quality measure is the cross-validation R factor, Rfree.

R-factor, R-free contd..
• Murshudov and Dodson estimate overall uncertainties of atomic positions in macromolecules from the Rfree values, giving in a typical case values of about ~ 0.05 Å at 1.5 Å resolution and ~ 0.15 Å at ~ 2 Å resolution.
• They approximate uncertainties of individual atomic positions from B-factors, giving values of about 0.16 Å for an atom with B=20 Å and 0.3 Å for an atom with B=60 Å.
Methods to detect the outliersType I
• Nomenclature and convention-related checks:• Examples include incorrect chirality, and the
naming of chemically equivalent side-chain atoms (e.g., in phenylalanine and tyrosine rings).
• Such errors can be corrected confidently without reference to experimental data and current submissions can be fixed at the time of deposition.Checking of old datasets is in progress.

Methods to detect the outliersType II
• Self-consistency tests: • Many stereochemical features of macromolecular
models are restrained during refinement. Bond lengths and angles are restrained to ideal values, planarity is imposed on aromatic rings and carboxylate groups, non-bonded atoms are prevented from clashing, temperature factors of atoms bonded to each other are forced to be similar, etc. Methods that assess how well these restraints are satisfied are an important part of the arsenal of structure verification tools.
• Nevertheless, their inadequacy in detecting genuine shortcomings in models has been demonstrated.

Type II continue…
Proper assessment of outliers (as features or errors) requires access to the experimental data. Sometimes,outliers warn of more serious problems and may require careful inspection of the electron-density maps and even model rebuilding by an experienced crystallographer.Unfortunately, not all errors can be fixed, even by appeal to structure factors and maps; some regions are fatally disordered.

Methods to detect the outliersType III
• Orthogonal tests: • Most revealing and useful are verification methods
independent of the restraints used during model refinement. Such methods use database derived information to assess how usual or unusual an atom, residue, or entire molecule is.
• Examples include the analysis of torsion angles of the protein main-chain (Ramachandran analysis) and side-chain atoms (rotamer analysis), the orientation of the peptide plane (peptide-flip analysis), atomic volumes, geometry of the Ca-backbone, nonbonded contacts, and the use of sequence-structure profiles.

Quality of NMR structure determination• NMR is the second major technique for determining
macromolecular structure. • The experiments determine approximate values of a set of
inter-atomic distances and conformational angles. • These distances, derived from the Nuclear Overhauser
Effect (NOE), identify pairs of atoms close together in space, including those from residues distant in the sequence which are essential for assembling the overall folding pattern.
• Calculations then produce sets of structures that are consistent–as far as possible–with the experimental constraints on distances and angles, and that have proper stereochemistry.

Q.C.I of NMR data• None of these measures really relates to accuracy, i.e. the
similarity of the calculated structure to the ``true'' structure.
• One can determine, however, whether a calculated structure is consistent with experimental data not used to constrain it.
• One such approach is cross-validation. A proportion of constraints is omitted from the structure calculation, and the consistency of the resulting structure with the unused constraints is taken as a measure of accuracy. (This is analogous to the procedures used by crystallographers in measuring Rfree).

ConclusionsTwo factors dominate current developments in
Bioinformatics: (1) The amount of raw data is increasing in
quantity, spectacularly so, and in quality. Methods for annotation are improving but by no means at a comparable rate. Tools for identification of errors are improving both through enhanced understanding of what to expect and from a better statistical base from which to flag outliers.
(2) A proliferation of web sites provides different views or slices or means of access to these data; and an increasingly dense reticulation of these sites provides links among databanks and information-retrieval engines. These links provide useful avenues to applications; but they also provide routes for propagation of errors in raw or immature data. subsequently corrected in the databanks but the corrections not passed on, and in annotation.

Conclusions contd../
• Annotation is a weak component of the enterprise. • Automation of annotation is possible only to a limited
extent and getting annotation right remains labor-intensive. • But the importance of proper annotation, however, cannot
be underestimated.• P. Bork has commented that for people interested in
analysing the protein sequences implicit in genome sequence information, errors in gene assignment vitiate the high quality of the sequence data.
• The only possible solution is a distributed and dynamic error-correction and annotation process.

Contd../
• The workload must be distributed because databank staff have neither the time nor the expertise for the job; specialists will have to act as curators.
• The process must be dynamic, in that progress in automation of annotation and error identification /correction will permit re-annotation of databanks.
• As a result, we will have to give up the ``safe'' idea of a stable databank composed of entries that are correct when they are first distributed in mature form and stay fixed thereafter.
• Databanks will become a seething broth of information both growing in size, and maturing–we must hope–in quality.

Contd../• This will create problems, however, in organizing applications. • Many institutions maintain local copies of databanks: At present,
``maintain'' means ``top up;'' yet this will no longer be sufficient. • In the face of dynamically changing databanks, how can we avoid
proliferation of various copies in various states? • How will it be possible to reproduce a scientific investigation based
on a database search? • One possible solution is to maintain adequate history records in each
databank itself in order to be able to reconstruct its form at any time. • This is analogous to the information in the Oxford English
Dictionary, which permits reconstruction of a English dictionary appropriate for 1616 or 1756.