Embed Size (px)
Citation preview

Data Processing, Information Extraction and Object
Recognition based on SAR Imagery
– Studies on GF-3 Satellite Dr. Lei Bin,
Institute of Electronics, Chinese Academy of Sciences
Oct 24, 2017
Outline
1、Introduction of GF-3 and Our Tasks
2、GF-3 data processing and analysis
3、Applications of GF-3 products
4、Summary
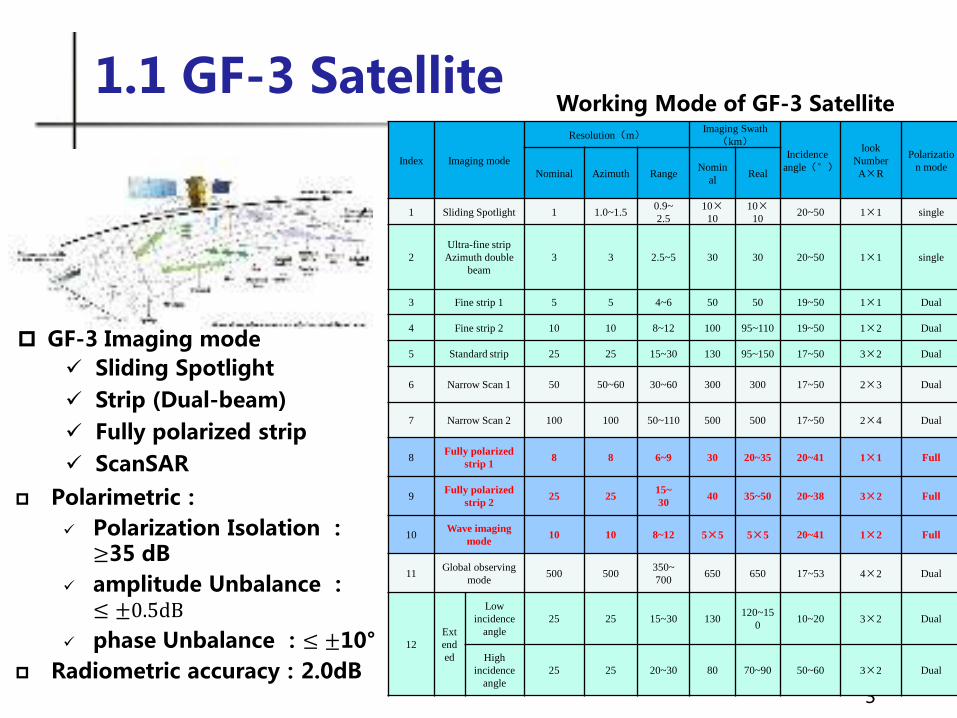
1.1 GF-3 Satellite
3
Index Imaging mode
Resolution(m) Imaging Swath(km)
Incidence angle(°)
look Number A×R
Polarization mode
Nominal Azimuth Range Nomin
al Real
1 Sliding Spotlight 1 1.0~1.5 0.9~ 2.5
10× 10
10× 10
20~50 1×1 single
2 Ultra-fine strip Azimuth double
beam 3 3 2.5~5 30 30 20~50 1×1 single
3 Fine strip 1 5 5 4~6 50 50 19~50 1×1 Dual
4 Fine strip 2 10 10 8~12 100 95~110 19~50 1×2 Dual
5 Standard strip 25 25 15~30 130 95~150 17~50 3×2 Dual
6 Narrow Scan 1 50 50~60 30~60 300 300 17~50 2×3 Dual
7 Narrow Scan 2 100 100 50~110 500 500 17~50 2×4 Dual
8 Fully polarized
strip 1 8 8 6~9 30 20~35 20~41 1×1 Full
9 Fully polarized
strip 2 25 25
15~ 30
40 35~50 20~38 3×2 Full
10 Wave imaging
mode 10 10 8~12 5×5 5×5 20~41 1×2 Full
11 Global observing
mode 500 500
350~ 700
650 650 17~53 4×2 Dual
12 Extended
Low incidence
angle 25 25 15~30 130
120~150
10~20 3×2 Dual
High incidence
angle 25 25 20~30 80 70~90 50~60 3×2 Dual
Working Mode of GF-3 Satellite
GF-3 Imaging mode
Sliding Spotlight
Strip (Dual-beam)
Fully polarized strip
ScanSAR
Polarimetric:
Polarization Isolation :≥35 dB
amplitude Unbalance :≤ ±0.5dB
phase Unbalance :≤ ±10°
Radiometric accuracy:2.0dB

Tasks from China Centre For Resources Satellite Data and Application
GF-3 Satellite product generation software GF-3 Satellite echo simulation software GF-3 Satellite calibration software
Research projects from GF-3 Satellite Polarization Data Processing and Analysis(Leader) Ground parameter inversion using GF-3 Data(participant) Quality enhancing of GF-3 Satellite ocean images (participant )
4
1.2 Tasks of Our Laboratory
Most of our work focuses on the raw data processing or the post-processing, which aims to provide high quality images for further applications
Outline
1、Introduction of GF-3 and Our Tasks
2、GF-3 data processing and analysis
3、Applications of GF-3 products
4、Summary

There are only a few orders of this mode ( totally 127 scenes, about 0.243% of all orders) Radiometric quality of this mode, which we observed, is quite good
6
2.1 Sliding spotlight mode
Data acquisition time:2016-08-17 10:14:32
Wave band:C Polarization mode:HH
Incidence angle:35.40degree
Imaging mode:(SL)
Nominal resolution:1.0m×1.0m E118.0_N24.5
Haicang District ,Xiamen City, Fujian Province

7
2.2 Standard strip mode
This mode is frequently used
1.The system is stable, but there is a deviation between the ground test antenna pattern and the actual antenna pattern. 2."Rainforest Estimation" correction produced a better image.
Calibration constant
Wave No. Wave code
8
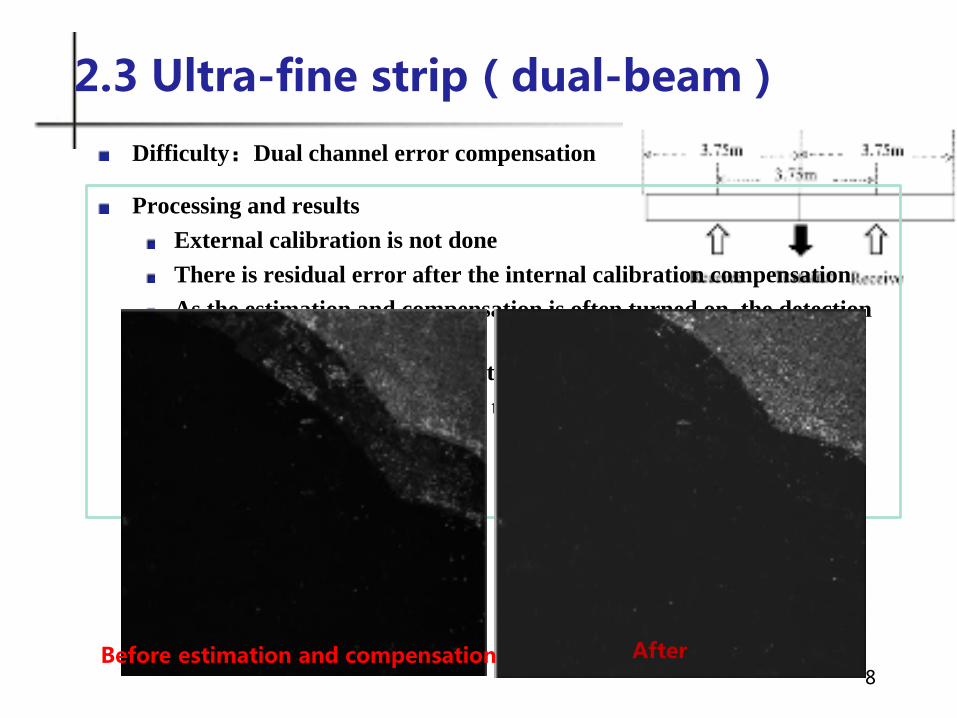
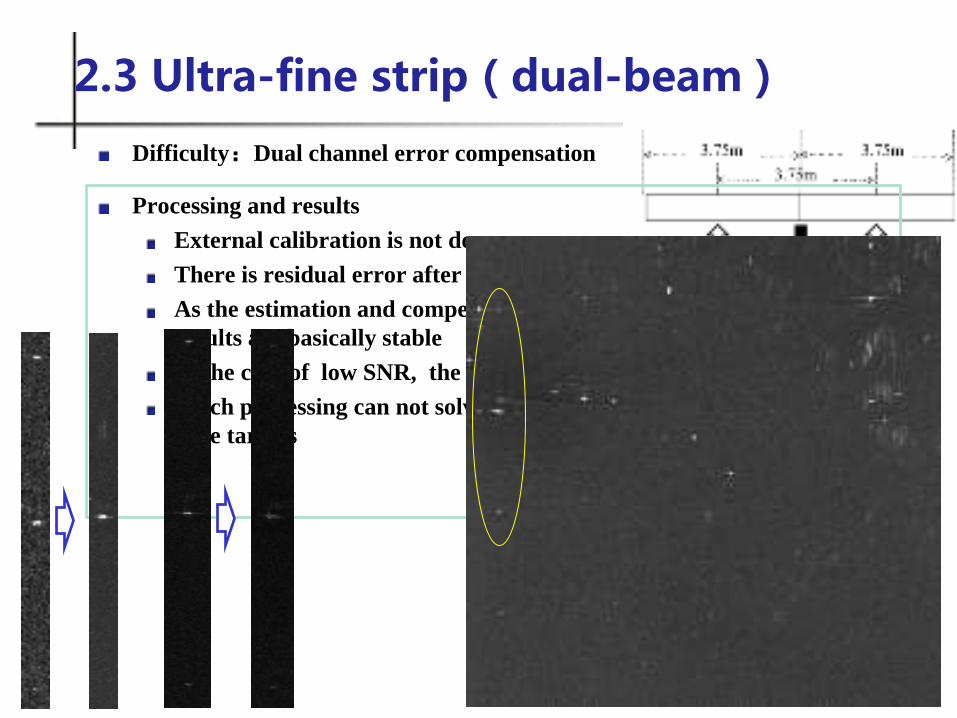
2.3 Ultra-fine strip(dual-beam)
Difficulty:Dual channel error compensation
Processing and results External calibration is not done There is residual error after the internal calibration compensation As the estimation and compensation is often turned on, the detection results are basically stable In the case of low SNR, the estimated deviation will be larger Batch processing can not solve the problem of moving targets and false targets
Before estimation and compensation After
9
2.3 Ultra-fine strip(dual-beam)
Difficulty:Dual channel error compensation
Processing and results External calibration is not done There is residual error after the internal calibration compensation As the estimation and compensation is often turned on, the detection results are basically stable In the case of low SNR, the estimated deviation will be larger Batch processing can not solve the problem of moving targets and false targets
9
10
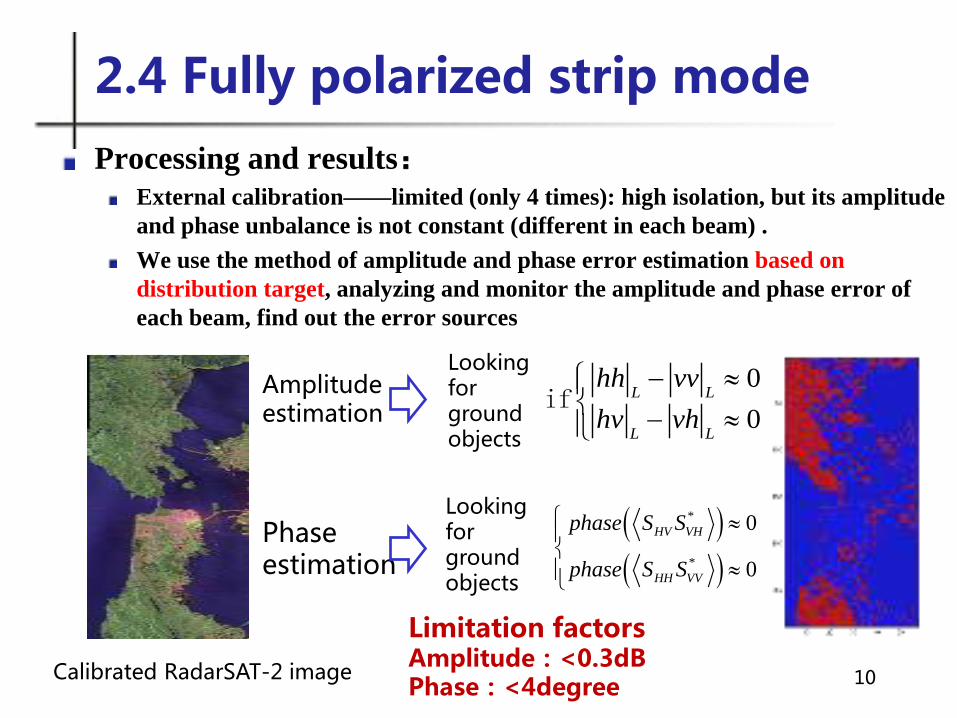
2.4 Fully polarized strip mode
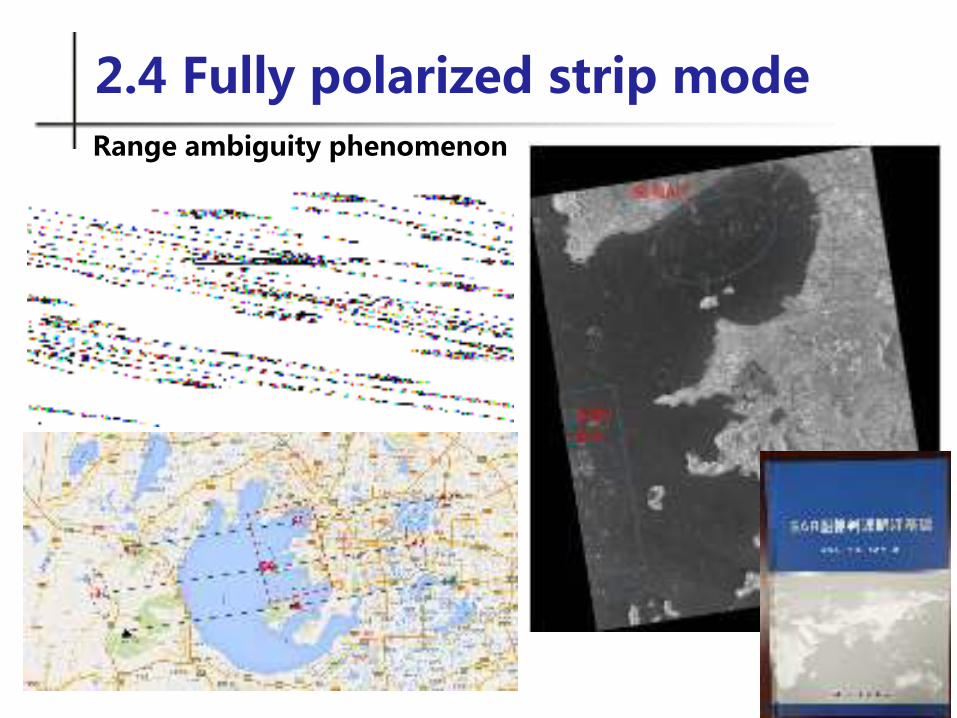
Processing and results: External calibration——limited (only 4 times): high isolation, but its amplitude and phase unbalance is not constant (different in each beam) . We use the method of amplitude and phase error estimation based on distribution target , analyzing and monitor the amplitude and phase error of each beam, find out the error sources
Calibrated RadarSAT-2 image
0
0L L
L L
hh vv
hv vh
− ≈ − ≈
ifAmplitude estimation
Looking for ground objects
Phase estimation
Looking for ground objects
( )( )
*
*
0
0
HV VH
HH VV
phase S S
phase S S
≈
≈
Limitation factors Amplitude:<0.3dB Phase:<4degree
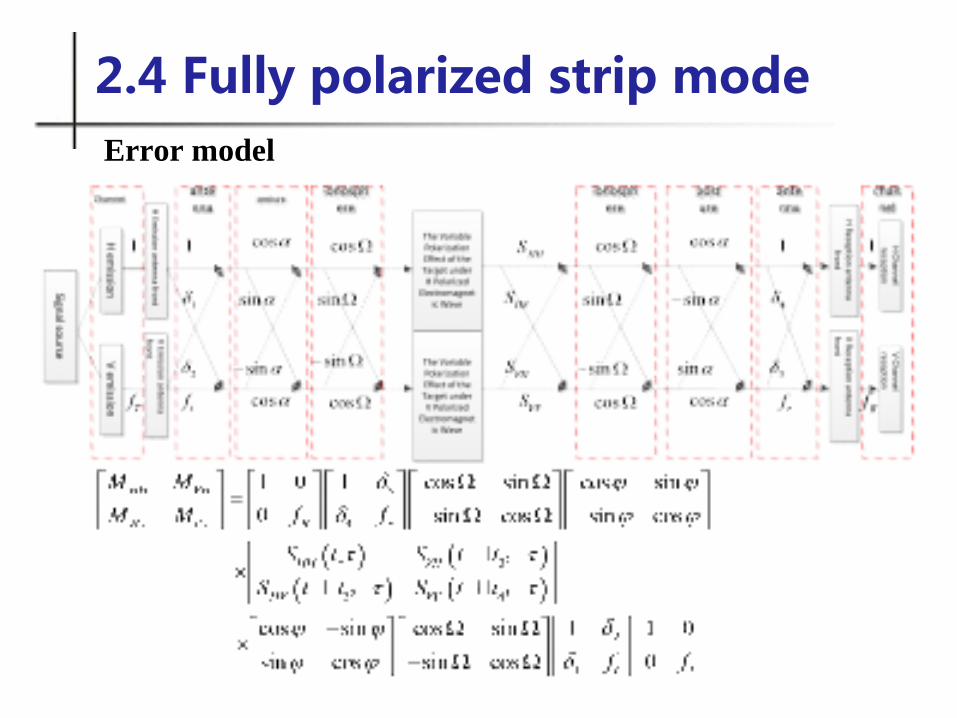
Error model
2.4 Fully polarized strip mode
12
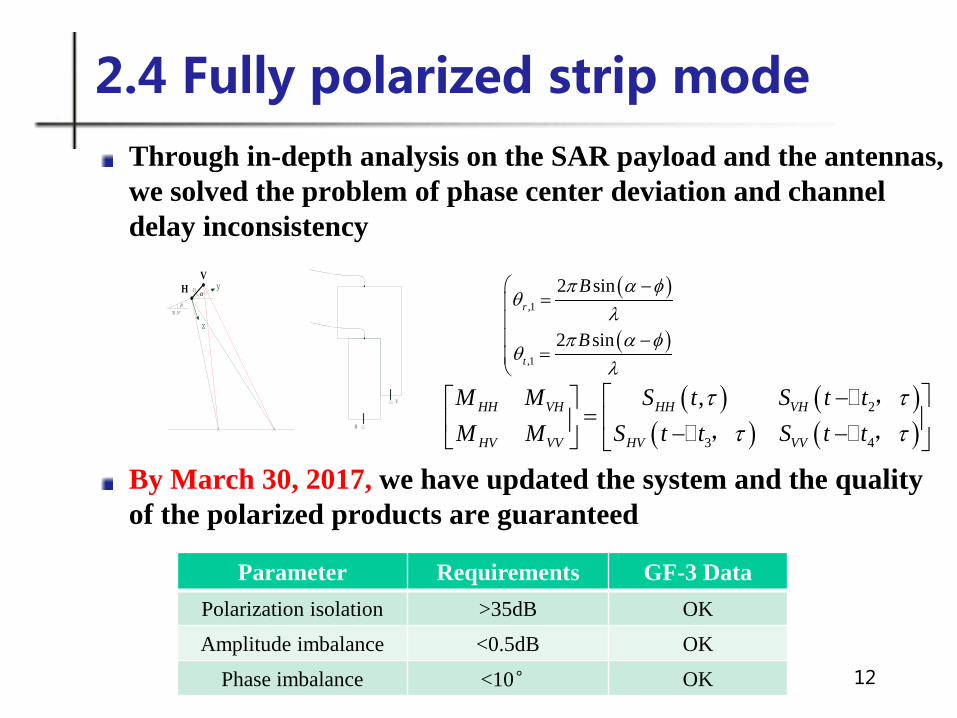
2.4 Fully polarized strip mode
Through in-depth analysis on the SAR payload and the antennas, we solved the problem of phase center deviation and channel delay inconsistency
By March 30, 2017, we have updated the system and the quality of the polarized products are guaranteed
z
yHV
31.5°
B αβ
H
V
( )
( ),1
,1
2 sin
2 sin
r
t
B
B
π α φθ
λπ α φ
θλ
−=
−
=
( ) ( )( ) ( )
2
3 4
,HH VH HH VH
HV VV HV VV
M M S t S t t
M M S t t S t t
τ ττ τ
− = − −
,
, ,
Parameter Requirements GF-3 Data
Polarization isolation >35dB OK
Amplitude imbalance <0.5dB OK
Phase imbalance <10° OK

13
2.4 Fully polarized strip mode
Notice:Different polarized channel data are quantized using different quantization peaks (see xml), see the manual for use.
DNimg = DN / QualifyValue * 32767
14
2.4 Fully polarized strip mode Range ambiguity phenomenon
15
2.5 ScanSAR mode
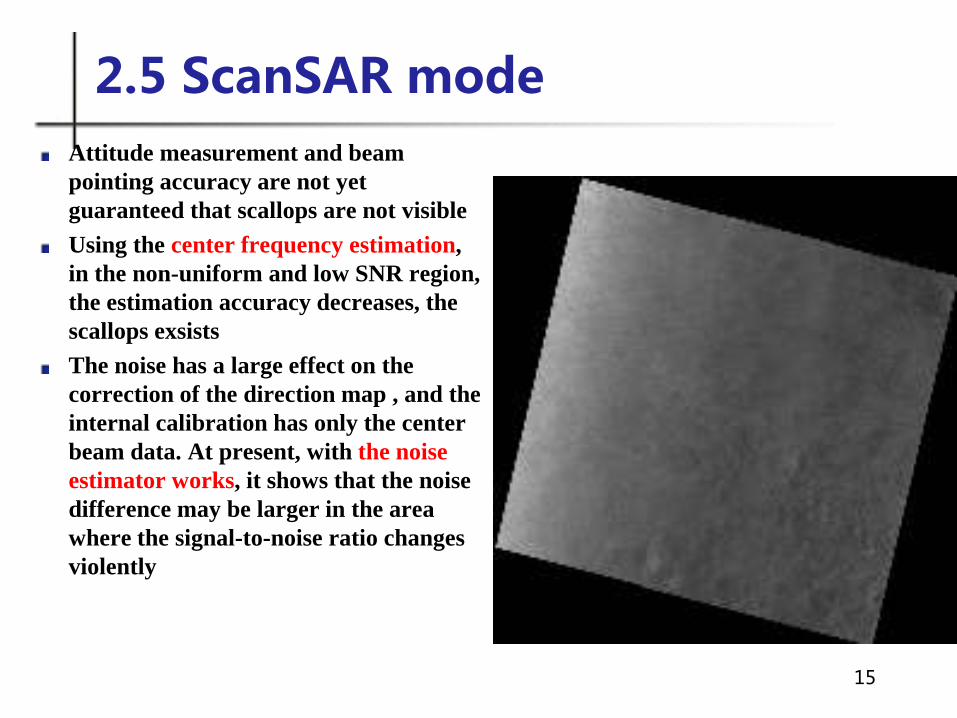
Attitude measurement and beam pointing accuracy are not yet guaranteed that scallops are not visible Using the center frequency estimation, in the non-uniform and low SNR region, the estimation accuracy decreases, the scallops exsists The noise has a large effect on the correction of the direction map , and the internal calibration has only the center beam data. At present, with the noise estimator works, it shows that the noise difference may be larger in the area where the signal-to-noise ratio changes violently

Outline
1、Introduction of GF-3 and Our Tasks
2、GF-3 data processing and analysis
3、Applications of GF-3 products
4、Summary

3.1 InSAR/DInSAR Processing
Commercial software Our research filter algorithm Coherence graph
Ground Phase removal by the original orbital data
Phase results using the processedOrbital data
rough DEM is used to remove the flat ground
phase
Song Shan :2 Huang Hua:4 Ning Bo:2

表1 平地DEM对比 表2 山区DEM对比
Comparison: average elevation error is 4 meters in flat
area, the average height error is about 30 meters in
mountain area.
SRTM's DEM
GF3 InSAR DEM
3.1 InSAR /DInSAR Processing

In Songshan mining area , mining led to ground subsidence, the red
frame within the circular area shown as the ground subsidence 3 cm
Figure2 Figure1
Songshan area results: using the proposed method, get a good coherent
results, observed some areas of the deformation, as shown below
3.1 InSAR/DInSAR Processing
20
GF
3 P
olar
izat
ion
Dat
a P
roce
ssin
g an
d A
naly
sis
file
Create a new document
Open the document
Data read
Image format conversion export
Pol
ariz
atio
n qu
ality
ev
alua
tion
Dom
inan
t sc
atte
ring
coef
ficie
nt
sepa
ratio
n
Spatial resolution quality
Radiation quality
Polarization channel quality
Polarization information enhancement effect
Corner reflector evaluation
Strong target evaluation
Radiation resolution
Dynamic Range
Noise level
Corner reflector evaluation
Regional evaluation
Color factor and information entropy
EPI
Backscatter retention capability
Pol
ariz
atio
n D
ecom
posi
tion
and
Syn
thes
is
Coherent decomposition
Noncoherent decomposition
Fine decomposition
Pseudo color synthesis
Polarization point target analysis
Scattered fine statistics Mean scattering characteristics
Scattering feature distribution
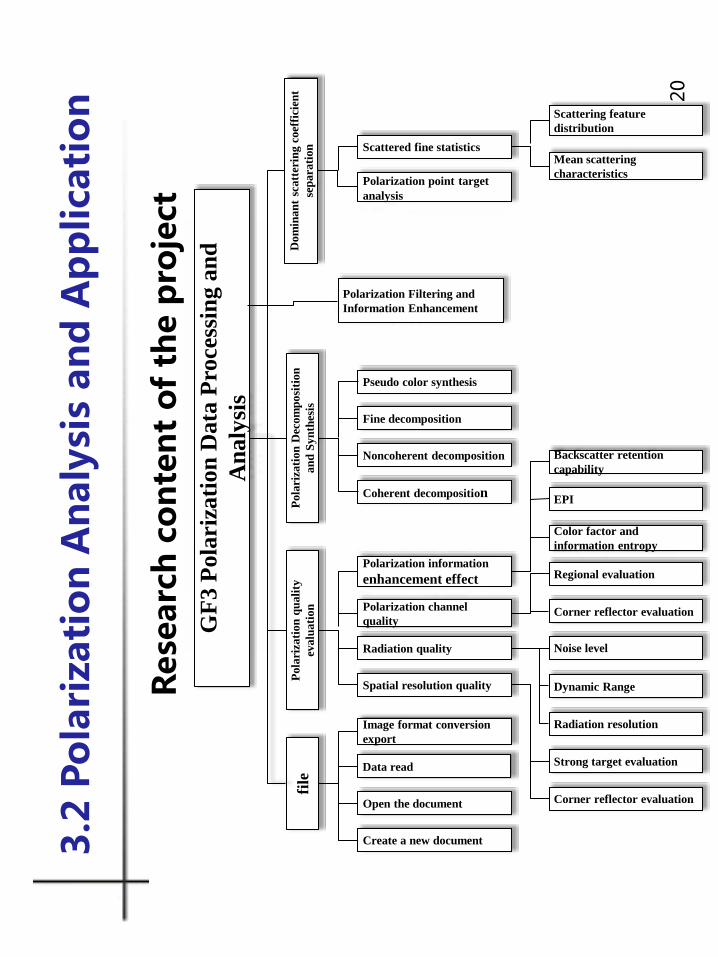
Rese
arc
h c
on
ten
t o
f th
e p
roje
ct
3.2
Po
lari
zati
on
An
aly
sis
an
d A
pp
lica
tio
n
Polarization Filtering and Information Enhancement
21
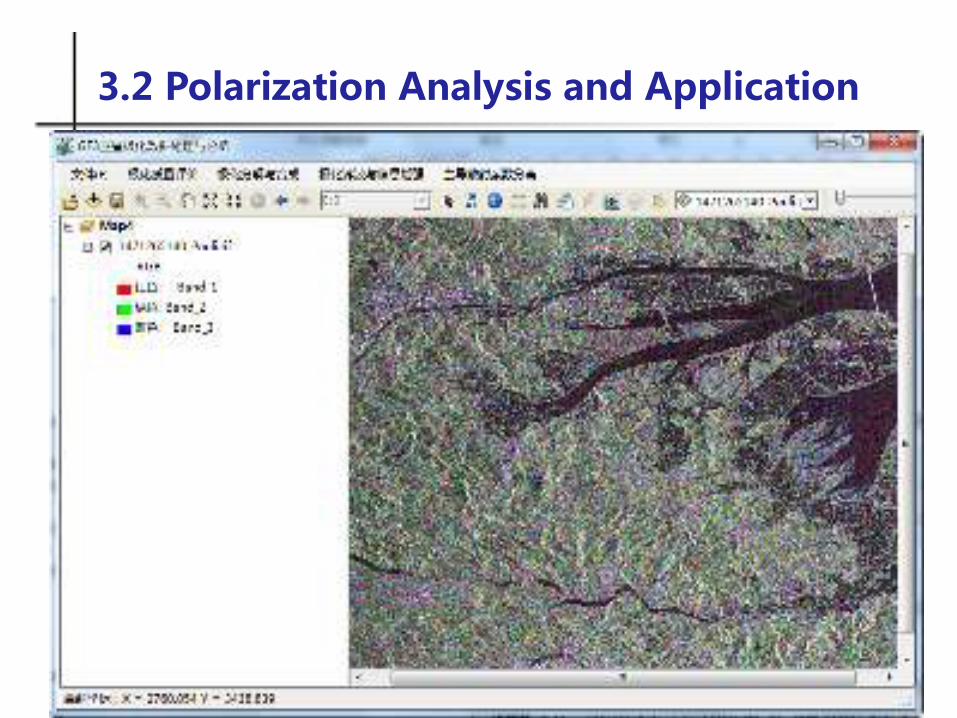
3.2 Polarization Analysis and Application
22
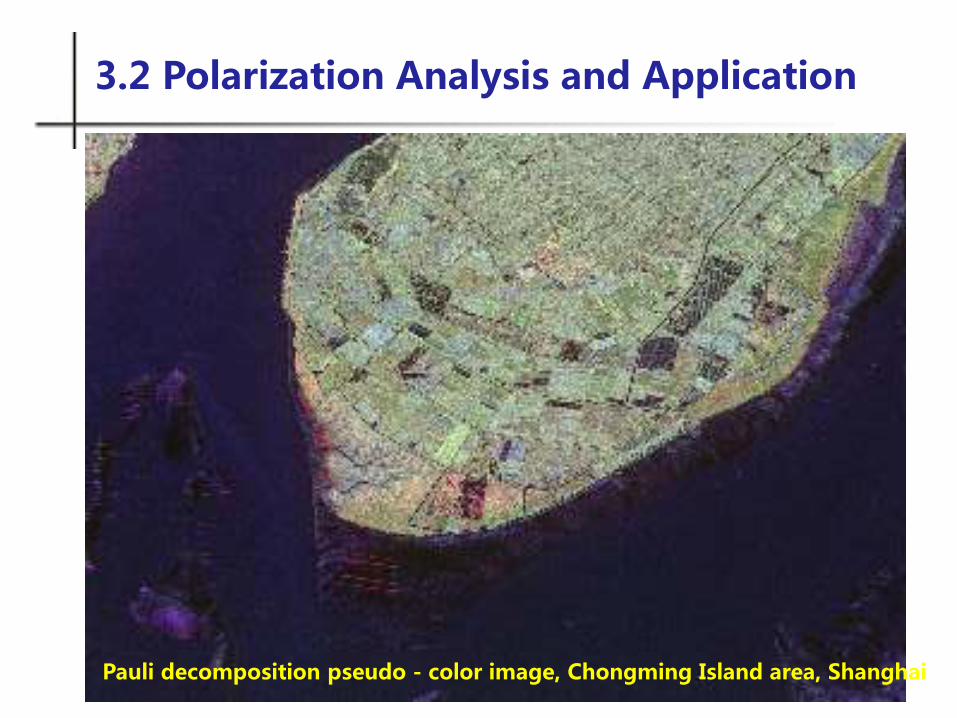
3.2 Polarization Analysis and Application
Pauli decomposition pseudo - color image, Chongming Island area, Shanghai
23
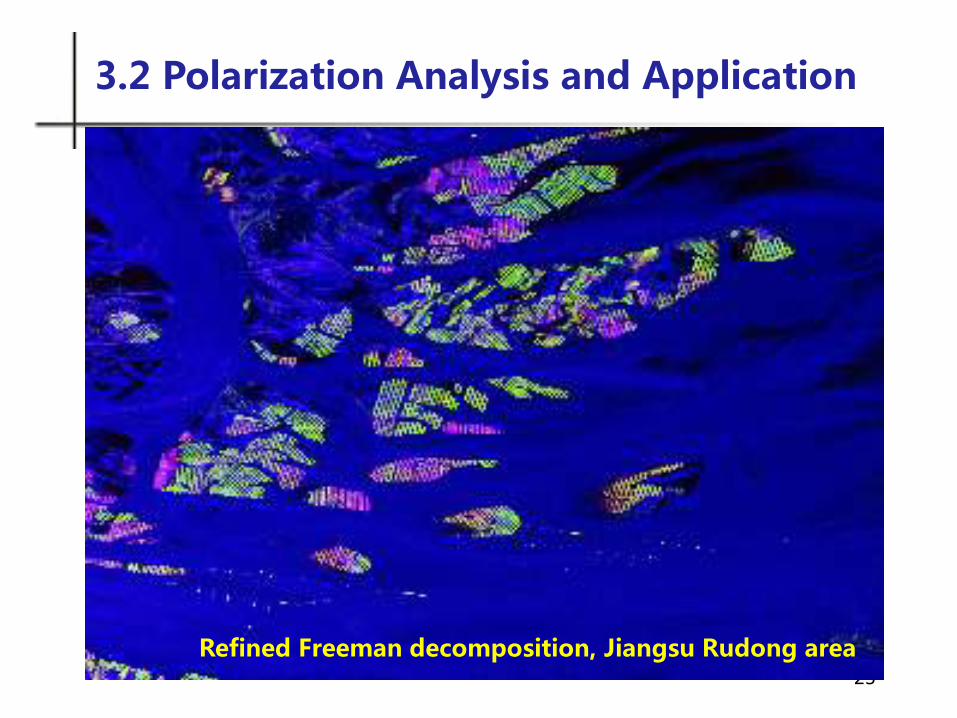
3.2 Polarization Analysis and Application
Refined Freeman decomposition, Jiangsu Rudong area
24
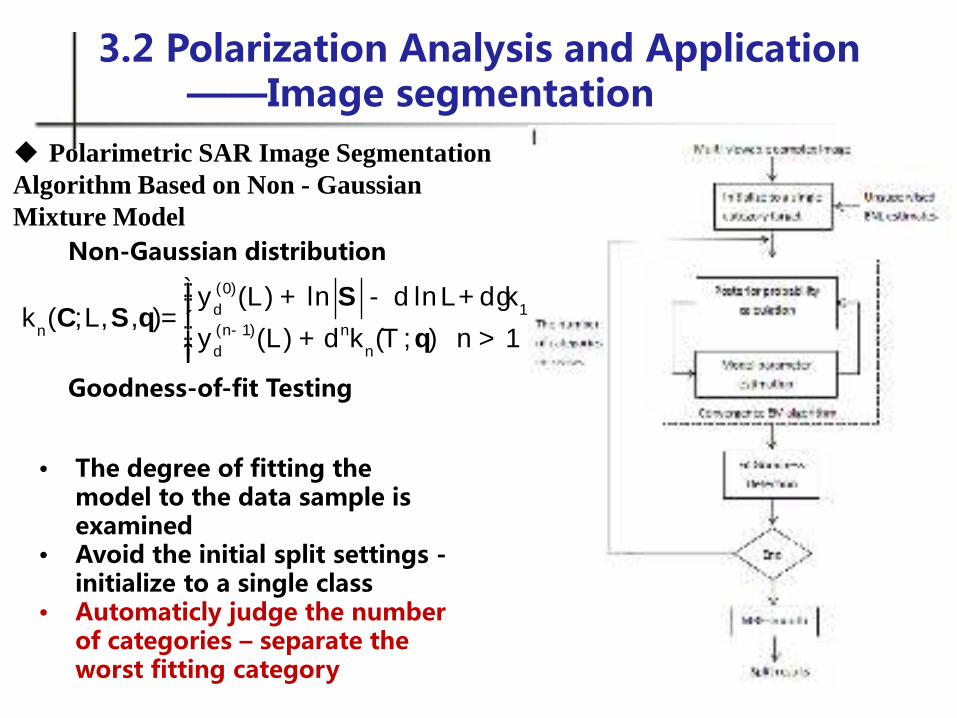
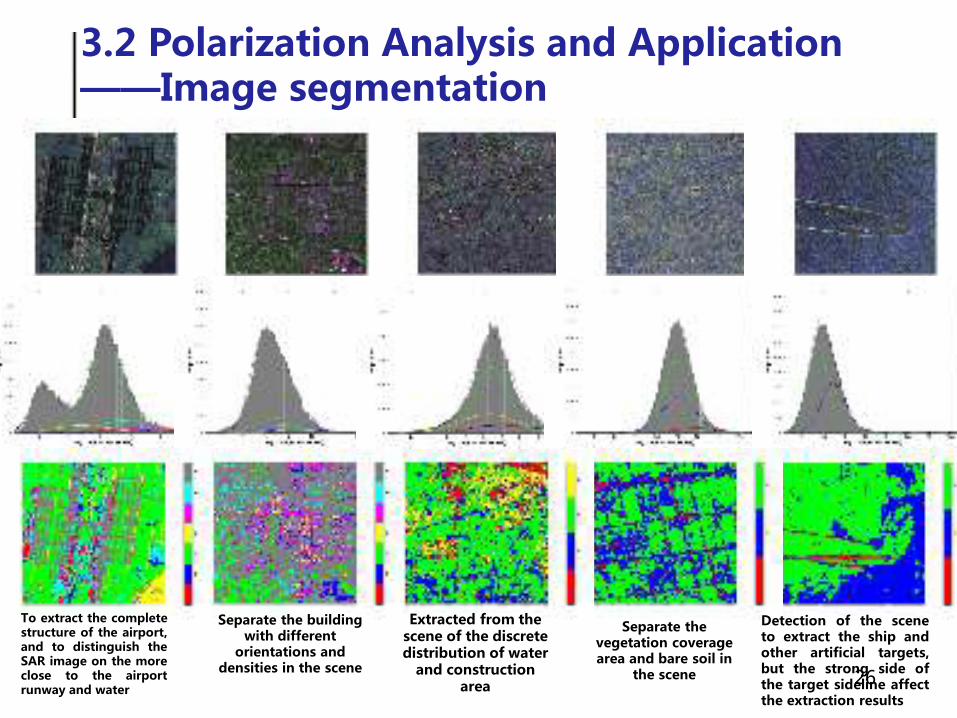
3.2 Polarization Analysis and Application ——Image segmentation
Polarimetric SAR Image Segmentation Algorithm Based on Non - Gaussian Mixture Model
(0)1
( 1)
( ) ln ln + ( ; ) 1( ; , , )=
( ) ( ; ) 1d
d
L d L d TL
L d Tn nnn
y k nk
y k n-
ìï + - =ïïíï + >ïïîC
S qS q
q
g
Non-Gaussian distribution
Goodness-of-fit Testing
• The degree of fitting the model to the data sample is examined
• Avoid the initial split settings - initialize to a single class
• Automaticly judge the number of categories – separate the worst fitting category
25
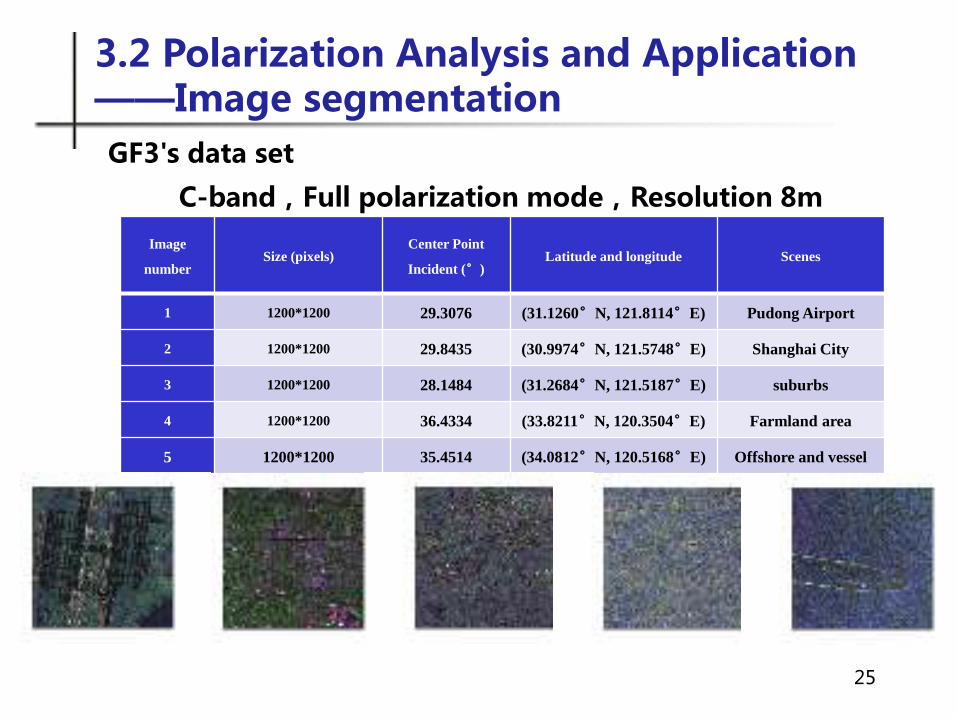
3.2 Polarization Analysis and Application ——Image segmentation
Image
number Size (pixels)
Center Point
Incident (°) Latitude and longitude Scenes
1 1200*1200 29.3076 (31.1260°N, 121.8114°E) Pudong Airport
2 1200*1200 29.8435 (30.9974°N, 121.5748°E) Shanghai City
3 1200*1200 28.1484 (31.2684°N, 121.5187°E) suburbs
4 1200*1200 36.4334 (33.8211°N, 120.3504°E) Farmland area
5 1200*1200 35.4514 (34.0812°N, 120.5168°E) Offshore and vessel
GF3's data set
C-band,Full polarization mode,Resolution 8m
26
3.2 Polarization Analysis and Application ——Image segmentation
To extract the complete structure of the airport, and to distinguish the SAR image on the more close to the airport runway and water
Separate the building with different
orientations and densities in the scene
Extracted from the scene of the discrete distribution of water
and construction area
Separate the vegetation coverage area and bare soil in
the scene
Detection of the scene to extract the ship and other artificial targets, but the strong side of the target sideline affect the extraction results
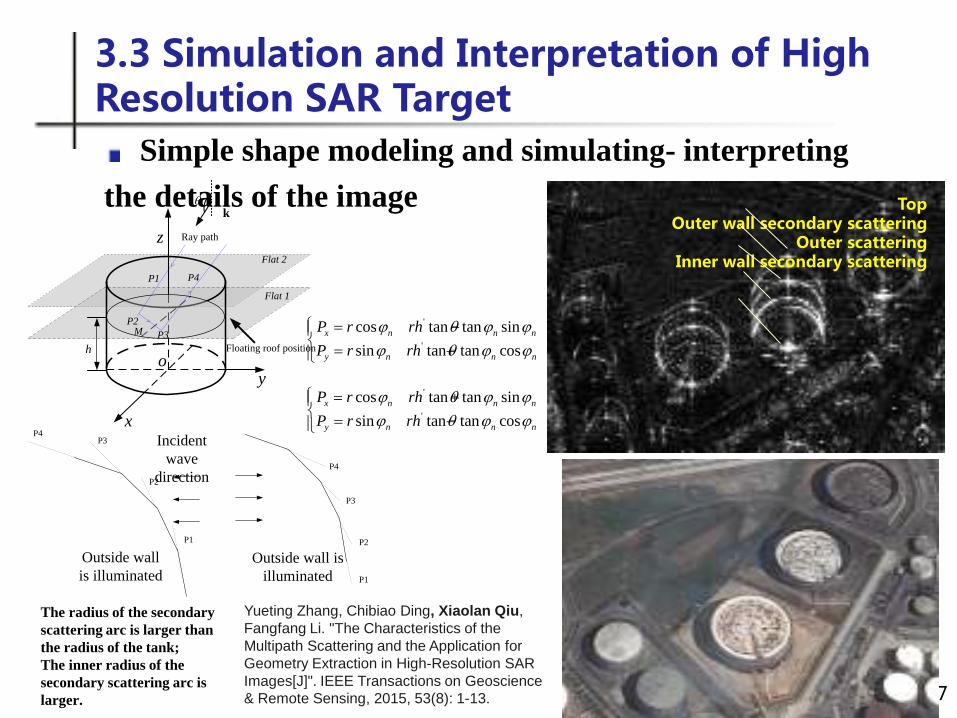
Simple shape modeling and simulating- interpreting the details of the image
27
kθ
o
x
y
z
Ray path
Flat 1
Flat 2
Floating roof position
P1
P2P3
P4
M
h
P1
P2
P3P4
P1
P2
P3
P4
Incident wave
direction
Outside wall is illuminated
Outside wall is illuminated
'
'
cos tan tan sin
sin tan tan cosx n n n
y n n n
P r rh
P r rh
ϕ θ ϕ ϕϕ θ ϕ ϕ
= − = +
'
'
cos tan tan sin
sin tan tan cosx n n n
y n n n
P r rh
P r rh
ϕ θ ϕ ϕϕ θ ϕ ϕ
= + = −
The radius of the secondary scattering arc is larger than the radius of the tank; The inner radius of the secondary scattering arc is larger.
Yueting Zhang, Chibiao Ding, Xiaolan Qiu, Fangfang Li. "The Characteristics of the Multipath Scattering and the Application for Geometry Extraction in High-Resolution SAR Images[J]". IEEE Transactions on Geoscience & Remote Sensing, 2015, 53(8): 1-13.
Top Outer wall secondary scattering
Outer scattering Inner wall secondary scattering
3.3 Simulation and Interpretation of High Resolution SAR Target

28
Simple shape modeling and simulating - interpreting the details of the image
3.3 Simulation and Interpretation of High Resolution SAR Target
Flat roof building 1: Simulation, Measurement and Markings
Flat roof building 2: Simulation, Measurement and Markings
Flat roof building 2: (a) Markings of feature A, B, C, D (b) Amplitude Comparison of simulation and measurement for each feature

29
Complex target modeling and simulating Method: 3D modeling + POVRay + PO method + point target impulse
response convolution According to the actual image, optimize the
model parameter settings
Actual image
Simulation image
MiniSAR
TerrsSAR-X
3.3 Simulation and Interpretation of High Resolution SAR Target
30
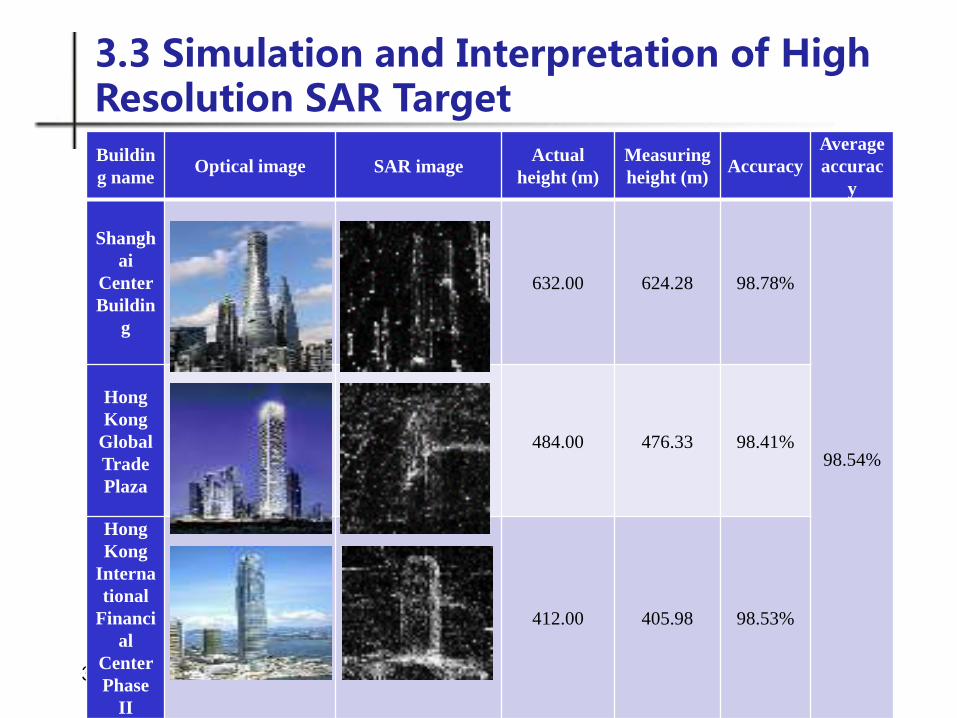
Building name
Optical image SAR image Actual
height (m) Measuring height (m)
Accuracy Average accurac
y
Shanghai
Center Buildin
g
632.00 624.28 98.78%
98.54%
Hong Kong
Global Trade Plaza
484.00 476.33 98.41%
Hong Kong
International
Financial
Center Phase
II
412.00 405.98 98.53%
3.3 Simulation and Interpretation of High Resolution SAR Target
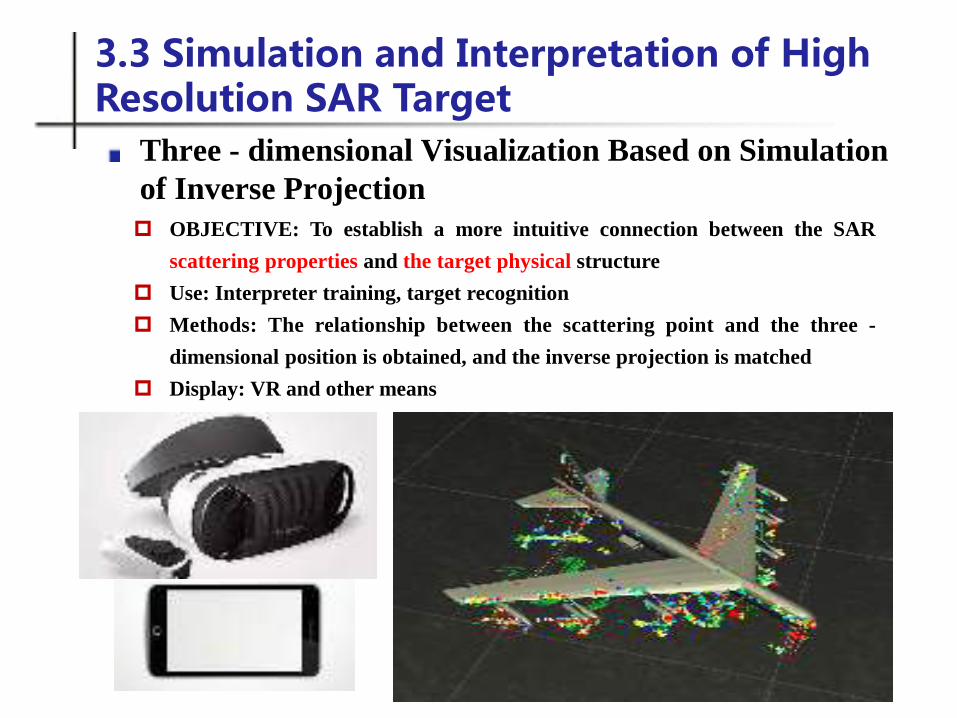
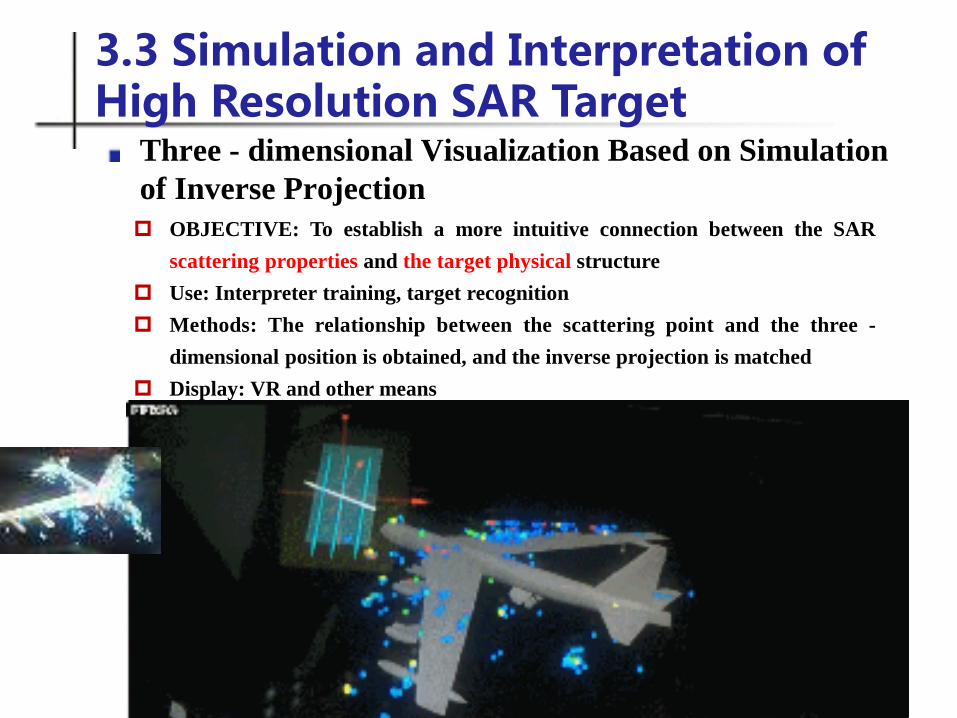
Three - dimensional Visualization Based on Simulation of Inverse Projection
31
OBJECTIVE : To establish a more intuitive connection between the SAR
scattering properties and the target physical structure
Use: Interpreter training, target recognition
Methods: The relationship between the scattering point and the three -
dimensional position is obtained, and the inverse projection is matched
Display: VR and other means
3.3 Simulation and Interpretation of High Resolution SAR Target
Three - dimensional Visualization Based on Simulation of Inverse Projection
3.3 Simulation and Interpretation of High Resolution SAR Target
OBJECTIVE : To establish a more intuitive connection between the SAR
scattering properties and the target physical structure
Use: Interpreter training, target recognition
Methods: The relationship between the scattering point and the three -
dimensional position is obtained, and the inverse projection is matched
Display: VR and other means
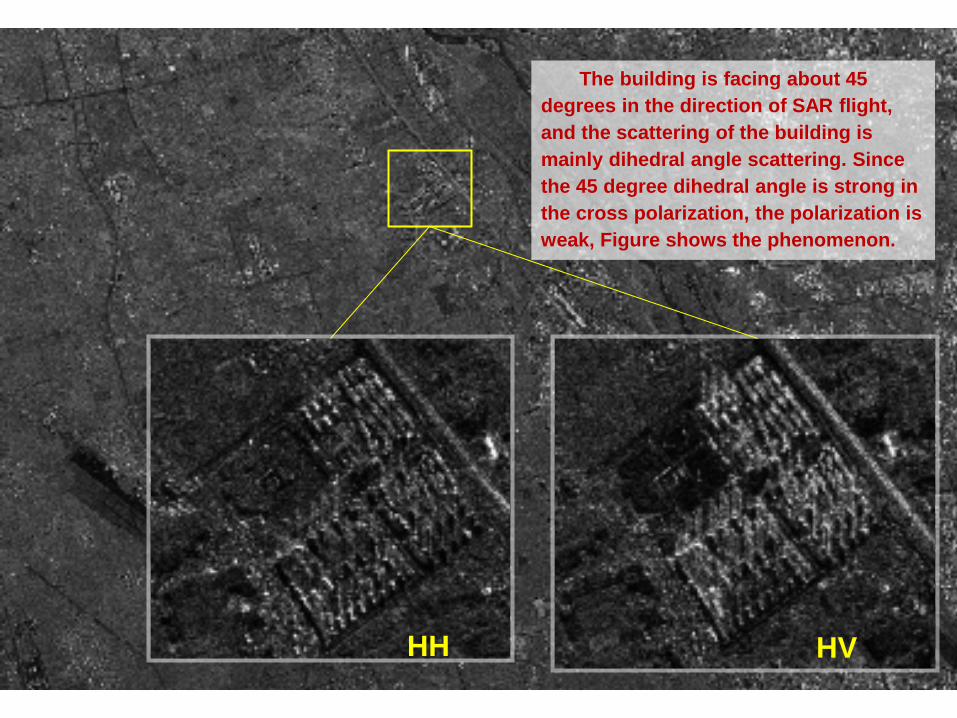
HV HH
The building is facing about 45 degrees in the direction of SAR flight, and the scattering of the building is mainly dihedral angle scattering. Since the 45 degree dihedral angle is strong in the cross polarization, the polarization is weak, Figure shows the phenomenon.
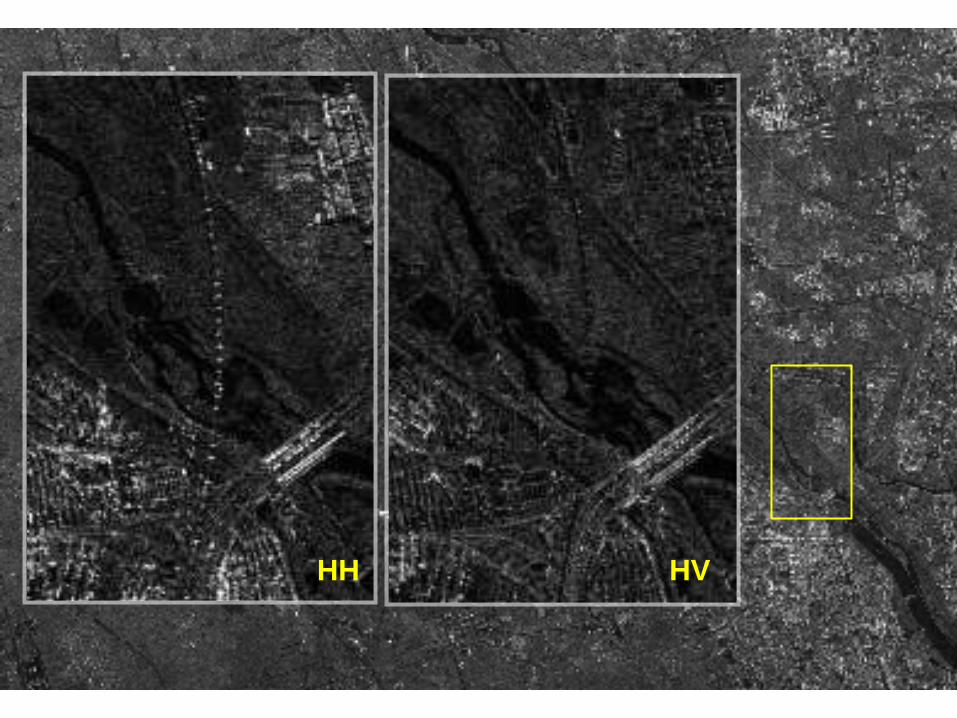
HH HV
35
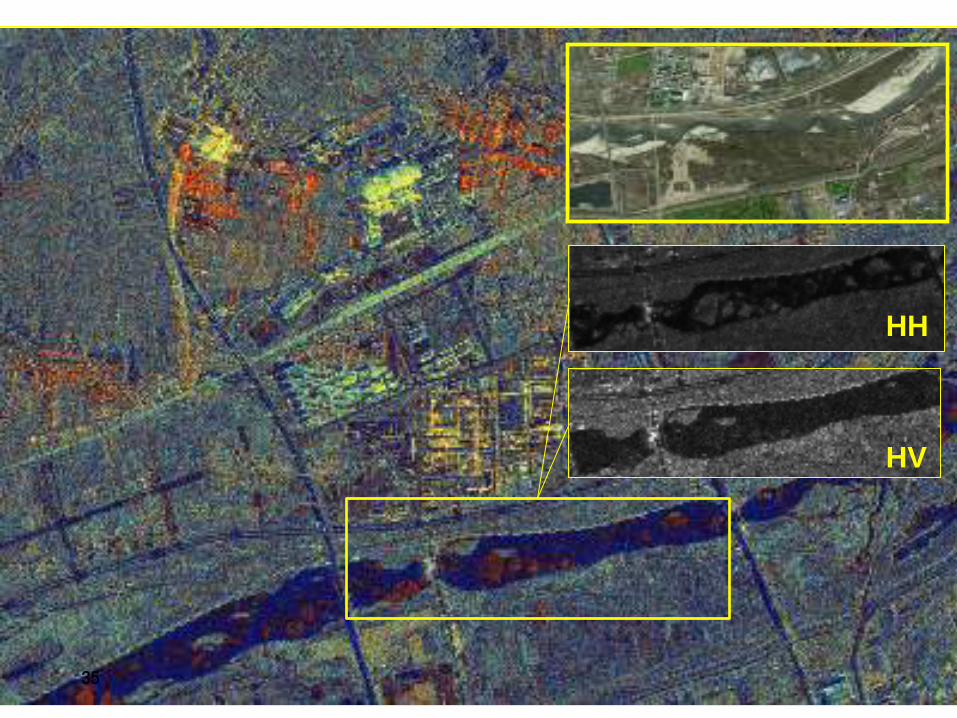
HH
HV

Outline
1、Introduction of GF-3 and Our Tasks
2、GF-3 data processing and analysis
3、Applications of GF-3 products
4、Summary
Outline
1、Intriduction of GF-3 and Our Lab’s Task
2、GF-3 data processing and analysis
3、Application of GF-3 satellite
4、Summary
My colleagues and I will continue to focus on the critical
requirements from Gaofeng-3 application, to improve the
quality of our satellite products, and to refine our
information extracting toolset. Our ongoing research on
calibration of system based on big data mining have also
made some progress. We hope to bring more values to all
customs of our SAR satellite and the up-coming
constellation.
38
4. Summary