Embed Size (px)
Citation preview
CSAT DI & LR 01
1 © Copyright 2011.Think & Learn Pvt. Ltd. Copying or Reproduction without the prior permission of the author is prohibited
DATA INTERPRETATION-BASICS
Data Interpretation deals with the understanding, organizing and interpreting of the given data so as to arrive at meaningful conclusions.
Data Interpretation skills are important to an IAS aspirant, as day in and out, a civil service officer is expected to have a good control over the analysis of data and deduction of meaningful conclusions from the myriad representations of information. Honing your skills in Data Interpretation is a three step process 1) Understanding the different modes of representation of data and linking of information across two or more graphs. 2) Improving your calculation speed 3) Practice to perfection so that you learn to pick the right questions and maximize your attempts with good accuracy.
Types of representation of data Data can be represented in multitude ways, including tables and different charts. We will look at the different representations of data in this section. 1) The Bar family
A bar chart or bar graph is a chart with rectangular bars with lengths proportional to the values that they represent.
The bars can be plotted vertically or horizontally. Bar charts are used for plotting discrete (or 'discontinuous') data
which has discrete values and is not continuous
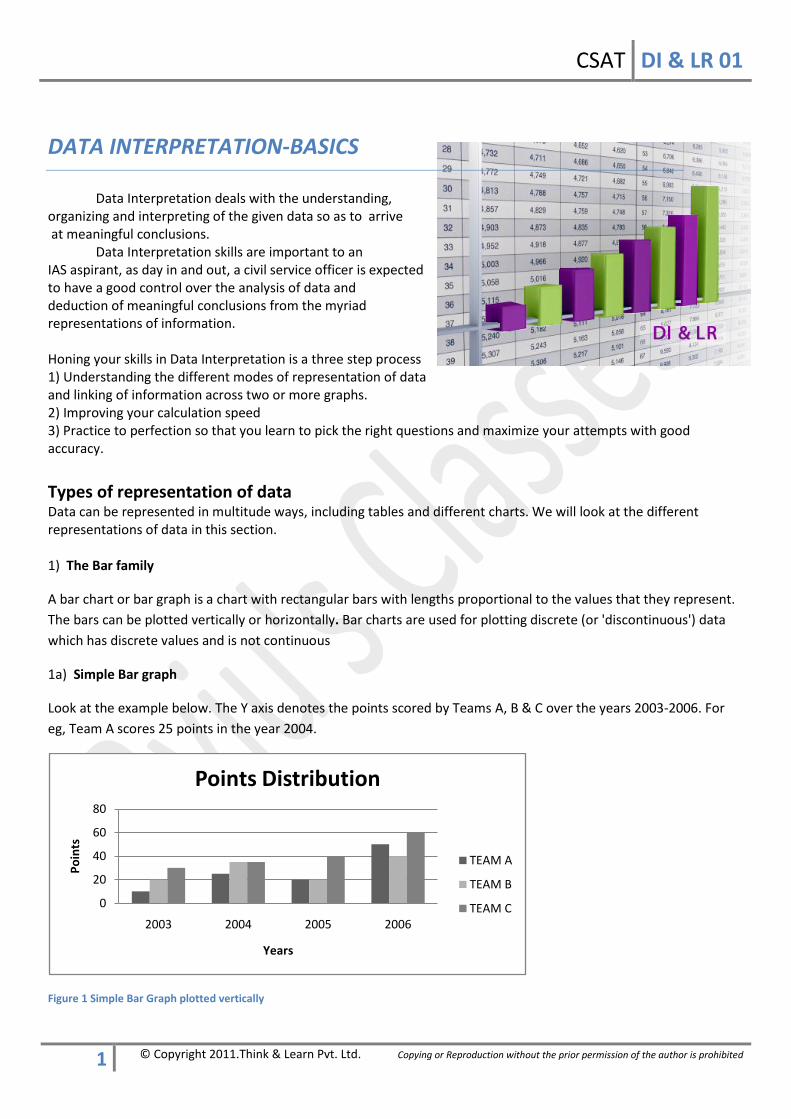
1a) Simple Bar graph
Look at the example below. The Y axis denotes the points scored by Teams A, B & C over the years 2003-2006. For
eg, Team A scores 25 points in the year 2004.
Figure 1 Simple Bar Graph plotted vertically
0
20
40
60
80
2003 2004 2005 2006
Po
ints
Years
Points Distribution
TEAM A
TEAM B
TEAM C
CSAT DI & LR 01
2 © Copyright 2011.Think & Learn Pvt. Ltd. Copying or Reproduction without the prior permission of the author is prohibited
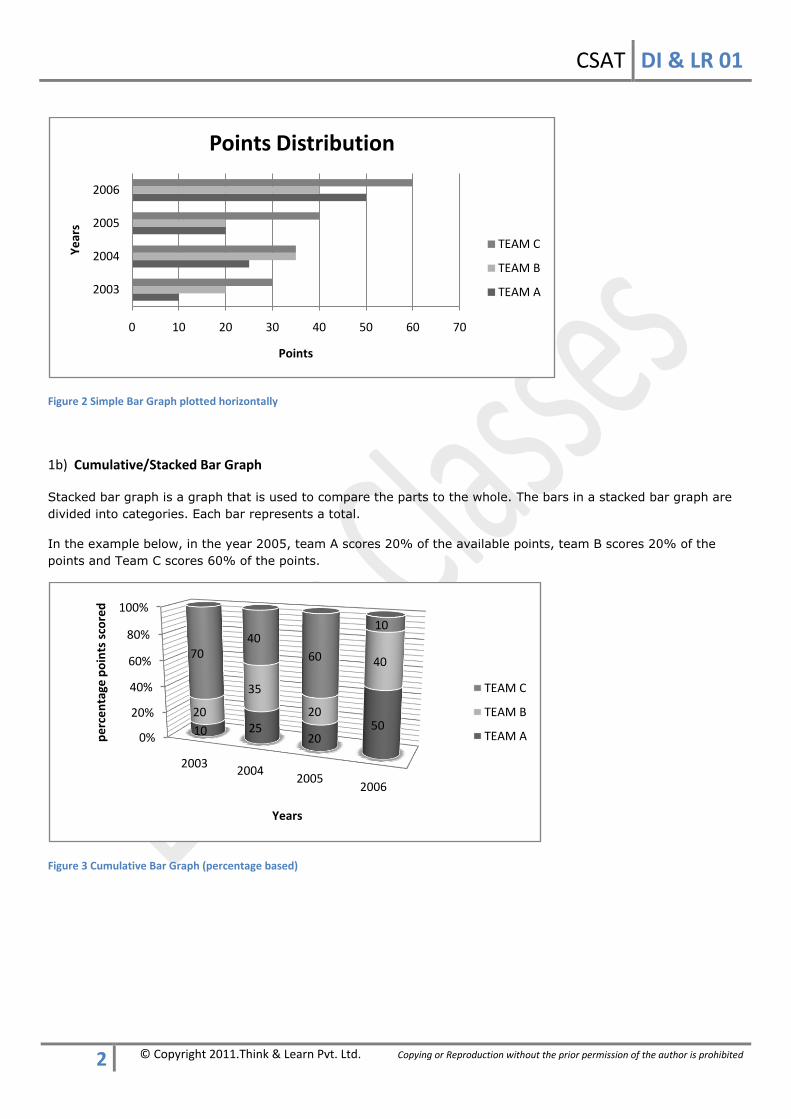
Figure 2 Simple Bar Graph plotted horizontally
1b) Cumulative/Stacked Bar Graph
Stacked bar graph is a graph that is used to compare the parts to the whole. The bars in a stacked bar graph are
divided into categories. Each bar represents a total.
In the example below, in the year 2005, team A scores 20% of the available points, team B scores 20% of the
points and Team C scores 60% of the points.
Figure 3 Cumulative Bar Graph (percentage based)
0 10 20 30 40 50 60 70
2003
2004
2005
2006
Points
Ye
ars
Points Distribution
TEAM C
TEAM B
TEAM A
0%
20%
40%
60%
80%
100%
20032004
20052006
10 2520
5020
35
20
4070
40
60
10
pe
rce
nta
ge p
oin
ts s
core
d
Years
TEAM C
TEAM B
TEAM A
CSAT DI & LR 01
3 © Copyright 2011.Think & Learn Pvt. Ltd. Copying or Reproduction without the prior permission of the author is prohibited
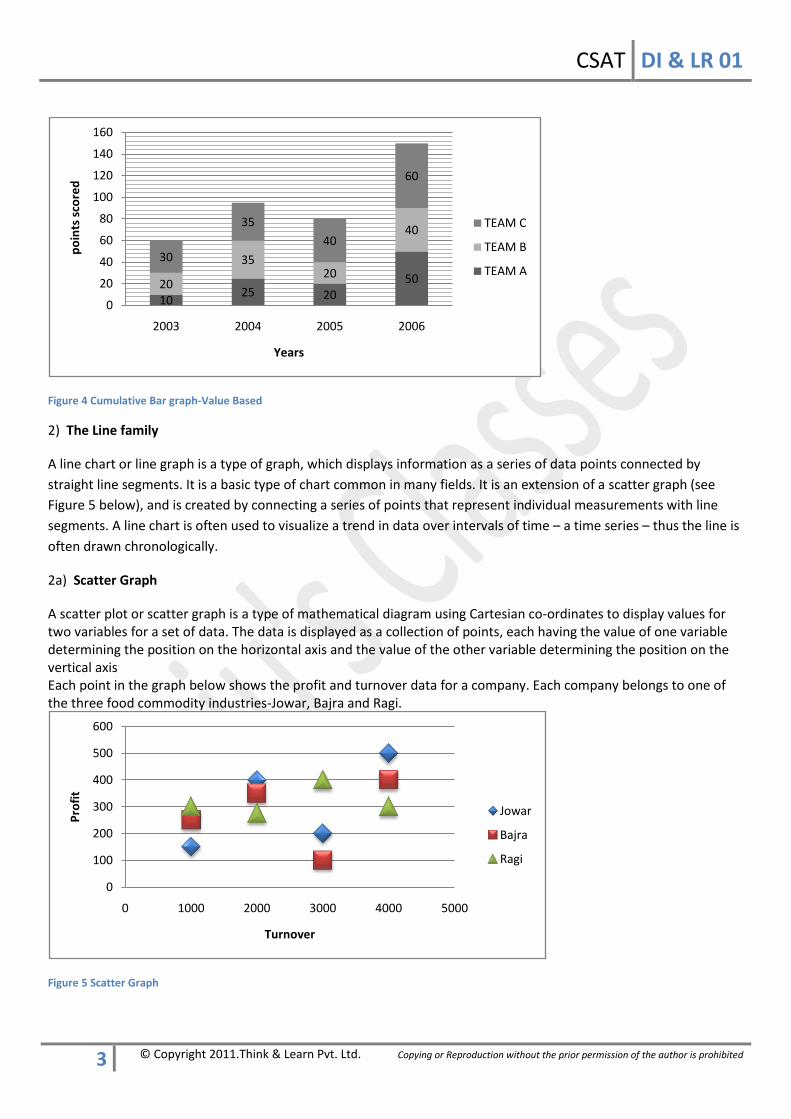
Figure 4 Cumulative Bar graph-Value Based
2) The Line family
A line chart or line graph is a type of graph, which displays information as a series of data points connected by
straight line segments. It is a basic type of chart common in many fields. It is an extension of a scatter graph (see
Figure 5 below), and is created by connecting a series of points that represent individual measurements with line
segments. A line chart is often used to visualize a trend in data over intervals of time – a time series – thus the line is
often drawn chronologically.
2a) Scatter Graph
A scatter plot or scatter graph is a type of mathematical diagram using Cartesian co-ordinates to display values for two variables for a set of data. The data is displayed as a collection of points, each having the value of one variable determining the position on the horizontal axis and the value of the other variable determining the position on the vertical axis Each point in the graph below shows the profit and turnover data for a company. Each company belongs to one of the three food commodity industries-Jowar, Bajra and Ragi.
Figure 5 Scatter Graph
1025 20
5020
3520
40
30
35
40
60
0
20
40
60
80
100
120
140
160
2003 2004 2005 2006
po
ints
sco
red
Years
TEAM C
TEAM B
TEAM A
0
100
200
300
400
500
600
0 1000 2000 3000 4000 5000
Pro
fit
Turnover
Jowar
Bajra
Ragi
CSAT DI & LR 01
4 © Copyright 2011.Think & Learn Pvt. Ltd. Copying or Reproduction without the prior permission of the author is prohibited
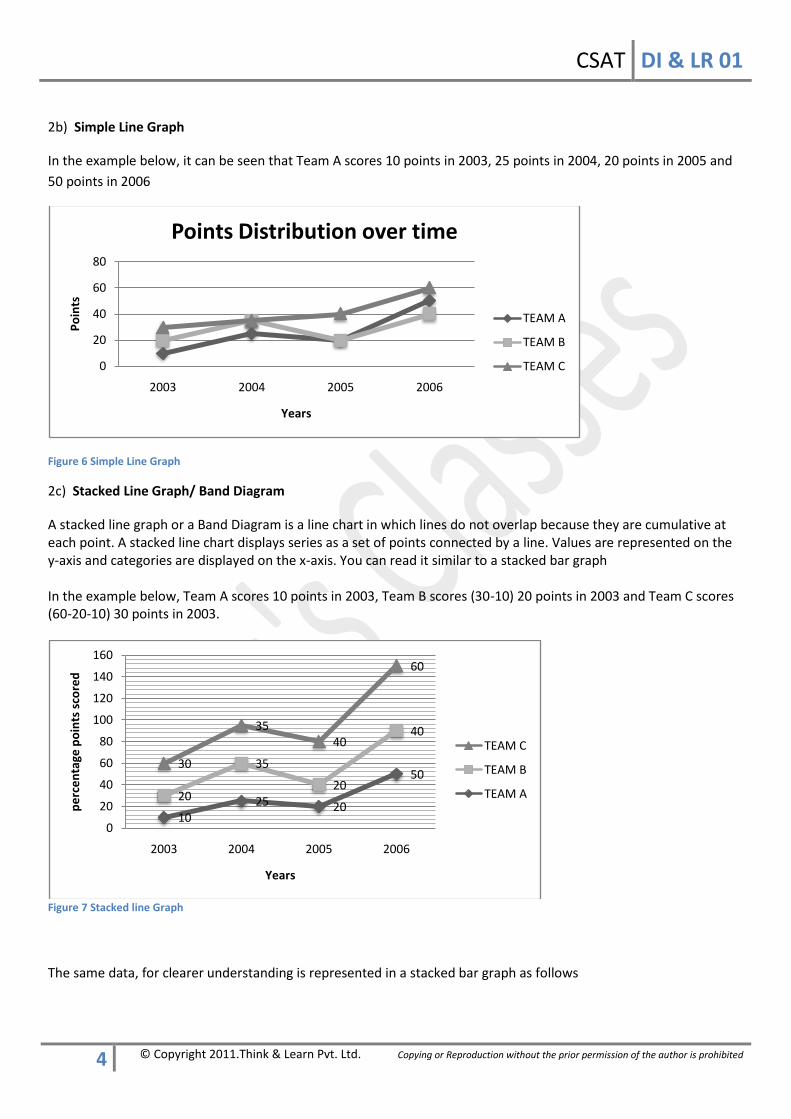
2b) Simple Line Graph
In the example below, it can be seen that Team A scores 10 points in 2003, 25 points in 2004, 20 points in 2005 and
50 points in 2006
Figure 6 Simple Line Graph
2c) Stacked Line Graph/ Band Diagram
A stacked line graph or a Band Diagram is a line chart in which lines do not overlap because they are cumulative at each point. A stacked line chart displays series as a set of points connected by a line. Values are represented on the y-axis and categories are displayed on the x-axis. You can read it similar to a stacked bar graph In the example below, Team A scores 10 points in 2003, Team B scores (30-10) 20 points in 2003 and Team C scores (60-20-10) 30 points in 2003.
Figure 7 Stacked line Graph
The same data, for clearer understanding is represented in a stacked bar graph as follows
0
20
40
60
80
2003 2004 2005 2006
Po
ints
Years
Points Distribution over time
TEAM A
TEAM B
TEAM C
1025 20
50
20
35
20
40
30
3540
60
0
20
40
60
80
100
120
140
160
2003 2004 2005 2006
pe
rce
nta
ge p
oin
ts s
core
d
Years
TEAM C
TEAM B
TEAM A
CSAT DI & LR 01
5 © Copyright 2011.Think & Learn Pvt. Ltd. Copying or Reproduction without the prior permission of the author is prohibited
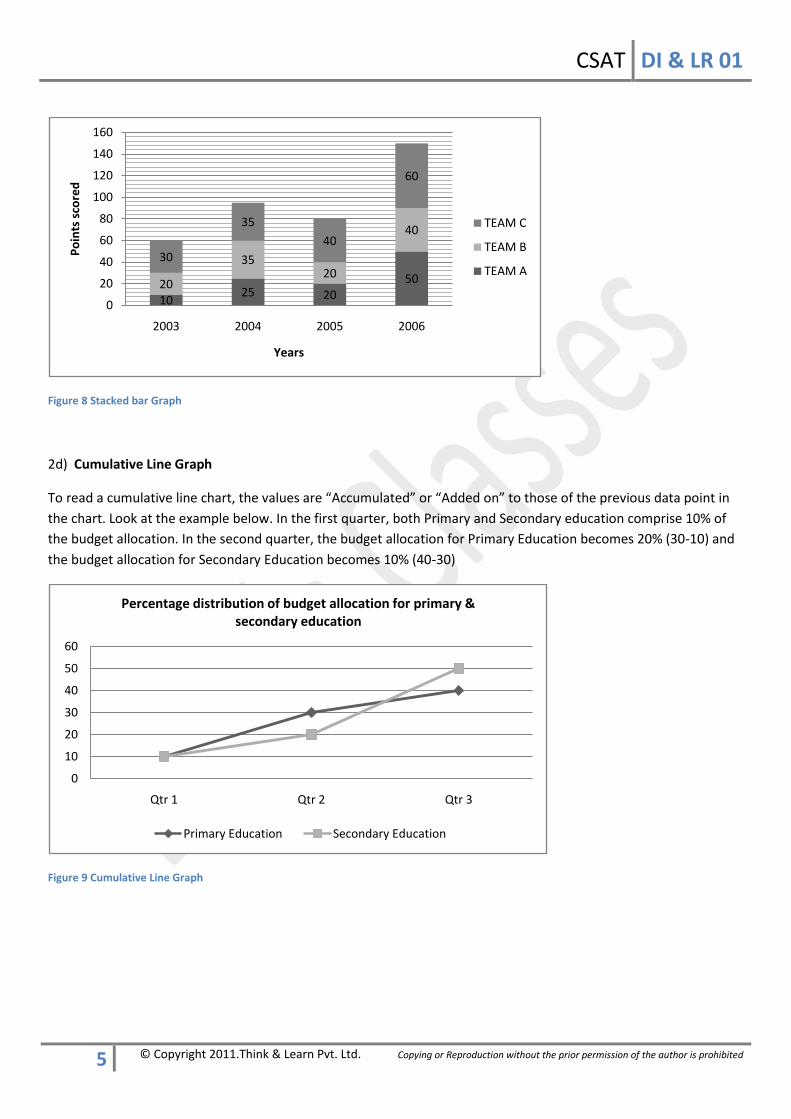
Figure 8 Stacked bar Graph
2d) Cumulative Line Graph
To read a cumulative line chart, the values are “Accumulated” or “Added on” to those of the previous data point in
the chart. Look at the example below. In the first quarter, both Primary and Secondary education comprise 10% of
the budget allocation. In the second quarter, the budget allocation for Primary Education becomes 20% (30-10) and
the budget allocation for Secondary Education becomes 10% (40-30)
Figure 9 Cumulative Line Graph
1025 20
5020
3520
40
30
35
40
60
0
20
40
60
80
100
120
140
160
2003 2004 2005 2006
Po
ints
sco
red
Years
TEAM C
TEAM B
TEAM A
0
10
20
30
40
50
60
Qtr 1 Qtr 2 Qtr 3
Percentage distribution of budget allocation for primary & secondary education
Primary Education Secondary Education
CSAT DI & LR 01
6 © Copyright 2011.Think & Learn Pvt. Ltd. Copying or Reproduction without the prior permission of the author is prohibited
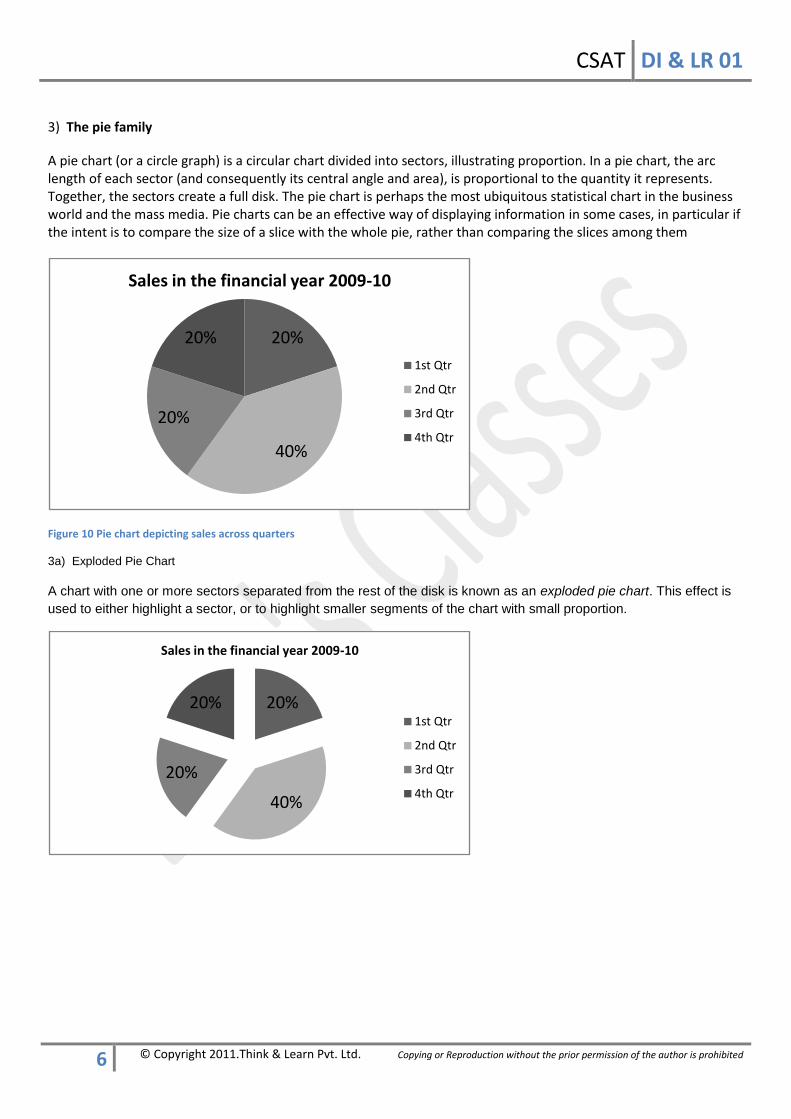
3) The pie family
A pie chart (or a circle graph) is a circular chart divided into sectors, illustrating proportion. In a pie chart, the arc length of each sector (and consequently its central angle and area), is proportional to the quantity it represents. Together, the sectors create a full disk. The pie chart is perhaps the most ubiquitous statistical chart in the business world and the mass media. Pie charts can be an effective way of displaying information in some cases, in particular if the intent is to compare the size of a slice with the whole pie, rather than comparing the slices among them
Figure 10 Pie chart depicting sales across quarters
3a) Exploded Pie Chart
A chart with one or more sectors separated from the rest of the disk is known as an exploded pie chart. This effect is
used to either highlight a sector, or to highlight smaller segments of the chart with small proportion.
20%
40%
20%
20%
Sales in the financial year 2009-10
1st Qtr
2nd Qtr
3rd Qtr
4th Qtr
20%
40%
20%
20%
Sales in the financial year 2009-10
1st Qtr
2nd Qtr
3rd Qtr
4th Qtr
CSAT DI & LR 01
7 © Copyright 2011.Think & Learn Pvt. Ltd. Copying or Reproduction without the prior permission of the author is prohibited
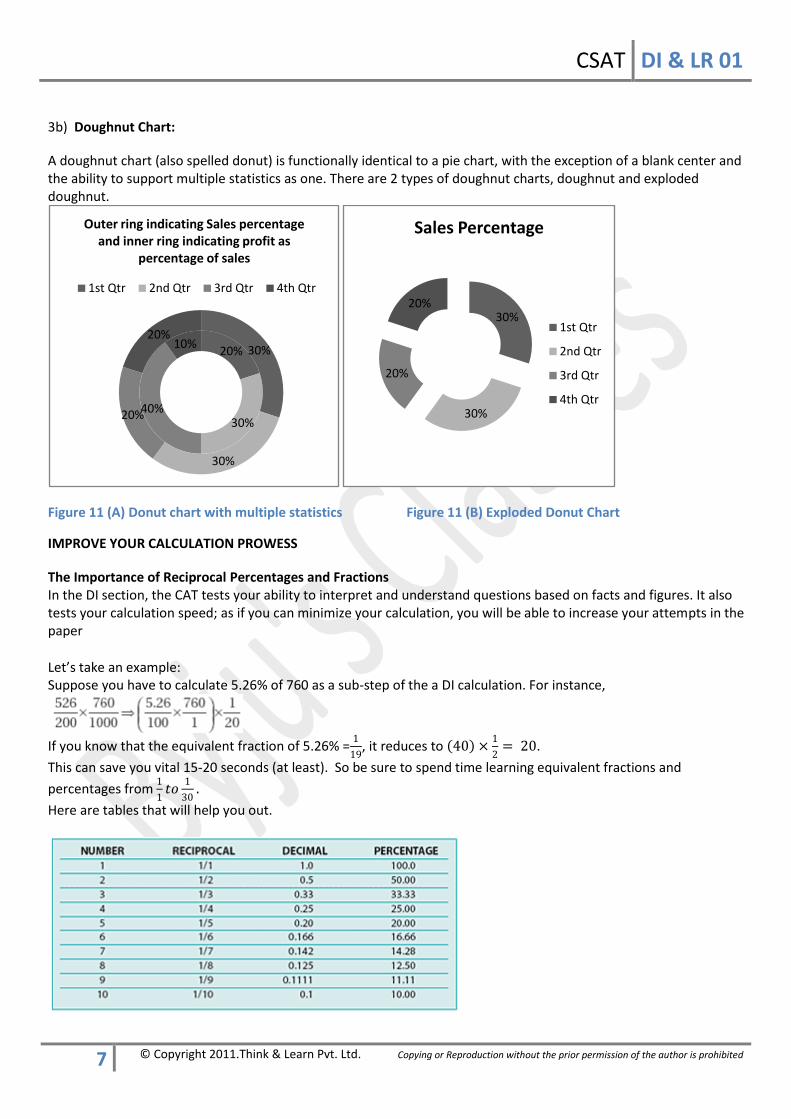
3b) Doughnut Chart:
A doughnut chart (also spelled donut) is functionally identical to a pie chart, with the exception of a blank center and the ability to support multiple statistics as one. There are 2 types of doughnut charts, doughnut and exploded doughnut.
Figure 11 (A) Donut chart with multiple statistics Figure 11 (B) Exploded Donut Chart
IMPROVE YOUR CALCULATION PROWESS
The Importance of Reciprocal Percentages and Fractions In the DI section, the CAT tests your ability to interpret and understand questions based on facts and figures. It also tests your calculation speed; as if you can minimize your calculation, you will be able to increase your attempts in the paper
Let’s take an example: Suppose you have to calculate 5.26% of 760 as a sub-step of the a DI calculation. For instance,
If you know that the equivalent fraction of 5.26% =
1
19, it reduces to 40 ×
1
2= 20.
This can save you vital 15-20 seconds (at least). So be sure to spend time learning equivalent fractions and
percentages from 1
1𝑡𝑜
1
30.
Here are tables that will help you out.
20%
30%40%
10% 30%
30%
20%
20%
Outer ring indicating Sales percentage and inner ring indicating profit as
percentage of sales
1st Qtr 2nd Qtr 3rd Qtr 4th Qtr
30%
30%
20%
20%
Sales Percentage
1st Qtr
2nd Qtr
3rd Qtr
4th Qtr
CSAT DI & LR 01
8 © Copyright 2011.Think & Learn Pvt. Ltd. Copying or Reproduction without the prior permission of the author is prohibited
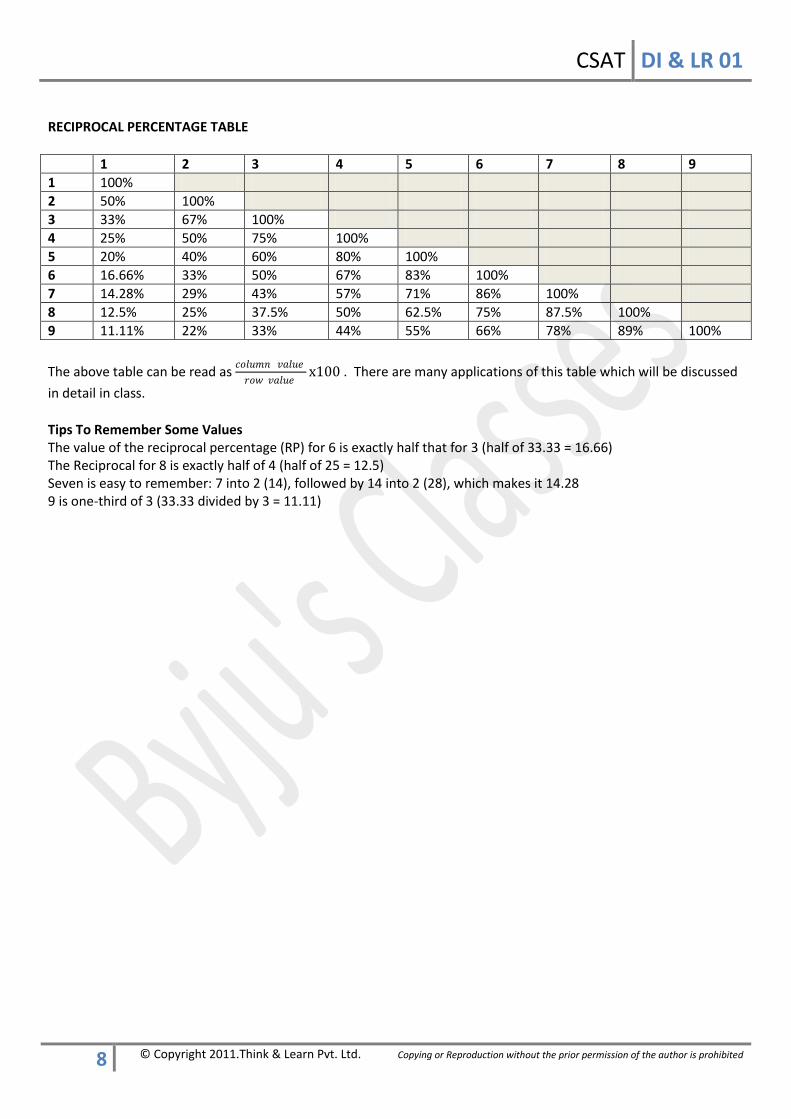
RECIPROCAL PERCENTAGE TABLE
1 2 3 4 5 6 7 8 9
1 100%
2 50% 100%
3 33% 67% 100%
4 25% 50% 75% 100%
5 20% 40% 60% 80% 100%
6 16.66% 33% 50% 67% 83% 100%
7 14.28% 29% 43% 57% 71% 86% 100%
8 12.5% 25% 37.5% 50% 62.5% 75% 87.5% 100%
9 11.11% 22% 33% 44% 55% 66% 78% 89% 100%
The above table can be read as 𝑐𝑜𝑙𝑢𝑚𝑛 𝑣𝑎𝑙𝑢𝑒
𝑟𝑜𝑤 𝑣𝑎𝑙𝑢𝑒x100 . There are many applications of this table which will be discussed
in detail in class.
Tips To Remember Some Values The value of the reciprocal percentage (RP) for 6 is exactly half that for 3 (half of 33.33 = 16.66) The Reciprocal for 8 is exactly half of 4 (half of 25 = 12.5) Seven is easy to remember: 7 into 2 (14), followed by 14 into 2 (28), which makes it 14.28 9 is one-third of 3 (33.33 divided by 3 = 11.11)
CSAT DI & LR 01
9 © Copyright 2011.Think & Learn Pvt. Ltd. Copying or Reproduction without the prior permission of the author is prohibited
DATA INTERPRETATION
CASELET 1
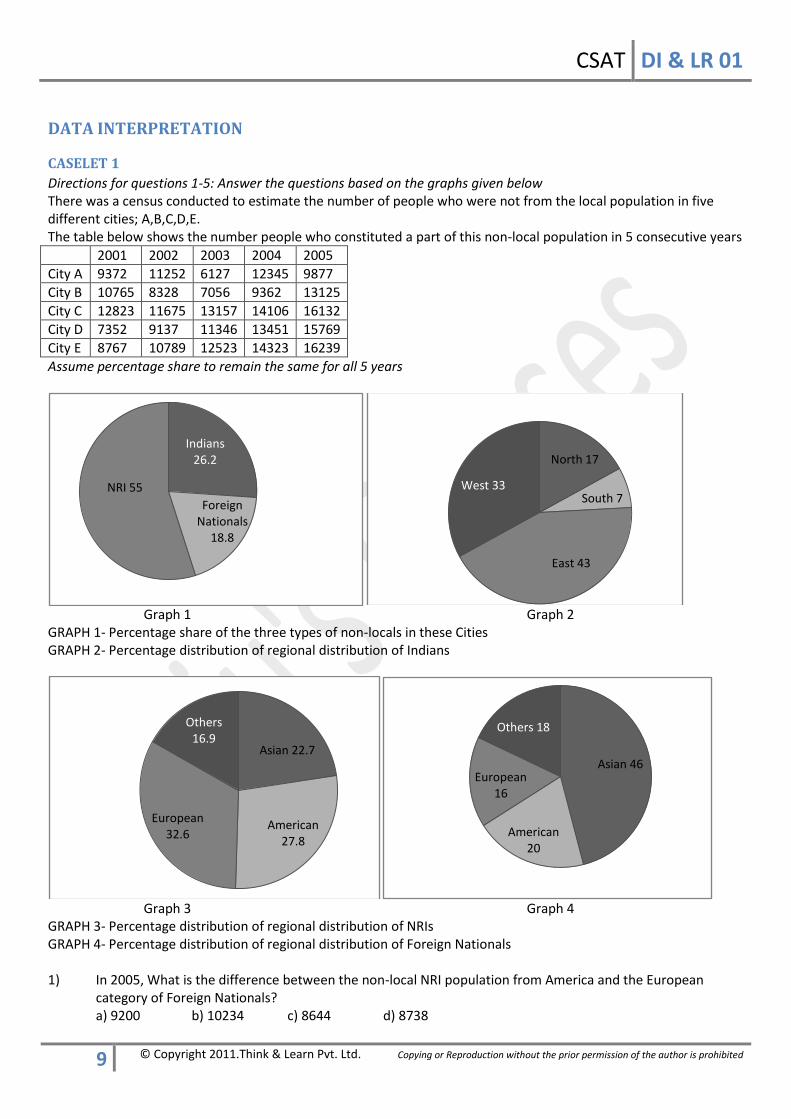
Directions for questions 1-5: Answer the questions based on the graphs given below There was a census conducted to estimate the number of people who were not from the local population in five different cities; A,B,C,D,E. The table below shows the number people who constituted a part of this non-local population in 5 consecutive years
2001 2002 2003 2004 2005
City A 9372 11252 6127 12345 9877
City B 10765 8328 7056 9362 13125
City C 12823 11675 13157 14106 16132
City D 7352 9137 11346 13451 15769
City E 8767 10789 12523 14323 16239
Assume percentage share to remain the same for all 5 years
Graph 1 Graph 2
GRAPH 1- Percentage share of the three types of non-locals in these Cities GRAPH 2- Percentage distribution of regional distribution of Indians
Graph 3 Graph 4
GRAPH 3- Percentage distribution of regional distribution of NRIs GRAPH 4- Percentage distribution of regional distribution of Foreign Nationals 1) In 2005, What is the difference between the non-local NRI population from America and the European
category of Foreign Nationals? a) 9200 b) 10234 c) 8644 d) 8738
Indians 26.2
Foreign Nationals
18.8
NRI 55
North 17
South 7
East 43
West 33
Asian 22.7
American 27.8
European 32.6
Others 16.9
Asian 46
American 20
European 16
Others 18
CSAT DI & LR 01
10 © Copyright 2011.Think & Learn Pvt. Ltd. Copying or Reproduction without the prior permission of the author is prohibited
2) What is the percentage change in the percentage increase in the number of non-local North Indian people in City A and non-local Foreign Nationals of the Asian category in City D, from 2001 to 2002? a) 11% b) 20% c) 16% d) 31% 3) The average amount spent by an American Foreign National for staying in a hotel in city E is Rs 3800. The average amount spent by a North Indian for staying in a hotel in city D is Rs 2375. What is the difference in expenditure on hotel stay by these two non-local groups over the given period? (Assume that all the individuals in the above mentioned groups stay in hotels duringthis period) a) 350 b) 291.5 c) 300 d) 250.25 4) What is the percentage increase in the number of Foreign Nationals from the category “others” over the
given period? a) 45% b) 65% c) 76% d) 52% 5) What is the highest percentage growth in the number of non-local people from East India, between any two consecutive years? a) 30% b) 27% c) 21% d) 32%
CASELET 2
Directions for questions 6-10: Answer the questions based on the information provided below ASNL, a government telecom agency, makes a log of all its tariffs for the year 2009. Due to recession, all rates have dropped by 20%. The bill is sent across every two months. Charges per minute are as follows (1) a total of 275 minutes free for 2 months (2) Above 275 upto 2000 minutes, the rate is 80 paise per minute (3) from 2001 up to 5000 minutes, the rate is 1 rupee per minute (4) in excess of 5000, it is 1.25 rupees per minute This tariff charges a rental fee of Rs 330 for every two months. (pulse rate of all calls = 60 seconds. The rental fee is apart from the calls made) 6) What would the telephone bill be if the user has used his phone for 6000 minutes? a) Rs. 5630 b) Rs 5960 c) Rs 6250 d) Rs 6996 7) Minu wants to have 2 phones. What would be the number of minutes of usage at which it would be
economical for her to buy the second phone, such that the number of minutes she uses on each phone are equal?
a) Rs 1650 b) Rs 1950 c) Rs 2550 d) Rs 2600 8) What is the difference in the telephone bill over 4 months, if the number of minutes for the first period is
4000 and the number of minutes for the second period is 2500? a) 1668 b) 1500 c) 1800 d) 1750 9) Anu wants to have a phone booth wherein she charges Rs.1 per minute. At what number of minutes, would
she neither make a profit nor have a loss (over a two month period). Handset cost not taken into account? a) 550 b) 1000 c) 300 d) 750 10) The government has changed and the rates are revised. The fixed rental is raised to Rs 400 for every two
months; but the number of free minutes is increased to 300. The slabs of charge remain the same. What would be the increase or decrease in telephone bill for a user who is talking for 1600 minutes?
a) Rs 50 b) Rs 60 c) Rs 70 d) Rs 80
CSAT DI & LR 01
11 © Copyright 2011.Think & Learn Pvt. Ltd. Copying or Reproduction without the prior permission of the author is prohibited
CASELET 3
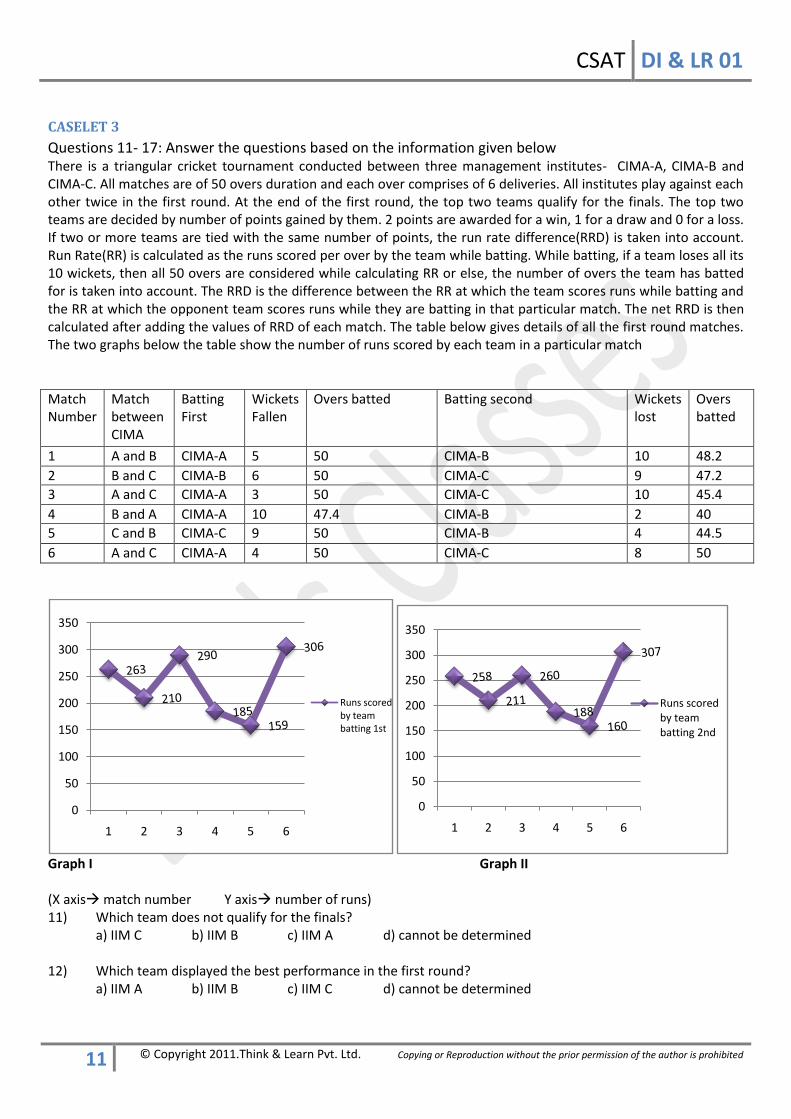
Questions 11- 17: Answer the questions based on the information given below There is a triangular cricket tournament conducted between three management institutes- CIMA-A, CIMA-B and CIMA-C. All matches are of 50 overs duration and each over comprises of 6 deliveries. All institutes play against each other twice in the first round. At the end of the first round, the top two teams qualify for the finals. The top two teams are decided by number of points gained by them. 2 points are awarded for a win, 1 for a draw and 0 for a loss. If two or more teams are tied with the same number of points, the run rate difference(RRD) is taken into account. Run Rate(RR) is calculated as the runs scored per over by the team while batting. While batting, if a team loses all its 10 wickets, then all 50 overs are considered while calculating RR or else, the number of overs the team has batted for is taken into account. The RRD is the difference between the RR at which the team scores runs while batting and the RR at which the opponent team scores runs while they are batting in that particular match. The net RRD is then calculated after adding the values of RRD of each match. The table below gives details of all the first round matches. The two graphs below the table show the number of runs scored by each team in a particular match
Match Number
Match between CIMA
Batting First
Wickets Fallen
Overs batted Batting second Wickets lost
Overs batted
1 A and B CIMA-A 5 50 CIMA-B 10 48.2
2 B and C CIMA-B 6 50 CIMA-C 9 47.2
3 A and C CIMA-A 3 50 CIMA-C 10 45.4
4 B and A CIMA-A 10 47.4 CIMA-B 2 40
5 C and B CIMA-C 9 50 CIMA-B 4 44.5
6 A and C CIMA-A 4 50 CIMA-C 8 50
Graph I Graph II (X axis match number Y axis number of runs) 11) Which team does not qualify for the finals? a) IIM C b) IIM B c) IIM A d) cannot be determined 12) Which team displayed the best performance in the first round? a) IIM A b) IIM B c) IIM C d) cannot be determined
0
50
100
150
200
250
300
350
1 2 3 4 5 6
Runs scored by team batting 1st
0
50
100
150
200
250
300
350
1 2 3 4 5 6
Runs scored by team batting 2nd
Match no.
CSAT DI & LR 01
12 © Copyright 2011.Think & Learn Pvt. Ltd. Copying or Reproduction without the prior permission of the author is prohibited
13) The team which failed to make it to the finals, would have made it to the finals if it had won in _____ overs in the last match it played
a) 48 b) 47 c) 46 d) 49 14) Which team made the best comeback to reach the finals? a) IIM C b) IIM A c) IIM B d) IIM A and IIM C e) cannot be determined 15) What is the highest value of Net Runs per wicket (NRW) for a team? NRW is calculated as the difference between runs per wicket scored by the team and runs per wicket conceded by the team a) 10 b) 12.2 c) 22 d) 13.5 16) A team wither wins by scoring more runs ( if it wins by batting first) or by wickets ( if it wins after batting
second). The margin by which a team wins is calculated by converting all victories to Final Victory Margin (FVM). If a team batting second wins, the FVM is calculated as = (10- wickets lost by winning team)*5 + deliveries to spare when the match was won. If the team batting first wins, the FVM will be the difference between the runs scored by it and its opponents. What is the highest FVM in any match?
a) 61 b) 80 c) 35 d) 100 17) As is the normal scenario, there is a legal betting going on. The “number 1 choice” to win the final is the
team which had first position in the first round standings. The betting agency accepts bets as 2 to 1 for “number 1 choice” to win the final and 4 to 1 for “number 2 choice” to win the final. A standard fee of Rs.1000 is paid upfront by every person who wants to bet on either of the two teams winning. A total of 10000 people bet. At the end of the match, “number 2 choice” was the winner. The agency had an income of 50 lakhs. How many people betted correctly?
a) 2000 b) 1500 c) 1000 d) 1250
CASELET 4
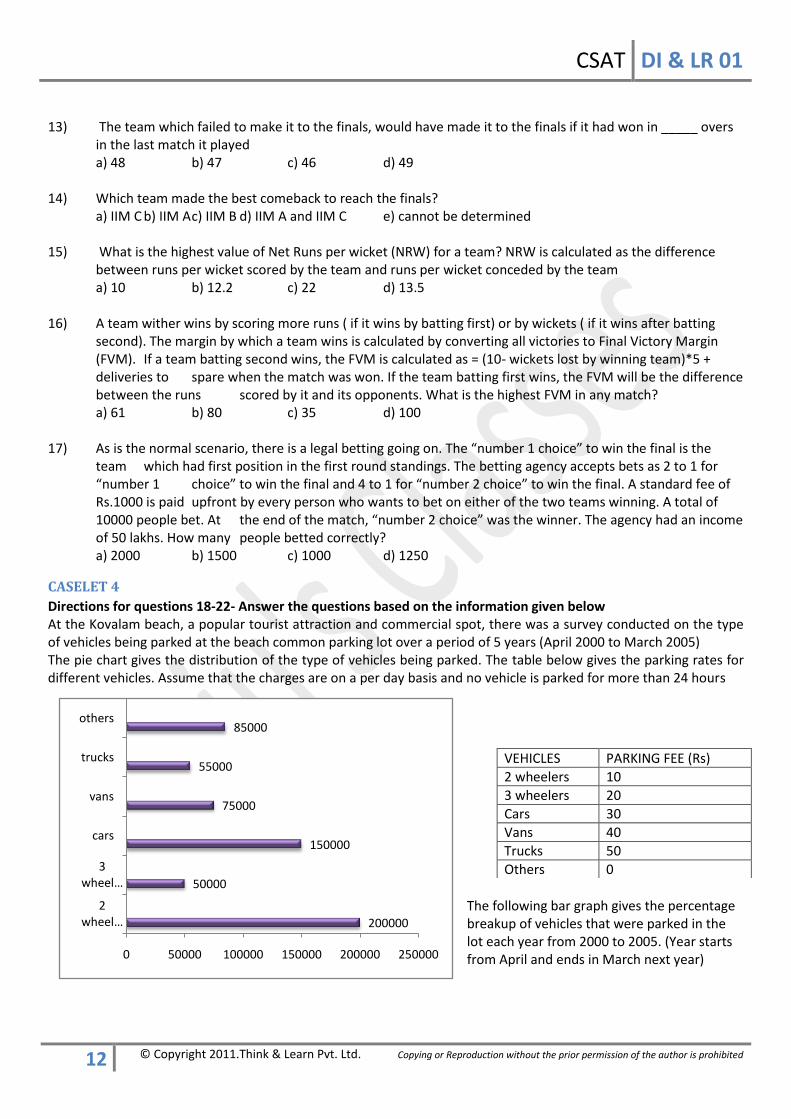
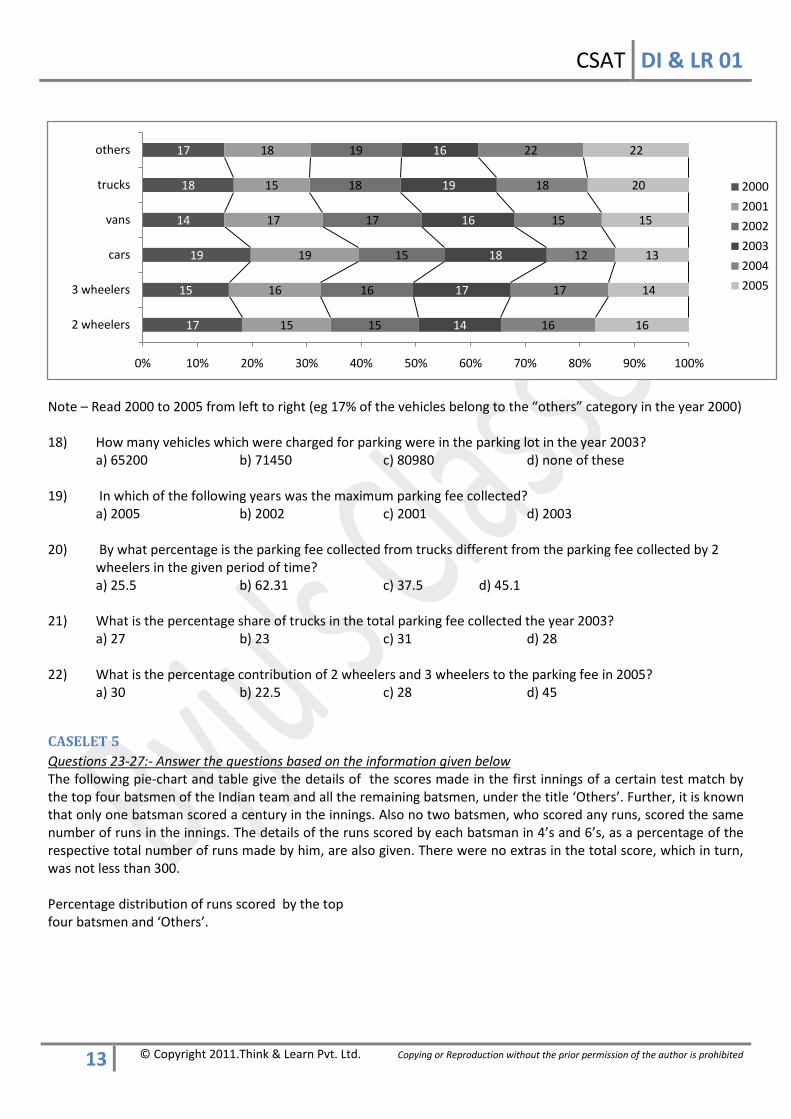
Directions for questions 18-22- Answer the questions based on the information given below At the Kovalam beach, a popular tourist attraction and commercial spot, there was a survey conducted on the type of vehicles being parked at the beach common parking lot over a period of 5 years (April 2000 to March 2005) The pie chart gives the distribution of the type of vehicles being parked. The table below gives the parking rates for different vehicles. Assume that the charges are on a per day basis and no vehicle is parked for more than 24 hours
The following bar graph gives the percentage breakup of vehicles that were parked in the lot each year from 2000 to 2005. (Year starts from April and ends in March next year)
VEHICLES PARKING FEE (Rs)
2 wheelers 10
3 wheelers 20
Cars 30
Vans 40
Trucks 50
Others 0
200000
50000
150000
75000
55000
85000
0 50000 100000 150000 200000 250000
2 wheel…
3 wheel…
cars
vans
trucks
others
CSAT DI & LR 01
13 © Copyright 2011.Think & Learn Pvt. Ltd. Copying or Reproduction without the prior permission of the author is prohibited
Note – Read 2000 to 2005 from left to right (eg 17% of the vehicles belong to the “others” category in the year 2000) 18) How many vehicles which were charged for parking were in the parking lot in the year 2003? a) 65200 b) 71450 c) 80980 d) none of these 19) In which of the following years was the maximum parking fee collected? a) 2005 b) 2002 c) 2001 d) 2003 20) By what percentage is the parking fee collected from trucks different from the parking fee collected by 2 wheelers in the given period of time? a) 25.5 b) 62.31 c) 37.5 d) 45.1 21) What is the percentage share of trucks in the total parking fee collected the year 2003? a) 27 b) 23 c) 31 d) 28 22) What is the percentage contribution of 2 wheelers and 3 wheelers to the parking fee in 2005? a) 30 b) 22.5 c) 28 d) 45
CASELET 5
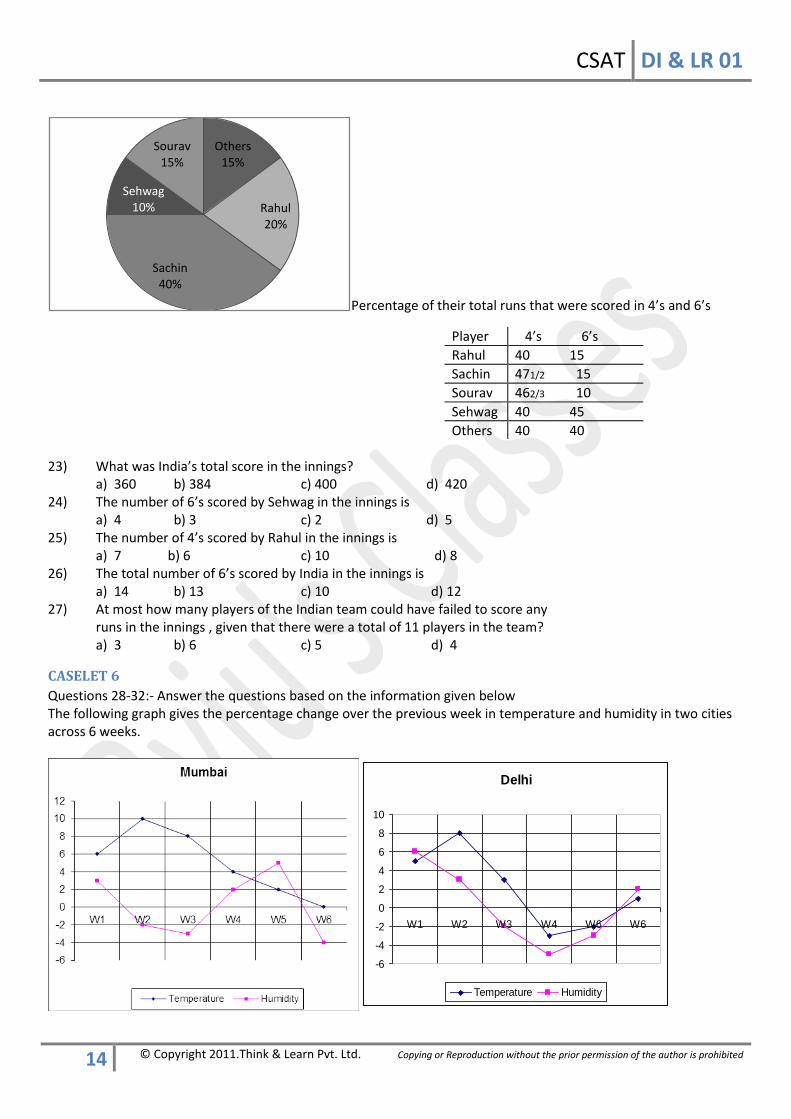
Questions 23-27:- Answer the questions based on the information given below The following pie-chart and table give the details of the scores made in the first innings of a certain test match by the top four batsmen of the Indian team and all the remaining batsmen, under the title ‘Others’. Further, it is known that only one batsman scored a century in the innings. Also no two batsmen, who scored any runs, scored the same number of runs in the innings. The details of the runs scored by each batsman in 4’s and 6’s, as a percentage of the respective total number of runs made by him, are also given. There were no extras in the total score, which in turn, was not less than 300. Percentage distribution of runs scored by the top four batsmen and ‘Others’.
17
15
19
14
18
17
15
16
19
17
15
18
15
16
15
17
18
19
14
17
18
16
19
16
16
17
12
15
18
22
16
14
13
15
20
22
0% 10% 20% 30% 40% 50% 60% 70% 80% 90% 100%
2 wheelers
3 wheelers
cars
vans
trucks
others
2000
2001
2002
2003
2004
2005
CSAT DI & LR 01
14 © Copyright 2011.Think & Learn Pvt. Ltd. Copying or Reproduction without the prior permission of the author is prohibited
Percentage of their total runs that were scored in 4’s and 6’s
23) What was India’s total score in the innings? a) 360 b) 384 c) 400 d) 420 24) The number of 6’s scored by Sehwag in the innings is a) 4 b) 3 c) 2 d) 5 25) The number of 4’s scored by Rahul in the innings is a) 7 b) 6 c) 10 d) 8 26) The total number of 6’s scored by India in the innings is a) 14 b) 13 c) 10 d) 12 27) At most how many players of the Indian team could have failed to score any runs in the innings , given that there were a total of 11 players in the team? a) 3 b) 6 c) 5 d) 4
CASELET 6
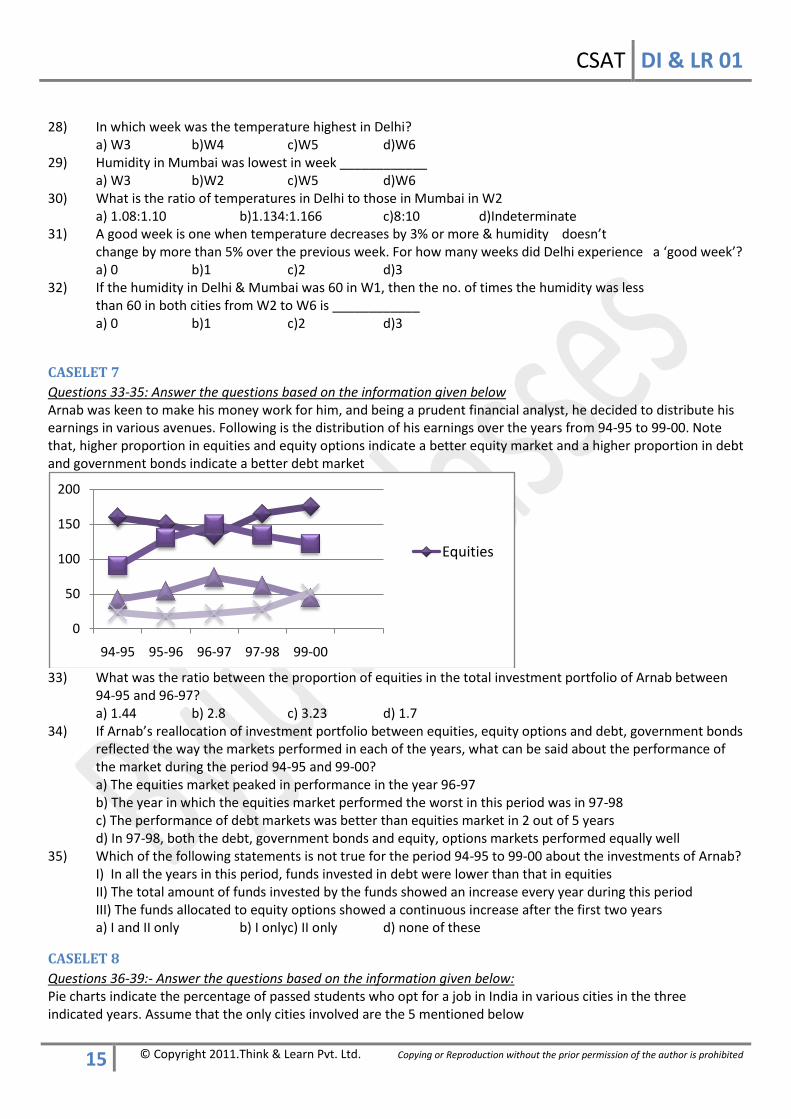
Questions 28-32:- Answer the questions based on the information given below The following graph gives the percentage change over the previous week in temperature and humidity in two cities across 6 weeks.
Others15%
Rahul20%
Sachin40%
Sehwag10%
Sourav15%
Player 4’s 6’s
Rahul 40 15
Sachin 471/2 15
Sourav 462/3 10
Sehwag 40 45
Others 40 40
Delhi
-6
-4
-2
0
2
4
6
8
10
W1 W2 W3 W4 W6 W6
Temperature Humidity
CSAT DI & LR 01
15 © Copyright 2011.Think & Learn Pvt. Ltd. Copying or Reproduction without the prior permission of the author is prohibited
28) In which week was the temperature highest in Delhi? a) W3 b)W4 c)W5 d)W6 29) Humidity in Mumbai was lowest in week ____________ a) W3 b)W2 c)W5 d)W6 30) What is the ratio of temperatures in Delhi to those in Mumbai in W2 a) 1.08:1.10 b)1.134:1.166 c)8:10 d)Indeterminate 31) A good week is one when temperature decreases by 3% or more & humidity doesn’t change by more than 5% over the previous week. For how many weeks did Delhi experience a ‘good week’? a) 0 b)1 c)2 d)3 32) If the humidity in Delhi & Mumbai was 60 in W1, then the no. of times the humidity was less than 60 in both cities from W2 to W6 is ____________ a) 0 b)1 c)2 d)3
CASELET 7
Questions 33-35: Answer the questions based on the information given below Arnab was keen to make his money work for him, and being a prudent financial analyst, he decided to distribute his earnings in various avenues. Following is the distribution of his earnings over the years from 94-95 to 99-00. Note that, higher proportion in equities and equity options indicate a better equity market and a higher proportion in debt and government bonds indicate a better debt market
33) What was the ratio between the proportion of equities in the total investment portfolio of Arnab between
94-95 and 96-97? a) 1.44 b) 2.8 c) 3.23 d) 1.7 34) If Arnab’s reallocation of investment portfolio between equities, equity options and debt, government bonds
reflected the way the markets performed in each of the years, what can be said about the performance of the market during the period 94-95 and 99-00?
a) The equities market peaked in performance in the year 96-97 b) The year in which the equities market performed the worst in this period was in 97-98 c) The performance of debt markets was better than equities market in 2 out of 5 years d) In 97-98, both the debt, government bonds and equity, options markets performed equally well 35) Which of the following statements is not true for the period 94-95 to 99-00 about the investments of Arnab? I) In all the years in this period, funds invested in debt were lower than that in equities II) The total amount of funds invested by the funds showed an increase every year during this period III) The funds allocated to equity options showed a continuous increase after the first two years a) I and II only b) I onlyc) II only d) none of these
CASELET 8
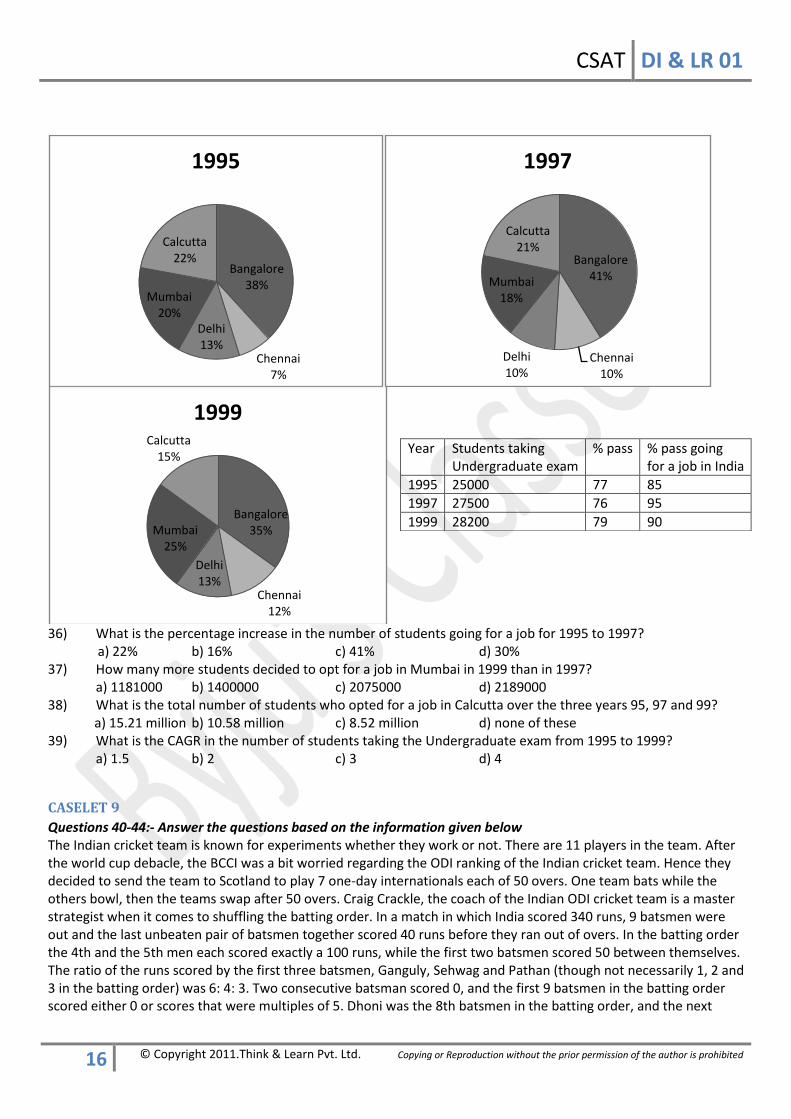
Questions 36-39:- Answer the questions based on the information given below: Pie charts indicate the percentage of passed students who opt for a job in India in various cities in the three indicated years. Assume that the only cities involved are the 5 mentioned below
0
50
100
150
200
94-95 95-96 96-97 97-98 99-00
Equities
CSAT DI & LR 01
16 © Copyright 2011.Think & Learn Pvt. Ltd. Copying or Reproduction without the prior permission of the author is prohibited
36) What is the percentage increase in the number of students going for a job for 1995 to 1997? a) 22% b) 16% c) 41% d) 30% 37) How many more students decided to opt for a job in Mumbai in 1999 than in 1997?
a) 1181000 b) 1400000 c) 2075000 d) 2189000 38) What is the total number of students who opted for a job in Calcutta over the three years 95, 97 and 99? a) 15.21 million b) 10.58 million c) 8.52 million d) none of these 39) What is the CAGR in the number of students taking the Undergraduate exam from 1995 to 1999? a) 1.5 b) 2 c) 3 d) 4
CASELET 9
Questions 40-44:- Answer the questions based on the information given below The Indian cricket team is known for experiments whether they work or not. There are 11 players in the team. After the world cup debacle, the BCCI was a bit worried regarding the ODI ranking of the Indian cricket team. Hence they decided to send the team to Scotland to play 7 one-day internationals each of 50 overs. One team bats while the others bowl, then the teams swap after 50 overs. Craig Crackle, the coach of the Indian ODI cricket team is a master strategist when it comes to shuffling the batting order. In a match in which India scored 340 runs, 9 batsmen were out and the last unbeaten pair of batsmen together scored 40 runs before they ran out of overs. In the batting order the 4th and the 5th men each scored exactly a 100 runs, while the first two batsmen scored 50 between themselves. The ratio of the runs scored by the first three batsmen, Ganguly, Sehwag and Pathan (though not necessarily 1, 2 and 3 in the batting order) was 6: 4: 3. Two consecutive batsman scored 0, and the first 9 batsmen in the batting order scored either 0 or scores that were multiples of 5. Dhoni was the 8th batsmen in the batting order, and the next
Bangalore38%
Chennai7%
Delhi13%
Mumbai20%
Calcutta22%
1995
Bangalore41%
Chennai10%
Delhi10%
Mumbai18%
Calcutta21%
1997
Bangalore35%
Chennai12%
Delhi13%
Mumbai25%
Calcutta15%
1999
Year Students taking Undergraduate exam
% pass % pass going for a job in India
1995 25000 77 85
1997 27500 76 95
1999 28200 79 90
CSAT DI & LR 01
17 © Copyright 2011.Think & Learn Pvt. Ltd. Copying or Reproduction without the prior permission of the author is prohibited
person after Dhoni scored a 5. The runs scored by Tendulkar if added to the extras (bonus runs not scored by any batsmen but given by the bowling team to the batting team) equaled Ganguly’s scores. Sehwag scored one-fifth of Yuvraj and equal to Tendulkar. Srinath scored 5 times what Tendulkar scored. Munaf and Mohanty scored 18 and 22 respectively, while together they scored 25 more than Dhoni and Pathan together. Kumble was India’s most successful bowler of the match, and Harbhajan took 2 wickets less than Kumble. 40) What was the number of extras in the Indian score? (a) 0 (b) 10 (c) 20 (d) cannot be determined 41) Tendulkar’s number in the batting order was immediately after (a) Yuvraj (b) Srinath (c) Yuvaraj or Srinath (d) cannot be determined 42) What is the total of the least 5 scores in the Indian Cricket team (excluding extras)? (a) 20 (b) 30 (c) 35 (d) 38 43) Who has scored 5 runs? (a) Kumble (b) Harbhajan (c) Tendulkar (d) Kumble or Harbhajan 44) The ratio of the number of runs scored by Pathan to Ganguly is the same as the ratio of the number of runs scored by (a) Extras to Tendulkar (b) Munaf to Mohanty (c) Extras to Sehwag (d) Both a & c
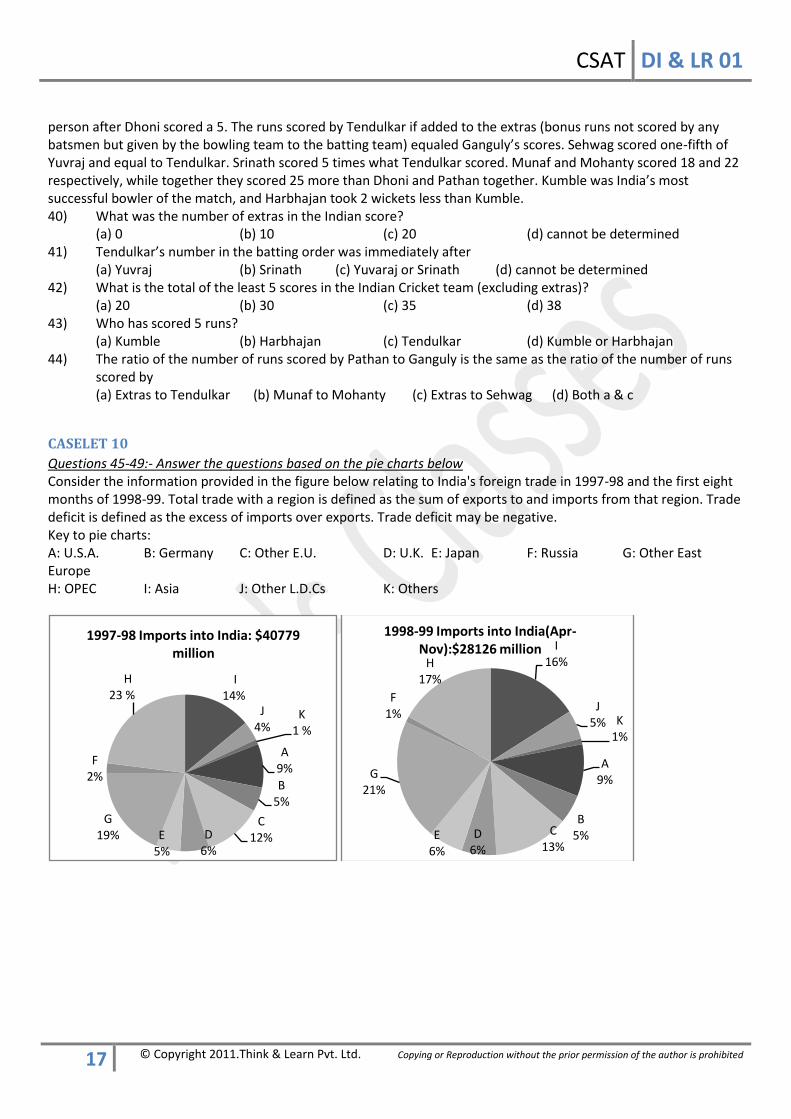
CASELET 10 Questions 45-49:- Answer the questions based on the pie charts below Consider the information provided in the figure below relating to India's foreign trade in 1997-98 and the first eight months of 1998-99. Total trade with a region is defined as the sum of exports to and imports from that region. Trade deficit is defined as the excess of imports over exports. Trade deficit may be negative. Key to pie charts: A: U.S.A. B: Germany C: Other E.U. D: U.K. E: Japan F: Russia G: Other East Europe H: OPEC I: Asia J: Other L.D.Cs K: Others
I 14%
J4%
K1 %
A9%
B5%
C12%D
6%E
5%
G19%
F2%
H 23 %
1997-98 Imports into India: $40779 million
I16%
J5% K
1%
A9%
B5%C
13%D
6%E
6%
G21%
F1%
H17%
1998-99 Imports into India(Apr-Nov):$28126 million
CSAT DI & LR 01
18 © Copyright 2011.Think & Learn Pvt. Ltd. Copying or Reproduction without the prior permission of the author is prohibited
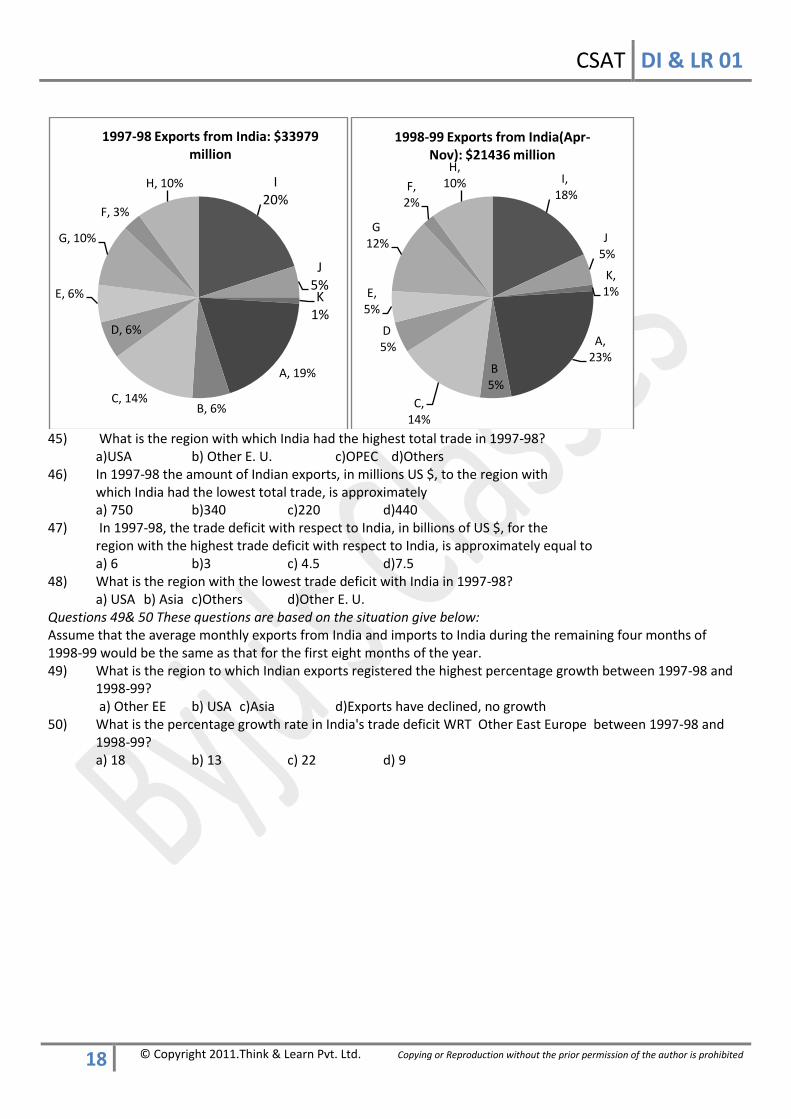
45) What is the region with which India had the highest total trade in 1997-98? a)USA b) Other E. U. c)OPEC d)Others 46) In 1997-98 the amount of Indian exports, in millions US $, to the region with which India had the lowest total trade, is approximately a) 750 b)340 c)220 d)440 47) In 1997-98, the trade deficit with respect to India, in billions of US $, for the region with the highest trade deficit with respect to India, is approximately equal to a) 6 b)3 c) 4.5 d)7.5 48) What is the region with the lowest trade deficit with India in 1997-98? a) USA b) Asia c)Others d)Other E. U. Questions 49& 50 These questions are based on the situation give below: Assume that the average monthly exports from India and imports to India during the remaining four months of 1998-99 would be the same as that for the first eight months of the year. 49) What is the region to which Indian exports registered the highest percentage growth between 1997-98 and 1998-99? a) Other EE b) USA c)Asia d)Exports have declined, no growth 50) What is the percentage growth rate in India's trade deficit WRT Other East Europe between 1997-98 and
1998-99? a) 18 b) 13 c) 22 d) 9
I20%
J5%K
1%
A, 19%
B, 6%C, 14%
D, 6%
E, 6%
G, 10%
F, 3%
H, 10%
1997-98 Exports from India: $33979 million
I,18%
J5%
K,1%
A,23%
B5%
C,14%
D5%
E,5%
G12%
F,2%
H,10%
1998-99 Exports from India(Apr-Nov): $21436 million
CSAT DI & LR 01
19 © Copyright 2011.Think & Learn Pvt. Ltd. Copying or Reproduction without the prior permission of the author is prohibited
LOGICAL REASONING
CASELET 1
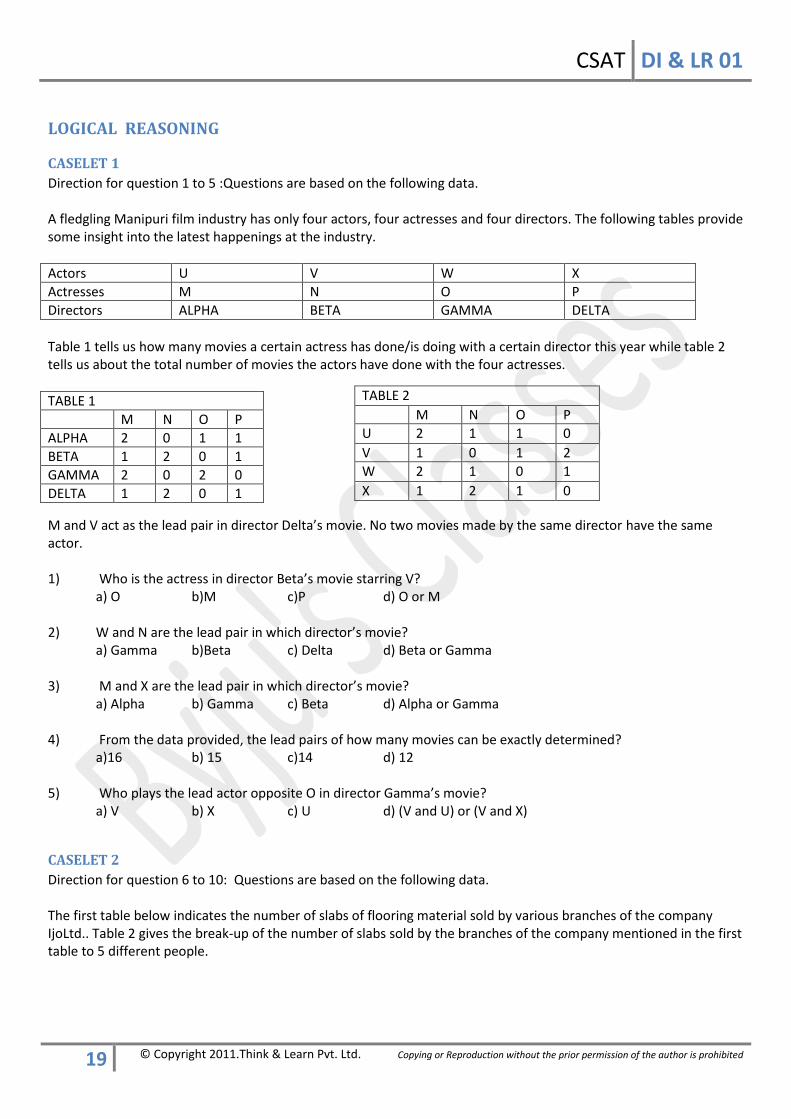
Direction for question 1 to 5 :Questions are based on the following data. A fledgling Manipuri film industry has only four actors, four actresses and four directors. The following tables provide some insight into the latest happenings at the industry.
Actors U V W X
Actresses M N O P
Directors ALPHA BETA GAMMA DELTA
Table 1 tells us how many movies a certain actress has done/is doing with a certain director this year while table 2 tells us about the total number of movies the actors have done with the four actresses.
M and V act as the lead pair in director Delta’s movie. No two movies made by the same director have the same actor. 1) Who is the actress in director Beta’s movie starring V?
a) O b)M c)P d) O or M 2) W and N are the lead pair in which director’s movie?
a) Gamma b)Beta c) Delta d) Beta or Gamma 3) M and X are the lead pair in which director’s movie?
a) Alpha b) Gamma c) Beta d) Alpha or Gamma 4) From the data provided, the lead pairs of how many movies can be exactly determined?
a)16 b) 15 c)14 d) 12 5) Who plays the lead actor opposite O in director Gamma’s movie?
a) V b) X c) U d) (V and U) or (V and X)
CASELET 2
Direction for question 6 to 10: Questions are based on the following data. The first table below indicates the number of slabs of flooring material sold by various branches of the company IjoLtd.. Table 2 gives the break-up of the number of slabs sold by the branches of the company mentioned in the first table to 5 different people.
TABLE 2
M N O P
U 2 1 1 0
V 1 0 1 2
W 2 1 0 1
X 1 2 1 0
TABLE 1
M N O P
ALPHA 2 0 1 1
BETA 1 2 0 1
GAMMA 2 0 2 0
DELTA 1 2 0 1
CSAT DI & LR 01
20 © Copyright 2011.Think & Learn Pvt. Ltd. Copying or Reproduction without the prior permission of the author is prohibited
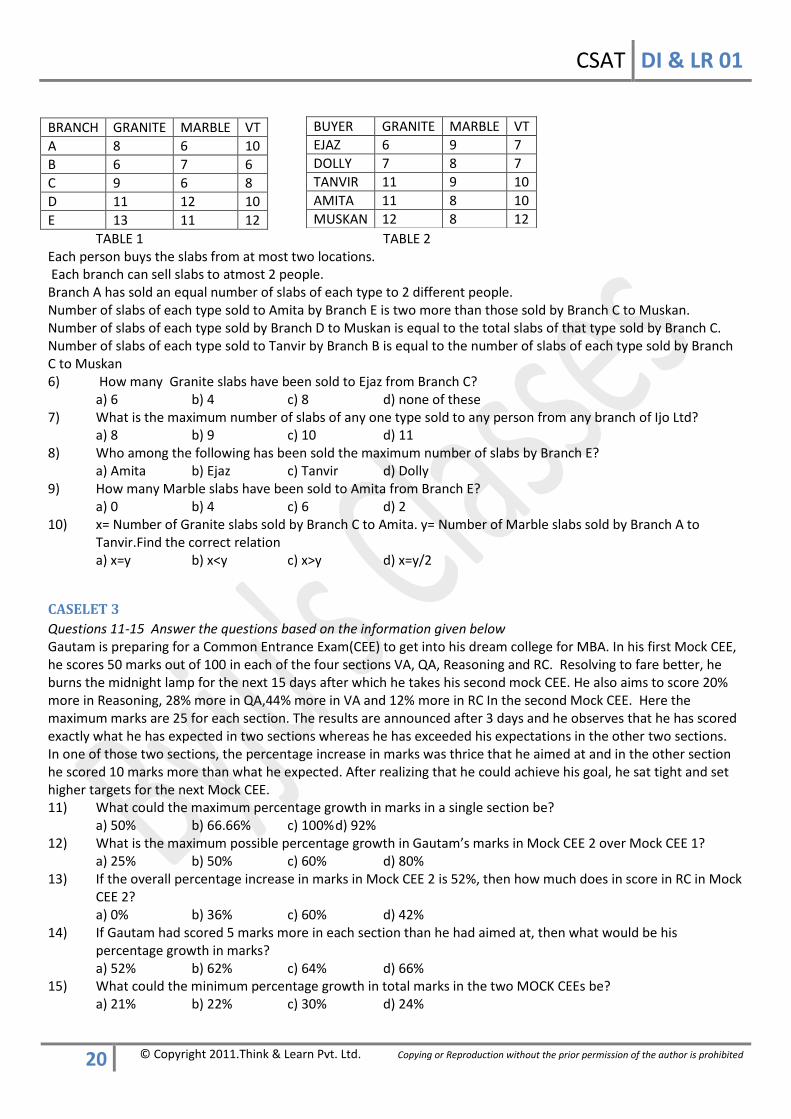
BRANCH GRANITE MARBLE VT
A 8 6 10
B 6 7 6
C 9 6 8
D 11 12 10
E 13 11 12
TABLE 1 TABLE 2 Each person buys the slabs from at most two locations. Each branch can sell slabs to atmost 2 people. Branch A has sold an equal number of slabs of each type to 2 different people. Number of slabs of each type sold to Amita by Branch E is two more than those sold by Branch C to Muskan. Number of slabs of each type sold by Branch D to Muskan is equal to the total slabs of that type sold by Branch C. Number of slabs of each type sold to Tanvir by Branch B is equal to the number of slabs of each type sold by Branch C to Muskan 6) How many Granite slabs have been sold to Ejaz from Branch C? a) 6 b) 4 c) 8 d) none of these 7) What is the maximum number of slabs of any one type sold to any person from any branch of Ijo Ltd? a) 8 b) 9 c) 10 d) 11 8) Who among the following has been sold the maximum number of slabs by Branch E? a) Amita b) Ejaz c) Tanvir d) Dolly 9) How many Marble slabs have been sold to Amita from Branch E? a) 0 b) 4 c) 6 d) 2 10) x= Number of Granite slabs sold by Branch C to Amita. y= Number of Marble slabs sold by Branch A to Tanvir.Find the correct relation a) x=y b) x<y c) x>y d) x=y/2
CASELET 3
Questions 11-15 Answer the questions based on the information given below Gautam is preparing for a Common Entrance Exam(CEE) to get into his dream college for MBA. In his first Mock CEE, he scores 50 marks out of 100 in each of the four sections VA, QA, Reasoning and RC. Resolving to fare better, he burns the midnight lamp for the next 15 days after which he takes his second mock CEE. He also aims to score 20% more in Reasoning, 28% more in QA,44% more in VA and 12% more in RC In the second Mock CEE. Here the maximum marks are 25 for each section. The results are announced after 3 days and he observes that he has scored exactly what he has expected in two sections whereas he has exceeded his expectations in the other two sections. In one of those two sections, the percentage increase in marks was thrice that he aimed at and in the other section he scored 10 marks more than what he expected. After realizing that he could achieve his goal, he sat tight and set higher targets for the next Mock CEE. 11) What could the maximum percentage growth in marks in a single section be? a) 50% b) 66.66% c) 100% d) 92% 12) What is the maximum possible percentage growth in Gautam’s marks in Mock CEE 2 over Mock CEE 1? a) 25% b) 50% c) 60% d) 80% 13) If the overall percentage increase in marks in Mock CEE 2 is 52%, then how much does in score in RC in Mock CEE 2? a) 0% b) 36% c) 60% d) 42% 14) If Gautam had scored 5 marks more in each section than he had aimed at, then what would be his
percentage growth in marks? a) 52% b) 62% c) 64% d) 66% 15) What could the minimum percentage growth in total marks in the two MOCK CEEs be? a) 21% b) 22% c) 30% d) 24%
BUYER GRANITE MARBLE VT
EJAZ 6 9 7
DOLLY 7 8 7
TANVIR 11 9 10
AMITA 11 8 10
MUSKAN 12 8 12
CSAT DI & LR 01
21 © Copyright 2011.Think & Learn Pvt. Ltd. Copying or Reproduction without the prior permission of the author is prohibited
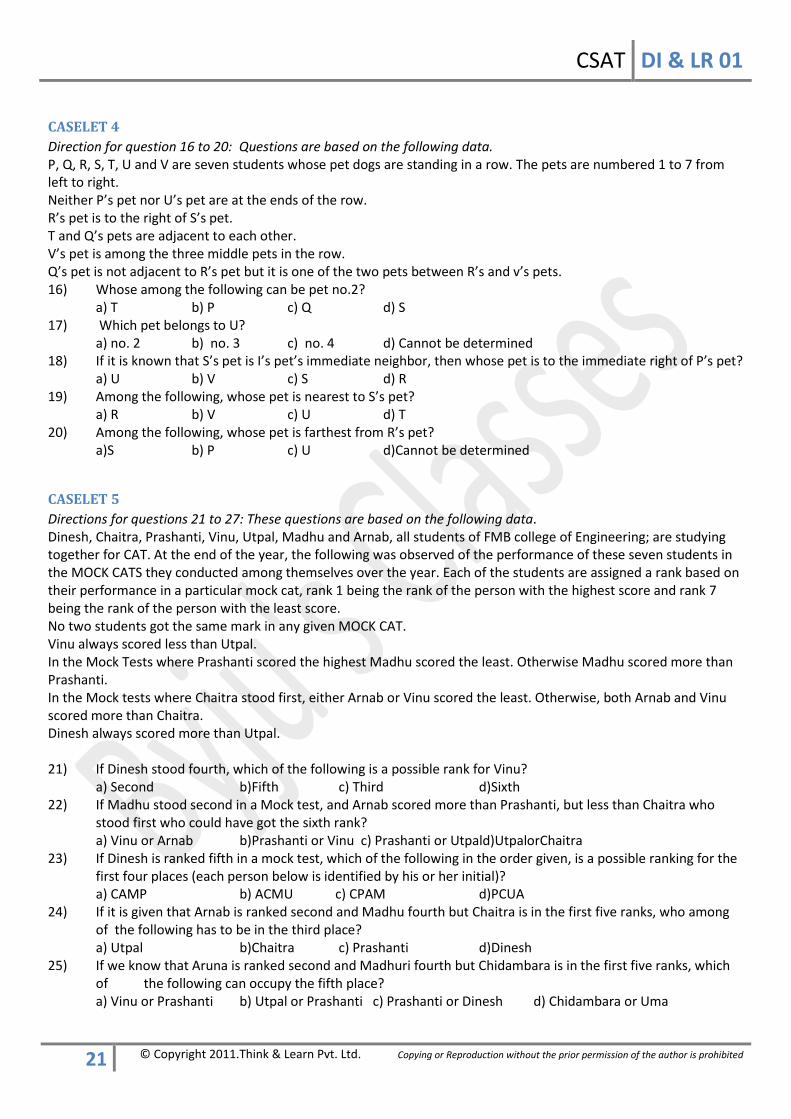
CASELET 4
Direction for question 16 to 20: Questions are based on the following data. P, Q, R, S, T, U and V are seven students whose pet dogs are standing in a row. The pets are numbered 1 to 7 from left to right. Neither P’s pet nor U’s pet are at the ends of the row. R’s pet is to the right of S’s pet. T and Q’s pets are adjacent to each other. V’s pet is among the three middle pets in the row. Q’s pet is not adjacent to R’s pet but it is one of the two pets between R’s and v’s pets. 16) Whose among the following can be pet no.2? a) T b) P c) Q d) S 17) Which pet belongs to U? a) no. 2 b) no. 3 c) no. 4 d) Cannot be determined 18) If it is known that S’s pet is I’s pet’s immediate neighbor, then whose pet is to the immediate right of P’s pet? a) U b) V c) S d) R 19) Among the following, whose pet is nearest to S’s pet? a) R b) V c) U d) T 20) Among the following, whose pet is farthest from R’s pet? a)S b) P c) U d)Cannot be determined
CASELET 5
Directions for questions 21 to 27: These questions are based on the following data. Dinesh, Chaitra, Prashanti, Vinu, Utpal, Madhu and Arnab, all students of FMB college of Engineering; are studying together for CAT. At the end of the year, the following was observed of the performance of these seven students in the MOCK CATS they conducted among themselves over the year. Each of the students are assigned a rank based on their performance in a particular mock cat, rank 1 being the rank of the person with the highest score and rank 7 being the rank of the person with the least score. No two students got the same mark in any given MOCK CAT. Vinu always scored less than Utpal. In the Mock Tests where Prashanti scored the highest Madhu scored the least. Otherwise Madhu scored more than Prashanti. In the Mock tests where Chaitra stood first, either Arnab or Vinu scored the least. Otherwise, both Arnab and Vinu scored more than Chaitra. Dinesh always scored more than Utpal. 21) If Dinesh stood fourth, which of the following is a possible rank for Vinu? a) Second b)Fifth c) Third d)Sixth 22) If Madhu stood second in a Mock test, and Arnab scored more than Prashanti, but less than Chaitra who
stood first who could have got the sixth rank? a) Vinu or Arnab b)Prashanti or Vinu c) Prashanti or Utpald)UtpalorChaitra 23) If Dinesh is ranked fifth in a mock test, which of the following in the order given, is a possible ranking for the
first four places (each person below is identified by his or her initial)? a) CAMP b) ACMU c) CPAM d)PCUA 24) If it is given that Arnab is ranked second and Madhu fourth but Chaitra is in the first five ranks, who among
of the following has to be in the third place? a) Utpal b)Chaitra c) Prashanti d)Dinesh 25) If we know that Aruna is ranked second and Madhuri fourth but Chidambara is in the first five ranks, which
of the following can occupy the fifth place? a) Vinu or Prashanti b) Utpal or Prashanti c) Prashanti or Dinesh d) Chidambara or Uma
CSAT DI & LR 01
22 © Copyright 2011.Think & Learn Pvt. Ltd. Copying or Reproduction without the prior permission of the author is prohibited
26) Which o the following statements is always true? a) Dinesh is placed two ranks higher than Vinu b) Prashanti can never be ranked second. c) Chaitra can never be ranked third or fourth. d) Vinu can never be third. 27) If Chaitra is first and Prashanti is fifth but Vinu is not ranked last, then which of the following arrangements is not possible? a) Madhuri is ranked third. b) Uma is ranked fourth. c) Venuthan is ranked fourth. d) Dilip is ranked second.
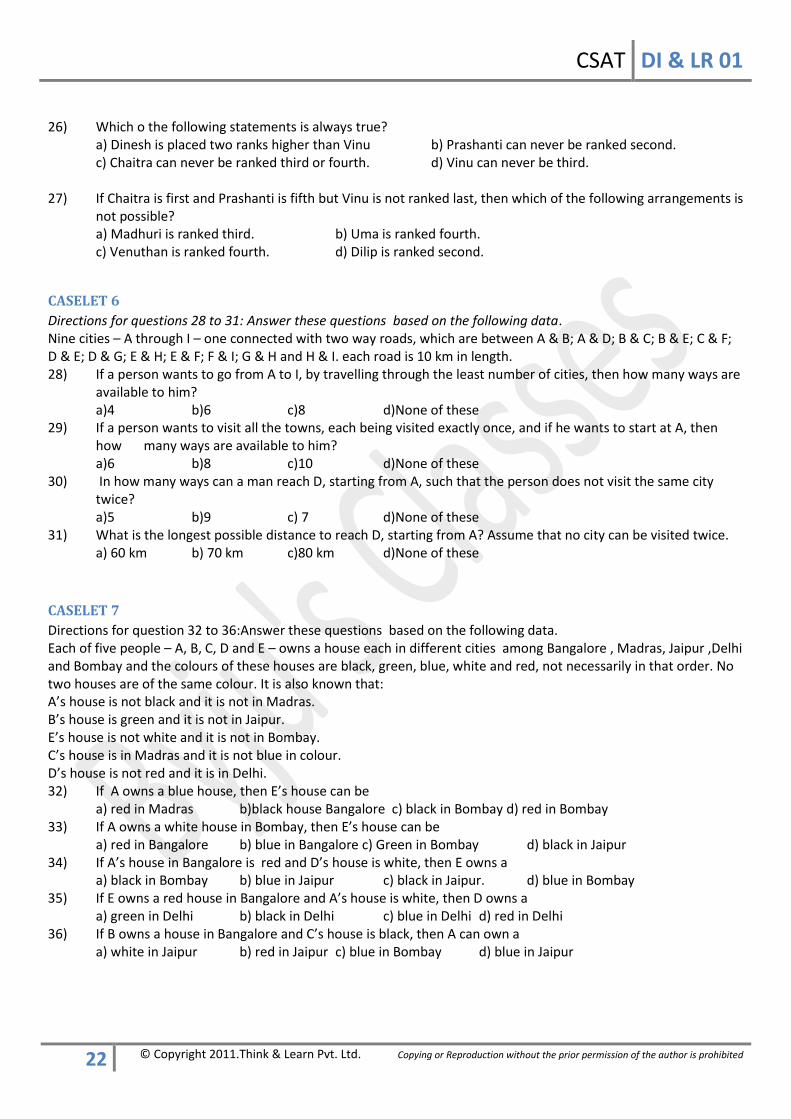
CASELET 6
Directions for questions 28 to 31: Answer these questions based on the following data. Nine cities – A through I – one connected with two way roads, which are between A & B; A & D; B & C; B & E; C & F; D & E; D & G; E & H; E & F; F & I; G & H and H & I. each road is 10 km in length. 28) If a person wants to go from A to I, by travelling through the least number of cities, then how many ways are available to him? a)4 b)6 c)8 d)None of these 29) If a person wants to visit all the towns, each being visited exactly once, and if he wants to start at A, then
how many ways are available to him? a)6 b)8 c)10 d)None of these 30) In how many ways can a man reach D, starting from A, such that the person does not visit the same city
twice? a)5 b)9 c) 7 d)None of these 31) What is the longest possible distance to reach D, starting from A? Assume that no city can be visited twice. a) 60 km b) 70 km c)80 km d)None of these
CASELET 7
Directions for question 32 to 36:Answer these questions based on the following data. Each of five people – A, B, C, D and E – owns a house each in different cities among Bangalore , Madras, Jaipur ,Delhi and Bombay and the colours of these houses are black, green, blue, white and red, not necessarily in that order. No two houses are of the same colour. It is also known that: A’s house is not black and it is not in Madras. B’s house is green and it is not in Jaipur. E’s house is not white and it is not in Bombay. C’s house is in Madras and it is not blue in colour. D’s house is not red and it is in Delhi. 32) If A owns a blue house, then E’s house can be a) red in Madras b)black house Bangalore c) black in Bombay d) red in Bombay 33) If A owns a white house in Bombay, then E’s house can be a) red in Bangalore b) blue in Bangalore c) Green in Bombay d) black in Jaipur 34) If A’s house in Bangalore is red and D’s house is white, then E owns a a) black in Bombay b) blue in Jaipur c) black in Jaipur. d) blue in Bombay 35) If E owns a red house in Bangalore and A’s house is white, then D owns a a) green in Delhi b) black in Delhi c) blue in Delhi d) red in Delhi 36) If B owns a house in Bangalore and C’s house is black, then A can own a a) white in Jaipur b) red in Jaipur c) blue in Bombay d) blue in Jaipur
CSAT DI & LR 01
23 © Copyright 2011.Think & Learn Pvt. Ltd. Copying or Reproduction without the prior permission of the author is prohibited
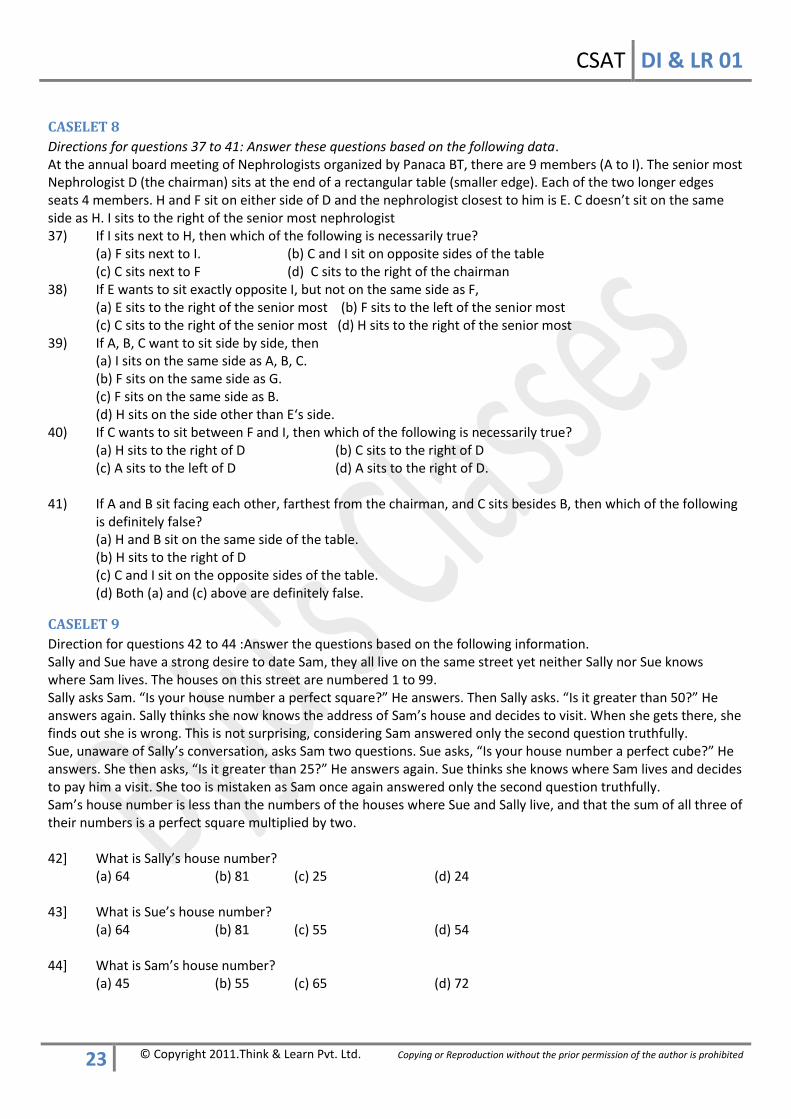
CASELET 8
Directions for questions 37 to 41: Answer these questions based on the following data. At the annual board meeting of Nephrologists organized by Panaca BT, there are 9 members (A to I). The senior most Nephrologist D (the chairman) sits at the end of a rectangular table (smaller edge). Each of the two longer edges seats 4 members. H and F sit on either side of D and the nephrologist closest to him is E. C doesn’t sit on the same side as H. I sits to the right of the senior most nephrologist 37) If I sits next to H, then which of the following is necessarily true? (a) F sits next to I. (b) C and I sit on opposite sides of the table (c) C sits next to F (d) C sits to the right of the chairman 38) If E wants to sit exactly opposite I, but not on the same side as F, (a) E sits to the right of the senior most (b) F sits to the left of the senior most (c) C sits to the right of the senior most (d) H sits to the right of the senior most 39) If A, B, C want to sit side by side, then (a) I sits on the same side as A, B, C. (b) F sits on the same side as G. (c) F sits on the same side as B. (d) H sits on the side other than E‘s side. 40) If C wants to sit between F and I, then which of the following is necessarily true? (a) H sits to the right of D (b) C sits to the right of D (c) A sits to the left of D (d) A sits to the right of D. 41) If A and B sit facing each other, farthest from the chairman, and C sits besides B, then which of the following
is definitely false? (a) H and B sit on the same side of the table. (b) H sits to the right of D (c) C and I sit on the opposite sides of the table. (d) Both (a) and (c) above are definitely false.
CASELET 9
Direction for questions 42 to 44 :Answer the questions based on the following information. Sally and Sue have a strong desire to date Sam, they all live on the same street yet neither Sally nor Sue knows where Sam lives. The houses on this street are numbered 1 to 99. Sally asks Sam. “Is your house number a perfect square?” He answers. Then Sally asks. “Is it greater than 50?” He answers again. Sally thinks she now knows the address of Sam’s house and decides to visit. When she gets there, she finds out she is wrong. This is not surprising, considering Sam answered only the second question truthfully. Sue, unaware of Sally’s conversation, asks Sam two questions. Sue asks, “Is your house number a perfect cube?” He answers. She then asks, “Is it greater than 25?” He answers again. Sue thinks she knows where Sam lives and decides to pay him a visit. She too is mistaken as Sam once again answered only the second question truthfully. Sam’s house number is less than the numbers of the houses where Sue and Sally live, and that the sum of all three of their numbers is a perfect square multiplied by two. 42] What is Sally’s house number? (a) 64 (b) 81 (c) 25 (d) 24 43] What is Sue’s house number? (a) 64 (b) 81 (c) 55 (d) 54 44] What is Sam’s house number? (a) 45 (b) 55 (c) 65 (d) 72
CSAT DI & LR 01
24 © Copyright 2011.Think & Learn Pvt. Ltd. Copying or Reproduction without the prior permission of the author is prohibited
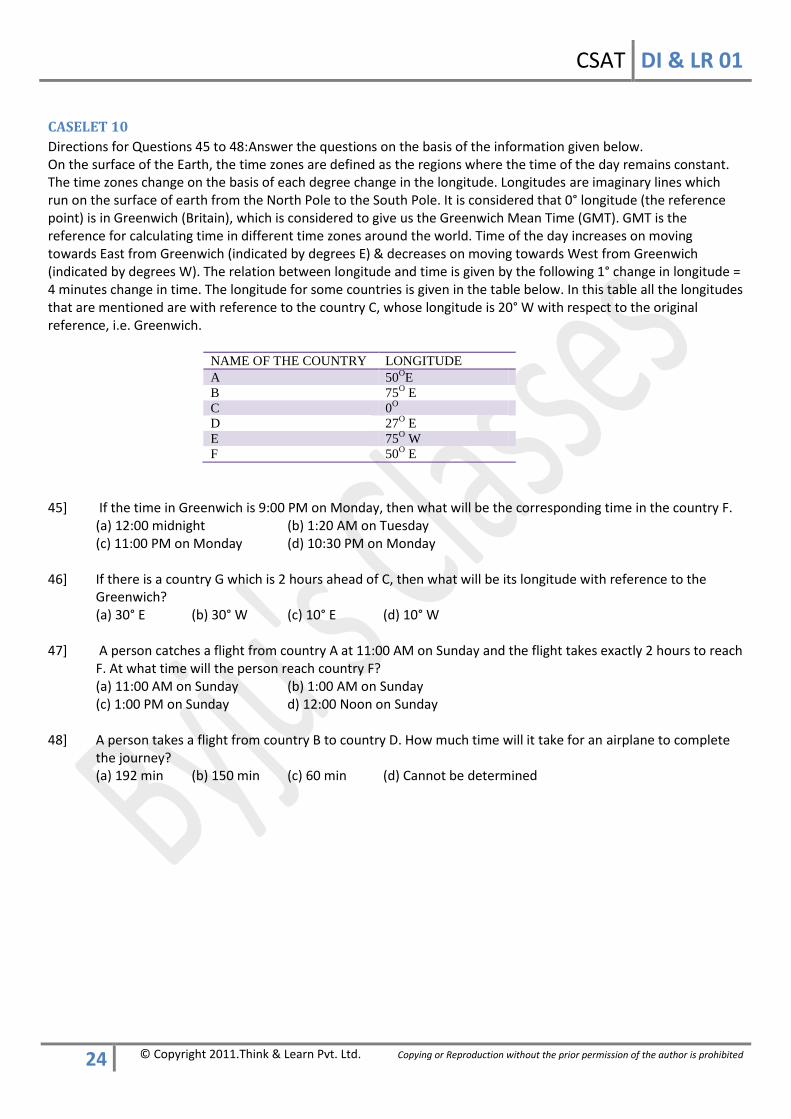
CASELET 10
Directions for Questions 45 to 48:Answer the questions on the basis of the information given below. On the surface of the Earth, the time zones are defined as the regions where the time of the day remains constant. The time zones change on the basis of each degree change in the longitude. Longitudes are imaginary lines which run on the surface of earth from the North Pole to the South Pole. It is considered that 0° longitude (the reference point) is in Greenwich (Britain), which is considered to give us the Greenwich Mean Time (GMT). GMT is the reference for calculating time in different time zones around the world. Time of the day increases on moving towards East from Greenwich (indicated by degrees E) & decreases on moving towards West from Greenwich (indicated by degrees W). The relation between longitude and time is given by the following 1° change in longitude = 4 minutes change in time. The longitude for some countries is given in the table below. In this table all the longitudes that are mentioned are with reference to the country C, whose longitude is 20° W with respect to the original reference, i.e. Greenwich.
NAME OF THE COUNTRY LONGITUDE
A 50OE
B 75O E
C 0O
D 27O E
E 75O W
F 50O E
45] If the time in Greenwich is 9:00 PM on Monday, then what will be the corresponding time in the country F. (a) 12:00 midnight (b) 1:20 AM on Tuesday (c) 11:00 PM on Monday (d) 10:30 PM on Monday 46] If there is a country G which is 2 hours ahead of C, then what will be its longitude with reference to the Greenwich? (a) 30° E (b) 30° W (c) 10° E (d) 10° W 47] A person catches a flight from country A at 11:00 AM on Sunday and the flight takes exactly 2 hours to reach
F. At what time will the person reach country F? (a) 11:00 AM on Sunday (b) 1:00 AM on Sunday
(c) 1:00 PM on Sunday d) 12:00 Noon on Sunday 48] A person takes a flight from country B to country D. How much time will it take for an airplane to complete
the journey? (a) 192 min (b) 150 min (c) 60 min (d) Cannot be determined
CSAT DI & LR 01
25 © Copyright 2011.Think & Learn Pvt. Ltd. Copying or Reproduction without the prior permission of the author is prohibited
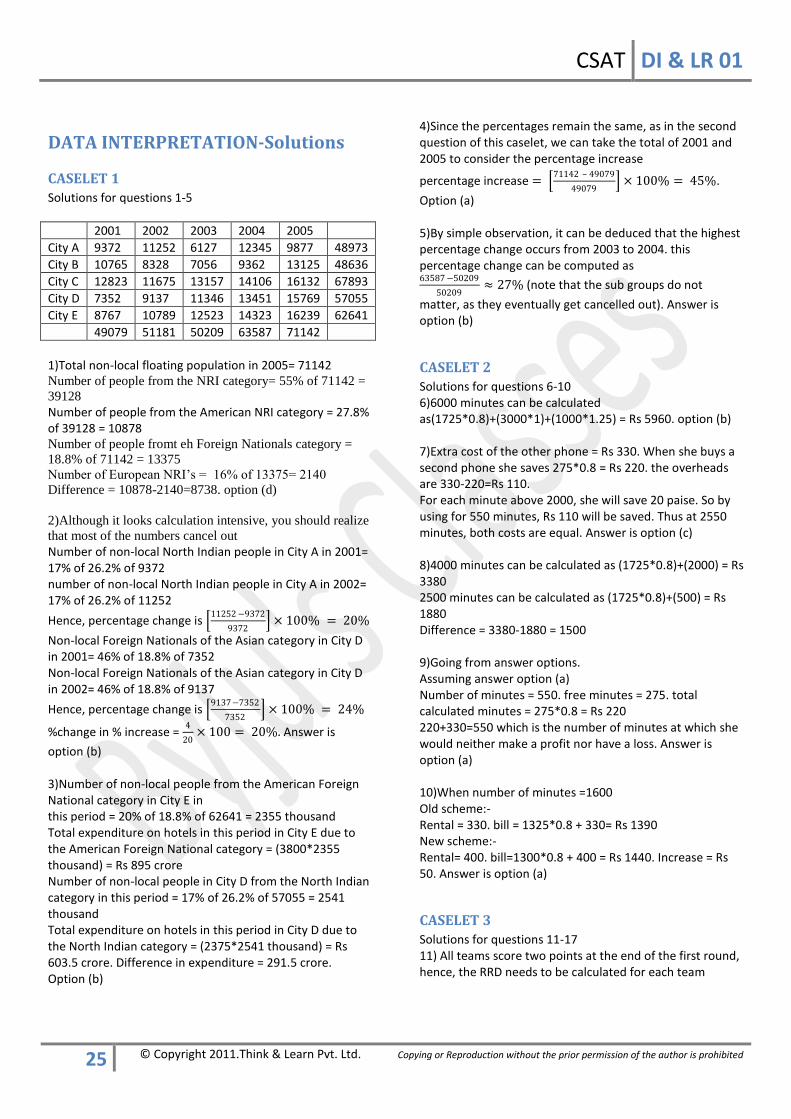
DATA INTERPRETATION-Solutions
CASELET 1
Solutions for questions 1-5
2001 2002 2003 2004 2005
City A 9372 11252 6127 12345 9877 48973
City B 10765 8328 7056 9362 13125 48636
City C 12823 11675 13157 14106 16132 67893
City D 7352 9137 11346 13451 15769 57055
City E 8767 10789 12523 14323 16239 62641
49079 51181 50209 63587 71142
1)Total non-local floating population in 2005= 71142 Number of people from the NRI category= 55% of 71142 =
39128
Number of people from the American NRI category = 27.8% of 39128 = 10878 Number of people fromt eh Foreign Nationals category =
18.8% of 71142 = 13375
Number of European NRI’s = 16% of 13375= 2140
Difference = 10878-2140=8738. option (d)
2)Although it looks calculation intensive, you should realize
that most of the numbers cancel out
Number of non-local North Indian people in City A in 2001= 17% of 26.2% of 9372 number of non-local North Indian people in City A in 2002= 17% of 26.2% of 11252
Hence, percentage change is 11252 −9372
9372 × 100% = 20%
Non-local Foreign Nationals of the Asian category in City D in 2001= 46% of 18.8% of 7352 Non-local Foreign Nationals of the Asian category in City D in 2002= 46% of 18.8% of 9137
Hence, percentage change is 9137−7352
7352 × 100% = 24%
%change in % increase = 4
20× 100 = 20%. Answer is
option (b) 3)Number of non-local people from the American Foreign National category in City E in this period = 20% of 18.8% of 62641 = 2355 thousand Total expenditure on hotels in this period in City E due to the American Foreign National category = (3800*2355 thousand) = Rs 895 crore Number of non-local people in City D from the North Indian category in this period = 17% of 26.2% of 57055 = 2541 thousand Total expenditure on hotels in this period in City D due to the North Indian category = (2375*2541 thousand) = Rs 603.5 crore. Difference in expenditure = 291.5 crore. Option (b)
4)Since the percentages remain the same, as in the second question of this caselet, we can take the total of 2001 and 2005 to consider the percentage increase
percentage increase = 71142 – 49079
49079 × 100% = 45%.
Option (a) 5)By simple observation, it can be deduced that the highest percentage change occurs from 2003 to 2004. this percentage change can be computed as 63587 −50209
50209≈ 27% (note that the sub groups do not
matter, as they eventually get cancelled out). Answer is option (b)
CASELET 2
Solutions for questions 6-10 6)6000 minutes can be calculated as(1725*0.8)+(3000*1)+(1000*1.25) = Rs 5960. option (b) 7)Extra cost of the other phone = Rs 330. When she buys a second phone she saves 275*0.8 = Rs 220. the overheads are 330-220=Rs 110. For each minute above 2000, she will save 20 paise. So by using for 550 minutes, Rs 110 will be saved. Thus at 2550 minutes, both costs are equal. Answer is option (c) 8)4000 minutes can be calculated as (1725*0.8)+(2000) = Rs 3380 2500 minutes can be calculated as (1725*0.8)+(500) = Rs 1880 Difference = 3380-1880 = 1500 9)Going from answer options. Assuming answer option (a) Number of minutes = 550. free minutes = 275. total calculated minutes = 275*0.8 = Rs 220 220+330=550 which is the number of minutes at which she would neither make a profit nor have a loss. Answer is option (a) 10)When number of minutes =1600 Old scheme:- Rental = 330. bill = 1325*0.8 + 330= Rs 1390 New scheme:- Rental= 400. bill=1300*0.8 + 400 = Rs 1440. Increase = Rs 50. Answer is option (a)
CASELET 3
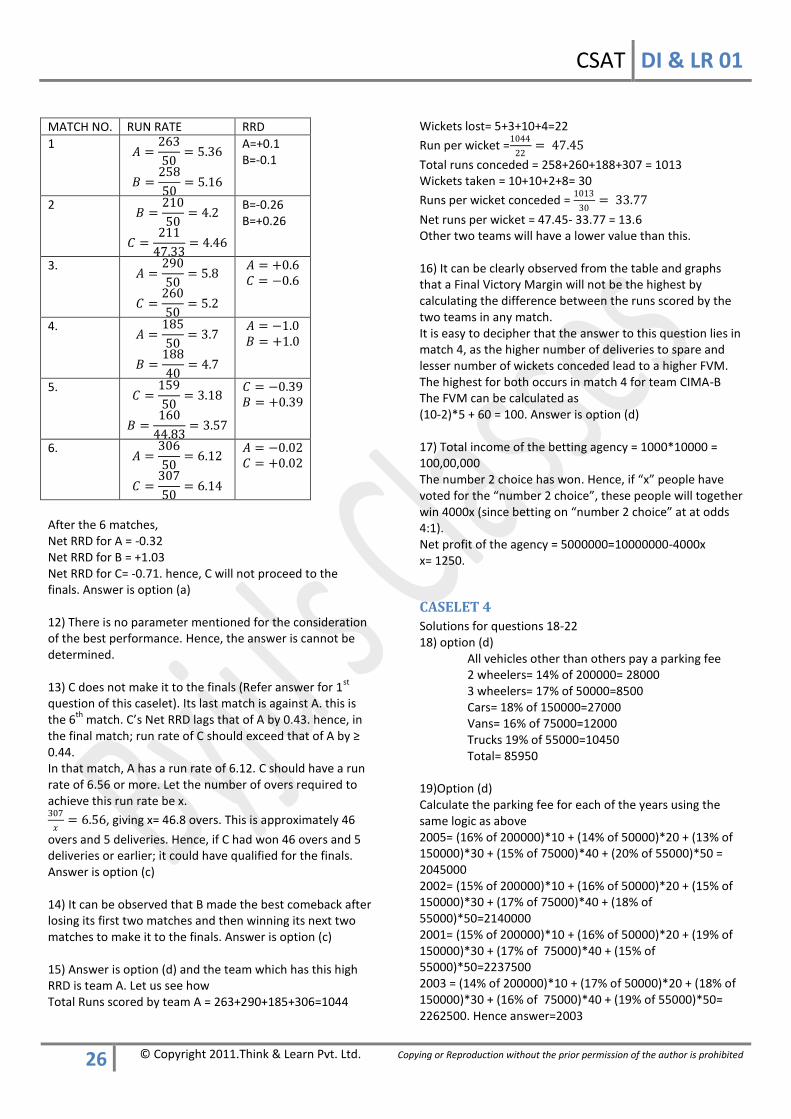
Solutions for questions 11-17 11) All teams score two points at the end of the first round, hence, the RRD needs to be calculated for each team
CSAT DI & LR 01
26 © Copyright 2011.Think & Learn Pvt. Ltd. Copying or Reproduction without the prior permission of the author is prohibited
MATCH NO. RUN RATE RRD
1 𝐴 =
263
50= 5.36
𝐵 =258
50= 5.16
A=+0.1 B=-0.1
2 𝐵 =
210
50= 4.2
𝐶 =211
47.33= 4.46
B=-0.26 B=+0.26
3. 𝐴 =
290
50= 5.8
𝐶 =260
50= 5.2
𝐴 = +0.6 𝐶 = −0.6
4. 𝐴 =
185
50= 3.7
𝐵 =188
40= 4.7
𝐴 = −1.0 𝐵 = +1.0
5. 𝐶 =
159
50= 3.18
𝐵 =160
44.83= 3.57
𝐶 = −0.39 𝐵 = +0.39
6. 𝐴 =
306
50= 6.12
𝐶 =307
50= 6.14
𝐴 = −0.02 𝐶 = +0.02
After the 6 matches, Net RRD for A = -0.32 Net RRD for B = +1.03 Net RRD for C= -0.71. hence, C will not proceed to the finals. Answer is option (a) 12) There is no parameter mentioned for the consideration of the best performance. Hence, the answer is cannot be determined. 13) C does not make it to the finals (Refer answer for 1
st
question of this caselet). Its last match is against A. this is the 6
th match. C’s Net RRD lags that of A by 0.43. hence, in
the final match; run rate of C should exceed that of A by ≥ 0.44. In that match, A has a run rate of 6.12. C should have a run rate of 6.56 or more. Let the number of overs required to achieve this run rate be x. 307
𝑥= 6.56, giving x= 46.8 overs. This is approximately 46
overs and 5 deliveries. Hence, if C had won 46 overs and 5 deliveries or earlier; it could have qualified for the finals. Answer is option (c) 14) It can be observed that B made the best comeback after losing its first two matches and then winning its next two matches to make it to the finals. Answer is option (c) 15) Answer is option (d) and the team which has this high RRD is team A. Let us see how Total Runs scored by team A = 263+290+185+306=1044
Wickets lost= 5+3+10+4=22
Run per wicket =1044
22= 47.45
Total runs conceded = 258+260+188+307 = 1013 Wickets taken = 10+10+2+8= 30
Runs per wicket conceded = 1013
30= 33.77
Net runs per wicket = 47.45- 33.77 = 13.6 Other two teams will have a lower value than this. 16) It can be clearly observed from the table and graphs that a Final Victory Margin will not be the highest by calculating the difference between the runs scored by the two teams in any match. It is easy to decipher that the answer to this question lies in match 4, as the higher number of deliveries to spare and lesser number of wickets conceded lead to a higher FVM. The highest for both occurs in match 4 for team CIMA-B The FVM can be calculated as (10-2)*5 + 60 = 100. Answer is option (d) 17) Total income of the betting agency = 1000*10000 = 100,00,000 The number 2 choice has won. Hence, if “x” people have voted for the “number 2 choice”, these people will together win 4000x (since betting on “number 2 choice” at at odds 4:1). Net profit of the agency = 5000000=10000000-4000x x= 1250.
CASELET 4
Solutions for questions 18-22 18) option (d) All vehicles other than others pay a parking fee
2 wheelers= 14% of 200000= 28000 3 wheelers= 17% of 50000=8500 Cars= 18% of 150000=27000 Vans= 16% of 75000=12000 Trucks 19% of 55000=10450 Total= 85950 19)Option (d) Calculate the parking fee for each of the years using the same logic as above 2005= (16% of 200000)*10 + (14% of 50000)*20 + (13% of 150000)*30 + (15% of 75000)*40 + (20% of 55000)*50 = 2045000 2002= (15% of 200000)*10 + (16% of 50000)*20 + (15% of 150000)*30 + (17% of 75000)*40 + (18% of 55000)*50=2140000 2001= (15% of 200000)*10 + (16% of 50000)*20 + (19% of 150000)*30 + (17% of 75000)*40 + (15% of 55000)*50=2237500 2003 = (14% of 200000)*10 + (17% of 50000)*20 + (18% of 150000)*30 + (16% of 75000)*40 + (19% of 55000)*50= 2262500. Hence answer=2003
CSAT DI & LR 01
27 © Copyright 2011.Think & Learn Pvt. Ltd. Copying or Reproduction without the prior permission of the author is prohibited
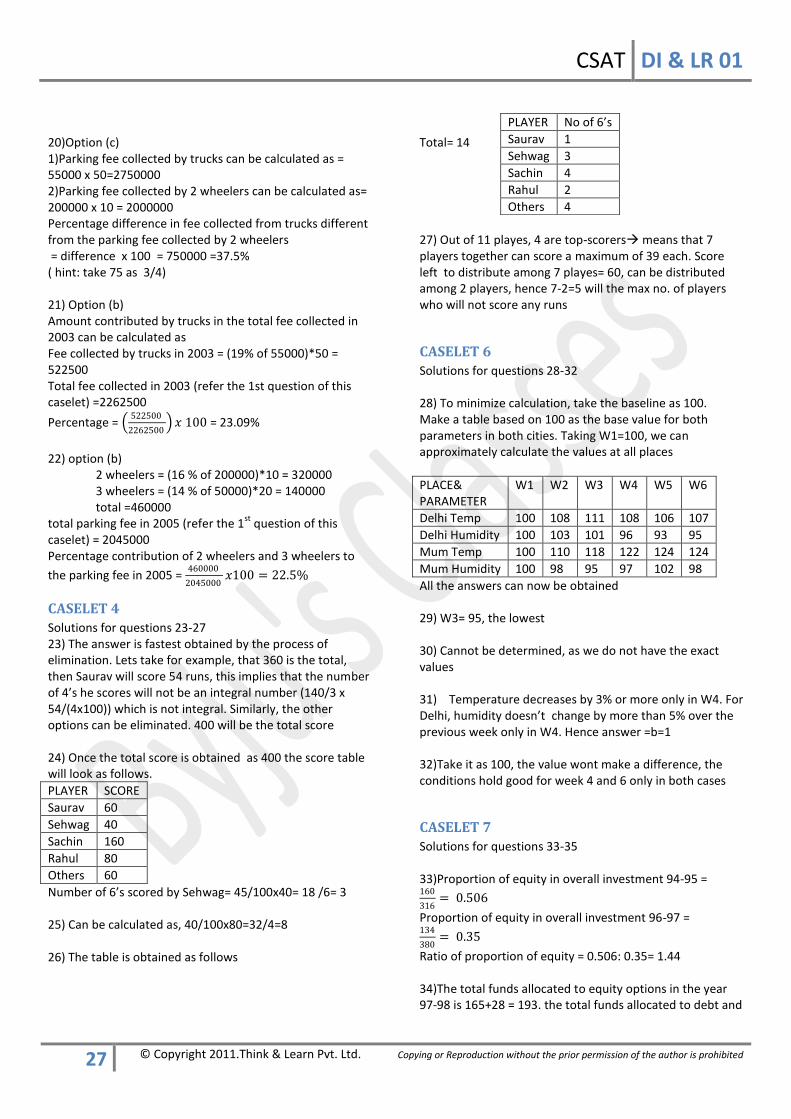
20)Option (c) 1)Parking fee collected by trucks can be calculated as = 55000 x 50=2750000 2)Parking fee collected by 2 wheelers can be calculated as= 200000 x 10 = 2000000 Percentage difference in fee collected from trucks different from the parking fee collected by 2 wheelers = difference x 100 = 750000 =37.5% ( hint: take 75 as 3/4) 21) Option (b) Amount contributed by trucks in the total fee collected in 2003 can be calculated as Fee collected by trucks in 2003 = (19% of 55000)*50 = 522500 Total fee collected in 2003 (refer the 1st question of this caselet) =2262500
Percentage = 522500
2262500 𝑥 100 = 23.09%
22) option (b) 2 wheelers = (16 % of 200000)*10 = 320000 3 wheelers = (14 % of 50000)*20 = 140000 total =460000 total parking fee in 2005 (refer the 1
st question of this
caselet) = 2045000 Percentage contribution of 2 wheelers and 3 wheelers to
the parking fee in 2005 = 460000
2045000𝑥100 = 22.5%
CASELET 4
Solutions for questions 23-27 23) The answer is fastest obtained by the process of elimination. Lets take for example, that 360 is the total, then Saurav will score 54 runs, this implies that the number of 4’s he scores will not be an integral number (140/3 x 54/(4x100)) which is not integral. Similarly, the other options can be eliminated. 400 will be the total score 24) Once the total score is obtained as 400 the score table will look as follows.
PLAYER SCORE
Saurav 60
Sehwag 40
Sachin 160
Rahul 80
Others 60
Number of 6’s scored by Sehwag= 45/100x40= 18 /6= 3 25) Can be calculated as, 40/100x80=32/4=8 26) The table is obtained as follows
Total= 14 27) Out of 11 playes, 4 are top-scorers means that 7 players together can score a maximum of 39 each. Score left to distribute among 7 playes= 60, can be distributed among 2 players, hence 7-2=5 will the max no. of players who will not score any runs
CASELET 6
Solutions for questions 28-32 28) To minimize calculation, take the baseline as 100. Make a table based on 100 as the base value for both parameters in both cities. Taking W1=100, we can approximately calculate the values at all places
PLACE& PARAMETER
W1 W2 W3 W4 W5 W6
Delhi Temp 100 108 111 108 106 107
Delhi Humidity 100 103 101 96 93 95
Mum Temp 100 110 118 122 124 124
Mum Humidity 100 98 95 97 102 98
All the answers can now be obtained 29) W3= 95, the lowest 30) Cannot be determined, as we do not have the exact values 31) Temperature decreases by 3% or more only in W4. For Delhi, humidity doesn’t change by more than 5% over the previous week only in W4. Hence answer =b=1 32)Take it as 100, the value wont make a difference, the conditions hold good for week 4 and 6 only in both cases
CASELET 7
Solutions for questions 33-35 33)Proportion of equity in overall investment 94-95 = 160
316= 0.506
Proportion of equity in overall investment 96-97 = 134
380= 0.35
Ratio of proportion of equity = 0.506: 0.35= 1.44 34)The total funds allocated to equity options in the year 97-98 is 165+28 = 193. the total funds allocated to debt and
PLAYER No of 6’s
Saurav 1
Sehwag 3
Sachin 4
Rahul 2
Others 4
CSAT DI & LR 01
28 © Copyright 2011.Think & Learn Pvt. Ltd. Copying or Reproduction without the prior permission of the author is prohibited
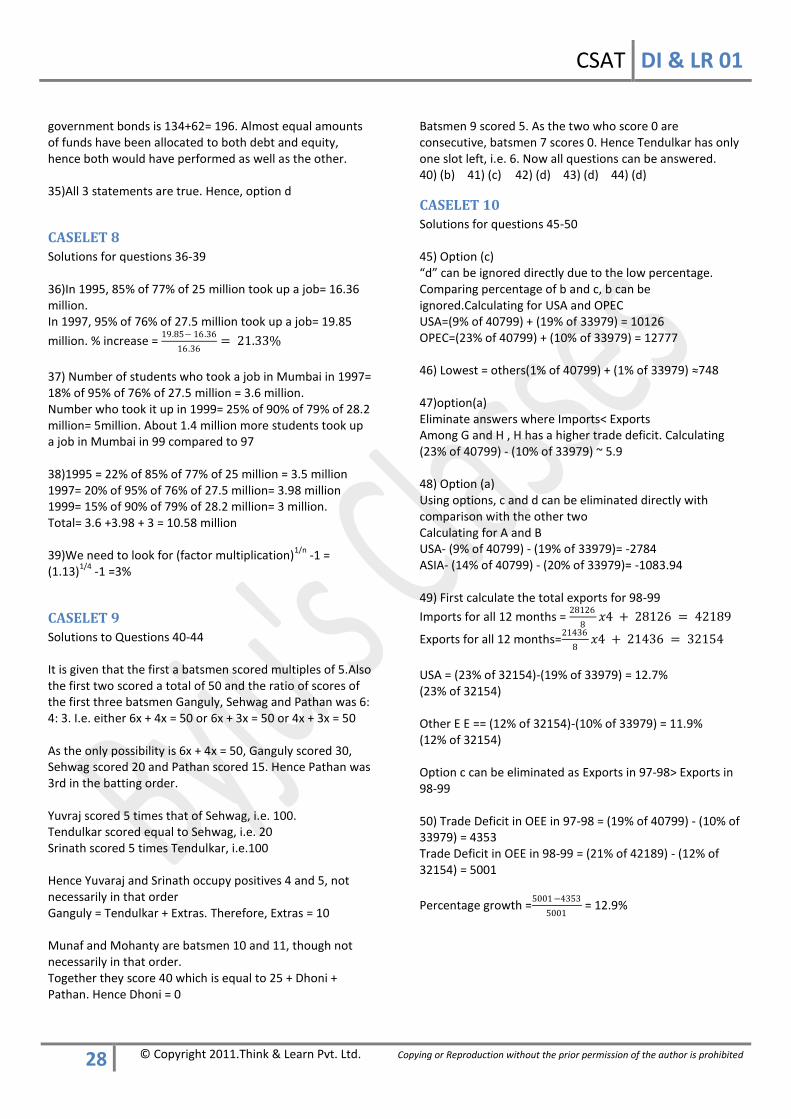
government bonds is 134+62= 196. Almost equal amounts of funds have been allocated to both debt and equity, hence both would have performed as well as the other. 35)All 3 statements are true. Hence, option d
CASELET 8
Solutions for questions 36-39 36)In 1995, 85% of 77% of 25 million took up a job= 16.36 million. In 1997, 95% of 76% of 27.5 million took up a job= 19.85
million. % increase = 19.85− 16.36
16.36= 21.33%
37) Number of students who took a job in Mumbai in 1997= 18% of 95% of 76% of 27.5 million = 3.6 million. Number who took it up in 1999= 25% of 90% of 79% of 28.2 million= 5million. About 1.4 million more students took up a job in Mumbai in 99 compared to 97 38)1995 = 22% of 85% of 77% of 25 million = 3.5 million 1997= 20% of 95% of 76% of 27.5 million= 3.98 million 1999= 15% of 90% of 79% of 28.2 million= 3 million. Total= 3.6 +3.98 + 3 = 10.58 million 39)We need to look for (factor multiplication)
1/n -1 =
(1.13)1/4
-1 =3%
CASELET 9
Solutions to Questions 40-44 It is given that the first a batsmen scored multiples of 5.Also the first two scored a total of 50 and the ratio of scores of the first three batsmen Ganguly, Sehwag and Pathan was 6: 4: 3. I.e. either 6x + 4x = 50 or 6x + 3x = 50 or 4x + 3x = 50 As the only possibility is 6x + 4x = 50, Ganguly scored 30, Sehwag scored 20 and Pathan scored 15. Hence Pathan was 3rd in the batting order. Yuvraj scored 5 times that of Sehwag, i.e. 100. Tendulkar scored equal to Sehwag, i.e. 20 Srinath scored 5 times Tendulkar, i.e.100 Hence Yuvaraj and Srinath occupy positives 4 and 5, not necessarily in that order Ganguly = Tendulkar + Extras. Therefore, Extras = 10 Munaf and Mohanty are batsmen 10 and 11, though not necessarily in that order. Together they score 40 which is equal to 25 + Dhoni + Pathan. Hence Dhoni = 0
Batsmen 9 scored 5. As the two who score 0 are consecutive, batsmen 7 scores 0. Hence Tendulkar has only one slot left, i.e. 6. Now all questions can be answered. 40) (b) 41) (c) 42) (d) 43) (d) 44) (d)
CASELET 10
Solutions for questions 45-50 45) Option (c) “d” can be ignored directly due to the low percentage. Comparing percentage of b and c, b can be ignored.Calculating for USA and OPEC USA=(9% of 40799) + (19% of 33979) = 10126 OPEC=(23% of 40799) + (10% of 33979) = 12777 46) Lowest = others(1% of 40799) + (1% of 33979) ≈748 47)option(a) Eliminate answers where Imports< Exports Among G and H , H has a higher trade deficit. Calculating (23% of 40799) - (10% of 33979) ~ 5.9 48) Option (a) Using options, c and d can be eliminated directly with comparison with the other two Calculating for A and B USA- (9% of 40799) - (19% of 33979)= -2784 ASIA- (14% of 40799) - (20% of 33979)= -1083.94 49) First calculate the total exports for 98-99
Imports for all 12 months = 28126
8𝑥4 + 28126 = 42189
Exports for all 12 months=21436
8𝑥4 + 21436 = 32154
USA = (23% of 32154)-(19% of 33979) = 12.7% (23% of 32154) Other E E == (12% of 32154)-(10% of 33979) = 11.9% (12% of 32154) Option c can be eliminated as Exports in 97-98> Exports in 98-99 50) Trade Deficit in OEE in 97-98 = (19% of 40799) - (10% of 33979) = 4353 Trade Deficit in OEE in 98-99 = (21% of 42189) - (12% of 32154) = 5001
Percentage growth =5001−4353
5001 = 12.9%
CSAT DI & LR 01
29 © Copyright 2011.Think & Learn Pvt. Ltd. Copying or Reproduction without the prior permission of the author is prohibited
LOGICAL REASONING-Solutions
CASELET 1
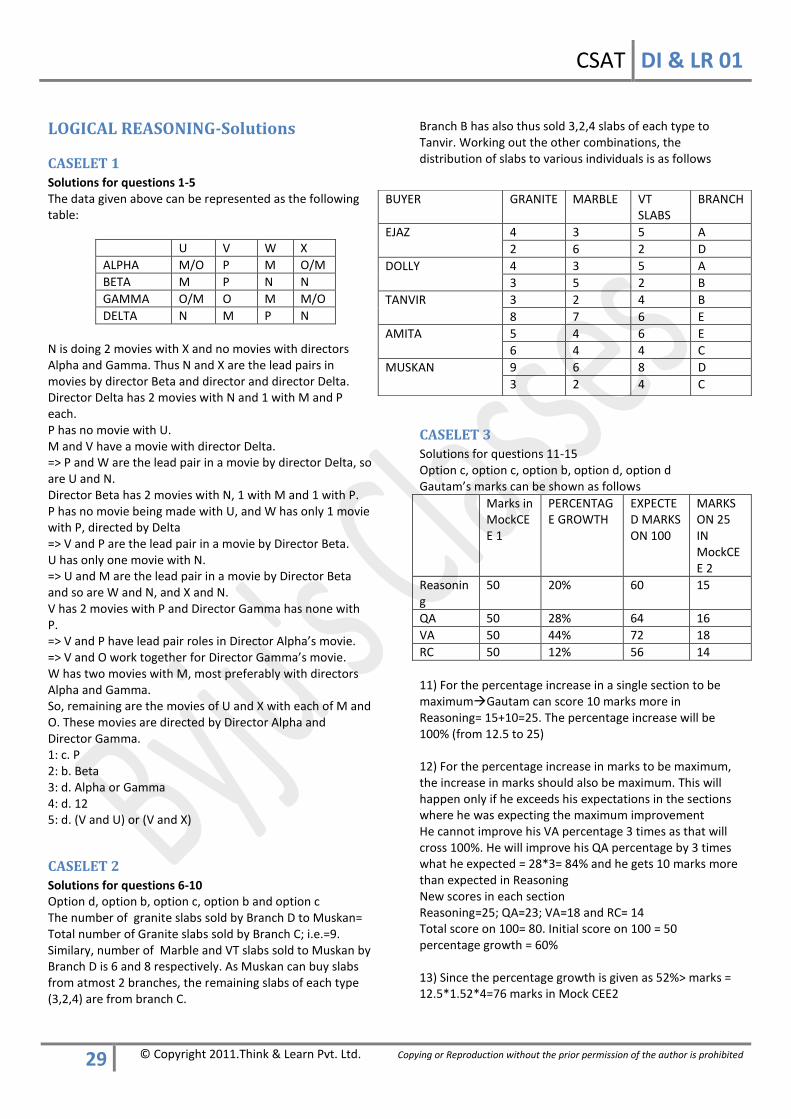
Solutions for questions 1-5 The data given above can be represented as the following table:
U V W X
ALPHA M/O P M O/M
BETA M P N N
GAMMA O/M O M M/O
DELTA N M P N
N is doing 2 movies with X and no movies with directors Alpha and Gamma. Thus N and X are the lead pairs in movies by director Beta and director and director Delta. Director Delta has 2 movies with N and 1 with M and P each. P has no movie with U. M and V have a movie with director Delta. => P and W are the lead pair in a movie by director Delta, so are U and N. Director Beta has 2 movies with N, 1 with M and 1 with P. P has no movie being made with U, and W has only 1 movie with P, directed by Delta => V and P are the lead pair in a movie by Director Beta. U has only one movie with N. => U and M are the lead pair in a movie by Director Beta and so are W and N, and X and N. V has 2 movies with P and Director Gamma has none with P. => V and P have lead pair roles in Director Alpha’s movie. => V and O work together for Director Gamma’s movie. W has two movies with M, most preferably with directors Alpha and Gamma. So, remaining are the movies of U and X with each of M and O. These movies are directed by Director Alpha and Director Gamma. 1: c. P 2: b. Beta 3: d. Alpha or Gamma 4: d. 12 5: d. (V and U) or (V and X)
CASELET 2
Solutions for questions 6-10 Option d, option b, option c, option b and option c The number of granite slabs sold by Branch D to Muskan= Total number of Granite slabs sold by Branch C; i.e.=9. Similary, number of Marble and VT slabs sold to Muskan by Branch D is 6 and 8 respectively. As Muskan can buy slabs from atmost 2 branches, the remaining slabs of each type (3,2,4) are from branch C.
Branch B has also thus sold 3,2,4 slabs of each type to Tanvir. Working out the other combinations, the distribution of slabs to various individuals is as follows
CASELET 3
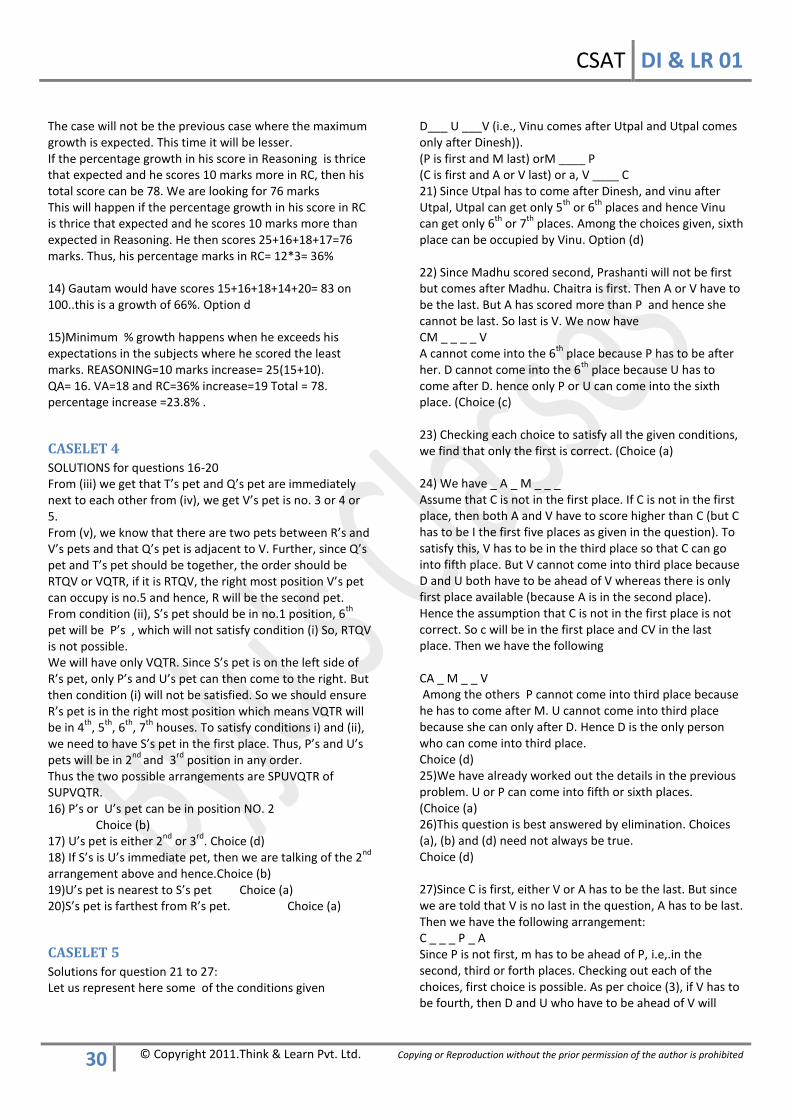
Solutions for questions 11-15 Option c, option c, option b, option d, option d Gautam’s marks can be shown as follows
Marks in MockCEE 1
PERCENTAGE GROWTH
EXPECTED MARKS ON 100
MARKS ON 25 IN MockCEE 2
Reasoning
50 20% 60 15
QA 50 28% 64 16
VA 50 44% 72 18
RC 50 12% 56 14
11) For the percentage increase in a single section to be maximumGautam can score 10 marks more in Reasoning= 15+10=25. The percentage increase will be 100% (from 12.5 to 25) 12) For the percentage increase in marks to be maximum, the increase in marks should also be maximum. This will happen only if he exceeds his expectations in the sections where he was expecting the maximum improvement He cannot improve his VA percentage 3 times as that will cross 100%. He will improve his QA percentage by 3 times what he expected = 28*3= 84% and he gets 10 marks more than expected in Reasoning New scores in each section Reasoning=25; QA=23; VA=18 and RC= 14 Total score on 100= 80. Initial score on 100 = 50 percentage growth = 60% 13) Since the percentage growth is given as 52%> marks = 12.5*1.52*4=76 marks in Mock CEE2
BUYER GRANITE MARBLE VT SLABS
BRANCH
EJAZ 4 3 5 A
2 6 2 D
DOLLY 4 3 5 A
3 5 2 B
TANVIR 3 2 4 B
8 7 6 E
AMITA 5 4 6 E
6 4 4 C
MUSKAN 9 6 8 D
3 2 4 C
CSAT DI & LR 01
30 © Copyright 2011.Think & Learn Pvt. Ltd. Copying or Reproduction without the prior permission of the author is prohibited
The case will not be the previous case where the maximum growth is expected. This time it will be lesser. If the percentage growth in his score in Reasoning is thrice that expected and he scores 10 marks more in RC, then his total score can be 78. We are looking for 76 marks This will happen if the percentage growth in his score in RC is thrice that expected and he scores 10 marks more than expected in Reasoning. He then scores 25+16+18+17=76 marks. Thus, his percentage marks in RC= 12*3= 36% 14) Gautam would have scores 15+16+18+14+20= 83 on 100..this is a growth of 66%. Option d 15)Minimum % growth happens when he exceeds his expectations in the subjects where he scored the least marks. REASONING=10 marks increase= 25(15+10). QA= 16. VA=18 and RC=36% increase=19 Total = 78. percentage increase =23.8% .
CASELET 4
SOLUTIONS for questions 16-20 From (iii) we get that T’s pet and Q’s pet are immediately next to each other from (iv), we get V’s pet is no. 3 or 4 or 5. From (v), we know that there are two pets between R’s and V’s pets and that Q’s pet is adjacent to V. Further, since Q’s pet and T’s pet should be together, the order should be RTQV or VQTR, if it is RTQV, the right most position V’s pet can occupy is no.5 and hence, R will be the second pet. From condition (ii), S’s pet should be in no.1 position, 6
th
pet will be P’s , which will not satisfy condition (i) So, RTQV is not possible. We will have only VQTR. Since S’s pet is on the left side of R’s pet, only P’s and U’s pet can then come to the right. But then condition (i) will not be satisfied. So we should ensure R’s pet is in the right most position which means VQTR will be in 4
th, 5
th, 6
th, 7
th houses. To satisfy conditions i) and (ii),
we need to have S’s pet in the first place. Thus, P’s and U’s pets will be in 2
nd and 3
rd position in any order.
Thus the two possible arrangements are SPUVQTR of SUPVQTR. 16) P’s or U’s pet can be in position NO. 2 Choice (b) 17) U’s pet is either 2
nd or 3
rd. Choice (d)
18) If S’s is U’s immediate pet, then we are talking of the 2nd
arrangement above and hence.Choice (b) 19)U’s pet is nearest to S’s pet Choice (a) 20)S’s pet is farthest from R’s pet. Choice (a)
CASELET 5
Solutions for question 21 to 27: Let us represent here some of the conditions given
D___ U ___V (i.e., Vinu comes after Utpal and Utpal comes only after Dinesh)). (P is first and M last) orM ____ P (C is first and A or V last) or a, V ____ C 21) Since Utpal has to come after Dinesh, and vinu after Utpal, Utpal can get only 5
th or 6
th places and hence Vinu
can get only 6th
or 7th
places. Among the choices given, sixth place can be occupied by Vinu. Option (d) 22) Since Madhu scored second, Prashanti will not be first but comes after Madhu. Chaitra is first. Then A or V have to be the last. But A has scored more than P and hence she cannot be last. So last is V. We now have CM _ _ _ _ V A cannot come into the 6
th place because P has to be after
her. D cannot come into the 6th
place because U has to come after D. hence only P or U can come into the sixth place. (Choice (c) 23) Checking each choice to satisfy all the given conditions, we find that only the first is correct. (Choice (a) 24) We have _ A _ M _ _ _ Assume that C is not in the first place. If C is not in the first place, then both A and V have to score higher than C (but C has to be I the first five places as given in the question). To satisfy this, V has to be in the third place so that C can go into fifth place. But V cannot come into third place because D and U both have to be ahead of V whereas there is only first place available (because A is in the second place). Hence the assumption that C is not in the first place is not correct. So c will be in the first place and CV in the last place. Then we have the following CA _ M _ _ V Among the others P cannot come into third place because he has to come after M. U cannot come into third place because she can only after D. Hence D is the only person who can come into third place. Choice (d) 25)We have already worked out the details in the previous problem. U or P can come into fifth or sixth places. (Choice (a) 26)This question is best answered by elimination. Choices (a), (b) and (d) need not always be true. Choice (d) 27)Since C is first, either V or A has to be the last. But since we are told that V is no last in the question, A has to be last. Then we have the following arrangement: C _ _ _ P _ A Since P is not first, m has to be ahead of P, i.e,.in the second, third or forth places. Checking out each of the choices, first choice is possible. As per choice (3), if V has to be fourth, then D and U who have to be ahead of V will
CSAT DI & LR 01
31 © Copyright 2011.Think & Learn Pvt. Ltd. Copying or Reproduction without the prior permission of the author is prohibited
come in 2nd
and 3rd
places. But this will not leave any place for M who we already said has to be in the 2
nd, 3
rd places.
But this will not leave any place for M who we already said has to be in the 2
nd, 3
rd or 4
th places. So, V cannot come in
the 4th
place.(Choice (c)
CASELET 6
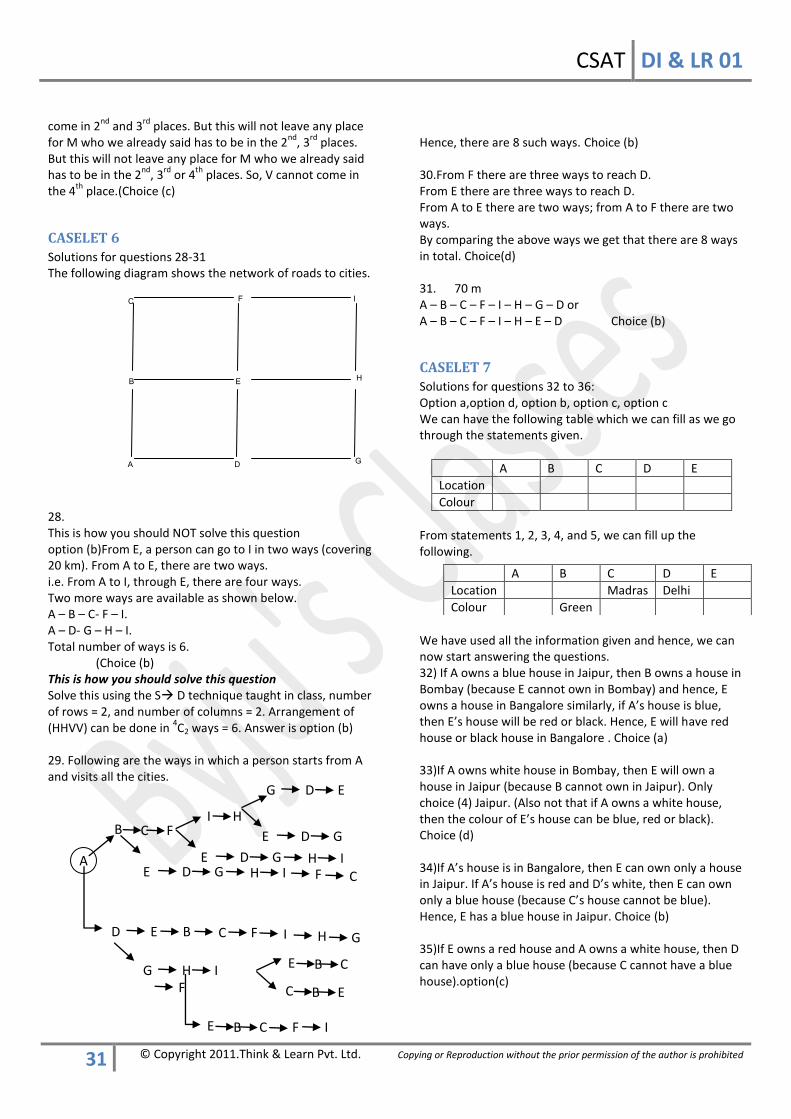
Solutions for questions 28-31 The following diagram shows the network of roads to cities. 28. This is how you should NOT solve this question option (b)From E, a person can go to I in two ways (covering 20 km). From A to E, there are two ways. i.e. From A to I, through E, there are four ways. Two more ways are available as shown below. A – B – C- F – I. A – D- G – H – I. Total number of ways is 6. (Choice (b) This is how you should solve this question Solve this using the S D technique taught in class, number of rows = 2, and number of columns = 2. Arrangement of (HHVV) can be done in
4C2 ways = 6. Answer is option (b)
29. Following are the ways in which a person starts from A and visits all the cities.
Hence, there are 8 such ways. Choice (b) 30.From F there are three ways to reach D. From E there are three ways to reach D. From A to E there are two ways; from A to F there are two ways. By comparing the above ways we get that there are 8 ways in total. Choice(d) 31. 70 m A – B – C – F – I – H – G – D or A – B – C – F – I – H – E – D Choice (b)
CASELET 7
Solutions for questions 32 to 36: Option a,option d, option b, option c, option c We can have the following table which we can fill as we go through the statements given.
A B C D E
Location
Colour
From statements 1, 2, 3, 4, and 5, we can fill up the following.
We have used all the information given and hence, we can now start answering the questions. 32) If A owns a blue house in Jaipur, then B owns a house in Bombay (because E cannot own in Bombay) and hence, E owns a house in Bangalore similarly, if A’s house is blue, then E’s house will be red or black. Hence, E will have red house or black house in Bangalore . Choice (a) 33)If A owns white house in Bombay, then E will own a house in Jaipur (because B cannot own in Jaipur). Only choice (4) Jaipur. (Also not that if A owns a white house, then the colour of E’s house can be blue, red or black). Choice (d) 34)If A’s house is in Bangalore, then E can own only a house in Jaipur. If A’s house is red and D’s white, then E can own only a blue house (because C’s house cannot be blue). Hence, E has a blue house in Jaipur. Choice (b) 35)If E owns a red house and A owns a white house, then D can have only a blue house (because C cannot have a blue house).option(c)
A B C D E
Location Madras Delhi
Colour Green
I C F
H E B
G D A
G D E
I H
E D G C F B
A E D G H I E D G H I F C
D E B C F I H G
G H I B C E
B E C
B C E F I
F
CSAT DI & LR 01
32 © Copyright 2011.Think & Learn Pvt. Ltd. Copying or Reproduction without the prior permission of the author is prohibited
36) If B owns a house in Bangalore, then A must own a house in Bombay (because E cannot own a house in Bombay).(Choice (c) (Note: If C’s house is black, then A’s house can be blue, red or white.)
CASELET 8
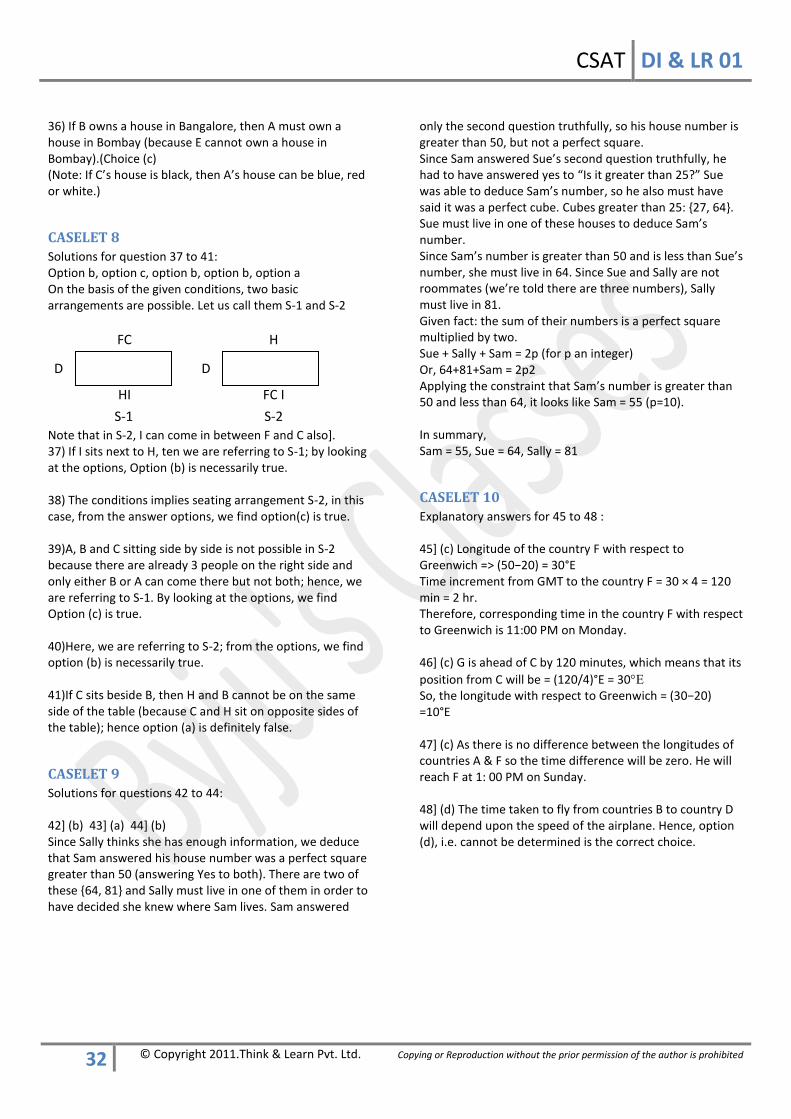
Solutions for question 37 to 41: Option b, option c, option b, option b, option a On the basis of the given conditions, two basic arrangements are possible. Let us call them S-1 and S-2 Note that in S-2, I can come in between F and C also]. 37) If I sits next to H, ten we are referring to S-1; by looking at the options, Option (b) is necessarily true. 38) The conditions implies seating arrangement S-2, in this case, from the answer options, we find option(c) is true. 39)A, B and C sitting side by side is not possible in S-2 because there are already 3 people on the right side and only either B or A can come there but not both; hence, we are referring to S-1. By looking at the options, we find Option (c) is true. 40)Here, we are referring to S-2; from the options, we find option (b) is necessarily true. 41)If C sits beside B, then H and B cannot be on the same side of the table (because C and H sit on opposite sides of the table); hence option (a) is definitely false.
CASELET 9
Solutions for questions 42 to 44: 42] (b) 43] (a) 44] (b) Since Sally thinks she has enough information, we deduce that Sam answered his house number was a perfect square greater than 50 (answering Yes to both). There are two of these {64, 81} and Sally must live in one of them in order to have decided she knew where Sam lives. Sam answered
only the second question truthfully, so his house number is greater than 50, but not a perfect square. Since Sam answered Sue’s second question truthfully, he had to have answered yes to “Is it greater than 25?” Sue was able to deduce Sam’s number, so he also must have said it was a perfect cube. Cubes greater than 25: {27, 64}. Sue must live in one of these houses to deduce Sam’s number. Since Sam’s number is greater than 50 and is less than Sue’s number, she must live in 64. Since Sue and Sally are not roommates (we’re told there are three numbers), Sally must live in 81. Given fact: the sum of their numbers is a perfect square multiplied by two. Sue + Sally + Sam = 2p (for p an integer) Or, 64+81+Sam = 2p2 Applying the constraint that Sam’s number is greater than 50 and less than 64, it looks like Sam = 55 (p=10). In summary, Sam = 55, Sue = 64, Sally = 81
CASELET 10
Explanatory answers for 45 to 48 : 45] (c) Longitude of the country F with respect to Greenwich => (50−20) = 30°E Time increment from GMT to the country F = 30 × 4 = 120 min = 2 hr. Therefore, corresponding time in the country F with respect to Greenwich is 11:00 PM on Monday. 46] (c) G is ahead of C by 120 minutes, which means that its
position from C will be = (120/4)°E = 30
So, the longitude with respect to Greenwich = (30−20) =10°E 47] (c) As there is no difference between the longitudes of countries A & F so the time difference will be zero. He will reach F at 1: 00 PM on Sunday. 48] (d) The time taken to fly from countries B to country D will depend upon the speed of the airplane. Hence, option (d), i.e. cannot be determined is the correct choice.
FC
D
HI
S-1
D
H
FC I
S-2


