Embed Size (px)
Citation preview

Data gathering and analysis to improve
the understanding of 2nd hand car and
LDV markets and implications for the cost
effectiveness and social equity of LDV
CO2 regulations
Final Report for:
DG Climate Action
24 Avenue de Beaulieu
B-1040 Brussels
Date: 2 May 2016
Authors: Kris Vanherle (TML), Robert Vergeer (CE)
Transport & Mobility Leuven
Diestsesteenweg 57
3010 Leuven
Belgium
http://www.tmleuven.be

LDV CO2 legislation and the 2nd hand vehicle market 2
Contents
Contents ............................................................................................................................................................... 2
1 Introduction ............................................................................................................................................... 4
1.1 Background ................................................................................................................................. 4
1.2 Objective ..................................................................................................................................... 5
1.3 Executive summary ................................................................................................................... 6
2 Overall methodology and structure ........................................................................................................ 9
3 Used car pricing, relevance of CO2-emissions .................................................................................. 10
3.1 Objective .................................................................................................................................. 10
3.2 Methodology ............................................................................................................................ 10
3.3 Data ........................................................................................................................................... 12
3.4 Results....................................................................................................................................... 19
3.5 Conclusions ............................................................................................................................. 27
4 Socio-demographic properties of the used car market .................................................................... 28
4.1 Objective .................................................................................................................................. 28
4.2 Data collection ........................................................................................................................ 28
4.3 Observations ........................................................................................................................... 31
4.4 Estimation of vehicle stock per income group .................................................................. 43
4.5 Conclusion ............................................................................................................................... 56
5 Used car cross-border trade .................................................................................................................. 57
5.1 Objective .................................................................................................................................. 57
5.2 Methodology ............................................................................................................................ 58
5.3 Data ........................................................................................................................................... 58
5.4 Estimation of flows ................................................................................................................ 75
5.5 Conclusions ............................................................................................................................. 78
6 Distribution of costs and benefits of CO2 legislation over social strata and member states ..... 79

LDV CO2 legislation and the 2nd hand vehicle market 3
6.1 Approach.................................................................................................................................. 79
6.2 Quantitative ............................................................................................................................. 80
6.3 Qualitative ................................................................................................................................ 90
6.4 Conclusions ............................................................................................................................. 91
7 References ............................................................................................................................................... 92
8 ANNEX .................................................................................................................................................. 94
8.1 Underlying data for figures ................................................................................................... 94
8.2 Regression model details + analysis ................................................................................... 104

LDV CO2 legislation and the 2nd hand vehicle market 4
1 Introduction
1.1 Background
EU Regulations set new vehicle fleet CO2 emission targets for 2015 and 2021 for cars and 2017 and
2020 for light commercial vehicles. The vehicles covered by the Regulations have average lifetimes
of the order of 15 years as explored in the study "Improvements to the definition of lifetime
mileage of light duty vehicles" (Ricardo-AEA - Dun et. al., 2015). These vehicles are typically
believed to have 3 or 4 owners over their lifetime with the first owner often keeping the vehicle for
around 3-4 years – often as part of a leasing contract. The second hand car market is a number of
times the size of the new car market, although the level of change of ownership varies substantially
between Member States.
Cost effectiveness and social equity are two factors to be taken into account in the design of
legislation for the period after the current Regulations. In addition, the period of time needed to
pay back any additional vehicle purchase price increase is pertinent when considering the level of
future ambition.
The study on "Improvements to the definition of lifetime mileage of light duty vehicles" also
identified that there are significant volumes of second hand vehicles traded between EU Member
States. This is likely to be of sufficient volume to have an impact on the average lifetime of vehicles
within different countries.
The trade in second hand cars was explored in considerable detail in a previous study1. This
provided mostly a one year (2008) snapshot of the EU second hand car and light commercial
vehicle trade. This trade has implications in that countries where a larger proportion of sales are
second hand vehicles imported from other EU Member States are likely to face lower incremental
costs if the additional costs of CO2 reducing technologies are not fully passed on when vehicles are
sold second hand. The study concluded that annual average net import of used vehicles of the then
recently acceded EU-12 Member States accounted for (at least) 130% of their registrations of new
vehicles. The volume of trade in second hand vehicles exported from the EU is also of interest
since it can be expected that the CO2 benefits from these vehicles will continue to be experienced
when they are driven in their destination countries.
The above suggests that the dynamics of the used car market affect the distribution of costs and
benefits of legislation among the different owners over the lifetime of the vehicles. Moreover, if the
different owners have distinct different socio-economic profiles (as is expected), this will result in
different “winners” and “losers”, both in terms of social equity as well as geographically (as a result
of international trade of used cars).
1 OKO - Mehlhart et al., 2011: European second-hand car market analysis Final Report -
http://ec.europa.eu/clima/policies/transport/vehicles/docs/2010_2nd_hand_car_en.pdf

LDV CO2 legislation and the 2nd hand vehicle market 5
1.2 Objective
The objective of this project is to improve the understanding of the second-hand car and light
commercial vehicle markets, and of the implications thereof for the cost effectiveness and social
equity of LDV CO2 regulations.
The scope of this study covers three main elements on the used car market dynamics:
1. The direct link between second-hand vehicle prices and their fuel consumption/CO2-
emission level: are fuel efficient vehicles more expensive in the second hand market and is
pricing different for consecutive ownership transfers?
2. The direct link between second-hand vehicle ownership and the buyer’s social stratum:
does the socio-economic profile differ between new car owners and (different age-classes
of) used car owners?
3. The geographic component of the used car market: Which Member States are the main
importers and exporters of used cars? Are there specific relations and what are Member
States used car market specifics in terms of size and socio-demographic properties?
The main objective is to identify key properties of the used car market dynamics that cause
distribution effects of costs and benefits of new EU legislation on CO2 emission standards for cars.
We go into detail on each of these links and elaborate on the consequences of the combined
conclusions of each separate link.

LDV CO2 legislation and the 2nd hand vehicle market 6
1.3 Executive summary
Incorporating the used car market in the analysis of the costs and benefits of fuel efficiency of
passenger cars and LCV’s will lead to a better understanding of distribution effects. First owners
pay the price for higher fuel efficiency and may or may not recuperate the premium when reselling
on the used car market. It is also expected that the socio-economic profile of new car owners and
used car owners differs, leading to asymmetric distribution of costs and benefits of fuel efficiency
among the different socio-economic groups. The key questions in this respect are: is fuel efficiency
priced in the used car/LCV market and can we confirm the different socio-economic profiles of
used and new car-owners?
The study concludes that a relation between the fuel efficiency of a vehicle and pricing on the used
car market can indeed be identified. We find that CO2-emissions have a negative effect on the value
of a passenger car on the second hand market of around €22 per gram CO2 emitted per km. This
implies that if one owns a car that emits 120 g/km CO2 instead of one that emits 140 g/km, the
value of the car on the second hand market on average increases by about €440.
The price premium associated with higher fuel efficiency is passed on between subsequent car
owners and increases with the sequence of owners. We observe a difference in added value passed
on for cars aging between 0 to 5 years and cars aging between 5 to 10 years. For younger cars, the
average value of reducing CO2 -emissions with 1 gram/km is €5, while for cars within the age group
of 5 to 10 years, this average value is €30. For cars older than 10 years, the average value increases
to €42.
We observe a similar trend in pricing of used Light Commercial Vehicles (LCVs). Increasing CO2-
emissions lead to a price decrease on the used LCV market of around €13 per gram CO2 emitted
per km.
The results are statistically significant at a very high rate, and robust to plausible changes in model
specification or the removal of outliers in the dataset. This means that from the dataset we
analysed, though counter-intuitive, we can conclude with high confidence there is progressive
pricing of fuel efficiency with increasing car/LCV age.
Analysis into the socio-economic properties of the used car market confirmed the intuition that
there are important socio-economic distribution effects associated with it. Consistently in all EU
countries, the used car market is more important for lower income groups. While used cars are
more prevalent in lower income groups, the used cars also tend to be older. As a consequence, any
policy (environmental legislation, safety, taxation,…) affecting (sales of) new vehicles exclusively,
will generate asymmetric impacts in terms of cost and benefits over the different socio-economic
groups.

LDV CO2 legislation and the 2nd hand vehicle market 7
figure 1: EU-27 passenger car fleet, by income group and car category2
There are distinct differences in the size and dynamics of the used car market between the EU
Member States. The used car market is of substantial larger size than the primary market in terms of
volume and this is more outspoken in EU-10 countries3. The import of used cars exceeds new
registrations in most EU-10 countries. The largest exporting countries are Germany, Italy,
Netherlands and most likely France (little data available). Germany is the largest exporter of used
cars, likely responsible for 2/3 of all used car exports within the EU. The largest importing
countries are Romania and Poland.
We observe minor trend changes in the used car cross-border trade over time. The German
scrappage scheme did cause significant knock-on effects on the used car market which
consequences clearly impact used car imports in EU-10 for the subsequent years.
An average passenger car has 3 to 4 owners during its lifetime, with average ownership duration of
4-7 years. Average ownership duration increases with subsequent owners.
Combining the conclusion that costs and benefits are unevenly distributed over the different
owners with the observation that different owners have different socio-economic profiles, lead to
the uneven distribution of costs and benefits over the different socio-economic profiles.
While higher fuel efficiency generates a benefit over the lifetime of the vehicle and for all the
different owners during its lifetime, not all owners benefit proportionally. The distributional effects
are mainly determined by the initial price premium. Lower income groups proportionally benefit
more from fuel efficiency, if the initial cost for increased fuel efficiency is larger than the initial fuel
savings for the first owner. The initial cost for increased fuel efficiency is borne by the first owner,
on average belonging to higher income groups.
2 X-axis 1-5 represents household income groups, 1 being the lowest income group and 5 the highest. Bracket threshold
values can be found in the main report. 3 References to "EU-10 countries" in this report should be understood as covering Bulgaria, Czech Republic, Estonia,
Hungary, Lithuania, Latvia, Poland, Romania, Slovenia and Slovakia

LDV CO2 legislation and the 2nd hand vehicle market 8
Table 1: summary of distribution effects for a selected case per car [petrol - 1.5€/l – 50€/g CO2 initial
price premium]4
Table 1 above summarizes the distribution of cost and benefits of fuel efficiency among different
ownership periods during the vehicle lifetime and the different socio-economic groups. In the top
right corner, the net costs (negative if benefits) during ownership of a fuel efficient car are
compared to a non-fuel efficient alternative. This model assumes 3 different owners during the
lifetime of the vehicle. In this case, the first owner has a cost of 140€ over the ownership period of
the first 4 years when choosing the fuel efficient car. The second owner has a benefit of 641€ in
case of the fuel efficient option.
The left side of table represents the distribution of the stock of vehicles owned by the different
household income groups. “1” represents the lowest income group, “5” the highest. The lower
income groups tend to own more and older used cars; the higher income groups have a higher
share of new cars. Costs/benefits are proportionally allocated and compared to the annual
household income. We find that all income groups benefit from fuel efficiency; in relative terms to
household income, the lowest income groups benefit the most.
Geographically, benefits for EU-10 Member States increase if the initial price premium (mainly
borne by first owners from EU-15 buying more new cars) is high. The earlier exports happen, the
more profound the benefit for the importing partner.
Summarized, fuel efficiency generates a total net benefit for all owners combined over the lifetime
of the vehicle. The way benefits are distributed depends mainly on the initial price premium. This
value was estimated to be between 10 and 50€/g CO2, building on findings in the evaluation of the
regulation on car/LCV fuel efficiency (Ricardo, 2015). If the initial price premium for fuel
efficiency is high, total benefits of fuel efficiency are lower, but still positive and low income groups
and car owners in EU-10 Member States proportionally benefit more.
4 X-axis 1-5 represents household income groups, 1 being the lowest income group and 5 the highest. Bracket threshold
values can be found in the main report.
1 2 3 4 5 net cost (-benefit)
NEW 3% 10% 19% 22% 31% € 140
young used (4-9) 26% 28% 35% 32% 29% -€ 641
old used (9-15) 72% 62% 47% 46% 41% € 108
TOTAL 100% 100% 100% 100% 100%
1 2 3 4 5
NEW € 4 € 14 € 26 € 30 € 43
5 - 10y -€ 164 -€ 180 -€ 222 -€ 205 -€ 183
>10y € 77 € 67 € 50 € 50 € 44
TOTAL -€ 83 -€ 99 -€ 146 -€ 125 -€ 96
% annual income -2.76% -1.42% -0.86% -0.38% -0.16%

LDV CO2 legislation and the 2nd hand vehicle market 9
2 Overall methodology and structure
This report is structured as follows:
Chapter 3 deals with the link between fuel economy/ CO2-emissions and prices on the used car
market. The objective is to establish the contribution of different used vehicle properties to its
value on the second-hand market, with a focus on fuel efficiency. This includes a combination of
data collection and in depth data analysis.
Chapter 4 deals with the link between (used car) ownership and socio-economic properties of the
owner. The objective of this chapter is to gather information on and analyse the connection
between vehicle owners’ social strata and their vehicle ownership patterns. This includes a
description of the primary survey dataset and a set of comprehensive set of graphs and figures. This
chapter also includes an estimation attempt to decompose the EU passenger car fleet per socio-
economic group and new/used car categories by age.
Chapter 5 looks into the cross border trade of used cars in the EU. This basically constitutes an
updated of the study carried out in 2011 that produced an estimate of used car flows for the year
2008 (OKO - Mehlhart e.t al., 2011). The chapter includes an overview of collected data and an
updated overview of vehicle trade flows by origin and destination between countries.
Chapter 6 brings together results of the previous chapters, and comprises 2 analyses. The first links
the price setting on the second hand vehicle market and the fuel efficiency improvements of EU
CO2 regulations to social strata, while the second links those improvements and prices to Member
states.

LDV CO2 legislation and the 2nd hand vehicle market 10
3 Used car pricing, relevance of CO2-
emissions
3.1 Objective
This chapter deals with an econometric analysis of the effect of CO2-emissions on the value of cars
on the second hand market.
It deals with the following questions:
1. What is the effect of fuel efficiency, indicated by the CO2-emissions, on the value of
passenger cars on the second hand market, when taking into account other factors that
influence that value?
2. To which degree is the added value associated with higher fuel efficiency, passed on to
subsequent owners in the second hand market, notably to third or fourth owners of cars
and LCV’s?
3. What is the effect of fuel efficiency, indicated by the CO2-emissions, on the value of light
commercial vehicles (LCVs) on the second hand market, when taking into account other
factors that influence that value?
To answer these questions, we have performed econometric tests on a model where the trading
value of a second hand car is explained by its CO2-emissions horsepower of the engine, its age and
mileage (in kilometres), its weight, the type of fuel, the brand, the country in which a car is traded
and its built year.
The chapter is structured as follows: the next section covers the methods used. The third section
focusses on data. Finally, we report the results. The annexes present elaborated estimation results,
correlation tables, and descriptive statistics and distribution plots of the variables.
3.2 Methodology
3.2.1 General approach
To estimate the effect of CO2-emissions on the value of cars traded at the second hand market, we
have developed a regression model. With this model, we have estimated the effect of CO2-
emissions on the value of cars at the second hand market, while controlling for other factors that
affect the value. We have done this by using information on prices, CO2-emissions and other
factors that are provided by sellers and can be readily observed by potential buyers of the car.
As an indicator for the trade-value of a car, we use information from a combination of data
sources, including an own dataset and the seller’s published price of the car on online
advertisements, the CO2-emissions as well as other relevant characteristics. This information can be
readily observed by potential buyers. It thus seems appropriate to assume that sellers as well as
most buyers are aware of CO2-emissions (and hence fuel efficiency) and other relevant
characteristic when they determine the value for which they are willing to trade the car.

LDV CO2 legislation and the 2nd hand vehicle market 11
𝑃 = 𝛽0 + 𝛽1𝐶𝑂2 + 𝛽2log(𝐴𝑔𝑒) + 𝛽3,𝑟𝑎𝑛𝑔𝑒 log(𝑀𝑖𝑙𝑒𝑎𝑔𝑒𝑟𝑎𝑛𝑔𝑒 )
𝑟𝑎𝑛𝑔𝑒
+𝐹𝑢𝑒𝑙𝑡𝑦𝑝𝑒 +𝑀𝑎𝑘𝑒 + 𝐶𝑜𝑢𝑛𝑡𝑟𝑦 + 𝐵𝑢𝑖𝑙𝑡 𝑦𝑒𝑎𝑟 + 𝐻𝑃 𝑐𝑙𝑎𝑠𝑠 +𝑊𝑒𝑖𝑔ℎ𝑡 𝑐𝑙𝑎𝑠𝑠 + 𝜀
Unfortunately, we do not directly observe trading prices of cars, but rather the published price by
the seller. As long as the assumption holds that the difference between the published price and the
trading price is not correlated with CO2-emissions, this does not affect the outcomes.
3.2.2 Development of regression model
We have formulated a model where the value of a second hand car (P) is explained by its CO2-
emissions (CO2), horsepower of the engine (HP), its age and mileage (in kilometres) (Age and
Mileage respectively), its weight (Weight), the type of fuel (Fueltype), the brand (Make), and the
country in which a car is traded (Country).
Theoretically, we expect CO2 to have a negative linear effect on the price of a car. The linear effect
arises, because CO2-emissions are linearly related with fuel consumption. Hence the effect of CO2-
emissions on saved fuel costs is a linear effect, which we expect to show up in an increase in value
of the car on the second hand market. We have thus included CO2 linearly in our model that
explains P.
Concerning the effect of horsepower (HP) of the engine on the value of the car, we have no strong
expectations about its exact relationship, except that it should be positive. We have included
horsepower in a flexible way in the model, by including 50 indicators for different classes of
horsepower (HP classes) running from low to high. We have tested robustness for other
specifications that did not influence the results of the model.
Concerning Age, we expect that the impact on the value of the car is negatively related to the %
increase in age of the car. Thus, a car getting older from age 1 to 2 years has a similar (negative)
effect on the value of the car as one getting older from 2 to 4 years. We have modelled this by
including age in (natural) logarithm. However, our theoretical expectations are not very strong. We
have thus also allowed for a flexible impact of age on the value of the car, by including an effect for
the year of built of the car (Built year) next to the logarithm of the age. The inclusion of an effect
for the year of built of the car, allows e.g. to control for the fact that average CO2-emissions have
fallen over the years (see figure 9).
For Mileage, we have modelled the effect on the value of car so that a %-change in the mileage of
the car has a negative effect on its value. This reflects how a car is written off as mileage increases.
However, we are aware that in the practice of the price formation on the second hand car market,
there may be certain threshold values in mileage that are associated with jumps in write-off speed.
We have incorporated this in our model by allowing different impacts of the %-change in miles for
cars ranging between: 0-10.000 kms, 10.000 – 25.000 kms, 25.000 – 50.000 kms, 50.000 – 100.000
kms, 100.000 – 200.000 kms and 200.000 kms and more.
Concerning Weight, we included this variable as a proxy for the size of the car. As this is a rather
rough indicator, we have included 50 weight classes (Weight class) in our model. We have tested
robustness for other specifications.
With respect to Fuel type, Make and Country, we have included indicators for the different fuel
types, makes and countries that are present in the database.
Formally, the regression model is depicted below. Linear model:

LDV CO2 legislation and the 2nd hand vehicle market 12
We have used ordinary least squares to estimate the coefficients of the models, with
heteroscedasticity and autocorrelation consistent standard errors.
3.3 Data
We have collected data for the variables mentioned above by combining two sources: online
advertisement websites and the EEA monitoring database. The first source provides information
for the trading value of the car (the published price by the seller), CO2-emissions, horsepower, age,
mileage (in kilometres), fuel type, brand, country and built year. We couple this information with
data on weight and wheelbase, based on make and model of the car. The latter data are from the
EEA monitoring of CO2-emissions of passenger cars and LCV’s. For both sets, we have cleaned
the data from obvious outliers (like negative values) before running the econometric estimations.
We have a dataset that contains information for one or more of the variables, for 398.737 cars
We have used the following rules to clean the data:
Remove observations that do not have values for all variables5
Keep only second hand cars6
Keep only cars with age below 30 years
Keep only cars with a price between 100€ and 100.000€
Keep only cars with an emission value between 50 g CO2/km and 999 g CO2/km
Keep only cars with a positive value for price and weight
3.3.1 Passenger cars
We remain with a sample of 243.898 passenger cars after cleaning. To test for robustness of the
outcomes, we have mainly worked with a sample where we have removed data with values that are
farther away than 2 standard deviations from the mean of the selected variables listed above. For
the estimation of the main model we use further in the analysis, we are then left with 202.055 2nd
hand cars in the sample.
Below, we cover distribution plots of selected variables. In the annexes, distribution plots of all
variables can be found.
5 CO2-emissions, for instance, are not reported for all cars. We have only kept cars in the sample for which these are
reported. 6 To guarantee that we actually have only second hand cars in our sample, we excluded cars with less than 5000 km
driven.

LDV CO2 legislation and the 2nd hand vehicle market 13
figure 2: The distribution of the value (k€) of second hand passenger cars, cleaned database with values
between 2 standard deviations of the mean
We observe that the value of cars ranges from around €1.000 to around €38.000 euros. For the
purpose of running a regression, this provides ample variance in this variable. The median value of
a second hand car in our database is €11.600; the mean value is €13.106.
Of course, these are advertised prices and not the actual prices paid for used cars. A second
database with survey data further referred to as TML-GfK database (GfK, 2014) will be discussed
in the next chapter. This database includes published as well as paid prices for about 25.000 used
car transactions. Figure below show the relative difference between paid and published price for
different price ranges of used cars:
figure 3: relative discount given for used cars in different price ranges – relative share per discount
category (left) - number of transactions (right)- (source: GfK, 2014)
We can see in over 50% of the cases no discount is obtained, or the respondent in the survey did
not report any discount. Most common discounts are in the order of 0-10%. In general we cannot
see any major differences between cars of different prices ranges, although relative discounts are
somewhat higher for used cars of lowest value. We conclude no correction is needed and work
further with the published prices for the analysis.

LDV CO2 legislation and the 2nd hand vehicle market 14
figure 4: The distribution of the age of second hand cars, cleaned database (per 0.5 year)
We observe that the age of traded second hand cars has peaks at 1 year, and around 4 years, and
then rather smoothly fades out until the age of 15. The peak at around 4 years can be explained by a
substantial supply of young cars from finished lease contracts. A reason for the peak of cars
between 0.5 and 1 year old may be that dealers of new cars around that age have an incentive to list
the car as second hand, because then they may have more room to give a discount than if the car is
listed as new.
To check whether the age distribution in our dataset is representative for the age distribution of
cars in the second hand market, we compare the age distribution from cars in our cleaned database
with the age distribution of cars in the TML-GfK database (GfK, 2014)7
Note that the distribution of the vehicle on sale does not necessarily equal the distribution of the
vehicles in the fleet by age. Younger vehicles may be traded more frequently and in such case will
be more common in this database, reflecting sales, compared to stock.
We compare the age distribution for the full database, with all cars aged between 0 and 30 years.
figure 5: The distribution of the age of second hand cars, full database with all cars ageing from 0 to 30
years, TML/GfK (red) – cleaned database (blue)
We observe that in both databases, the distribution peaks at the years 1 and at around 4, although in
the database, the peaks are more pronounced. Moreover, in both databases, the distribution is
skewed to the left with the majority of mass between years 0 and 5.
We conclude that the shape and peaks of the distribution of the sample used for our analysis is
representative, because it is rather comparable to the age distribution of other samples.
We now turn to the distribution of the variable of main interest in our analysis (figure 6).
7 ideally this should be weighted for vehicle stock by country to make it more representative for this comparison.

LDV CO2 legislation and the 2nd hand vehicle market 15
figure 6: The distribution of the CO2-emissons of second hand cars, cleaned database.
We see that CO2-emissions vary from around 75 g/km to 230 g/km. The mean and median values
are at around 140 g/km.
Below, we plot figures that show the distribution of mileage for cars of different ages.
figure 7: Average cumulated mileage for cars of different age (1000skm - left), Average annual mileage
for cars of different age (1000 km/year, right), cleaned database.
We observe that the average number of kilometres drive rises with age. However, the average
amount of kilometres driven per year falls with age (see figure below)
This reflects that cars that last longer are used less intensely.
figure 8: Average annual mileage for cars of different ages split by fuel type, cleaned database (1000
km/y)
figure 8 splits the mileage/year for cars of different ages into cars that use diesel and cars that use a
different fuel. We observe that the average mileage/year is higher for diesel cars, and that it peaks at
cars with an age of around 3 years. The higher average mileage/year is a consequence of diesel cars
being more economical and therefore being purchased where driven distances will be higher. The

LDV CO2 legislation and the 2nd hand vehicle market 16
peak at three may be a consequence of diesel cars being more often lease cars (80% of lease cars are
diesel compared to 55% in the overall fleet). Lease cars typically drive more km/year (on average
about 30,000km), while they return from the lease and are sold at the second hand market typically
at around 4 years (average lease period is 41 months).
figure 9: Average emissions of CO2 per year of built of the car
Judging from this figure, average fuel efficiency has risen in recent years. We take account of this
characteristic by the inclusion of dummies for the year of built of the car in the estimations.
Dummies for year of built should thus control for the variation over the past years.
3.3.2 LCVs
We remain with a sample of 172.817 LCVs after cleaning8.
To test for robustness of the outcomes, we have mainly worked with a sample where we have
removed data with values that are farther away than 2 standard deviations from the mean, as was
done for passenger cars.
We are then left with 140.136 2nd hand LCV’s in the sample.
Below, we cover distribution plots of selected variables. In the annexes, distribution plots of all
variables can be found.
8 Note that the sum of the LCV’s and passenger cars adds up to more than the total sample size. The reason is that there
is overlap between make and models of cars that are in the EEA-list of passenger cars and in the list of LCV’s.
0
20
40
60
80
100
120
140
160
180
2006 2007 2008 2009 2010 2011 2012 2013 2014 2015
CO
2-e
mis
sons
(g/k
m)
Year of built

LDV CO2 legislation and the 2nd hand vehicle market 17
figure 10: The distribution of the value of second hand LCVs (k€), cleaned database with values between
2 standard deviations of the mean
We observe that the price of LCVs ranges from some €1.000 to €30.000. The median value is
around €11.842, which is a little larger than the median value for passenger cars (albeit this
difference is far from being statistically significant). This provides ample variation for the purpose
of a regression analysis.
figure 11: The distribution of the age of second hand LCV’s, cleaned database with values between 2
standard deviations of the mean.
Looking at the age distribution, we see similar peaks as with the passenger cars.
figure 12: The distribution of the CO2-emissons of second hand LCV’s, cleaned database with values
between 2 standard deviations of the mean
Median CO2-emissions for LCV’s (135) are comparable with those passenger cars (138). The same
holds for weight (see annex). This would suggest that the lighter LCV’s, of the type that can be

LDV CO2 legislation and the 2nd hand vehicle market 18
transformed into passenger cars and vice versa by adding/removing seats are included in the
sample.
Below, we plot figures that show the distribution of mileage for LCV’s of different ages.
figure 13: Average mileage for LCV’s of different age (1000km - left), annual mileager for LCV’s of
different age (1000 km/year - right), cleaned database with values between 2 standard deviations of the
mean
We observe that the average number of kilometres driven rises with age. However, the average
amount of kilometres driven per year falls with age (see figure below)
This reflects that LCV’s that last longer are used less intensely.
figure 14: Average mileage/year for LCV’s of different ages split by fuel type, cleaned database with
values between 2 standard deviations of the mean (1000 km/y)
Table 2 displays the distribution of LCV’s over weight classes, comparing our database with the
total population9.
Table 2 Distribution of LCV’s over weight classes
9 Numbers for the total population follow from
http://ec.europa.eu/clima/policies/transport/vehicles/docs/ldv_downweighting_co2_report_en.pdf, figure 3-22. Ideally this should
be weighted by trade-intensity to make the comparison representative.
Class Weight Percent in our database Percent in total population
Class I Reference mass ≤ 1305 kg 33% 10%
Class II 1305 kg < Reference mass ≤ 1760 kg 61% 31%
Class III 1760 kg < Reference mass ≤ 3560 kg 6% 59%
Total 100% 100%

LDV CO2 legislation and the 2nd hand vehicle market 19
From the table, we see that indeed the lightest class is overrepresented in our database, while the
heaviest class is substantially underrepresented. We take this sample bias into account in our
estimation LCV(9).
3.4 Results
Below, we cover the main results of the econometric estimation, by providing an answer to the
questions above.
3.4.1 Answers to the research questions
In this section we summarize the key answers to the research questions. A detailed discussion is
added in the subsequent section.
Research question one was:
“What is the effect of fuel efficiency, indicated by the CO2-emissions, on the value of cars on the second hand market,
when taking into account other factors that influence that value?”
CO2-emissions have a negative effect on the value of a passenger car on the second hand market of
around €22 per gram CO2 emitted per kilometre. This result is robust and statistically significant at a
very high rate.
This result implies that if one owns a car that emits 120 g/km CO2 instead of one that emits 140
g/km, the value of the car increases by about €440 on the second hand market.
The second research question was:
“To which degree is the added value associated with higher fuel efficiency, passed on to subsequent owners in the second
hand market, notably to third or fourth owners of cars?”
There seems to be a marked increase in the extent to which the added value of car fuel efficiency is
passed on, when the amount of owners increases. For cars aging between 0 to 5 years, the value of
reducing CO2-emisions with 1 gram/km is €5, while for cars within the age group of 5 to 10 years,
this value is €30. For cars older than 10 years, this value increases to €42.
The third research question was:
“What is the effect of fuel efficiency, indicated by the CO2-emissions, on the value of LCV’s on the second hand
market, when taking into account other factors that influence that value?”
We find that CO2-emissions have a negative effect on the value of an LCV on the second hand
market of around €13 per gram CO2 that an LCV emits per kilometre. This result is statistically
significant at a very high rate.
This result would imply that if one owns a car that emits 120 g/km CO2 instead of one that emits
140 g/km, the value of the LCV increases by about €260 on the second hand market.
As we found with passenger cars, we observe a difference in added value passed on to subsequent
owners. For younger LCV’s, the value of reducing CO2-emisions with 1 gram is €3, while for LCV’s
within the age group of 5 to 10 years, this value is €21. For LCV’s older than 10 years, this value
increases to €29.

LDV CO2 legislation and the 2nd hand vehicle market 20
3.4.2 Detailed results
Table 3 presents a summary of the detailed results of our estimations (more elaborate results in
annex). Estimation (1) is our main result, on which the answer to research question 1 is based. The
other estimation variants are other models, removing or adding variables and should be considered
stability checks. E.g. in model 4, built year and mileage class dummies were removed; in model 5,
more dummies were removed from the estimation. This leads to a slightly worse estimation
(represented by the r² value – higher meaning a better fit), though still acceptable with an r² in the
range of 0.8. Some variables are converted to logarithmic values (‘log”). The model results are
discussed below.
The results are robust. That is: the sign and significance of the effect are stable for changes in the
sample on which our model is estimated, although the magnitude differs somewhat. Furthermore,
sign, significance and magnitude are rather stable for changes in the specification of the model, like
adding or removing variables to/from the model.
Table 3: Results of models that explain the value (€) of second hand cars by CO2-emissions and other
variables
NOTES:
- All reported coefficients are significant with P-values below 0.1%.
- Estimation (1) is our preferred estimation. It is estimated on the cleaned, complete sample after removal of all
observations for which 1 or more of the independent variables contained 1 or more values outside a 2 standard
deviation interval of the mean.
- Estimation (2) is estimated on the complete, cleaned sample with obvious outliers removed
- Estimation (3) is as (1) with Engine power, weight and mileage class dummies added.
- Estimation (4) is as (1) with mileage (log) added and the mileage (log) split in classes and built year dummies
removed.
- Estimation (5) is as (1), but without dummies for fuel type, make, country and built year
- Estimation (6) is as (1), but with all dummies removed and Engine power, log and weight added
- Estimation (7) splits the effect of CO2 into an effect for cars using Diesel fuel and for cars using all other fuels.
We proceed discussing the findings.
Type Split
Estimation 1 2 3 4 5 6 7
Estimation variant Main modelMain, but with
larger sampleComplete model Simple model Fewer dummies No dummies
CO2 split between
types of fuel
Variable
CO2 (g/km) -22 -53 -22 -57 -45 -60 no
Age (year), log -1054 -1560 -1035 -2674 -3231 -2673 -1084
Mileage (1000 kilometres), log no no no -2465 no no no
class 0-10 -3190 -2889 -934 no 5167 -4203 -3141
class 10-25 -2448 -2192 -308 no 3890 -2989 -2427
class 25-50 -2086 -1836 -863 no 3101 -2466 -2078
class 50-100 -1991 -1843 -2680 no 2276 -2394 -1993
class 100-200 -2277 -2186 -6287 no 1400 -2721 -2269
class 200 up -2636 -2520 -6895 no 736 -3059 -2605
Engine power (hp), log no no 5335 no no 11579 no
Weight (kg) no no 5 no no 9 no
CO2 (g/km), Diesel no no no no no no -31
CO2 (g/km), other fuel no no no no no no -12
Fuel type dummies yes yes yes yes no no yes
Make dummies yes yes yes yes no no yes
Country dummies yes yes yes yes no no yes
Built year dummies yes yes yes no no no yes
HP class dummies yes yes yes yes yes no yes
Weight class dummies yes yes yes yes yes no yes
Mileage class dummies no no yes no no no no
N 202.055 243.898 202.055 202.055 202.055 202.055 202.055
r2 0,877 0,842 0,881 0,850 0,811 0,787 0,878
Main model Removing or adding variables

LDV CO2 legislation and the 2nd hand vehicle market 21
On the relation between CO2-emissions and value of second hand passenger cars
Estimation (1) is based on a sample that contains high quality data, while it still has a high degree of
variation in the data. The data is of high quality, because in the sample of data on which we have
estimated our model, we have manually removed implausible values (e.g. negative weights), and
removed extremely large and extremely small values from the dataset (see earlier in section 3.3.1 for
more information on the data cleaning process) by only keeping observations that are within 2
standard deviations of the mean for all variables involved in the model. This sample thus strikes a
balance between variety and quality of the data.
From estimation (1), we see that the value of reducing CO2-emissions by 1 gram/km is €22.
The coefficient of the age of the car has to be interpreted with some caution, as we have also
included dummies for built year. Disregarding the effect of the built year dummies, every doubling
of age implies a €1.054 loss in value. To put things into perspective: the median value of a car in the
sample is €11.600. The estimated coefficients of the built year dummies imply that there is some
extra loss in value on top of this.
For mileage, the estimated coefficients imply that a doubling in the mileage results in a decrease in
value that ranges from €1.991 for cars with a mileage between 50.000 and 100.000 km to €3.190 for
the cars with the least mileage.
Estimation (2) presents results from estimating the same model is in (1), but on the complete,
cleaned sample, not excluding data points beyond 2 standard deviations of the mean (see earlier for
cleaning rules conducted). We observe that the value of CO2 is larger at -€53, while the value of the
other coefficients is either smaller or larger. All signs remain and all coefficients that turned up
significant in the main regression. This indicates that “extreme” used cars (very high/low price,
mileage, age,…) behave differently. In this sense, the model we used for the analysis is applicable to
a “central” sub-set of used cars. As this covers >82% of the volume, this is representing the bulk of
the market.
From the correlation table (see annex), we observe that correlation between some of the variables is
rather high. This may result in so-called multicollinearity of variables. A feature of multicollinearity
is that the estimation results may become instable for inclusion or removing of a variable that is
highly correlated with another variable in the model. Another feature is that the variance of
estimated coefficients may be inflated if two or more highly correlated repressors are included,
which can be indicated by the so-called variance inflation factor (VIF).
To test whether multicollinearity plagues our regression results, we estimate several models in
which we add or remove variables from the regression equation. We observe that the coefficient of
CO2 is rather stable for these manipulations, both in magnitude as well as significance. Thus,
although some of the variables are highly correlated, this does not result in a multicollinearity
problem.
As a limit to removing variables from the model, we adhere to our theoretical notions for which
variables influence the value as well as the CO2-emissions of a second hand car. We include all
variables in the model in some form to prevent so-called omitted variable bias. Omitted variable
bias arises if a third variable (e.g. engine power) influence both the dependent variable (e.g. value of
the car) as well as the independent variable of interest (e.g. CO2), but is not included in the model.
In that case, the estimated coefficient on the independent variable is not just a measure of its effect

LDV CO2 legislation and the 2nd hand vehicle market 22
on the dependent, but also of the indirect of the omitted third variable on the dependent, that runs
through its correlation with the independent variable.
To prevent omitted variable bias, we include measures of age (or built year), horse power and
weight in all models, next to CO2. Estimations 3-5 reflect this:
Estimation (3) presents a more elaborate model than estimation (1), in which we have allowed a
more flexible effect for Mileage and we have included weight and Engine power (in log-form).
Clearly, the estimated coefficient on CO2 remains the same, in sign, magnitude and significance.
The estimated coefficient on age (log) is somewhat smaller in magnitude. The most affected
variables are the various classes of Mileage (log), which are marked downwards in magnitude. This
is to be expected, as the estimation variant introduces dummies for mileage classes.
Estimation (4) presents a simple model. We have included all variables for which we have some
theoretical notion about the form of their relationship with the value of the car in that form. We
have removed the more flexible forms of these variables (we have removed mileage (log) split in
classes and built year dummies). We observe that the value of CO2 is inflated (it more than
doubles), as is the value of the %-change of age.
Estimation (5) shows the effect of removing dummies for which we have no a priori reason to
expect them to affect the relationship between CO2-emissions and car value: fuel type, make,
country and built year10. This results in an inflated value of CO2 of around a factor 2. Age (log) has
the expected sign, but the signs of the classes of mileage (log) flip. This may be a result of the
removal of the 4 types of dummies combined with the exclusion of mileage dummies, which forces
the different classes of mileage (log) to pick up the effect of the mileage dummies.
Estimation (6) removes all dummies from the model, which results in an estimated coefficient of
CO2 of -€60.
Seemingly, removing the dummies results in a somewhat larger estimation of the price premium
than in estimation (1) (main model). Note that estimations (5) and (6) may suffer from omitted
variable bias as we have removed variables that are significant in estimation (1). Consequently, from
an econometric point of view, estimation (1) is to be preferred. However, allowing other
considerations to play a role and taking the estimations (5) and (6) at face value, the important thing
to note is that the estimated value of the price premium is of the same number of magnitude and
the sign remains the same if compared to estimation (1). We conclude that the estimation results
are robust. Estimation (7) splits the effect of CO2-emissions on car value into a separate effect for
cars running on diesel and for cars running on a different fuel. We observe that the value of CO2-
emissions for diesel is of larger magnitude, and for other of smaller magnitude. The value remains
negative and significant.
10 We have included age (log) in the model. With this variable included, we may not expect built year dummies to affect
the relation between CO2 and car value.

LDV CO2 legislation and the 2nd hand vehicle market 23
On passing on added value to subsequent owners of passenger cars
In this section, we focus on answering research question 2:
“To which degree is the added value associated with higher fuel efficiency, passed on to subsequent owners in the second
hand market, notably to third or fourth owners of cars?”
We analyse this question by looking at differences in the effect of CO2-emissions for younger cars
vis-à-vis older cars. The assumption is that older cars have had multiple owners. Therefore we
distinguished three groups of cars depending on their age (0-5 years, 5-10 years, > 10 years) in the
model and estimated whether the impact of CO2-emissions on the second hand car value differ for
these three groups. For comparison we repeat our main estimation (1).
Also, we test whether the effect of CO2 differs between cars from different age groups. Although
we interpret this test in light of the possibility of subsequent owners to pass on the added value of
fuel efficient cars, we may also interpret it as a direct test for the stability of our estimations for
splitting the effect of CO2 into effects for different age groups. We see that the estimated effect is
negatively significant for all age groups, although it differs in magnitude.
Table 4: Results of models that explain the value (€) of second hand cars by CO2-emissions and other
variables, comparing different age groups
From the table, we observe that the effect of fuel efficient cars (with smaller CO2-emissions)
increases in magnitude with age of the car. This implies that it is likely that 3rd owners are better
able to pass through the added value of fuel efficient cars than 2nd owners, and e.g. 4th or 5th
owners are better to pass the value on than 3rd owners. This may be explained by the notion that,
the more owners a car has had and the older it becomes, the more dominant the value of fuel costs
becomes in the total use costs of the car.
It was not possible to study from this data whether higher fuel efficiency vehicles are retained
longer by their owners, as the data available for this study do not provide any information on the
number of times the cars are resold and the intervals between these sales.
Estimation 1 8
Variable Main modelCO2 split between
age groups
CO2 (g/km) all cars -22 no
CO2 (g/km) cars younger than 5 No -5
CO2 (g/km) cars between 5 and 10 no -30
CO2 (g/km) cars older than 10 No -42
Age (year), log -1054 -955
Mileage (1000 kilometres), log no no
class 0-10 -3190 -3119
class 10-25 -2448 -2399
class 25-50 -2086 -2048
class 50-100 -1991 -1954
class 100-200 -2277 -2240
class 200 up -2636 -2597
Fuel type dummies yes yes
Make dummies yes yes
Country dummies yes yes
Built year dummies yes yes
HP class dummies yes yes
Weight class dummies yes yes
Mileage class dummies no no
N 202.055 202.055
r2 0,877 0,881

LDV CO2 legislation and the 2nd hand vehicle market 24
The fact that the premium value increases with subsequent ownership transfer, and thus vehicle
age, is opposite to the initial hypothesis. One would expect the value to decrease, mainly because of
2 reasons:
1. The value of the car decreases over time; one would expect that also the individual
components in the model making the price decrease proportionally.
2. The benefit of fuel efficiency decreases with vehicle age as the future fuel benefits decrease
due to decreasing remaining service life as well as decreasing intensity of use (i.e. older
vehicles typically have lower annual mileage).
It is striking that we find a robust result that suggests the opposite of our initial hypothesis. We
have reviewed the methodology extensively and have considered the following possible
explanations and how these effects were controlled:
1. There is a trend in CO2-emissions over the built-years of the vehicle. CO2-emissions
decline with recency of built-year. This may distort the estimation of the fuel efficiency
premium for different age groups. We have controlled for this by including built-year
dummies in the model. These dummies account for this effect so the trend in CO2-
emissions over the built-years cannot explain the result.
2. Older cars are typically bigger cars. These are more expensive. This may distort the
estimated fuel efficiency premium. We have controlled for this by including weight
dummies in the model. These dummies account for the link between bigger and expensive
cars so cannot explain the result.
3. Certain more expensive brands may be overrepresented in vehicles in older age cohorts.
We have controlled for this by including both make-dummies and age-dummies in the
model.
4. Diesel cars may be overrepresented in older age cohorts. As these are more expensive than
petrol cars, this may distort the estimated fuel efficiency premium. We have controlled for
this by including both dummies for fuel type and age in the model. These pick up the
effects of shifts in the distribution of the traded cars over the fuel types.
Possible explanations that substantiate our finding:
Fuel-efficient cars may be overrepresented in older age cohorts, because the scrappage rate
of fuel-efficient cars is lower (hypothesis). That may be a reason for our finding if the
premium associated with higher fuel efficiency is more than proportional to CO2-
emissions, while the model assumption is that it is exactly proportional.
Fuel costs represent a larger share of the Total Cost of Ownership for the second owner of
a car than for the first owner (and for the third owner this share is even larger), as the
investment costs of cars decrease exponentially. Therefore the second/third owner will pay
more attention to the fuel efficiency of the car and consequently this will result in a higher
premium.
There is a genuine lack of information in the used car market for later owners of used cars
which causes irrational/uninformed purchase decisions.
The project team recommends further research is needed to understand what the underlying
mechanism are that drive the increasing purchase cost premium in the used car market we found in
this analysis.

LDV CO2 legislation and the 2nd hand vehicle market 25
On the relation between CO2-emissions and value of second hand LCV’s
This section focusses on answering research question 3. The question reads:
“What is the effect of fuel efficiency, indicated by the CO2-emissions, on the value of light commercial vehicles
(LCV’s) on the second hand market, when taking into account other factors that influence that value?”
Estimation LCV(1) is based on a sample that contains high quality data, while it still has a high
degree of variation in the data. The data is of high quality, because in the sample of data on which
we have estimated our model, we have manually removed implausible values (e.g. negative weights),
and removed extremely large and extremely small values from the dataset (see section 3 for more
information on the data cleaning process) by only keeping observations that are within 2 standard
deviations of the mean for all variables involved in the model. This sample thus strikes a balance
between variety and quality of the data.
Table 5: Results of models that explain the value (€) of second hand LCV’s by CO2-emissions and other
variables
Notes:
- All reported coefficients are significant with P-values below 0.1%.
- Estimation number LCV(1) is our preferred estimation. It is estimated on the cleaned, complete sample after
removal of all observations for which 1 or more of the independent variables contained 1 or more values
outside a 2 standard deviation interval of the mean.
- Estimation LCV(3) is as LCV(1) with Engine power, weight and mileage class dummies added.
- Estimation LCV(4) is as LCV(1) with mileage (log) added and the mileage (log) split in classes and built year
dummies removed.
- Estimation LCV(5) is as LCV(1), but without dummies for fuel type, make, country and built year
- Estimation LCV(6) is as LCV(1), but with all dummies removed and Engine power, log and weight added
- Estimation LCV(7) splits the effect of CO2 into an effect for LCV’s using Diesel fuel and for LCV’s using all
other fuels.
- Estimation LCV(8) splits the effect of CO2 into an effect for LCV’s of different age groups (0-5, 5-10, 10 years
up)
Type
Estimation LCV(1) LCV(3)* LCV(4) LCV(5) LCV(6) LCV(7) LCV(8) LCV(9)
Estimation variantMain
model
Complete
model
Simple
model
Fewer
dummies
No
dummies
CO2 split between
types of fuel
CO2 split between
age groups
weighted
regression
Variable
CO2 (g/km) -13 -14 -45 -37 -46 no no -11
Age (year), log -1008 -987 -2446 -2908 -2601 -1035 -944 -1124
Mileage (1000 kilometres), log no no -2130 no no no no no
class 0-10 -2623 -706 no 3628 -3452 -2585 -2578 -3954
class 10-25 -2027 -327 no 2791 -2464 -2008 -1995 -3011
class 25-50 -1751 -793 no 2208 -2030 -1742 -1727 -2591
class 50-100 -1687 -2232 no 1579 -1980 -1683 -1663 -2431
class 100-200 -1934 -5553 no 878 -2249 -1924 -1911 -2693
class 200 up -2250 -6739 no 316 -2540 -2224 -2226 -3012
Engine power (hp), log no 1569 no no 9325 no no no
Weight (kg) no 9 no no 8 no no no
CO2 (g/km), Diesel no no no no no -21 no no
CO2 (g/km), other fuel no no no no no -4 no no
CO2 (g/km), LCV’s younger than 5 no no no no no no -3 no
CO2 (g/km), LCV’s between 5 and 10 no no no no no no -21 no
CO2 (g/km), LCV’s older than 10 no no no no no no -29 no
Fuel type dummies yes yes yes no no yes yes yes
Make dummies yes yes yes no no yes yes yes
Country dummies yes yes yes no no yes yes yes
Built year dummies yes yes no no no yes yes yes
HP class dummies yes yes yes yes no yes yes yes
Weight class dummies yes yes yes yes no yes yes yes
Mileage class dummies no yes no no no no no no
N 140136 140136 140136 140136 140136 140136 140136 140136
r2 0,876 0,881 0,845 0,805 0,778 0,877 0,879 no
Main model Removing or adding variables Split

LDV CO2 legislation and the 2nd hand vehicle market 26
- Estimation LCV(9) weights the regression to compensate for the bias in representativeness of LCV’s of
different weight classes.
- LCV(3)*: An estimation based on the complete, cleaned sample (equivalent to estimation number (2) for
passenger cars) turned out not to be possible due to a near complete multi-collinearity of some of the
regressors (HP and weight class dummies).
From estimation LCV(1), we see that the value in the second hand market of reducing CO2-
emissions by 1 gram/km is €13.
The coefficient of the age of the LCV has to be interpreted with some caution, as we have also
included dummies for built year. Disregarding the effect of the built year dummies, every doubling
of age implies a €1.008 loss in value. To put things into perspective: the median value of a LCV in
the sample is €10.850. The estimated coefficients of the built year dummies imply that there is some
extra loss in value on top of this.
For mileage, the estimated coefficients imply that a doubling in the mileage results in a decrease in
value that ranges from €1.687 for LCV’s with a mileage between 50.000 and 100.000 km to €2.623
for the LCV’s with the least mileage.
We could not estimate the LCV-analogue for estimation (2) for passenger cars. This estimation
would have been based on the complete, cleaned sample (see earlier for cleaning rules conducted).
However, we encounter a near complete collinearity problem when running this regression.11 This
happens because some of the HP class dummies span some of the weight class dummies. In short,
it doesn’t make sense to include both variables as a predictor as groups using these variables as a
distinguishing factor span the same group of vehicles.
Estimation LCV(3) presents a more elaborate model than estimation (1), in which we have allowed
a more flexible effect for Mileage and we have included weight and Engine power (in log-form).
The estimated coefficient on CO2 remains rather stable with a value of -€14. Other variables keep
the same sign and significance.
Estimation LCV(4) presents a simple model. We have included all variables for which we have
some theoretical notion about the form of their relationship with the value of the LCV in that
form. We have removed the more flexible forms of these variables (we have removed mileage (log)
split in classes and built year dummies). We observe that the estimate of the impact CO2 on LCV-
value increases to -€45. Age and Mileage have the expected sign.
Estimation LCV(5) shows the effect of removing dummies for which we have no a priori reason to
expect them to affect the relationship between CO2-emissions and LCV value: fuel type, make,
country and built year . We see that the value of CO2 is -€37. Age (log) has the expected sign. Like
with estimate (5) for passenger cars, the signs of the classes of mileage (log) flip. This may be a
result of the removal of the mileage dummies, which forces the different classes of mileage (log) to
pick up the effect of the mileage dummies.
Estimation LCV(6) removes all dummies from the model, which results in an estimated coefficient
of CO2 of -€46. Other variables have the expected sign.
11 https://en.wikipedia.org/wiki/Multicollinearity

LDV CO2 legislation and the 2nd hand vehicle market 27
Estimation LCV(7) splits the effect of CO2-emissions on LCV value into a separate effect for
LCV’s running on diesel and for LCV’s running on a different fuel. We observe that the effect of
CO2 is bigger in magnitude for Diesel LCV’s than for LCV’s running on a different fuel.
Estimation LCV(8) tests whether the effect of CO2 differs between LCV’s from different age
groups. We obtain a finding that is consistent with the finding for passenger cars: for younger cars,
the value of CO2 is somewhat smaller in magnitude, albeit it is negative for all age groups.
Estimation LCV(9) compensates for the difference in distribution over weight classes for our
sample compared to the total population of LCV’s. We weight the sample so that class I LCV’s get
a small weight in the estimation, while class II and more so class III get a higher weight. The
weights are designed, so that the distribution of the weighted database mimics the distribution of
the total population over weight classes. Looking at the results, we observe that the coefficient of
CO2 remains rather stable at -€11. The other coefficients seem to inflate somewhat in size.
3.5 Conclusions
We summarize the key conclusions of the analysis:
Fuel efficient passenger cars have a positive price premium in the second hand market. The
value of this premium is estimated to be of around €22 per gram CO2 emitted per
kilometre. This result is statistically significant at a very high rate, and robust to plausible
changes in model specification or the removal of outliers in the dataset.
This value associated with higher fuel efficiency is passed on between subsequent car
owners. The value passed on increases with the sequence of owners.
Fuel efficient Light Commercial Vehicles have a positive price premium in the second
hand market. The value of this premium is estimated to be of around €13 per gram CO2
emitted per kilometre. This result is statistically significant at a very high rate, and robust to
plausible changes in model specification or the removal of outliers in the dataset.
This value associated with higher fuel efficiency is passed on between subsequent LCV
owners. The value passed on increases with the sequence of owners.
The increasing cost premium with age is opposite to the initial hypothesis. A definite
explanation could not be found. Further work is needed to understand the driving
mechanisms.

LDV CO2 legislation and the 2nd hand vehicle market 28
4 Socio-demographic properties of the used
car market
4.1 Objective
In this chapter, we go into the relation between (used) vehicle ownership and social profile of the
owner. The goal is to understand how used car ownership differs from car ownership in general.
The intuitive expectation is that low-income social groups spends less on transport equipment and
will be forced to buy more in the used car market compared to the high-income groups. We first
elaborate on the data we used for the analysis, interpret the pure data to come to first conclusions
and finally link the data to other sources to gain further understanding.
4.2 Data collection
4.2.1 Used car survey
The primary data source for this task builds upon a survey done by GFK and TML for DG
SANCO12. It includes detailed feedback from consumers. The dataset consists of 25,287 data
points. The samples size is evenly distributed among all (at the time) EU-27 Member States plus
HR, NO and IS. The aim was 1,000 respondents for bigger countries and 500 for smaller. Below an
overview of the sample size per member state:
Figure 15: available sample size
On the vehicle side, the following data is gathered (list is limited to key parameters):
Make/type
Age (i.e. year of first registration)
Year purchased
Mileage upon purchase
Annual mileage since purchase
Fuel type
Price paid
Country of origin
12 (GfK, 2014): Consumer market study on the functioning of the market for second-hand cars from a consumer
perspective. http://ec.europa.eu/consumers/consumer_evidence/market_studies/second_hand_cars/index_en.htm
0200400600800
10001200
Au
striaB
elgiu
mB
ulgaria
Cyp
rus
Cze
ch…
Germ
any
De
nm
arkEsto
nia
Gree
ceSp
ainFin
land
France
Hu
ngary
Irelan
dItalyLith
uan
iaLu
xemb
ou
rgLatviaM
altaN
etherlan
ds
Po
land
Po
rtugal
Ro
man
iaSw
ede
nSlo
venia
Slovakia
Un
ited
…Ice
land
No
rway
Cro
atia

LDV CO2 legislation and the 2nd hand vehicle market 29
On the consumer side we have information on:
Sex
Age
Education level
Employment
Household income
4.2.2 SILC
A second source is the EU-Statistics on Income and Living Conditions database (EU-SILC), which
is based on an extensive survey and holds data on car ownership from one specific question on car
ownership.
EU-SILC, is the reference source for comparative statistics on income distribution and social
inclusion in the European Union (EU). It is used for policy monitoring within the 'Open method of
coordination (OMC)'. EU-SILC provides two types of annual data:
1. cross-sectional data pertaining to a given time or a certain time period with variables on
income, poverty, social exclusion and other living conditions;
2. longitudinal data pertaining to individual-level changes over time, observed periodically
over a four-year period.
EU-SILC is a multi-purpose instrument which focuses mainly on income. Detailed data are
collected on income components, mostly on personal income, although a few household income
components are included. However, information on social exclusion, housing conditions, labour,
education and health information is also obtained.
EU-SILC is based on the idea of a common “framework” and no longer a common “survey”. The
common framework defines the harmonized lists of target primary (annual) and secondary (every
four years or less frequently) variables to be transmitted to Eurostat; common guidelines and
procedures; common concepts (household and income) and classifications aimed at maximizing
comparability of the information produced.
The reference population in EU-SILC includes all private households and their current members
residing in the territory of the countries at the time of data collection. Persons living in collective
households and in institutions are generally excluded from the target population. Some small parts
of the national territory amounting to no more than 2 % of the national population and the national
territories listed below may be excluded from EU-SILC. All household members are surveyed, but
only those aged 16 and more are interviewed.13
13 Description from the EU-SILC website: http://ec.europa.eu/eurostat/statistics-
explained/index.php/Glossary:EU_statistics_on_income_and_living_conditions_%28EU-SILC%29

LDV CO2 legislation and the 2nd hand vehicle market 30
SILC includes a single question on car ownership:
“
…Whether the household have a car or whether the household does not have a car because it cannot afford it (enforced
lack) or for other reasons. ‘Enforced lack’ implies that the item is something that the household would like to have,
but cannot afford. Possessing the item does not necessarily imply ownership: the item may be rented, leased, provided
on loan, or shared with other households. If the item is shared between households, the answer is "Yes" if there is
adequate/easy access (i.e. household can use the durable whenever it wants) and "No" otherwise.
In the case of a car, the household is considered to possess it if any member possesses it. A company car or van which
is available to the household for private use counts as possessing the item. A car or van provided ONLY for
professional purpose, should not be considered as possessing the item. Motorcycles are excluded…
“
SILC data provides information about households owning a car, in ownership or lease. It does not
provide information about how many cars are owned by the household and it excludes professional
vehicles and motorcycles.
4.2.3 Additional sources
Several auction websites publish own analysis based using the data from their trading platform. The
British Car Association (BCA) publishes an annual used car market review, executed by the
University of Buckingham. The report includes data on market volumes, prices, age-structure as
well as limited information on the socio-economic properties of used car buyers. The report holds
data for several years and some information for other EU countries.
2013 report: http://www.bcamarketplaceplc.com/~/media/Files/B/BCA/documents/bca-2013-
used-car-market-report.pdf
2014 report: http://www.buckingham.ac.uk/wp-content/uploads/2014/11/pnc-2014-usedcar.pdf
The evaluation of the car and LCV CO2 regulations by Ricardo-AEAT (Ricardo-AEA - Gibson et.
al., 2015) provides limited information on the social impact of new environmental regulation for
new cars:
http://ec.europa.eu/clima/policies/transport/vehicles/docs/evaluation_ldv_co2_regs_en.pdf
Several other papers provide fragmented insight in social aspects of the used car market:
“A cross-country comparison of household car ownership – A Cohort Analysis –“ A.
BERRI- INRETS (2009)
“From Consumer Incomes to Car Ages: How the Distribution of Income Affects the
distribution of Vehicle Vintages” A. Yurko (2009)
“THE DYNAMICS OF CAR OWNERSHIP IN EU COUNTRIES: A COMPARISON
BASED ON THE EUROPEAN HOUSEHOLD PANEL SURVEY”, J. Dargay (Oxford)
& L. Hivert (INRETS) (2005)
“The Anatomy and Physiology of the Used Car Business” CIRP II & Capgemini (2007)
“A Dynamic Model of Vehicle Ownership, Type Choice, and Usage” K. Gillingham et. Al.
(Yale) (2015)

LDV CO2 legislation and the 2nd hand vehicle market 31
4.3 Observations
The aim of analysis in this chapter is fairly straight-forward: we want to understand how car-
ownership differs for different socio-economic groups and explicitly make the distinction in the
ownership of new and used hand cars.
Unless otherwise specified, data refers to the used car survey as explained in section 4.2.1
4.3.1 Income
In this section, we look into the relation of the transaction indicator with income as the key
indicator for socio-demographic group.
The income categories are fixed and linked to the options given to respondents in the survey.
Because of this, it is not possible to set dynamic limits to the 5 income categories, to distribute the
sample more evenly over the different groups. For the remainder of the analysis, in this and
following sections, we are bound to the income categories as presented in table below. Of all
respondents, 84% supplied information on household income, slightly reducing the useful sample
to 21.711 records.
Table 6: Income-brackets considered in this study
WEEKLY MONTHLY YEARLY
1 Less than €79 Less than €349 Less than €4.199
2 €80 to €209 € 350 to €899 €4.200 to €10.799
3 €210 to €449 € 900 to €1.949 €10.800 to € 23.399
4 €450 to € 824 €1.950 to €3.599 €23.400 to € 43.199
5 € 825 or more € 3.600 or more €43.200 or more
The figure below shows the absolute sample size (left) and relative share (right) of used car
transactions of different car age cohorts per income category.
figure 16: used car transactions, per age-group of used cars, per household income category in EU-27.
Absolute data (left), relative share (right)

LDV CO2 legislation and the 2nd hand vehicle market 32
We find a fairly even distribution of the sample, with a higher representation in the higher income
categories. The lower income categories tend to buy older cars, in line with the intuition that
because of a lower disposable income to buy a car, lower income groups are forced to buy older,
cheaper cars. This observation is consistent for different groups of countries.
For this analysis, we have made a distinction between EU-15 countries and EU-10 countries in
view of the overall differences in income of the population:
EU-15: AT, BE, DE, DK, EL, ES, FI, FR, IE, IT, LU, NL, PT, SE, UK
EU-10(*): BG, CZ, EE, HU, LT, LV, PL, RO, SI, SK
(*) MT and CY (part of the so-called EU-12 countries) are not included here as they are likely to
have an atypical used car market. Therefore, we refer to "EU-10 countries".
figure 17 used car transactions, per age-group of used cars, per household income category in EU-15
(top) and EU-10 (bot). Absolute data (left), relative share (right)
The sample is distributed less evenly over the income groups, because of the simple reason that
household income is higher in EU-15 than in EU-10. The observation that lower income groups
tend to buy older cars holds. Older cars are more important in EU-10, with a higher share of used
car transactions in the >10y group. In depth observations on income-relations are done later in this
chapter.
A similar observation is clear when looking at average mileage:

LDV CO2 legislation and the 2nd hand vehicle market 33
figure 18: average mileage of used cars bought, per income category (km)
The mileage of used cars bought by the lower income groups is higher compared to high income
groups. The average mileage of used cars bought in EU-10 is consistently higher than EU-15. It is
interesting to note that for EU-15, the average mileage of cars bought by the lowest income group
is actually lower than that of the 2nd lowest income group. There is no immediate explanation for
this; possibly the used car for the lowest income group is the sole car in the household, while this
may be more likely to be an additional car for higher income groups. Willingness to pay for a first
car is likely to be higher than for a second car in households and lower income groups could opt
for a car with less initial mileage, although it may be more expensive. This hypothesis is also
supported when comparing prices of used cars, see figure below.
figure 19: average price of used cars bought, per income category (€)
We can make several interesting observations when looking at average prices of used car
transactions:
1. For both groups of countries, the average price of used car is higher in the lowest income
group compared to the second lowest income group. One possible explanation is that used
cars are more likely to be the sole car in the household for the lowest income group (see
earlier).

LDV CO2 legislation and the 2nd hand vehicle market 34
2. Average prices are lower in EU-10 than EU-15, consistently over all income categories.
This is logical as disposable income is lower in EU-10 compared to EU-15.
3. The average price of used cars from the highest income category behaves differently in the
2 groups of countries. For EU-15, the used cars of the highest income group are by far
more expensive than other income groups, while for EU-10, the average price is actually
lower compared to the second highest income group. There is no immediate explanation
for this. Possibly the market for young, former leasing cars is more important in Western
EU countries (EU-15), driving prices up in the young car market, and therefore more
profoundly affecting the highest income group.
Table 7: average and mean prices, per income category, EU-27 (€)
figure 20: Cumulative distribution of used car prices, per income category, EU-27 (€)
When looking in detail into the prices of used cars, we see a similar pattern for the used cars in the
different income groups. Mean prices are consistently for all income categories higher than the
median value, indicating a long tail in the data. This reflects a marginal, though significant share of
high price used cars, in all income groups.
4.3.2 Education level
In this section, we look into the relation of transaction indicator with education level as the key
indicator for socio-demographic group. We are again limited to the definition of education level as
provided in the survey options given. 5 possible answers are given:
1. Elementary (primary) school or less
2. Some high (secondary) school
3. Graduation from high (secondary) school
4. Graduation from college, university or other third-level institute
5. Post-graduate degree (Masters, PhD) beyond your initial degree
96% of respondents gave feedback on the question related to education level. As such, almost the
full dataset was used in this analysis.
1 2 3 4 5
average € 7 915 € 6 814 € 8 273 € 10 358 € 15 519
median € 3 500 € 4 000 € 5 800 € 7 650 € 10 720

LDV CO2 legislation and the 2nd hand vehicle market 35
The figure below shows the absolute sample size (left) and relative share (right) of used car
transactions of different age-intervals per education level.
figure 21: used car transactions, per age-group of used cars, per education level in EU-27. Absolute data
(left), relative share (right)
The bulk of the sample lies in the 3rd and 4th education group (75%). Only marginal differences
between the different levels of education can be observed in terms of age of the vehicles bought.
Less educated consumers seem to buy older cars, most likely due to correlation between education
level and income.
figure 22: used car transactions, per age-group of used cars, per education level in EU-15 (top) and EU-
10 (bot). Absolute data (left), relative share (right)
When comparing the 2 groups of countries, no major differences can be observed. The distribution
is more even in EU-10; in EU-15, the tendency to young used cars among the higher educated is
somewhat more explicit.

LDV CO2 legislation and the 2nd hand vehicle market 36
figure 23: average mileage of used cars bought, per education level (km)
Corresponding to the inverse correlation between education level and age of the used car bought,
the less educated also tend to buy used cars with higher mileage. As with the age relation discussed
in the previous figure, this relation is also more explicit for EU-15,
Finally, when looking at the average purchase price and its link to education level, the following
figure emerges:
figure 24: average price of used cars bought, per education level (€)
Interestingly, the group with the lowest education level tend on average to buy more expensive
vehicles; it is the middle group, “graduation from high (secondary) school”, buying the least
expensive used cars, on average. The observation holds for both groups of countries.

LDV CO2 legislation and the 2nd hand vehicle market 37
4.3.3 Employment
1. Self-employed
2. Employed full time
3. Employed part time
4. Unable to work due to long-term illness or disability
5. Unemployed and not looking for a job / looking after the home
6. Unemployed but looking for a job
7. In full time education / student
8. Retired
9. Other
Figure 25: used car transactions, per age-group of used cars, per employment group in EU-27. Absolute
data (left), relative share (right)
The employment situation does not provide any significant information on the distribution of the
used car sale. Obviously, the category of the full time employed takes the largest share of the sales,
as they represent the largest share of the population. The share taken by the other groups therefore
is so small that the limited statistical relevance of the data makes interpretation more difficult.
4.3.4 Age
figure 26: used car transactions, per age-group of used cars, per age of the owner in EU27. Absolute
data (left), relative share (right)
For distinction by age, we only see a small trend toward buying younger vehicles with increasing age
of the buyer. This most likely is linked to increasing income with age.

LDV CO2 legislation and the 2nd hand vehicle market 38
4.3.5 Income relations – link with SILC
We focus on household income as the indicator to distinguish between socio-economic groups as
this correlates with education level and employment situation. Household income is the most
logical indicator to focus on.
Our approach is to compare car ownership and transaction data from the 2 sources described in the
previous section:
1. SILC: total population with and without a passenger car, per member state and per
household income category.
2. TML-GfK data (GfK, 2014): prevalence of used car transactions in the last 3 years, per
member state and per income categories as a proxy for car ownership of used cars.
Matching the distributions from both sources gives an indication of the prevalence of used cars in
the population, per income category and per member state. More specifically, if the share of the
data-points from the TML-GfK data in a given income category is higher than the share of
households from the SILC-database estimating total car ownership, this indicates (a subset of) used
cars are over-represented in this income category compared to the population average.
Figure below represents the above comparison for EU-27:
figure 27: comparison of distribution of data-points of different datasets for EU-27
The above figure shows the share of the population (in case of SILC data) or respondents (in case
of TML-GfK data) in the different income categories. In the TML-GfK dataset, we make a
distinction between all transactions, transactions of vehicles younger than 5 year old and vehicles
older than 10 year. We can draw several conclusions:
When comparing SILC-data, the distribution of total households vs. the distribution of household
that own a car, the data shows that in the lower income categories the share of households with a
car is lower than the share of all households. Conversely, in the higher income category, the share
of households with car is higher than the share of all households. This indicates the obvious
conclusion that lower income households are less likely to own a car.
When comparing the data for second-hand transactions to the distribution of second hand car
transactions per income category, a similar trend emerges: the share of second hand transactions is
even higher in lower income categories and lower in the higher income category. This suggests an

LDV CO2 legislation and the 2nd hand vehicle market 39
overrepresentation of used hand car transactions in the lower income categories and thus an
overrepresentation of used car ownership in the lower income categories. If a lower income
household owns a car, it is more likely to be a used car compared to the population average, again
confirming the intuition.
When distinguishing age groups in the used car transactions, we observe it’s mainly older cars that
are overrepresented in the lower income categories. This is consistent over the income categories,
with a decreasing importance of older cars with increasing household income.
This indicates that lower income households are (1) more likely to purchase used cars compared to
the population average and (2) tend to buy older used cars.
There are limitations to comparing SILC and the used car transaction survey data:
1. The reliability of data on income in the TML-GfK database is not clear. Though sample
size is large, data is never perfect.
2. There is a sample bias in the TML-GfK database in that only dealer transactions are
included. Peer-to-peer transactions are excluded.
3. We are comparing transactions (TML-Gfk data) with ownership (SILC). Differences
between age groups in terms of transactions (more/less frequent) dilute the comparison.
E.g. if a higher turn-over rate occurs for older used cars this would entail more
transactions.
4. Uneven distribution of population & transaction over the selected income categories. Care
is needed when interpreting (e.g. the top 1% in PL can behave very differently to the top
10% in DE, while this is still the same income category in this analysis).
The observation holds for most individual EU-15 countries:
figure 28: comparison of distribution of data-points of different datasets for selected countries (clockwise
from top left: DE, FR, IT, ES)

LDV CO2 legislation and the 2nd hand vehicle market 40
For all countries, the same observation holds: an overrepresention of used cars, mainly older used
cars in the lower income group and less used cars compared to total households for the higher
income categories. This suggests that lower income groups, more than the population average tend
to buy used cars and if they do, the used cars are of older age.
For EU-10, the observations are similar, although there are a few important differences compared
to the EU-15 countries.
figure 29: comparison of distribution of data-points of different datasets for selected countries (clockwise
from top left: PL, LT, HU, SK)
What differs compared to selected EU-15 countries is the higher share of the lower income
category. Also, the share of households in the lowest income category without car is much higher
compared to selected EU-15 countries. When comparing the importance of used cars for different
socio-economic groups, used cars are indeed overrepresented in the lower income category as the
share of used car transactions is higher than the share of households with car for that income
category. Also, consistently over the countries, older used cars are important in the lower income
category.
The main difference is the observation that also in the higher income category used car transactions
are overrepresented to the population. This would suggest the higher income households buy more
used cars instead of new cars compared to the population average. This is counter-intuitive and a
straight-forward explanation cannot be found.

LDV CO2 legislation and the 2nd hand vehicle market 41
If this counter-intuitive observation would hold for only one or two countries, one may attribute
this to data-issues. However, the observation is consistent for most EU-10 Member States14.
Possible explanations:
1. Data issues:
a. Reliability of data: did the respondents flag the correct household income?, did a
higher share of low-income groups not respond to the question related to
household income? (84% of respondents gave feedback on income)
b. Possible respondent bias: although the survey is controlled for the mismatch
between the online population and the total population, a respondent bias cannot
be ruled out. (e.g. limited access to the questionnaire in lower income groups?)
2. Are there private traders active in the higher income category? There is circumstantial
evidence hinting in this direction.
3. Possibly there is a higher turn-over rate of used cars in the higher income category vs.
stronger retention in the lower income category. i.e. lower income households could hold
on to their (old) used car for much longer while higher income households may afford to
change (used) car more frequently. As a result, we would find more transactions in the
higher income group compared to the lower income groups. This is a consequence of
comparing ownership (SILC) with transactions (TML-GfK)
4. TML-GfK data only includes used car transactions via traders. It is possible the higher
income groups tend to buy more via traders and less via direct peer-to-peer purchases.
5. The uneven distribution of selected income categories can cause problems for the
methodology. i.e. the highest income category in PL (and most other new Member States)
represents only 1% of the population, while this is more evenly distributed for EU-15 MS
(e.g. FR: 26%, DE: 15%, IT: 19%.)
14 All EU-10 Member States except CZ show similar behaviour. In the TML-Gfk database, over 60% of transactions in
CZ would fall under the highest income category, while the share of households in this bracket is limited to 1%,
according to SILC. We find this specific issue only in data for CZ and conclude the findings for the other countries still
stand. CZ is excluded from further analysis when looking into income distribution.

LDV CO2 legislation and the 2nd hand vehicle market 42
To complete the analysis, we distinguish between EU-10 and EU-15. Because of the data problem,
we exclude CZ from further analysis, not to dilute the overall figures.
figure 30: comparison of distribution of data-points of different datasets for EU-15 (top) and EU-10-CZ
(bottom)
The observation for EU-15 is similar to the EU-27 observations. For EU-10, as discussed earlier,
we see an unexpected higher prevalence of used car transactions also in the higher income groups,
although in absolute figures this does not account for many transactions.

LDV CO2 legislation and the 2nd hand vehicle market 43
4.4 Estimation of vehicle stock per income group
In a next step, we use the above sources to estimate the EU vehicle stock, broken down per income
group and we make the distinction between new and different age-classes of used cars, in each
member state.
We apply the following, step-wise procedure:
1. First, we estimate the total stock per income group per country based on
a. Car ownership rate per country per income group (SILC)
b. Numbers of cars owned per household based on additional information on the
number of cars owned per income category. This is needed as car ownership rate
in SILC as such does not include information how many cars are owned by the
household.
2. Secondly, we add the distinction between used and new vehicles in the total stock. For the
estimations of size of used car market we rely on various sources.
3. Subsequently, we add further distinction to further break down the share of used cars by
using the distributions of used car transactions of different age brackets (TML-GfK data)
and total ownership (SILC).
4. Finally, a RAS-procedure is applied to fit totals. This step can also be seen as a quality
check to see if the preliminary estimate after the previous step is correct. Initial values for
the RAS-procedure should not differ too much from the end result.
4.4.1 Estimation of total stock by income group
SILC provides information on the total number of households per income category, per country, as
well as car ownership per household. When combined with the number of cars per household, this
allows us to estimate the total stock of vehicles in a given country, per income category.
The number of cars per household is less obvious to estimate. SILC only reports if households own
a car, but it does not provide information about how many cars are owned. There is limited
anecdotal evidence confirming the intuition that higher income households tend to have more cars.
The “used car market report” (BCA, 2013 and BCA, 2014) includes an annual survey in the UK;
including the question how many cars are available in each household, linking the feedback to
‘social grade’ of the respondent. The distinguishing feature of social grade is that it is based on
occupation.
upper middle class: higher managerial, administrative or professional
middle class: intermediate managerial, administrative or professional
skilled working class: Skilled manual workers
working class: Semi-skilled and unskilled manual workers
non-working: Casual or lowest grade workers, pensioners, and others who depend on the
welfare state for their income
Unfortunately, no data is available at the level of income, so we use the UK NRS15 social grade
segmentation as a proxy for the income group.
15 United Kingdom National Readership Survey

LDV CO2 legislation and the 2nd hand vehicle market 44
figure 31 Number of cars per UK household by social grade (source: Ricardo-AEAT evaluation, 2015.
Original source: BCA, 2013)
A second source holds similar information for Denmark (Gillingham et. al. 2015):
figure 32: Number of cars per DK household by income (source: Gillingham et. al. 2015)
Both sources indicate an increasing amount of cars with increasing income. We use these sources to
estimate how many cars are owned by car-owning households. Obviously, this cannot be lower
than 1. Building on both sources, thus excluding the households without car and assuming
households owning more than 2 cars, on average own 3.5 cars, we can draw the following
relationship between social grade (UK)/income quintile (DK) to the number of cars owned per
household:

LDV CO2 legislation and the 2nd hand vehicle market 45
figure 33: estimation of cars per UK household by social grade
We observe a quasi-linear trend and we will assume a similar relation for all EU countries to
estimate total number of vehicles per country (confirmed by the Danish data). We then re-estimate
the coefficient value (a + b*x, with “x” being the income group, from 1 to 5) so as to match the
estimations with the vehicle stock data published in the EU pocketbook “transport in figures” (TiF
2015), for the year 2014.
The table below summarizes the initial estimation, using the coefficient values from the DK-UK
analysis. Note that the estimation for the UK gives a reliable estimate, only deviating 4% compared
to the statistics. This indicates the assumption to use UK NRS social grade for income group is a
good proxy.

LDV CO2 legislation and the 2nd hand vehicle market 46
Table 8: summary of estimation attempt, breaking down vehicle stock into income groups.16
For most EU-15 countries, only minor changes were needed to the coefficient value. We target first
the slope (“b”) to fit the estimation and only make changes to the constant (“a”) if slope
adjustments generate more than 4 cars on average for households in the highest income group. The
constant reflects how many cars are owned by the lowest income group, if at least one car is owned
by the household (households without cars are excluded). A higher constant value is needed mostly
for EU-10 countries. This is to be expected as households tend to be larger in those countries.
It is important to understand the limitations of this estimation. Elements to consider:
1. Size of households differs between MS: in order to fit the estimation, the constant need to
be higher to account for these differences.
2. The linear estimate, though valid for UK & DK, may not be valid for other MS.
3. The distribution of households among the income groups: The lowest income group may
represent >20% of households in one country, it may represent merely 1% for the other.
The linear function may not apply for the different countries as the variable “x” is de facto
not the same for the countries.
Clearly, there are important limitations to this estimation approach. However, for the purpose of
our analysis, the estimation is useful. This step adds nuance to what extent cars are distributed
16 Graded colour scale: green = closer to perfect fit (100%); yellow increasing to red = increasing relative deviation
a b a b
AT 1.15 1.1172 4454358 4641308 96% 1.15 1.1320 4642019
BE 1.15 1.1172 5816874 5504809 106% 1.15 1.0971 5505110
BG 1.15 1.1172 1801163 2910200 62% 1.6 1.2774 2912627
CY 1.15 1.1172 390959 474561 82% 1.15 1.1889 474454
CZ 1.15 1.1172 3824912 4729185 81% 1.15 1.2474 4732292
DE 1.15 1.1172 47955973 43851230 109% 1.15 1.0833 43853183
DK 1.15 1.1172 3141439 2278121 138% 1.05 1.0410 2278016
EE 1.15 1.1172 427784 628500 68% 1.4 1.2405 628515
ES 1.15 1.1172 19983252 22024538 91% 1.15 1.1572 22023055
FI 1.15 1.1172 2976582 3127399 95% 1.15 1.1352 3128476
FR 1.15 1.1172 35400809 32243826 110% 1.15 1.0835 32245437
GR 1.15 1.1172 4490442 5124208 88% 1.15 1.1754 5123156
HU 1.15 1.1172 2553026 3040732 84% 1.15 1.2535 3042781
IE 1.15 1.1172 2148786 1933129 111% 1.15 1.0825 1933278
IT 1.15 1.1172 30477065 36962934 82% 1.15 1.1943 36934766
LT 1.15 1.1172 1037521 1808982 57% 1.6 1.2814 1809326
LU 1.15 1.1172 290266 363247 80% 1.15 1.1879 363244
LV 1.15 1.1172 568368 634603 90% 1.15 1.1854 634525
MT 1.15 1.1172 173918 256096 68% 1.4 1.2108 256102
NL 1.15 1.1172 9138062 7932290 115% 1.15 1.0677 7934142
PL 1.15 1.1172 10735842 19389446 55% 1.8 1.2151 19391585
PT 1.15 1.1172 4148017 4480000 93% 1.15 1.1566 4479866
RO 1.15 1.1172 2738075 4695660 58% 1.8 1.2244 7433739
SE 1.15 1.1172 5442591 4495473 121% 1.15 1.0486 4498511
SI 1.15 1.1172 892170 1063795 84% 1.15 1.1964 1063242
SK 1.15 1.1172 1622129 1879759 86% 1.15 1.2701 3501892
UK 1.15 1.1172 31203773 30074857 104% 1.15 1.1030 30078204
EU-27 1.15 1.1172 233700308 246548888 95% 1.15 1.1391 246679924
EU-15 1.15 1.1172 206026209 200387722 103% 1.15 1.1067 200384073
EU-10 1.15 1.1172 26067140 40780862 64% 1.6 1.2007 40821268
estimate stock
pre-calibration
estimate stock
post calibration
initial coef adjusted coefTIF 2013 deviation

LDV CO2 legislation and the 2nd hand vehicle market 47
between households of different income groups. The main determining factor is the share of
households per income group. In this sense, the limitations of the estimation are mitigated, as we
only use it to refine the allocation of the vehicle stock not one-on-one to distribution of
households, but to take into account the fact that higher income households own more cars.
We come to the following estimate of the distribution of the total stock of cars, per household, for
EU countries:
Table 9: Estimated Distribution of passenger cars, per household by income group, for EU member
states.
1 2 3 4 5
AT 0% 2% 21% 38% 39%
BE 0% 2% 27% 36% 35%
BG 15% 57% 26% 2% 0%
CY 0% 3% 21% 37% 39%
CZ 1% 22% 59% 14% 3%
DE 0% 4% 29% 38% 28%
DK 0% 1% 19% 33% 47%
EE 4% 28% 52% 14% 3%
ES 1% 6% 32% 38% 24%
FI 0% 2% 22% 36% 39%
FR 0% 2% 25% 40% 33%
GR 1% 9% 36% 37% 17%
HU 3% 45% 48% 4% 1%
IE 0% 1% 15% 30% 53%
IT 1% 4% 29% 37% 29%
LT 6% 34% 48% 9% 3%
LU 0% 0% 5% 23% 72%
LV 6% 27% 44% 17% 5%
MT 1% 13% 43% 34% 9%
NL 0% 2% 22% 39% 37%
PL 3% 34% 51% 10% 2%
PT 2% 16% 49% 23% 10%
RO 19% 62% 17% 1% 0%
SE 1% 4% 26% 35% 34%
SI 0% 7% 38% 42% 12%
SK 2% 27% 58% 12% 2%
UK 1% 6% 28% 35% 29%
EU-27 1% 8% 29% 34% 28%
EU-15 1% 4% 27% 37% 31%
EU-10 6% 36% 46% 10% 2%

LDV CO2 legislation and the 2nd hand vehicle market 48
4.4.2 Distinction between new and used cars
In the next step, we compare the prevalence of transactions, using the TML-GfK dataset, with the
estimated stock per income group. If the prevalence of a given income group is higher than the
share of total stock for that group, used cars will be overrepresented for this group.
The table below depicts the share of used car transactions vs. the share of vehicles owned, by
household income class for the EU.
Table 10: share of used car transactions and vehicle ownership by income group (source: SILC & TML-
GfK database)
While the lowest income class only represents 1% of ownership, it accounts for 9% of used car
transactions. This indicates lower income groups proportionally tend to buy more used cars than
higher income groups. The trend consistently declines with increasing household income.
The table below adds detail at the level of age of the used car.
Table 11: share of used car transactions, for different age cohorts of used cars and vehicle ownership by
income group (source: SILC & TML-GfK database)
Older vehicles are more common in the lower income groups and vice versa for the richer income
groups. This indicates that low income groups not only tend to buy more used cars than higher
income groups, but also that lower income groups also tend to buy older used cars.
To estimate the total fleet by vehicle properties, namely new and different age cohort of used
vehicles, as well as by household income group, we apply the following methodology:
From the previous section, we have an estimate of the total fleet by income group. We first
distinguish between the total of used cars vs. new cars, using public information about the size of
the used car market. This differs by country. (BCA 2013) published ratios for different member
states:
1 2 3 4 5
SILC ownership 1% 8% 29% 34% 28%
TML-GfK used car transactions 9% 16% 30% 29% 15%
ratio 8.07 2.05 1.04 0.86 0.54
1 2 3 4 5
SILC ownership 1% 8% 29% 34% 28%
transactions <5y 8% 13% 29% 32% 18%
transactions 5-10y 9% 16% 32% 29% 13%
transactions >10y 13% 22% 31% 24% 9%

LDV CO2 legislation and the 2nd hand vehicle market 49
figure 34; ratio used/new passenger cars in 2013, for selected member states (BCA, 2013)
Key fleet indicators from (BCA 2014) for Germany, UK and France are summarized below:
Table 12: fleet dynamics in DE, UK & FR (BCA, 2014)
(CIRP, 2007) comes to a similar ratio for most countries data is presented. Only for Spain, the
sources are contradictory:
figure 35: ratio used/new passenger cars in 2013, for selected member states (CIRP, 2007)
There are large differences between countries and this will differ from year to year as market
conditions in the new car market can fluctuate significantly. A mix of incentives or disincentives for
used car trade and apparent national consumer preferences also explain the large differences.
Detailed information is not available for all countries. We thus have to estimate the used car market
at EU level with other sources. We use the difference between new registrations from Eurostat and
ACEA as a proxy to estimate the importance of the used car market. ACEA data reflects new
units (M) DE FR UK
fleet (2012) 43.4 31.6 30.9
sales new (2013) 2.95 1.79 2.26
sales used (2013) 7.1 5.3 7.4
used/new 2.4 3.0 3.3
turn ratio 23% 22% 31%

LDV CO2 legislation and the 2nd hand vehicle market 50
registrations of new cars, while Eurostat reports total new registrations. This means Eurostat
registration includes new registrations of new cars as well as imported used cars (see also in the
subsequent chapter). Note that this still excludes the domestic used car market.
Because of the lack of data, we cannot do this analysis at country level, but will stick to analysis for
the groups of countries described earlier. Also, the used car market size will still be an estimate, so
care is needed when interpreting the final results on the detailed fleet composition, especially with
respect to the size of the used car vs. new car share.
As such, conventionally, we estimate the used car market at factor 3.5 for EU-27, 3 for EU-15
and factor 8 for EU-10 compared to the size of the new car market.
Secondly, we need to account for differences in used car sales frequency as a function of their age
If younger cars are traded more frequently, this will be reflected in the sample of the used car
transactions. A correction factor is needed to derive ratios of the importance of different age
cohorts of used cars to the total fleet.
We compare below the age distribution of used car transactions with the age structure of the fleet.
For the first, we use the TML-GfK database; for the latter we use TRACCS17. The latter is
consistent with findings from (Ricardo-AEA - Dun et. al., 2015)
The figure below compares both sources:
figure 36: share of used car transactions (dashed line) and total fleet (full line) as a function of age.
The figure shows that there are proportionally more used car transactions for younger vehicles
compared to their importance in the total fleet. This suggests younger cars are more frequently
traded and are as such overrepresented in the sample. This suggests a shorter retention period in a
passenger car’s early life, changing hands more frequently compared to older cars.
As with the data on the used car market, this information only gives us an indication that the effect
is relevant (i.e. younger cars are overrepresented in the sample but cannot be directly used to
distribute the stock over different age cohorts of used cars). Various issues complicate the
comparison:
17 http://traccs.emisia.com/index.php

LDV CO2 legislation and the 2nd hand vehicle market 51
1. The age distribution of the fleet is 2010 data, while the transaction data is mixed 2010-
2011-2012-2013
2. Increasing scrappage rates with growing age dilute the relative comparison of the datasets.
Also, data from the UK market suggests dealer transactions are mostly young used cars (BCA,
2013), particularly in the 0-5y segment. The sample of transactions excludes peer-to-peer
transactions, suggesting the sample is biased towards young used car transactions.
Based on the available data, comparing sales and fleet, we weigh the transaction sample with the
following weighting factors.
Table 13: assumption weighting of used car transaction data
We have tested different weighting factors and estimated the fleet composition for all income
groups over the different vehicle age cohorts and compared the resulting fleet composition by age
with Eurostat data. The weighting factors we apply are strong, but the resulting fleet composition
supports its use:
Table 14: resulting fleet composition by age cohort, comparing initial estimate with unweighted sample
with weighted sample and available data from Eurostat18
Both assumptions on the size of the used car market and the correction for comparing transactions
with ownership affect the estimation results. The assumptions are a best effort with limited
information available but clearly, the estimation of the fleet composition is subject to uncertainty
and the reader should be aware about the importance of these assumptions when drawing
conclusions from the estimation, in particular about the size of the used car market.
With the above data and assumptions, we can now estimate the fleet size per income group and
distinguishing between first owner (hereafter referred to as 'new') and different age cohorts of used
cars.
18 All “new” vehicles in the estimate are allocated to the 0-5y vehicle stock. This will create a minor overestimation in the
0-5y estimate figure.
weight original distribution weighted distribution
0 - 5y 0.25 54% 13%
5 - 10y 1.50 24% 40%
>10y 2.00 23% 47%
Eurostat data
estimate unweighted
sample
estimate weighted
sample
0 - 5y 29% 57% 30%
5 - 10y 28% 18% 24%
>10y 44% 26% 46%
0 - 5y 32% 58% 32%
5 - 10y 29% 17% 23%
>10y 39% 25% 45%
0 - 5y 13% 50% 20%
5 - 10y 23% 20% 27%
>10y 64% 29% 53%
EU-27
EU-15
EU-10

LDV CO2 legislation and the 2nd hand vehicle market 52
The share of vehicle ownership per income group, using the SILC data and the (weighted) share of
used car transaction enables us to distinguish between used and new cars. The table below
summarizes this for the whole EU:
Table 15: allocation of total fleet per household income class to new (first owner) or used car, using the
share of used car transactions and total car ownership. (EU-27)
The first row is the estimate of total fleet per income group, using the approach as summarized in
Table 8. The second row reflects the relative share per income group, comparing with the share of
total used car transactions per income group in the third row. We then estimate the amount of used
car transactions for every new car as the share of used car transactions (3rd row) divided by the
share of total fleet (2nd row), divided by the correction for the size of the used car market as a
whole, in this case 3.5. We then allocated the total fleet (first row) to new and used car fleet,
respecting the estimated amount of used car transactions for every new car.
Note that in all income groups, the used car market is still larger in volume than the new car
market. We assume a ratio of 3.5 used cars vs. new cars, based on various sources (see earlier).
We add the distinction of the different age cohort of used cars. In this step, the weighting of the
transactions according to age is relevant (see earlier about conventional assumptions on sample
weighting).
Table 16: allocation of the used cars by income group to different age cohort
After applying these shares to the estimates in
Table 15, we come to the following intermediate result:
Table 17: intermediate result: fleet size per income group and new/used car age cohort (EU27)
1 2 3 4 5
total cars owned (SILC) 2 790 472 19 290 866 72 087 805 84 210 716 68 300 064
share 1.13% 7.82% 29.22% 34.14% 27.69%
share of used car transactions 9.13% 16.06% 30.49% 29.38% 14.94%
2nd hand transactions per new sales 28.26 7.19 3.65 3.01 1.89
new 95 370 2 356 608 15 497 182 20 986 582 23 647 617
used 2 695 102 16 934 258 56 590 623 63 224 135 44 652 447
1 2 3 4 5
all 100.00% 100.00% 100.00% 100.00% 100.00%
0 - 5y 8.46% 8.24% 11.10% 14.27% 12.16%
5 - 10y 22.46% 27.99% 37.00% 32.35% 34.60%
>10y 69.08% 63.77% 51.91% 53.38% 53.23%
1 2 3 4 5 TOTAL TOTAL*
all 2 790 472 19 290 866 72 087 805 84 210 716 68 300 064 246 679 924 246 679 924
0 - 5y 227 955 1 395 924 6 279 720 9 021 139 5 430 728 22 355 466 19 053 682
5 - 10y 605 420 4 739 188 20 936 193 20 453 045 15 451 757 62 185 603 58 532 866
>10y 1 861 728 10 799 146 29 374 710 33 749 951 23 769 962 99 555 496 114 275 616
NEW 95 370 2 356 608 15 497 182 20 986 582 23 647 617 62 583 358 54 817 761

LDV CO2 legislation and the 2nd hand vehicle market 53
Note that in table above, there are 2 different figures for totals over the income groups. The totals
on the left sum up after the allocation as described above. The totals on the right (*) disregard the
distinction per income group, only using the weighted sample on transactions per used car category.
The minor differences that persist are a consequence of the proportional allocation per income
group, in which we cannot maintain the overall share per category.
The allocation of the totals, ignoring the distinction per income group is expected to be more
reliable (larger sample, less assumptions) and as such we execute a final data conversion to fit row
totals, using “Iterative proportional fitting” or RAS-procedure. This procedure is an iterative
algorithm for estimating cell values of a contingency table such that the marginal totals remain fixed
and the estimated table decomposes into an outer product.19
After applying the RAS-algorithm to fit rows and column totals, the final estimation figures are:
Table 18: final estimation of EU-27 passenger car fleet, by income group and used car category
The estimation results confirm the intuition. Highlights:
1. Over 70% of cars owned by low income household groups are old used cars (>10 years)
2. New cars only account for 30% even in the highest income group, attributed to the large
size of the used car market.
3. The relative share of used cars and the age of the used cars increases with decreasing
income.
4. New sales in the EU amount to about 12M unit annually20. Our estimate indicates about
54M new cars active. Added up with the youngest used car category, this sums up to about
19 https://en.wikipedia.org/wiki/Iterative_proportional_fitting 20 Source: ACEA
absolute figures 1 2 3 4 5 TOTALS
TOTAL 2 790 472 19 290 866 72 087 805 84 210 716 68 300 064 246 679 924
0 - 5y 181 284 1 139 602 5 328 798 7 697 836 4 706 162 19 053 682
5 - 10y 532 139 4 276 148 19 635 599 19 289 577 14 799 402 58 532 866
>10y 1 999 411 11 905 718 33 661 809 38 891 554 27 817 124 114 275 616
NEW 77 639 1 969 398 13 461 599 18 331 749 20 977 376 54 817 761
TOTAL USED 2 712 834 17 321 468 58 626 206 65 878 967 47 322 688 191 862 163
relative distributions 1 2 3 4 5 TOTALS
TOTAL 1% 8% 29% 34% 28% 100%
0 - 5y 1% 6% 28% 40% 25% 100%
5 - 10y 1% 7% 34% 33% 25% 100%
>10y 2% 10% 29% 34% 24% 100%
NEW 0% 4% 25% 33% 38% 100%
TOTAL USED 1% 9% 31% 34% 25% 100%

LDV CO2 legislation and the 2nd hand vehicle market 54
73M, suggesting an age of about 4-4.5y for the first transaction new used (taking into
account that a minority cars under the label “NEW” will be retained longer than 5 years).
This chapter elaborated in detail the methodology to come to this estimate. At various steps key
assumptions were made (size of the used car market, comparing transactions vs. ownership). It’s
important to acknowledge the above results are an estimate and should not be treated as data.
Because of the limited sample size, it is not possible to makes statements at country level. As
indicated in the beginning of the chapter, we can distinguish 2 groups of countries: (i) EU-15, with
higher average incomes and mainly car exporters, and EU-10 mainly importing cars. To understand
if the combination of both groups masks any real differences, we show the results of the analysis
for both groups:
Table 19: final estimation of EU-15 passenger car fleet, by income group and used car category
There are no major differences between the total EU-27 estimation and the EU-15 estimation,
other than that the lower income groups are smaller. All trends are similar. Note that EU-15 total
fleet accounts for over 80% of the total EU-27 fleet, as such it is logical that observations between
the 2 outcomes are similar.
Finally, we discuss the results for EU-10.
absolute figures 1 2 3 4 5 TOTALS
TOTAL 1 139 582 8 502 730 55 371 998 74 411 038 60 946 432 200 371 780
0 - 5y 72 809 491 404 3 942 753 6 551 946 3 865 162 14 924 074
5 - 10y 216 977 1 871 994 14 749 604 16 668 263 12 339 881 45 846 720
>10y 828 154 5 294 521 25 685 792 34 138 326 23 561 249 89 508 041
NEW 21 642 844 810 10 993 849 17 052 503 21 180 140 50 092 945
TOTAL USED 1 117 940 7 657 919 44 378 149 57 358 534 39 766 292 150 278 835
relative distributions 1 2 3 4 5 TOTALS
TOTAL 1% 4% 28% 37% 30% 100%
0 - 5y 0% 3% 26% 44% 26% 100%
5 - 10y 0% 4% 32% 36% 27% 100%
>10y 1% 6% 29% 38% 26% 100%
NEW 0% 2% 22% 34% 42% 100%
TOTAL USED 1% 5% 30% 38% 26% 100%

LDV CO2 legislation and the 2nd hand vehicle market 55
Table 20: final estimation of EU-10 passenger car fleet, by income group and used car category
A different picture for EU-10 emerges. The most striking observation is the reversed trend of
increased prevalence of used cars also for the higher income groups. This is not the case for EU-15
and is counter-intuitive.
Possible explanations were already discussed earlier in the chapter. It is not clear if this counter-
intuitive observation is the effect of flawed data or if in fact the data holds unidentified behaviour.
Data issues cannot be ruled out, with possible reliability problems of data on the household
income, though 84% of respondents gave feedback on income. Secondly, a sample bias on the
income classification can distort the result. According to SILC data (considered reliable), only 5%
of the households are included in the top 2 income groups, while the survey data on transactions
puts 20% of all transactions is the top 2 income groups, reflecting a higher share of used car
transactions in the higher income groups. Analysis of the sample used in the survey data revealed
no possible cause for sample bias, though this cannot be ruled out.
If the data is indeed correct, the counter-intuitive trends reveals specific behaviour for these aspects
of the EU used car market. For example, it is possible there are private traders in the higher income
category, causing a higher share of used car transactions. These groups could operate as an
importing “gateway” of foreign used cars, reselling foreign used cars quickly in the domestic
market.
Secondly, it is possible there is a higher turn-over rate of used cars in higher income category vs.
stronger retention in the lower income category. i.e. lower income households, due to limited
absolute figures 1 2 3 4 5 TOTALS
TOTAL 2 253 623 14 856 273 18 830 507 4 075 718 807 021 40 823 142
0 - 5y 176 199 1 074 867 1 742 264 516 781 93 546 3 603 657
5 - 10y 455 889 3 555 053 5 658 751 1 141 438 259 296 11 070 427
>10y 1 536 122 8 876 437 8 699 688 2 063 834 437 072 21 613 153
NEW 85 414 1 349 917 2 729 804 353 664 17 106 4 535 905
TOTAL USED 2 168 209 13 506 356 16 100 704 3 722 054 789 915 36 287 237
relative distributions 1 2 3 4 5 TOTALS
TOTAL 6% 36% 46% 10% 2% 100%
0 - 5y 5% 30% 48% 14% 3% 100%
5 - 10y 4% 32% 51% 10% 2% 100%
>10y 7% 41% 40% 10% 2% 100%
NEW 2% 30% 60% 8% 0% 100%
TOTAL USED 6% 37% 44% 10% 2% 100%

LDV CO2 legislation and the 2nd hand vehicle market 56
budget, could hold on to their (old) used car for much longer while higher income households may
afford to change (used) car more frequently.
Also the size of the households matters; households tend to be larger in Eastern EU, leading to
higher total household income, but also to higher car ownership, of which most may be used cars.
(See also earlier in this chapter).
Finally, from a methodological point of view, the uneven distribution of selected income brackets
can also cause problems for the RAS-procedure.
In any case, in absolute volumes, the top 2 income groups represent a small share and the 3 lower
income groups, accounting for 87% of total used cars, reveal the same trend as the first group of
countries, i.e. higher prevalence of used car and older used cars with decreasing household income.
4.5 Conclusion
This chapter looked into the open SILC database and other publications, in combination with our
own dataset on used car transaction to gain understanding in the importance of social strata in the
used car market.
Scattered data and anecdotal evidence has led to the intuition that there are important socio-
economic distribution effects associated with the used car market. This chapter confirms this
intuition and supports the rationale with data and estimation. Key conclusions are:
1. The used car market is of substantially larger size than the new car market in terms of
volume and this is more explicit for EU-10.
2. There are distinct differences in the size of the used car market between countries
3. Consistently for all EU countries, the used car market is more important for lower income
groups.
4. While used cars are more prevalent in lower income groups, the used cars they own also
tend to be older.
5. We expect average ownership periods of about 5-7 years, average 3-4 different owners
during the lifetime, with potential large differences between member states.
6. Given the above, we expect important distribution effects between income-groups
for measures focusing on new sales (e.g. environmental legislation, safety, taxation).
7. Some of the findings are not intuitive and important assumptions were needed to come to
an estimate of the EU fleet by income group & age cohort (see top income group for EU-
10). More empirical evidence is needed to make any definite statements

LDV CO2 legislation and the 2nd hand vehicle market 57
5 Used car cross-border trade
5.1 Objective
The aim of this task is to update the 2011 study of flows of second hand cars within the EU and
export outside the EU (OKO - Mehlhart e.t al., 2011), to construct a time series. Table below
summarizes the estimate the findings of that study, estimating used car flows in the EU for 2008:
Table 21: Estimated relevance of imports and exports (M1 & N1) to the composition of the national fleets
for 2008 (source European second-hand car market analysis 2011, OKO)

LDV CO2 legislation and the 2nd hand vehicle market 58
5.2 Methodology
In the 2011 study, national sources were used to compile the above table. COMEXT21, the
European database for intra- and extra-EU trade is the data source of preference. However, due to
high reporting threshold values, the bulk of the used car trade is not captured in the trade database.
This was a problem for the study in 2011 and still is for this study. We therefore have to focus on
national sources.
5.3 Data
5.3.1 Used car survey
Before going over the national data, we look into the survey data from (GfK, 2014). In this survey
information about the country of origin was collected and in total, 23.493 transactions include this
information (93%). Of these, 1.459 transactions are cross-border trades, 6.2% of all transactions.
The table below summarizes the origin and destination of used cars transactions reported in this
dataset.
Because the sample size is fixed at 1000 points for big countries and 500 for small countries, while
population differs between countries, the data should be weighted to allow for comparison between
countries.
The table below shows the weighting factors we apply. Figures represent how many households a
data point represents.
Table 22: weighting factors to allow for comparison of transactions between countries
In the figure below the number of used car transactions is shown, unweighted (top) and weighted
(bottom).
21 http://ec.europa.eu/eurostat/web/international-trade/data/database
country AT BE BG CY CZ DE DK EE ES FI FR GR HU IE IT LT LU LV MT NL PL PT RO SE SI SK UK
weight
factor 6628 8437 6073 1356 7754 65294 4378 2165 36999 4122 48194 9310 8186 5556 47815 4846 827 3368 1136 12263 30214 8209 17423 7519 3384 4386 44306

LDV CO2 legislation and the 2nd hand vehicle market 59
Table 23: origin and destination of used car transactions in the TML-GfK dataset. Unweighted (top –
weighted (bottom)
For all countries, the country of origin of the used car is most often also the country of destination.
Several countries stand out in having a relatively large share of import compared to domestic used
cars, though the bulk is still domestic trade:
1. Bulgaria: Large import mainly from Austria, Germany and Italy
2. Luxembourg: Large import mainly from Belgium and Germany. This is due to the fact that
domestic supply is limited and to the small size of the country. Neighbouring countries are
quite close with shared languages, facilitating cross-border trade
3. Latvia: Large import mainly from Germany
4. Malta: Large import mainly from the UK. Malta and Cyprus are special cases due to left-
hand drive and due to their small size. As a consequence, domestic supply is limited leading
to high imports from the UK.
5. Poland: Large import mainly from Germany and to lesser extent other Western EU
countries.
6. Romania: Large import mainly from Germany and to lesser extent other Western EU
countries. At 69%, Romania has the lowest ratio of domestic used car trade according to
Destination
Origin AT BE BG CY CZ DE DK EE ES FI FR GR HU IE IT LT LU LV MT NL PL PT RO SE SI SK UK
AT 1010 22 2 1 1 1 13 1 2 11 3 14
BE 1 1022 4 4 1 1 4 7 4 1 5 5 18 6 3 14 4 9 1 1 7
BG 827 1 1 2 2
CY 433
CZ 1025
DE 23 5 69 1 63 1042 17 28 2 16 5 29 9 5 31 67 44 8 73 4 231 6 10 35 2
DK 2 1 966 1 1 2 11
EE 1 456 3 1
ES 1 1 1004 1 1 1 2 4 1 1
FI 5 1017
FR 1 4 5 1 5 3 1034 1 1 1 5 2 4 8 13 1 1 1
GR 8 962 1
HU 965
IE 562
IT 4 3 61 9 1 1 1 2 1 1034 1 1 1 1 17 1 4 4
LT 5 1 444 8 1
LU 1 4 2 406 1 1
LV 2 1 2 435
MT 218
NL 1 5 3 3 2 2 4 2 1059 5 8 1 4
PL 1 2 1 902 2
PT 1023
RO 682
SE 3 3 2 1 2 2 990
SI 483
SK 1 919
UK 10 39 1 1 53 6 1 66 1 5 1 4 1 1 1114
Destination
Origin AT BE BG CY CZ DE DK EE ES FI FR GR HU IE IT LT LU LV MT NL PL PT RO SE SI SK UK
AT 285 5.7 0.7 2.8 0.2 2.1 4.5 2.0 2.6 8.2 0.4 2.6
BE 0.3 367 1.0 1.3 2.8 0.1 6.3 14.4 1.6 0.3 10.2 1.0 0.6 0.9 1.6 18.0 1.4 6.7 0.3 0.1 1.3
BG 214 0.2 0.4 4.1 1.5
CY 25
CZ 338
DE 6.5 1.8 17.8 0.1 20.8 2896 3.2 2.6 3.1 2.8 10.3 11.5 3.1 10.2 6.4 2.4 6.3 4.2 93.9 1.4 171.3 1.9 1.4 6.5 3.8
DK 0.5 0.3 180 0.3 1.3 1.5 2.1
EE 0.2 42 0.5 0.1
ES 0.3 2.8 1581 2.0 0.1 1.3 0.7 3.0 0.3 1.9
FI 0.5 178
FR 0.3 1.4 1.3 0.1 1.7 4.7 2121 0.4 0.2 0.2 0.2 0.3 5.1 2.8 9.6 0.3 0.2 1.9
GR 0.5 381 0.7
HU 336
IE 133
IT 1.1 1.1 15.8 3.0 2.8 1.6 2.1 0.8 0.3 2104 0.2 0.0 1.3 0.3 12.6 0.3 0.6 0.7
LT 0.5 0.2 92 1.1 0.3
LU 0.4 8.2 0.4 14 0.5 1.3
LV 0.2 0.2 0.4 62
MT 11
NL 0.3 1.8 0.8 1.0 5.6 0.4 0.1 0.3 553 6.4 5.9 0.1 0.7
PL 0.3 0.4 0.1 1160 0.4
PT 357
RO 506
SE 0.8 0.3 0.7 2.0 2.6 0.7 317
SI 70
SK 0.3 172
UK 2.6 2.3 1.6 0.3 12.5 1.2 0.1 3.2 0.5 6.4 0.3 3.0 0.3 0.2 2101

LDV CO2 legislation and the 2nd hand vehicle market 60
the data. The flow from Germany to Romania is the largest in the dataset in absolute
figures (231 transactions)
We can use the share of domestic transactions by origin vs total transactions as a proxy to
determine to what extent imports are important for a given country. The lower the ratio the more
important are imports for this market. Likewise, we use the share of domestic transactions by
destination vs total transaction as a proxy to determine to what extent exports are important for a
given country. The lower the ratio the more important are exports.
Table 24: share of domestic transactions by origin (left) and destination (right)
In general, the 2011 study conclusions on the distinction between importing and exporting
countries are supported by this new data.22 The countries identified as main import countries
(green) and main exporters (blue) match the countries in the 2011 study. LT, identified as a
somewhat special case in the 2011 study, is also according to this data somewhat different
compared to the other member states scoring relatively highly for both import and export.
22 Note that the ratios presented are not the same ratios from the 2011 study. However, the conclusions that are drawn
from the ratios, to identify countries as importer or exporter do match.
country
share
domestic
origin
share
domestic
destination
AT 97% 90%
BE 98% 84%
BG 82% 97%
CY 90% 100%
CZ 92% 100%
DE 99% 88%
DK 98% 97%
EE 91% 98%
ES 99% 99%
FI 98% 100%
FR 98% 99%
GR 96% 100%
HU 97% 100%
IE 91% 100%
IT 99% 98%
LT 90% 98%
LU 81% 57%
LV 87% 99%
MT 77% 100%
NL 99% 96%
PL 89% 100%
PT 98% 100%
RO 69% 100%
SE 99% 98%
SI 96% 100%
SK 92% 100%
UK 100% 98%

LDV CO2 legislation and the 2nd hand vehicle market 61
Given the relatively small sample-size, we cannot draw general conclusions from this data. For
example, even for Poland (the largest importer), we find only 140 import transactions, from various
countries. This is not enough to make any robust statement about trends in individual countries of
origin.
Also, due to the setup of the survey (which focussed on dealers), it is likely imports are
underestimated compared to the domestic trade in the data. Used cars bought via domestic dealers
may well be imported by the dealers so should be considered import. To the consumer however,
this is perceived as a domestic transaction and it will be reflected as such in the survey feedback. As
a consequence, the data is only useful to draw conclusions on the relevance of import and export
between countries but not the size of the domestic used car trade vs. import and export.
5.3.2 National sources
The TML-GfK dataset gives an indication of key flows of used cars within the EU, between
member states. It is clear, as was concluded in the 2011 study, there is a flow from Western EU
countries, particularly Germany, to Eastern EU countries. We cannot derive total trade volumes
from the dataset. To this end, we attempt to reconstruct the flows within the EU, using national
statistics.
We focus on key countries to understand the main flows. For some countries, data could be found,
for other, no data was available.
Table 25: size of the EU vehicle stock (TiF, 2015 – data for 2013) and own assessment of quality of data
We first elaborate on the national data for major exporting and importing countries.
country stock (TiF2013) share EU stock data found
DE 43851230 17.79% ++
IT 36962934 14.99% ++
FR 32243826 13.08% -
UK 30074857 12.20% excluded
ES 22024538 8.93% --
PL 19389446 7.86% ++
NL 7932290 3.22% +
BE 5504809 2.23% +/-
GR 5124208 2.08% --
CZ 4729185 1.92% ++
RO 4695660 1.90% ++
AT 4641308 1.88% --
SE 4495473 1.82% +
PT 4480000 1.82% --
FI 3127399 1.27% +
HU 3040732 1.23% +
BG 2910200 1.18% -
DK 2278121 0.92% +
IE 1933129 0.78% excluded
SK 1879759 0.76% --
LT 1808982 0.73% ++
SI 1063795 0.43% --
LV 634603 0.26% ++
EE 628500 0.25% ++
CY 474561 0.19% excluded
LU 363247 0.15% excluded
MT 256096 0.10% excluded

LDV CO2 legislation and the 2nd hand vehicle market 62
5.3.2.1 Main exporting countries
Germany
Germany keeps a detailed record of exports of used cars to other member states. Whenever a car is
de-registered in Germany and registered in another EU country, the country of destination reports
this to Germany. This enables the German “Kraftfahrt-Bundesamt” to compile detailed export
data.
We received data directly from the agency which is not published on their website. This data is
considered an estimate and should by no means be considered an official German statistic.
Figure 37: German used car exports, by country, 2007-2014 (source: KBA)
We can observe several interesting findings:
1. The largest export partner is Poland, accounting for almost half of all German used car
exports, though the share has declined from 48% in 2007 to 40% in 2014.
2. All Eastern European countries, labelled importing countries in this study, account for 75-
85% of German exports.
3. There is a strong decrease of exports in 2009. This is mainly due to the German scrappage
scheme to stimulate the car industry. A €5bn scrappage programme, with a subsidy of
2,500€ per scrapped vehicle, led to additional scrappage of 2 million old cars, reducing the
supply of used car significantly. We see a decrease of about 660,000 used car exports in
2009, 280,000 to Poland alone. These are old used cars, reports claiming an average age of
about 15y23 which are likely destined for export to Eastern EU. We can thus observe a
clear knock-on effect on the used car market and consequently also on the exports.
23 “Assessment of the Effectiveness of Scrapping Schemes for Vehicles: Economic, Environmental, and Safety
Impacts”; Global Insight for European Commission DG ENTR; 2010

LDV CO2 legislation and the 2nd hand vehicle market 63
Exports have only gradually been recovering and have not yet return to peak levels of
2008. It is not clear if this is due to a continuing lack of supply of German used cars in
Eastern European importing countries or due to a shift from used cars to new cars in
Eastern Europe associated with a (comparative) improvement of economic conditions.
Data for Poland further in this chapter will clarify further.
4. German exports to France have increased from nearly non-existent in 2007 to 8.2% of
total exports in 2014.
This export matrix is the best data we have found and given the importance of Germany, due to the
large size of its used car market, this dataset will be the starting point to reconstruct flows in the
EU (see further).
Netherlands
The Netherlands Central Office for Statistics (CBS) publishes official used car export statistics.
Data includes export as well as ELV (scrapped vehicles) and distinguishes between cars and LCVs.
Table 26 time series of used car exports and ELV in NL (2000-2014) – source: CBS24
Car exports increased from about 100,000 units to over 300,000 units annually at its peak in 2012,
decreasing slightly in 2013 & 2014. The ratio [export]/[ELV] increased from 0.3 in 2000 to 1 in
2007 and up to 1.4 in 2012 to stabilize around 1.2 in 2013-2014. Especially in the period 2000-2008,
there is a clear shift from ELV to export, i.e. instead of being scrapped, old vehicles are exported.
This is likely due to the gradual opening of the Eastern European markets in the early years of their
EU membership.
LCV exports are considerable smaller, on average about one fifth of the passenger car trade.
Though smaller, the ratio [export]/[ELV] is considerably higher for LCV’s than cars. This indicates
that LCVs seem more popular to export. Possible explanations are that LCV’s are (almost) always
company vehicles and when written off still have a valuable service life remaining. It is expected the
bulk of new LCV’s in the Netherlands are new purchases so most used LCV’s are exported, though
we did not find data to support this.
24 http://statline.cbs.nl/Statweb/publication/?DM=SLNL&PA=80360ned&D1=1%2c3&D2=1-
2&D3=0&D4=a&HDR=G3&STB=G1%2cG2%2cT&VW=D
Export ELV Export ELV
2000 96365 310323 21740 15181
2001 133542 303866 27342 15932
2002 123222 294637 30366 16255
2003 137266 292023 31088 15670
2004 197175 274573 40686 15909
2005 177430 231627 88562 18386
2006 179901 225760 69014 13740
2007 209446 200836 55321 10960
2008 205455 198272 53940 10915
2009 181928 246759 46421 14344
2010 193131 229629 53571 14783
2011 273938 235852 62870 13633
2012 324590 224102 63605 12593
2013 278770 219836 56739 12614
2014 247188 213045 46260 12823
CAR LCV

LDV CO2 legislation and the 2nd hand vehicle market 64
Belgium
No official statistics exist for Belgian used car exports. Direct contact with the Vehicle Registration
Service (DIV: “Dienst InVerkeerstelling”:
http://www.belgium.be/nl/mobiliteit/Voertuigen/inschrijving/div-kantoren) has resulted in ad
hoc analysis to gain some insight in Belgian exports.
As with Germany, Belgium aims to identify partner countries for deregistered vehicles from
Belgium, reregistered abroad. This is successful for some countries but less so for others. Officials
informally expect an underestimate of 20-50% for countries they receive data from. Also, there is a
considerable time-lag of 2 to 7 months (estimate) between deregistration in Belgium and
reregistration in other countries. Data is incomplete and not cleaned adding to the underestimation.
The table below summarizes exports for 2012-2014, for key export partners
Table 27: time series of used car exports in BE, by partner country (2012-2014) – source: DIV
Note the erratic trend pattern in the data. Most likely, in 2012 the system of keeping record of
exports by country was setup and was thus incomplete for some countries, while in 2014, the time-
lag will lead to further underestimation. It’s also possible that in 2013 a “catch-up” operation was
done, allocating some of the transactions in 2012 to 2013.
It’s clear this data is not reliable, so we will not use the specific figures in the EU flow estimate later
on. The data does provide some insight in key partner countries. France and Poland are the key
export countries. The total amount of exports is likely to be around 150,000 units annually.
2012 2013 2014
BG 1 80 123
CZ 3391 1035 /
DE 2091 116 116
DK / 71 47
EE 1 130 42
ES 587 2215 476
FR 909 69707 46338
HU 530 481 1249
LT 3401 / 2
LU 810 1500 1623
LV 649 / 1607
NL 3 1525 391
PL 10349 68443 33545
RO 1911 2018 4059
SI 355 250 61
SK 1784 3662 1134
TOTAL 26772 151233 90813

LDV CO2 legislation and the 2nd hand vehicle market 65
Italy
For Italy, we received data from ANFIA, “Associazione Nazionale Fra Industrie Automobilistiche”; the
National Association of the Automobile Industry25. The data includes both imports and exports by
partner country. Holding data both on import and export, by partner country, this is the best data
we could find for any EU country.
Figure below summarizes Italian imports and exports from and to other EU countries
Figure 38: Italian used car imports and exports, by country, 2013 (source: ANFIA)
Total EU imports amount to 21,128 units while total exports are 100,968. The net balance is 79,840
units exported, mainly to Germany, France and Bulgaria. The import from Germany according to
this data set (9,222 units) corresponds well to the German data on export to Italy (9,646 units).
Both import and export used car flows are rather low compared to the total fleet in Italy. The
Italian fleet is only 15% smaller than Germany's, yet used car exports are a factor 10 smaller than
Germany. It is not clear if the data capture all cross-border used car flows, for example the exports
to Poland and Romania seem low, compared to German exports to these countries.
The data on volumes also includes the value of the trade. This data allows us to derive average
values of the cars traded, per import/export partner country.
25 http://webmail.anfia.it/autoincifre/indexbis.htm

LDV CO2 legislation and the 2nd hand vehicle market 66
Table 28: Italian used car trade volumes and value, with derived average price per unit – 2013 (source:
ANFIA)
Prices implicitly reflect the quality of the used car traded. It’s clear that imported cars are of higher
value than exported cars. For the main Eastern EU export partners the average prices are low,
correlating with comparative socio-economic situation of the country.
The above data is official trade data and suffers the same problem as COMEXT discussed at the
beginning of the chapter. As such, the export volumes are expected to be a large underestimate of
the real used car flows. In particular, smaller trades are not reported making it most likely the flow
to Eastern EU countries is further underreported.
Further inquiry with Italy officials has led to a second source of information, from ACI
(Automobile Club d'Italia - http://www.aci.it/). We received a dataset with a similar approach to
the German data, i.e. an overview of registered used car per country, of cars deregistered in Italy:
import export import export import export
AT 365 3 552 € 4 € 37 € 11 261 € 10 395
BE 1 949 1 864 € 17 € 26 € 8 883 € 14 039
BG 139 12 418 € 1 € 36 € 8 886 € 2 902
CY 9 85 € 0 € 1 € 9 600 € 9 878
CZ 108 6 141 € 1 € 30 € 11 645 € 4 910
DE 9 222 21 619 € 144 € 256 € 15 650 € 11 821
DK 4 516 € 0 € 13 € 18 320 € 24 339
EE 1 635 € 0 € 7 € 28 000 € 10 570
ES 2 789 4 942 € 21 € 41 € 7 442 € 8 336
FI 8 618 € 0 € 10 € 58 784 € 16 604
FR 5 249 17 436 € 35 € 197 € 6 581 € 11 291
GR 70 315 € 0 € 2 € 1 950 € 4 826
HU 9 3 435 € 0 € 17 € 26 802 € 4 873
IE 16 1 € 0 € 0 € 1 221 € 80 000
LT 4 5 469 € 0 € 33 € 10 950 € 6 012
LU 27 1 544 € 0 € 19 € 7 568 € 11 986
LV 0 160 € 0 € 2 € 10 100
MT 0 6 € 0 € 0 € 59 403
NL 222 1 245 € 3 € 18 € 11 901 € 14 654
PL 228 6 265 € 3 € 22 € 12 359 € 3 472
PT 115 128 € 1 € 2 € 7 120 € 13 468
RO 15 1 469 € 0 € 16 € 15 890 € 11 120
SE 16 522 € 0 € 13 € 19 229 € 24 324
SI 407 5 700 € 5 € 32 € 11 859 € 5 552
SK 13 3 049 € 0 € 17 € 13 147 € 5 634
UK 122 368 € 4 € 5 € 28 763 € 12 295
HR 21 1 466 € 0 € 5 € 6 369 € 3 377
TOTAL 21 128 100 968 240 854 € 11 374 € 8 458
Unit price (€)2013
UNITS VALUE (M€)

LDV CO2 legislation and the 2nd hand vehicle market 67
Table 29: Italian used car exports, by country, 2014-2015 (source: ACI)
Exports are a factor 3 higher than reported by ANFIA, confirming the expectation of
underreporting. The ACI data also highlights the importance of the trade with Eastern EU
countries. For Italy, the key eastern EU export partners of used cars are BG, PL and RO, while LT,
HU, CZ and SI are of considerable importance.
This data will be used to estimate EU flows later in this chapter.
Other countries
No data could be found for Austria. For France, official statistics only hold information on the
domestic used car market, not on import and export. Direct contacts with statistical offices did not
lead to official data, though an estimate was given of about 500.000 exported vehicles over a 6 year
period to other EU countries, amounting to 84.000 cars per year.
2014 2015
AT 5022 5322
BE 6843 6462
BG 106684 116569
CY 85 13
CZ 16243 18729
DE 49172 41983
DK 321 376
EE 799 675
ES 2757 3604
FI 585 620
FR 31279 28934
GR 865 731
HU 15548 16094
IE 46 34
LT 17678 14078
LU 1610 550
LV 500 504
MT 170 157
NL 2260 2463
PL 31109 28821
PT 341 243
RO 23667 15532
SE 1244 858
SI 16180 21863
SK 7798 7962
UK 1442 1282
HR 8148 9242
TOTAL 348396 343701

LDV CO2 legislation and the 2nd hand vehicle market 68
5.3.2.2 Main importing countries
Poland
The German data flagged Poland as the main export destination. Import data from Poland would
provide an independent second source to support this observation. As such, Polish data is
considered crucial to understanding the flows and assessing the reliability of data found.
Reliable data was found on Poland imports from the Polish automotive association and Ministry of
finance. The table below compares total imports to new registrations, to assess the importance of
used car imports.
Table 30 Polish imports and new registrations time series (2004-2014) – source http://www.pzpm.org.pl
and ACEA
The import of used cars exceeds domestic registration of new passengers by a factor of 2 to 3.
There is a slight decrease of the ratio of imported used car to new registrations over time, indicating
Polish purchases gradually shift from used to new cars. This shift, however, is still modest and a
reversed trend seems visible in the last few years.
Table 31: Polish imports compared to German exports to Poland
new reg import used
%
import/
new reg
2004 318111 828142 260%
2005 235522 870777 370%
2006 238993 816789 342%
2007 293305 994564 339%
2008 320040 1103970 345%
2009 320206 693324 217%
2010 333490 718286 215%
2011 297937 655314 220%
2012 270895 657392 243%
2013 288998 711865 246%
2014 327709 748863 229%
0
200000
400000
600000
800000
1000000
1200000
1400000
1600000
2004
2005
2006
2007
2008
2009
2010
2011
2012
2013
2014
new reg import used
Total PL
import DE export
share
DE
2007 994564 716409 72%
2008 1103970 702030 64%
2009 693324 425686 61%
2010 718286 427736 60%
2011 655314 433349 66%
2012 657392 394311 60%
2013 711865 487585 68%
2014 748863 484429 65%
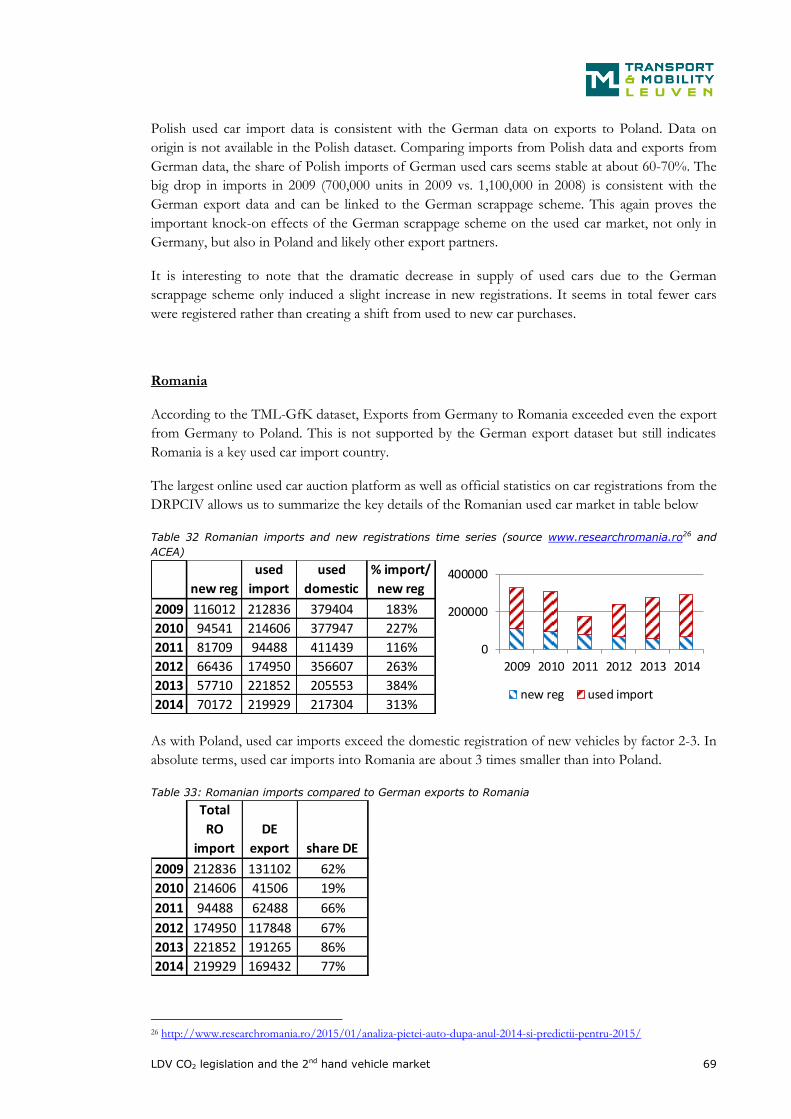
LDV CO2 legislation and the 2nd hand vehicle market 69
Polish used car import data is consistent with the German data on exports to Poland. Data on
origin is not available in the Polish dataset. Comparing imports from Polish data and exports from
German data, the share of Polish imports of German used cars seems stable at about 60-70%. The
big drop in imports in 2009 (700,000 units in 2009 vs. 1,100,000 in 2008) is consistent with the
German export data and can be linked to the German scrappage scheme. This again proves the
important knock-on effects of the German scrappage scheme on the used car market, not only in
Germany, but also in Poland and likely other export partners.
It is interesting to note that the dramatic decrease in supply of used cars due to the German
scrappage scheme only induced a slight increase in new registrations. It seems in total fewer cars
were registered rather than creating a shift from used to new car purchases.
Romania
According to the TML-GfK dataset, Exports from Germany to Romania exceeded even the export
from Germany to Poland. This is not supported by the German export dataset but still indicates
Romania is a key used car import country.
The largest online used car auction platform as well as official statistics on car registrations from the
DRPCIV allows us to summarize the key details of the Romanian used car market in table below
Table 32 Romanian imports and new registrations time series (source www.researchromania.ro26 and
ACEA)
As with Poland, used car imports exceed the domestic registration of new vehicles by factor 2-3. In
absolute terms, used car imports into Romania are about 3 times smaller than into Poland.
Table 33: Romanian imports compared to German exports to Romania
26 http://www.researchromania.ro/2015/01/analiza-pietei-auto-dupa-anul-2014-si-predictii-pentru-2015/
new reg
used
import
used
domestic
% import/
new reg
2009 116012 212836 379404 183%
2010 94541 214606 377947 227%
2011 81709 94488 411439 116%
2012 66436 174950 356607 263%
2013 57710 221852 205553 384%
2014 70172 219929 217304 313%
0
200000
400000
2009 2010 2011 2012 2013 2014
new reg used import
Total
RO
import
DE
export share DE
2009 212836 131102 62%
2010 214606 41506 19%
2011 94488 62488 66%
2012 174950 117848 67%
2013 221852 191265 86%
2014 219929 169432 77%

LDV CO2 legislation and the 2nd hand vehicle market 70
Comparing with German exports, the data shows that also for Romania, Germany is the most
important import-partner. Only for 2010 is there a large drop in the market share of Germany as
supplier of foreign used cars.
This is consistent with an estimation of the source of foreign used cars by country. Based on the
leading Romanian online used car auction platform http://autovit.ro/, by filtering advertisements
per country, we were able to estimate the importance of individual import countries
Table 34: importance of used car import countries in Romania, based on used car advertisement by
country of origin. (source: http://autovit.ro/)
The online trading platform indicates Germany as the most important source of foreign used cars
in Romania, with over 70% of all (known) foreign imports. France, Belgium and the Netherlands all
supply a small share of about 6-7%
Czech Republic
In terms of fleet size, the Czech Republic resembles the Romanian fleet. According to Eurostat
data, Nominal GDP per capita in 2015 in the Czech Republic is 14.7k € while in Romania it is 8k €.
The Czech Republic is one of the most prosperous eastern European countries and as has been
indicated in the previous task, this would suggest a larger emphasis on the new car market and less
dependence on the import of used passenger cars.
Data on used car imports was acquired from public statistics. The table below summarizes used car
imports as well as domestic registrations of new passenger cars.
Table 35: Czech imports and new registrations time series (source ACEA & Centrální registr vozidel
Ministerstva dopravy ČR)
Country ads % import
DE 6568 71%
RO 4370
FR 631 7%
BE 556 6%
NL 553 6%
IT 273 3%
AT 208 2%
other 450 5%
unknown 2715
new reg import used
% import/
new reg
2006 156686 183143 117%
2007 174456 212869 122%
2008 182554 230974 127%
2009 167708 144602 86%
2010 169580 127034 75%
2011 173595 131707 76%
2012 173988 124343 71%
2013 164746 126115 77%
2014 192314 120408 63%
0
100000
200000
300000
400000
500000
new reg import used

LDV CO2 legislation and the 2nd hand vehicle market 71
Unlike Poland and Romania, in the Czech Republic there is a steady decline of imported used cars.
The ratio used vs. new registration is lower than in Poland and Romania.
Table 36: Czech imports compared to German exports to Czech Republic
Germany is the most important source of foreign used cars
Hungary
Limited data on used car registrations was found for Hungary. Data was acquired from
DATAHOUSE (https://carinfo.hu/) and holds time series data for first used car registrations in
HU. As these are first registrations, all are considered as imports. Data by country of origin was not
available.
Table 37: Hungarian imports and new registrations time series (source ACEA & DATAHOUSE)
Hungary seems to deviate from most Eastern EU countries as the importance of used car imports
only emerged later compared to for example in Poland and Romania.
Total
CZ
import DE export share DE
2007 212869 144993 68%
2008 230974 171657 74%
2009 144602 82993 57%
2010 127034 88118 69%
2011 131707 66953 51%
2012 124343 60890 49%
2013 126115 88724 70%
2014 120408 66665 55%
year new reg import used
% import/
new reg
2001 43780
2002 67364
2003 67550
2004 207055 38624 19%
2005 198982 37512 19%
2006 187676 20960 11%
2007 171661 24452 14%
2008 153278 23573 15%
2009 60189 15453 26%
2010 43476 17698 41%
2011 45094 31312 69%
2012 53059 53531 101%
2013 56139 70700 126%
2014 67476 96733 143%
2015 77171 122620 159%
0
50000
100000
150000
200000
250000
300000
2004
2005
2006
2007
2008
2009
2010
2011
2012
2013
2014
2015
new reg import used

LDV CO2 legislation and the 2nd hand vehicle market 72
Domestic registrations of new cars exceeded used car imports until 2011. New registrations
gradually lost ground to used car imports and after a major decline in 2008 & 2009, the market
rebound mainly favoured used car imports while domestic new registrations only slowly recovered.
Baltic countries (LV, LT, EE)
Because of their small market share of the EU market, we combine the Baltic countries in a single
section. Though limited in market size, the used car market in the 3 Baltic countries reveals
distinctly different characteristics between each other.
Table 38: imports and new registrations in the Baltic countries in time series (source ACEA & various
national agencies27)
For all 3 countries, used car imports exceed domestic registrations of new vehicles. In Lithuania,
new registrations are negligible compared to used car imports. Lithuania is a special case and can be
considered a transit country (see earlier).
27 http://www.mnt.ee/?404 http://www.mnt.ee/?404 - http://autotyrimai.lt/ - http://www.bta-kindlustus.ee/en/about/news/the-average-age-of-
vehicles-in-latvia-and-estonia-keeps - http://www.csdd.lv/eng/about_csdd/
new reg
import
used
% import/
new reg new reg
import
used
% import/
new reg new reg
import
used
% import/
new reg
2006 26255 71144 271% 14234 145241 1020% 25363 11464 45%
2007 32805 74198 226% 21606 197863 916% 30912 43980 142%
2008 19778 34981 177% 22217 176400 794% 24579 24082 98%
2009 5534 11754 212% 7515 121364 1615% 9946 11574 116%
2010 6588 20068 305% 7970 152422 1912% 10295 20154 196%
2011 11328 32140 284% 13234 204128 1542% 17070 28632 168%
2012 11034 39101 354% 12165 199722 1642% 19424 31691 163%
2013 11070 44738 404% 12163 200129 1645% 19694 29790 151%
2014 12452 50112 402% 14503 163553 1128% 20969 26118 125%
LV LT EE
0
50000
100000
150000
200000
250000
2006
2007
2008
2009
2010
2011
2012
2013
2014
new reg import used
2006
2007
2008
2009
2010
2011
2012
2013
2014
new reg import used
2006
2007
2008
2009
2010
2011
2012
2013
2014
new reg import used

LDV CO2 legislation and the 2nd hand vehicle market 73
Latvia and Estonia show a similar pattern to Hungary with declining new registrations in 2008-2009
and a gradual recovery mostly favouring used car imports with limited growth of new registrations.
In contrast with Hungary however, used car imports were already large prior to 2008-2009.
5.3.2.3 Other countries
We briefly present data found for other countries. These are smaller countries that can neither be
labelled as key exporting or importing in the EU used car market.
Denmark
Direct communication from the Danish statistical office (SKAT) indicated about 32.000 vehicles
are exported each year. This information was given in an informal way and cannot by verified. No
further information on the source of this claim is available. SKAT could not provide information
about imports. On average, there are about 190.000 new registrations per year in DK
Finland
The Finish automobile association publishes information about imports of used passenger cars and
LCV’s. This data is summarized in the table below
Table 39: Finish imports and new registrations time series (source ACEA & http://www.aut.fi28)
Imports first saw a major increase in 2003, most likely related to the introduction of the Euro,
creating helping to open the domestic market to the foreign supply of used cars. Imports have
however consistently been low at about 20% of domestic new registrations. In recent years, imports
of used car have declined further from 28% in 2010 to 18% in 2014.
Imports of used LCV’s are negligible.
Export data was not available. Exports are expected to be low due to a high vehicle registration tax
which cannot be recovered when exported.
28 http://www.aut.fi/en/statistics/other_statistics/used_passenger_cars_imported_one_by_one
car van (car new reg)
2000 2229
2001 1925
2002 4709
2003 31944 873 147222
2004 31381 2994 142439
2005 29728 1498 147949
2006 27625 1465 145689
2007 21999 1540 125285
2008 22580 2041 139611
2009 22595 1977 88344
2010 30141 1744 107346
2011 27745 1657 121171
2012 23478 1455 111147
2013 21674 1289 103314
2014 19045 1444 106259

LDV CO2 legislation and the 2nd hand vehicle market 74
Sweden
Public statistics and data from the national Automobile Association allow us to compile a
comprehensive picture of used car import and export markets in Sweden.
Table 40: Swedish imports, exports and new registrations time series (source ACEA -
https://www.transportstyrelsen.se - http://trafa.se/en/road-traffic/vehicle-statistics/)
As with Finland, the Swedish market appears to be rather isolated, both in terms of imports and
exports.
Other countries either lack data or have not been researched due to their limited size (MT, LU,
CY). We also excluded IE and the UK from the analysis of flows of used cars as the (separate)
market for left-hand drive passenger cars is limited to UK, IE, CY and MT.
import export (car new reg) import/new reg export/new reg
2005 36851 14517 311779 12% 5%
2006 29828 19049 313812 10% 6%
2007 29923 21936 338538 9% 6%
2008 20896 30374 276344 8% 11%
2009 13915 39571 228528 6% 17%
2010 17500 29068 308734 6% 9%
2011 20289 24575 326649 6% 8%
2012 20028 27113 301335 7% 9%
2013 19914 23931 292178 7% 8%
2014 16972 26440 324037 5% 8%

LDV CO2 legislation and the 2nd hand vehicle market 75
5.4 Estimation of flows
The data collected, allows us to estimate the flows of used cars in the EU. We apply a cascade of
data manipulations to come to an estimation of the used car flows for the year 2013. We choose
2013 as it is the most recent year we have found data for almost all countries.
The sequence of data manipulations is as follows:
1. The starting point is the German exports. Together with data for Italy, the German data is
the most reliable and detailed data we found. Moreover, Germany is the largest car market
in Europe and is the key exporting country of used cars to other EU countries.
2. For the main importing countries (BG, CZ, EE, HU, LT, LV, PL, RO, SK), we use the
share of export by country, using the imports from Germany as a validation point. For
those importing countries lacking detail about the country of origin, we use the total
imports as a validation of the approach.
3. Apart from the national data, also the discrepancy between new registration as reported by
ACEA and new registration as reported by Eurostat can provide a source for validation.
Though not explicitly mentioned in the publications, the new registrations reported by
ACEA include only new vehicles, while new registration in Eurostat include newly
registered vehicles for the first time in a country. This would imply that higher registrations
according to Eurostat can only be due to net import of used cars. Indeed, we find the same
key importing countries revealing large discrepancy between the two sources.
These steps generate the following preliminary estimate of flows:
Table 41: preliminary estimate of used car flows
For the major flows, it seems this approach generates plausible results. Poland, by far the biggest
importer of used cars, sums up to 728.038 units according to the estimation. This matches to
711.865 and 698.811 units according to national data and the ACEA-Eurostat discrepancy,
respectively. The close match (2% deviation) suggests the approach is reliable. Also for RO (13%
to
from AT BE BG CY CZ DE DK EE ES FI FR GR HU IE IT LT LU LV MT NL PL PT RO SE SI SK UK
AT 13934 2817 0 48324 0 0 13358 9108 1811
BE 2533 5633 523 3717 12813 3650 93509 7452 906
BG 0 0 0 0 0 0 0 1656 0
CY 0 0 0 0 0 0 0 0 0
CZ 0 0 0 0 0 0 0 0 0
DE 3281 24771 43701 0 88724 4985 14651 3180 14910 91878 164 33455 34 9646 79438 9123 26769 83 58334 487585 141 191265 9029 4528 15556 714
DK 1267 1408 0 3717 0 0 6679 1656 1423
EE 0 0 0 0 0 608 0 0 0
ES 0 0 0 0 0 608 6679 3312 0
FI 0 0 2616 0 0 0 0 0 0
FR 3167 7042 0 0 2563 1217 26717 10764 129
GR 0 0 0 0 0 0 0 828 0
HU 0 0 0 0 0 0 0 0 0
IE 0 0 0 0 0 0 0 0 0
IT 38634 12675 0 3717 2563 0 6679 14076 517
LT 0 0 2616 0 0 4867 0 0 0
LU 0 0 0 0 5125 0 6679 0 0
LV 0 0 1047 0 5125 0 0 0 0
MT 0 0 0 0 0 0 0 0 0
NL 1900 4225 0 0 5125 1217 33396 6624 1778
PL 0 1408 0 0 5125 608 0 0 889
PT 0 0 0 0 0 0 0 0 0
RO 0 0 0 0 0 0 0 0 0
SE 1900 0 1570 6764 7434 0 0 13358 0 0
SI 0 0 0 0 0 0 0 0 0
SK 633 0 0 0 0 0 0 0 0
UK 6333 0 0 3717 15375 608 33396 3312 444
total import
estimate114003 123932 23023 21674 104082 133251 40154 728038 250052 23454
total import
data126115 29790 21674 70700 200129 44738 711865 221852
ratio 98% 77% 100% 147% 67% 90% 102% 113%
ACEA-EUROSTAT
estimate(175628) (53612) ((118883)) 45172 698811 (169882) (61550)
(2012 data)
((2011 data))

LDV CO2 legislation and the 2nd hand vehicle market 76
deviation), CZ (2% deviation), the estimation matches the national data. Only for HU is the
estimate 40% higher than the national reported used car import figures. .
LT is a special case and reports higher imports compared to the estimate; however the estimate
matches better with the ACEA-Eurostat source.
For Romania, an additional validation check is possible with the data on advertisement of used cars
by country of origin (see
Table 34)
Table 42: comparing market share of countries of imported used cars in Romania. Data from online
auctions (right) and according to the estimation approach (left)
Market shares of countries are of the same order of magnitude. In further steps, we stick to the
estimation approach, also for Romania, though the online auction data could be considered
superior, for consistency purposes. Italian data provides another source for validation. The table
below compares the estimate approach to the reported data by ANFIA & ACI.
Table 43: comparing used car imports from Italy estimates (2013) with data from Italian exports
(ANFIA-2013 and ACI-2014).
There are large differences. The estimation approach exceeds the reported Italian data from
ANFIA, a consequence of the underreporting discussed earlier. On the other hand, the ACI-data,
considered superior, are higher than the original estimate. We attribute this to the limited sample
size of the TML-GfK dataset for trans-boundary trade as well as the bias in that sample to
transactions via traders only. Private trade is expected to be of larger importance particularly for
Eastern EU countries. Therefore we rely on the ACI data in the estimation of flows.
We complement the matrix further with the following elements:
1. Italian import & export (highlighted in blue)
2. Estimates for Scandinavia trades (Swedish import & export figures) – highlighted in orange
3. Missing key data to complete the matrix are highlighted in yellow
This gives the following final picture to complete the matrix of flows of used cars:
share (TML-GfK) share (adv)
DE 76.49% 71.09%
IT 5.63% 2.95%
FR 4.30% 6.83%
AT 3.64% 2.25%
BE 2.98% 6.02%
NL 2.65% 5.99%
other 4.30% 4.87%
estimate IT data ANFIA ratio IT data ACI ratio
BG 38634 12418 32% 106684 276%
CZ 12675 6141 48% 16243 128%
HU 3717 3435 92% 15548 418%
LT 2563 5469 213% 17678 690%
PL 6679 6265 94% 31109 466%
RO 14076 1469 10% 23667 168%
SK 517 3049 589% 7798 1507%

LDV CO2 legislation and the 2nd hand vehicle market 77
Table 44: final estimate of used car flows in EU (2013)
to
fro
mA
TB
EB
GC
ZD
ED
KEE
ESFI
FRG
RH
UIT
LTLU
LVN
LPL
PTR
OSE
SISK
tota
l
expo
rt
esti
mat
e
tota
l
expo
rt
data
rati
o
AT
1393
428
170
4711
036
50
013
358
9108
1811
8850
3
BE
2533
5633
523
3717
1949
1281
336
5093
509
7452
906
1326
8615
0000
88%
BG
00
00
139
00
016
560
1795
CZ
00
00
108
00
00
010
8
DE
3281
2477
143
701
8872
449
8514
651
3180
1491
091
878
164
3345
596
4679
438
9123
2676
958
334
4875
8514
119
1265
9029
4528
1555
612
1511
412
1511
410
0%
DK
1267
1408
037
174
00
6679
1656
8000
1423
2415
532
000
75%
EE0
00
01
060
80
00
609
ES0
00
027
890
608
6679
3312
013
389
xxx
FI0
026
160
80
00
00
2624
FR31
6770
420
052
4925
6312
1726
717
1076
412
956
847
8333
368
%
GR
00
00
700
00
828
089
8
HU
00
00
90
00
00
9
IT50
2268
4310
6684
1624
349
172
321
799
2757
585
3127
986
515
548
1767
816
1050
022
6031
109
341
2366
712
4416
180
7798
3385
0533
8505
100%
LT0
026
160
40
4867
00
074
87
LU0
00
027
5125
066
790
011
831
LV0
010
470
051
250
00
061
72
NL
1900
4225
00
222
5125
1217
3339
666
2417
7854
487
2787
7020
%
PL0
1408
00
228
5125
608
00
889
8259
PT0
00
011
50
00
00
115
RO
00
00
150
00
00
15
SE19
000
1570
5000
7434
160
013
358
00
2927
926
440
111%
SI0
00
040
70
00
00
407
SK63
30
00
130
00
00
646
tota
l im
port
esti
mat
e18
2052
1275
0023
822
2049
511
4699
2153
114
8366
4065
475
2468
2596
4318
273
3073
4
tota
l im
port
data
xxx
1261
1529
790
2167
470
700
2112
820
0129
4473
871
1865
2218
5216
972
xxx
rati
o10
1%80
%95
%16
2%74
%91
%10
6%11
7%

LDV CO2 legislation and the 2nd hand vehicle market 78
This table captures keys flows of used cars, mainly based on German export data as well as import
by country of origin, as estimated from the international transactions in the TML-GfK dataset.
Validation to total import and export figures seem to confirm the initial estimate. Large
uncertainties remain for Spanish, French and Dutch exports. For Spanish exports, no data was
found; for French exports, the 84.000 units annually are likely to be a conservative estimate. On
Dutch exports, the estimation generates only 20% of the reported exports. Dutch statistics are
expected to be reliable. Possibly the TML-GfK dataset, with limited figures for cross-border trade
are not sufficiently representative. Another possibility is that Dutch exports also include export
outside the EU.
On the import side, no validation data was found for Bulgaria and Slovakia. These countries are
likely to behave in a similar way as Poland, Romania. However there is no data to confirm this
hypothesis.
5.5 Conclusions
We draw the following key conclusions from the above analysis
1. There are large flows of used cars from Western EU countries to Eastern EU countries.
The import of used cars exceeds the number of domestic new registrations in almost all
Eastern EU countries.
2. The largest exporting countries are Germany, Italy, Netherlands, Belgium and possibly also
France though for the latter we did not find data to verify this. Germany is the largest
exporter of used cars, likely responsible for 2/3 of all used car exports. The largest
importing countries are Romania and Poland.
3. There are no major trend shifts compared to the 2011 study of flows of second hand cars
within the EU. The German scrappage scheme did result in significant knock-on effects on
the used car market whose consequences clearly impacted used car imports in Eastern
Europe for subsequent years.
4. The used car market dynamics are highly influenced by national policy, facilitating or
restricting used car trade (import as well as export). Together with the observation of the
impact of the German scrappage scheme, policy levers in the used car market are
particularly strong. European and/or national authorities can influence the market with
targeted regulation.
5. There is no harmonized data available at European level. As a consequence there remain
many gaps in the data due to lack of consistent reporting procedure. Informal data sources
such as unofficial statistics and used car websites can help to further complete the picture
of the used car trade in the EU.

LDV CO2 legislation and the 2nd hand vehicle market 79
6 Distribution of costs and benefits of CO2
legislation over social strata and member
states
Previous studies have extensively reviewed the impact of costs and benefits of CO2 legislation, in
the case of newly sold vehicles but have not considered the impact of the market for second hand
vehicles on the distribution of these costs and benefits among socio-economic groups in great
detail. The evaluation of the CO2 regulations (Ricardo, 2015) briefly discusses the topic. In short, it
is expected that lower income groups benefit more from the regulation as the fuel savings are more
important compared to the purchase cost of relatively inexpensive new vehicles or used vehicles,
primarily bought by low income groups. However, the report does not go in detail to allocate costs
and benefits of the regulation quantitatively among socio-economic groups. If the economic
benefits or costs of choosing a (second hand) fuel efficient car are priced and thus passed on to
consequent owners, this has an impact on the distribution of the costs and benefits over the
different owners during the lifetime of a vehicle.
In this chapter, we use findings from the previous 3 chapters to increase understanding of which
member states and socio-economic groups are taking the benefits of fuel efficiency and which
member states and socio-economic groups are bearing the burden.
6.1 Approach
The main focus is the distribution of costs and benefit at member state level and at level of socio-
economic groups by incorporating the second hand market dynamics in the assessment. We use the
CO2 regulation as a test case but in fact the approach applies to any measure affecting prices of
newly sold vehicles. (Ricardo, 2015) also gives us recent figures on the different cost components
associated with the regulation (increased purchase cost, decreased fuel cost).
The key element is that while costs and benefits are known for the total lifetime of the vehicle, it is
unclear to what extent the second hand market influences the allocation of these costs and benefits
over the different owners during the lifetime of the vehicle.
These distributional effects by owner, coupled with the dynamics of the second hand market at
level of MS and social strata, allow us to estimate the distributional effects at level of EU member
state and social strata.
In this chapter, we elaborate on selected cases quantitatively, assessing the costs and benefits first at
the vehicle ownership level, secondly how this affects socio-economic groups and finally, what the
distribution is between member states.
We add a qualitative discussion, going into possible second order effects ignored in the quantitative
analysis.

LDV CO2 legislation and the 2nd hand vehicle market 80
6.2 Quantitative
6.2.1 At level of vehicle ownership
We look into the case of the CO2 regulation. Cost and benefits of CO2-regulation on new cars, at
vehicle ownership from the perspective of the owner level mainly account to the following 2
elements:
1. Increased purchase cost due to new technology needed to comply with the regulation
2. Decreased fuel cost due to higher fuel efficiency associated with low CO2-emissions.
These 2 parameters determine the costs and benefits and in the quantitative analysis, we will use a
high and low estimate for both, to get a view of the gross order of the impacts.
Cost and benefits of CO2 regulations have extensively been investigated, most recently by Ricardo-
AEAT (2015) in an evaluation study for the EC DG CLIMA. The ex-post evaluation concluded a
benefit over the lifetime of the vehicle at 46€/t CO2, marking a large difference compared to the
ex-ante impact assessment which estimated the cost at about 40€/t CO2 in the central scenario,
with variation as wide as a benefit of 3€/t to a cost of 90€/t CO2. The reason for the large
difference is twofold. First, the fuel cost trends ex-post were higher than even the pessimistic fuel
cost scenario in the ex-ante impact assessment study. Secondly, the cost premium for CO2
abatement technologies was much lower ex-post compared to the ex-ante estimations: 10€/g ex-
post vs. 30-68€/g ex-ante.
In line with these findings, for the first parameter, the increased purchase cost associated with
higher fuel economy, we use a low estimate of 10€/gCO2 and a high estimate of 50€/gCO2.
For the fuel prices, we use a 1€/L for low and 1.5€/L as high estimate, in line with the ex-ante fuel
price scenario’s, which also reflect real world prices in the past years.
We assume a maximum of 4 different owners during the lifetime of a passenger car with an average
retention of 5-6 years. We assume a shorter ownership period for younger passenger cars as can
implicitly be derived from the findings in the second chapter. Leasing cars are almost exclusively
new cars and tend to have a contract of maximum 4 years (Ricardo, 2016).
We assume:
a first life of 4 years: 0-4y,
a second of 5 years: life 4-9y,
a third life of 6 years: 9-15y,
(a possible fourth life of 7 years: >15y)
Taking into account scrappage rates, as reported in Ricardo-AEAT, 2015 (table 8.11), we assume
94% of the cars have a second life, 87% have a third life and for the share of vehicles that live long
enough we assume to have a fourth life, as a 27% chance of all new vehicles.
Under these assumptions on timing of ownership transfer, a fourth life is not common given the
scrappage rate. Also, for very old used cars, the extra-EU export will become more important. We
therefore consider only the first 3 owners for the analysis.

LDV CO2 legislation and the 2nd hand vehicle market 81
Because we will compare how costs and benefits of fuel efficient vehicles are distributed among the
owners, we have to consider 2 types of vehicles and have to make an assumption on the fuel
consumption of a fuel efficient and non-fuel efficient vehicle. To this end, we will consider the
emission level of the current park average per fuel type a fuel efficient vehicle and the emission
level of the counterfactual scenario from the CO2 policy evaluation report (Ricardo-AEAT, 2015)
as the non-fuel efficient vehicle. The regression analysis in chapter 3 included vehicles with CO2
emissions in this range, so the regression model can be applied for these vehicles. The test cycle
(NEDC) emission levels are corrected for real world (RW) levels. We use the same uplift from
(Ricardo-AEAT, 2015). Summarized, we are comparing vehicles with the following properties in
terms of fuel efficiency:
Table 45: assumptions on CO2-emissions of fuel efficient and non-fuel efficient passenger cars
Further assumptions include:
1. Discount rate for future fuel cost, set at 8%
2. Premium of resale value on the used car market, as a function of the CO2-emissions.
Chapter 3 concluded a premium of 5€/g for vehicles younger than 5y, 30€/g CO2 for
vehicles of 5-10y and 42€/g CO2 for vehicles older than 10. As the boundaries do not
match exactly the assumed age of transactions (4, 9 and 15), we assume values of 15, 38
and 42€/g CO2 respectively for the specific transactions, corresponding to a linear relation
with g CO2. Note that 1g/km translates into a fuel saving of about 4 litres per year if you
drive 10,000km annually.
3. For the mileage per age, we rely on findings on our own dataset discussed in chapter 3.
We start from the perspective of the owner: to compare cost and benefits of choosing a fuel
efficient, new or used car. We compare the net (private) costs and benefits of each option at a given
time the buyer is considering to buy any of the alternatives available. The buyer will consider:
The actual purchase cost, with a premium for the fuel efficient car,
The expected fuel costs, given the expected mileage per year, discounted to the present,
Expected survival rates, related to the age of the vehicle. Note that the attrition rate will be
higher for later owners,
Expected resale value (if applicable), with a premium for the fuel efficient car, discounted
to the present.
In table below, we summarize the calculation approach, for one example case, petrol - 1.5€/l –
50€/gCO2:
uplift
petrol diesel petrol diesel
fuel efficient 126.7 126.9 31% 166 166
non-fuel efficient 159 153.7 15% 182.9 177
delta 16.87 10.5
NEDC RW

LDV CO2 legislation and the 2nd hand vehicle market 82
Table 46: summary of the calculation approach for the distribution of costs and benefits for the case
[petrol - 1.5€/l – 50€/gCO2]
Table above summarizes by age of the vehicle the potential costs and benefits of a fuel efficient
vehicle vs. a non-fuel efficient vehicle.
There are 3 components that influence cost and benefit to the owner:
1. First, the premium in purchase cost for the fuel efficient vehicle. In case of a new car, this
is 50€/gCO2 for this specific case. In case of used cars, this is the price premium value as
discussed in the 3rd chapter. This value depends on the age of the vehicle. These values are
presented in the first column.
2. Secondly, the potential fuel savings for each year. These are calculated as [average mileage
per year] x [delta fuel consumption] x [fuel cost], taking into account the attrition rate with
increasing age.
3. Thirdly, the premium on the resale value. This value is the inverted value of the purchase
premium.
We first calculate each cost component for every year. In a second step, we account for the
scrappage. This is done by multiplying the sum of cost and benefits per year by the survival rate
related to the age of the vehicle (2nd column). Note that most of the scrappage occurs at the oldest
used car. 87% of the 4-9 year old used cars will be resold; for the older used cars ranging 9-15 year
old, the probability of resale is only 31%.
Finally, all figures are discounted at a rate of 8% per annum. The total cost (+) or savings (-) are
highlighted green if favourable for the fuel efficient car and orange if the fuel efficient car comes at
a cost for the specific owner.
We observe that in this example, there is a benefit when buying a fuel economic 2nd hand car 4-9
years old; buying a new car or an older used car with more previous owners, the fuel efficient car is
an uneconomical choice.
years in
owernship retention
fuel
savings
purchase
premium
resale
premium scrappage discounted TOTAL
0 100% € 0 € 844 € 844 € 844
1 96% -€ 209 -€ 200 -€ 184
2 96% -€ 159 -€ 153 -€ 129
3 95% -€ 154 -€ 147 -€ 114
4 94% -€ 157 -€ 253 -€ 386 -€ 276
0 100% € 253 € 253 € 253
1 98% -€ 151 -€ 147 -€ 136
2 98% -€ 142 -€ 139 -€ 118
3 96% -€ 140 -€ 134 -€ 104
4 93% -€ 134 -€ 124 -€ 89
5 88% -€ 128 -€ 641 -€ 679 -€ 448
0 100% € 641 € 641 € 641
1 95% -€ 127 -€ 121 -€ 111
2 90% -€ 122 -€ 110 -€ 93
3 80% -€ 121 -€ 97 -€ 76
4 68% -€ 118 -€ 80 -€ 57
5 55% -€ 114 -€ 63 -€ 41
6 31% -€ 114 -€ 709 -€ 255 -€ 155
New (0-4y)
used (4-9y)
used (9-15y)
€ 140
-€ 641
€ 108

LDV CO2 legislation and the 2nd hand vehicle market 83
Considering the purchase cost of a new car is several 10k€, consumers buying a new car are slightly
worse off when choosing the fuel efficient options with an extra cost of 140€ for the ownership
period compared to the non-fuel efficient option. Keeping in mind the spread between the fuel
efficient and non-fuel efficient vehicle is quite large (16g), this means the relative price differential is
marginal. However, consumers may overestimate the fuel savings or don’t recognize they will not
recuperate the value of fuel efficiency in price setting to consequent owners in the used car market.
Consumers buying a relatively young used car (4-9y) are better off with the fuel efficient option. On
top of the fuel savings, the owners will be able to pass on the benefit of fuel efficiency more
profoundly to the consequent owner in the resale value. Keeping in mind the considerations made
in chapter 3 on the interpretation of the increasing premium value with increasing age, caution is
needed when drawing conclusions.
Particularly the large cost for the oldest used cars is surprising. The explanation is straight-forward:
1. The 9-15 year old used cars have a high purchase premium value for fuel efficiency, at a
rate of 38€/g
2. The older used cars are driven less, thus limiting the benefit of the fuel savings
3. The oldest cars suffer the highest attrition rates, with scrappage rates at least twice as high
as younger used cars after equal time in ownership, again reducing benefits from fuel
savings over the ownership period.
4. The probability to recuperate some of the premium value of the fuel efficient car, as is
done with younger cars, is much lower (31%) as most cars are scrapped.
Under these assumptions (fuel efficiency premium, scrappage rates and usages rates) it would be
illogical to purchase an old fuel efficient car. Especially the high purchase premium for older cars is
quite surprising; one would expect this to be lower with increasing age, as with increasing age it is
less likely the owner can use the car long enough to justify the higher initial purchase price offset by
fuel savings. However, the data analysis and the regression model established with the date provide
robust results. (See also chapter 3)
For comparison purposes, we add an example for diesel cars: 1.5€/l – 50€/gCO2:
Table 47: summary of the calculation approach for the distribution of costs and benefits for the case
[diesel - 1.5€/l – 50€/gCO2]
years in
owernship retention
fuel
savings
purchase
premium
resale
premium scrappage discounted TOTAL
0 100% € 0 € 526 € 526 € 526
1 96% -€ 140 -€ 135 -€ 124
2 96% -€ 149 -€ 143 -€ 121
3 95% -€ 159 -€ 151 -€ 118
4 94% -€ 142 -€ 158 -€ 281 -€ 202
0 100% € 158 € 158 € 158
1 98% -€ 127 -€ 124 -€ 114
2 98% -€ 116 -€ 114 -€ 96
3 96% -€ 109 -€ 105 -€ 81
4 93% -€ 102 -€ 95 -€ 68
5 88% -€ 97 -€ 400 -€ 439 -€ 289
0 100% € 400 € 400 € 400
1 95% -€ 92 -€ 88 -€ 81
2 90% -€ 87 -€ 78 -€ 66
3 80% -€ 85 -€ 68 -€ 53
4 68% -€ 79 -€ 53 -€ 38
5 55% -€ 78 -€ 43 -€ 28
6 31% -€ 78 -€ 442 -€ 161 -€ 98
New (0-4y) -€ 39
used (4-9y) -€ 491
used (9-15y) € 35

LDV CO2 legislation and the 2nd hand vehicle market 84
The result is similar to the petrol case, though there is a slight benefit for new fuel efficient cars and
the cost for the 3rd owner is lower. This could indicate that consumers buying a new car or old
used car are well informed and can make a (private) cost benefit analysis when considering their
options. A hidden bias in the cars owned by the lower households could also be an explanation: we
assumed same ownership period for petrol and diesel. The subset of older cars owned by lower
income groups could have a higher mileage than the average giving a better benefit to cost ratio.
We summarize the results for all the cases considered
Table 48: summary of the distribution of costs and benefits of fuel efficiency in passenger cars
We find that in most cases, when looking at the costs and benefits of a single vehicle, the fuel
efficient alternative is the more economical option, with the young used cars (4-9y) benefitting the
most. Highlights:
1. Used cars of age 4-9, entering their second life, are more economical with only a minor
premium for the fuel efficient car while being able to recuperate a much higher premium in
most cases (87%).
2. The fact that the value of higher fuel efficiency is passed on more profoundly to later
owners, means that total costs for the later owners (3rd and 4th) exceed the benefits of the
fuel savings. Under these assumptions, the fuel efficient option is more expensive when
looking at the older used cars aged 9 years and over, though the absolute value in all cases
is limited (max 241€ in all cases).
3. The difference between purchased and resale premium value for fuel efficient vehicles
primarily determines to what extent owners win or lose. Because of this, the second owner
(younger used cars aging 4-9 y) wins the most as fuel efficient vehicles are only priced at
fuel cost (€/l) premium (€/gCO2) fuel type discount rate new used young used old
1.5 50 petrol 8% € 140 -€ 641 € 108
1.5 10 petrol 8% -€ 535 -€ 641 € 108
1 50 petrol 8% € 317 -€ 467 € 241
1 10 petrol 8% -€ 357 -€ 467 € 241
1.5 50 diesel 8% -€ 39 -€ 491 € 35
1.5 10 diesel 8% -€ 459 -€ 491 € 35
1 50 diesel 8% € 114 -€ 352 € 129
1 10 diesel 8% -€ 306 -€ 352 € 129

LDV CO2 legislation and the 2nd hand vehicle market 85
5€/gCO2 in purchase, while being able to resell at a 30€/gCO2 premium and this for
almost all the vehicles involved (87%)
We see a large variety in the results for new vehicles. This is all down to the assumption on the
initial price premium (10-50€/g). We find positive and negative values for the fuel efficient option.
Considering the fact that new vehicles are most expensive in purchase, the relative variation of the
costs/benefits to the price will be maximum a few percentage. One could argue the consumer
accepts minor costs favouring other preferences over the value of future fuel savings. Given that
the variety is small compared to the purchase price and varies in sign, we can argue the consumer
buying a new car is making a rational and informed purchase decision.
This does not go for the used car market. For the young used cars, there is a clear benefit for the
fuel efficient option, in all cases. Also, the benefit is larger in absolute terms while the purchase cost
is lower compared to new cars. This mean the relative importance of the fuel savings are large
compared to the purchase costs. For the older used cars, all cases considered generate a cost,
though smaller in absolute terms. Relative to the purchase price, the lower cost associated with the
fuel efficient option is important. Both the observation of the young and older used cars could
indicate that buyers of used cars are not fully aware of the cost impacts of choosing of fuel efficient
vehicle. There is a case here for better informing the consumer in order to allow them to make a
better purchase decision.
6.2.2 At level of socio-economic group
The second step aims to link owner properties to socio-economic groups (chapter 4).
The approach described above quantifies the distributional effects at the level of ownership. To
understand the distributional effects at socio-economic groups, we link the distributional effects per
owner to properties of the second hand market.
To this end, we allocate the cost or benefits of the different owners proportionally to income groups. We
recap the finding in chapter four, more specifically
Table 18, and combine this with the cost and benefits estimated in the previous section of this
chapter.
The age cohorts considered in chapter 4 don’t match the transaction thresholds used in this
chapter. We therefor link the age cohorts 0-5y and 5-10y with the values found for the young used
cars (4-9y) and link the age cohort >10y to the old used cars (9-15y).
We also add the relative importance of cost/benefit to disposable income. To this end we make an
assumption on the average income per income group. We use 3.000, 7.000, 17.000, 33.000 and
60.000 for the income categories, coming down to the central value in each income category.
Under these additional assumptions, we find the following results for a selected case, petrol - 1.5€/l
– 10€/g CO2

LDV CO2 legislation and the 2nd hand vehicle market 86
Table 49: summary of distribution effects at income group for the case [petrol - 1.5€/l – 10€/g CO2]
In this particular case, there is a benefit for the fuel efficient option for new cars and young used
cars and a cost for the older used cars. The consequence is that the income group with the highest
share of older used cars, i.e. the lower income groups, will benefit less. This is indeed what we find,
though when looking at the income group as a whole, the benefits from the less prevalent young
used and new cars is sufficiently large to also generate a benefit for the income group as a whole.
The benefit increases with increasing income as the share of the oldest used cars decreases, in
favour of young used and new cars.
Though lowest in absolute terms, in relative terms compared to annual disposable income, the
lower income groups are progressively better off. Relative to annual income, the lowest income
groups are best of.
The same case, with a stronger assumption on the new price premium for the fuel efficient car
gives the following result:
Table 50: summary of distribution effects at income group for the case [petrol - 1.5€/l – 50€/g CO2]
In this case, the benefits are lower overall compared to the previous case, but still the fuel efficient
options are favourable for all income groups. The income group buying the most new cars (i.e. the
higher income groups), suffers more compared to the previous case, while the lower income group,
the lowest only buying 3% new cars, suffer less. This results in an overall decrease, and a cost for all
1 2 3 4 5 net cost (-benefit)
NEW 3% 10% 19% 22% 31% -€ 535
young used (4-9) 26% 28% 35% 32% 29% -€ 641
old used (9-15) 72% 62% 47% 46% 41% € 108
TOTAL 100% 100% 100% 100% 100%
1 2 3 4 5
NEW -€ 15 -€ 55 -€ 100 -€ 117 -€ 164
young used (4-9) -€ 164 -€ 180 -€ 222 -€ 205 -€ 183
old used (9-15) € 77 € 67 € 50 € 50 € 44
TOTAL -€ 102 -€ 168 -€ 272 -€ 272 -€ 304
% annual income -3.38% -2.40% -1.60% -0.82% -0.51%
1 2 3 4 5 net cost (-benefit)
NEW 3% 10% 19% 22% 31% € 140
young used (4-9) 26% 28% 35% 32% 29% -€ 641
old used (9-15) 72% 62% 47% 46% 41% € 108
TOTAL 100% 100% 100% 100% 100%
1 2 3 4 5
NEW € 4 € 14 € 26 € 30 € 43
5 - 10y -€ 164 -€ 180 -€ 222 -€ 205 -€ 183
>10y € 77 € 67 € 50 € 50 € 44
TOTAL -€ 83 -€ 99 -€ 146 -€ 125 -€ 96
% annual income -2.76% -1.42% -0.86% -0.38% -0.16%

LDV CO2 legislation and the 2nd hand vehicle market 87
income groups for the fuel efficient option. The middle income group, with the highest share of
young used cars are the winners in this case. Relative to annual income, again the lowest income
groups are best of.
We analyse the results for all other cases, using the same approach as the examples above:
Table 51: summary of distribution effects at income group
We find a benefit for most of the cases, for most income groups. Generally, a lower fuel cost
diminishes the importance of fuel efficiency; this generates a negative value for the fuel efficient
option for all income groups for one case [petrol - 1 €/l – 50€/g CO2].
Due to the lower fuel savings, the benefits decrease and the importance of the initial price premium
has a bigger impact on the result. The case of low fuel price and high price premium for the fuel
efficient petrol car generates a cost for all income groups. The equivalent diesel case generates low
benefits for most income groups and a cost for the lowest income group. Because the lower
income groups are less exposed to the high premium for the new vehicle, there is little difference
between the cases of high and low initial purchase premium.
We can conclude the following from the above analysis:
1. The fuel efficient vehicle is favourable for all income groups, in almost all cases.
2. The initial price premium paid by the first owner mainly determines the distribution effects
of the costs and benefits of a vehicle over the population of households in different
income groups. A higher initial premium is favourable for middle income groups,
unfavourable for higher income groups and vice versa for a lower initial premium.
3. Proportional to the household income, the lowest income group win the most. The
assumption on the fuel costs is most important for the lower income group, flipping
benefits to costs, low in absolute terms, but important compared to disposable income.
fuel cost (€/l) premium (€/gCO2) fuel type discount rate 1 2 3 4 5
1.5 50 petrol 8% -€ 83 -€ 99 -€ 146 -€ 125 -€ 96
1.5 10 petrol 8% -€ 102 -€ 168 -€ 272 -€ 272 -€ 304
1 50 petrol 8% € 62 € 50 € 10 € 31 € 62
1 10 petrol 8% € 43 -€ 19 -€ 116 -€ 116 -€ 145
1.5 50 diesel 8% -€ 102 -€ 120 -€ 161 -€ 150 -€ 138
1.5 10 diesel 8% -€ 113 -€ 163 -€ 239 -€ 241 -€ 267
1 50 diesel 8% € 5 -€ 8 -€ 41 -€ 29 -€ 13
1 10 diesel 8% -€ 6 -€ 51 -€ 119 -€ 120 -€ 142
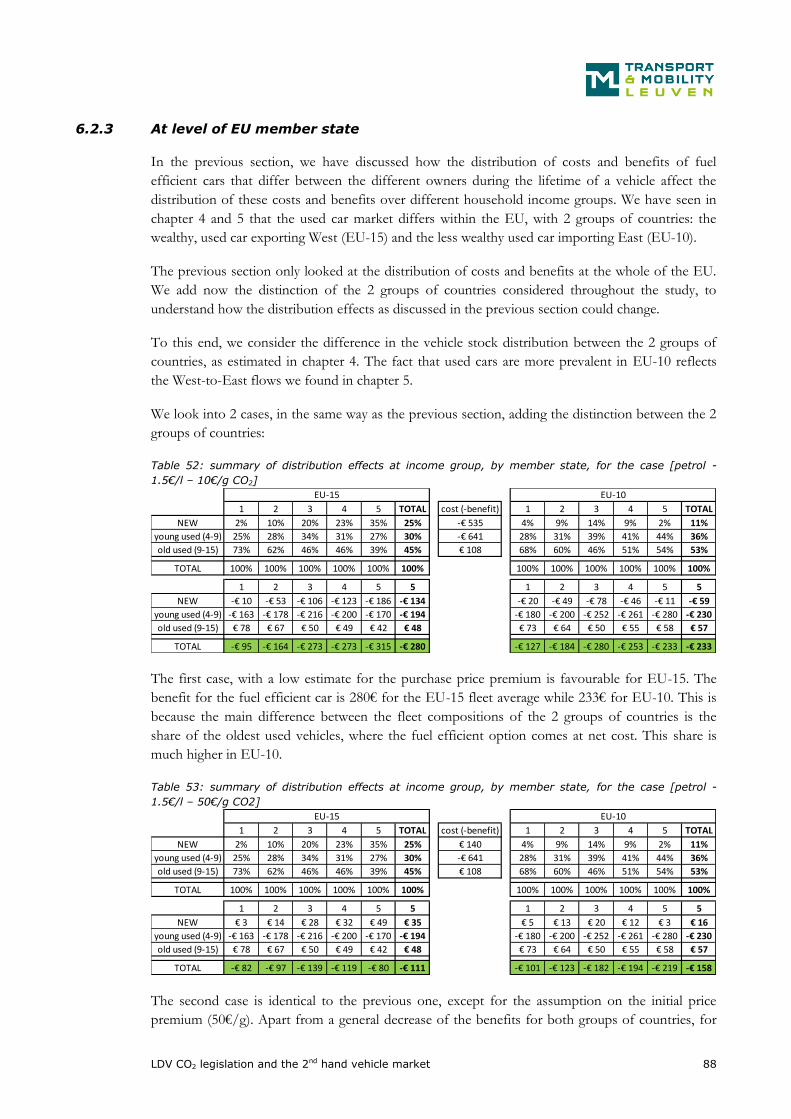
LDV CO2 legislation and the 2nd hand vehicle market 88
6.2.3 At level of EU member state
In the previous section, we have discussed how the distribution of costs and benefits of fuel
efficient cars that differ between the different owners during the lifetime of a vehicle affect the
distribution of these costs and benefits over different household income groups. We have seen in
chapter 4 and 5 that the used car market differs within the EU, with 2 groups of countries: the
wealthy, used car exporting West (EU-15) and the less wealthy used car importing East (EU-10).
The previous section only looked at the distribution of costs and benefits at the whole of the EU.
We add now the distinction of the 2 groups of countries considered throughout the study, to
understand how the distribution effects as discussed in the previous section could change.
To this end, we consider the difference in the vehicle stock distribution between the 2 groups of
countries, as estimated in chapter 4. The fact that used cars are more prevalent in EU-10 reflects
the West-to-East flows we found in chapter 5.
We look into 2 cases, in the same way as the previous section, adding the distinction between the 2
groups of countries:
Table 52: summary of distribution effects at income group, by member state, for the case [petrol -
1.5€/l – 10€/g CO2]
The first case, with a low estimate for the purchase price premium is favourable for EU-15. The
benefit for the fuel efficient car is 280€ for the EU-15 fleet average while 233€ for EU-10. This is
because the main difference between the fleet compositions of the 2 groups of countries is the
share of the oldest used vehicles, where the fuel efficient option comes at net cost. This share is
much higher in EU-10.
Table 53: summary of distribution effects at income group, by member state, for the case [petrol -
1.5€/l – 50€/g CO2]
The second case is identical to the previous one, except for the assumption on the initial price
premium (50€/g). Apart from a general decrease of the benefits for both groups of countries, for
1 2 3 4 5 TOTAL cost (-benefit) 1 2 3 4 5 TOTAL
NEW 2% 10% 20% 23% 35% 25% -€ 535 4% 9% 14% 9% 2% 11%
young used (4-9) 25% 28% 34% 31% 27% 30% -€ 641 28% 31% 39% 41% 44% 36%
old used (9-15) 73% 62% 46% 46% 39% 45% € 108 68% 60% 46% 51% 54% 53%
TOTAL 100% 100% 100% 100% 100% 100% 100% 100% 100% 100% 100% 100%
1 2 3 4 5 5 1 2 3 4 5 5
NEW -€ 10 -€ 53 -€ 106 -€ 123 -€ 186 -€ 134 -€ 20 -€ 49 -€ 78 -€ 46 -€ 11 -€ 59
young used (4-9) -€ 163 -€ 178 -€ 216 -€ 200 -€ 170 -€ 194 -€ 180 -€ 200 -€ 252 -€ 261 -€ 280 -€ 230
old used (9-15) € 78 € 67 € 50 € 49 € 42 € 48 € 73 € 64 € 50 € 55 € 58 € 57
TOTAL -€ 95 -€ 164 -€ 273 -€ 273 -€ 315 -€ 280 -€ 127 -€ 184 -€ 280 -€ 253 -€ 233 -€ 233
EU-15 EU-10
1 2 3 4 5 TOTAL cost (-benefit) 1 2 3 4 5 TOTAL
NEW 2% 10% 20% 23% 35% 25% € 140 4% 9% 14% 9% 2% 11%
young used (4-9) 25% 28% 34% 31% 27% 30% -€ 641 28% 31% 39% 41% 44% 36%
old used (9-15) 73% 62% 46% 46% 39% 45% € 108 68% 60% 46% 51% 54% 53%
TOTAL 100% 100% 100% 100% 100% 100% 100% 100% 100% 100% 100% 100%
1 2 3 4 5 5 1 2 3 4 5 5
NEW € 3 € 14 € 28 € 32 € 49 € 35 € 5 € 13 € 20 € 12 € 3 € 16
young used (4-9) -€ 163 -€ 178 -€ 216 -€ 200 -€ 170 -€ 194 -€ 180 -€ 200 -€ 252 -€ 261 -€ 280 -€ 230
old used (9-15) € 78 € 67 € 50 € 49 € 42 € 48 € 73 € 64 € 50 € 55 € 58 € 57
TOTAL -€ 82 -€ 97 -€ 139 -€ 119 -€ 80 -€ 111 -€ 101 -€ 123 -€ 182 -€ 194 -€ 219 -€ 158
EU-15 EU-10

LDV CO2 legislation and the 2nd hand vehicle market 89
all income groups, in this case, the highest benefits are in EU-10. Due to the lower share of new
cars, fewer consumers in EU-10 have to carry the initial price premium for new fuel efficient
vehicles.
The other cases give similar results. The initial purchase premium determines what group of
countries benefits most from fuel efficiency:
If the purchase premium is high, the higher income EU-15 countries, who buy the most new cars,
bear the cost of fuel efficiency. The fuel savings during first ownership are insufficient to offset the
cost and the purchase premium is only partially passed on to subsequent owners. The subsequent
owners are more likely to be EU-10 importers. The EU-10 countries, with a higher share of used
cars, import fuel efficient cars with a premium less than the premium paid by the first owner. The
net effect is that EU-15 consumers benefit, but less than EU-10 consumers, from car fuel
efficiency.
If the initial purchase premium is low, also the first owners have an immediate benefit with fuel
savings in the first life easily offsetting the marginally increase purchase cost. At the same time, the
oldest used fuel efficient cars, more prevalent in EU-10 countries, come at a cost. In this case both
groups of countries benefit more, with EU-15 proportionally benefitting more due to a higher share
of new cars/lower share of old used cars.

LDV CO2 legislation and the 2nd hand vehicle market 90
6.3 Qualitative
There are various other impact pathways possible that affect the way costs and benefits are
distributed. We identify the possible impacts on distribution effects not considered in the
quantitative analysis. We list a few examples:
Timing effect: in a trend of improving fuel efficiency over time, fuel efficient vehicles are
only available on the used car market with a delay compared to the primary market. This is
unfavourable for the used car owner, and thus the lower income groups, if the price
premium for a new fuel efficient car is low compared to the fuel savings. It is not clear if
this effect is relevant for the quantitative analysis.
Budget constraints: Consumers with a limited budget are less able to buy a more expensive
fuel efficient vehicle in the primary market, even if it would save money over time. The
quantitative analysis for example showed that for young used cars the fuel efficient option
would generate benefits over the duration of ownership. However, due to higher purchase
cost (both fuel efficient and non-fuel efficient option), lower income households may not
always be able to buy these cars. As a consequence, lower income classes take less of the
direct benefit of fuel efficiency (assuming the lifetime cost of the fuel efficient alternative is
indeed lower than the less fuel efficient alternative)
Spill-over effects of fuel costs: an increase of fuel costs make newer fuel efficient vehicles
more competitive compared to less fuel efficient vehicles, incentivising consumers to buy
in the primary market (more fuel efficient supply) compared to the second hand market.
New car owners will enjoy more from new (very) fuel efficient cars (e.g. under impulse of
more stringent CO2 legislation) compared to owners of older cars, lower income classes
being less able to purchase new (more expensive) fuel efficient cars. On the other hand,
this can generate a knock-on effect on second hand market prices, mitigating the negative
impact for used car owners.
Difference in retention rate: fuel efficient cars are more likely to be retained by their
primary owner compared to less fuel efficient cars, as such limiting the supply of fuel
efficient cars on the second hand market. A limited supply of fuel efficient cars in the
second hand car market, lower income groups have less access to these vehicles and don’t
enjoy the benefit of increasing fuel efficiency (assuming the lifetime cost of the fuel
efficient alternative is indeed lower than the less fuel efficient alternative). The quantitative
analysis could not find any data supporting this hypothesis. This is one of the possible
explanations we consider for the increasing purchase price premium associated with fuel
efficiency with increasing age.

LDV CO2 legislation and the 2nd hand vehicle market 91
6.4 Conclusions
In this chapter, we discussed how pricing of fuel efficiency in used cars causes distribution effects
at the level of vehicle ownership, socio-economic group and geographically. The key findings are:
In most cases, higher fuel efficiency generates a benefit during the different stages of the
active service life of a vehicle and for the different owners during its lifetime.
The initial price premium determines the distributional effects. Lower income groups
proportionally benefit more from fuel efficiency, if the initial cost for fuel efficiency, borne
by higher income groups is larger than initial fuel savings for the first owner.
Geographically, EU-10 wins more if the initial price premium, borne by EU-15 first
owners, is high. The earlier exports happen, the more profound the benefit for the
importing partner.

LDV CO2 legislation and the 2nd hand vehicle market 92
7 References
OKO - Mehlhart e.t al., 2011: European second-hand car market analysis Final Report -
http://ec.europa.eu/clima/policies/transport/vehicles/docs/2010_2nd_hand_car_en.pdf
Ricardo-AEA - Dun et. al., 2015: Improvements to the definition of lifetime mileage of light duty
vehicles.
http://ec.europa.eu/clima/policies/transport/vehicles/docs/ldv_mileage_improvement_en.pdf
GfK, 2014: Consumer market study on the functioning of the market for second-hand cars from a
consumer perspective.
http://ec.europa.eu/consumers/consumer_evidence/market_studies/second_hand_cars/index_en
.htm
EU-SILC: http://ec.europa.eu/eurostat/statistics-
explained/index.php/Glossary:EU_statistics_on_income_and_living_conditions_(EU-SILC)
BCA, 2013: The Used Car Market Report- Centre for Automotive Management The University of
Buckingham Business School
http://www.bcamarketplaceplc.com/~/media/Files/B/BCA/documents/bca-2013-used-car-
market-report.pdf
BCA, 2014: The Used Car Market Report- Centre for Automotive Management The University of
Buckingham Business School http://www.buckingham.ac.uk/wp-content/uploads/2014/11/pnc-
2014-usedcar.pdf
Ricardo-AEA - Gibson et. al., 2015: "Evaluation of Regulation 443/2009 and 510/2011 on the
reduction of CO2 emissions from light-duty vehicles" Study contract no
071201/2013/664487/ETU/CLIMA.C.2
http://ec.europa.eu/clima/policies/transport/vehicles/docs/evaluation_ldv_co2_regs_en.pdf
INRETS – A. Berri (2009): “A cross-country comparison of household car ownership – A Cohort
Analysis –“
A. Yurko (2009): “From Consumer Incomes to Car Ages: How the Distribution of Income Affects
the distribution of Vehicle Vintages”
J. Dargay (Oxford) & L. Hivert (INRETS) (2005): “The dynamics of car ownership in EU
countries; a comparison based on the European household panel survey”
CIRP II & Capgemini (2007): “The Anatomy and Physiology of the Used Car Business”
K. Gillingham et. Al. (Yale) (2015): “A Dynamic Model of Vehicle Ownership, Type Choice, and
Usage”
TiF, 2015: Statistical pocketbook 2014, European Transport In Figures.
http://ec.europa.eu/transport/facts-fundings/statistics/pocketbook-2015_en.htm

LDV CO2 legislation and the 2nd hand vehicle market 93
COMEXT: http://epp.eurostat.ec.europa.eu/newxtweb/ -
http://ec.europa.eu/eurostat/web/international-trade/data/database
“Assessment of the Effectiveness of Scrapping Schemes for Vehicles: Economic, Environmental, and Safety
Impacts”; Global Insight for European Commission DG ENTR; 2010

LDV CO2 legislation and the 2nd hand vehicle market 94
8 ANNEX
8.1 Underlying data for figures
Fig 2
Endvalue of bin (*1000 €) Relative frequency
1 0.23%
2 1.62%
3 3.36%
4 4.41%
5 4.94%
6 5.32%
7 5.74%
8 5.68%
9 5.74%
10 5.58%
11 4.69%
12 4.56%
13 4.68%
14 4.46%
15 4.11%
16 3.70%
17 3.50%
18 3.18%
19 3.00%
20 2.91%
21 1.83%
22 2.08%
23 1.97%
24 1.80%
25 1.71%
26 1.32%
27 1.20%

LDV CO2 legislation and the 2nd hand vehicle market 95
28 1.10%
29 1.01%
30 1.05%
31 0.48%
32 0.61%
33 0.59%
34 0.52%
35 0.50%
36 0.39%
37 0.34%
38 0.12%
Fig3
0 - 2500 2500 - 5000 5000 - 7500 7500 - 10000
10000 - 12500
15000 - 20000
20000 - 25000
25000 - 30000
30000 - 100000
20-25% 152 116 61 40 29 25 15 5 8
15-20% 381 266 129 140 71 46 23 12 13
10-15% 435 478 236 204 110 93 39 22 25
5-10% 567 857 565 458 211 245 116 69 71
up to 5% 182 417 356 317 196 212 105 49 77
0% 2534 3146 2018 1829 937 853 442 250 285
Fig4
Endvalue of bin (year)
Relative frequency
0.5 4.14%
1 9.45%
1.5 5.77%
2 3.61%
2.5 3.97%
3 4.51%
3.5 8.46%
4 5.91%

LDV CO2 legislation and the 2nd hand vehicle market 96
4.5 7.24%
5 4.77%
5.5 4.22%
6 3.46%
6.5 4.05%
7 2.96%
7.5 3.16%
8 2.95%
8.5 2.82%
9 2.69%
9.5 2.57%
10 2.22%
10.5 2.19%
11 1.78%
11.5 1.60%
12 1.29%
12.5 1.42%
13 0.98%
13.5 0.95%
14 0.73%
14.5 0.11%
Fig8
Diesel Other fuel
1 27203.45 16217.1
2 25705.52 15324.12
3 27544.93 14536.48
4 24300.87 14570.96
5 22061.5 14022.19
6 20470.74 13210.17
7 19564.81 13180.04
8 18540.57 12528.86

LDV CO2 legislation and the 2nd hand vehicle market 97
9 17929.38 11897.31
10 17432.36 11948.83
11 16715.9 11504.45
12 16397.15 11541.34
13 16221.65 11336.64
14 15469.6 11007.71
15 15775.24 10886.19
16 15184.02 10561.38
17 14832.6 10241.11
18 13758.35 9940.013
19 12362.41 9101.853
20 12487.06 8615.929
21 9562.016 8308.783
22 9454.592 7404.762
23 10624.41 6715.158
Fig10
Endvalue of bin (€)
Relative frequency
1000 0.20%
2000 1.41%
3000 3.10%
4000 4.36%
5000 5.26%
6000 5.81%
7000 6.42%
8000 6.47%
9000 6.55%
10000 6.36%
11000 5.39%
12000 5.19%
13000 5.34%
14000 5.04%

LDV CO2 legislation and the 2nd hand vehicle market 98
15000 4.45%
16000 3.88%
17000 3.59%
18000 3.20%
19000 2.94%
20000 2.80%
21000 1.73%
22000 1.89%
23000 1.71%
24000 1.59%
25000 1.39%
26000 0.97%
27000 0.88%
28000 0.76%
29000 0.68%
30000 0.62%
31000 0.03%
Fig11
Endvalue of bin (age)
Relative frequency
0.5 4.62%
1 9.83%
1.5 5.88%
2 4.00%
2.5 4.30%
3 4.47%
3.5 8.06%
4 6.05%
4.5 7.75%
5 5.09%
5.5 4.43%
6 3.54%

LDV CO2 legislation and the 2nd hand vehicle market 99
6.5 4.19%
7 3.00%
7.5 3.10%
8 2.84%
8.5 2.73%
9 2.57%
9.5 2.37%
10 1.96%
10.5 1.97%
11 1.57%
11.5 1.38%
12 1.18%
12.5 1.24%
13 0.87%
13.5 0.78%
14 0.22%
Fig12
Endvalue of bin (g/km)
Relative frequency
80 0.10%
85 0.12%
90 1.42%
95 1.03%
100 4.64%
105 2.83%
110 6.21%
115 5.70%
120 9.46%
125 5.86%
130 7.01%
135 4.39%
140 9.82%

LDV CO2 legislation and the 2nd hand vehicle market 100
145 5.15%
150 6.54%
155 5.19%
160 6.09%
165 2.96%
170 3.60%
175 2.29%
180 2.21%
185 1.37%
190 1.64%
195 1.68%
200 1.19%
205 0.49%
210 0.50%
215 0.30%
220 0.17%
Fig13
Age Km
Age Km/year
1 19.59142
1 21946.22
2 41.52483
2 20461.8
3 68.27356
3 22244.55
4 80.23085
4 20069.48
5 87.64809
5 17781.47
6 95.21741
6 15908.13
7 108.0447
7 15376
8 116.7112
8 14583.09
9 124.9943
9 13906.49
10 132.5536
10 13285.77
11 137.3751
11 12540.94
12 145.221
12 12112.91
13 147.7848
13 11361.36
14 142.1826
14 10452.6

LDV CO2 legislation and the 2nd hand vehicle market 101
Fig14
Diesel Other fuel
1 27203.45 16217.1
2 25705.52 15324.12
3 27544.93 14536.48
4 24300.87 14570.96
5 22061.5 14022.19
6 20470.74 13210.17
7 19564.81 13180.04
8 18540.57 12528.86
9 17929.38 11897.31
10 17432.36 11948.83
11 16715.9 11504.45
12 16397.15 11541.34
13 16221.65 11336.64
14 15469.6 11007.71
15 15775.24 10886.19
16 15184.02 10561.38
17 14832.6 10241.11
18 13758.35 9940.013
19 12362.41 9101.853
20 12487.06 8615.929
21 9562.016 8308.783
22 9454.592 7404.762
23 10624.41 6715.158
Fig16
1 2 3 4 5
<5 590 1341 2485 2433 2303
5-10 606 1563 2401 2011 1398
>10 608 1268 1268 874 562

LDV CO2 legislation and the 2nd hand vehicle market 102
Fig17
1 2 3 4 5
<5 257 671 699 327 300
5-10 276 920 852 328 276
>10 363 848 461 175 176
Fig18
1 2 3 4 5
country group 1 83533 90428 83873 81836 73510
country group 2 130704 127806 120529 116663 115932
All 107458 112532 95783 87590 81439
Fig19
1 2 3 4 5
country group 1 10887 9664 8973 10583 16187
country group 2 5410 5118 7084 7739 6744
All 7915 6814 8271 10358 15519
Fig21
1 2 3 4 5
<5 249 899 3610 4142 1434
5-10 239 871 3138 3590 1117
>10 184 580 1944 1797 569
Fig22
1 2 3 4 5
<5 199 613 2556 2493 789
1 2 3 4 5
<5 299 548 1502 1909 1683
5-10 286 506 1324 1491 894
>10 212 353 729 627 323

LDV CO2 legislation and the 2nd hand vehicle market 103
5-10 187 521 1910 1886 454
>10 141 283 1092 750 173
1 2 3 4 5
<5 33 228 733 1192 470
5-10 30 280 888 1328 545
>10 32 262 704 938 351
Fig23
1 2 3 4 5
group1 101711 87553 81675 78192 70531
group2 149166 124129 124282 120718 121908
All 108859 100114 94040 92779 92385
Fig24
1 2 3 4 5
group1 14155.04 11442.19 10063.72 11555.9 13503.5
group2 8580.531 6098.205 5938.782 6162.441 6793.368
All 13731.73 9726.483 9011.431 9817.029 11019.17
Fig25
1 2 3 4 5 6 7 8 9
<5 926 5900 1042 169 346 670 566 810 249
5-10 816 4929 900 232 334 720 537 569 259
>10 456 2529 513 157 217 568 366 296 210
Fig26
18-25 25-35 35-45 45-55 >55
<5 1375 2820 2478 2116 1889
5-10 1133 2639 2196 1899 1429
>10 1120 1538 1201 960 675

LDV CO2 legislation and the 2nd hand vehicle market 104
8.2 Regression model details + analysis
- Separate document -