Embed Size (px)
Citation preview

PHREE Background Paper Series
Document No. PHREE/91/43
FILE Copy
"Data Collection Strategies and Methodsfor Monitoring Student Flows'
by
Ernesto Cuadra(Consultant)
Education and Employment DivisionPopulation and Human Resources Department
The World Bank
November 1991
This publication series serves as an outlet for background products from the ongoing work progrmfn of policy research and analysis of theEducation and Employment Division in the Population and Human Resources Department of the World Bank The views expressed arethose of the author(s), and should not be attributed to the World Bank.
Pub
lic D
iscl
osur
e A
utho
rized
Pub
lic D
iscl
osur
e A
utho
rized
Pub
lic D
iscl
osur
e A
utho
rized
Pub
lic D
iscl
osur
e A
utho
rized
Pub
lic D
iscl
osur
e A
utho
rized
Pub
lic D
iscl
osur
e A
utho
rized
Pub
lic D
iscl
osur
e A
utho
rized
Pub
lic D
iscl
osur
e A
utho
rized

° The Intemational Bank for Reconstruction and Development/The World Bank, 1991

CONTENTS
Page
Executive Summary . . . . . . . . . . . . . . . . . . . . . . . . . . . . i
I. Introduction.. ............. ........ 1
II. Strategies Used to Obtain Information About Students' Flow. . 2A. The Individualized Data System (IDS) or The True Pupil
Accounting System.. 4B. The Cohort Coding System (CCS). . . . . . . . . . . . . . . 5C. The Grade Ratio Model (GRM) or The Apparent Cohort Model. . . 9D. The Grade Transition Model or The Reconstructed Cohort
Model .13E. The Age-Grade Reconstructed Flow Method. . . . . . . . . . . 23
III. Conclusions. . . . . . . . . . . . . . . . . . . . . . . . . . . . . 29
APPENDIX I... . .... 32
Formal Description of the Age-Grade Reconstructed Flow Method . . . 32
APPENDIX II.. . ..... 34
REFERENCES . . . . . . . . . . . . . . . . . . . . . . . . . . . . . . . 35
TABLES
Table 1: Comparison of Strategies Used toObtain Students' Flow data. 3
Table 2: Summary Yearly Table of Coding Forms by Cohort . . . . . . . . 6Table 3: Enrollment by Grade, Age, and Status
for Female Students in 1988/89. 7Table 4: Enrollment in Grade 1: 1987/88. 7Table 5: Dropouts Between Grade 1 and 2. 8Table 6: Enrollment in Primary Education . . . . . . . . . . . . . . . . 10Table 7: Cohort Survival and Proportion of Dropouts . . . . . . . . . . 11Table 8: Enrollment and Repeaters in Primary Education . . . . . . . . . 16Table 9: Difference Between Survival and Dropout as Estimates
Using the GRM and the GTM percentage points) . . . . . . . . . 22Table 10: Example of a Computation Matrix Used by
the Age Grade Reconstructed Flow Method . . . . . . . . . . . . 24Table 11: Honduras: Promotion, Repetition and Dropout
Rates Estimated using the GTM and theAge-Grade Reconstructed Flow Model: 1983 . . . . . . . . . . . 20
Table 12: Comparison of Survival Rates as EstimatedUsing the Grade Transition Model and theAge- Grade Reconstructed Flow Model (1983-84) . . . . . . . . . 27
Table 13: Comparison of Estimates of Repetition Ratesin the First Grade for Honduras: 1978-1983 . . . . . . . . . . 29
Table 14: Promotion, Repetition and Dropout Rates in 1983Estimated Using the Grade Transition Model . . . . . . . . . . 34
Table 15: Cohort Survival in 1983 as EstimatedUsing the Grade Transition Model . . . . . . . . . . . . . . . 34
FIGURES AND GRAPHS
Page
Figure 1: Student Flows Between Grade 1 and Grade 2 fromSchool Years t to t+l . . . . . . . . . . . . . . . 13
Graph 1: Patterns of Repetition by Grade for Burkina Faso,Belgium and Hcaduras ............... . 18
Graph 2: Patterns or Promotion Rates by Grade for Burkina Faso,Belgium and Honduras .... . . . . . . . . . . . . 19
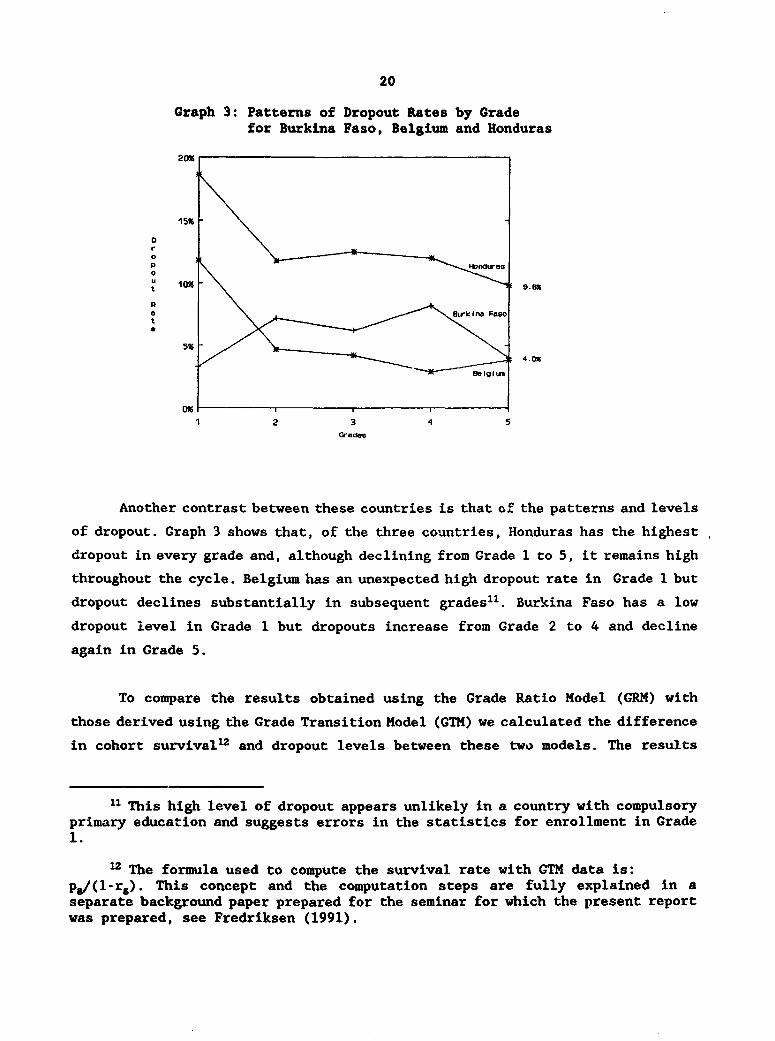
Graph 3: Patterns of Dropout Rates b Srade for Burkina Faso,Belgium and Honduras . . . . . . . . . . . . . . . 20

i
Executive Summarv
This paper examines five methods used ta collect or estimate the
information needed to monitor the flow of a cohort of students through a cycle
of education. Two of these five methods --the True Pupil Accounting System and
the Cohort Coding System- - are not currently used in developing countries because
they are expensive to establish, difficult to maintain and demanding in terms of
needed qualified personnel. Of the remaining three methods, the simplest and
easiest to use and implement is the Grade Ratio Model. This approach, however,
is applicable only for countries where repetition is negligible or non-existent,
which is not the case of most developing countries. This leaves us with on'y two
viable options for estimating flow rates for countries where repetition is
common. One is the Grade Transition Model, which provides accurate description
of how students move through a cycle of education when reliable data are
available on enrollment and repetition by grade. Because of its simplicity and
low data requirement, this is he most widely used method. The second is the Age-
Grade Model which is designed for use in cases where more data are not available
on repetition, or where such data are very unreliable, and where more reliable
data are available on enrollment by grade and by age. However, this method is
more difficult to use than the Grade Transition Model because it requires the use
of a much more comprehensive data set, necessitating the use of a computer.
Since flow rate estimates obtained using the Grade Transition Model
are so dependent on reliable repetition data, the reliability of this information
should be evaluated before using this method. If repetition rates are deemed
I -eliable but accurate data are available on enrollment by age and grade, then
the Age-Grade Method can be used to estimate transition rates. If age-grade data
are not available, then transition rates may still be estimated using linear
programming models based on enrollment by grade for a few consecutive years.
Computation algorithms and programs are available for use on personal computers
for some such models.

1
I. Tntroduction.
The goal of ensuring "universal access to, and completion of, primary
education by the year 2000," adopted by all countries participating at the World
Conference on Education for All (WCEFA) in March 1990, coupled with increasing
budget constraints, have added new pressures for developing countries to improve
the efficiency and effectiveness of their educational systems.
How much students learn and how many students drop out, repeat, or
successfully complete a grad3 are all dependent upon policies that determine the
amount of resources allocated to education, upon how efficiently these resources
are used and what type of administrative regulations goverr repetition and
promotion. Inefficiencies in the system occur partly because there is
insufficient information upon which to design and implement these policies, and
because, even with good informatior, implementation is poor. Therefore, enhancing
the efficiency and effectiveness of education in developing countries requires,
among other things, strengthening their education sectcr management, policy
analysis and planning capacities. A prerequisite to achi._ving this is building
a management inf-rmation system capable of providing reliable, relevant and
timely information about how well the sector functions.
Among the type of information most frequently missing in developing
countries is data on learning outcomes derived, for example, through achievement
tests. Such informatLin is crucial to the assessment of school effectiveness.
Although few developing countries have so far set up systems for collecting such
information, increasingly more countries recognize the need to evaluate how much
students have learned as they move through the school system.
Whether or not information on learning outcomes are available, promotion
repetition and dropout rates are the most widely used indicators to describe how
many and how fast students progress through the school system. These flow rates
are used to: (i) assess the magnitude of wastage (repetition and dropout)
prevalent in a school system; (ii) evaluate the capacity of the system to admit
new students; (iii) project future enrollment and the number of graduates who

2
will enter the subsequent cycle of education ot will join the labor market; and
(iv) estimate the cost of operating the system.
This paper presents five data collection strategies and methods designed
to gather the information required to compute these flow rates and, more broadly,
to monitor progress of students, either as individuals or as a group (cohort)
through a cycle of education.
II. Strategies Used to Obta:n Information About Students' Flow.
In student flow analyses, five conct.ALs are used to describe the flow of
students through the educational system. These are: (i) new admission to the
first grade of a cycle of education; (ii) repetition in any grade; (iii) dropout
from any grade; (iv) promotion from one grade to the next; and (v) graduation
from the final grade'. Some countries have established mon.toring systems to
directly collect information on each of these student flows. However, since these
systems are usually expensive and difficult to maintain, most countries have
opted to directly collect data on one or two of these flows and to combine this
basic information with data on enrollment by grade to derive estimated values for
the other flows.
There are five major strategies used to study how a cohort of students
moves through a cycle of education. These are the: (a) True Pupil Accounting
System; (b) Cohort Coding System; (c) Grade Transition Model; (d) Age-Grade
Reconstructed Flow Model; and (e) Grade Ratio Model. These methods differ both
in the way data are collected and in the number of flow events on which
information is directly collected. Table 1 presents a summary of the differences
1 Other flows exist, e.g there may be new entrants to other grades than thefirst grade of the cycle; re-entrants to all grades by students who temporarilyinterrupt their schooling; and transfer between different sub-systems in the casewhere the data refers to one sub-system only (e.g. public 'chools). If any ofthese flows exist, it would naturally be desirable to te%-;; hem directly intoaccount. However, collection of the required statistic. _s costly and themagnitudes of these other fiows normally are too modest to warrant theseadditional costs.

3
between each of the meth.ods in terms of which data flows are monitored using
direct data collection procedures and which flows are monitor d using estimates.
Table .: Comparison of Strategies Used toObtain Students' Flow data
INFORMATIONCollected Estimated
True Pupil Accounting System A N E R P D GCohort Coding System A E N R P D GGrade Transition Model 3 R G N P DAge Grade Reconstructed Flow Model A E N R P DGrade Ratio Model E D S
A-Age of students in each grade, fl-New entrants, E-Enrollment, R-Repetition,P-Promotion, D-Dropout, G-Graduation, S-Survival between grades
Each of the strategies presented in Table 1 use different methodologies to
collect information about how students progress through the system. If we were
to arrange these strategies along a continuum, at one extreme would be a system
where all information on student flow is based on data for individual students
(the true pupil accounting system) and is compiled in the form of academic
hiistory for every student enrolled in the system. At the other extreme of the
continuum we would find a system of data gathering which only collects annual
data on stock of enrollment (the grade ratio model) which is subsequently used
to estimate other student flow information. Unlike the True Pupil Accounting
System, the other four methods cannot furnish information on individual students.
t bast, they offer some indicators referring to the cohort2 as a whole.
Once the information on student flows, shown in Table 1, is collected, or
estimated, policy makers and analysts can use it to assess how a cohort of pupils
progress through a cycle of education and to derive various composite indicators
characterizing this progress, e.g. what proportion of the cohort complete the
2 By "cohort" we understand ell students entering Grade 1 for the first timeduring the same school year.

4
cycle, the magnitude of "wastage" in terms of repetition and dropout, and number
of school years used per graduate.
A. The Individualized Data System (IDS) or The True Pupil Accounting System.
This system consist of a central register where individualized information
on every student enrolled is kept. An academic history card is opened for every
student when he/she is enrolled for the first time in a school. This card holds
basic background information about the student such as age, sex, address, etc,
and a detailed account of any cl- ges in the student's academic status such as
the grade in which she/he 'Ls enrolled, area of specialization, type of
institution attended, etc.
On entering the educational system the student is assigned a reference
number which is recorded on the student's card. This number is a unique code that
the student carries through out her/his career (Yendall 1968, UNESCO 1972). This
system makes it possible not only to reconstruct the academic history of a cohort
or any other group of students, but also of individual students. Therefore, it
provides accurate measurement of promotion, repetition, dropout, survival, and
graduation, thereby allowing the study of the impAct of repetition and dropout
on the overall efficiency of the educational system.
The main problems with IDS is that it is expensive and difficult to
maintain, and demands thorough training of personnel in charge of data collection
and of staff responsible for producing statistical reports and data analysis.
Currently the system is only applied in a few small industrialized countries, and
as a part of an overall individualized data system covering sectors other than
education. This system was introduced on an experimental base in Honduras in the
early 1980s but it was abandoned because it was too expensive and difficult to
maintain. Because of its cost and complexity, the IDS system is not yet
appropriate for most developing countries and will, therefore, not be discussed
further in this paper.

5
B. The Cohort Coding System (CCS).
The Cohort Coding System (CCS) is a simplified version of the IDS. it is
designed to provide information on how a cohort of students (rather than
individual students as in the case of the IDS) moves through a cyc'le of
education.
Using the Cohort Coding System, information about students is recorded on
a cohort codit.g data collection form which is kept at the school. There may be
two coding forms per school, one for girls and one for boys. In the case of a
primary education system with six grades, it is recommended that the form
contains 13 columns (Sammak 1981). The first column is used to record the
student's name, the second the student's code. The next ten hold informatiorn
about te grade i-n which the student is enrolled at the beginning of each
academic year (i.e. first, second, third, etc), and the last column is used to
record the date of graduation from the primary cycle.
The key to following the academic history of the students is the code that
is assigned to each student upon first entering first grade. This code holds
information about the student's year of entrance to school (two digits), the
student's year of birth (two digits), and the region of the country where the
student was first enrolled (two digits) (UNESCO 1980, Sammak 1981). All pupils
born the same year and entering first grade of the cycle in the same school year
and in the same region will have the same code. A student migrating to another
region carries with her/him the original code. The school principal enters the
student code in the school coding form and records the grade attended by the
student under the appropri Wze column. Principals are also responsible for
preparing a "summary yei:iy table of coding forms by cohort" containing
information of enrollment by grade and cohort. For example, after two years of
implementing the system, the summary form for female enrollment in region one
would look like this3:
3. This example was adapted from Sammak 1981, p.103. It is presented hereto illustrate the complexity of the system both in terms of data collection aswell as data processing, and to demonstrate the level of detailed information

6
Table 2: Summary Yearly Table of Coding Forms by Cohort
Region 01 School Year 1988/89Sex Female
Success.Compl.GRADE of Cycle at End
Code 1 2 3 4 5 6 Prev. Sch. Year
878101 375 4,500878001 250 1,625877901 175 375888201 5,2508881011 2,0008880011 750
Table 2 summarizes the enrollment in Grades 1 and 2 in academic year
1988/89. Coiumn 2, for example, shows that 8800 students enrolied in Grade 1 in
1988/89. According to the codes on column 1, 800 of these 8800 >.udents joined
the systvm for the first time in 1987, i.e. they were repeating Grade 1 in 1988.
These are the students who have a code beginning with the number "87" (i.e. 375
plus 250, plus 175). Of these 800 students, 375 were born in 1981, i.e. they are
eight years old in 1988/89. These are the students with code 878101. Another 250
(code 878001) were born in 1980, which means that they are nine years old in
1988/89. And there are 175 students (code 877901) who were born in 1979, i.e.
they are ten years old that academic year. The remaining enrollment in Grade 1
in 1988/89 are new entrants, i.e. 5,250 entering at the age of seven, 2,000
entering at the age of eight, and 750 entering at the age of nine.
The information derived from lable 2 can be tabulated and presented in a
summary table as fol.ws:
that it provides.

7
Table 3: Earollment b-y Grade, Age, and Statusfor Female Students in 1983/89
Gra%de 1Age New Repeaters Total
7 5,250 5,2508 2,000 375 2,3759 750 250 1,00010 - 175 175
Grade 2Age Promotees Repeaters Total4
8 4,500 n/a 4,5009 1,625 n/a 1,62510 375 n/a 375
If we knew that the enrollment in Grade 1 in the previous year was
distributed in the following way:
Table 4: Enrollment in Grade 1: 1987/88
Code Grade 1
878101 5,000878001 1,925877901 625
and none of the students from region one moved tn a different region in 1988/89,
then the dropout by age between Grade 1 and 2 for the region can be easily
estimated as the difference between enrollments that begin with code 87 in
academic year 1987/88 (Table 4) and enrollments that start with the same code in
1988/89 (Table 2). In this example the dropout for age seven equals 125 students.
4' Because we are assuming that the CCS was established only two years agothe system is still unable to show repeaters in second grade. Therefore, thetotal enrollment by age presented in this table does not show the real number ofstudents enrolled in second grade.
8
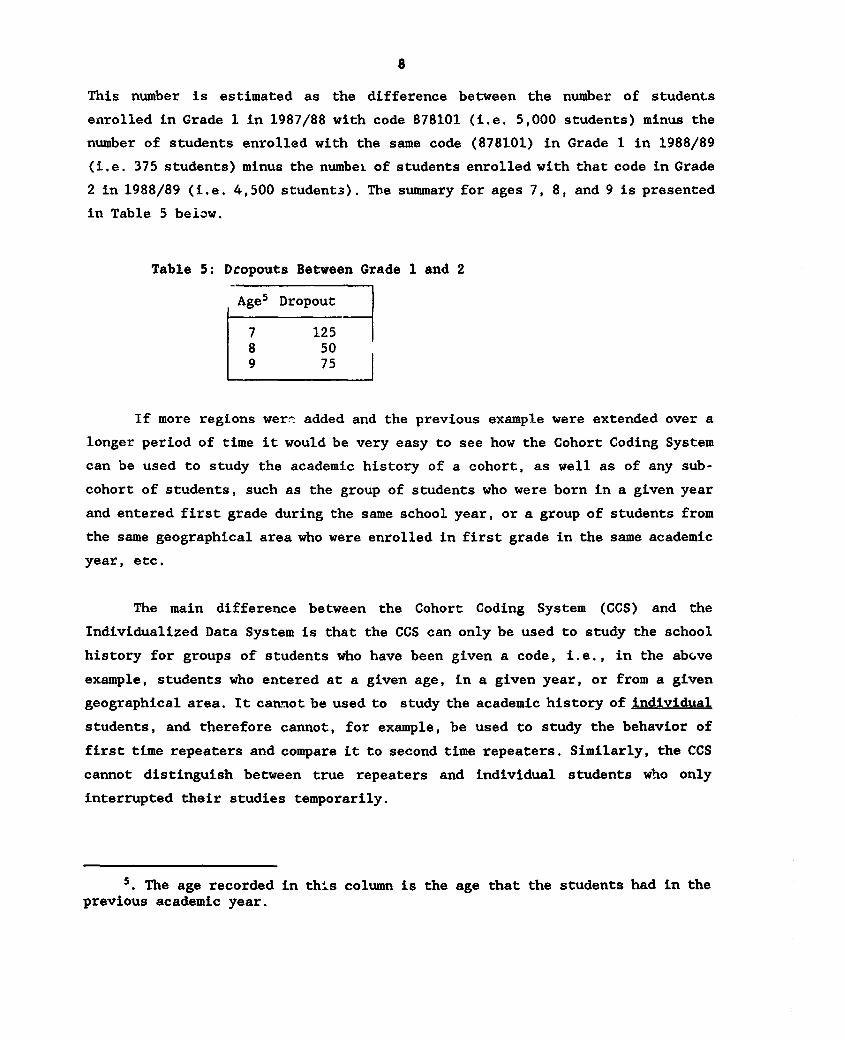
This number is estimated as the difference between the number of students
enrolled in Grade 1 in 1987/88 with code 878101 (i.e. 5,000 students) minus the
number of students enrolled with the same code (878101) in Grade 1 in 1988/89
(i.e. 375 students) minus the numbei of students enrolled with that code in Grade
2 in 1988/89 (i.e. 4,500 students). The summary for ages 7, 8, and 9 is presented
in Table 5 beiow.
Table 5: Dropouts Between Grade 1 and 2
Age5 Dropout
7 1258 509 75
If more regions wer^7 added and the previous example were extended over a
longer period of time it would be very easy to see how the Cohort Coding System
can be used to study the academic history of a cohort, as well as of any sub-
cohort of students, such as the group of students who were born in a given year
and entered first grade during the same school year, or a group of students from
the same geographical area who were enrolled in first grade in the same academic
year, etc.
The main difference between the Cohort Coding System (CCS) and the
Individualized Data System is that the CCS can only be used to study the school
history for groups of students who have been given a code, i.e., in the abGve
example, students who entered at a given age, in a given year, or from a given
geographical area. It cannot be used to study the academic history of individual
students, and therefore cannot, for example, be used to study the behavior of
first time repeaters and compare it to second time repeaters. Similarly, the CCS
cannot distinguish between true repeaters and individual students who only
interrupted their studies temporarily.
5. The age recorded in this column is the age that the students had in theprevious academic year.

9
Although the Cohort Coding System is less resource demanding than the
Individualized Data System, it still requires careful training and supervision
and demands that school principals spend a great deal of time collecting the
basic data and producing the summary reports needed at the national level. In
addition to the needed human resource capacity, the CCS most likely requires a
strong technological capacity. It is difficult to conceive a CCS reporting system
operating without the support of computers.
C. The Grade Ratio Model (GRM) or The Apparent Cohort Model6.
The simplest model used to estimate the progression of a cchort through a
cycle of education is the Grade Ratio Model (GRM). This model is based on data
on enrollment by grade for consecutive years, and is only used when data on
repeaters by grade is not available. (Fredriksen 1976, Thonstad 1976, Unesco
1972, 1980).
The basic relationship of the model is called the survival or orogression
rate, which is defined as the ratio of enrollment in a grade in a given year to
the enrollment in the previous grade the year before:
krg =gt
where kg is the survival ratio in school year tbetween Grades g and g+l.
is the enrollment in grade g in schoolyear t.
is the enrollment in grade g+l in schoolyear t+l.
6. The Grade Ratio Model is presented before the Grade Transition Model tofacilitate comparisons between the two models.

10
When this model is used for estimating the flow of a cohort through a cycle
of education (as opposed to the projection of enrollment), it assumes that the
decline in enrollment between two successive grades in two consecutive school
years represents dropouts. The remainder is treated as promotees.
The main weakness of this method for analyzing student flows is that it
disregards repetition. In cases where repetition is negligible or low the method
will give good approximation of survival and dropout. In cases where repetition
is not negligible, the magnitude of the error made depends on the level and
pattern of repetition by grade. This will be illustrated below with data for
Burkina Faso, Belgium and Honduras. These countries were selected because they
all have a total repetition level of about 16X but, at the same time, they have
very different grade specific repetition rates.
Table 6: Enrollment in Primary Education
BURKINA FASO BELGIUM HONDURASGrade 1982 1983 1983 1984 1983 1984
Grade 1 61904 65106 132332 130847 236619 244643Grade 2 51071 58546 122358 121944 144943 151062Grade 3 42734 47268 121189 120143 111143 118481Grade 4 33507 38411 124471 119391 86019 91423Grade 5 27891 30323 129559 124166 68793 72280Grade 6 33521 37078 128754 123031 56091 59013Total 250628 276732 758663 739522 703608 736902
The survival rate between Grade 1 and 2 is computed as:
k182 - 58546 - .946 for Burkina Faso
61904
k183 - 121944 - .922 for Belgium
132332
k183 _ 151062 - .638 for Honduras236619
11
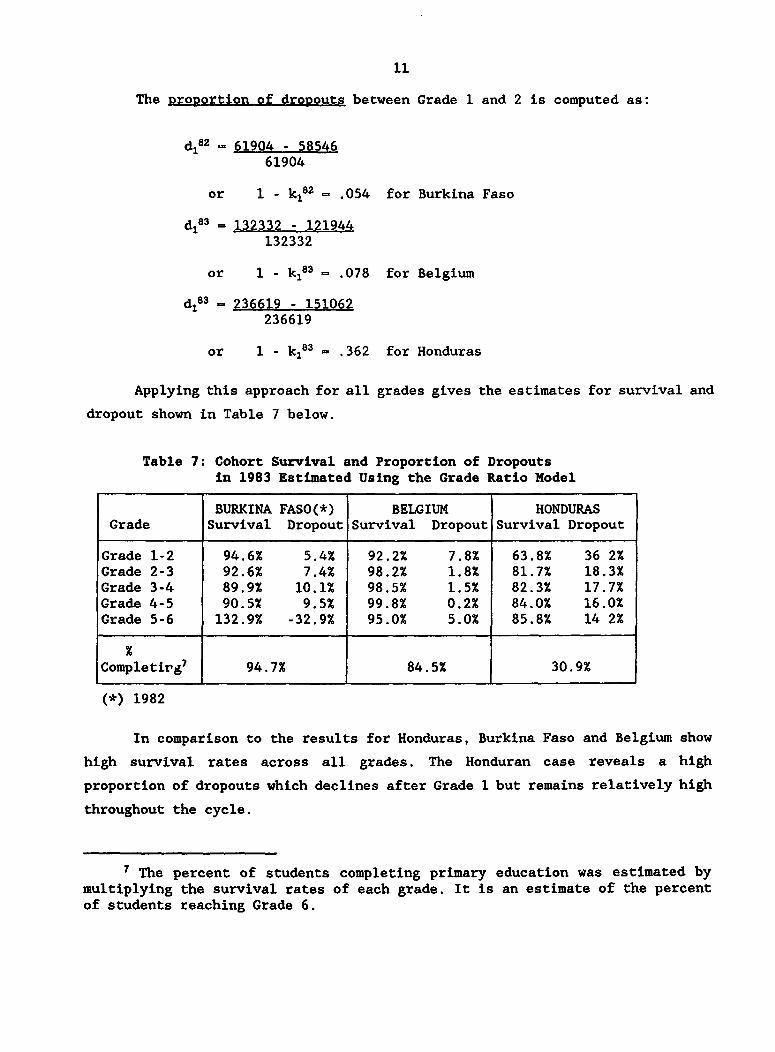
The Rroportion of drogouts between Grade 1 and 2 is computed as:
dl82 61904 - 5854661904
or 1 - k182 _ .054 for Burkina Faso
d183 _ 132332 - 121944
132332
or 1 - k183 _ .078 for Belgium
d183 - 236619 - 151062
236619
or 1 - k183 _ .362 for Honduras
Applying this approach for all grades gives the estimates for survival and
dropout shown in Table 7 below.
Table 7: Cohort Survival and Proportion of Dropoutsin 1983 Estimated Using the Grade Ratio Model
BURKINA FASO(*) BELGIUM HONDURASGrade Survival Dropout Survival Dropout Survival Dropout
Grade 1-2 94.6% 5.4% 92.2% 7.8% 63.8% 36 2%Grade 2-3 92.6% 7.4% 98.2% 1.8% 81.7% 18.3%Grade 3-4 89.9% 10.1% 98.5% 1.5% 82.3% 17.7%Grade 4-5 90.5% 9.5% 99.8% 0.2% 84.0% 16.0%Grade 5-6 132.9% -32.9% 95.0% 5.0% 85.8% 14 2%
Completirg7 94.7% 84.5% 30.9%
(*) 1982
In comparison to the results for Honduras, Burkina Faso and Belgium show
high survival rates across all grades. The Honduran case reveals a high
proportion of dropouts which declines after Grade 1 but remains relatively high
throughout the cycle.
7 The percent of students completing primary education was estimated bymultiplying the survival rates of each grade. It is an estimate of the percentof students reaching Grade 6.
12
The main limitation of the Grade Ratio Model is that it assumes that
students either dropout from the system or are promoted to a higher grade,
therefore there is no place for repetition. This might be a true description of
what happens in a system with automatic promotion and open access to secondary
education, but is certainly not a realistic picture of what happens in most Third
World countries. Model simplicity is obtained at the expense of excluding the
parameters describing the internal efficiency of the school system.
This shortcoming of the GRM model is illustrated by the sxample of Burkina
Faso where the survival rate between Gradss 5 and 6 exceeds hundred percent
(132.9%), yielding negative dropout (-32.9%). This results e.ccurs because
enrollment in Grade 6 in 1983 exceeded enrollment in Grade 5 in 1982 due to high
levels of repetition in Grade 6. This situation is not uncommon in Third World
countries, especially in Africa, where repetition in the last grade of primary
education is very high because of high selectivity and/or limited capacity of the
secondary cycle, which force enrollment in the last grade of the primary cycle
to be higher than enrollment in the previous grade the year before.
The GRM method also yields negative estimates of dropout grades other than
the final grade for co-untries such as Costa Rica in the 1970s and Egypt, where
automatic promotion in one grade is followed by a grade with examinations and.
therefore, with repetition. In these cases the higher of these two grades will
almost invariably have more students enrolled than the lower grade the previous
year. The GRM will yield a survival rate larger th.n 100 percent and, thus, a
negative dropout rate.
The next section presents the Grade Transition Model and examines how these
findings change when survival and dropout are estimated on the basis of a model
that takes repetition explicitly into account. It also illustrates a common
mistake made by some users of the Grade Ratio Model who treat the survival rate
as the Rromotion rate and who consider the Droportion of droRouts as equal to the
droRout rate.

13
D. The Grade Transition Model or The Reconstructed Cohort Model
The Grade Transition Model (GTM) uses data on enrollment by grade for two
consecutive years and data on repeaters by grade for the second of these two
Jears to estimate new entrants to the first grade and promotion, repetition and
dropout rates for all grades.
Figure 1 illustrates the basic assumptions of the Grade Transition Model
and shows how the information on enrollment and repetition by grade is used to
estimate new entrants, promotees and dropout.
Figure I
Stucdent FlowB Between Grade 1 and Grade 2
from School Years t to t.1
School Year Grade 1 Crade 2
Ne4 Entrants
Year I t t
Erroifffient Enro mTnt
Aepeaters Promotees *Reeeaters
t-I~~~~~~~~~~~~.
Now Entrants
Et.1t.Yrear t.1 2'
Enroll'metErlment
Fli - 6OWtQd data
O) - estimaSted date

14
Three assumptions govern the application of the GTM. The number of students
enrolled in a given year in any grade consists of students repeating the grade
and students who come from the previous grade with the status of promotees. The
only exception to this rule is the first grade where new entrants replace
promotees. The following equation illustrates this notion:
Eg'.i. = Rg.i + Pg4j
where Ent is the number of students enrolled in
grade g+l in school year t+l
Rg+i is the number of students enrolled asrepeaters in grade g+l in school year t+l
is the number of students enrolled aspromotees in grade g+l in school year t+l
Since educational systems using the GTM model gather data on enrollment and
repetition, the only unknown in the previous equation is the number of promotees,
which is estimated as the difference between enrollment and repeaters, i.e.
C+Il t+1 evl-igJl Eg.2 -Rg.
The second assumption is that students enrolled in a given grade in a given
year will be enrolled, at the beginning of the following year, as either
repeaters in the same grade or as promotees in the next grade, or will have
dropped out before the start of the next school year. Thus, using the estimates
of promotees derived above, together with the data on enrollment and repeaters,
the dropout can be estimated according to the following equation:

15
4R g PRg+ +D;
where D, is the number of students who drop from
grade g between school years t and t+l
rearranging terms we get that dropout is equal to:
Dgt-EgA -Rg tgpt1l
The data on enrollment and repeaters, plus the estimates of promotees and
dropcats are used to estimate promotion, repetition, and dropout rates for grade
g in year t according to the following formulae:
repeti:tion: r=
e -Pg+j
promotion: Pw gj1Egt
dropout: dg = D
A third assumption of the Grade Transition Model is that the probability
of repetition is the same for repeaters as for non repeaters. Although there is
not much research on this topic in developing countries, evidence from the USA,
Canada and Europe indicates that students repeating a grade have a higher chance
of repeating in a subsequent grade and of dropping-out than non-repeaters
(Holmes, 1989).
There are two extensions of the GTM that do not make the same assumption.
One is the Age-Grade Transition Model. This model is based on the hypothesis that

16
the transition rates are age dependent within each grade. For example, a seven
year old in first grade will have a different probability of repeating, being
promoted, or dropping out than will a ten year old. The second is the School-
History Model which is based on the hypothesis that the transition rates in a
grade depend on whether the student has repeated the previous grade, and her/his
prior academic history (UNESCO 1980). The mechanics for computing the flow rates
in these two versions of the GTM model are the same as in the original model, the
only difference is that for each grade there are as many sets of flow rates as
age groups or "historical" groups. These extensions of the GTM model are,
therefore, much more data intensive than the original one.
The example below, using data from Honduras, illustrates how the GTM model
can be used to estimate repetition, promotion, and dropout rates by grade.
Table 8: Enrollment and Repeaters in Primary Education
BURKINA FASO BELGIUM HONDURASRepea- Repea- Repea-
Enrollment ters Enrollment ters Enrollment tersGrade 1982 1983 1983 1983 1984 1984 1983 1984 1984
Gr 1 61904 65106 8025 132332 130847 12537 236619 244643 64666Gr 2 51071 58546 6745 122358 121944 17819 144943 151062 22952Gi 3 42734 47268 6605 121189 120143 21421 111143 118481 13475Gr 4 33507 38411 4943 124471 119391 24684 86019 91423 7579Gr 5 27891 30323 4536 129559 124166 27989 68793 72280 4156Gr 6 33521 37078 14838 128754 123031 26441 56091 59013 1104
The promotion rate for Honduras in Grade 1 is estimated as:
Pi83 - 151062 - 22952 - .541236619
The repetition rate for Honduras in Grade 1 is estimated as:
r183 - 64666 - .273
236619

17
The dropout rate for Honduras in Grade 1 is estimated as:
d163 _ 1 -p 1
8 3 - r1 83 - 1 - .541 - .273 - .186
The procedures for computing the flow rates for all other grades is the
same as for Grade 1 except for Grade 6, where onlv the repetition rate can be
estimated directly. The promotion rate in this grade is called the graduation
rate and is estimated by using additional information on the number of students
passing the final examination.
In contrast to the Grade Ratio Model, the Grade Transition Model gives
direct estimates of new entrants to the first grade, calculated as the difference
between repeaters and the total enrollment in this grade. In our example the
number of new entrants into first grade, in 1984, is equal to:
N184 - 244643 - 64666 - 179977 for Honduras
Although the three countries used in the example have almost the same
overall level of repetition in primary education (18% in Burkina Faso, 17Z in
Belgium and 16% in Honduras) their patterns of repetition rates by grade are very
different, as depicted in Graph 1. This illustrates how similar levels of overall
repetition may hide quite wide differences in repetition by grade, and how poorly
the indicator of total repetition describes a national system.

18
Graph 1: Patterns of Repetition by Grade forBurkina Faso, Belgium and Honduras
sox . _
30%
9,.rk Inm Paoo . 44.3a
20%00
0% g I - - T- - - - - r ( ~~~~~~~~~~~~2. OX
0%
12 3 4 Is 6
Gres
From Graph 18 we can see that Burkina Faso has the highest repetition rate
in Grade 6 (44.3%) and that the difference between the highest and the lowest
rate is 31.3 percentage points. We also observe that repetition levels remain
almost unchanged for Burkina Faso between Grade 1 and 5 and that it jumps from
16.3% to 44.3% between Grade 5 and 6. In contrast, Honduras has the highest
re;stition rate in Grade . (27.3%) and there is a steady decline in repetition
te a 2% level in Grade 6. The difference between the highest and the lowest rate
in Honduras is 25.3 percentage points. Although repetition in Belgium increases
from Grade 1 to 5 there is less difference in repetition across grades. As a
matter of fact, the difference between the highest (21.6% in Grade 5) and the
lowest (9.5% in Grade 1) repetition is only 11 percentage points9.
8 The actual rates are presented in Table 14 of Appendix II.
9 The high level of repetition in Belgium is quite atypical forindustrialized countries.

19
Graph 2: Patterns of Promotion Rates by Gradefor Burkina Faso, Belgium and Honduras
100%
90%
rp
. / 79.Nt
70
a
00
! evxlm2 3 4 5 6
Graph 2 shows that promotion rates follow a pattern very similar to
repetition but with the reverse sign. Burkina Faso has the lowest promotion in
Grade 6 (55.7%) and the highest in Grade 1 (83.7%)1o. In this country, promotion
levels remain almost unchanged between Grade 1 and Grade 5 but drastically
decline by 24 percentage points between Grades 5 and 6. Almost the opposite is
true for Honduras where promotion increases from Grade 1 (54.1%) to Grade 6 (98%)
with two big jumps in between. The first big increase occurs between Grades 1 and
2 where promotion jumps by 18.3 percentage points, after Grade 2 promotion
increases at a regular pace to jump again by 13.8 percentage points between
Grades 5 and 6. Belgium has very similar promotion levels across all grades, and
the difference between the highest (80.7% in Grade 2) and the lowest (74.6% in
Grade 5) promotion rate is only 6.1 percentage points.
10 The actual rates are presented in Table 14 of Appendix II.
20
Graph 3: Patterns of Dropout Rates by Gradefor Burkina Faso, Belgium and Honduras
20%
15% \
0r
0
at 5% t4.o~~~~~~~~~~~~~~~~408eIglox
1 2 3 4 SGrades
Another contrast between these countries is that of the patterns and levels
of dropout. Graph 3 shows that, of the three countries, Honduras has the highest
dropout in every grade and, although declining from Grade 1 to 5, it remains high
throughout the cycle. Belgium has an unexpected high dropout rate in Grade 1 but
dropout declines substantially in subsequent grades1l. Burkina Faso has a low
dropout level in Grade 1 but dropouts increase from Grade 2 to 4 and decline
again in Grade 5.
To compare the results obtained using the Grade Ratio Model (GRM) with
those derived using the Grade Transition Model (GTM) we calculated the difference
in cohort survival12 and dropout levels between these two models. The results
12. This high level of dropout appears unlikely in a country with compulsory
primary education and suggests errors in the statistics for enrollment in Grade
1.
12 The formula used to compute the survival rate with GTM data is:
p,/(l-r6). This concept and the computation steps are fully explained in a
separate background paper prepared for the seminar for which the present report
was prepared, see Fredriksen (1991).

21
are shown in Table 9. The first conclusion that we draw from this comparison is
that it is almost impossible to predict the effect that not taking repetition
into account (as implied by using the GRM) will have on the estimates of survival
and dropout. For example, dropout levels are underestimated in Belgium in all
grades but Grade 5, whereas they are overestimated in Honduras in all grades and
in Burkina Faso in all grades except in Grade 5, where dropout is grossly
underestimated by almost 37 percentage points. Furthermore, the difference in
survival levels between grades for Belgium indicates that the GRM overestimates
survival in all grades but Grade 5, but for Honduras it underestimates survival
in all grades but Grade 5. Burkina Faso's survival rates are overestimated for
three grades (Grades 2, 4, and 5), and underestimated for twe grades (Grades 1
and 4). In Grade 5 the survival rate is overestimated by almost 38 percentage
points.
The cumulative effect of overestimating cohort survival in Belgium and in
Burkina Faso, especially in Grade 6, can be appreciated when comparing the number
of students reaching Grade 6 suggested by the survival rates13. For example, the
Grade Ratio Model overestimates the number of students reaching Grade 6 by 24.3
percentage points in Burkina Faso, and by 13.4 percentage points in Belgium; but
underestimates the number of pupils reaching the last grade of the cycle by 11.9
percentage points in Honduras.
13 The percentaga of students reaching Grade 6 is estimated by multiplying
the survival rates for each grade.

22
Table 9: Difference Between Survival and Dropout as EstimatesUsing the GRM and the GTM percentage points)1 4
BURKINA FASO BELGIUM HONDURASSurvi- Drop- Survi- Drop- Survi- Drop-
Grade val out val out val out
Grade 1-2 -1.6 2.1 5.2 -4.0 -10.7 17.6Grade 2-3 0.8 0.3 3.8 -2.9 -4.3 6.5Grade 3-4 -2.8 3.9 3.6 -2.7 -3.6 5.3Grade 4-5 0.2 1.2 3.4 -2.7 -2.8 4.0Grade 5-6 37.7 -36.9 -0.1 1.2 -3.8 4.4
Completing 24.3 13.4 -11.9
The comparison also shows that the lower the repetition rate the closer
will be the cohort survival and the dropout rates estimated by the two methods.
In fact, in situations where repetition is equal to zero, which is what is
expected to happen in countries that have automatic promotion, the flow rates
estimated by the two the GRM and the GTM will be the same.
If repetition is equal to zero, then the promotion rate will be;
promotion: PE which is equal to kt,
and the dropout rate will be estimated as a residual, i.e.:
dtg - 1 -pts or 1 - ktg
The main strength of the GTM model is it simplicity. All the necessary
computations can be done with pencil and paper or, with a hand calculator. The
main weakness of the model is that it relies too much on one single piece of flow
data, namely repeaters, as reported by schools. Any problem that effects the
quality of these data will also have an impact on the other estimates of students
14 The differences presented in this table is the difference between thesurvival as estimated by the GRM and presented in Table 7 minus the survival asestim&ted by the GTM. These estimates are presented in Table 15 in Appendix II.

23
flow, i.e. promotion and dropout. The impact of some common errors in data on the
estimation of the flow rates has been discussed in Fredriksen 1991. One method
designed to deal with under-estimation of repetition, a problem particularly
relevant in some countries, is presented in the following section.
E. The Age-Grade Reconstructed Flow Method.
Several analyses of educational and demographic statistics of Latin
American countries have shown that while schools tend to accurately report
enrollment by grade and age, there is a substantial under-reporting of repetition
(Schiefelbein 1981, 1989). This under-reporting is largest in the first grade.
The implication of this finding is that, in these countries, the Grade
Transition Model yields biased estimates of repetition, promotion, dropout and
intak3 rates. Therefore, there is a need for an alternative method for estimating
transition rates that is not based on information about repeaters. Schiefelbein
(1981 and 1985) has proposed a method which does not rely on data on repeaters
but uses one piece of information that schools in Latin America report more
accurately, i.e the age distribution of students enrolled in each grade. This
method is called the Age-Grade Reconstructed Flow Method (Schiefelbein and Grossi
1981).
The Age-Grade Reconstructed Flow Method uses data on enrollment by age and
grade for two consecutive years to estimate promotion, repetition and dropout
rates by grade. The basic idea behind this method is that the enrollment by age
and grade of any single academic year is related to the enrollment of the
following year by a set of implicit promotion, repetition, and dropout rates.
These rates can be identified using data on enrollment by age and grade for two
consecutive years and two informed gu3sses, or unrestrictive assumptions. One
informed guess concerns the percentage of students repeating the last grade and
the second the percentage of non-promoted students who drop out from each grade.

24
The role of these informed guesses will become clearer in the following
paragraphs which present a more detailed explanation of this method15.
The method starts by reorganizing the enrollment for two consecutive years
into a series of matrices15 of enrollment by age and grade similar to Table 10.
This table shows in the second column the enrollment of students aged 11 years
in 1983 and, in the last column, the enrollment of the same group one year later
(1984) when they were 12 years old.
Table 10: Example of a Computation Matrix Used bythe Age Grade Reconstructed Flow Method
Enroll Yes No Repea- Drop- EnrollGrade 1983 Promot. Promot. ters out New 1984
Age 11 Age 12
1 10132 0 7823 6724 1099 0 67242 14753 2309 7849 7692 157 0 100013 18225 6904 6911 6773 138 0 136774 19136 11314 4688 4594 94 0 159085 16997 14448 1998 1958 40 0 164066 9333 14999 187 0 15186
To fill in the rest of the columns in the table the method starts by
computing the number of repeaters in the highest grade of the second year. The
repeaters in sixth grade in 1984 must come from the eleven year old students who
were enrolled in the same grade in 1983. This number is estimated by making an
assumption or an informed guess about the proportion of students in sixth grade
in 1983 who are enrolled as repeaters in the same grade in 1984. In this example
we used as an informed guess the repetition rate for Grade 6 as estimated using
official data on the total number of students repeating that grade (two percent).
The repeaters (i.e. 9333 * 0.02 - 187) are then subtracted from the 1984 sixth
15 A full presentation of each of the formulas and procedures involved inthe estimation of promotion, repetition and dropout using this method isintroduced in Appendix I.
16* The total number of matrices will equal the number of age groups forwhich enrollment is reported minus one. That is, if enrollment is reported forages six to twenty one, then fifteen computation matrices are required.

25
grade enrollment to get the number of students who were promoted from Grade 5 in
1983 (15186-187 - 14999). Next, the number of non-promoted students from Grade
5 in 1983 is calculated as the difference between the enrollment in that grade
and the number of students who were promoted to sixth grade in 1984 (16997-14999
- 1998). Next, the estimated number of non-promoted students is split between
repeaters and dropouts. To split this group a second assumption is made about the
proportion of the non-promoted who dropout from school17. In this example we
assumed that two percent of the non-promoted will not be enrolled next year
(1998*0.02 - 40). Finally, the rest of the non-promoted are considered repeaters
(1998-40 - 1958) which are then used to estimate the students promoted from
fourth grade. The computations then proceed grade by grade estimating non-
promoted students, dropouts, repeaters, and promoted until reaching the first
grade.
It is possible to find cases where the enrollment in a grade in the second
of two consecutive years (let us say Grade 6 in 1984) will be higher than the
enrollment in the previous grade the year before (Grade 5 in 1983) plus the
repeaters in that grade (Grade 6 in 1984). Since Grade 5 in 1983 defines the
maximum number of students who could be promoted to Grade 6 in 1984 there is a
need to find out where the additional number of students found in sixth grade in
1984 come from. This is done by introducing the possibility of new students
entering to the grade. The new-entrants to any grade are estimated as the
difference between enrollment in the specific grade minus promotees from the
previous grade, minus student repeating that grade. In grades above Grade 1, the
new-entrants will be either international immigrants or children reentering the
system after a period of absenteeism.
Although the Age-Grade Reconstructed Flow method is less resource demanding
than the CCS or the IDS, it requires more detailed data than does the Grade
. In 1986 a research team from the Harvard Institute for InternationalDevelopment carried out more than thirty experimental applications of this methodto estimate transition rates in six Central American countries. Their work showedthat because repetition is low in Grade 6, the final estimates of the flow ratesare not very sensitive to informed guesses about the proportion of dropouts orthe proportion of students who repeat the highest grade (Cuadra 1987).

26
Transition Model. Age data might not seem very difficult to collect but a review
of the UNESCO Statistical Year Book shows that this kind of information is
available for relative few countries. This is partly because for schools to
report enrollment by grade cross-classified by age considerably increases the
work involved in completing and processing the annual school census. Furthermore,
in some regions (e.g. Africa) the information on age of students is very
unreliable. Finally, even in cases where reliable data on enrollment by grade and
age are available (e.g., in Latin America), a real problem with this method is
that it requires many calculations which are cumbersome without the assistance
of a computer. However, given that personal computers are now available, and
contemplating the very considerable magnitude of errors in the data on repeaters
in many countries, it is highly desirable to use the age-grade data to compute
alternative estimates of flow rates in cases where the age-grade data are
considered more reliable than those available on repetition.
An application of the Age-Grade Reconstructed Flow method to the 1983 and
1984 enrollment in primary school in Honduras produced the transition rates
presented in Table 11:
Table 11: Honduras: Promotion, Repetition and DropoutRates Estimated using the GTM and theAge-Grade Reconstructed Flow Model: 1983
Promoti,n Repetition DropoutGTM AGE-GR GTM AGE-GR GTM AGE-GR
Grade 1 54.1% 42.5% 27.3X 51.7% 18.6% 5.8%Grade 2 72.4% 58.9% 15.8% 34.6% 11.8% 6.5%Grade 3 75.4% 65.2% 12.1% 27.2% 12.5% 7.6%Grade 4 79.2% 71.9% 8.8% 22.0% 12.0% 6.1%Grade 5 84.2% 81.4% 6.0% 15.2% 9.8% 3.4%Grade 6 98.0% 98.0% 2.0% 2.0% 0.0% 0.0%
What Table 11 shows is how the estimates obtained using the GTM are
dramatically different from the estimates derived using the Age-Grade Model in
Honduras. On the one hand, the repetition rates estimated using the Age-Grade
Reconstructed Flow Method are generally twice the size of those estimated using

27
the Grade Transition Model, which is a very significant difference for repetition
rates of the magnitude found in Honduras. On the other hand, the promotion and
dropout rates are much lower in the Age-Grade Model.
The consequences of having such different estimates of repetition and
promotion rates can be assessed by examining the impact of these rates on the
survival of a cohort of students. Table 12 shows that the Grade Transition Model
systematically under-estimates the capacity of the syEtem to retain students due
to the combined effect of underestimating repetition and overestimating dropouts.
This combined effect becomes particularly striking when we compare the percentage
of &..udent who complete up to Grade 6, i.e. 43.7% according to the GTM, as
compared to 62.8% for the Age Grade Model.
Table 12: Comparison of Survival Rates as EstimatedUsing the Grade Transition Model and theAge- Grade Reconstructed Flow Model (1983-84)
Survival Rates DifferenceGTM Age-Grade (percentage points)
Grade 1-2 76.2% 38.0% -11.8Grade 2-3 86.0% 90.1% -4.1Grade 3-4 85.8% 89.6% -3.8Grade 4-5 86.8% 92.1% -5.3Grade 5-6 89.6% 96.0% -6.4
Completing 43.7% 62.8% -19.1
Obviously, such major differences in the estimates would affect the
relative priority given in an eventual Bank project to address repetition and
dropout. The Grade Transition Model suggest that Honduras has problems with
retaining students in schools since only 43.7% complete up to Grade 6. This low
percentage is strongly influenced by the estimated low cohort survival between
Grade 1 and 2. Contrary to this picture, the Age-Grade Model suggest that 62.8%
students complete up to Grade 6. While still low, this indicates that dropout is
less of a problem than suggested by the GTM, and that repetition is a much more
serious problem than what is indicated by the data available on repetition.

28
These findings have important implications for project preparation and for
monitoring the progress of educational systems. On the one hand, using the Age-
Grade estimates of repetition rates suggest that the system spends almost 52%18
more student-years in educating a cohort of student than what is estimated when
using the GTM figures. This happens because, due to higher repetition and lower
dropout rates estimated by the Age-Grade Model, it is predicted that more
students will remain in the system and eventually graduate and, at the same time,
that they will stay longer on average in the system than what is predicted by the
GTM. As a matter of fact, according to the Age-Grade Model, the system graduates
almost 50% more students (62.8%) than what the official repetition figures
suggest (42%), and the average duration of study is almost 7 years and not 4.5
years as estimated when using the GTM figures. On the other hand, the combined
effect of a higher level of total expenditures (i.e. student-years) with a higher
number of graduates only translates in a 2.5% increase in the cost per graduate.
The 1983-84 results presented in Table 12 are consistent with results for
other years in Honduras. A comparison between the repetition rates for the first
grade during six consecutive years estimated using the Grade Transition Model
with the same rates estimated using the Age-Grade Model shows that both models
give very consistent results over time, yet the latter model invariably estimates
repetition rates that are about twice the size of those derived from using the
GTM.
18 The numFer of student-years estimated using the flow rates estimated by
the Age-Grade Reconstructed Flow Model is equal to 6827 as compared to 4500obtained when using the flow rates produced by the GTM.

29
Table 13: Comparison of Estimates of Repetition Ratesin the First Grade for Honduras: 1978-1983
Year Grade Transition Age-GradeModel Model
1978 27.3% 51.8%1979 26.7% 54.1%1980 26.1% 57.6%1981 28.0% 50.1%1982 27.3% 50.7%1983 27.3% 51.7%
The question is: Which model yields rates that best represent what actually
happens in primary education in Honduras? Indirect evidence from Honduras and
other Central American countries suggest that, in the case of these countries,
the Age-Grade Model gives more accurate estimates of transition rates than the
GTM. This evidence has been empirically verified in the case of Honduras through
a school sample survey conducted in 1987. This survey concluded that in Honduras
the information that schools send to the Ministry of Education regarding
enrollment by grade and age is fairly accurate. The information about the status
of students (i.e. repeater or promotee), however, is not so accurate and tend to
underreport repetition, especially in lower grades. The under-reporting of
repetition is higher for students attending first grade for the first time than
for students who had repeated before'9.
III. Conclusions.
This paper examines five methods used to collect or estimate the
information needed to monitor the flow of a cohort of students through a cycle
of education. Two of these five methods --the True Pupil Accounting System and
the Cohort Coding System- - are not currently used in developing countries because
they are too expensive to establish, difficult to maintain and too demanding in
terms of needed qualified personnel. Of the remaining three methods, the simplest
and easiest to use and implement is the Grade Ratio Model. This approach,
however, is applicable only for countries where repetition is negligible or not
19 For more information about this research see Cuadra (1989).

30
existant, which is not the case of most developing countries. This leaves us with
only two viable options to estimate flow rates in cases where repetition is
common. One is the Grade Transition Model, which provides accurate description
of how students move through a cycle of education in cases where reliable data
are available on enrollment and repetition by grade. Because of it's simplicity
and low data requirement, this is the most widely used method. The second is the
Age-Grade Model which is designed for use in cases where data are not available
on repetition, or where such data are very unreliable, and where reliable data
are available on enrollment by grade and by age. However, this method is more
difficult to use than the Grade Transition Model because it demands much more
data and requires the use of a computer.
Given that flow rate estimates obtained using the Grade Transition Model
are so dependent on reliable repetition data, the reliability of this information
should be evaluated before using this method. There are some crude techniques
which, based on data already available in most ministries of education, can be
used for this purpose. One of these consists of estimating the difference between
the gross and the net enrollment ratios and to use this difference as a gross
indicator of the overall level of repetition for the counltry. Note, however, that
this is a crude indicator of overall repetition that should not be used in
countries where late entrance is common. However, in countries where many
students enter late, this indicator will overstate repetition because all overage
students will be counted as repeaters. The problem is further complicated if
dropout is related to repetition. For example, if the propensity to drop out is
higher among repeaters than among non-repeaters, the difference between gross and
net enrollment ratios will, other things equal, tend to under-estimate
repetition.
Another technique to assess the reliability of repetition data in countries
with high admission rates is to estimate the apparent intake rate20 for a period
of approximately 10 years and to use this estimate to assess the quality of the
reported repetition data for Grade 1. As a general rule, if the value of this
20 The apparent intake rate is the ratio of new-entrants to the number ofchildren in the admission age group.

31
rate remains above, say, 110% during most of this period and there are good
reasons to believe that the enrollment and population estimates are reliable,
then there is a strong indication that repetition in Grade 1 is under-reported.
If repetition rates are deemed unreliable while accurate data are available
on enrollment by age and grade, then the Age-Grade Method can be used to estimate
transition rates. If age-grade data are not available, there is still the
possibility of estimating transition rates using linear programming models which
in many cases only require data on enrollment by grade for a few consecutive
years. Computation algorithms and programs for use on personal computers are
available for some such models2 1. These programs are not only user friendly but
also require minimum knowledge of the principles governing linear programming.
Notwithstanding these qualities, these linear programming software are still not
extensively used in educational planning either because they are in their
developing stages and have not been disseminated well, or because educational
planners do not feel comfortable using models where the computation algorithms
do not seem fully transparent. While the quality of repetition data remains poor,
these models are a very good and inexpensive instrument for estimating transition
rates.
21 See Schiefelbein E. and Schiefelbein R. (1988) and Crouch, L.(fortheoming)

32
APPENDIX I
Formal Description of the Age-Grade Reconstructed Flow Method
The computations described above can be represented by the following set
of mathematical relationships22:
The model starts by calculating the number of repeaters of age a, in Grade
6 at time t as:
R(6,t,a) - r( 6 ) * E(Bt-,,a&-)
where r(6) is an assumed value.
Then we calculate the total number of students promoted from
grades 5 to 6 as follows:
we first check if E(5,t-1,a-1) + R(6,t,a) >- E(6,t,a), if this is
true then:
P(S,t,a) - E(s6t,a) - Rc6,t,a) otherwise,
P(6,t,a) w E(5,t-l,a-1)
Nowi, if Ec5,t-,l,l) + R(6,t,a) =< E(6,t,a), then we need
to compute the number of new entrants into sixth grade, which will be equal
to:
N(6,t,a) - E(6,t,a) - P(6,t,a) - R(6,t,a)
Then we calculate the number of non-promoted from the
earlier grade in the previous year as the difference between
the enrollment and promotees. This is represented as:
NP(g-l,t-l,a-1) E E(l t-lj a-1) - P(gt,a)
22. These relationships are described in Schiefelbein and Grossi (1985) andCrouch (1988).

33
To calculate the number of repeaters we check if:
NP(s&_,t-l,a-1) <- E(g-lt,a) if this is not the case
then the repeaters are set to:
R(g-l,t-l,a-1) - E(g-,t,a) if this is the case then we
must first compute the dropout rate which is estimated as a fixed
proportion of the non-promoted. This proportion is an assumed
value which is set at the same level for all the grade. This is
represented as:
D(Sg_,t.1,a-1) - pd*NP(g 1,t.l,a-l) where pd is a
constant with a value less than one.
When NPl,tl,al) <- E ,ta) then the total number
of repeaters is computed as a residual in the following way:
R(s_1,t-l,a-1) - 1 - D(g_.l ,t-1.,a-l)
The number of repeaters calculated in this way is then used to compute the
number of students promoted from the previous grade in the same manner as it was
dnne for the sixth grade, then, the number of new entrants and non-promoted are
chus calculated following the same rule. The iteration continues up until the
first grade.
Grade 1 is the last grade in the series of iterations. Therefore this grade
cannot have promotees from a previous grade. In fact, the promotees to this grade
are new-entrants to the grade. To calculate the new-entrants in Grade 1 the
method operates as follows:

34
we must first check if R(1,t a) -< E(l.t a) If this is true then:
N(l,t,a) E(l,t,a) - Rc1,t,a) otherwise,
N(1,t,a) 0 0
APPENDIX II
Table 14: Promotion, Repetition and Dropout Rates in 1983Estimated Using the Grade Transition Model
BURKINA FASO(*) BELGIUM HONDURASGrade Prom Rep Drop Prom Rep Drop Prom Rep Drop
Gr 1 83.7% 13.0% 3.3% 78.7% 9.5% 11.8% 54.1% 27.3% 18.6%Gr 2 79.6% 13.2% 7.2% 80.7% 14.6% 4.7% 72.4% 15.8% 11.8%Gr 3 78.3% 15.5% 6.2% 78.1% 17.7% 4.2% 75.4% 12.1% 12.5%Gr 4 77.0% 14.8% 8.2% 77.3% 19.8% 2.9% 79.2% 8.8% 12.0%Gr 5 79.7% 16.3% 4.0% 74.6% 21.6% 3.8% 84.2% 6.0% 9.8%Gr 6 55.7% 44.3% 0.0% 79.5% 20.5% 0.0% 98.0% 2.0% 0.0%
(*) 1982
Table 15: Cohort Survival in 1983 as EstimatedUsing the Grade Transition Model
COHORT SURVIVAL RATESGrade BURKINA FASO(*) BELGIUM HONDURAS
Grade 1-2 96.1% 86.9% 74.5%Grade 2-3 91.7% 94.4% 86.1%Grade 3-4 92.6% 94.9% 85.8%Grade 4-5 90.3% 96.4% 86.8%Grade 5-6 95.2% 95.1% 89.6%
Graduating 70.4% 71.1% 42.8%
(*) 1982

35
R E F-E R E N C E S
Chapman, David W. and Roger Boothroyd. "Threats to Data Quality in DevelopingCountry Settings." ComRarative Education Review, 32 (4): 416-429, 1988.
Cocco, I. A Model for Projecting Primary Scnool Enrolment Ratios: Applicationsof the Logistic Function. In UNESCO. Methods of Projecting SchoolEnrolment in Developing Countries. Paris: UNESCO, 1976.
Crouch, Luis. "Two Methodologies for Estimating Student Flow Rates." Cambridge:BRIDGES, RGsearch Report Series, No. 6, Dec., 1989.
. "A Simplified Linear Programming Approach to the Estimation of Enrollmentand Transition Rates: Estimating Rates with Minimum Data Availability."In, Economics of Education Review. (Forthcoming).
Crouch, L., S. Moreland, E. Cuadra, and N. McGinn. "A User's Guide to the Systemfor Tracking Educational Progress (STEP)." Research Triangle Institute andHarvard University, BRIDGES Project, August 1988.
Cuadra, Ernesto. "Development of a System for Tracking Primary Education inCentral America: Final Report." Cambridge: Harvard Institute forInternational Development, BRIDGES Project, 1988.
Indicators of Student Flow Rates in Honduras: An Assessment of anAlternative Methodology. Harvard University, BRIDGES, Research ReportSeries, No.6 Dec., 1989.
Davis, Russell G. Planning Education for Development: Volume II. Models andMethods for Systematic Planning of Education. Cambridge, MA:USAID/HARVARD, 1980.
Fredriksen, B. "The use of Flow Models for Estimating the Future SchoolEnrolment in Developing Countries. In UNESCO. Methods of Projecting SchoolEnrolment in DeveloRing Countries. Paris: UNESCO, 1976.
. "Internal Efficiency of School Systems. A Study in the Use of Pupil FlowModels for Developing Countries." NUPI Rapport No. 78. Oslo: NorskUtenrikspolitisk Institutt, January 1983(a).
. "Statistics on Education in Developing Countries: An Introduction toTheir Collection and Analysis." NUPI Rapport No. 80. Oslo: NorskUtenrikspolitisk Institutt. February 1983(b).
' "Methods of Analyzing and Projecting Education Statistics in Zambia.'NUPI Rapport No. 86. Oslo: Norsk Utenrikspolitisk Institutt, July 1984.
"An Introduction To The Analysis of Student Enrollment and FlowsStatistics." PHREE Background Paper No. 91/39, Washington D.C.: WorldBank, June 1991.

36
Holmes, C.T. "Grade Level Retention Effects: A Meta-Analysis of ResearchStudies." In, Shepar, L.A. and Smith, M.L. (Eds) Flunking Grades: Researchand Policies on Retention. New York: The Falmer Press, 1989.
International Bureau of Education (IBE). Wastage in Education: A World Problem.Paris: UNESCO/IBE, 1971.
Kendall, W. L. Statistics of Education in DeveloRing Countries: An Introductionto their Collection and Presentation. Paris: UNESCO, 1968.
Lindgren-Hooker, B. "Statistical Methods in Analyzing Enrolment, Student Flowsand Efficiency - With Applications to Asian Statistical Data." In UNESCO.Methods of Projecting School Enrolment in Developing Countries. Paris:UNESCO, 1976.
Sammak, A. "School Enrolment Coding Systems." In. UNESCO. Statistical Methodsfor Improving the Estimation of Repetition and Drop-Out: TwoMethodological Studies. Paris: UNESCO, 1981, pp. 95-113.
Schiefelbein, Ernesto. "R,peating: An Overlooked Problem in Latin AmericanEducation." Comparative Education Review, 19(3), 1975, pp. 468-487.
"Metodos Para Examinar Antecedentes Sobre Repetici6n." La Educaci6n.Afho XXIII, No. 81, 1979, pp. 9-37.
Repetition: The Constraint For Reaching Universal Primary Education InLatin America. In Major Proiect in the Field of Education in Latin Americaand The Caribbean, Santiago, Chile: OREALC/Unesco, April, 1989.
and Russell G. Davis. "Methods of Estimating Enrollment Flow Rates: AnInstructional Unit." In Russell G. Davis, Planning Education forDeveloRment: Volume 1I. Models and Methods for Systematic Planning ofEducation. Cambridge, MA: USAID/HARVARD, 1980, pp. 121-149.
and M. C. Grossi. "Statistical Report on Repetition in Latin America." InUNESCO. Statistical Methods for ImRroving the Estimation of Repetition andDrop-Out: Two Methodological Studies. Paris: UNESCO, 1981, pp. 1-94.
, I. Molfino, H. Martinez, and M. C. Grossi. "Simulating Historical andFuture Trends of an Educational System with the SMMG: The Case ofGuatemala." Washington, D.C.: World Bank, 1985.
Thonstad, T. "Estimating Educational Flows and Transition Rates from IncompleteData: a Brief Survey." In UNESCO. Methods of Proiecting School Enrolmentin DeveloRing Countries. Paris: UNESCO, 1976.
UNESCO. A Statistical Study of Wastage at School. Paris, UNESCO-IBE, 1972
Analyzing and Projecting School Enrolment in Developing Countries: AManual of Methodology. UNESCO, Statistical Reports and Studies #24. Paris,1980.

37
Windham, Douglas M. Indicators of EgLucatlonal Effectiveness and Efficiency.Florida: IEES, Florida State University, 1988.
World Conference on Education for All. World Declaration on Education For Alland Framework for Action to Meet Basic Learning Needs. New York: WCEFA,(UNICEF), April 1990.


![Seismic Monitoring Strategies for Deep Longwall Coal … · Seismic Monitoring Strategies for Deep Longwall Coal ... [2016]. Seismic monitoring strategies for deep longwall coal](https://img.dokumen.tips/doc/110x75/5b40c06e7f8b9a2f138d8854/seismic-monitoring-strategies-for-deep-longwall-coal-seismic-monitoring-strategies.jpg)