Embed Size (px)
Citation preview

DATA BASED DECISION MAKING IN THE RTI PROCESS: WEBINAR #2SETTING GOALS & INSTRUCTION FOR THE GRADE
Edward S. Shapiro, Ph.D.
Director, Center for Promoting Research to Practice, Lehigh University
University Consultant, Response to Instruction and Intervention Initiative for Pennsylvania
Monday, December 8, 2014NYS RtI TAC
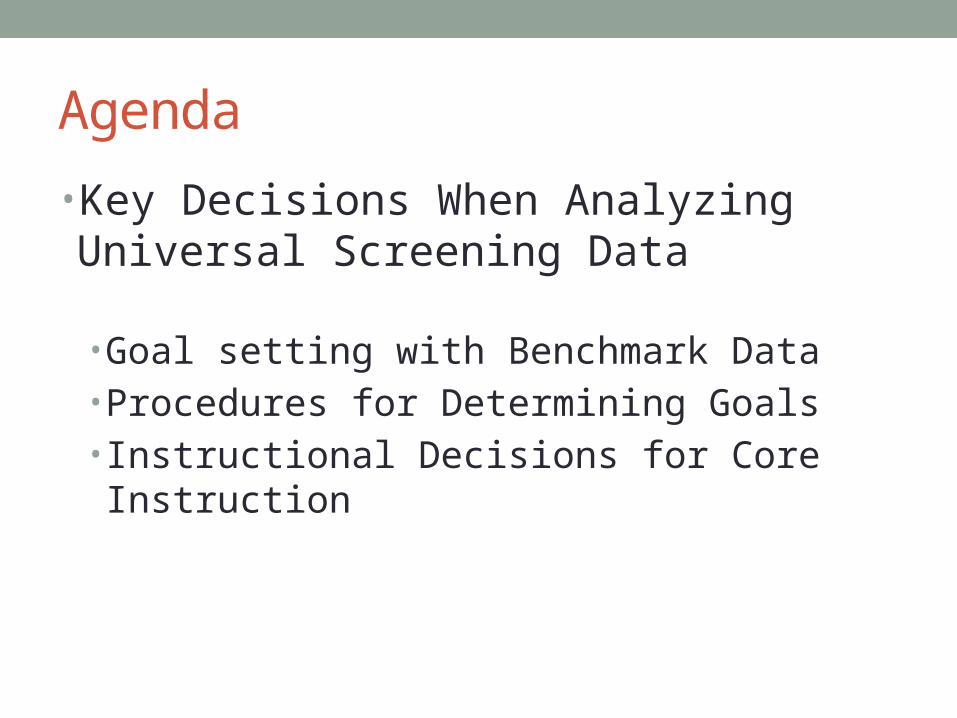
Agenda
• Key Decisions When Analyzing Universal Screening Data
• Goal setting with Benchmark Data• Procedures for Determining Goals• Instructional Decisions for Core Instruction

Without Data…
It’s ONLY An Opinion!
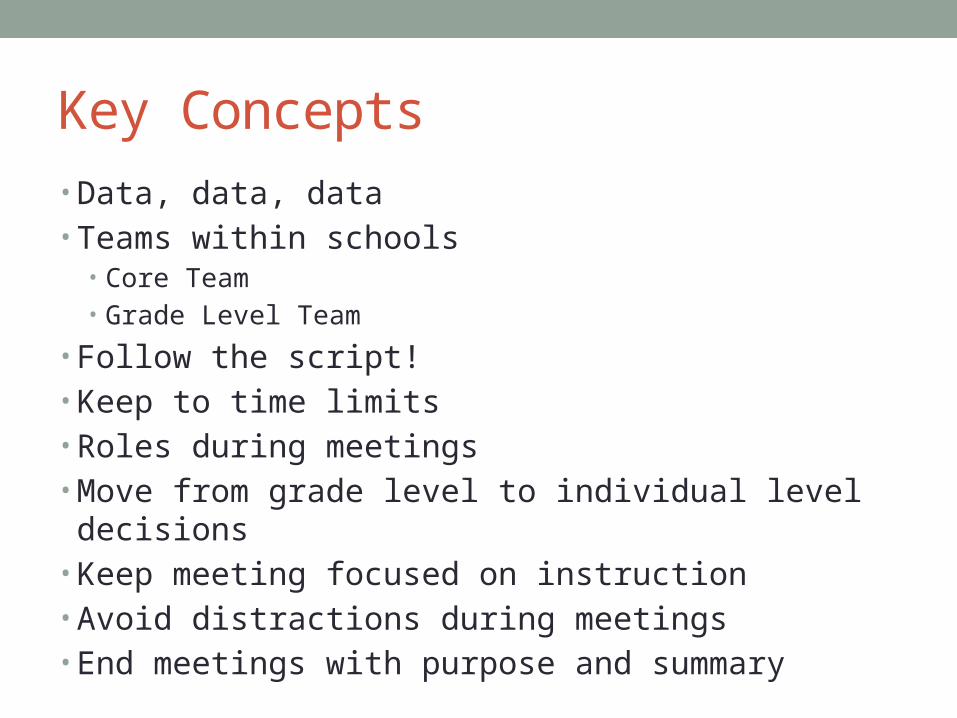
Key Concepts• Data, data, data• Teams within schools
• Core Team• Grade Level Team
• Follow the script!• Keep to time limits• Roles during meetings• Move from grade level to individual level decisions• Keep meeting focused on instruction• Avoid distractions during meetings• End meetings with purpose and summary

During the Meeting1. Team accesses district-provided data sets2. Team identifies current performance of grade level 3. Team sets measurable goal (s)4. Team identifies research-based instructional strategies5. Team analyzes suggested strategies6. Team selects and agrees to implement strategies7. Team plans logistics of strategy implementation8. Team identifies which students will need more frequent
assessment9. Team sets next meeting date
Fall Benchmark Data
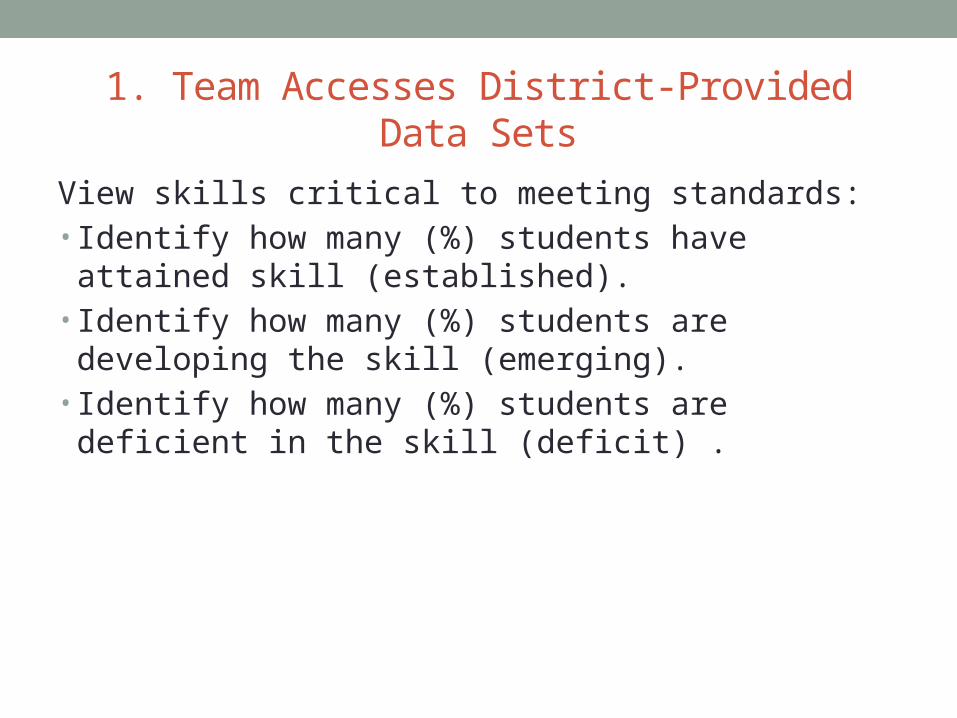
1. Team Accesses District-Provided Data Sets
View skills critical to meeting standards:• Identify how many (%) students have attained skill
(established).• Identify how many (%) students are developing the skill
(emerging).• Identify how many (%) students are deficient in the skill
(deficit) .
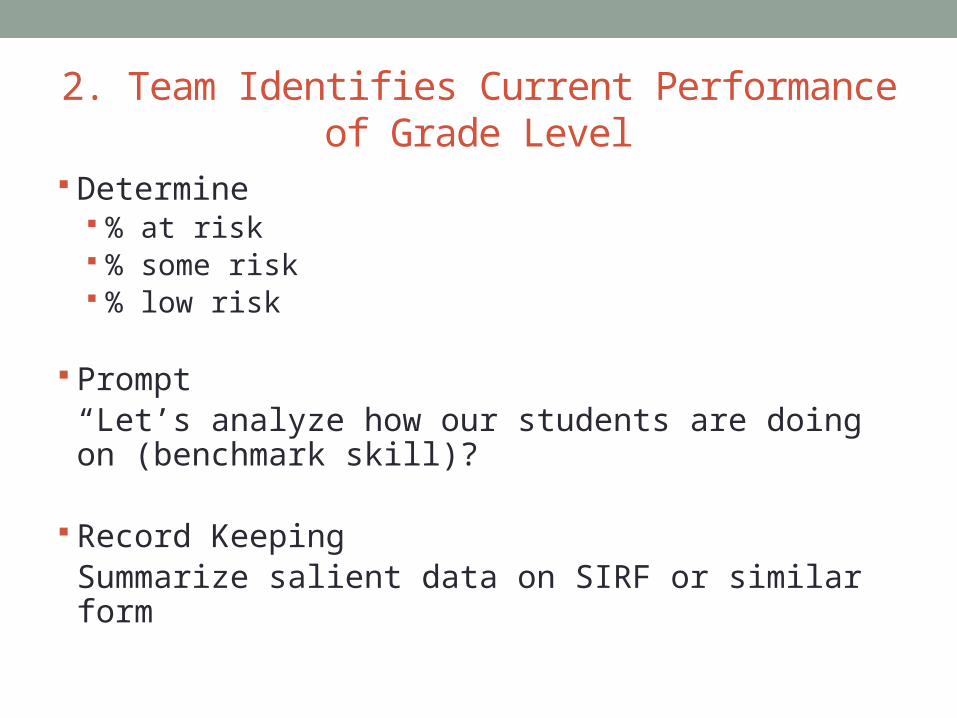
2. Team Identifies Current Performance of Grade Level
Determine % at risk % some risk % low risk
Prompt“Let’s analyze how our students are doing on (benchmark skill)?
Record KeepingSummarize salient data on SIRF or similar form
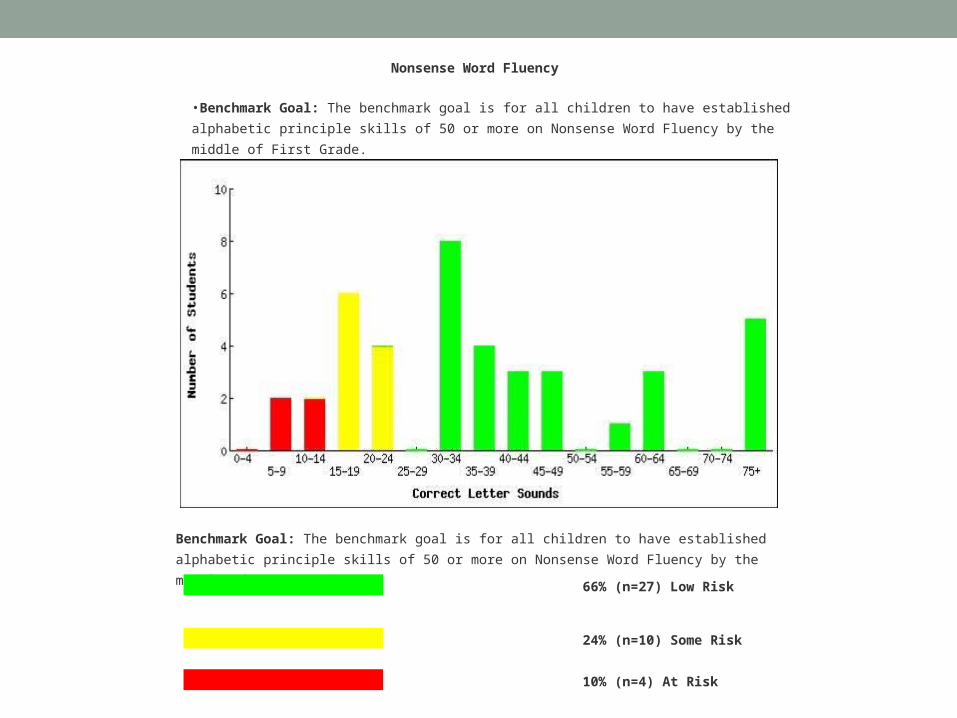
Nonsense Word Fluency
•Benchmark Goal: The benchmark goal is for all children to have established alphabetic principle skills of 50 or more on Nonsense Word Fluency by the middle of First Grade.
Benchmark Goal: The benchmark goal is for all children to have established alphabetic principle skills of 50 or more on Nonsense Word Fluency by the middle of First Grade.
66% (n=27) Low Risk
24% (n=10) Some Risk 10% (n=4) At Risk
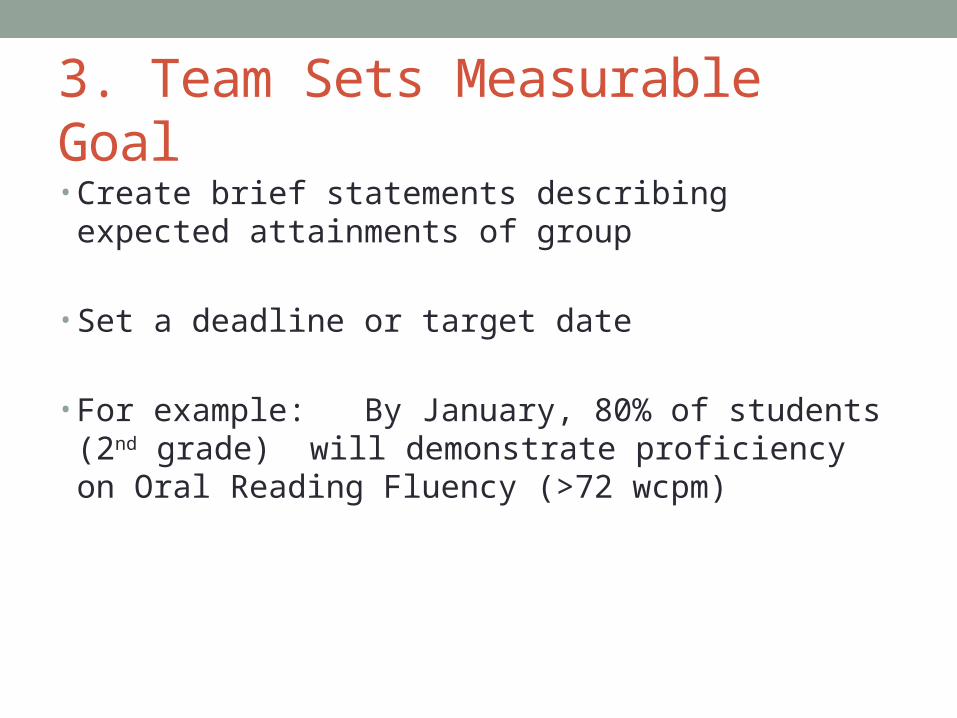
3. Team Sets Measurable Goal • Create brief statements describing expected attainments
of group
• Set a deadline or target date
• For example: By January, 80% of students (2nd grade) will demonstrate proficiency on Oral Reading Fluency (>72 wcpm)
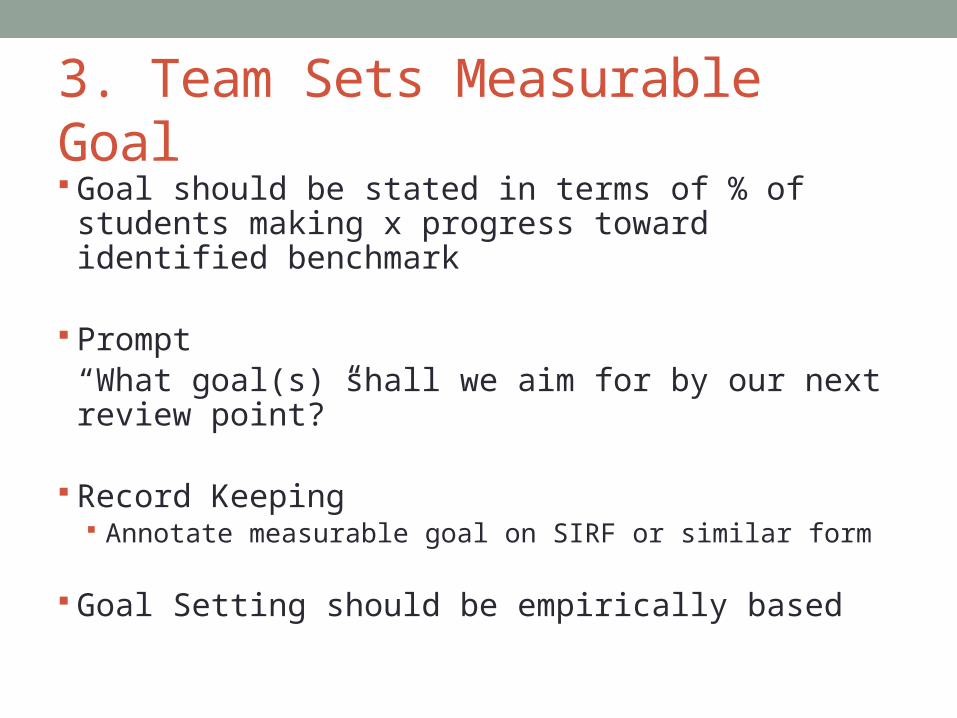
3. Team Sets Measurable Goal Goal should be stated in terms of % of students making x
progress toward identified benchmark
Prompt“What goal(s) shall we aim for by our next review point?”
Record Keeping Annotate measurable goal on SIRF or similar form
Goal Setting should be empirically based
GOAL SETTING WITH BENCHMARK DATA
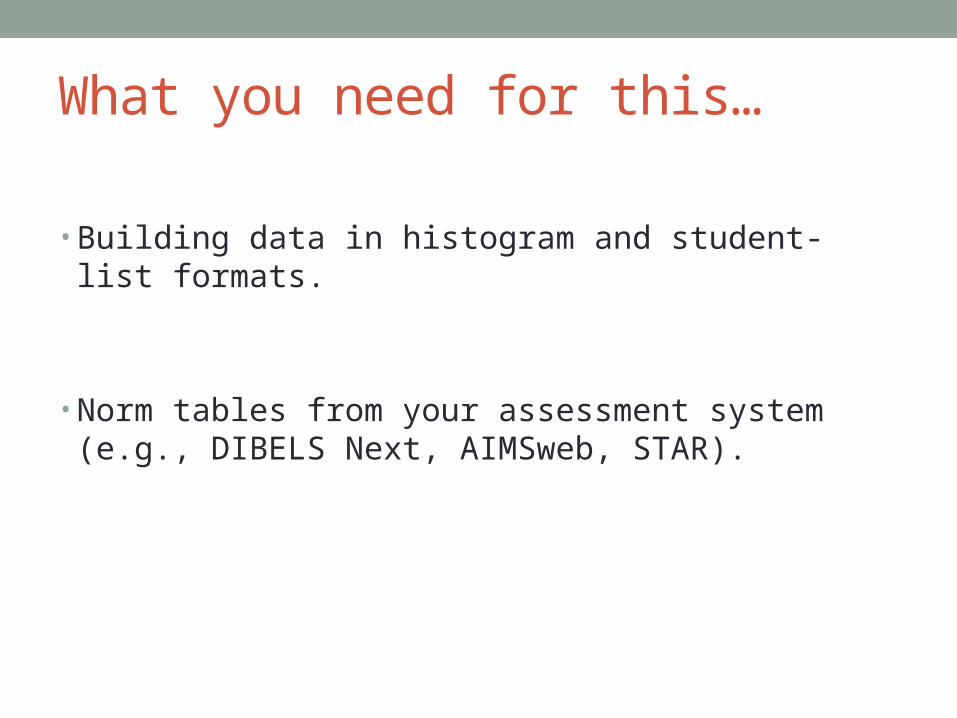
What you need for this…
• Building data in histogram and student-list formats.
• Norm tables from your assessment system (e.g., DIBELS Next, AIMSweb, STAR).

HISTOGRAM
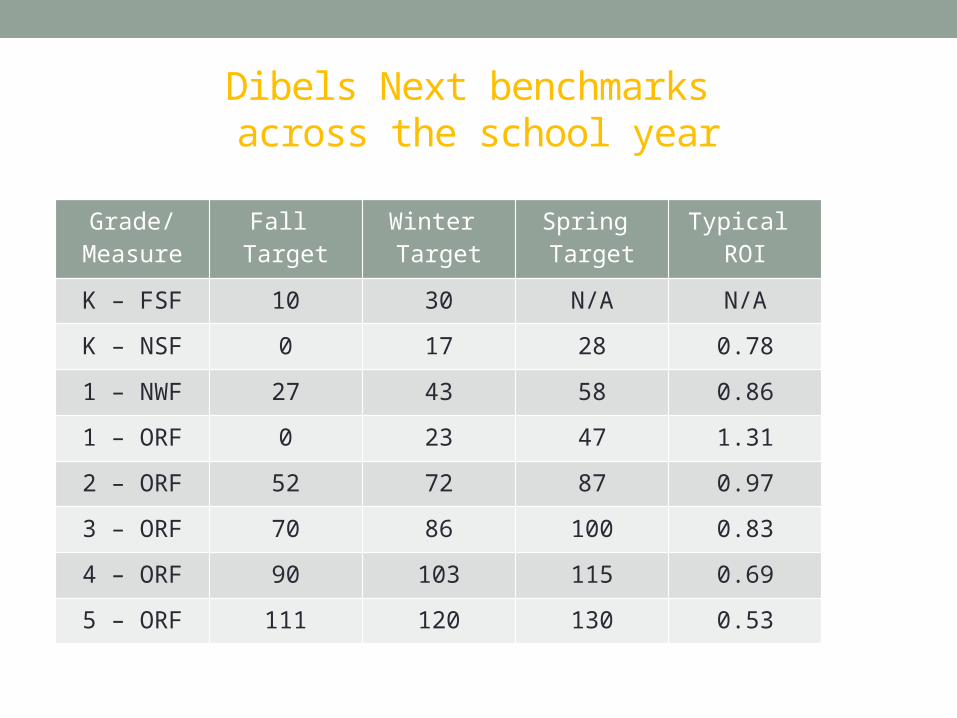
Dibels Next benchmarks across the school year
Grade/Measure
Fall Target
Winter Target
Spring Target
Typical ROI
K – FSF 10 30 N/A N/A
K – NSF 0 17 28 0.78
1 – NWF 27 43 58 0.86
1 – ORF 0 23 47 1.31
2 – ORF 52 72 87 0.97
3 – ORF 70 86 100 0.83
4 – ORF 90 103 115 0.69
5 – ORF 111 120 130 0.53

AIMSWEB NORMS

AIMSweb Norms Expanded – Gr 2
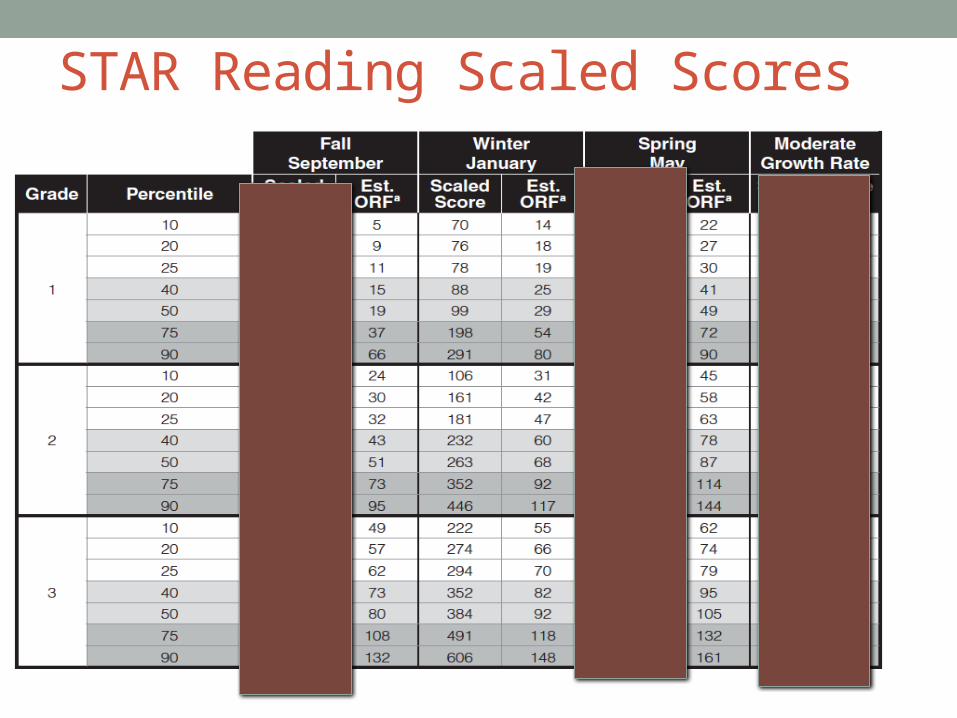
STAR Reading Scaled Scores

Purpose of Procedure Pushing the pile of students toward benchmarks
Set goal for the number of students we hope to move by the next benchmark assessment:
Strategic to benchmark (Some risk to low risk)
Intensive to strategic (At risk to Some risk)
We are looking at groups of students
in each grade level,
not individual students at this point!
PROCEDURE FOR DETERMINING GOALS
A Multi-step Process

(DIBELS Next)
Determine typical ROI Step
1

Grade Level Goal Setting Procedures: Benchmark Charts
1. Determine the average rate of improvement (ROI) of students who start and end at benchmark across the year. Use 50th percentile for students in that grade or the ROI provided by the assessment product for students.
2. For the example in this training, we will use the Dibels Next ROI tables. Works the same for AIMSweb, STAR, or any measure with normative growth data
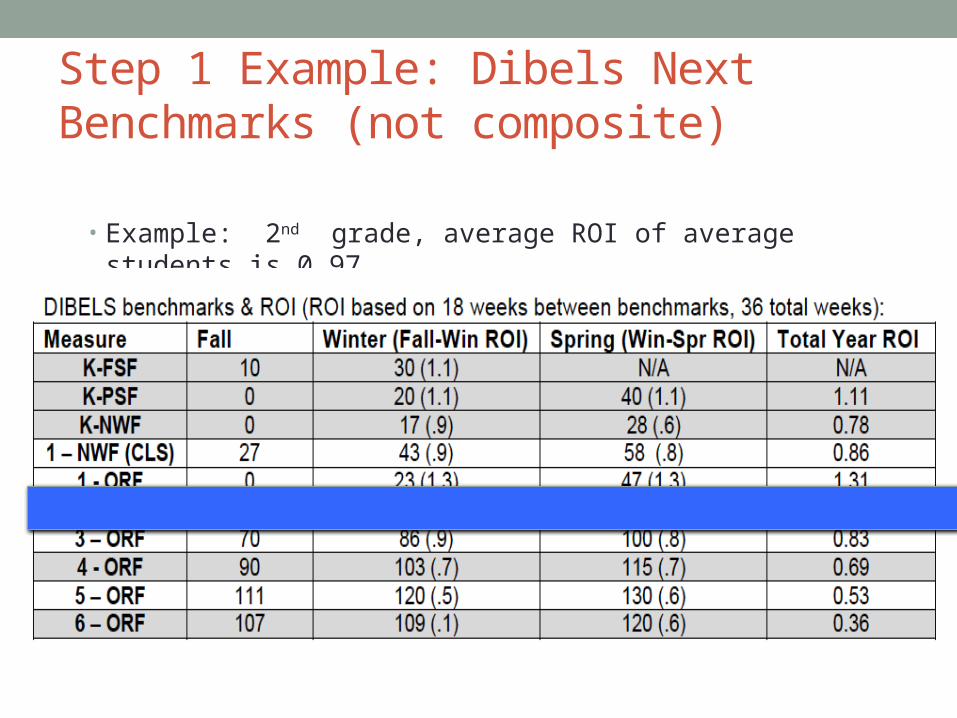
Step 1 Example: Dibels Next Benchmarks (not composite)
• Example: 2nd grade, average ROI of average students is 0.97.
DIBELS Next Example
• Determine target• ROI
Step 2

To Determine the target ROI
• Multiply the ROI by a value of 1.5 or 2
• 1.5 is conservative
• 2 is ambitious
• Team should make decision
• How far below target are students?
• Grade level of students

Why multiply?
We need the target student to learn faster. The rate of improvement needs to exceed the
typical student’s! So if we want to double the student’s rate of
improvement, we would have to multiply by 2. If we want to be a little less ambitious, we would
multiply by 1.5. For all the examples that follow, we will use
the 1.5 multiplier.

Example: Target Rate of Improvement
Multiply the average Rate of Improvement by 1.5.
2nd Grade ORF: 0.97 x 1.5 = 1.46So if typical students have a rate of improvement of 0.97
words correct per minute per week, our plan for these students would be to accelerate their progress to 1.46 WCPM per minute per week.
Grade/Measure
Fall Target
Winter Target
Spring Target
Typical ROI
2 – ORF 52 72 87 0.97

Typical benchmark time is 18 weeks
(fall to winter – winter to spring).
• Determine • Expected• Gain
Step 3

Expected Gain
Multiply expected rate of improvement x number of weeks to the next benchmark =
Expected gain (EG) in the target measure
Example: 2nd Grade EG for ORF: 1.46 x 18 = 26.3 ( round to 26)
So, we now expect the target students to gain 26 WCPM in the next 18 weeks.
• Calculate the• Cut-off • Score
Step 4
Typical benchmark time is 18 weeks (fall to winter – winter to spring).
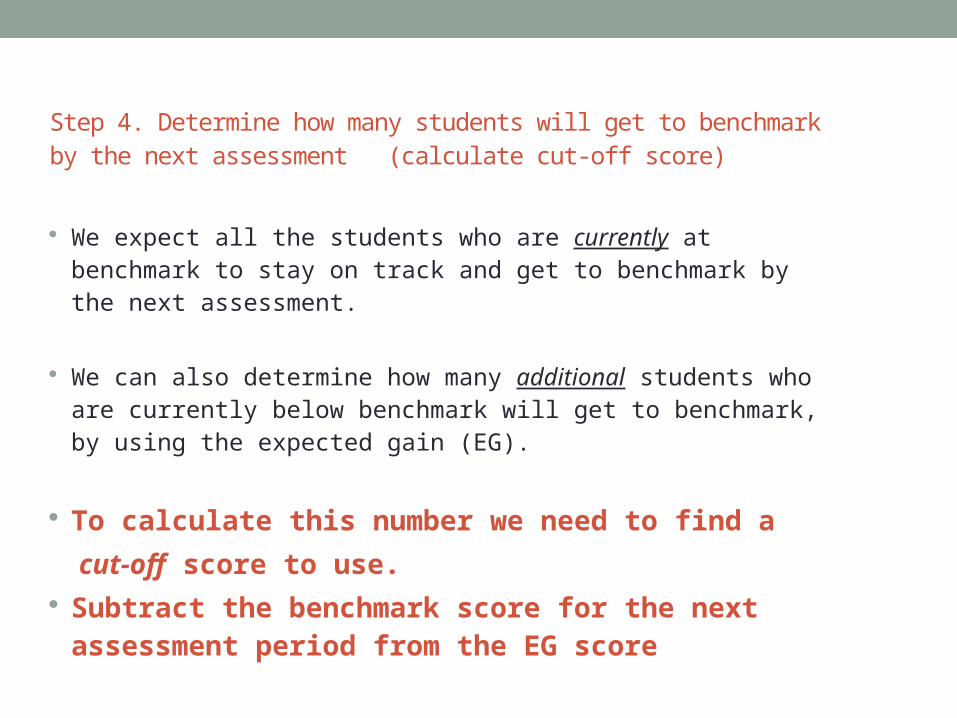
Step 4. Determine how many students will get to benchmark by the next assessment (calculate cut-off score)
We expect all the students who are currently at benchmark to stay on track and get to benchmark by the next assessment.
We can also determine how many additional students who are currently below benchmark will get to benchmark, by using the expected gain (EG).
To calculate this number we need to find a
cut-off score to use. Subtract the benchmark score for the next
assessment period from the EG score

Benchmark for Winter
Grade/Measure
Fall Target
Winter Target
Spring Target
Typical ROI
2 – ORF 52 72 87 0.97
Winter Benchmark – Expected Gain = Cut Score
(72 – 26 = 46 is the cut off score)
Count the number of students from the Cut-off score
• Determine how many
• Students need to• get to benchmark
Step 5

So, how many students would this be?
• Consult a list of outcomes of individual students
• Determine the number of students who are at the strategic level who are reading at or above the cut-off score calculated in step 4.
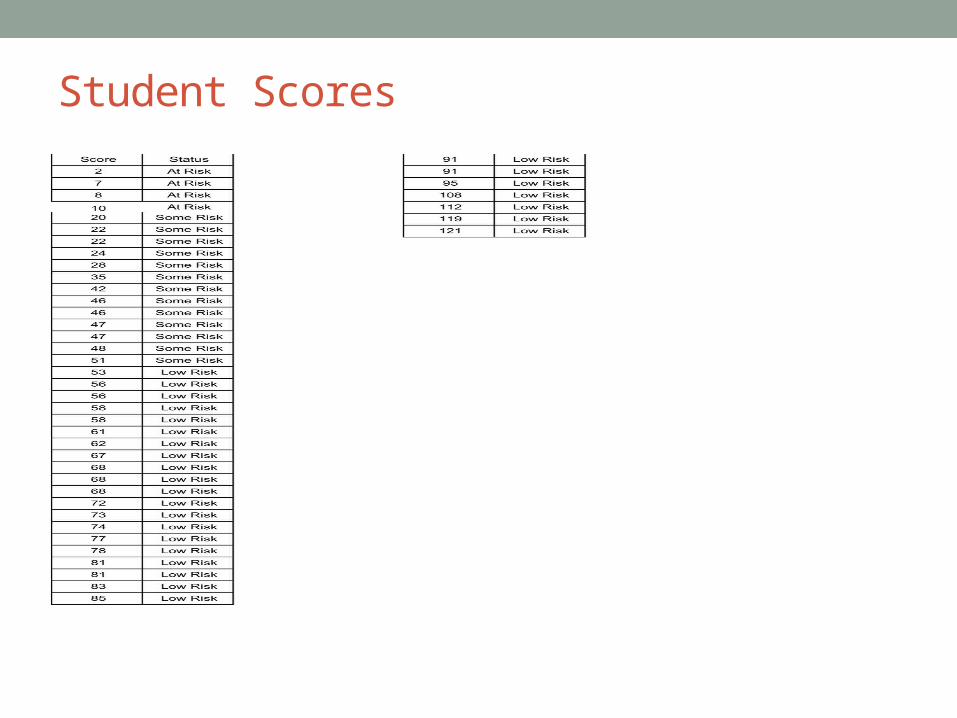
CUT-OFF
Score
(46)
6 between 46 and 52
Fall61.4% Low Risk
30.2% Some Risk
9.1% At Risk
Student Scores
Number of students
• The cut-off score gives you the starting place to count the number of additional students who are expected to reach benchmark by the next assessment.
• Add this number to the number of students already at benchmark to give the total number expected to reach benchmark.

Rule: Calculating Goal for moving strategic to benchmark
• Count every student with a score above the ‘cut-off’ to determine the expected benchmark group.
Percentage Calculation
• Convert the number • of students you • expect to reach • benchmark to a • percentage•
Step 6
Calculating goal
Example…from the cut-off score of 46, the number of students from that number through benchmark is 6 + those from 52 (benchmark +=27) = 33
To convert this number to a percentage of students divide this number by the total number of students at the grade level.
33 Divided by 44 ( total students) =75.0 %.
75.0% should be your target goal of students at benchmark for the winter assessment.
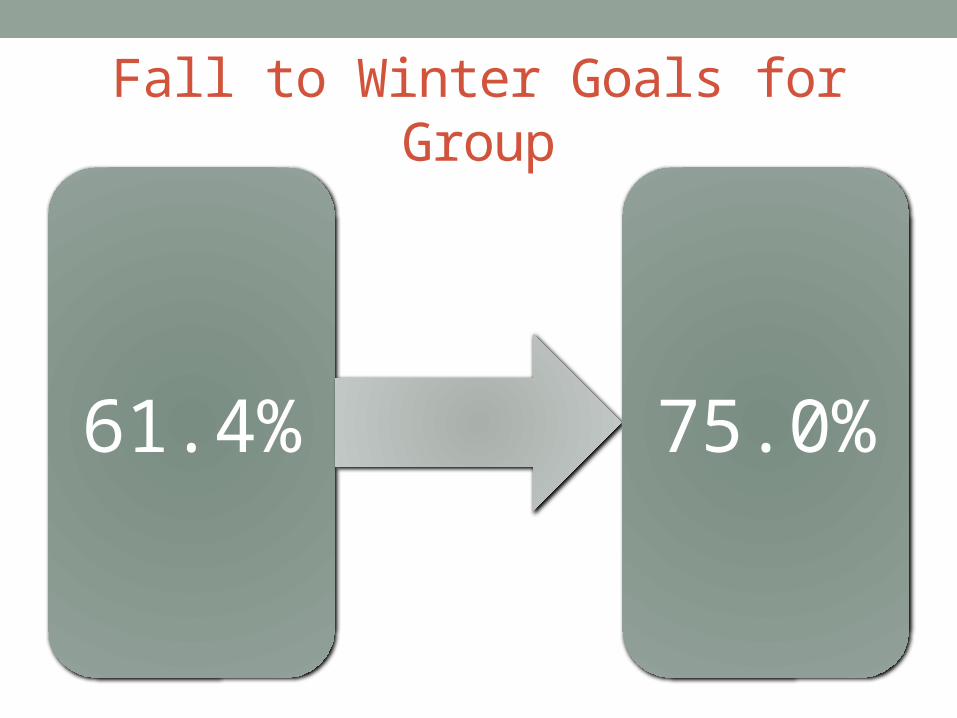
Fall to Winter Goals for Group
61.4% 75.0%
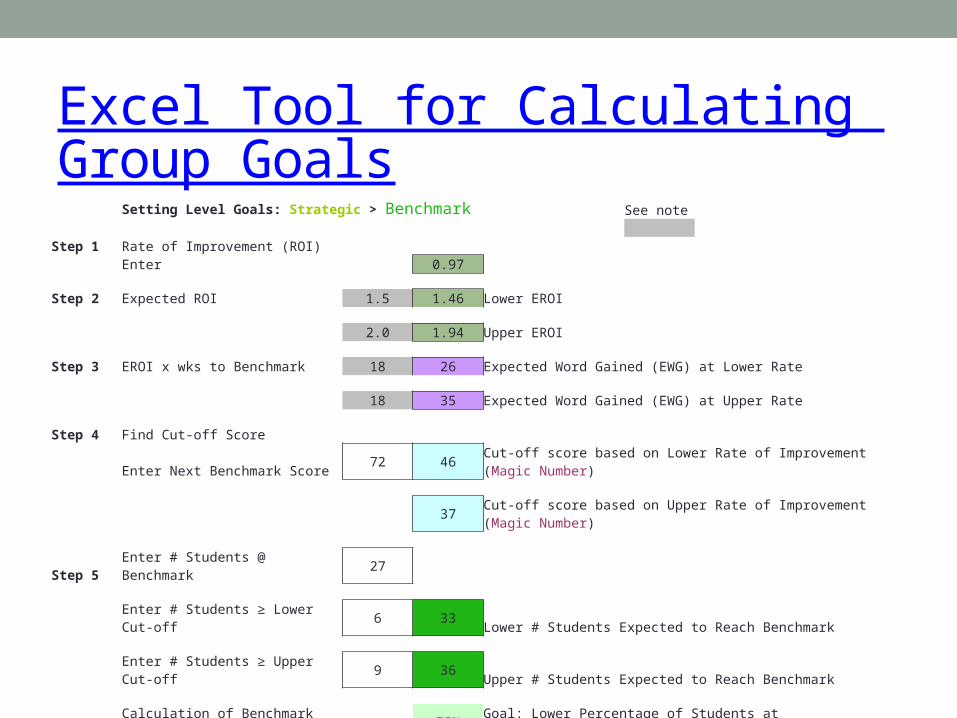
Excel Tool for Calculating Group Goals
Setting Level Goals: Strategic > Benchmark See note
Step 1 Rate of Improvement (ROI)Enter 0.97
Step 2 Expected ROI 1.5 1.46 Lower EROI
2.0 1.94 Upper EROI
Step 3 EROI x wks to Benchmark 18 26 Expected Word Gained (EWG) at Lower Rate
18 35 Expected Word Gained (EWG) at Upper Rate
Step 4 Find Cut-off ScoreEnter Next Benchmark Score 72 46 Cut-off score based on Lower Rate of Improvement (Magic Number)
37 Cut-off score based on Upper Rate of Improvement (Magic Number)
Step 5 Enter # Students @ Benchmark 27
Enter # Students ≥ Lower Cut-off 6 33 Lower # Students Expected to Reach Benchmark
Enter # Students ≥ Upper Cut-off 9 36 Upper # Students Expected to Reach Benchmark
Step 6 Calculation of Benchmark Goal 75% Goal: Lower Percentage of Students at BenchmarkEnter Total 44# of Students 82% Goal: Upper Percentage of Students at Benchmark

4. Team Selects Instructional Strategies
• With goal in mind, teachers identify specific strategies for teaching to the target skill• E.g., Need for attention to close reading for deep comprehension• E.g., Need for attention to new vocabulary embedded in story• E.g., Need for reflection on reading non-fiction
• Can use existing known strategies
• Keep focused on scientifically validated strategies
5. Team Analyzes Suggested Strategies
Analyzes according to: Strategy should be research-based Strategy should be practical Curricular materials should be available to implement strategy (or
easily made).
Prompt“Let’s rate these strategies. Which ones have good research base? Of those, which ones are most practical? What materials do we have available? What materials do we need?”
Record KeepingAnnotate newsprint of ideas
6. Team selects and agrees to implement strategies
Prompt
“Based on what we see on the display, what’s our choice for the best strategy(ies)?”
Record Keeping
Write an explicit description of the strategy on the SIRF

7. Team plans logistics of strategyLogistics of implementation
Team assists all teachers in learning strategy using peer modeling and coaching grade-level discourse regarding implementation assistance by specialists (for demonstration of strategies only).
Team identifies instructional materials
Team plans for self-monitoring of use of strategy
Time to create/adapt materials
Strategies for teaching strategies to novice teachers

7. Team plans logistics of strategy continued…
Record Keeping
Prompt “What do we need to do as a team to make this really happen for
our students?” “What do we have to do to ensure we all use this strategy as
planned?” “Who can help us with implementation?” “How will we know that we are on track?”
Annotate the SIRF or other forms with “to-do’s”
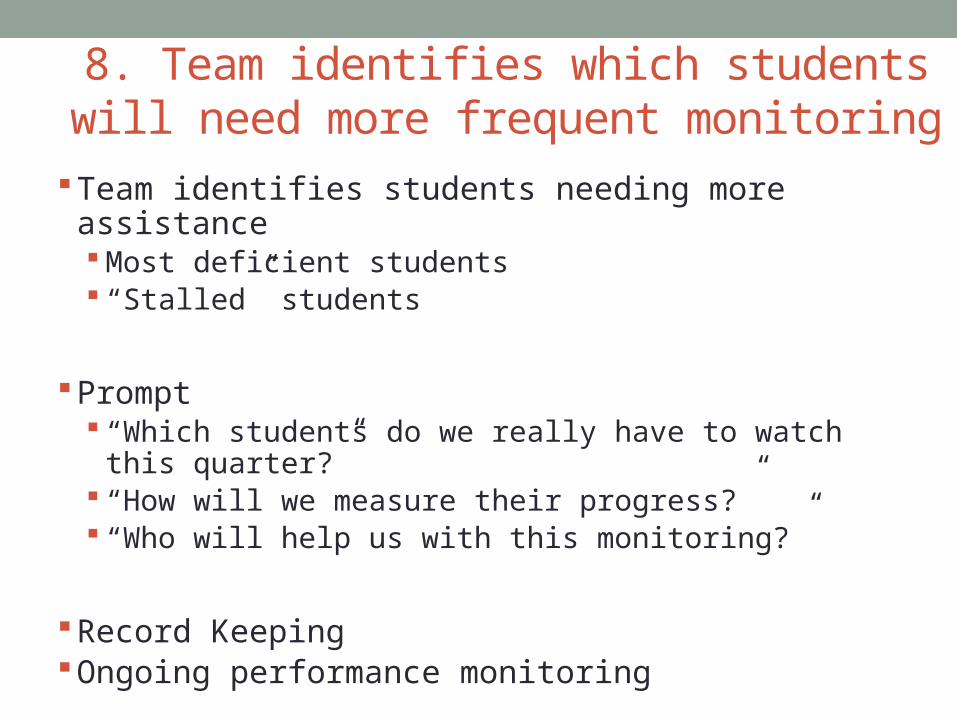
8. Team identifies which students will need more frequent monitoring
Team identifies students needing more assistance Most deficient students “Stalled” students
Prompt “Which students do we really have to watch this quarter?” “How will we measure their progress?” “Who will help us with this monitoring?”
Record KeepingOngoing performance monitoring

9. Team sets next meeting date Prompt “When shall we meet again to review our
progress?”
Record Keeping
Annotate next date on SIRF
Interim Steps (Between meetings)
Monitor fidelity of intervention
Monitor students’ progress
Change (fine-tune) strategy (requires team meeting)

Who goes to Tier 2? Tier 1? Tier 3?
• Use data to identify students
• Use decision rules established at local level
• Annotate the decisions

End day 2• Next Webinar- Monday, December 15, 2014• 4 – 5:30 pm
• Key Decisions When Analyzing Progress Monitoring Data• Rate of Improvement: What It Is and How to Calculate It• Using ROI to Determine Student Response