Embed Size (px)
Citation preview

Data Analysis

Time spent in the light
0
10
20
30
40
50
60
70
80
90
1 2 3 4 5 6
Tim
e s
pe
nt
in t
he
lig
ht
(min
)
A tank was set up so that half of it was lit and the other half was dark. Six different species of animals were placed in the tank and monitored for 100 minutes. The amount of time they spent in the light was recorded.
What type of graph would be most appropriate for this data set?Which animal (s) are probably nocturnal?Why else (other than being nocturnal) may animals #2 and #5 have spent very little time in the light?

A town was surveyed to see what types of pets were most common. What type(s) of graphs would
be appropriate to show this data?
Dogs
Cats
Gerbils
Rabbits
Lizards
Fish
Pets
What type of pet was most common?Approximately what percent of pets were dogs?What type of pet was least common?
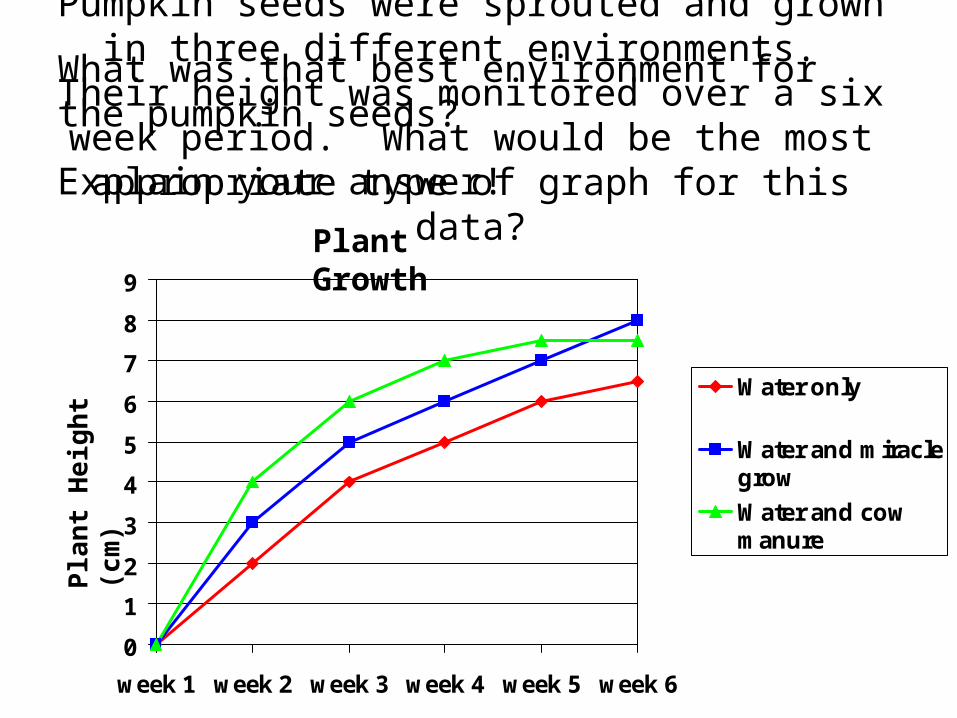
Pumpkin seeds were sprouted and grown in three different environments. Their height was
monitored over a six week period. What would be the most appropriate type of graph for this data?
0
1
2
3
4
5
6
7
8
9
week 1 week 2 week 3 week 4 week 5 week 6
Water only
Water and miraclegrow
Water and cowmanure
Plant Growth
Pla
nt
He
igh
t (c
m)
What was that best environment for the pumpkin seeds?
Explain your answer!

Insects have a waxy coating that protect them from drying out. Grasshoppers
were raised in four different temperature environments. After they molted (shed
their exoskeletons), their wax was tested to determine its melting point. What is the most appropriate type of graph for
this data?
0
5
10
15
20
25
30
35
40
45
20 oC 34oC 36oC 42oC
Wax Layer Melting Point
Temperature of the insect’s environment
Tem
per
atu
re t
hat
wax
mel
ted
(oC
)What was the melting point of the wax of the insects raised in a 34oC environment?What is the relationship between environment temperature and wax melting point?
Why would it be detrimental to an insect in a warm environment to have wax that melts at a lower temperature?

The number of students in the class with As, Bs, Cs, Ds and Fs was recorded. What is/are the most
appropriate type of graph(s) for this data set?
0
2
4
6
8
10
12
Grades
Nu
mb
er
of
Stu
de
nts
A B C D F
How many students are passing the class?What is this type of distribution called?What is the most common grade?
Grades
A
B
C
D
F
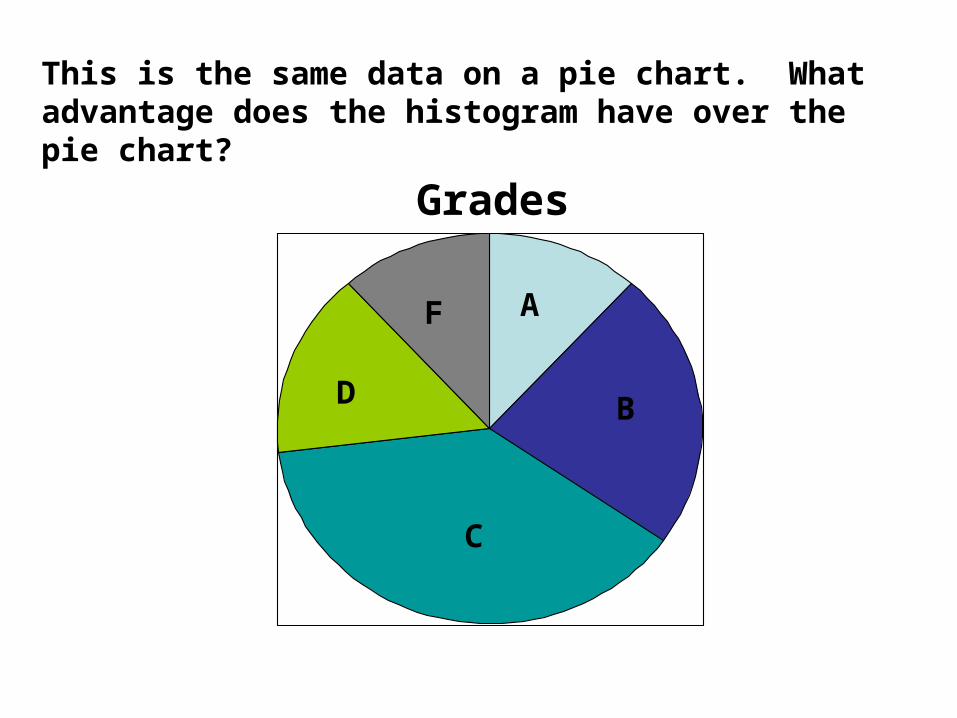
This is the same data on a pie chart. What advantage does the histogram have over the pie chart?
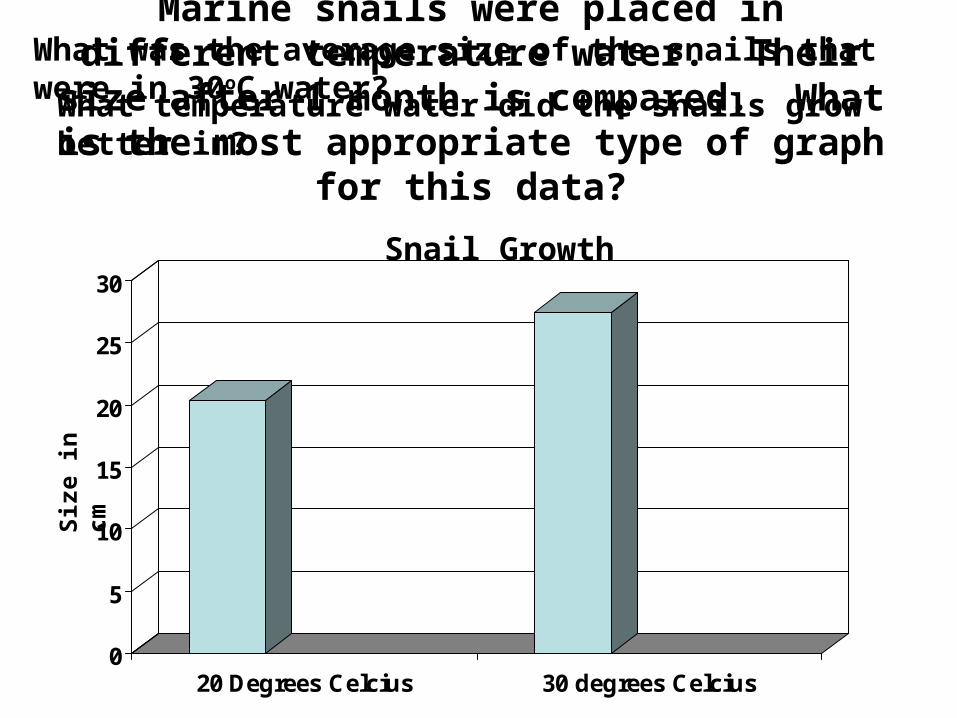
Marine snails were placed in different temperature water. Their size after 1 month is compared. What is the most appropriate type
of graph for this data?
0
5
10
15
20
25
30
20 Degrees Celcius 30 degrees Celcius
Siz
e in
cm
Snail Growth
What was the average size of the snails that were in 30oC water?What temperature water did the snails grow better in?

Some snails were grown in water that also contained shrimp. Otherwise, the conditions were identical.
Their size after 1 month is compared. What is the most appropriate type of graph for this data?
26
26.5
27
27.5
28
28.5
29
29.5
30
with shrimp without shrimp
Siz
e in
cm
Snail Growth
Did the snails grow bigger with or without shrimp?What might have caused the observed results?
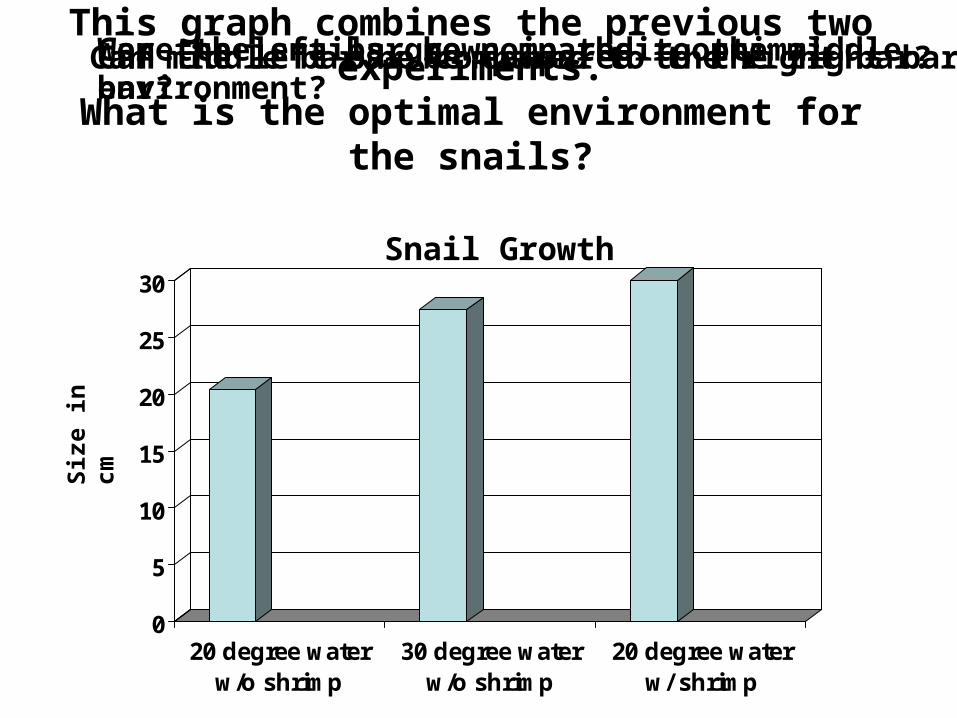
This graph combines the previous two experiments.
What is the optimal environment for the snails?
0
5
10
15
20
25
30
20 degree waterw/o shrimp
30 degree waterw/o shrimp
20 degree waterw/ shrimp
Siz
e in
cm
Snail Growth
Can the left bar be compared to the middle bar?Can the left bar be compared to the right bar?Can middle bar be compared to the right bar?Were the snails grown in their optimal environment?
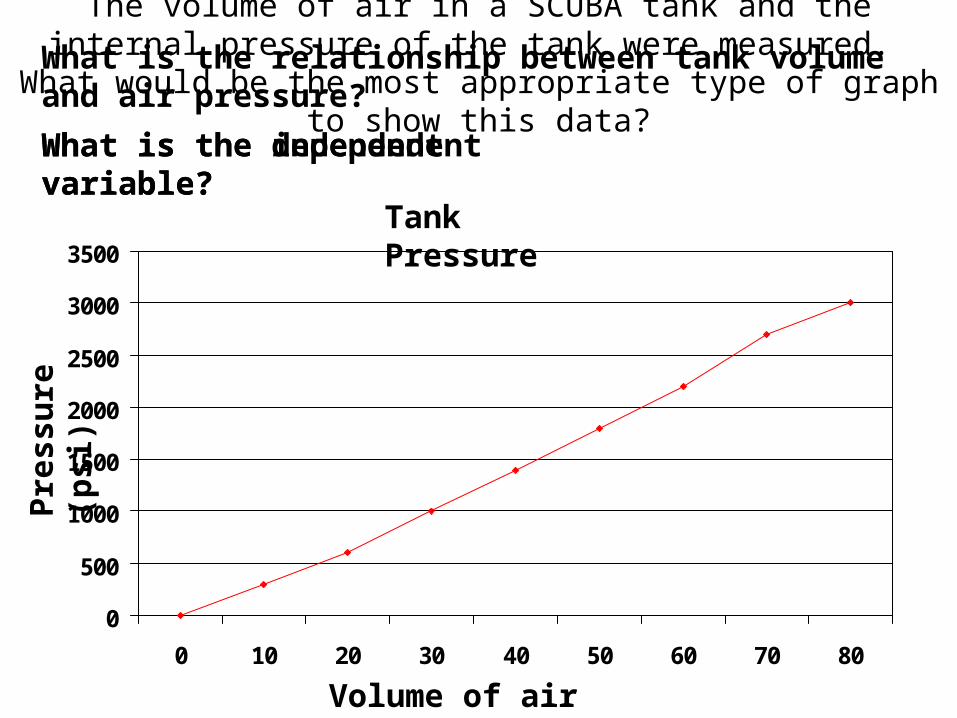
The volume of air in a SCUBA tank and the internal pressure of the tank were measured. What would be the most appropriate
type of graph to show this data?
0
500
1000
1500
2000
2500
3000
3500
0 10 20 30 40 50 60 70 80
Tank Pressure
Volume of air (liters)
Pre
ssu
re (
psi
)
What is the independent variable?What is the dependent variable?
What is the relationship between tank volume and air pressure?

Graphing Growth Rate DataAge in years Males – height in cm Females – height in cm
5 109 109
7 119 119
9 133 133
11 138 145
13 157 160
15 169 162
17 177 162
19 177 163
1. Is there any part of your graph that shows the girls being taller than the boys? If there is, circle the area.
2. Who grows taller overall, boys or girls?3. Do humans grow at a continuous rate or in spurts? Explain your answer.4. What may be causing the observed results?

Heights of males and females
Hei
ght i
n cm
Age in years


![Endometrial mesenchymal stem cells as a cell based therapy ......almost half of all medical expenses[1]. In the early 1990s in the United States alone, $400 billion was spent per annum](https://img.dokumen.tips/doc/110x75/603cf7d3c6553567bd29c00d/endometrial-mesenchymal-stem-cells-as-a-cell-based-therapy-almost-half-of.jpg)