Embed Size (px)
Citation preview
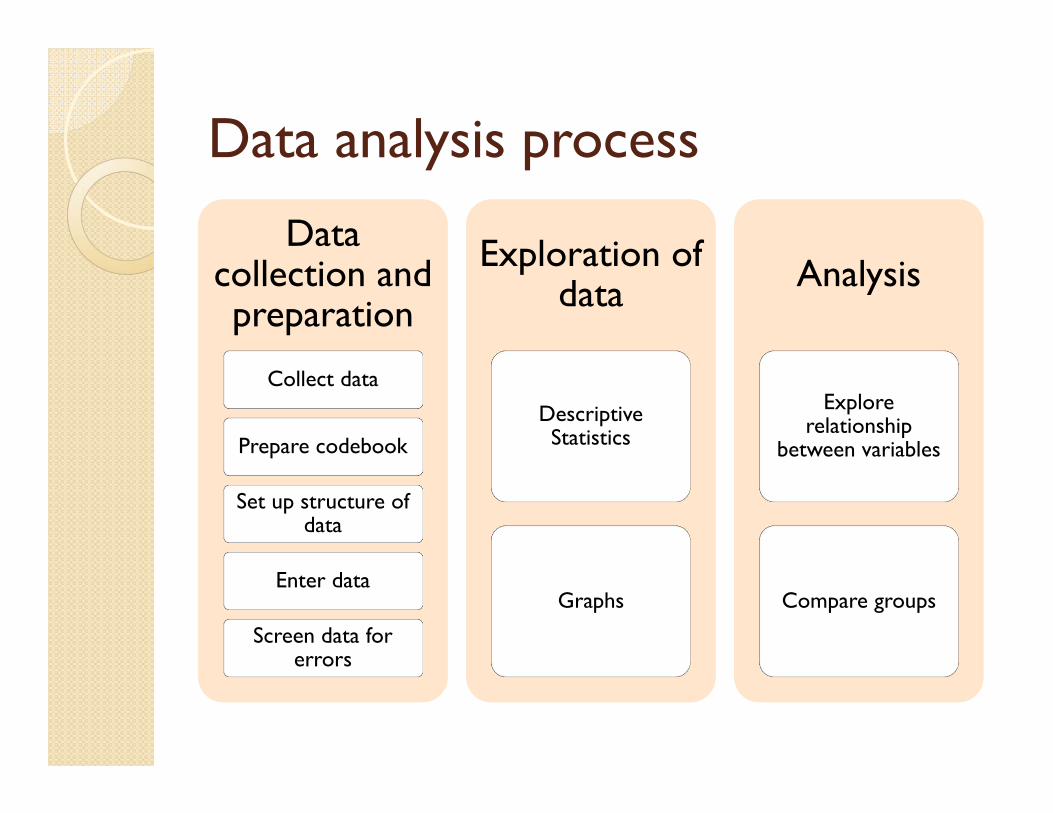
Data analysis process
Data collection and preparation
Data collection and preparation
Collect data
Prepare codebook
Set up structure of data
Enter data
Screen data for errors
Exploration of data
Exploration of data
Descriptive Statistics
Graphs
AnalysisAnalysis
Explore relationship
between variables
Compare groups

Collecting data
Survey Using existing data

PREPARING A DATA FILE
Three steps to
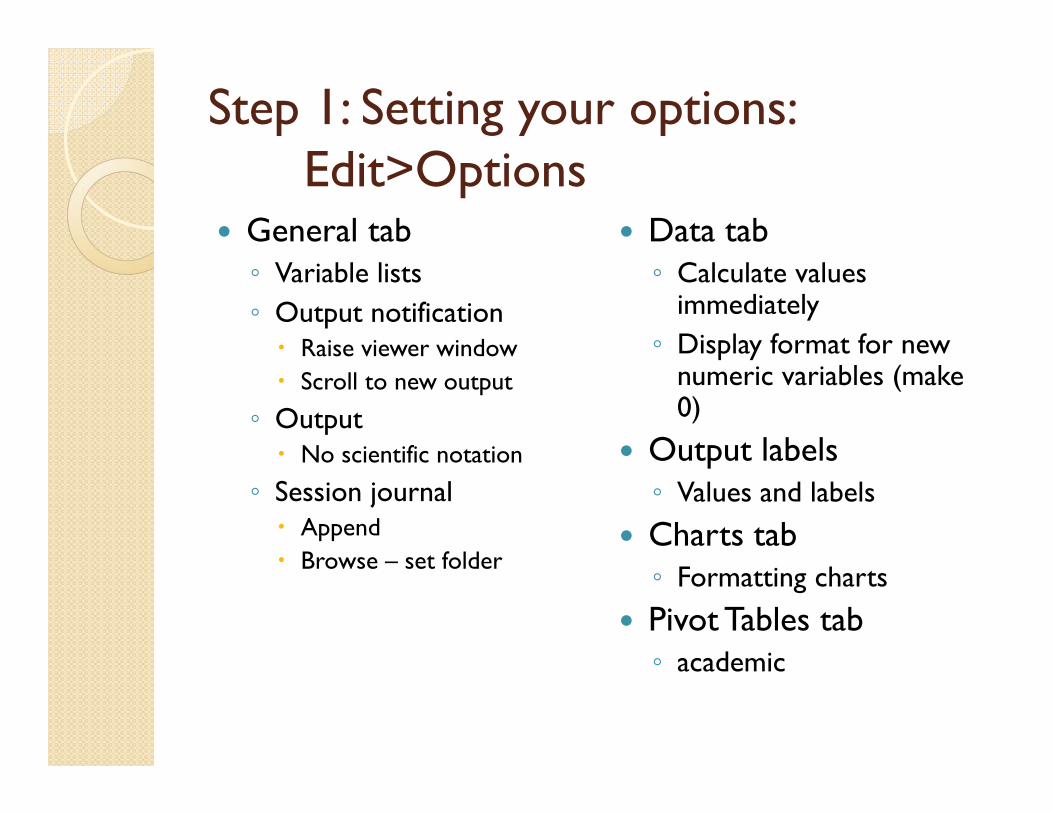
Step 1: Setting your options: Edit>Options
General tab◦ Variable lists◦ Output notification Raise viewer window Scroll to new output
◦ Output No scientific notation
◦ Session journal Append Browse – set folder
Data tab◦ Calculate values
immediately◦ Display format for new
numeric variables (make 0)
Output labels◦ Values and labels
Charts tab◦ Formatting charts
Pivot Tables tab◦ academic

Step 2: setting up the structure of the data fileVariable tab – SPSS codebook Label versus name Types of variables Values of a variable Missing values Type of measurement

Step 3: enter the data
Data view◦ Entering data◦ Opening an existing data set
Using Excel◦ Variable names in the first row◦ Converting to SPSS format
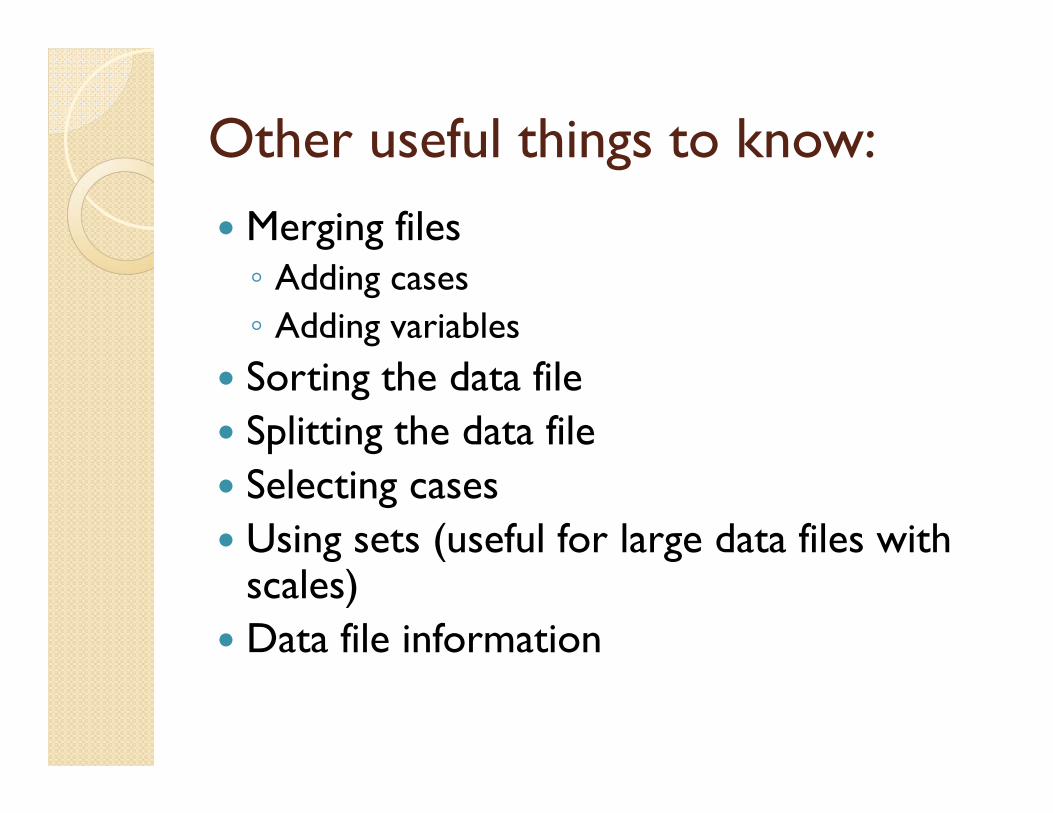
Other useful things to know: Merging files◦ Adding cases◦ Adding variables
Sorting the data file Splitting the data file Selecting cases Using sets (useful for large data files with
scales) Data file information

SCREENING AND CLEANING THE DATA
Two step to
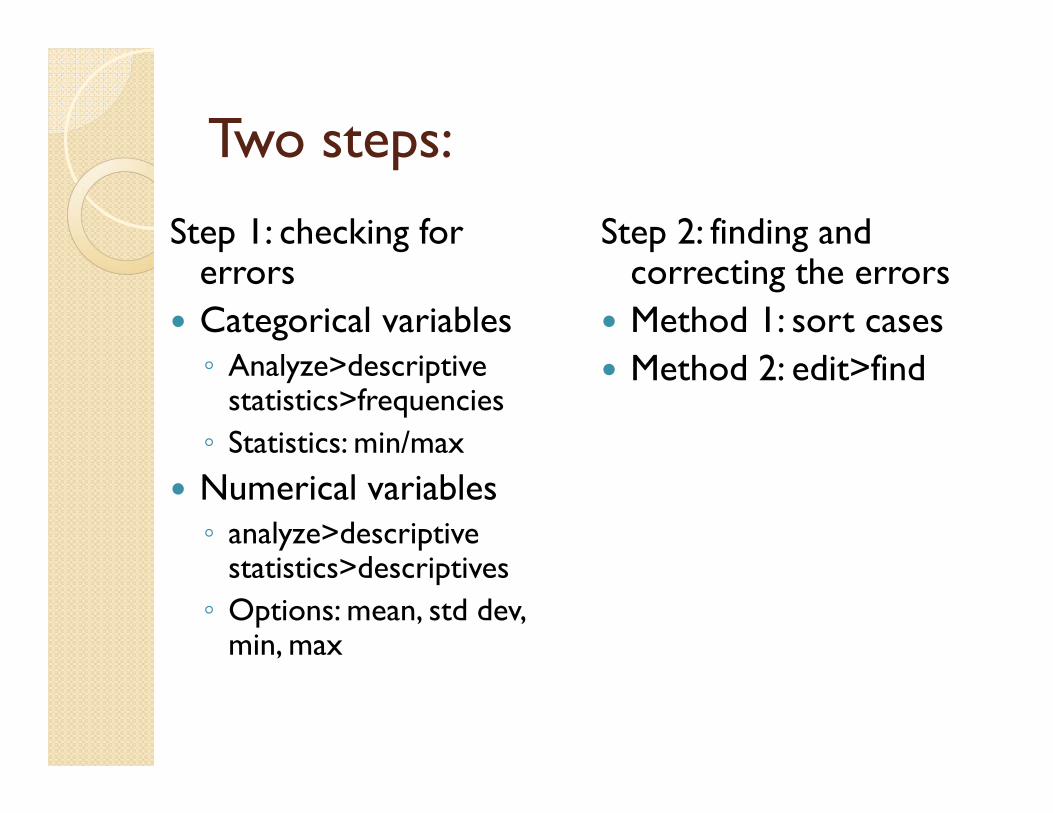
Two steps:
Step 1: checking for errors
Categorical variables ◦ Analyze>descriptive
statistics>frequencies◦ Statistics: min/max
Numerical variables◦ analyze>descriptive
statistics>descriptives◦ Options: mean, std dev,
min, max
Step 2: finding and correcting the errors
Method 1: sort cases Method 2: edit>find

Other useful thing for screening
Case summaries1. Analyze>reports>case summaries2. Choose variables, limit cases to first 1003. Statistics: number of cases4. Options: uncheck subheadings for totals

Data analysis process
Data collection and preparation
Data collection and preparation
Collect data
Prepare codebook
Set up structure of data
Enter data
Screen data for errors
Exploration of data
Exploration of data
Descriptive Statistics
Graphs
AnalysisAnalysis
Explore relationship
between variables
Compare groups
EXPLORATION OF DATA
Descriptive statistics and graphs

Descriptive statistics
Categorical:Frequencies
Numerical:Descriptives: mean standard deviation minimum maximum skewness (symmetry) kurtosis (peakness)

Two potential problems with missing data:
1. Large amount of missing data – number of valid cases decreases – drops the statistical power
2. Nonrandom missing data – either related to respondent characteristics and/or to respondent attitudes – may create a bias
Missing Data

Missing Data Analysis
Examine missing data
By variable By respondent By analysis
If no problem found, go directly to your analysisIf a problem is found:
Delete the cases with missing dataTry to estimate the value of the missing data

Use Analyze > Descriptive Statistics > Frequencies
Look at the frequency tables to see how much missing
If the amount is more than 5%, there is too much. Need analyze further.
Amount of missing data by variable

1. Use transform>count2. Create NMISS in the target variable3. Pick a set of variables that have more
missing data4. Click on define values5. Click on system- or user-missing6. Click add7. Click continue and then ok8. Use the frequency table to show you
the results of NMISS
Missing data by respondent

Use Analyze>descriptive statistics>crosstabs
Look to see if there is a correlation between NMISS (row) and another variable (column)
Use column percents to view the % of missing for the value of the variable
Missing data patterns

Proceed anyway In SPSS Options:◦ Exclude case listwise – include only cases that
have all of the variables◦ Exclude cases pairwise – excludes only if the
variables in the analysis is missing◦ Replace with mean – use at your own risk
What to do about the missing data?

Assessing Normality
Skewness and kurtosis Using Explore:◦ Dependent variable◦ Label cases by – id variable◦ Display – both◦ Statistics – descriptives and outliers◦ Plots – descriptive: histogram, normality plots
with test◦ options – exclude cases pairwise

1. histogram
2. boxplot
Outliers
Other graphs
Bar charts Scatterplots Line graphs
Recoding Calculating When to create a new variable versus
creating a new one.
Manipulating data

Data analysis process
Data collection and preparation
Data collection and preparation
Collect data
Prepare codebook
Set up structure of data
Enter data
Screen data for errors
Exploration of data
Exploration of data
Descriptive Statistics
Graphs
AnalysisAnalysis
Explore relationship
between variables
Compare groups
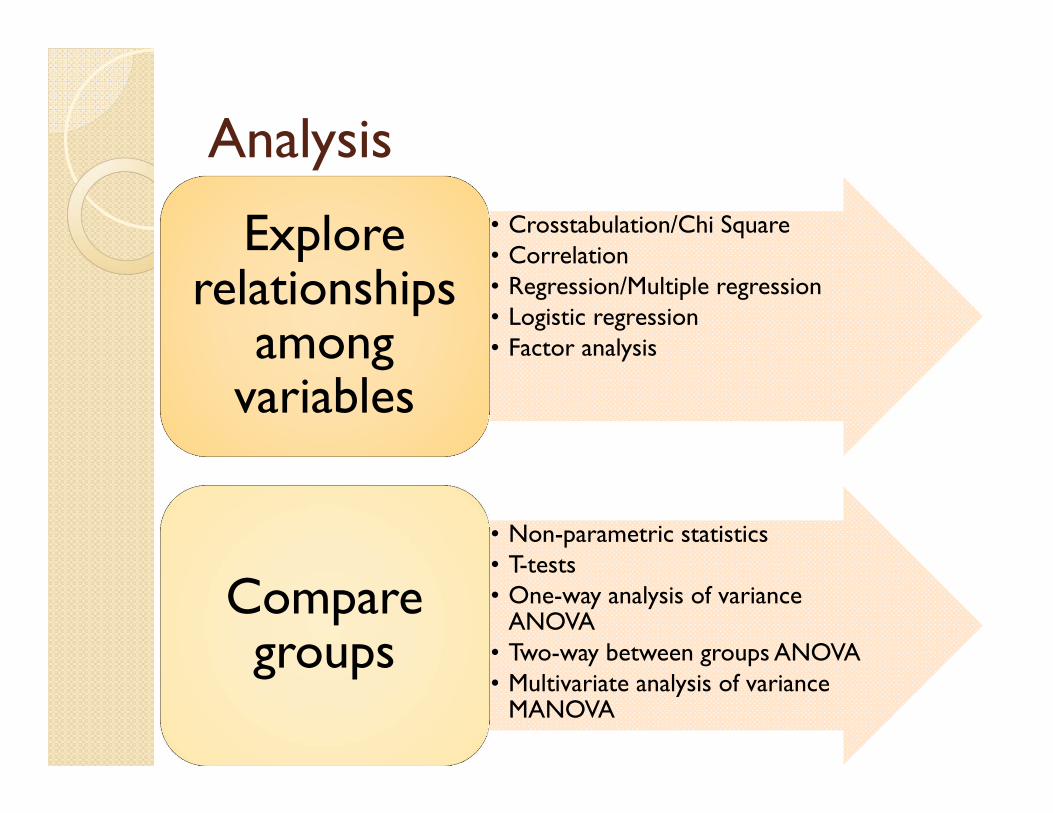
Analysis• Crosstabulation/Chi Square• Correlation• Regression/Multiple regression• Logistic regression• Factor analysis
Explore relationships
among variables
• Non-parametric statistics• T-tests• One-way analysis of variance
ANOVA• Two-way between groups ANOVA• Multivariate analysis of variance
MANOVA
Compare groups

Aim: for categorical data to see the relationship between two or more variables
Procedure:◦ Analyze>Descriptive statistics>Crosstab◦ Statistics: correlation, Chi Square, association◦ Cells: Percentages – row or column◦ Cluster bar charts
Crosstabulation

CorrelationAim: find out whether a relationship exists and
determine its magnitude and directionCorrelation coefficients:
Pearson product moment correlation coefficientSpearman rank order correlation coefficient
Assumptions:relationship is linearHomoscedasticity: variability of DV should remain constant at all values of IV

Partial correlation
Aim: to explore the relationship between two variables while statistically controlling for the effect of another variable that may be influencing the relationship
Assumptions:same as correlation
cab

RegressionAim: use after there is a significant correlation to find the
appropriate linear model to predict DV (scale or ordinal) from one or more IV (scale or ordinal)
Assumptions:sample size needs to be large enoughmulticollinearity and singularityoutliersnormalitylinearityhomoscedasticity
Types:standardhierarchicalstepwise DV
IV1IV2
IV3
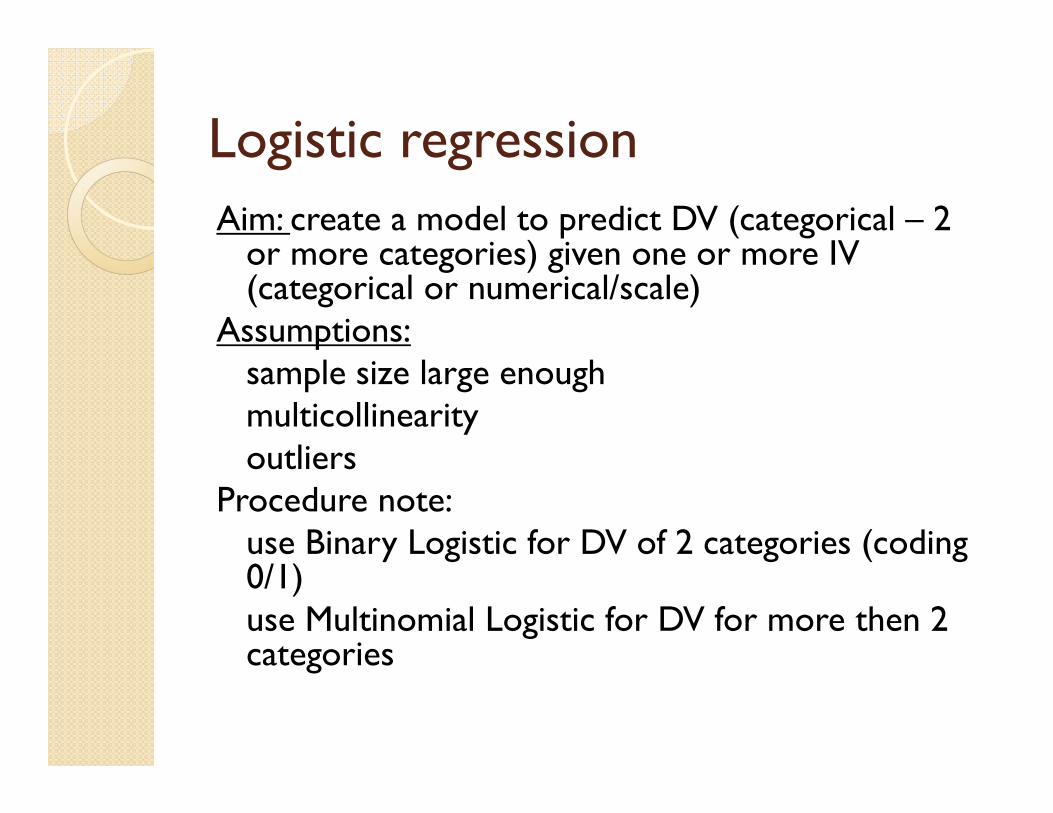
Logistic regressionAim: create a model to predict DV (categorical – 2
or more categories) given one or more IV (categorical or numerical/scale)
Assumptions:sample size large enoughmulticollinearityoutliers
Procedure note:use Binary Logistic for DV of 2 categories (coding 0/1)use Multinomial Logistic for DV for more then 2 categories

Factor analysis
Aim: to find what items (variables) clump together. Usually used to create subscales. Data reduction.
Factor analysis:exploratoryconfirmatory
SPSS -> Principal component analysis

Three steps of factor analysis
1. Assessment of the suitability of the data for factor analysis
2. Factor extraction3. Factor rotation and interpretation

1. Assessment of the suitability
1. Sample size: 10 to 1 ratio2. Strength of the relationship among
variables (items) – Test of Sphericity3. Linearity4. Outliers among cases

Step 2. Factor extraction1. Commonly used technique principal
components analysis2. Kaiser’s criterion: only factors with
eigenvalues of 1.0 or more are retained –may give too many factors
3. Scree test: plot of the eigenvalues, retain all the factors above the “elbow”
4. Parallel analysis: compares the size of the eigenvalues with those obtained from randomly generated data set of the same size
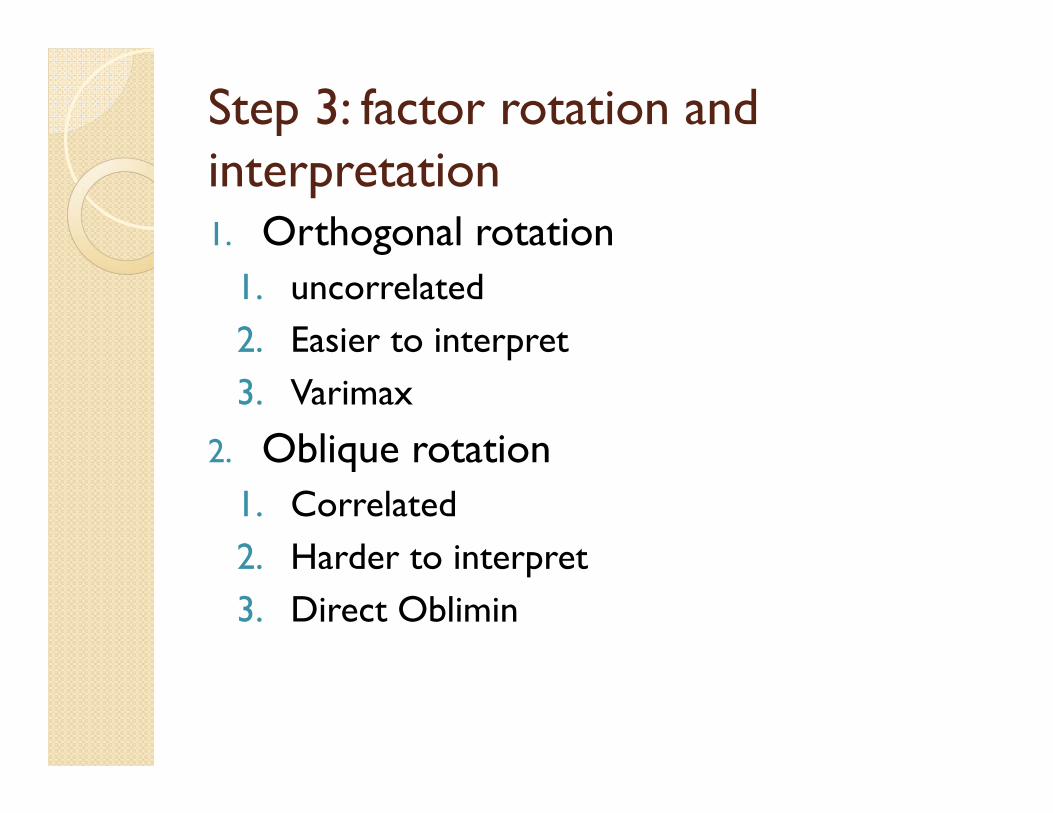
Step 3: factor rotation and interpretation1. Orthogonal rotation
1. uncorrelated2. Easier to interpret3. Varimax
2. Oblique rotation1. Correlated2. Harder to interpret3. Direct Oblimin

Checking the reliability of a scale
Analyze>Scale>Reliability Items Model: Alpha Scale label: name new subscale to be
created Statistics: ◦ descriptives: item, scale, scale if item deleted◦ Inter-item: correlations◦ Summaries: correlations

Analysis• Crosstabulation/Chi Square• Correlation• Regression/Multiple regression• Logistic regression• Factor analysis
Explore relationships
among variables
• Non-parametric statistics• T-tests• One-way analysis of variance ANOVA• Two-way between groups ANOVA• Multivariate analysis of variance
MANOVA
Compare groups

Nonparametric testsNon-parametric techniques Parametric techniques
Chi-square test for goodness of fit None
Chi-square test for independence None
Kappa measure of agreement None
Mann-Whitney U Test Independent samples t-test
Wilcoxon Signed Rank Test Paired samples t-test
Kruskal-Wallis Test One-way between groups ANOVA
Friedman Test One-way repeated measures ANOVA

Aim:Testing the differences between the means of two independent samples or groups
Requirements:◦ Only one independent (grouping) variable IV (ex. Gender)◦ Only two levels for that IV (ex. Male or Female)◦ Only one dependent variable (DV - numerical)
Assumptions:◦ Sampling distribution of the difference between the means is normally
distributed◦ Homogeneity of variances – Tested by Levene’s Test for Equality of
Variances Procedure:◦ ANALYZE>COMPARE MEANS>INDEPENDENT SAMPLES T-TEST◦ Test variable – DV◦ Grouping variable – IV◦ DEFINE GROUPS (need to remember your coding of the IV)◦ Can also divide a range by using a cut point
T-test for independent groups
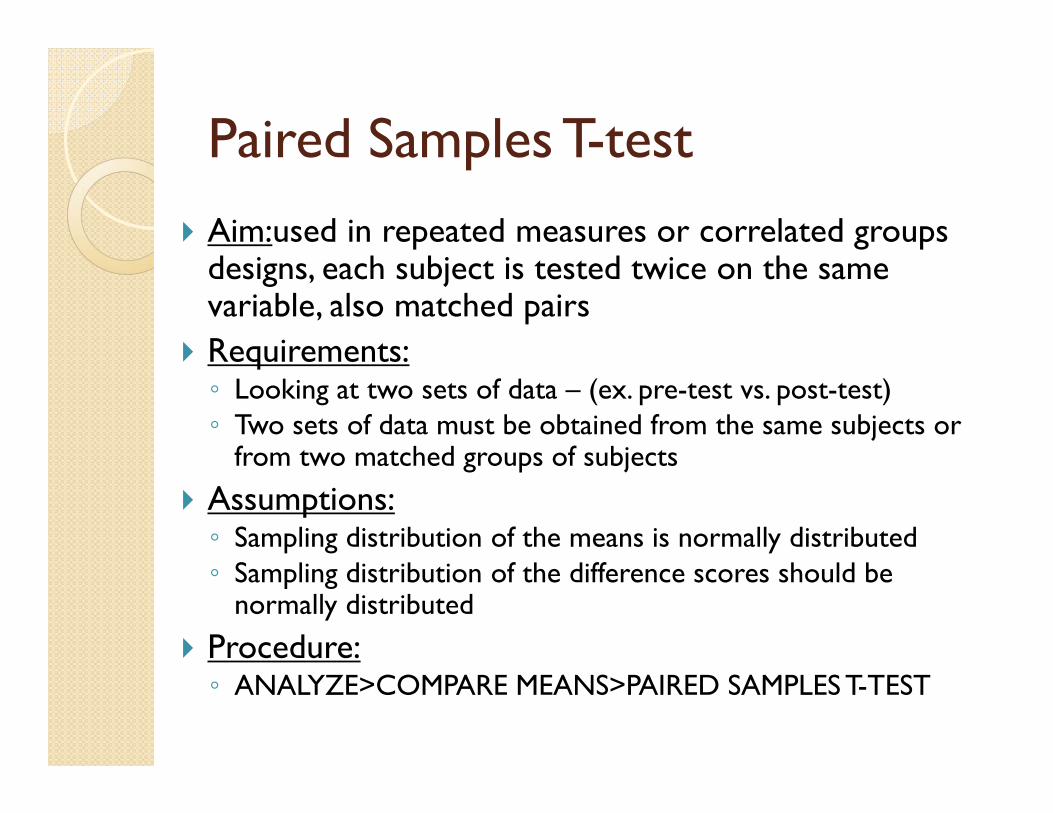
Aim:used in repeated measures or correlated groups designs, each subject is tested twice on the same variable, also matched pairs
Requirements:◦ Looking at two sets of data – (ex. pre-test vs. post-test)◦ Two sets of data must be obtained from the same subjects or
from two matched groups of subjects
Assumptions:◦ Sampling distribution of the means is normally distributed◦ Sampling distribution of the difference scores should be
normally distributed
Procedure:◦ ANALYZE>COMPARE MEANS>PAIRED SAMPLES T-TEST
Paired Samples T-test
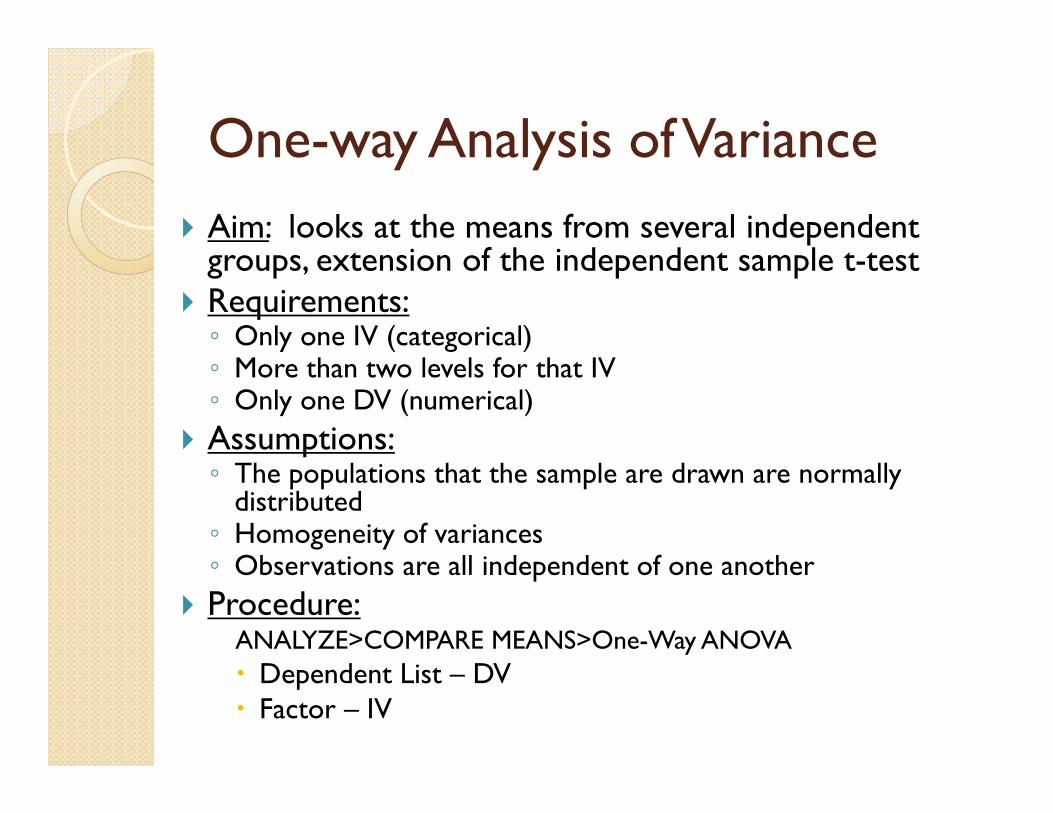
Aim: looks at the means from several independent groups, extension of the independent sample t-test
Requirements:◦ Only one IV (categorical)◦ More than two levels for that IV◦ Only one DV (numerical)
Assumptions:◦ The populations that the sample are drawn are normally
distributed◦ Homogeneity of variances◦ Observations are all independent of one another
Procedure:ANALYZE>COMPARE MEANS>One-Way ANOVA Dependent List – DV Factor – IV
One-way Analysis of Variance

Aim: test for main effect and interaction effects on the DV
Requirements:◦ Two IV (categorical variables)◦ Only one DV (continuous variable)
Procedure:ANALYZE>General Linear Model>Univariate Dependent List – DV Fixed Factor – IVs
Two-way Analysis of Variance

MANOVAAim: extension of ANOVA when there is more
than one DV (should be related)Assumptions:
sample sizenormalityoutlierslinearityhomogeneity of regressionmulticollinearity and singularityhomogeneity of variance-covariance matrices

Data analysis process
Data collection and preparation
Collect data
Prepare codebook
Set up structure of data
Enter data
Screen data for errors
Exploration of data
Descriptive Statistics
Graphs
Analysis
Explore relationship
between variables
Compare groups

THANK YOU!


