Embed Size (px)
Citation preview
DASHBOARD JAKARTAFlood Mapping App
FLOOD CONTROL 2015 > STIELTJESWEG 2 > 2628 CK DELFT > THE NETHERLANDS > T: +31 (0)88 33 57 446 > F: +31 (0)15 261 0821
INFO@FLOODCONTROL2015 > WWW.FLOODCONTROL2015.COM
INFOTitelDashboard Jakarta - Dashboard Application for Flood Mapping
Commissioned byStichting Flood Control
Number of Pages22
StatusConcept
DisclaimerWhile every effort has been made to ensure that the information herein is accurate, Stichting Flood Control
does not accept liability for error or fact or opinion which may be present, nor for the consequences of any
financial decision based on this information. The reports and material submitted by the various research
providers, which are contained within the publication, have been prepared in accordance with reasonable
standards of scientific endeavor. The research providers also have no control over its use by third parties,
and shall likewise have no liability to a third party arising from their use of this information.
Version Date Author Signature Reviewer Signature
1 2011-05-26K.J. van HeeringenA. van Loenen
Research team:Klaas-Jan van HeeringenArnejan van Loenen (Deltares)
1> DASHBOARD JAKARTA – FLOOD MAPPING APP
CONTENT
Content..................................................................................................................... 11 Introduction....................................................................................................... 2
1.1 General ...................................................................................................... 2
1.2 Objective and Deliverables......................................................................... 2
1.3 Structure of the Report............................................................................... 22 Approach........................................................................................................... 4
2.1 General ...................................................................................................... 4
2.2 Pilot 2011................................................................................................... 5
2.3 Long Term Implementation ........................................................................ 6
3 Technical Implementation ................................................................................ 73.1 Overview of Pilot Framework ..................................................................... 7
3.2 Monitoring Data Collector........................................................................... 7
3.3 Delft-FEWS................................................................................................ 8
4 Accuracy and Scope....................................................................................... 134.1 Accuracy.................................................................................................. 13
4.2 Scope of practical use of the flood map Dashboard control...................... 13
5 Possible Improvements.................................................................................. 145.1 General .................................................................................................... 14
5.2 Flood Mapping Improvements.................................................................. 14
5.3 Other Improvements ................................................................................ 14
6 Conclusions .................................................................................................... 157 Literature ......................................................................................................... 16Appendix 1 : List of Fluvial Gauges ................................................................ 18Appendix 2 : Hydraulic Correlations ............................................................... 19

2> DASHBOARD JAKARTA – FLOOD MAPPING APP
1 INTRODUCTION
1.1 GENERALIn this report we describe the work done during the visit for the Flood Control 2015 Dashboard Jakarta projectfrom May 22 – 28, 2011.
The mission was done by Klaas-Jan van Heeringen and Arnejan van Loenen from Deltares departmentOperational Water Management.
1.2 OBJECTIVE AND DELIVERABLESThe objective of the mission was to make a pilot flood map, available through HTML and to be presented atthe dashboard http://www.banjironline.com. Flood mapping information should be available to all kind of users:- govermental organisations,- business companies,- NGOs like Red Cross- and general public.
This means that the flood maps should cover both a global scale (view on whole Jakarta) next to very localscale (Kelurahan, street). The accuracy of the flood maps should be that at least a proper estimate will beprovided that shows if the water level will reach:- a level of about 30cm: knee level, still traffic possible- a level of about 100 cm: navel level, no traffic possible any more but still possible to “walk”- a level of more than 150: large scale and serious flooding
Based on real-time available water level measurements a simple correlation is used to select a flood map froma set of hydraulic simulation results. The resulting flood map is presented in the dashboard, together withsome expected water levels.
1.3 STRUCTURE OF THE REPORTIn the next chapter we describe our approach to generate flood maps, both for the short-term during this year2011 and for the long term. Chapter 3 describes our current implementation, where chapter 4 focuses on thescope and accuracy of the product. In chapter 5 we discus some possible improvements, that probably willimprove the quality of flood maps. Conclusions and recommendations are finally presented in Chapter 6.
3> DASHBOARD JAKARTA – FLOOD MAPPING APP
4> DASHBOARD JAKARTA – FLOOD MAPPING APP
2 APPROACH
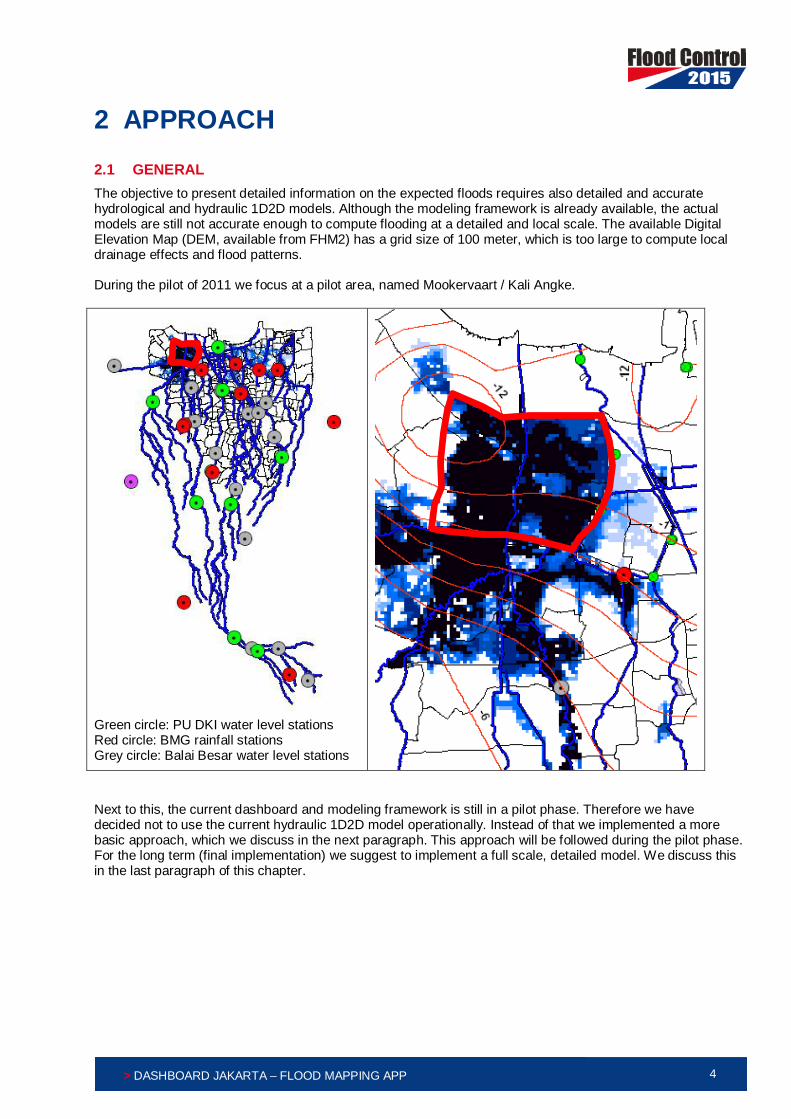
2.1 GENERALThe objective to present detailed information on the expected floods requires also detailed and accuratehydrological and hydraulic 1D2D models. Although the modeling framework is already available, the actualmodels are still not accurate enough to compute flooding at a detailed and local scale. The available DigitalElevation Map (DEM, available from FHM2) has a grid size of 100 meter, which is too large to compute localdrainage effects and flood patterns.
During the pilot of 2011 we focus at a pilot area, named Mookervaart / Kali Angke.
Green circle: PU DKI water level stationsRed circle: BMG rainfall stationsGrey circle: Balai Besar water level stations
Next to this, the current dashboard and modeling framework is still in a pilot phase. Therefore we havedecided not to use the current hydraulic 1D2D model operationally. Instead of that we implemented a morebasic approach, which we discuss in the next paragraph. This approach will be followed during the pilot phase.For the long term (final implementation) we suggest to implement a full scale, detailed model. We discuss thisin the last paragraph of this chapter.
5> DASHBOARD JAKARTA – FLOOD MAPPING APP
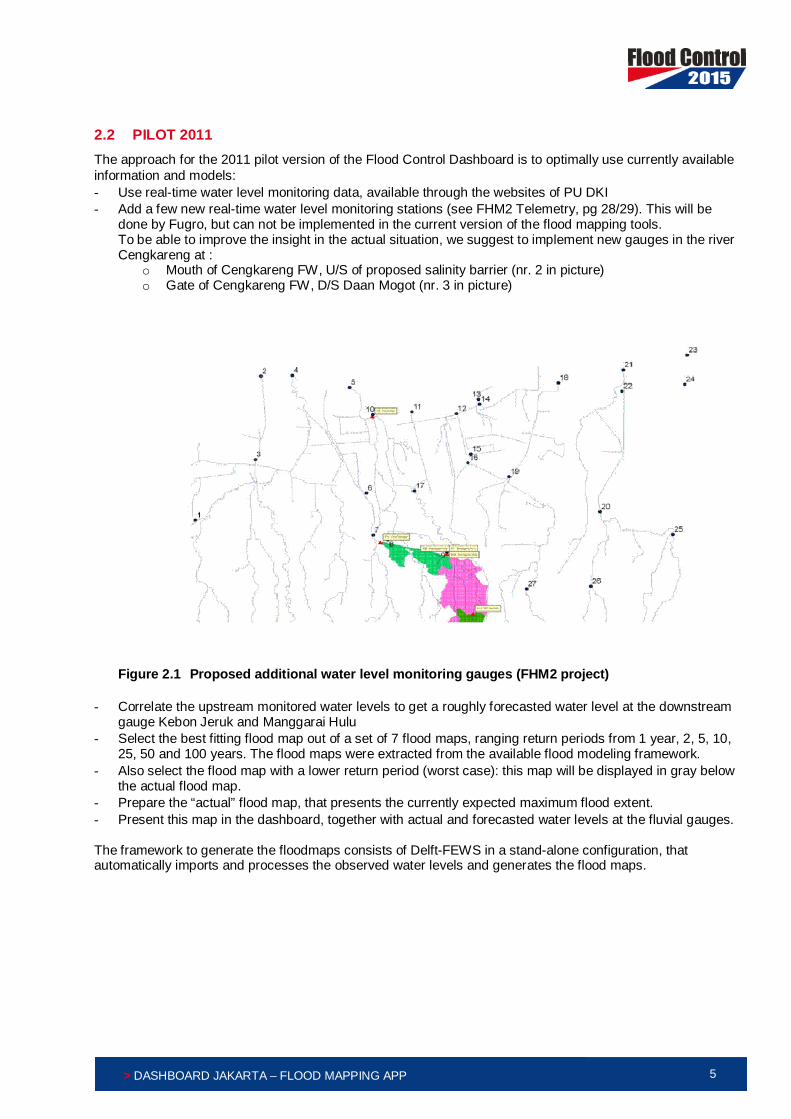
2.2 PILOT 2011The approach for the 2011 pilot version of the Flood Control Dashboard is to optimally use currently availableinformation and models:- Use real-time water level monitoring data, available through the websites of PU DKI- Add a few new real-time water level monitoring stations (see FHM2 Telemetry, pg 28/29). This will be
done by Fugro, but can not be implemented in the current version of the flood mapping tools.To be able to improve the insight in the actual situation, we suggest to implement new gauges in the riverCengkareng at :
o Mouth of Cengkareng FW, U/S of proposed salinity barrier (nr. 2 in picture)o Gate of Cengkareng FW, D/S Daan Mogot (nr. 3 in picture)
Figure 2.1 Proposed additional water level monitoring gauges (FHM2 project)
- Correlate the upstream monitored water levels to get a roughly forecasted water level at the downstreamgauge Kebon Jeruk and Manggarai Hulu
- Select the best fitting flood map out of a set of 7 flood maps, ranging return periods from 1 year, 2, 5, 10,25, 50 and 100 years. The flood maps were extracted from the available flood modeling framework.
- Also select the flood map with a lower return period (worst case): this map will be displayed in gray belowthe actual flood map.
- Prepare the “actual” flood map, that presents the currently expected maximum flood extent.- Present this map in the dashboard, together with actual and forecasted water levels at the fluvial gauges.
The framework to generate the floodmaps consists of Delft-FEWS in a stand-alone configuration, thatautomatically imports and processes the observed water levels and generates the flood maps.
6> DASHBOARD JAKARTA – FLOOD MAPPING APP
2.3 LONG TERM IMPLEMENTATION
For the long term we advise to follow the next approach:- Use Delft-FEWS in a client-server configuration as a real-time information and modeling framework- Run a global SOBEK 1D2D model that computes the flood extent for the whole Jakarta district.- Run – if needed – detailed local models (e.g. at a Kelurahan scale) to compute detailed local flood maps
7> DASHBOARD JAKARTA – FLOOD MAPPING APP
3 TECHNICAL IMPLEMENTATION
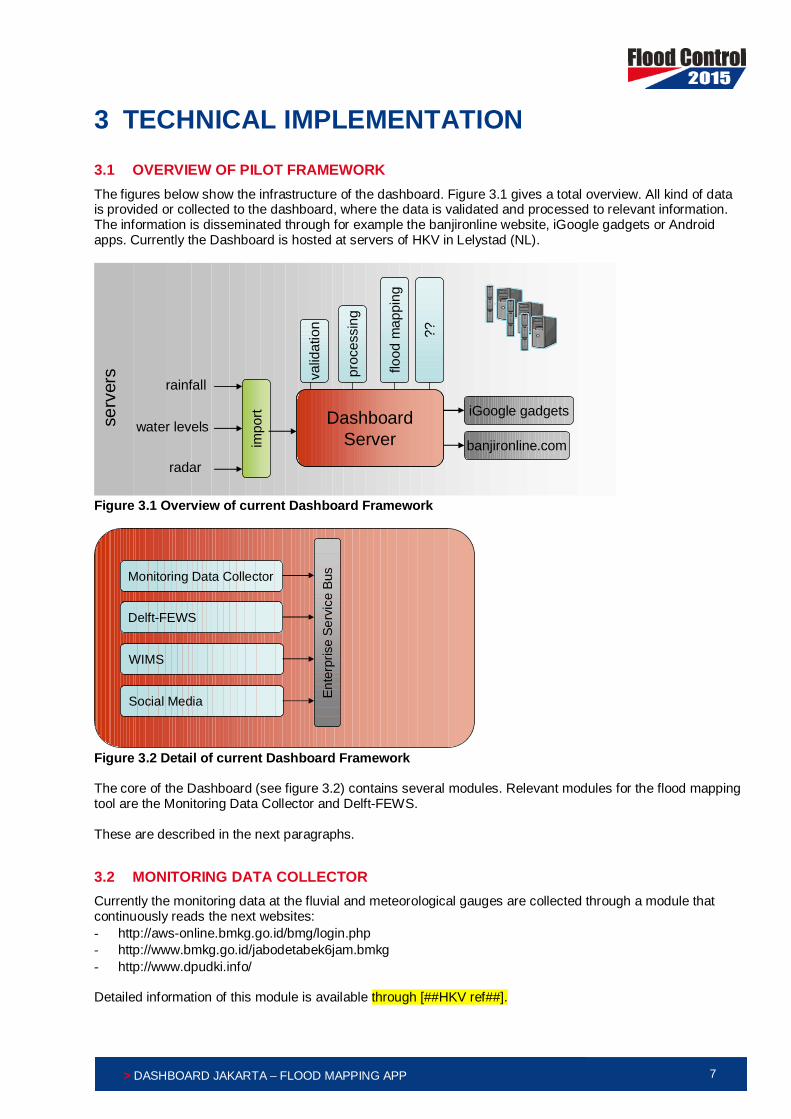
3.1 OVERVIEW OF PILOT FRAMEWORKThe figures below show the infrastructure of the dashboard. Figure 3.1 gives a total overview. All kind of datais provided or collected to the dashboard, where the data is validated and processed to relevant information.The information is disseminated through for example the banjironline website, iGoogle gadgets or Androidapps. Currently the Dashboard is hosted at servers of HKV in Lelystad (NL).
DashboardServerim
port
rainfall
radar
water levels
valid
atio
n
flood
map
ping
proc
essi
ng
??iGoogle gadgets
banjironline.com
serv
ers
Figure 3.1 Overview of current Dashboard Framework
Monitoring Data Collector
Social Media
Delft-FEWS
WIMS
Ente
rpris
e Se
rvic
e Bu
s
Figure 3.2 Detail of current Dashboard Framework
The core of the Dashboard (see figure 3.2) contains several modules. Relevant modules for the flood mappingtool are the Monitoring Data Collector and Delft-FEWS.
These are described in the next paragraphs.
3.2 MONITORING DATA COLLECTORCurrently the monitoring data at the fluvial and meteorological gauges are collected through a module thatcontinuously reads the next websites:- http://aws-online.bmkg.go.id/bmg/login.php- http://www.bmkg.go.id/jabodetabek6jam.bmkg- http://www.dpudki.info/
Detailed information of this module is available through [##HKV ref##].

8> DASHBOARD JAKARTA – FLOOD MAPPING APP
3.3 DELFT-FEWS
3.3.1 General
We use Delft-FEWS (Delft Hydraulics) as framework to:- Import monitoring data (actually only water levels)- Make an estimate of the water levels to be expected (as listed in Appendix 2)
o Manggarai based on Panus Depok and Katu Lampao Kebon Jeruk based on Katu Lampa, Panus Depok and Manggarai
- Compute discharges through QH relations (FHM1 report, Annex B):
Katu Lampa:2.310
AWLR AWLR2.145
AWLR AWLR
for 0.33 H 1.05 : Q 95.34(H 0.33)
for 1.05 H 3.50 : Q 76.76(H 0.27)
< < = -
£ £ = -
Panus Depok: 1.805Q 31.52(H 0.160)= -
- Selection of flood map that fits best to the actual situation.- Export to dashboard service bus:
o PI XML file with timeseries of forecasted water levels and discharges.o HTML files with graphs of observed and forecasted water levels and dischargeso PNG of expected flood map (with background map)o In future (fall of 2011) a PNG file with expected flood map (without background map) to be used
as overlay on dynamic map server, like Google Maps. Currently this functionality is not available inDelft-FEWS, but will be implemented.
3.3.2 ConfigurationThe stand-alone configuration contains the following locations:- PU DKI Water level gauges (see appendix 1)- Forecast locations for the pilot: Kapuk Selatan Pump station and Kebon Jeruk
Figure 3.3 Water level forecast locations
9> DASHBOARD JAKARTA – FLOOD MAPPING APP
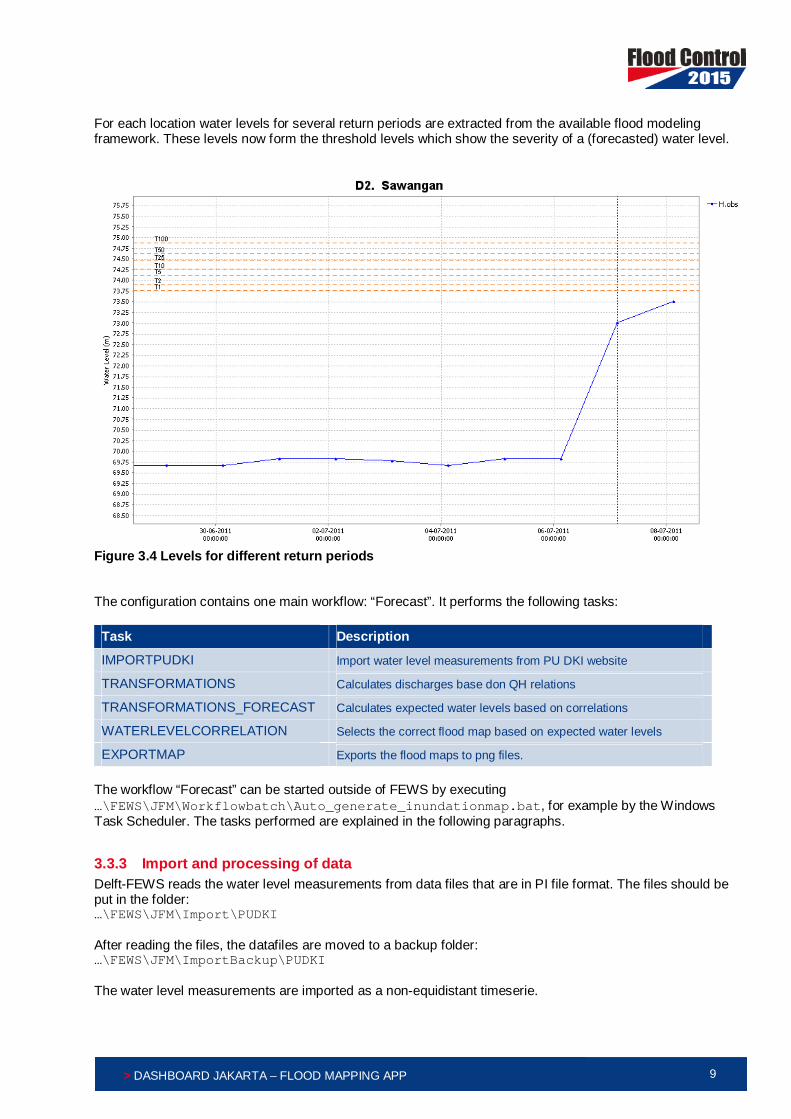
For each location water levels for several return periods are extracted from the available flood modelingframework. These levels now form the threshold levels which show the severity of a (forecasted) water level.
Figure 3.4 Levels for different return periods
The configuration contains one main workflow: “Forecast”. It performs the following tasks:
Task Description
IMPORTPUDKI Import water level measurements from PU DKI website
TRANSFORMATIONS Calculates discharges base don QH relations
TRANSFORMATIONS_FORECAST Calculates expected water levels based on correlations
WATERLEVELCORRELATION Selects the correct flood map based on expected water levels
EXPORTMAP Exports the flood maps to png files.
The workflow “Forecast” can be started outside of FEWS by executing…\FEWS\JFM\Workflowbatch\Auto_generate_inundationmap.bat, for example by the WindowsTask Scheduler. The tasks performed are explained in the following paragraphs.
3.3.3 Import and processing of dataDelft-FEWS reads the water level measurements from data files that are in PI file format. The files should beput in the folder:…\FEWS\JFM\Import\PUDKI
After reading the files, the datafiles are moved to a backup folder:…\FEWS\JFM\ImportBackup\PUDKI
The water level measurements are imported as a non-equidistant timeserie.
10> DASHBOARD JAKARTA – FLOOD MAPPING APP
The external location ID’s are saved in column “IDMAP” in the locations table (gauges.dbf). Using this tablethe external ID’s are mapped to the ID’s used within FEWS. The external parameter ID is “waterlevel”, whilethe internal parameter ID is “H.obs”. The mappings are described in…\FEWS\JFM\Config\IdMapFiles\IdImportDKI.xml
The water levels are measured against a local datum. In the import they are not converted to global(Indonesian) datum. But when displayed in graphs, the water levels are shown in global datum. For eachlocation the level of the local datum is stored in the locations table (gauges.dbf), column “Z”.
After the import of the measured water levels, discharges are calculated for Manggarai Hulu and Panus Depok(see paragraph 3.3.1). The configuration is stored in…\FEWS\JFM\Config\ModuleConfigFules\Transformations.xml
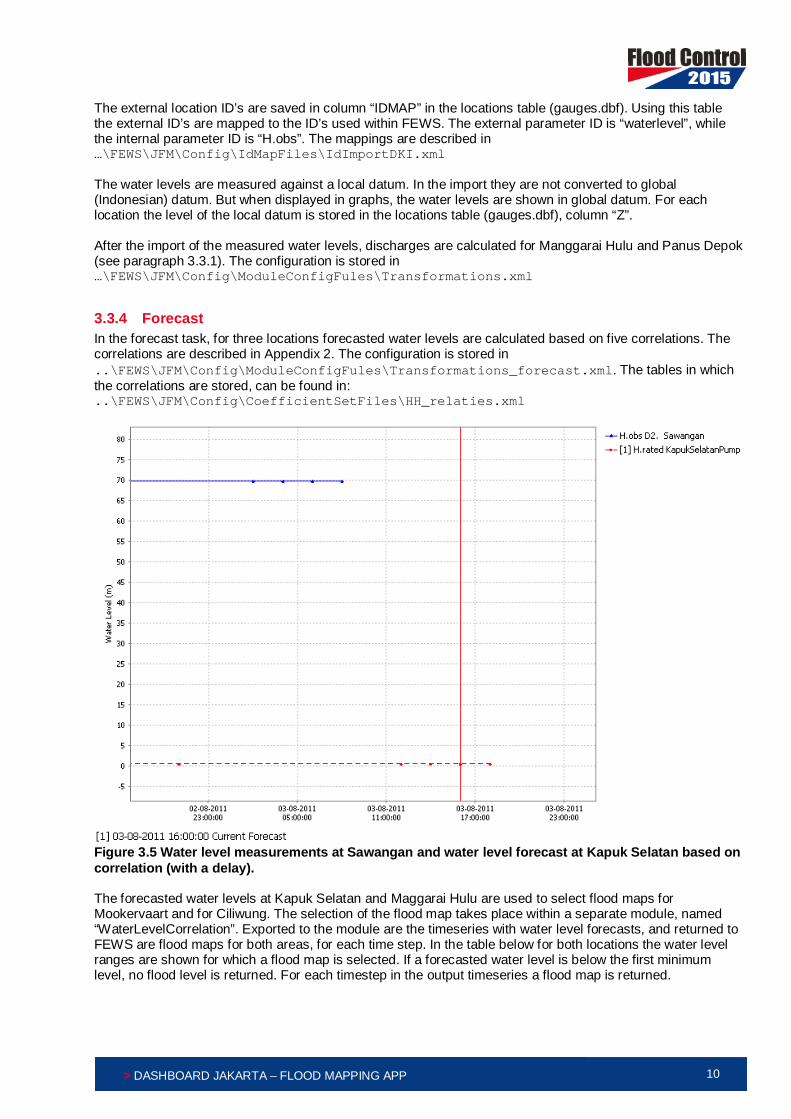
3.3.4 ForecastIn the forecast task, for three locations forecasted water levels are calculated based on five correlations. Thecorrelations are described in Appendix 2. The configuration is stored in..\FEWS\JFM\Config\ModuleConfigFules\Transformations_forecast.xml. The tables in whichthe correlations are stored, can be found in:..\FEWS\JFM\Config\CoefficientSetFiles\HH_relaties.xml
Figure 3.5 Water level measurements at Sawangan and water level forecast at Kapuk Selatan based oncorrelation (with a delay).
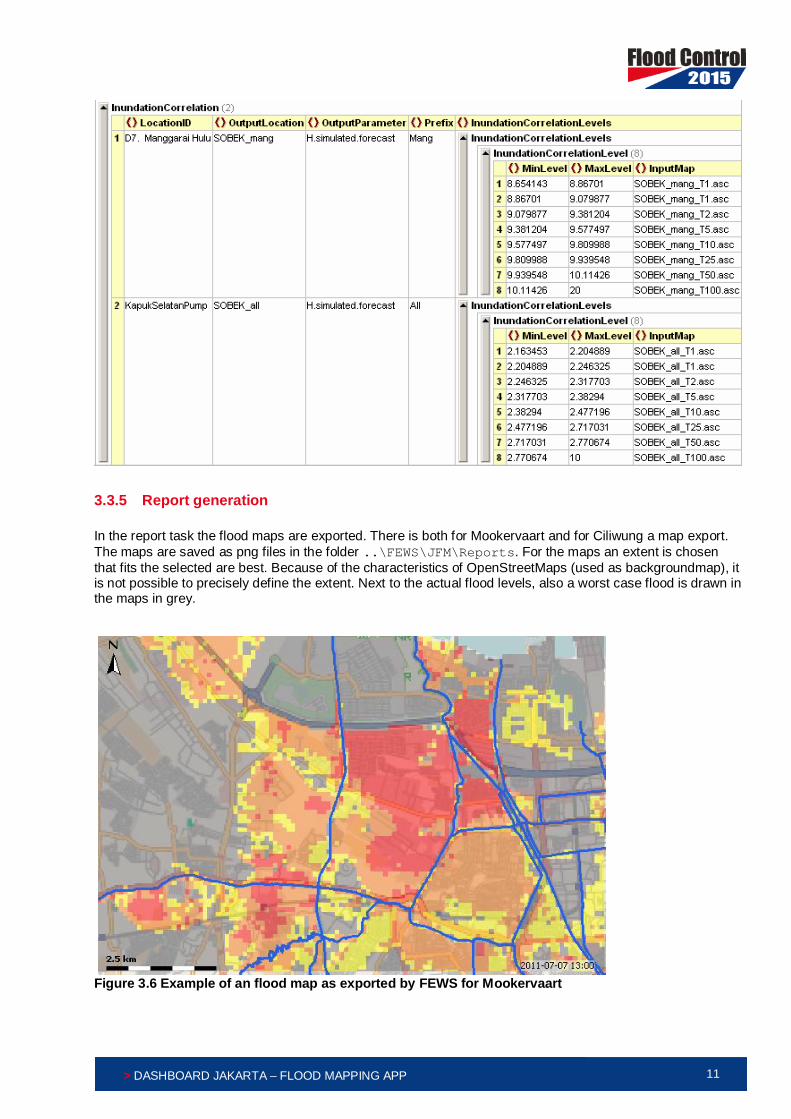
The forecasted water levels at Kapuk Selatan and Maggarai Hulu are used to select flood maps forMookervaart and for Ciliwung. The selection of the flood map takes place within a separate module, named“WaterLevelCorrelation”. Exported to the module are the timeseries with water level forecasts, and returned toFEWS are flood maps for both areas, for each time step. In the table below for both locations the water levelranges are shown for which a flood map is selected. If a forecasted water level is below the first minimumlevel, no flood level is returned. For each timestep in the output timeseries a flood map is returned.
11> DASHBOARD JAKARTA – FLOOD MAPPING APP
3.3.5 Report generation
In the report task the flood maps are exported. There is both for Mookervaart and for Ciliwung a map export.The maps are saved as png files in the folder ..\FEWS\JFM\Reports. For the maps an extent is chosenthat fits the selected are best. Because of the characteristics of OpenStreetMaps (used as backgroundmap), itis not possible to precisely define the extent. Next to the actual flood levels, also a worst case flood is drawn inthe maps in grey.
Figure 3.6 Example of an flood map as exported by FEWS for Mookervaart

12> DASHBOARD JAKARTA – FLOOD MAPPING APP
3.4 DASHBOARD COMPONENT
The exported flood maps can be viewed in one of the app of the BanjirOnline dashboard. The gadget showsthe forecasted flood level in the area.
Figure 3.7 Dashboard Jakarta FC2015 including the flood mapping app.

13> DASHBOARD JAKARTA – FLOOD MAPPING APP
4 ACCURACY AND SCOPE
4.1 ACCURACYThe current pilot implementation of the flood mapping control in the Dashboard is based on availablemonitoring data and correlated water level forecasts. The flood mapping is done by selecting a pre-simulatedflood map that best fits to the actual situation. Currently a more detailed approach is not feasible.
This means that:- monitoring data is only available at a daily timestep through internet website of PU DKI. As the catchment
is fast responding and travel times are short, this will be not accurate.- Water level forecast is done by correlations of monitored water levels. No rainfall monitoring data, rainfall-
runoff modelling and hydraulic modelling is performed yet. This means that the forecasted levels are onlya rough estimate.
- The largest forecast period is 13 hours. This means that, by a daily timestep, for half a day there is noforecast available.
- Flood mapping is done by a selection of the best fitting flood map out of a set of 7 available floodmaps.The presented flood map is only one of these floodmaps. No verification is done with the actual situationand flood extent.
- The presented flood map is only a map that presents the maximum extent of the flooding. No floodmapping during a period of days (an animation) is provided.
4.2 SCOPE OF PRACTICAL USE OF THE FLOOD MAP DASHBOARD CONTROLThe above mentioned accuracy makes that the current flood mapping control at the dashboard should not beused operationally. It should only be used for demonstration purpose. At best, the presented flood mapsshould be used to get a rough idea of what could be expected.
14> DASHBOARD JAKARTA – FLOOD MAPPING APP
5 POSSIBLE IMPROVEMENTS
5.1 GENERALFrom the previous chapter it is clear that lots of improvements are required and possible. These will bediscussed in this chapter.
5.2 FLOOD MAPPING IMPROVEMENTSWe see the next possible improvements for the flood extent mapping tool. They are listed in sequential orderas most of the improvements require that the beforementioned improvement is effectuated.- The actual datafeed of water level monitoring data is done via an internet website of PU DKI. This
approach should be changed to a continuously reading and feeding monitoring systemo Add at least the Kebon Jeruk station to the datafeed.o Record the waterlevels with a frequency of preferably 15 minutes.o Provide these through an automated service to the Dashboard and within that, Delft-FEWS
- Install and maintain automatic water level recorders and rain gauges. See report FHM2 – Telemetricsystem for suggested new monitoring stations. For the pilot area at least the next stations are preferred:
o Mouth of Cengkareng FW, U/S of proposed salinity barriero Gate of Cengkareng FW, D/S Daan Mogot
- Add radar reflection information to have detailed information on the spatial and temporal distribution of therainfall.
- Make use of a full scale flood modelling framework like SOBEK to simulate actual and forecastedhydraulics and flooding. This modelling framework can be included in the Delft-FEWS framework.
5.3 OTHER IMPROVEMENTSThe next step from calculating accurate flood levels is to present them to the public and to professionalorganizations. The dashboard is one means of disseminating information, but this can only be displayed ondesktop computers. In Jakarta most people use smartphones for accessing internet data: the flood informationshould therefore also be viewable on smartphones. Therefore a mobile framework could be added to thedashboard framework. This could consist of, for example, iGoogle gadgets, or lightweight Android and Iphoneapps.

15> DASHBOARD JAKARTA – FLOOD MAPPING APP
6 CONCLUSIONS
The demonstration Flood mapping App, as integrated in Dashboard BanjirOnline, is a good example of how topresent simple flood maps to the general public. The development shows that, for a realistic flood forecast andmapping, more measurement data are required and implementation of hydraulic models is necessary. The aimof the demonstrator was to get experience with calculating and presenting flood maps for Jakarta, and thatgoal is reached. The inundation maps are added as app to the FC2015 dashboard and with that thedashboard contains one more example of the many uses of the dashboard.
16> DASHBOARD JAKARTA – FLOOD MAPPING APP
7 LITERATUREFlood Control 2015, 2010: Flood Control 2015 – Programmering 2011. Stichting Flood Control, status:
definitief, 17 december 2010.
Brinkman, J.J., 2007. Flood Hazard Mapping Overview. Dutch assistance with nonstructural measures JakartaFlood Management.
Brinkman, JJ, Diermanse, F., Zijl, F. 2997: Hydrology and Sea water level – Dutch assistance with non-structural measures Jakarta Flood Management.
Burnash, R.J.C., Ferral, R.L and Mc.Guire, R.A. A generalized streamflow simulation system. Conceptialmodelling for digital computers. Dept. of Water Resources, Sacramento, March 1973.
Ogink, H.J.M., 2009. Jakarta Flood Early Warning System - Telemetric System, Deltares report Q4743.
Verschelling, E., Udo, J., 2007. Hydraulics report. Dutch assistance with non-structural measures JakartaFlood Management.
H.J.M. Ogink, G.F. Prinsen, E. Verschelling, Hydrology & Hydraulics - Model Development, Flood HazardMapping 2, Jakarta Flood Management 2, Partners for Water, March 2009, Deltares, project Q4743

17> DASHBOARD JAKARTA – FLOOD MAPPING APP
18> DASHBOARD JAKARTA – FLOOD MAPPING APP
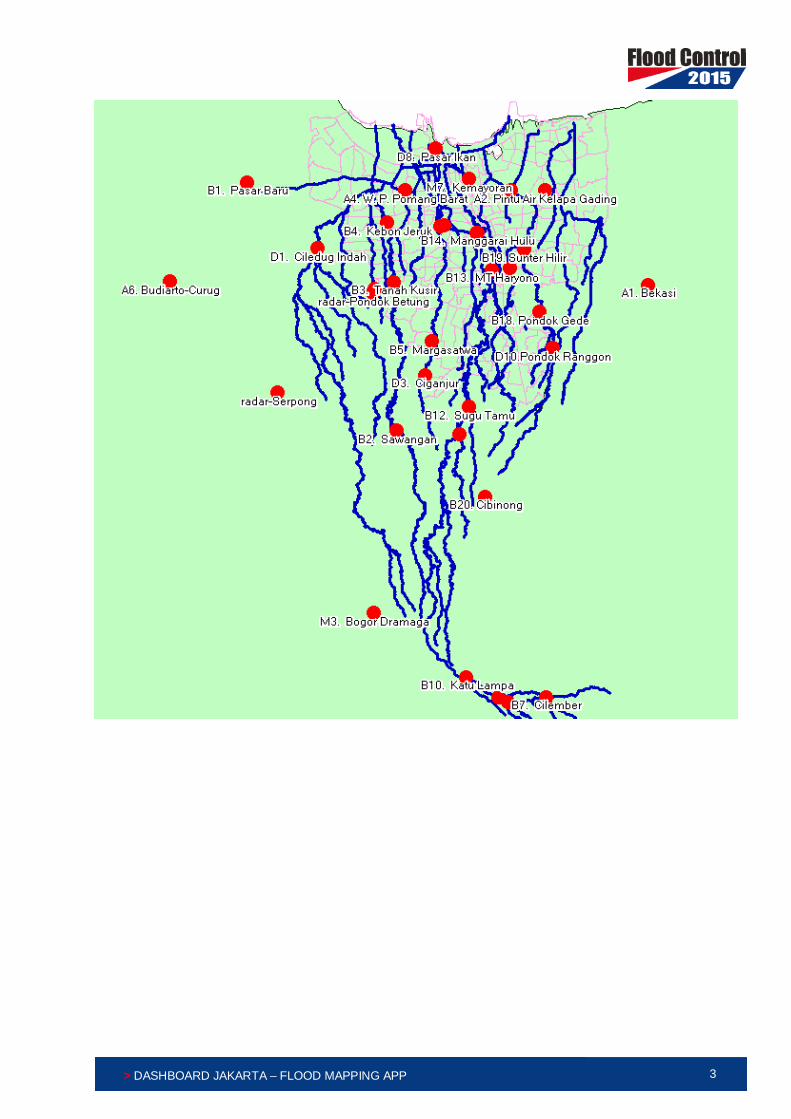
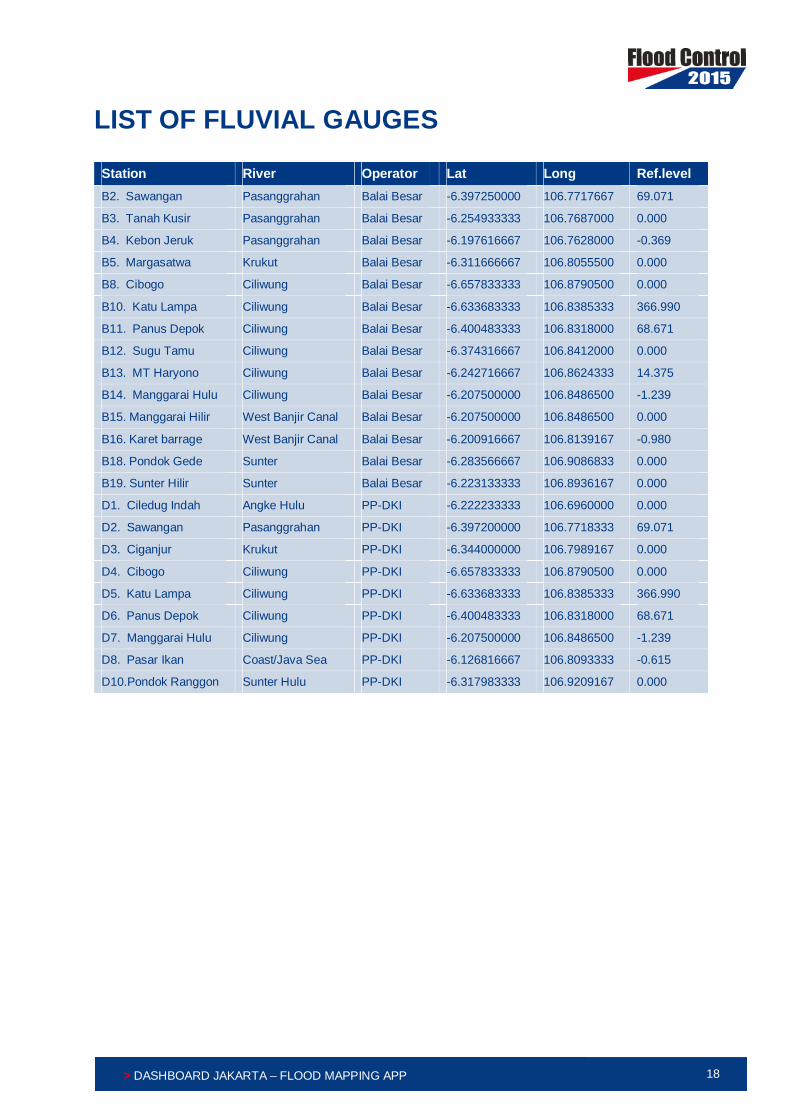
LIST OF FLUVIAL GAUGES
Station River Operator Lat Long Ref.levelB2. Sawangan Pasanggrahan Balai Besar -6.397250000 106.7717667 69.071
B3. Tanah Kusir Pasanggrahan Balai Besar -6.254933333 106.7687000 0.000
B4. Kebon Jeruk Pasanggrahan Balai Besar -6.197616667 106.7628000 -0.369
B5. Margasatwa Krukut Balai Besar -6.311666667 106.8055500 0.000
B8. Cibogo Ciliwung Balai Besar -6.657833333 106.8790500 0.000
B10. Katu Lampa Ciliwung Balai Besar -6.633683333 106.8385333 366.990
B11. Panus Depok Ciliwung Balai Besar -6.400483333 106.8318000 68.671
B12. Sugu Tamu Ciliwung Balai Besar -6.374316667 106.8412000 0.000
B13. MT Haryono Ciliwung Balai Besar -6.242716667 106.8624333 14.375
B14. Manggarai Hulu Ciliwung Balai Besar -6.207500000 106.8486500 -1.239
B15. Manggarai Hilir West Banjir Canal Balai Besar -6.207500000 106.8486500 0.000
B16. Karet barrage West Banjir Canal Balai Besar -6.200916667 106.8139167 -0.980
B18. Pondok Gede Sunter Balai Besar -6.283566667 106.9086833 0.000
B19. Sunter Hilir Sunter Balai Besar -6.223133333 106.8936167 0.000
D1. Ciledug Indah Angke Hulu PP-DKI -6.222233333 106.6960000 0.000
D2. Sawangan Pasanggrahan PP-DKI -6.397200000 106.7718333 69.071
D3. Ciganjur Krukut PP-DKI -6.344000000 106.7989167 0.000
D4. Cibogo Ciliwung PP-DKI -6.657833333 106.8790500 0.000
D5. Katu Lampa Ciliwung PP-DKI -6.633683333 106.8385333 366.990
D6. Panus Depok Ciliwung PP-DKI -6.400483333 106.8318000 68.671
D7. Manggarai Hulu Ciliwung PP-DKI -6.207500000 106.8486500 -1.239
D8. Pasar Ikan Coast/Java Sea PP-DKI -6.126816667 106.8093333 -0.615
D10.Pondok Ranggon Sunter Hulu PP-DKI -6.317983333 106.9209167 0.000

19> DASHBOARD JAKARTA – FLOOD MAPPING APP
APPENDIX 1 : HYDRAULIC CORRELATIONS
Pump station Kapuk Selatan from Gauge Sawagan (Pesanggrahan)
Average travel times during floods: 10 hours
T=100 event
14:00
0:00
1
1.5
2
2.5
3
3.5
4
6:00 12:00 18:00 0:00 6:00 12:00 18:00 0:00 6:00 12:00 18:00 0:00
time
leve
l (sh
ifted
) m
Saw agan
Kapuk Selatan Pump
0
0.5
1
1.5
2
2.5
3
2 2.5 3 3.5 4 4.5 5 5.5 6 6.5
Sawagan, gauge reading [m + local datum]
Pum
psta
tion
Kap
uk S
elat
an [m
AD
]
T100 simulation
Table
Sawagan(ref=69.071 m MSL)
Pump stationKapuk Selatan(MSL)
2.2 1.7
2.6 2
4 2.6
5 2.75
6 2.8
20> DASHBOARD JAKARTA – FLOOD MAPPING APP
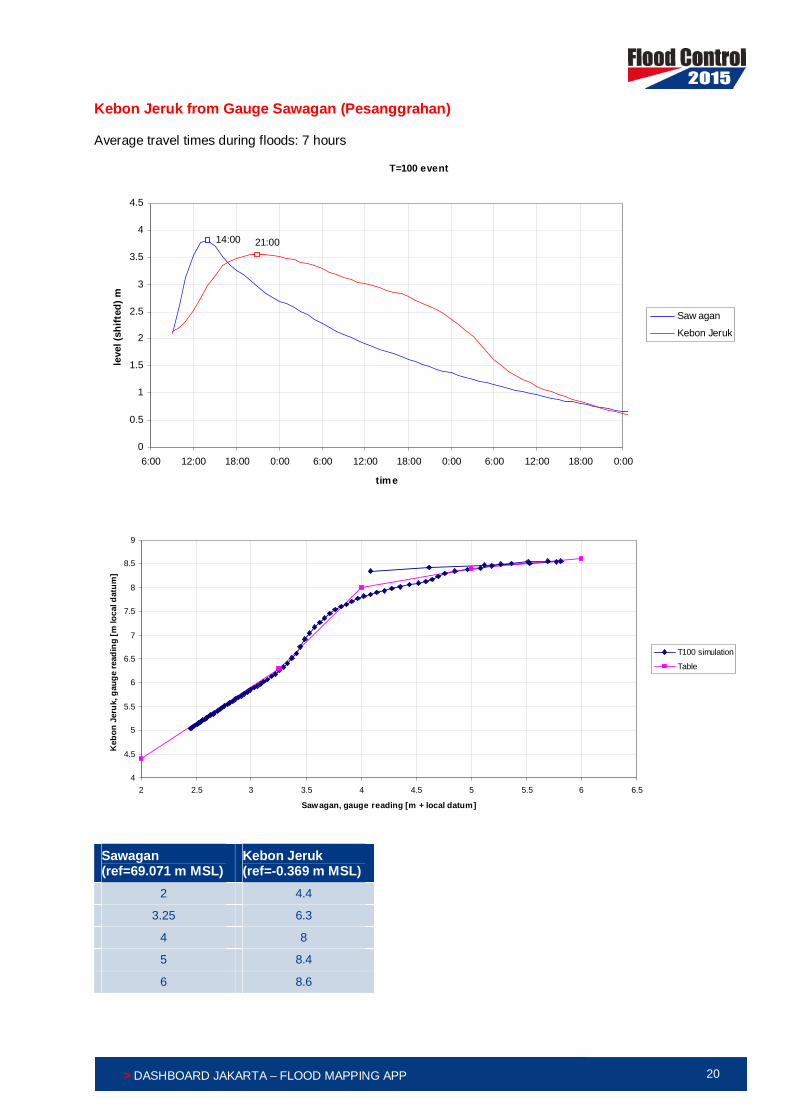
Kebon Jeruk from Gauge Sawagan (Pesanggrahan)
Average travel times during floods: 7 hours
T=100 event
14:00 21:00
0
0.5
1
1.5
2
2.5
3
3.5
4
4.5
6:00 12:00 18:00 0:00 6:00 12:00 18:00 0:00 6:00 12:00 18:00 0:00
time
leve
l (sh
ifted
) m
Saw agan
Kebon Jeruk
4
4.5
5
5.5
6
6.5
7
7.5
8
8.5
9
2 2.5 3 3.5 4 4.5 5 5.5 6 6.5
Saw agan, gauge reading [m + local datum]
Keb
on J
eruk
, gau
ge re
adin
g [m
loca
l dat
um]
T100 simulation
Table
Sawagan(ref=69.071 m MSL)
Kebon Jeruk(ref=-0.369 m MSL)
2 4.4
3.25 6.3
4 8
5 8.4
6 8.6
21> DASHBOARD JAKARTA – FLOOD MAPPING APP
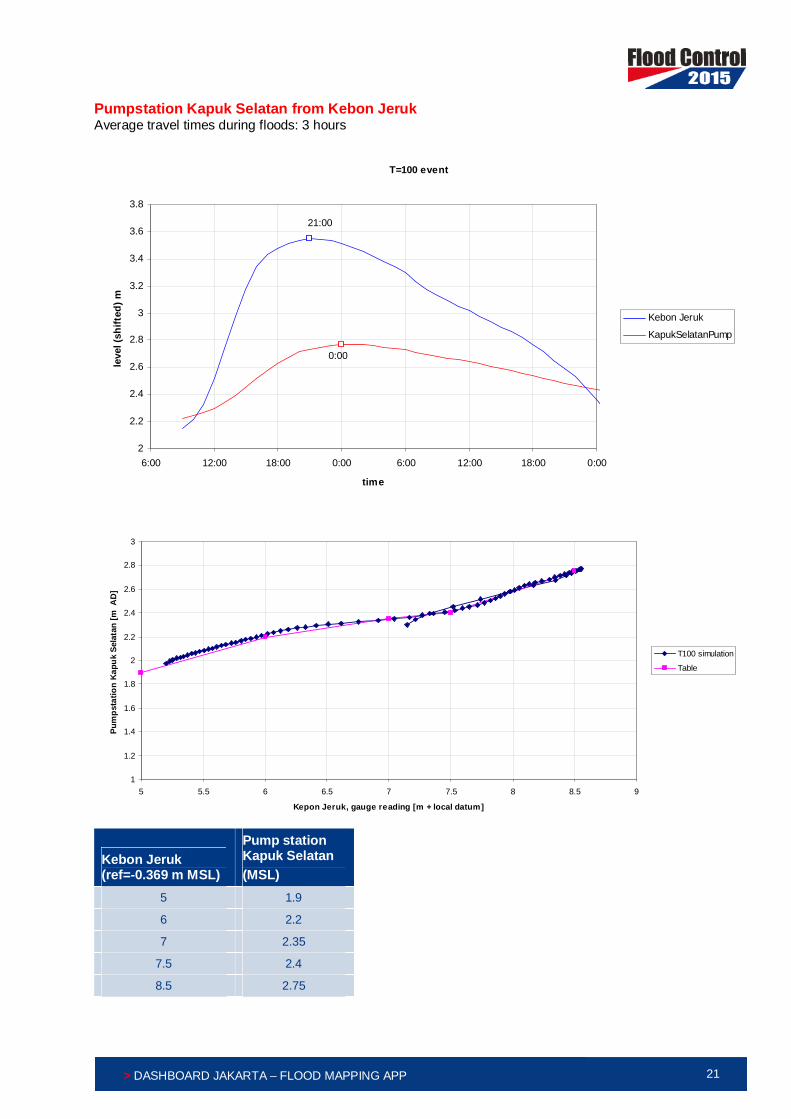
Pumpstation Kapuk Selatan from Kebon JerukAverage travel times during floods: 3 hours
T=100 event
21:00
0:00
2
2.2
2.4
2.6
2.8
3
3.2
3.4
3.6
3.8
6:00 12:00 18:00 0:00 6:00 12:00 18:00 0:00
time
leve
l (sh
ifted
) m
Kebon Jeruk
KapukSelatanPump
1
1.2
1.4
1.6
1.8
2
2.2
2.4
2.6
2.8
3
5 5.5 6 6.5 7 7.5 8 8.5 9
Kepon Jeruk, gauge reading [m + local datum]
Pum
psta
tion
Kapu
k Se
lata
n [m
AD
]
T100 simulation
Table
Kebon Jeruk(ref=-0.369 m MSL)
Pump stationKapuk Selatan(MSL)
5 1.9
6 2.2
7 2.35
7.5 2.4
8.5 2.75
22> DASHBOARD JAKARTA – FLOOD MAPPING APP
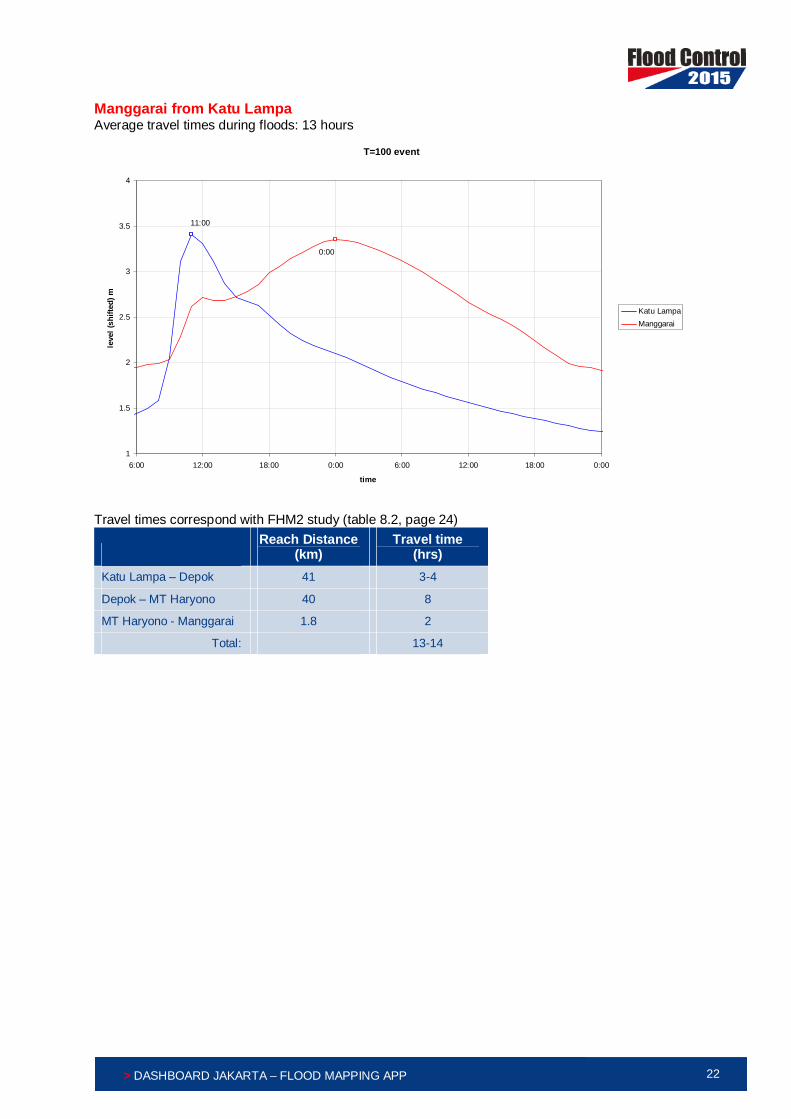
Manggarai from Katu LampaAverage travel times during floods: 13 hours
T=100 event
11:00
0:00
1
1.5
2
2.5
3
3.5
4
6:00 12:00 18:00 0:00 6:00 12:00 18:00 0:00
time
leve
l (sh
ifted
) m
Katu LampaManggarai
Travel times correspond with FHM2 study (table 8.2, page 24)Reach Distance
(km)Travel time
(hrs)Katu Lampa – Depok 41 3-4
Depok – MT Haryono 40 8
MT Haryono - Manggarai 1.8 2
Total: 13-14

23> DASHBOARD JAKARTA – FLOOD MAPPING APP
0
2
4
6
8
10
12
0 0.5 1 1.5 2 2.5 3 3.5 4
Katu Lampa, gauge reading [m + local datum]
Man
ggar
ai g
auge
read
ing
[m +
loca
l dat
um]
T100 simulation
Table
Katu Lampa(ref=-366.99 m MSL)
Manggarai(ref=-1.2385 m MSL)
0.8 7.8
1.5 10.5
2 10.9
2.5 11.3
3.5 11.4

24> DASHBOARD JAKARTA – FLOOD MAPPING APP
Manggarai from Panus Depok
Average travel times during floods: 10 hours (See also the abovementioned table 8.2 from FHM2)
T=100 event
14:00
0:00
0
0.5
1
1.5
2
2.5
3
3.5
4
4.5
6:00 12:00 18:00 0:00 6:00 12:00 18:00 0:00
time
leve
l (sh
ifted
) m
Depok
Manggarai
Katu Lampa
0
2
4
6
8
10
12
0 0.5 1 1.5 2 2.5 3 3.5 4 4.5
Depok, gauge reading [m + local datum]
Man
ggar
ai g
auge
read
ing
[m +
loca
l dat
um]
T100 simulation
Table
Panus Depok(ref=55.00 m MSL)
Manggarai(ref=-1.2385 m MSL)
0.8 5
1.5 7.7
2 8.1
2.5 8.5
3.5 8.6
25> DASHBOARD JAKARTA – FLOOD MAPPING APP
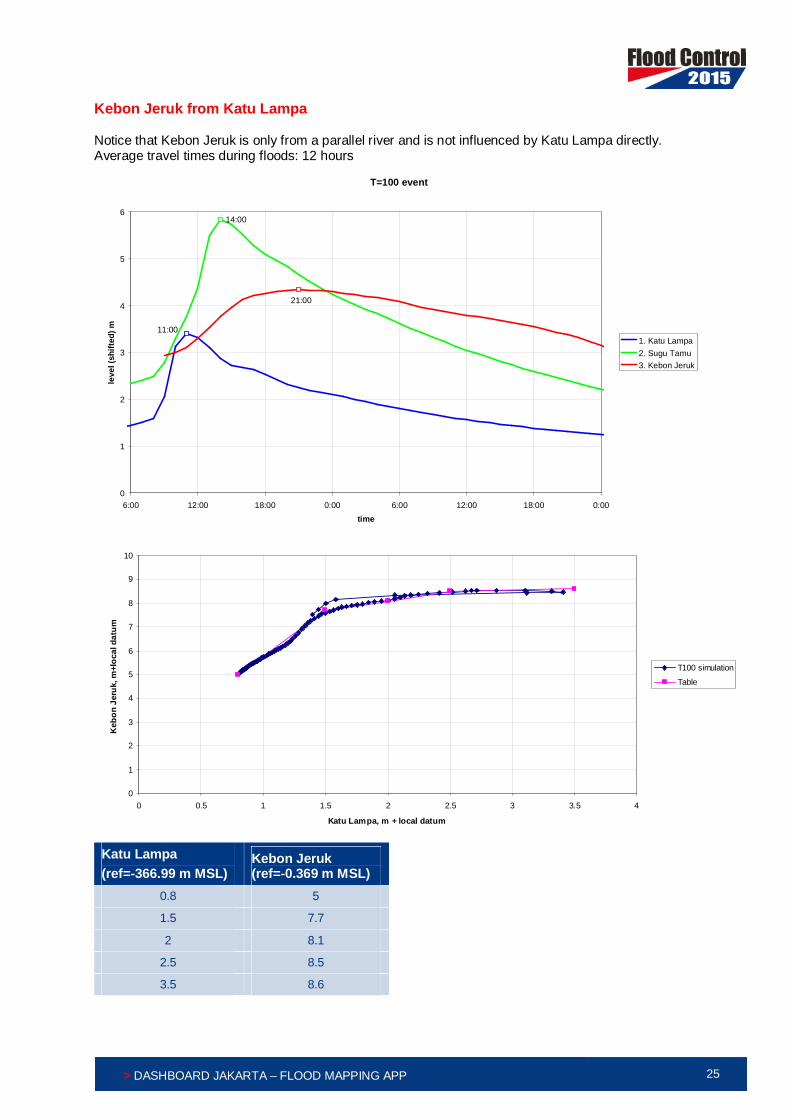
Kebon Jeruk from Katu Lampa
Notice that Kebon Jeruk is only from a parallel river and is not influenced by Katu Lampa directly.Average travel times during floods: 12 hours
T=100 event
11:00
14:00
21:00
0
1
2
3
4
5
6
6:00 12:00 18:00 0:00 6:00 12:00 18:00 0:00time
leve
l (sh
ifted
) m
1. Katu Lampa2. Sugu Tamu3. Kebon Jeruk
0
1
2
3
4
5
6
7
8
9
10
0 0.5 1 1.5 2 2.5 3 3.5 4
Katu Lampa, m + local datum
Keb
on J
eruk
, m+l
ocal
dat
um
T100 simulation
Table
Katu Lampa(ref=-366.99 m MSL)
Kebon Jeruk(ref=-0.369 m MSL)
0.8 5
1.5 7.7
2 8.1
2.5 8.5
3.5 8.6