Embed Size (px)
Citation preview
1 | P a g e
DAS – Dashboard Framework
November 8, 2011
Project Summary
As part of the strategic planning process being conducted by DAS leadership, surveys were conducted to
gather input from DAS employees. This project management team is to create dashboard schematics
that will assist in the completion of a DAS dashboard that will have indicators of how they are
progressing through surveys.
Project Goal
DAS has requested our team to analyze existing data and develop schematics of a possible dashboard
that will assist in future surveys. Currently DAS lacks having a tool with the ability to analyze the results
and have them viewable at a glance. The dashboard will provide an easy method to display and interpret
survey data to aid in decision making.
Project Outcome
Dashboard Development Framework:
• Dashboard (top-level and second-level schematics; third-level if time allows)
• Description of inputs and steps that feed the dashboard
• Implementation recommendations for key DAS developers and implementers

2 | P a g e
Project Benefits
Creation of the dashboard schematics and user guide that will display results for future DAS surveys and
can be implemented and repeated for use by multiple agencies and surveys over time.
Products/deliverables:
Dashboard (top-level and second –level Schematics; Third level if time allows)
User tip and instruction (users guide)
Description of inputs and steps that feed the dashboard
Implementation recommendations for key DAS developers and implementers
Project Team
For more information about this project, contact team members
Kevin Kent — [email protected]
Irene Barnett – [email protected]
Bob Greene — [email protected]
Mike Azad — [email protected]
Ron Meade — [email protected]
Mentor – Coach: Nelson Gonzalez

DAS Survey
Dashboard

Dashboard, The purpose of a dashboard
is to provide the user with actionable
business information in a format that is
both intuitive and insightful.
Overview

Introduction 1
Objectives 2
WBS, Schedule & Cost 3
Risk & Human Resource Management 4
Communication & Quality Management 5
Agenda
Closing Statements & Questions 7
Proposed Dashboard Revealed 6
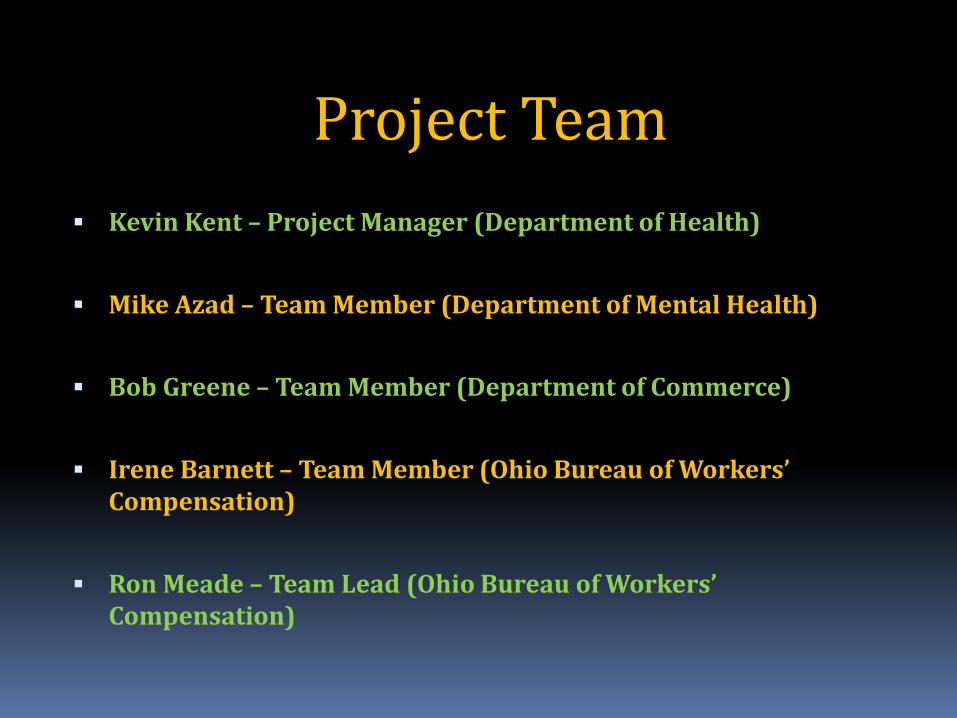
Project Team
Kevin Kent – Project Manager (Department of Health)
Mike Azad – Team Member (Department of Mental Health)
Bob Greene – Team Member (Department of Commerce)
Irene Barnett – Team Member (Ohio Bureau of Workers’ Compensation)
Ron Meade – Team Lead (Ohio Bureau of Workers’ Compensation)

Work Breakdown Structure (WBS)

Project Schedule
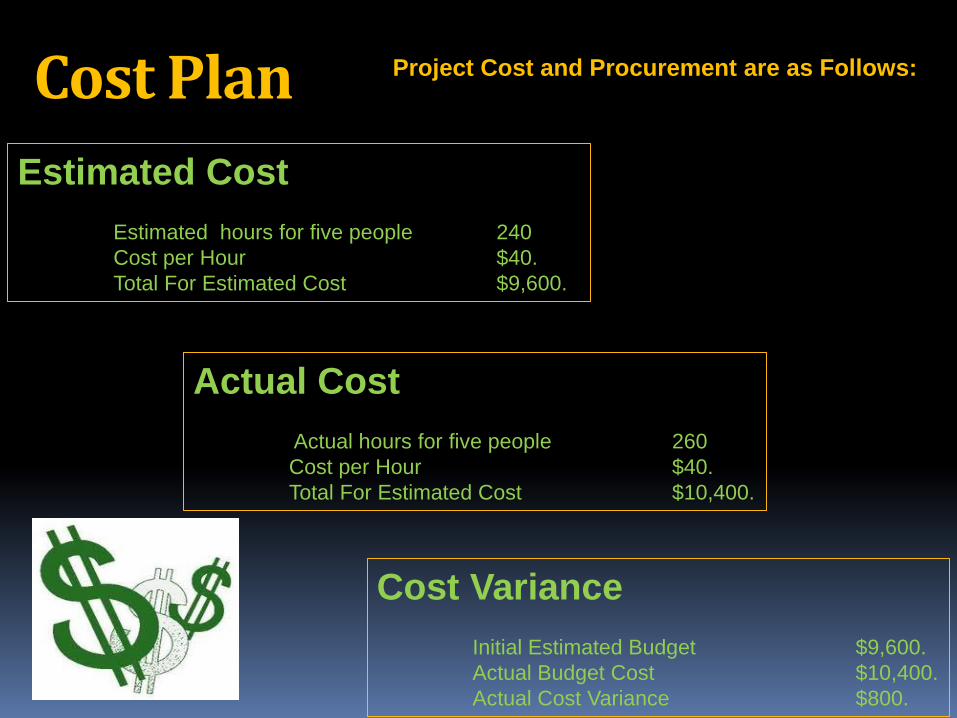
Cost Plan
Project Cost and Procurement are as Follows:
Estimated Cost
Estimated hours for five people 240
Cost per Hour $40.
Total For Estimated Cost $9,600.
Actual Cost
Actual hours for five people 260
Cost per Hour $40.
Total For Estimated Cost $10,400.
Cost Variance
Initial Estimated Budget $9,600.
Actual Budget Cost $10,400.
Actual Cost Variance $800.

Risk Management
What is Risk Management?

Why is it important?
Risk Management

Risk Management
Risk Analysis
Risk ID & Description Category Potential Impact Probably (1-5)
Impact (1-5)
Risk (1-25)
Risk Response Plan
1. Lack of Knowledge of Dashboard Technology from Project team members
Internal risk Project Delay 2 5 10 Avoid the risk by assigning the learning of Dashboard Technology to team member
2. Scope of the Project changes External risk Project Delay 2 5 10 Out of team's control. Stay in communication with project sponsor. Close communication with project mentor if changes occur
3. No funding for additional resources to complete project/product (dashboard)
External risk Not meeting project deliverables
5 4 20 Extensive product research, communication between sponsor & project team
4. Participation & availability of them members to complete assigned tasks
Internal risk Imbalance of workload / project
deadline
1 5 5 Project Team Members have buy-in to project & finished product. Good communication
5. Six week project timeline restriction
Project Management Risk
Project / Product not completed
1 5 5 Communication, finish all assigned tasks, present project/product on time

WEAKNESSES
•Team has not created dashboard
prior to project
•Time to complete project/product
OPPORTUNITIES
•Dashboard can be utilized state
wide for a variety of surveys
Risk Management
THREATS
•Unforeseen project scope
changes
•6 week timeline to complete
project & deliver product
STRENGTHS
•Knowledgeable project team
•Strong support / communication
from sponsor
•No procurement cost
SWOT Analysis

Human Resource Management
What is Human Resource Management?

Human Resource Management
Why is it important?
Human Resource Management
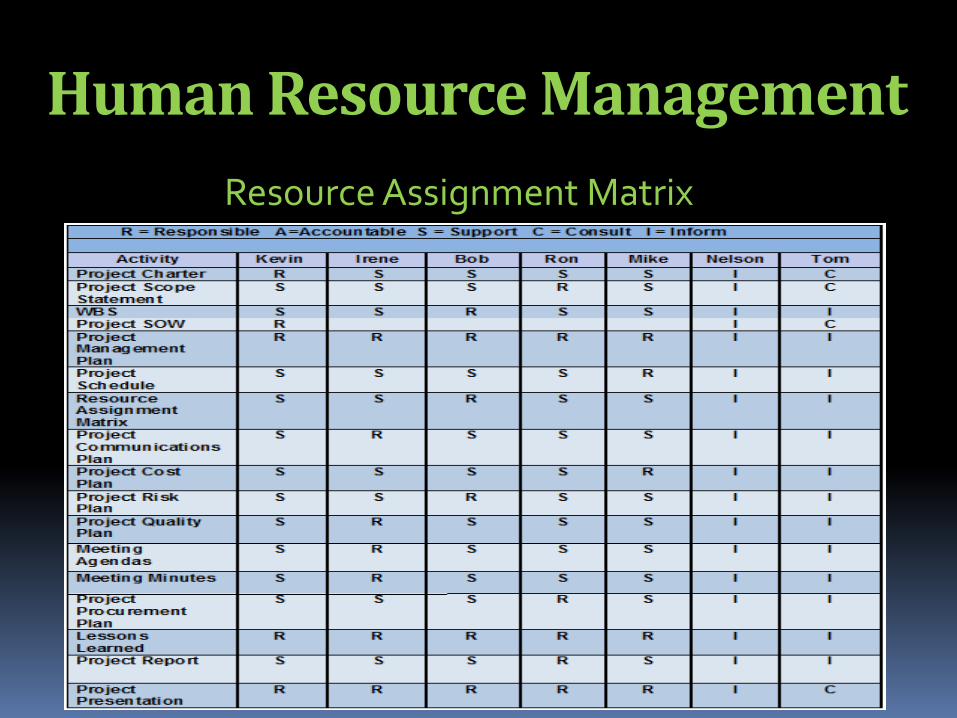
Resource Assignment Matrix

Communications Plan
Welcome
Bienvenidos
One message can be expressed in many ways…

Communications Plan
Quality Management Plan
• Quality of DAS • Quality of Dashboard • Quality of Project • Quality of Presentation
Total Quality Management: Everyone in the organization is responsible for quality.
Site Visits
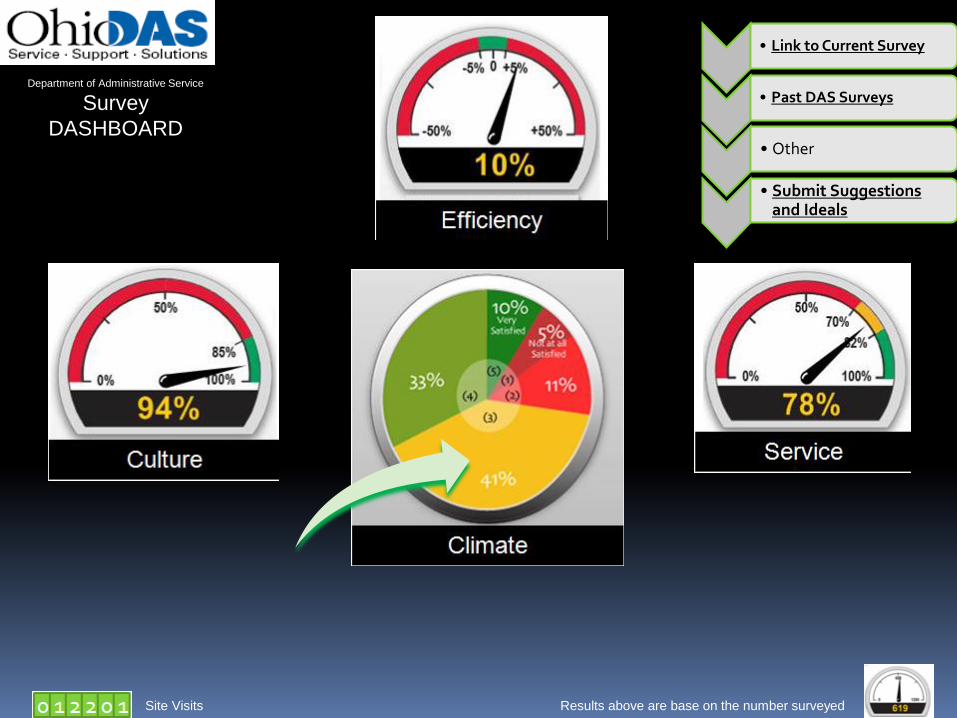
Department of Administrative Service
Survey
DASHBOARD
Results above are base on the number surveyed
• Link to Current Survey
• Past DAS Surveys
• Other
• Submit Suggestions and Ideals

SURVEY DASHBOARD
LEVEL 2
Climate
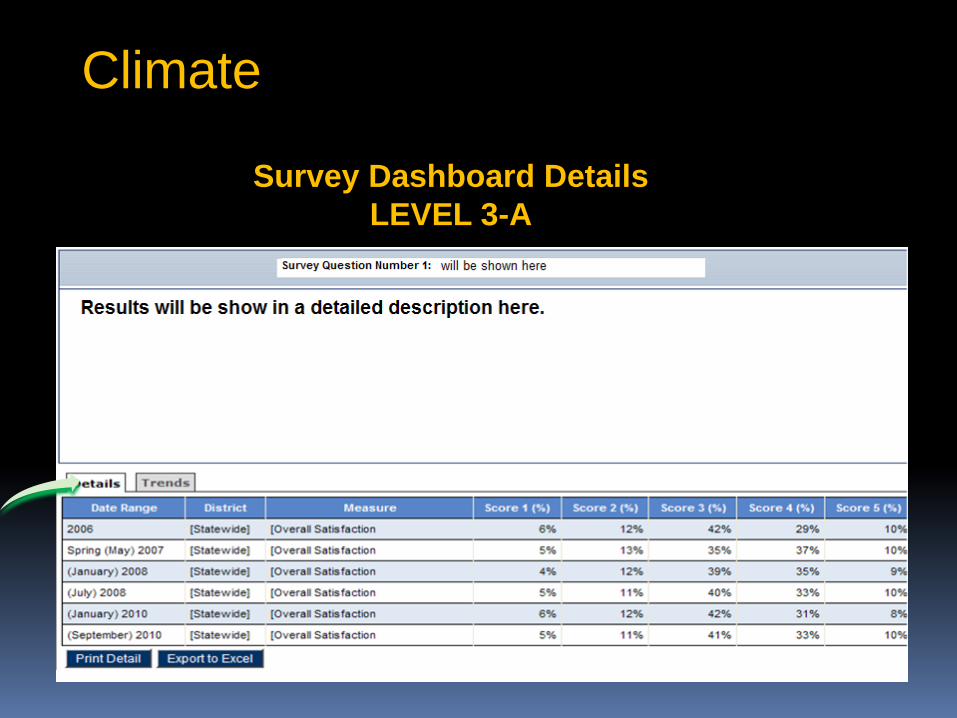
Climate
Survey Dashboard Details
LEVEL 3-A
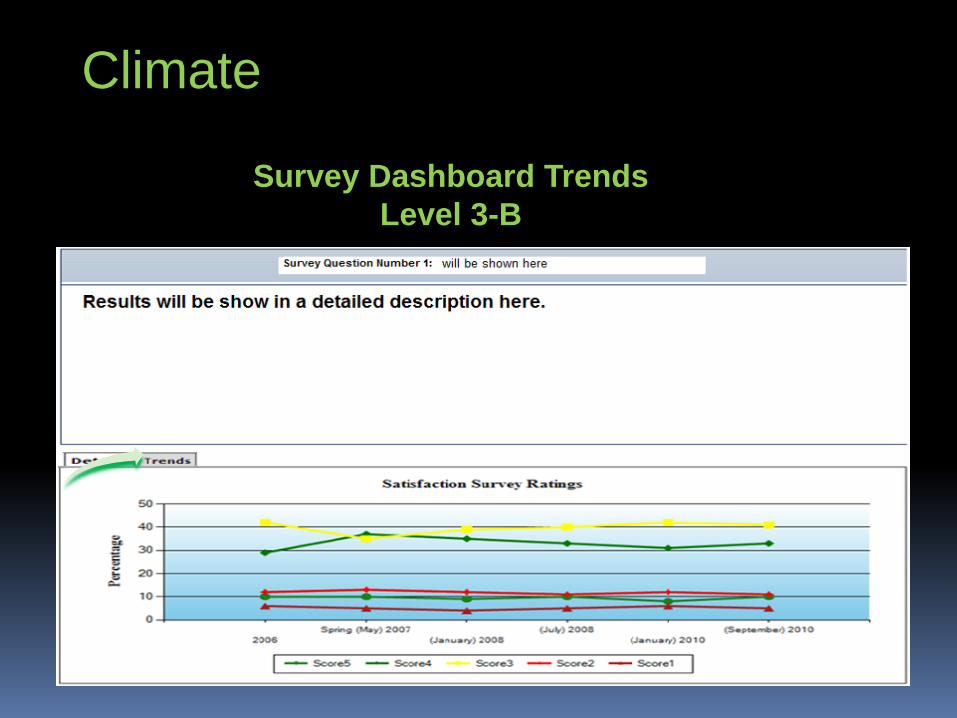
Climate
Survey Dashboard Trends
Level 3-B


John R. Kasich, Governor
Robert Blair, Director
Project Name
PROJECT IDENTIFICATION Project Sponsor Agency Name
Employee Survey Dashboard Tom Terez Administrative Services Project Number (Finance Code – Optional)
Project Manager Date Created
Kevin Kent October 1, 2011
PROJECT MANAGER AND AUTHORITY LEV EL Project Manager and Level of Authority
The Project Manager, Kevin Kent, is hereby authorized to interface with management as required, negotiate for resources, delegate responsibilities within the framework of the project, and to communicate with all contractors and management, as required, to ensure successful and timely completion of the project. The Project Manager is responsible for developing the project plan, monitoring the project’s schedule, control of the project’s scope and authorized to spend the project’s budget during the project’s life cycle.
APPROVAL Name Title Date Approved
Tom Terez Lean Ohio 10/18/2011 < Yes, No, Pending >
Tom Terez ( Per Tom’s e-mail, electronic Sign Off)
(If Using Hard Copy) Signature

John R. Kasich, Governor
Robert Blair, Director
PROJECT CHARTER Project Background and Purpose
As part of the strategic planning process being conducted by DAS leadership, surveys were conducted to gather input from DAS employees. This project management team is to create dashboard schematics that will assist in the completion of a DAS dashboard that will have indicators of how they are progressing through surveys.
Business Case
DAS has requested our team to analyze existing data and develop schematics of a possible dashboard that will assist in future surveys. Currently DAS lacks having a tool with the ability to analyze the results and have them viewable at a glance. The dashboard will provide an easy method to display and interpret survey data to aid in decision making.
Product/Service Description and Deliverables
Dashboard
• Dashboard (top-level and second-level schematics; third-level if time allows) • Description of inputs and steps that feed the dashboard • Implementation recommendations for key DAS developers and implementers • Presentation • Final report
Project Timeline
September 20 – November 1, 2011 Tasks :
• Information gathering will be done September 20 – 27 • Review and Analysis of guiding principles September 27 – October 4 • Dashboard Schematics development October 4 – October 25 • Inputting data into dashboard October 4 – October 25 • Dashboard Test October 11 – October 25 • Presentation November 1
John R. Kasich, Governor
Robert Blair, Director
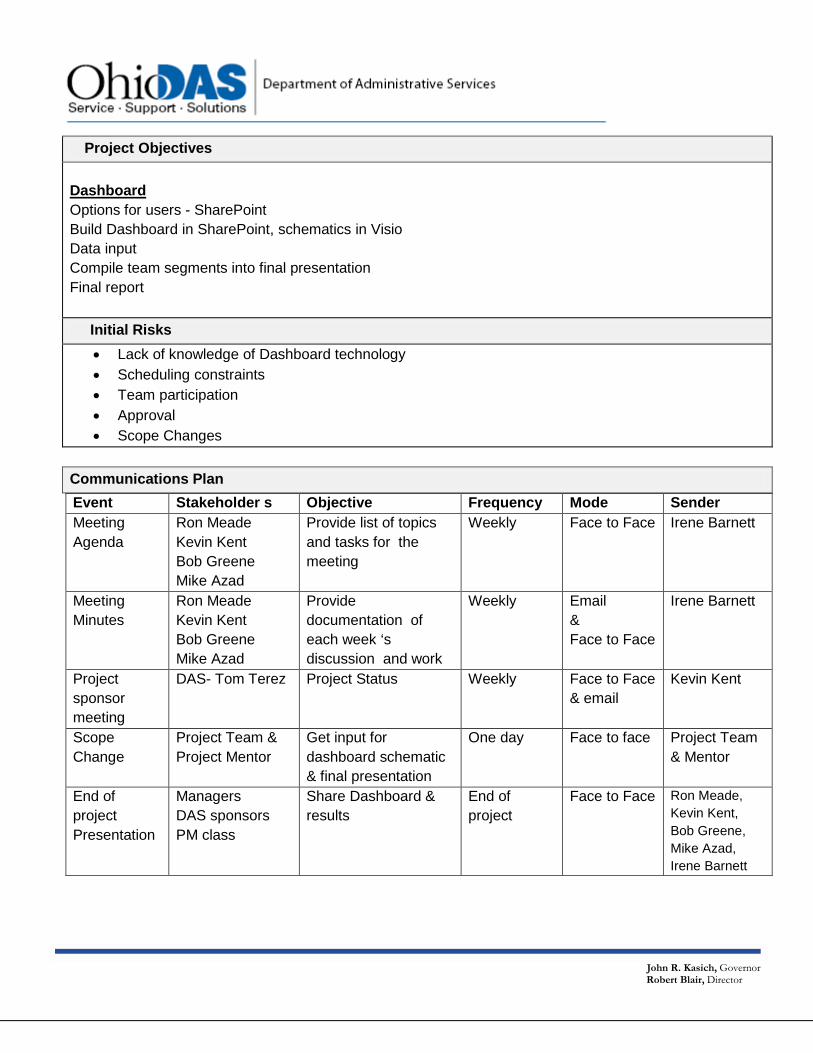
Project Objectives
Dashboard
Options for users - SharePoint Build Dashboard in SharePoint, schematics in Visio Data input Compile team segments into final presentation Final report Initial Risks
• Lack of knowledge of Dashboard technology • Scheduling constraints • Team participation • Approval • Scope Changes
Communications Plan
Event Stakeholder s Objective Frequency Mode Sender
Meeting Agenda
Ron Meade Kevin Kent Bob Greene Mike Azad
Provide list of topics and tasks for the meeting
Weekly Face to Face Irene Barnett
Meeting Minutes
Ron Meade Kevin Kent Bob Greene Mike Azad
Provide documentation of each week ‘s discussion and work
Weekly Email & Face to Face
Irene Barnett
Project sponsor meeting
DAS- Tom Terez Project Status Weekly Face to Face & email
Kevin Kent
Scope Change
Project Team & Project Mentor
Get input for dashboard schematic & final presentation
One day Face to face Project Team & Mentor
End of project Presentation
Managers DAS sponsors PM class
Share Dashboard & results
End of project
Face to Face Ron Meade, Kevin Kent, Bob Greene, Mike Azad, Irene Barnett

John R. Kasich, Governor
Robert Blair, Director
PROJECT SCOPE PROJECT OVERVIEW
Project Scope Statement Project name: DAS Employee Survey Dashboard Department: Department of Administrative Services Project Manager: Kevin Kent Project Sponsor: Tom Terez Date: Sept 27, 2011 Project Business Case: Department of Administrative Services (DAS) has requested our project management team to develop a schematic of a dashboard for survey results that will show a top level (of what users will see as the main opening screen), a secondary level (of what user will see with a little more in-depth look, and a possible third level of design that will allow a more in-depth look of the second level. Project Product/ Description: Dashboard (user interface that organizes and presents information in a way that is easy to read) that can be used for displaying survey data. For this project – we will be using DAS‘s recent employee survey as a sample to create the schematics and possible model of the dashboard tool. The value of this project is to create a dashboard that will be user friendly and the will provide feedback to employees on the agency’s Culture, Efficiency, Service and Climate. Product acceptance criteria: Creation of the dashboard schematics and user guide that will display results for future DAS surveys and can be implemented and repeated for use by multiple agencies and surveys over time. Products/deliverables : Dashboard (top-level and second –level Schematics; Third level if time allows) User tip and instruction (users guide) Description of inputs and steps that feed the dashboard Implementation recommendations for key DAS developers and implementers Presentation Final report

John R. Kasich, Governor
Robert Blair, Director
PROJECT SCOPE (CONTINUED) PROJECT OVERVIEW CONTINUED
Project exclusions: Building new survey package Implementation survey results Project Constraints: Availability of team Lack of dashboard development expertise Team was not part of the survey development Team members are not DAS employees Team members are not DAS employees impacting understanding of organization, environment, climate, terminology and culture. Lack of funding Project Assumption: Survey content will not impact dashboard schematics A dashboard is the preferred tool for customer Team members are available on Tuesdays throughout project Deliverables will be completed on time No procurement activities Project timeline: Sept 20 – Nov 1 2011 Risks Lack of knowledge of Dashboard technology Sponsor terminates project Sponsor changes scope Miscommunication between team members Miscommunication between project sponsor and team Team member availability Scheduling constraints Team participation

DAS SURVEY DASHBOARD WBSNOVEMBER 2011
DASHBOARD
1.2
PROJECT
MANAGEMENT
1.1
INPUTS TO
DASHBOARD
1.3
IMPLEMENTATION
RECOMMENDATIONS
1.4
PRESENTATION
1.5
FINAL REPORT
1.6
TOP LEVEL
SCHEMATIC
1.2.1
2ND LEVEL
SCHEMATIC
1.2.2
3RD LEVEL
SCHEMATIC
1.2.3
MEETING
AGENDA
1.1.1
MEETING
MINUTES
1.1.2
CULTURE
1.3.1
EFFICIENCY
1.3.1.1
STATE IMPACT/
CLIMATE
1.3.1.3
CUSTOMER
SERVICE
1.3.1.2
AGENCY
DIVISIONS/
SECTIONS
1.3.1.1.1
DELIVERABLES
1.3.1.1.1.1
AGENCY
DIVISIONS/
SECTIONS
1.3.1.2.1
DELIVERABLES
1.3.1.2.1.1
AGENCY
DIVISIONS/
SECTIONS
1.3.1.3.1
DELIVERABLES
1.3.1.3.1.1
LEARN
SHAREPONT/
ACCESS
1.4.1
INPUT
SCHEMATICS
1.4.3
DEFINE
SCHEMATICS
1.4.2
DEFINE/DIVIDE
ROLES
1.5.1
CREATE
PRESENTATION
1.5.2
WALK THROUGH/
DRY RUN
1.5.3
PRESENT
PROJECT
1.5.4
TAKE-AWAYS
1.6.1
OPTIONAL USES
OF DASHBOARD
1.6.2
OTHER AGENCY
USES
1.6.2.1
COMPILE DATA
1.6.3
CREATE FINAL
DRAFT
1.6.4
SUBMIT FINAL
REPORT
1.6.5
SCOPE
STATEMENT
1.1.3
WBS
1.1.4
SCHEDULE
1.1.5
RESOURCE
MATRIX
1.1.6
COMM. PLAN
1.1.7
COST PLAN
1.1.8
RISK PLAN
1.1.9
QUALITY PLAN
1.1.10
LESSONS
LEARNED
1.1.11
FINAL REPORT
1.1.12

John R. Kasich, Governor
Robert Blair, Director
COST MANAGEMENT
Estimated Cost
Estimated hours for five people 240
Cost per Hour $40.
Total For Estimated Cost $9,600.
Actual Cost
Actual hours for five people 260
Cost per Hour $40.
Total For Estimated Cost $10,400.
Cost Variance
Initial Estimated Budget $9,600.
Actual Budget Cost $10,400.
Actual Cost Variance $800.
• Project completed on time, however over budget in man hours
• There was a cost Variance of $800., as to our initial cost projection
• Additional resources will be needed for completion of a working model

John R. Kasich, Governor Robert Blair, Director
QUALITY MANAGEMENT
Total Quality Management: Everyone in the organization is responsible for quality.
Based on the team’s meeting with Director Blair and sponsor Tom Terez , it is clear that DAS desires to be a high quality service provider to its internal and external customers as well as a desirable employer.
The quality of the dashboard as a true indicator of DAS’s culture, gauged by service, climate and efficiency will be based on the timeliness of the information gathered, honesty and trust of the employees surveyed and the interpretation and analysis of the dashboard readings.
The quality of this project plan is also based on everyone’s contribution to the idea that we want absolute customer and sponsor satisfaction that the deliverables precisely follow the requirements of the scope.
For today’s presentation - attention to quality were considered for :
Visual integrity and relevance of handouts
Simplicity of project steps and project management messages
Relevance and usefulness of recommendations , resources and links; and
Implementation of the Dashboard

John R. Kasich, Governor Robert Blair, Director
RESOURCE ASSIGNMENT MATRIX R = Responsible A=Accountable S = Support C = Consult I = Inform
Activity Kevin Irene Bob Ron Mike Nelson Tom
Project Charter R S S S S I C
Project Scope Statement
S S S R S I C
WBS S S R S S I I
Project SOW R I C
Project Management Plan
R R R R R I I
Project Schedule
S S S S R I I
Resource Assignment Matrix
S S R S S I I
Project Communications Plan
S R S S S I I
Project Cost Plan
S S S S R I I
Project Risk Plan
S S R S S I I
Project Quality Plan
S R S S S I I
Meeting Agendas
S R S S S I I
Meeting Minutes S R S S S I I
Project Procurement Plan
S S S R S I I
Lessons Learned
R R R R R I I
Project Report R S S R S I I
Project Presentation
R R R R R I C

Project Communications Plan Project Name: DAS Employee Survey Dashboard Project Sponsor: DAS – Tom Terez Project Manager: Kevin Kent
Event Target
Audience Message Objective Timing Vehicles Sender Impacts Comments
Project Core Team Meeting's Agenda and Minutes
Project Team Nelson Gonzales and Tom Terez
1.) review of assigned action items
2.) review of the project status
3.) address outstanding issues.
Weekly Electronic Mail
Irene Barnett Provided meeting structure.
Project Core Team Meeting communications
Project Team Nelson Gonzales and Tom Terez
Example: Communicate and confirm all decisions or agreements made, and any action items (with the assignee established) during the Core Team meeting.
At least weekly or sooner if needed.
Electronic Mail
All team members
Provided documentation for project team of the weekly discussion . .
Weekly Project Status Updates
Project Team Nelson Gonzales and Tom Terez
Project's status, high level achievement and any possible risks or issues, including conflicts.
Every Week Example: Electronic Mail
All team members
Provided documentation of project team work.
Special Meeting with DAS
Met with Director Blair and Tom Terez On October 4 2011 on project scope.
Opportunity to discuss Director Blair’s idea of this project and deliverables to finalize the team’s scope statement.
October 4 2011 In person Project team Tom Terez Director Blair
The team gained knowledge of the agency, the leadership direction and strategies for the use for the dashboard.
Meeting & communications with Sponsor
Communications with Tom Terez to clarify and confirm project scope.
To make sure that the team scope statement and work is documented and approved by sponsor.
September 27, 2011 October 3 , 2011 October 4, 2011 October 10, 2011 October 11, 2011
In person and Electronic Mail
Project team Tom Terez
The team gained knowledge of the scope of work , the direction and strategies for the use for the dashboard
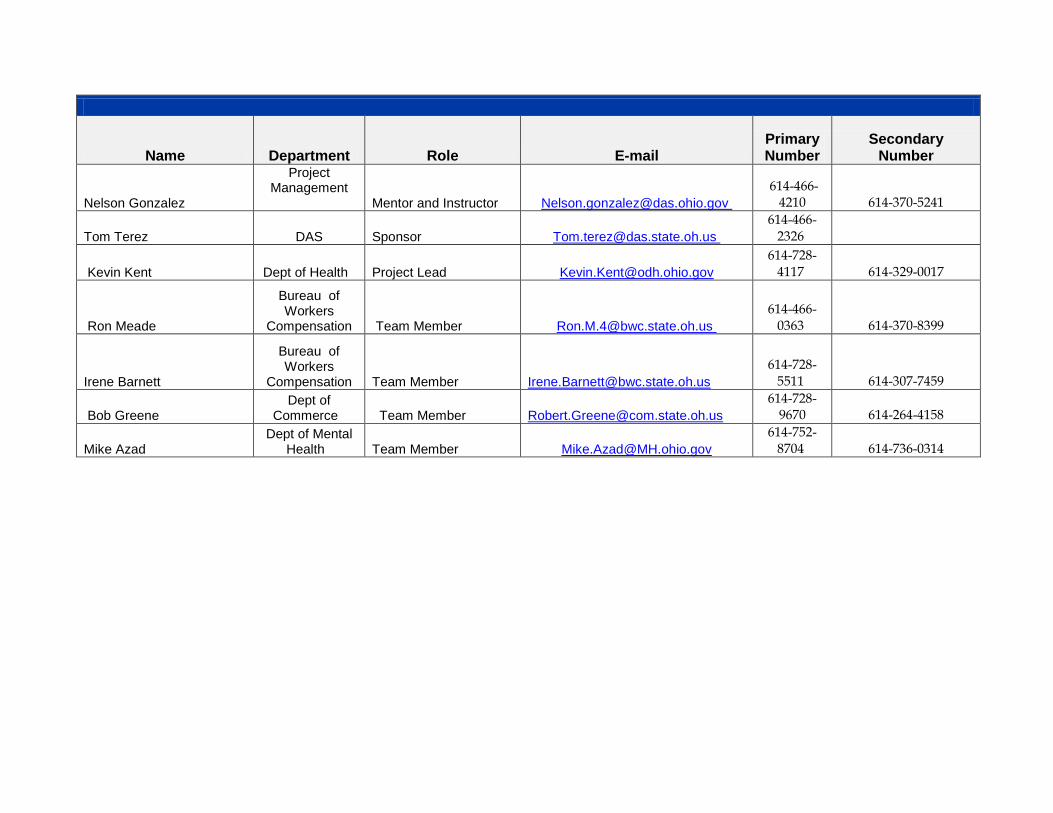
Name Department Role E-mail Primary Number
Secondary Number
Nelson Gonzalez
Project Management
Mentor and Instructor [email protected]
614-466-4210 614-370-5241
Tom Terez DAS Sponsor [email protected]
614-466-2326
Kevin Kent Dept of Health Project Lead [email protected]
614-728-4117 614-329-0017
Ron Meade
Bureau of Workers
Compensation Team Member [email protected]
614-466-0363 614-370-8399
Irene Barnett
Bureau of Workers
Compensation Team Member [email protected]
614-728-5511 614-307-7459
Bob Greene Dept of
Commerce Team Member [email protected]
614-728-9670 614-264-4158
Mike Azad Dept of Mental
Health Team Member [email protected]
614-752-8704 614-736-0314

John R. Kasich, Governor Robert Blair, Director
RISK PLAN RISK REGISTER
Risk ID & Description
Category Potential Impact
Prob. (1-5)
Impact (1-5)
Risk (1-25)
Risk Response Plan
1. Lack of knowledge of Dashboard Technology from project team members
Internal risk Project delay
2 5 10 Avoid the risk by assigning the learning of Dashboard Technology to team member
2.Scope of the project changes
External risk Project delay
2 5 10 Out of team's control. Stay in communication with project sponsor. Close communication with project mentor if changes occur
3.No funding for additional resources to complete project / product (dashboard)
External risk Not meeting project deliverables
5 4 20 Extensive product research, communication between sponsor & project team
4.Participation & availability of team members to complete assigned tasks
Internal risk Imbalance of workload / project deadline
1 5 5 Project Team Members have buy-in to project & finished product. Good communication
5.Six week project timeline restriction
Project Management risk
Project/ Product not completed
1 5 5 Communication, finish all assigned tasks, present project/product on time

John R. Kasich, Governor Robert Blair, Director
SWOT ANALYSIS
STRENGTHS
• Knowledgable project team • Strong support /
communication from sponsor • No Procurement costs
WEAKNESSES
• Team has not created dashboard prior to project
• Time to complete project/product
OPPORTUNITIES
• Dashboard can be utilized state wide for a variety of surveys
THREATS
• Unforseen project scope changes
• 6 week timeline to complete project & deliver product