Embed Size (px)
Citation preview
DANMARKS NATIONALBANK
WORKING PAPERS
2010 •••• 70
Birgitte Vølund Buchholst
(Danmarks Nationalbank)
Jacob Gyntelberg
(Bank for International Settlements)
Thomas Sangill
(Danmarks Nationalbank)
Liquidity of Danish Government and Covered Bonds – Before, During and After the Financial Crisis –
Preliminary Findings
September 2010

The Working Papers of Danmarks Nationalbank describe research and development, often still ongoing, as a contribution to the professional debate.
The viewpoints and conclusions stated are the responsibility of the individual contributors, and do not necessarily reflect the views of Danmarks Nationalbank.
As a general rule, Working Papers are not translated, but are available in the original language used by the contributor.
Danmarks Nationalbank's Working Papers are published in PDF format at www.nationalbanken.dk. A free electronic subscription is also available at this Web site.
The subscriber receives an e-mail notification whenever a new Working Paper is published.
Please direct any enquiries to Danmarks Nationalbank, Communication Desk, Havnegade 5, DK-1093 Copenhagen K Denmark Tel.: +45 33 63 70 00 (direct) or +45 33 63 63 63 Fax : +45 33 63 71 03 E-mail:[email protected]
Nationalbankens Working Papers beskriver forsknings- og udviklingsarbejde, ofte af foreløbig karakter, med henblik på at bidrage til en faglig debat.
Synspunkter og konklusioner står for forfatternes regning og er derfor ikke nødvendigvis udtryk for Nationalbankens holdninger.
Working Papers vil som regel ikke blive oversat, men vil kun foreligge på det sprog, forfatterne har brugt.
Danmarks Nationalbanks Working Papers er tilgængelige på Internettet www.nationalbanken.dk i pdf-format. På webstedet er det muligt at oprette et gratis elektronisk abonnement, der leverer en e-mail notifikation ved enhver udgivelse af et Working Paper.
Henvendelser kan rettes til : Danmarks Nationalbank, Kommunikation, Havnegade 5, 1093 København K. Telefon: 33 63 70 00 (direkte) eller 33 63 63 63 E-mail: [email protected]
Det er tilladt at kopiere fra Nationalbankens Working Papers - såvel elektronisk som i papirform - forudsat, at Danmarks Nationalbank udtrykkeligt anføres som kilde. Det er ikke tilladt at ændre eller forvanske indholdet.
ISSN (trykt/print) 1602-1185
ISSN (online) 1602-1193

Abstract1
We present preliminary findings on the liquidity of the government and
covered bond markets in Denmark before, during and after the 2008
financial crisis. The analysis focuses on wholesale trading in benchmark
bonds in the two markets and is based on an up to now unused transaction
level dataset for the period from January 2005 until May 2010. We find that
even though trading continued during the crisis, both markets experienced
substantial declines in liquidity and significantly increased liquidity risk.
Overall, our findings suggest that Danish benchmark covered bonds by and
large are as liquid as Danish government bonds during periods of market
stress. The findings also suggest that before the crisis government bonds
were slightly more liquid than covered bonds in both the short- and long-
term market segments. For the period after the crisis, the two markets
appear to have had more or less the same level of liquidity for short-term as
well as long-term bonds.
1 The authors would like to thank Jens Dick-Nielsen, Ib Hansen, Kristian Kjeldsen,
Jesper Lund, Birgitte Søgaard Holm and Christian Upper for useful comments and discussions. All errors are attributable to the authors.

4
Non-technical summary
This paper presents preliminary findings on the liquidity of the Danish
government and covered bond markets before, during and after the 2008
financial crisis. The analysis focuses on wholesale trading in benchmark
bonds in the two markets and is based on an up to now virtually unused
high-frequency transaction dataset for the period from January 2005 until
May 2010. To our knowledge the only previous study which has used
transaction level data to analyse the liquidity of Danish bonds is Nyholm
(1999).
Overall, our findings suggest that Danish benchmark covered bonds by and
large are as liquid as Danish government bonds during periods of market
stress. Our findings also suggest that before the crisis government bonds
were slightly more liquid than covered bonds in both the short- and long-
term market segments. For the period after the crisis, our findings suggest
that the two markets have had more or less the same level of liquidity for
short-term as well as long-term bonds. This conclusion is supported by
standard liquidity indicators such as the turnover rate, median trade size, the
Roll (1984) bid-ask spreads and the Amihud (2002) price impact measure of
illiquidity.
Concerning the variability of liquidity or liquidity risk, we find a notable
increase during the crisis for short-term government and long-term fixed-
rate callable covered bonds. This is consistent with theories of liquidity risk
which suggest that both the level of liquidity and idiosyncratic liquidity risk
contribute to expected returns of securities (Acharya and Pedersen (2005)).
The notable increase in the liquidity risk measures could reflect that the
funding constraints of capital constrained traders become binding during the
crisis (Brunnermeier and Pedersen (2009)).
Perhaps surprisingly, we also find that relative to the period before the
crisis, liquidity risk decreased during the crisis for short-term covered bonds
and long-term government bonds. It suggests that these markets saw less
dramatic price moves in response to trades – consistent with our finding that
liquidity was higher in these market segments during the crisis. Finally, we
find that liquidity risk of the short-term covered bond market has remained
low in the period after the crisis, while it has increased for short-term
government bonds. In contrast, liquidity risk in long-term bond markets
have been higher after than before the crisis for both covered and
government bonds.

5
1. Introduction
In contrast to several other mortgage and securitisation bond markets,
trading continued in the Danish covered bond market during the crisis. Both
the government and the covered bond markets, however, did experience
substantial declines in liquidity.
In Denmark the outstanding volume of government bonds correspond to
around 35 per cent of GDP while the outstanding volume of covered bonds
or mortgage bonds is around 140 per cent of GDP. Both government and
covered bonds are included as eligible securities in the collateral base used
by the Danish central bank.
This paper presents preliminary findings on the liquidity of the Danish
government and covered bond markets before, during and after the 2008
financial crisis. The analysis focuses on wholesale trading in benchmark
bonds in the two markets and is based on an up to now virtually unused
high-frequency transaction dataset for the period from January 2005 until
May 2010. To our knowledge the only previous study which has used
transaction level data to analyse the liquidity of Danish bonds is Nyholm
(1999).
Our findings suggest that Danish benchmark covered bonds by and large are
as liquid as Danish government bonds during periods of market stress. In
addition, we also find that although liquidity did decline substantially, both
the covered and government bonds on average continued to be fairly liquid
during the crisis. There is little indication that the covered bond market saw
a more significant decline in liquidity than the government bond market.
During the peak of the crisis in September-October 2008 the Amihud
illiquidity measure rose sharply for long-term covered bonds as well as
short- and long-term government bonds. In contrast, it increased only
slightly for short-term covered bonds.2
Before the crisis government bonds were slightly more liquid than covered
bonds in both the short- and long-term market segments. For the period after
the crisis, the two markets have had more or less the same level of liquidity
for both short- and long-term bonds. These conclusions are supported by
standard liquidity indicators such as the turnover rate, median trade size, the
2 The median price impact of trade measures during the crisis imply that a trade of EUR
5,000,000 for an average bond moves the price by just below 0.04 per cent for both short-term covered and government bonds. In the long-term bond markets our price impact of trade liquidity measure implies that a trade of EUR 5,000,000 moves the price of an average covered bond by 0.11 per cent and an average government bond by 0.086 per cent. In comparison, Dick-Nielsen et al. (2009) find that in the US corporate bond market a trade of $300,000 in an average bond moves the price by roughly 0.13 per cent.

6
Roll (1984) bid-ask spreads and the Amihud (2002) price impact measure of
illiquidity.
Concerning the variability of liquidity or liquidity risk we find a notable
increase during the crisis for short-term government and long-term covered
bonds. This is consistent with theories of liquidity risk which suggest that
both the level of liquidity and idiosyncratic liquidity-risk contribute to
expected returns of securities. The notable increase in the liquidity risk
measures suggests that the funding constraints of capital constrained traders
become binding during the crisis. Perhaps surprisingly, we also find that
relative to the period before the crisis, liquidity risk decreased during the
crisis for short-term covered bonds and long-term government bonds. It
suggests that these markets saw less dramatic price moves in response to
trades – consistent with our finding that liquidity was higher in these market
segments during the crisis. This finding may be explained by flight-to-
quality. Finally, we find that the short-term covered market liquidity risk has
remained low in the period after the crisis, while it has increased for short-
term government bonds. In contrast, liquidity risk in long-term bond
markets have been higher after than before the crisis for both covered and
government bonds.
The following section provides a brief overview of developments in the
Danish markets during the financial crisis. Section 3 provides summary
statistics for the two markets and briefly describes the transaction dataset.
Section 4 defines the liquidity measures we use in the following analysis.
Section 5 compares the liquidity of short-term covered and government
bonds. Section 6 compares the liquidity of long-term covered and
government bonds. Section 7 considers the liquidity risk or variability of
liquidity in the four different market segments. The final section concludes.
2. The financial crisis and Danish bond markets
The Danish covered bond market has been affected by the escalation of the
financial crisis, with yields on both short- and long-term covered bonds
increasing considerably in September and October 2008 (Chart 1). At the
same time, the spread to government yields widened (Chart 2). These price
developments clearly suggest that during this crisis period there was
significantly reduced liquidity in the covered bond market.
During this period two policy measures were put in place. The first measure,
which was concluded on 31 October 2008, was an agreement between the
Danish Insurance Association and the Ministry of Economic and Business
Affairs targeting the pension area. The aim was to ensure that the widening
of the spread between covered bonds and government bonds would not
7
force pension funds to divest covered bonds from their portfolios. The
agreement focused on long-term covered bonds as the pension funds
primarily invest in long-term bonds.
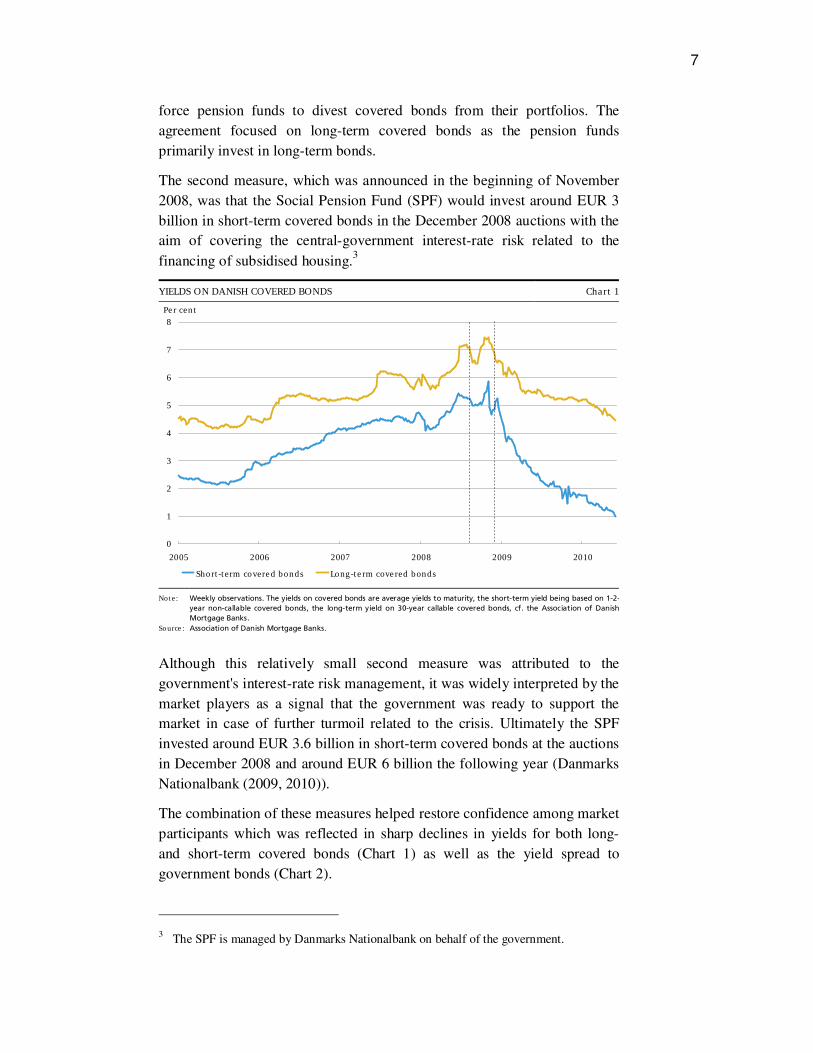
The second measure, which was announced in the beginning of November
2008, was that the Social Pension Fund (SPF) would invest around EUR 3
billion in short-term covered bonds in the December 2008 auctions with the
aim of covering the central-government interest-rate risk related to the
financing of subsidised housing.3
YIELDS ON DANISH COVERED BONDS Chart 1
0
1
2
3
4
5
6
7
8
2005 2006 2007 2008 2009 2010
Short-term covered bonds Long-term covered bonds
Per cent
Note:
Source:
Weekly observations. The yields on covered bonds are average yields to maturity, the short-term yield being based on 1-2-
year non-callable covered bonds, the long-term yield on 30-year callable covered bonds, cf. the Association of Danish
Mortgage Banks.
Association of Danish Mortgage Banks.
Although this relatively small second measure was attributed to the
government's interest-rate risk management, it was widely interpreted by the
market players as a signal that the government was ready to support the
market in case of further turmoil related to the crisis. Ultimately the SPF
invested around EUR 3.6 billion in short-term covered bonds at the auctions
in December 2008 and around EUR 6 billion the following year (Danmarks
Nationalbank (2009, 2010)).
The combination of these measures helped restore confidence among market
participants which was reflected in sharp declines in yields for both long-
and short-term covered bonds (Chart 1) as well as the yield spread to
government bonds (Chart 2).
3 The SPF is managed by Danmarks Nationalbank on behalf of the government.

8
In the following, we define the period before the crisis to be from January
2005 until end-July 2008. We define the crisis period as being the period
from early August 2008 until end-November 2008, i.e. the period in which
the pricing of the Danish bonds was most clearly affected by the financial
crisis. It includes in particular Fannie Mae and Freddie Mac being taken into
conservatorship by the US Government, the AIG bailout and the failure of
Lehmann Brothers (Fender and Gyntelberg (2008)). Finally, the period after
the crisis runs from start December 2008 until end-May 2010.
OPTION-ADJUSTED YIELD SPREAD BETWEEN LONG-TERM GOVERNMENT AND
COVERED BONDS Chart 2
0
20
40
60
80
100
120
140
160
Jan 05
Apr 05
Jul 05
Oct 05
Jan 06
Apr 06
Jul 06
Oct 06
Jan 07
Apr 07
Jul 07
Oct 07
Jan 08
Apr 08
Jul 08
Oct 08
Jan 09
Apr 09
Jul 09
Oct 09
Jan 10
Apr 10
Basis points
Source: Nordea Analytics.
3. The bond markets and the data
Our analysis focuses on wholesale trades in short- and long-term benchmark
bonds. We define wholesale trades as trades with a nominal value of at least
DKK 10 million. Benchmark or large bonds are defined as bonds with an
outstanding nominal amount of at least EUR 1 billion. For covered bonds
we restrict the analysis to short-term bullet bonds and long-term fixed-rate
callable bonds issued by specialised mortgage-credit banks. Thus we do not
analyse the floating rate segment of the covered bond market. Nor do we
analyse covered bonds issued by universal banks.
3.1. Short-term bonds
Short-term covered bonds are fixed-rate bullet bonds while short-term
government bonds are defined as bonds with a time to maturity of maximum
five years.

9
The fixed-rate bullet covered bonds are issued with up to ten years to
maturity. However, the majority of the bonds are issued with only one year
to maturity as they provide funding for adjustable-rate mortgages of which
most have their interest rate reset once a year. Therefore the bonds do not
reach an outstanding amount of EUR 1 billion until the time to maturity is
considerably shorter than ten years. In fact the only covered bond in our
sample of large bonds with time to maturity of more than five years is a
bond which expires 1 January 2015 and is included from August 2009.
Our focus on large bonds in the two markets implies that we cover on
average 77 per cent of the outstanding amount in the covered bond market
whereas we include almost all of the government bond market (Table 1). In
the covered bond market our focus on large bonds excludes 190 small bonds
on average. These small bonds have an average size of only EUR 110
million. Especially in the covered bond market the selection on wholesale
trades exclude a very large number of retail trades. Despite this, we actually
include 93 per cent of the turnover in the large covered bonds.
SHORT-TERM COVERED AND GOVERNMENT BONDS – SUMMARY STATISTICS Table 1
Covered bonds Government bonds
Large bonds Small bonds Large bonds Small bonds
Average total outstanding amount (EUR bn) 74 22 46 1 Average number of bonds 17 190 8 4
Average bond size (EUR bn) 4.44 0.11 6.08 0.27
Wholesale 19.58 6.35 5.41 0.26 Average monthly turnover (EUR bn) Retail 1.45 0.98 0.13 0.00
Wholesale 1,102 695 407 18 Average monthly number of
trades Retail 12,410 7,695 712 81
Wholesale 17.76 9.13 13.28 14.66 Average trade size
(EUR mill.) Retail 0.12 0.13 0.18 0.06
Wholesale 6.24 3.34 8.03 5.11 Median trade size
(EUR mill.) Retail 0.06 0.05 0.04 0.01
Note: Large bonds are defined as bonds with an outstanding amount of at least EUR 1 billion. Wholesale trades are defined as
trades with a nominal turnover of at least DKK 10 million (EUR 1.3 million).
Source: Nasdaq OMX, Danish FSA and Danmarks Nationalbank.
3.2. Long-term bonds
The long-term covered bond market is defined as callable fixed-rate bonds.
By May 2010 the total outstanding nominal amount was EUR 96 billion.
Again the focus on wholesale trades excludes a large number of retail
trades. However, the wholesale trades comprise more than 80 per cent of the
turnover in the large bonds.
There are on average around 1,250 different callable fixed-rate bonds and
their average time to maturity is around 12 years by May 2010. Of the 1,250

10
bonds only 29 bonds on average have a nominal outstanding amount of at
least EUR 1 billion (Table 2). These large bonds, however, make up on
average 60 per cent of the total outstanding nominal amount of long-term
covered bonds. The large number of very small callable fixed-rate bonds
reflects that mortgage-credit banks for regulatory reasons issue bonds with
cash flows that match those of their lending portfolio. A covered bond
cannot be removed from the exchange until all borrowers having their
mortgages funded by this specific bond have paid off their mortgages
completely.
This is very different from the government bond market where the debt is
actively managed in order to obtain a relatively small number of larger and
more liquid bonds.
LONG-TERM COVERED AND GOVERNMENT BONDS – SUMMARY STATISTICS Table 2
Covered bonds Government bonds
Large bonds Small bonds Large bonds Small bonds
Average total outstanding amount (EUR bn) 70 45 43 0.3
Average number of bonds 29 1221 6 2
Average bond size (EUR bn) 2.43 0.04 6.84 0.13
Wholesale 10.65 4.35 6.94 0.07 Average monthly turnover
(EUR bn) Retail 2.29 1.69 0.17 0.00
Wholesale 1,479 927 677 7 Average monthly number of
trades Retail 16,150 13,157 767 9
Wholesale 7.20 4.69 10.24 10.05 Average trade size
(EUR mill.) Retail 0.14 0.13 0.22 0.10
Wholesale 3.64 3.14 5.67 5.56 Median trade size
(EUR mill.) Retail 0.10 0.07 0.07 0.01
Note: Large bonds are defined as bonds with an outstanding amount of at least EUR 1 billion. Wholesale trades are defined as
trades with a nominal turnover of at least DKK 10 million (EUR 1.3 million).
Source: Nasdaq OMX, Danish FSA and Danmarks Nationalbank.
The long-term government bond market is defined as government bonds
with a time to maturity of more than or equal to five years (i.e. the part of
the market that is not defined as short-term). Nearly all of these bonds have
an outstanding nominal amount larger than EUR 1 billion. The outstanding
amount of long-term government bonds with a principal of at least EUR 1
billion has increased slowly since January 2005 until November 2008 from
around EUR 30 to EUR 40 billion. In November 2008 it increased sharply
primarily due to a new issuance of a bond with 30 years to maturity. The
initial outstanding amount of this issue was EUR 7 billion.
3.3. Transaction data
The analysis is based on transaction data from Nasdaq OMX Copenhagen
A/S and the Danish Financial Supervisory Authority (FSA) covering the
period from January 2005 until May 2010. The transaction data from both
11
sources have been combined with contractual information for each bond
from VP Securities A/S.
All covered bonds issued by Danish mortgage-credit banks are listed on
Nasdaq OMX Copenhagen A/S to which all trades – including OTC – are
reported. Before November 2007 all trades in government bonds were also
reported to Nasdaq OMX Copenhagen A/S. However, following the
November 2007 implementation of new MiFID regulations Danish
government bonds have been exempted for post trade publication
requirements. For government bonds we have, therefore, obtained
transaction data from the Danish FSA covering the period from November
2007 until May 2010.4
We have excluded a small number of transactions in government bonds
where the price was not between 50 and 150. For the data from the FSA we
have found it necessary to manually examine all price changes of at least 2
percentage points in order to identify possible errors.
As from November 2007 repurchase transactions in neither the covered nor
the government bond market are required to be reported.5 In both markets,
we have identified and removed a relatively large number of repurchase
transactions.
In the data cleaning process we have generally focused on transactions used
in the following analysis – i.e. wholesale trades in large bonds, cf. the above
definitions.
4. Liquidity measures
We consider four different liquidity measures or proxies.
4.1. Median trade size
The monthly median trade size is calculated as the median of the market
value of each large trade in a given month. The market value is calculated
as: (clean price*nominal quantity)/100.
4 Following MiFID all transactions executed by an investment firm in any financial
instrument admitted to trading on a regulated market shall be reported to the competent authority.
5 Before November 2007 repurchase transactions reported to Nasdaq OMX Copenhagen
A/S were clearly labelled as such.
12
4.2. Turnover rate
The turnover rate is the sum of the market value of all large trades in a
given month divided by the average of the outstanding nominal amounts at
the beginning and the end of the month.
4.3. Bid-ask spread (Roll)
As the data do not contain quotes or bid-ask spreads, we use the finding of
Roll (1984) that under certain conditions the bid-ask spread equals two
times the square root of minus the covariance between adjacent price
changes:
),cov(2 1−∆∆−= iit PPRoll
where t is the period for which the measure is calculated.
Following Dick-Nielsen et. al. (2009) we calculate a daily Roll measure
using a rolling window of 21 trading days. The monthly Roll bid-ask spread
is defined as the median of all daily measures within the month. There are a
number of caveats one should keep in mind when considering the Roll
measure. First, as shown in Stoll (1989), in the presence of adverse selection
or inventory effects it may underestimate the actual bid-ask spread. Second,
as pointed out by Choi (1988), it may be biased if the number of bid and
offer transactions is not balanced. Given the available data it is, however,
not obvious how one can account for these possible sources of bias.
In the calculation of the Roll measure we define price changes as the
difference between adjacent prices. This implies that the bid-ask spread is
defined as the price difference between bid and ask prices.6
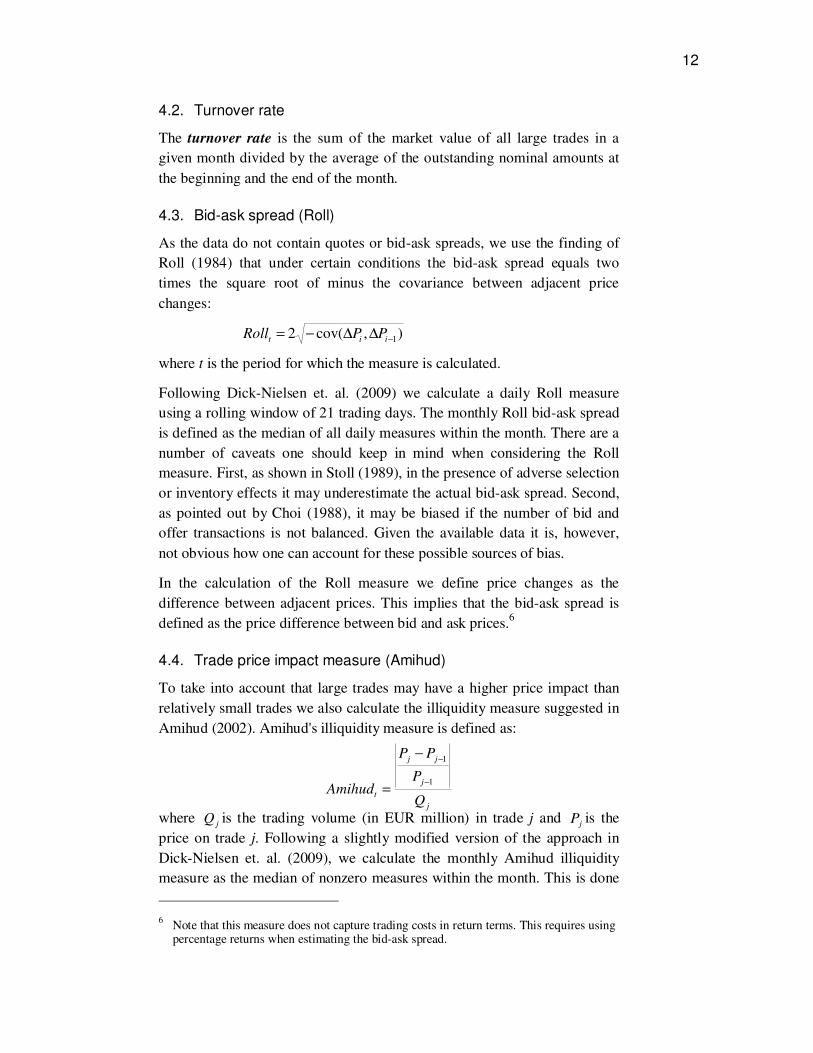
4.4. Trade price impact measure (Amihud)
To take into account that large trades may have a higher price impact than
relatively small trades we also calculate the illiquidity measure suggested in
Amihud (2002). Amihud's illiquidity measure is defined as:
j
j
jj
tQ
P
PP
Amihud1
1
−
−−
=
where jQ is the trading volume (in EUR million) in trade j and jP is the
price on trade j. Following a slightly modified version of the approach in
Dick-Nielsen et. al. (2009), we calculate the monthly Amihud illiquidity
measure as the median of nonzero measures within the month. This is done
6 Note that this measure does not capture trading costs in return terms. This requires using
percentage returns when estimating the bid-ask spread.

13
in part to avoid having the measure reflect possible errors in the government
bond data.
5. Liquidity in short-term bonds
5.1. Market size
The short end of the Danish covered bond market is defined as fixed-rate
bullet covered bonds (cf. Section 3.1). Most bullet bonds are sold at large
auctions during December with settlement on 1 January the following year
and maturity on 1 January one year later. For this reason the total
outstanding amount of bullets increases throughout December and declines
sharply in January. As the market has increased in size, the issuing
mortgage-credit banks have started to spread the auctions on more dates
starting already in November. Furthermore, other maturity dates are
gradually being introduced.
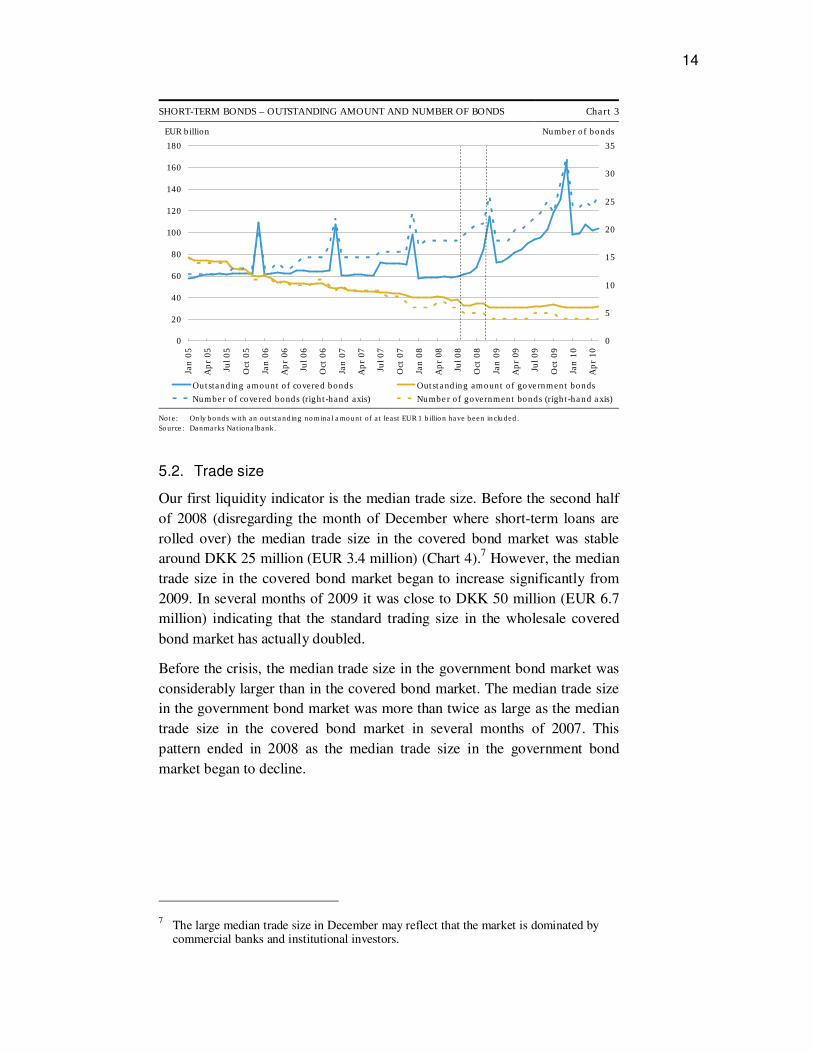
The outstanding nominal amount of short-term covered bonds has (apart
from the temporary increases related to refinancing) remained stable around
EUR 60 billion from January 2005 until 4th quarter 2008 (Chart 3), but has
increased steadily since end-2008. By May 2010 the total outstanding
nominal amount was roughly EUR 100 billion. The increase can to a large
extent be attributed to a steep yield curve (Chart 3) making adjustable-rate
mortgages more attractive to borrowers. In 2005 the outstanding nominal
amounts of short-term covered bonds and government bonds were close in
size. However, this picture has changed dramatically and in 2010 the total
outstanding nominal amount of short-term government bonds was only
around EUR 30 billion – less than one third of the total outstanding nominal
amount of short-term covered bonds.
14
SHORT-TERM BONDS – OUTSTANDING AMOUNT AND NUMBER OF BONDS Chart 3
0
20
40
60
80
100
120
140
160
180
Jan 05
Apr 05
Jul 05
Oct 05
Jan 06
Apr 06
Jul 06
Oct 06
Jan 07
Apr 07
Jul 07
Oct 07
Jan 08
Apr 08
Jul 08
Oct 08
Jan 09
Apr 09
Jul 09
Oct 09
Jan 10
Apr 10
0
5
10
15
20
25
30
35
Outstanding amount of covered bonds Outstanding amount of government bonds
Number of covered bonds (right-hand axis) Number of government bonds (right-hand axis)
EUR billion Number of bonds
Note:
Source:
Only bonds with an outstanding nominal amount of at least EUR 1 billion have been included.
Danmarks Nationalbank.
5.2. Trade size
Our first liquidity indicator is the median trade size. Before the second half
of 2008 (disregarding the month of December where short-term loans are
rolled over) the median trade size in the covered bond market was stable
around DKK 25 million (EUR 3.4 million) (Chart 4).7 However, the median
trade size in the covered bond market began to increase significantly from
2009. In several months of 2009 it was close to DKK 50 million (EUR 6.7
million) indicating that the standard trading size in the wholesale covered
bond market has actually doubled.
Before the crisis, the median trade size in the government bond market was
considerably larger than in the covered bond market. The median trade size
in the government bond market was more than twice as large as the median
trade size in the covered bond market in several months of 2007. This
pattern ended in 2008 as the median trade size in the government bond
market began to decline.
7 The large median trade size in December may reflect that the market is dominated by
commercial banks and institutional investors.

15
SHORT-TERM BONDS – MEDIAN TRADE SIZE Chart 4
0
5
10
15
20
25
Jan 05
Apr 05
Jul 05
Oct 05
Jan 06
Apr 06
Jul 06
Oct 06
Jan 07
Apr 07
Jul 07
Oct 07
Jan 08
Apr 08
Jul 08
Oct 08
Jan 09
Apr 09
Jul 09
Oct 09
Jan 10
Apr 10
Government bonds Covered bonds
EUR million
Note:
Source:
Only bonds with an outstanding nominal amount of at least EUR 1 billion and trades of at least DKK 10 million have been
included.
Nasdaq OMX, Danish FSA and Danmarks Nationalbank.
5.3. Turnover rate
The second liquidity indicator is the turnover rate, i.e. total turnover divided
by the nominal outstanding amount.
As can be seen from Chart 5, the turnover rate was roughly the same in the
two markets before the crises. Except from the month of December the
turnover rates of the two markets have been relatively close until September
2008. From September 2008 and until end 2009 it was markedly higher in
the covered bond market than in the government bond market. By early
2010 the difference between the turnover rates in the two markets had
virtually disappeared, with both markets having higher stable turnover rates
than before the crisis.
The spike in the turnover rate in March 2010 reflects that one of the
mortgage-credit banks began to gain considerable volume in a bond with
maturity on 1 April. This is also reflected in the temporary increase in the
outstanding nominal amount in March 2010 in Chart 3.

16
SHORT-TERM BONDS – MONTHLY TURNOVER RATE Chart 5
0
20
40
60
80
100
120
140
Jan 05
Apr 05
Jul 05
Oct 05
Jan 06
Apr 06
Jul 06
Oct 06
Jan 07
Apr 07
Jul 07
Oct 07
Jan 08
Apr 08
Jul 08
Oct 08
Jan 09
Apr 09
Jul 09
Oct 09
Jan 10
Apr 10
Covered bonds Government bonds
Per cent
Note:
Source:
Only bonds with an outstanding nominal amount of at least EUR 1 billion and trades of at least DKK 10 million have been
included.
Nasdaq OMX, Danish FSA and Danmarks Nationalbank.
5.4. Bid-ask spreads
The Roll measure indicates that both markets have traded with bid-ask
spreads in the interval 5-10 ticks before the crisis (Chart 6). During the
crisis the bid-ask spreads for government bonds jumped to 20 ticks in
October and then over 30 ticks in November 2008.
SHORT-TERM BONDS – BID-ASK SPREAD (ROLL) Chart 6
0
10
20
30
40
50
Jan 05
Apr 05
Jul 05
Oct 05
Jan 06
Apr 06
Jul 06
Oct 06
Jan 07
Apr 07
Jul 07
Oct 07
Jan 08
Apr 08
Jul 08
Oct 08
Jan 09
Apr 09
Jul 09
Oct 09
Jan 10
Apr 10
Covered bonds Government bonds
Ticks
Note:
Source:
Only bonds with an outstanding nominal amount of at least EUR 1 billion and trades of at least DKK 10 million have been
included.
Nasdaq OMX, Danish FSA and Danmarks Nationalbank

17
In contrast, the bid-ask spreads for covered bonds remained stable during
the crisis. Afterwards bid-ask spreads in both markets increased in the early
months of 2009, but have since stabilised around 10 ticks, somewhat higher
than the bid-ask spreads that prevailed before the crisis.
5.5. Price impact of trade
Before the crisis the Amihud illiquidity measures of both government and
covered bonds have been relatively stable (Chart 7). The Amihud measure
of the covered bonds has generally been a little higher than that of the
government bonds – except for the month of December where liquidity in
the covered bond market increases temporarily. In 2008 there is a clear
tendency that the Amihud illiquidity measure of the covered bonds is higher
than in the three previous years.
Before the crisis the price impact of trades was higher for short-term
covered bonds than for government bonds. During the crisis, however, the
price impact measure for government bonds increased rapidly, reaching a
much higher level than was seen for covered bonds (Chart 7). After the
crisis period, the price impact measure remained higher for government
bonds than for covered bonds until June 2009. Thus, although the price
impact of trades in the short-term covered bond market is higher than for
government bonds, our findings suggest that the liquidity is less likely to
deteriorate in periods of market stress.
SHORT-TERM BONDS – PRICE IMPACT OF TRADE (AMIHUD) Chart 7
0.00000
0.00005
0.00010
0.00015
0.00020
Jan 05
Apr 05
Jul 05
Oct 05
Jan 06
Apr 06
Jul 06
Oct 06
Jan 07
Apr 07
Jul 07
Oct 07
Jan 08
Apr 08
Jul 08
Oct 08
Jan 09
Apr 09
Jul 09
Oct 09
Jan 10
Apr 10
Covered bonds Government bonds
Note:
Source:
Only bonds with an outstanding nominal amount of at least EUR 1 billion and trades of at least DKK 10 million have been
included.
Nasdaq OMX, Danish FSA and Danmarks Nationalbank.

18
6. Liquidity in long-term bonds
In this section we compare the liquidity of long-term covered and
government bonds. (See Section 3.2 for definitions of the two market
segments.)
6.1. Market size
The outstanding amount of long-term covered bonds increased gradually
from EUR 65 billion in January 2005 to a peak of around EUR 90 billion in
January 2008 (Chart 8). Since then the outstanding amount has continued to
decline reaching around EUR 50 billion by end-May 2010.
LONG-TERM BONDS – OUTSTANDING AMOUNT AND NUMBER OF BONDS Chart 8
0
10
20
30
40
50
60
70
80
90
100
Jan 05
Apr 05
Jul 05
Oct 05
Jan 06
Apr 06
Jul 06
Oct 06
Jan 07
Apr 07
Jul 07
Oct 07
Jan 08
Apr 08
Jul 08
Oct 08
Jan 09
Apr 09
Jul 09
Oct 09
Jan 10
Apr 10
0
5
10
15
20
25
30
35
40
45
50
Outstanding amount of covered bonds Outstanding amount of government bonds
Number of covered bonds (right-hand axis) Number of government bonds (right-hand axis)
EUR billion Number of bonds
Note:
Source:
Only bonds with an outstanding nominal amount of at least EUR 1 billion have been included.
Danmarks Nationalbank.
6.2. Trade size
Before the crisis, the median trade size for government bonds was EUR 5-7
million (Chart 9). It nearly halved during the crisis period and only slowly
increased after the crisis. By mid 2009 it stabilised around EUR 6-7 million
(DKK 50 million). In October 2008, the median trade size began to increase
again, suggesting that liquidity improved.

19
LONG-TERM BONDS – MEDIAN TRADE SIZE Chart 9
0
1
2
3
4
5
6
7
8
Jan 05
Apr 05
Jul 05
Oct 05
Jan 06
Apr 06
Jul 06
Oct 06
Jan 07
Apr 07
Jul 07
Oct 07
Jan 08
Apr 08
Jul 08
Oct 08
Jan 09
Apr 09
Jul 09
Oct 09
Jan 10
Apr 10
Covered bonds Government bonds
EUR million
Note:
Source:
Only bonds with an outstanding nominal amount of at least EUR 1 billion and trades of at least DKK 10 million have been
included.
Nasdaq OMX, Danish FSA and Danmarks Nationalbank.
For the covered bonds the median trade size has been remarkable stable
close to EUR 3 million throughout most of 2008 and the beginning of 2009.
This is a little lower than both before and after the crisis. However, the
decrease in trade size during the crisis has been much less pronounced for
covered bonds than for government bonds.
6.3. Turnover rate
Before the crisis the turnover rate for both covered and government bonds
declined quickly during 2005, and has since then remained in the interval
15-25 per cent for most of the period until late 2007 (Chart 10). Since late
2007, including during the crisis, the turnover rate for covered bonds has
been fairly stable around 10 per cent. In the same period, the government
bond turnover rate, although less stable, has also declined and has stabilised
a little below that for covered bonds. During the crisis, however, the
turnover rate did spike upwards to around 20 per cent for government
bonds.
The higher turnover rate for covered than for government bonds since the
beginning of 2009 may reflect the large increase in outstanding amount of
government bonds at the end of 2008 due to the new issuance of a
government bond with 30 years to maturity. The turnover rate for this bond
has been smaller than that for other long-term government bonds, as more
than 80 per cent of the outstanding amount is held by pension funds.

20
LONG-TERM BONDS - MONTHLY TURNOVER RATE Chart 10
0
10
20
30
40
50
60
70
Jan 05
Apr 05
Jul 05
Oct 05
Jan 06
Apr 06
Jul 06
Oct 06
Jan 07
Apr 07
Jul 07
Oct 07
Jan 08
Apr 08
Jul 08
Oct 08
Jan 09
Apr 09
Jul 09
Oct 09
Jan 10
Apr 10
Covered bonds Government bonds
Per cent
Note:
Source:
Only bonds with an outstanding nominal amount of at least EUR 1 billion and trades of at least DKK 10 million have been
included.
Nasdaq OMX, Danish FSA and Danmarks Nationalbank.
6.4. Bid-ask spreads
Roll's measure indicates that both markets have traded with bid-ask spreads
around 10-20 ticks before the crisis (Chart 11). The spreads increase in the
period leading up to the crisis and peak at around 50 ticks for the covered
bonds in November 2008.
LONG-TERM BONDS – BID-ASK SPREAD (ROLL ) Chart 11
0
10
20
30
40
50
Jan 05
Apr 05
Jul 05
Oct 05
Jan 06
Apr 06
Jul 06
Oct 06
Jan 07
Apr 07
Jul 07
Oct 07
Jan 08
Apr 08
Jul 08
Oct 08
Jan 09
Apr 09
Jul 09
Oct 09
Jan 10
Apr 10
Covered bonds Government bonds
Ticks
Note:
Source:
Only bonds with an outstanding nominal amount of at least EUR 1 billion and trades of at least DKK 10 million have been
included.
Nasdaq OMX, Danish FSA and Danmarks Nationalbank.

21
The peak is also around 50 ticks for government bonds. This peak was
reached in February 2009 instead of during the crisis. In October 2008 the
spreads were almost equal with the spread being just 1 tick higher for
covered bonds. The spread for the covered bond market seems to have
stabilised around 15 ticks whereas the spread for government bonds is both
higher and more volatile.
6.5. Price impact of trade
The Amihud measure has been higher for covered bonds than for
government bonds with the exception of a brief period in early 2009 (Chart
12). During the peak of the crisis in October 2008 and the period leading up
to the crisis there was a notable increase in the illiquidity measure in both
markets.
The increase is somewhat higher for covered bonds than for government
bonds. The trade price impact measure decreased rapidly in the period after
the crisis. By April 2009 it stabilised in both markets at slightly higher
levels than before the crisis.
LONG-TERM BONDS – PRICE IMPACT OF TRADE (AMIHUD) Chart 12
0.00000
0.00005
0.00010
0.00015
0.00020
0.00025
0.00030
0.00035
0.00040
Jan 05
Apr 05
Jul 05
Oct 05
Jan 06
Apr 06
Jul 06
Oct 06
Jan 07
Apr 07
Jul 07
Oct 07
Jan 08
Apr 08
Jul 08
Oct 08
Jan 09
Apr 09
Jul 09
Oct 09
Jan 10
Apr 10
Covered bonds Government bonds
Note:
Source:
Only bonds with an outstanding nominal amount of at least EUR 1 billion and trades of at least DKK 10 million have been
included.
Nasdaq OMX, Danish FSA and Danmarks Nationalbank.
7. Liquidity risk
In addition to the level of liquidity the level of liquidity risk or variability of
liquidity is also of interest as recent studies such as Acharya and Pedersen
(2005) and Brunnermeier and Pedersen (2009) suggest that both the level of
22
liquidity as well as idiosyncratic liquidity-risk contribute to expected
returns.
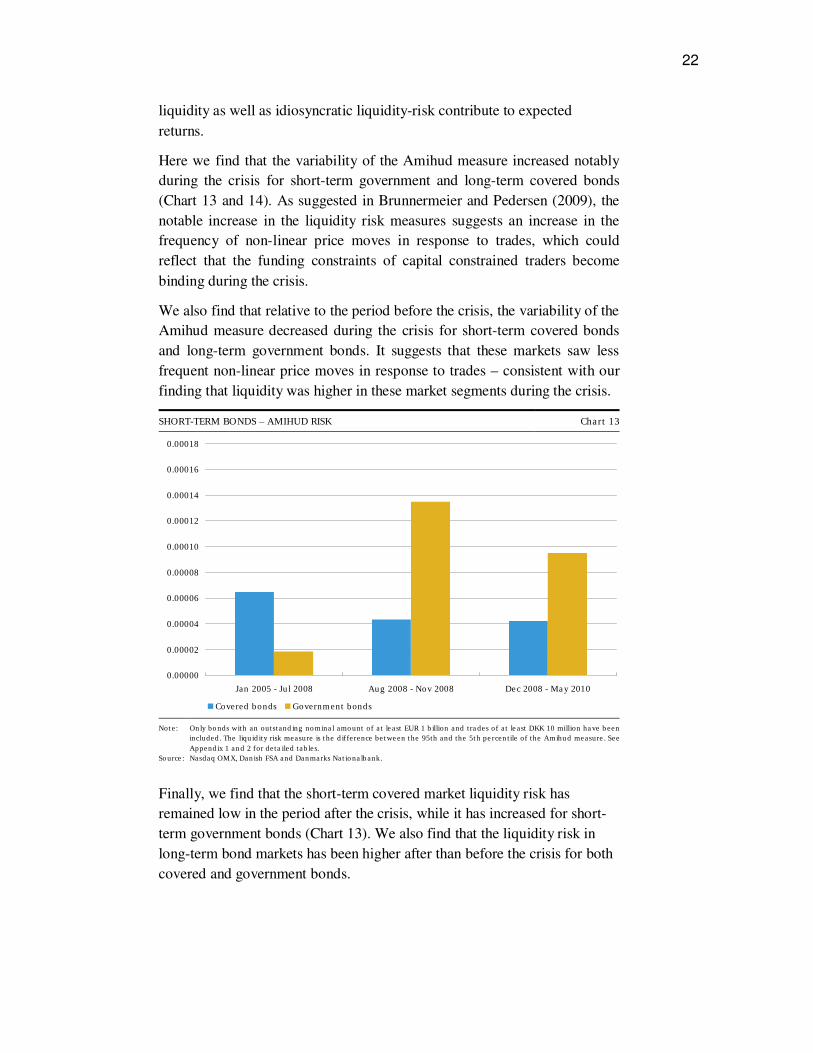
Here we find that the variability of the Amihud measure increased notably
during the crisis for short-term government and long-term covered bonds
(Chart 13 and 14). As suggested in Brunnermeier and Pedersen (2009), the
notable increase in the liquidity risk measures suggests an increase in the
frequency of non-linear price moves in response to trades, which could
reflect that the funding constraints of capital constrained traders become
binding during the crisis.
We also find that relative to the period before the crisis, the variability of the
Amihud measure decreased during the crisis for short-term covered bonds
and long-term government bonds. It suggests that these markets saw less
frequent non-linear price moves in response to trades – consistent with our
finding that liquidity was higher in these market segments during the crisis.
SHORT-TERM BONDS – AMIHUD RISK Chart 13
0.00000
0.00002
0.00004
0.00006
0.00008
0.00010
0.00012
0.00014
0.00016
0.00018
Jan 2005 - Jul 2008 Aug 2008 - Nov 2008 Dec 2008 - May 2010
Covered bonds Government bonds
Note:
Source:
Only bonds with an outstanding nominal amount of at least EUR 1 billion and trades of at least DKK 10 million have been
included. The liquidity risk measure is the difference between the 95th and the 5th percentile of the Amihud measure. See
Appendix 1 and 2 for detailed tables.
Nasdaq OMX, Danish FSA and Danmarks Nationalbank.
Finally, we find that the short-term covered market liquidity risk has
remained low in the period after the crisis, while it has increased for short-
term government bonds (Chart 13). We also find that the liquidity risk in
long-term bond markets has been higher after than before the crisis for both
covered and government bonds.

23
LONG-TERM BONDS – AMIHUD RISK Chart 14
0.00000
0.00002
0.00004
0.00006
0.00008
0.00010
0.00012
0.00014
0.00016
0.00018
Jan 2005 - Jul 2008 Aug 2008 - Nov 2008 Dec 2008 - May 2010
Covered bonds Government bonds
Note:
Source:
Only bonds with an outstanding nominal amount of at least EUR 1 billion and trades of at least DKK 10 million have been
included. The liquidity risk measure is the difference between the 95th and the 5th percentile of the Amihud measure. See
Appendix 1 and 2 for detailed tables.
Nasdaq OMX, Danish FSA and Danmarks Nationalbank.
8. Concluding remarks
We have presented preliminary findings on the liquidity of the government
and covered bond markets in Denmark before, during and after the 2008
financial crisis. Going forward, the intention is to analyse in more detail
which specific factors can help explain the level of liquidity of different
market segments as well as individual bonds.
Based on other findings in the literature on market liquidity one could
consider factors such as overall market and bond series size and credit
quality.8 Here one could also see if there are larger differences between on-
and off-the-run bonds during the crisis period than in the periods before and
after.
Furthermore it would be interesting to analyse how the level of liquidity and
liquidity risk affect the returns of the different bonds, both within and across
the two markets.
In addition, it would be relevant to see if the type of market participant(s) in
a trade has an impact on the various liquidity measures. This aspect could
include making a distinction between inter-market-maker trades and market
maker/nonmarket-maker trades.
8 Amihud et al. (2005) provides a comprehensive survey.
24
The covered bonds generally have a positive yield spread to government
bonds. Thus the covered bonds are more likely to attract leveraged
investors. These investors normally build up their positions gradually over a
longer period of time. However, large (abrupt) price changes can force them
to liquidate their positions over a very short period. It would therefore be
interesting to see if the share of leveraged or speculative investors in
different segments of the markets can help explain the variation in the
liquidity measures.
Finally, one could also analyse the impact on liquidity and liquidity risk
measures if trades of less than DKK 10 million are included.

25
References
Acharya, V. V. and L. H. Pedersen (2005). Asset Pricing with Liquidity
Risk. Journal of Financial Economics 77 (2), pp 375-410.
Amihud, Y. (2002). Illiquidity and Stock Returns: Cross-Section and Time-
Series Effects. Journal of Financial Markets 5 (1), pp 31-56.
Amihud, Y., H. Mendelson, and L. H. Pedersen (2005). Liquidity and Asset
Prices. Foundations and Trends in Finance 1 (4), pp 269-364.
Bao, J., J. Pan, and J. Wang (2009). Liquidity of Corporate Bonds. Working
Paper. MIT Sloan School of Management.
Bessembinder, H., W. Maxwell, and K. Venkaraman (2006). Market
Transparency, Liquidity Externalities, and Institutional Trading Costs in
Corporate Bonds. Journal of Financial Economics 82 (2), pp 251-288.
Brunnermeier, M. and L. Pedersen (2009). Market Liquidity and Funding
Liquidity. Review of Financial Studies 22, pp 2201-2238.
Choi, J.Y, Dan Salandro and Kuldeep Shastri (1988), “On the Estimation of
Bid-Ask Spreads: Theory and Evidence.” Journal of Financial and
Quantitative Analysis, Vol. 23, pp 219-229.
Covitz, D. and C. Downing (2007). Liquidity or Credit Risk? The
Determinants of Very Short-Term Corporate Yield Spreads. Journal of
Finance 62 (5), pp 2303-2328.
Danmarks Nationalbank (2008), Recent Economic and Monetary Trends,
Monetary Review, 4rd Quarter.
Danmarks Nationalbank (2009), Danish Government Borrowing and Debt
2008
Danmarks Nationalbank (2010), Danish Government Borrowing and Debt
2009.
Dick-Nielsen, J., Feldhütter, P., and Lando, D. (2009), Corporate bond
liquidity before and after the onset of the subprime crisis, Working Paper,
Copenhagen Business School, Institute of Finance.
Feldhütter, P. and D. Lando (2008). Decomposing Swap Spreads. Journal of
Financial Economics 88, pp 375-405.
Fender, I and J Gyntelberg (2008), “Overview: global financial crisis spurs
unprecedented policy actions”, Bank for International Settlements Quarterly
Review, December 2008, pp 21-24.

26
Nyholm, K. (1999), “Estimation of the Effective Bid-Ask Spread on High
Frequency Danish Bond Data“, European Journal of Finance, vol. 5, pp 109-
122
Roll, R. (1984), “A Simple Implicit Measure of the Effective Bid-Ask
Spread in an Efficient Market”, Journal of Finance, vol. 39, pp 1127-1139.
Stoll, R. (1989). “Inferring the components of the bid-ask spread: Theory
and empirical tests”, Journal of Finance, Vol. 44, pp 115-134.
27
Appendix 1 – Summary of liquidity measures for short-term bonds
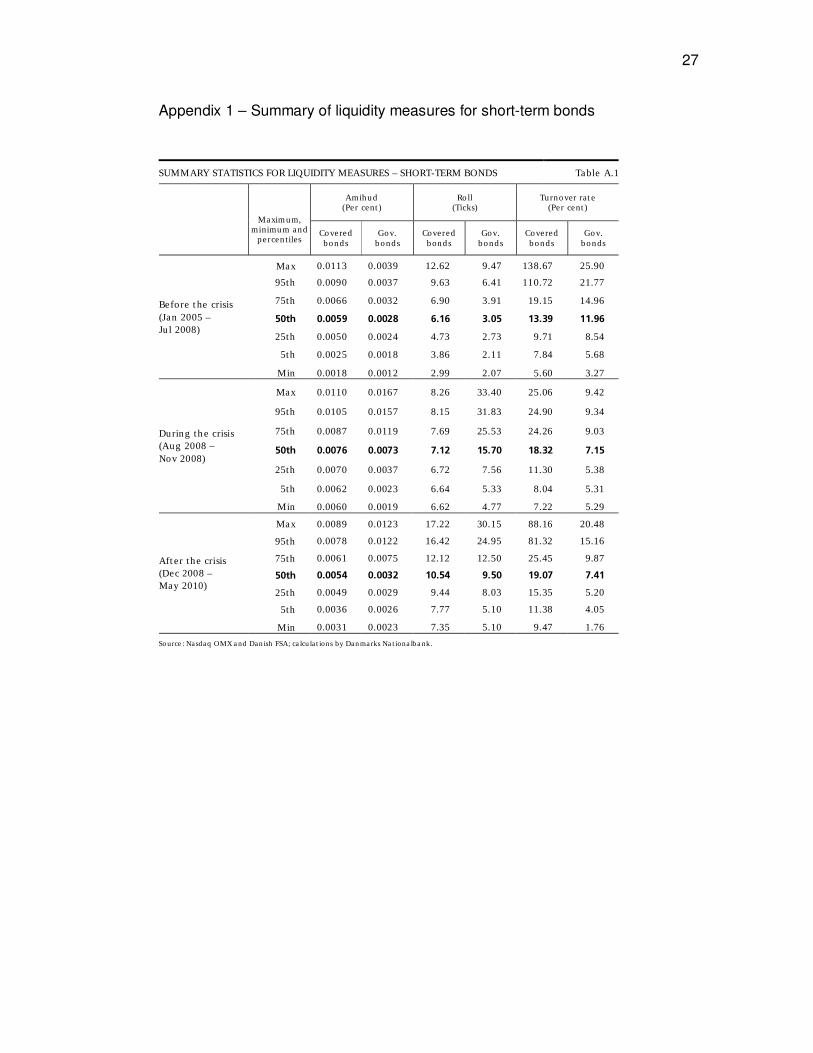
SUMMARY STATISTICS FOR LIQUIDITY MEASURES – SHORT-TERM BONDS Table A.1
Amihud (Per cent)
Roll (Ticks)
Turnover rate (Per cent)
Maximum, minimum and percentiles
Covered bonds
Gov. bonds
Covered bonds
Gov. bonds
Covered bonds
Gov. bonds
Max 0.0113 0.0039 12.62 9.47 138.67 25.90
95th 0.0090 0.0037 9.63 6.41 110.72 21.77
75th 0.0066 0.0032 6.90 3.91 19.15 14.96
50th 0.0059 0.0028 6.16 3.05 13.39 11.96
25th 0.0050 0.0024 4.73 2.73 9.71 8.54
5th 0.0025 0.0018 3.86 2.11 7.84 5.68
Before the crisis
(Jan 2005 –
Jul 2008)
Min 0.0018 0.0012 2.99 2.07 5.60 3.27
Max 0.0110 0.0167 8.26 33.40 25.06 9.42
95th 0.0105 0.0157 8.15 31.83 24.90 9.34
75th 0.0087 0.0119 7.69 25.53 24.26 9.03
50th 0.0076 0.0073 7.12 15.70 18.32 7.15
25th 0.0070 0.0037 6.72 7.56 11.30 5.38
5th 0.0062 0.0023 6.64 5.33 8.04 5.31
During the crisis
(Aug 2008 –
Nov 2008)
Min 0.0060 0.0019 6.62 4.77 7.22 5.29
Max 0.0089 0.0123 17.22 30.15 88.16 20.48
95th 0.0078 0.0122 16.42 24.95 81.32 15.16
75th 0.0061 0.0075 12.12 12.50 25.45 9.87
50th 0.0054 0.0032 10.54 9.50 19.07 7.41
25th 0.0049 0.0029 9.44 8.03 15.35 5.20
5th 0.0036 0.0026 7.77 5.10 11.38 4.05
After the crisis
(Dec 2008 –
May 2010)
Min 0.0031 0.0023 7.35 5.10 9.47 1.76
Source: Nasdaq OMX and Danish FSA; calculations by Danmarks Nationalbank.

28
Appendix 2 – Summary of liquidity measures for long-term bonds
SUMMARY STATISTICS FOR LIQUIDITY MEASURES – LONG-TERM BONDS Table A.2
Amihud (Per cent)
Roll (Ticks)
Turnover rate (Per cent)
Maximum, minimum and percentiles
Covered bonds
Gov. bonds
Covered bonds
Gov. bonds
Covered bonds
Gov. bonds
Max 0.0205 0.0131 23.40 29.32 41.95 60.67
95th 0.0182 0.0128 21.71 23.64 29.78 42.51
75th 0.0136 0.0080 15.84 13.59 21.50 27.04
50th 0.0119 0.0067 13.14 9.97 18.04 20.78
25th 0.0105 0.0061 10.70 9.44 12.46 16.53
5th 0.0094 0.0050 9.20 7.05 8.58 9.03
Before the crisis
(Jan 2005 –
Jul 2008)
Min 0.0082 0.0048 8.72 6.66 7.35 7.69
Max 0.0378 0.0210 49.09 39.86 14.18 23.01
95th 0.0358 0.0207 46.61 38.62 13.90 22.56
75th 0.0280 0.0195 36.69 33.64 12.79 20.75
50th 0.0222 0.0172 26.66 27.51 11.68 14.16
25th 0.0196 0.0153 20.69 22.71 10.16 7.94
5th 0.0194 0.0149 20.49 20.88 8.04 7.02
During the crisis
(Aug 2008 –
Nov 2008)
Min 0.0194 0.0148 20.45 20.43 7.51 6.79
Max 0.0259 0.0234 23.38 48.23 14.55 10.98
95th 0.0244 0.0212 21.52 44.30 14.45 10.30
75th 0.0171 0.0129 18.47 35.07 11.24 8.52
50th 0.0149 0.0088 15.32 27.97 9.93 7.53
25th 0.0143 0.0070 14.43 23.77 8.57 5.95
5th 0.0122 0.0066 12.41 17.44 7.54 4.18
After the crisis
(Dec 2008 –
May 2010)
Min 0.0110 0.0062 12.07 17.17 6.71 3.89
Source: Nasdaq OMX and Danish FSA; calculations by Danmarks Nationalbank.


![presentation 2016.ppt [Kompatibilitetstilstand] 20… · Source: Danmarks Nationalbank, end-April 2016. Foreign ownership of domestic bonds Source: Danmarks Nationalbank, end-April](https://img.dokumen.tips/doc/110x75/5f228453b9badb6acd72db76/presentation-2016ppt-kompatibilitetstilstand-20-source-danmarks-nationalbank.jpg)


![presentation 2016.ppt [Kompatibilitetstilstand] · Source: Danmarks Nationalbank, end-April 2016. Foreign ownership of domestic bonds Source: Danmarks Nationalbank, end-April 2016](https://img.dokumen.tips/doc/110x75/60335803b86e73281965d87b/presentation-2016ppt-kompatibilitetstilstand-source-danmarks-nationalbank-end-april.jpg)