Embed Size (px)
Citation preview

���
����������������� � �� �������� �� ����� �� ����
* Exploration-Production Department, Romgaz, Romania** SPM Schlumberger, Romania
http://dx.doi.org/10.7494/drill.2016.33.2.495
Dan Paul Ştefănescu*, Oki Ari Maulidani**, Beryl Audrey**
COMPRESSOR APPLICATIONFOR EXTENDING PRODUCTION LIFE CYCLE
IN MATURE FIELDS
1. INTRODUCTION
Laslau Mare gas field is located in the central part of the Transylvanian Basin, Ro-mania (Fig. 1). The field has 49 active producing gas wells. The field has been producingdry gas (99� methane) for more than 40 years by natural depletion with no active waterdrive. The porosity range from 6–10� and the permeability range from 0.1–1 mD.The current recovery factor is 74.5�.
Fig. 1. Laslau Mare field location

���
The reservoirs are formed of sandstones with carbonate cement, interbeddedwith shale layers. The depth of the gas saturated reservoirs varies between 1800 m and3000 m TVD.
The 49 active producing wells are divided into 5 group stations based on their loca-tion as shown in the Figure 2. Every well has its own individual underground separatorwhich is located in the group station in order to separate water based on gravitationalprincipal.
All the gas production from the 5 groups then enter the drying station whereadsorption process occurs using silica gel to remove any remaining associated water.Afterwards, Laslau Mare gas production is compressed together with other fields’ gasproduction in the Filitelnic then Tigmandru compression stations in order to meetnational sales pressure. The national sales pressure is in the range of 25–30 bars whilethe pressure in the drying station is in the range of 7–10 bars.
Fig. 2. Laslau Mare gathering system
2. LASLAU MARE FIELD CHALLENGES
The focus of this paper is to address two main challenges in Laslau Mare field whichare reservoir backpressure causing liquid loading and highimpact on production basedon the external pressure.
Turner and Coleman characterized loading as occurring when droplets of liquidin the tubing either rise (not loaded) or fall against the flow (loaded). They balancedthe weight of liquid droplets vs. the upward drag force from the flow of gas. The gas

���
production velocity and corresponding rate to just support the droplets and keep themfrom falling and accumulating in the bottom of the well is referred to as the critical velo-city or rate.
The Turner equation correlated to well data with surface pressures generally muchmore than 1000 psi while Coleman equation correlated to well data with surfacepressures generally less than 1000 psi. Therefore, Coleman equation is more suitablefor Laslau Mare liquid loading analysis as the current maximum surface pressure isaround 150 psi.
Coleman equation [3] to calculate critical gas velocity is
( )1144
12
1.59L g
g
Uσ ρ − ρ
=ρ
where:U – minimum gas velocity in units of ft/s,σ – surface tension in units of dynes/cm,ρl – liquid phase density in units of lbm/ft3,ρg – gas phase density in units of lbm/ft3.
Assuming that the surface tension of water is 60 dynes/cm, liquid phase density ofwater is 67 lbm/ft3, gas gravity is 0.6 and gas average temperature is 120 F, the equationcan be expressed as a function of pressure [3], where p is in units of psia.
( )( )
14
12
67 0.00314.43
0.0031U
p
p=
−
When the well is flowing above its critical velocity, it is predicted that droplets arebeing carried up by the gas velocity and are not accumulating in the well. If the well isflowing below its critical velocity, then it is predicted that droplets are not being carriedupward and are accumulating in the well.
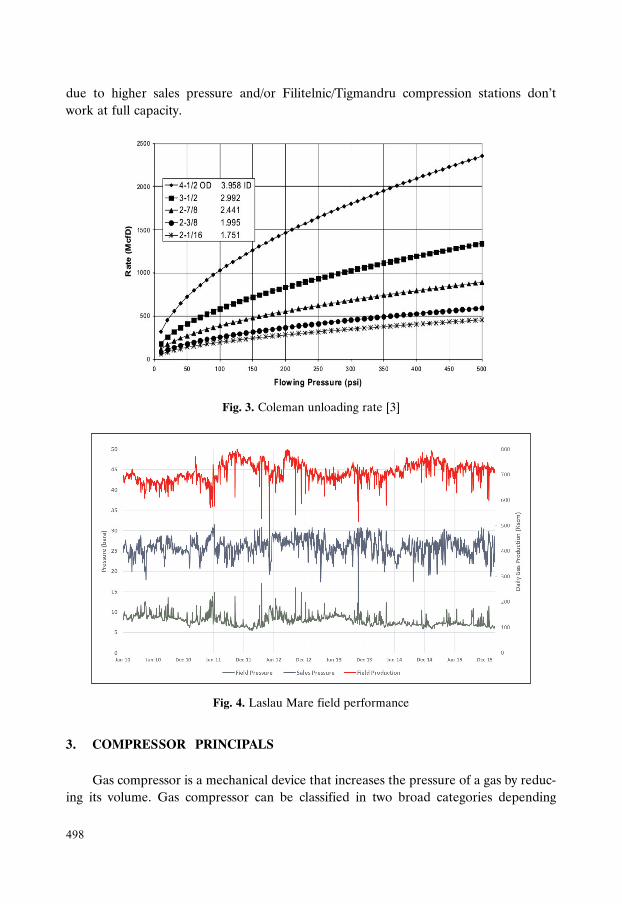
Figure 3 shows Coleman unloading rate for well producing Water at various tubingsizes [3]. The graph clearly shows that the critical gas rate is proportional to the flowingwellhead pressure. In the other words, when wellhead pressure increases then criticalrate will be higher which will give a “pseudo” production decline of the wells.
Laslau Mare wells are completed mostly with 2 7/8" tubing. The correspondingcritical gas rate at 150 psi flowing pressure is 500 Mcf/d (14 kscm/d) where 70� of currentgas rates in Laslau Mare field are less than that.
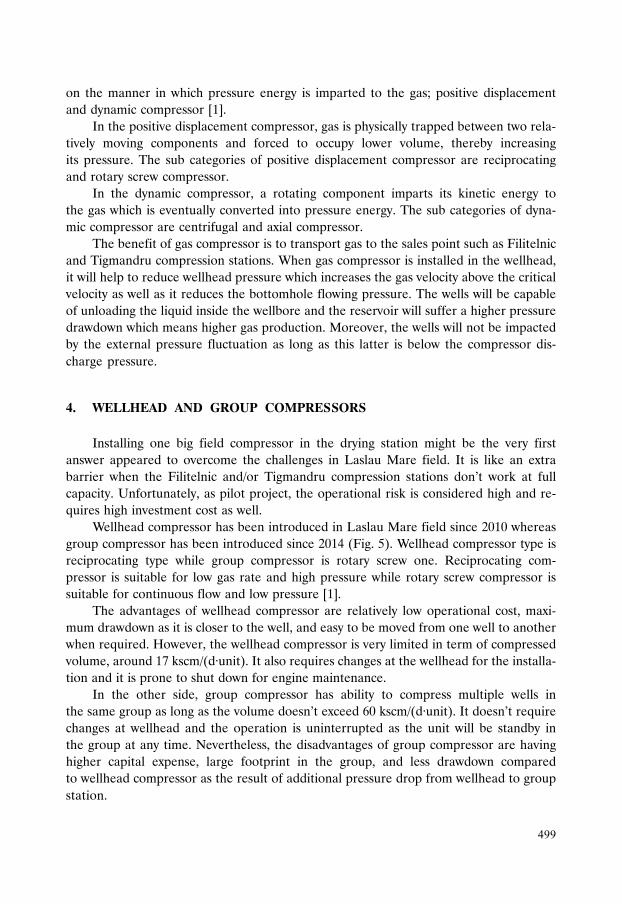
The next Laslau Mare field challenge is highly dependent on the external pressure.It is observed that every 1 bar higher of field pressure, field gas production decreasesaround 20 kscm/d as shown in the Figure 4. The reason of higher field pressure mainly
���
due to higher sales pressure and/or Filitelnic/Tigmandru compression stations don’twork at full capacity.
Fig. 3. Coleman unloading rate [3]
Fig. 4. Laslau Mare field performance
3. COMPRESSOR PRINCIPALS
Gas compressor is a mechanical device that increases the pressure of a gas by reduc-ing its volume. Gas compressor can be classified in two broad categories depending
���
on the manner in which pressure energy is imparted to the gas; positive displacementand dynamic compressor [1].
In the positive displacement compressor, gas is physically trapped between two rela-tively moving components and forced to occupy lower volume, thereby increasingits pressure. The sub categories of positive displacement compressor are reciprocatingand rotary screw compressor.
In the dynamic compressor, a rotating component imparts its kinetic energy tothe gas which is eventually converted into pressure energy. The sub categories of dyna-mic compressor are centrifugal and axial compressor.
The benefit of gas compressor is to transport gas to the sales point such as Filitelnicand Tigmandru compression stations. When gas compressor is installed in the wellhead,it will help to reduce wellhead pressure which increases the gas velocity above the criticalvelocity as well as it reduces the bottomhole flowing pressure. The wells will be capableof unloading the liquid inside the wellbore and the reservoir will suffer a higher pressuredrawdown which means higher gas production. Moreover, the wells will not be impactedby the external pressure fluctuation as long as this latter is below the compressor dis-charge pressure.
4. WELLHEAD AND GROUP COMPRESSORS
Installing one big field compressor in the drying station might be the very firstanswer appeared to overcome the challenges in Laslau Mare field. It is like an extrabarrier when the Filitelnic and/or Tigmandru compression stations don’t work at fullcapacity. Unfortunately, as pilot project, the operational risk is considered high and re-quires high investment cost as well.
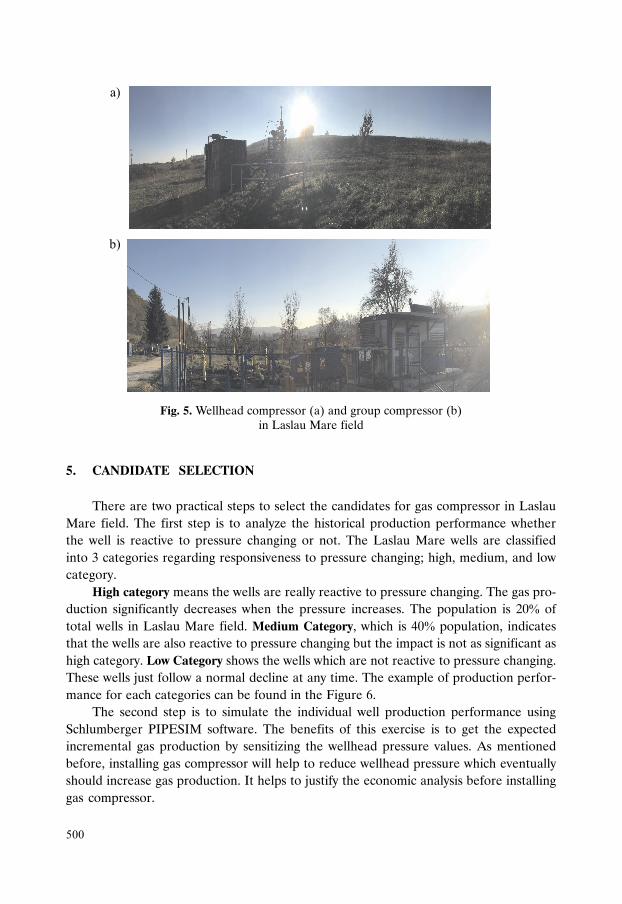
Wellhead compressor has been introduced in Laslau Mare field since 2010 whereasgroup compressor has been introduced since 2014 (Fig. 5). Wellhead compressor type isreciprocating type while group compressor is rotary screw one. Reciprocating com-pressor is suitable for low gas rate and high pressure while rotary screw compressor issuitable for continuous flow and low pressure [1].
The advantages of wellhead compressor are relatively low operational cost, maxi-mum drawdown as it is closer to the well, and easy to be moved from one well to anotherwhen required. However, the wellhead compressor is very limited in term of compressedvolume, around 17 kscm/(d·unit). It also requires changes at the wellhead for the installa-tion and it is prone to shut down for engine maintenance.
In the other side, group compressor has ability to compress multiple wells inthe same group as long as the volume doesn’t exceed 60 kscm/(d·unit). It doesn’t requirechanges at wellhead and the operation is uninterrupted as the unit will be standby inthe group at any time. Nevertheless, the disadvantages of group compressor are havinghigher capital expense, large footprint in the group, and less drawdown comparedto wellhead compressor as the result of additional pressure drop from wellhead to groupstation.
�
Fig. 5. Wellhead compressor (a) and group compressor (b)in Laslau Mare field
5. CANDIDATE SELECTION
There are two practical steps to select the candidates for gas compressor in LaslauMare field. The first step is to analyze the historical production performance whetherthe well is reactive to pressure changing or not. The Laslau Mare wells are classifiedinto 3 categories regarding responsiveness to pressure changing; high, medium, and lowcategory.
High category means the wells are really reactive to pressure changing. The gas pro-duction significantly decreases when the pressure increases. The population is 20� oftotal wells in Laslau Mare field. Medium Category, which is 40� population, indicatesthat the wells are also reactive to pressure changing but the impact is not as significant ashigh category. Low Category shows the wells which are not reactive to pressure changing.These wells just follow a normal decline at any time. The example of production perfor-mance for each categories can be found in the Figure 6.
The second step is to simulate the individual well production performance usingSchlumberger PIPESIM software. The benefits of this exercise is to get the expectedincremental gas production by sensitizing the wellhead pressure values. As mentionedbefore, installing gas compressor will help to reduce wellhead pressure which eventuallyshould increase gas production. It helps to justify the economic analysis before installinggas compressor.
�
��

��
Fig. 6. High category well (LM A) (a), medium category well (LM B) (b),and low category well (LM C) (c)
Figure 7 shows the example of Nodal analysis for high reactive and low reactive wellat 3 different wellhead pressures; 3 bars (purple line)*, 8.5 bars (red line), and 13 bars(grey line). For high reactive well, gas rate significantly increases when wellhead pressuredecreases. Conversely, gas rate is insignificantly different when wellhead pressuredecreases for low reactive well.
The clear difference of low reactive and high reactive well is at the locationof the nodal points. The low reactive well has nodal points almost at end of IPR
�
��
��
* Colour version on CD.

��
(inflow performance relationship) curve. Therefore, reducing wellhead pressure will giveinsignificant impact of gas production. In the other side, high reactive well has nodalpoints a bit further to the left side. Hence, some incremental gas production is observedwhen the wellhead pressure is lower.
Fig. 7. Example of nodal analysis for high reactive (a) and low reactive (b) well
When analyzing closely the performance of each well, it is observed that high-reac-tive wells have lower skin compared to low-reactive wells. It means that gas compressor isthe appropriate solution to increase gas production for low skin wells. High skin wellswill not be reactive to pressure change as the perforation intervals is blocked. In this case,stimulation operation such as acidizing or fracturing would be the solution.
6. COMPRESSOR PERFORMANCE
Five units of wellhead compressor have been installed since 2010 in Laslau Marefield and giving in average of 15 kscm/d incremental gas production. The average payout
�
��

���
equivalent gas production is 6 kscm/d. Payout equivalent gas production representsthe operational cost and gas consumption of the 5 unit’s compressors (Fig. 8).
LM X is the example of successful wellhead compressor application in Laslau Marefield. Looking at the well performance history, the well is significantly reactive to pres-sure changing. The wellhead compressor has been installed in this well since 2013 asindicated by lower wellhead pressure (Fig. 9). The positive result has been observed bygaining around 8kscm/d incremental of gas production.
Fig. 8. Wellhead compressor performance in Laslau Mare field
Fig. 9. LM X production performance

��
The well could have declined rapidly if the compressor wasn’t installed back in 2013.The gas production might drop to 0 at the end of 2013 by extrapolating its high declinerate. Thus, it is proven that gas compression does extend the production life cycle.
The application of group compressor has been started since September 2014 ingroup 9 station only. The average incremental gas production is 8 kscm/d with payoutequivalent gas production of 4 kscm/d (Fig. 10). Currently, only one well (LM A) is con-nected to the group compressor as the gas rate is by now at the limit, 60 kscm/d. Whenthe wellhead pressure is lower as the result of decreasing group pressure, gas productionincreases subsequently. This condition surely extends its production life cycle and im-prove the final gas recovery factor (Fig. 11).
Fig. 10. Group compressor performance in Laslau Mare field
Fig. 11. LM A production performance

��
7. COMPRESSOR CHALLENGES
Some challenges have been observed while implementing group and wellhead com-pressor in Laslau Mare field. Below are the main factors:
– Modifying wellhead and group station to install gas compressor usually is challeng-ing due to accessibility and/or weather condition.
– Once the compressor is installed, it might take up few weeks to fine-tune the com-pressor parameters so the units are working at optimum condition.
– The process to find the best candidate have been performed and will be reviewedperiodically based on wells’ performance. Therefore, re-allocating wellhead com-pressor from one well to another is required. Lifting operation must be performedsafely as the unit is fairly heavy (5 tons).
– High field pressure reduces the wellhead compressor performance.– Regular engine maintenance has to be performed especially for reciprocating type.– Some units were down due to suspected foamy liquid entered into the compressor.
Foam is created by the soaping operations performed on daily basis. It happened asthe wells were soaped to help unloading process. As an action item, injecting defo-amer in the inlet line of compressor have been implemented since 2015 and it worksperfectly.
– Less drawdown for group compressor due to high pressure drop from wellhead togroup station.
8. CONCLUSIONS
– Laslau Mare mature gas field is having liquid loading issue and highly dependenton the external pressure.
– Field production performance and well modeling are keys to select the best candi-date.
– Compressor should be designed to meet current and future requirements.– Both wellhead and group compressors have been successfully implemented to
extend production life cycle of Laslau Mare field.� Average of 15 kscm/d incremental from 5 wellhead compressors since 2010.� Average of 8 kscm/d incremental from 1 group compressor since 2014.
9. WAYS FORWARD
– Install gas compressor in the other 4 group stations.– Further feasibility study to implement field compressor in Laslau Mare field.

��
Acknowledgements
The authors would like to thank the management of ROMGAZ and SPM Schlumbergerfor the support given to implement compressor application in Laslau Mare Field. Also,the authors would like to thank the IRCAT Company for supplying the compressor.
REFERENCES
[1] Littlefield R.: Gas Compression Design and Operation. SPE: 9996. 1982.[2] Clayton R.: Overview of Laslau Mare Surface Facilities. 2008[3] Coleman S.B, Clay H.B., McCurdy D.G, Norris, H.L. III: A New Look at Predic-
ting Gas-Well Load Up. Journal of Petroleum Technology, March, 1991.