Embed Size (px)
Citation preview

Tsunami and Damage to Coastal Facilitiesof the March 11, 2011, Tohoku, Japan Earthquake
Taro ARIKAWAPort and Airport Research Institute
Special Session 24.4 Great East Japan Earthquake 15th World Conference on Earthquake Engineering
Lisbon, Portugal, September 24, 2012

Damage of Otsuchi
Taken by resident

Otsuchi

Tsunami profiles acquired by GPS buoys around Japan
12 15 18 21 0 3 6 9 12 15March 11 Time (h) March 12
(1)(7)(6)(5)(4)(3)(2)
Highest crestEarthquake
1mNorth-Iwate
Central-Iwate
South-Iwate
North-Miyagi
Central-Miyagi
FukushimaShizuoka-Omaezaki
Mie-OwaseSouthwest-Wakayama
Tokushima-Kaiyo
0.54m
0.66m
0.95m
0.38m
0.24m
1m
Mean line after earthquake
Mean line before earthquake
(Kawai, et. al. 2011)
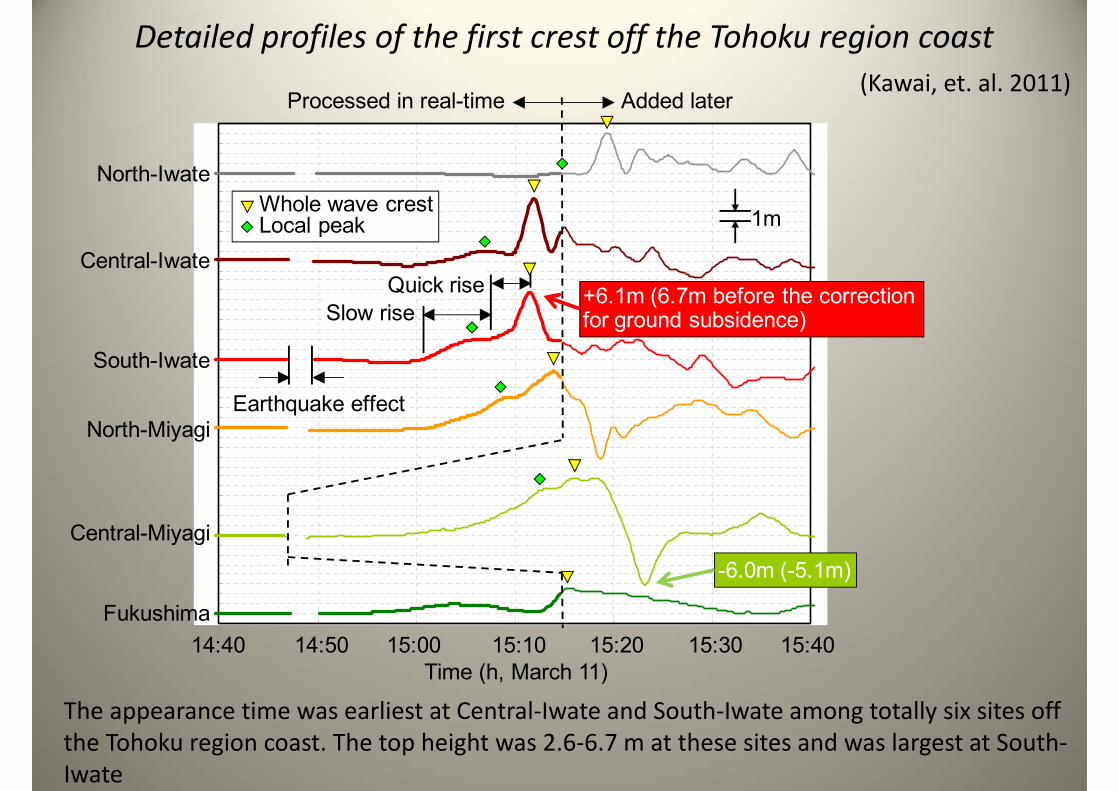
Detailed profiles of the first crest off the Tohoku region coast
North-Iwate
Central-Iwate
South-Iwate
North-Miyagi
Central-Miyagi
Fukushima14:40 14:50 15:00 15:10 15:20 15:30 15:40
Time (h, March 11)
Processed in real-time Added later
Earthquake effect
Slow riseQuick rise
Whole wave crestLocal peak 1m
+6.1m (6.7m before the correctionfor ground subsidence)
-6.0m (-5.1m)
(Kawai, et. al. 2011)
The appearance time was earliest at Central‐Iwate and South‐Iwate among totally six sites off the Tohoku region coast. The top height was 2.6‐6.7 m at these sites and was largest at South‐Iwate
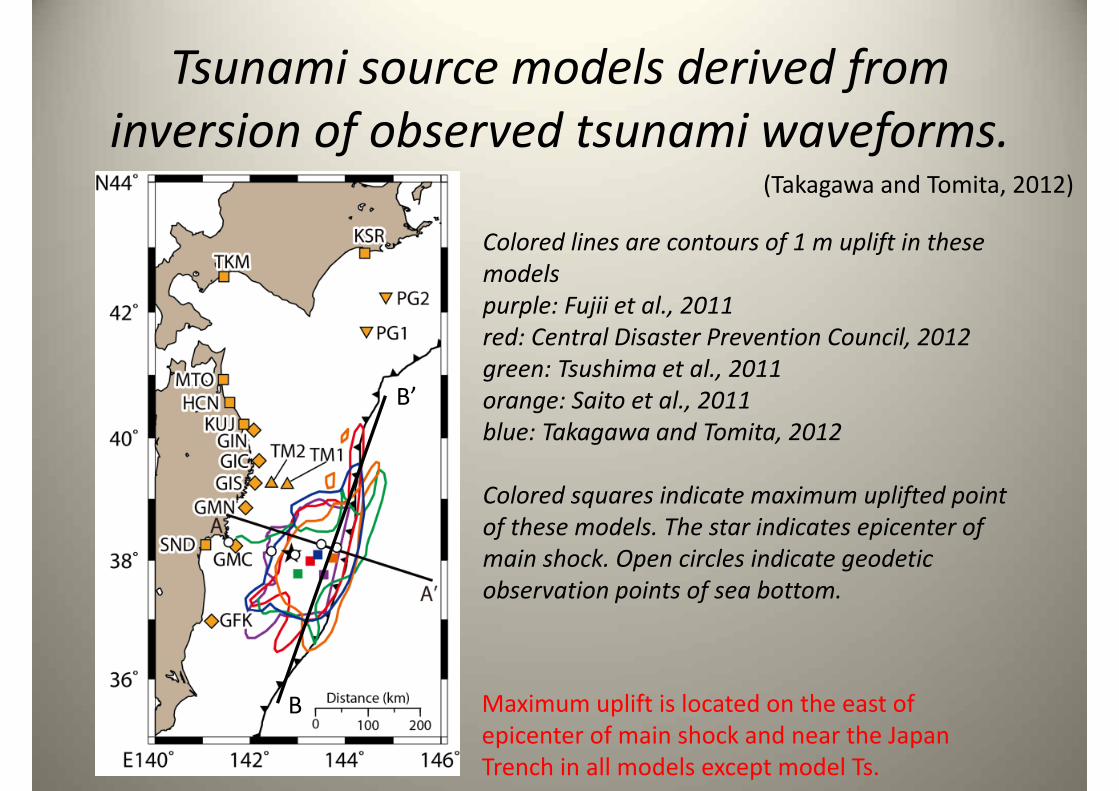
Tsunami source models derived from inversion of observed tsunami waveforms.
(Takagawa and Tomita, 2012)
Colored lines are contours of 1 m uplift in these models purple: Fujii et al., 2011red: Central Disaster Prevention Council, 2012green: Tsushima et al., 2011orange: Saito et al., 2011blue: Takagawa and Tomita, 2012
Colored squares indicate maximum uplifted point of these models. The star indicates epicenter of main shock. Open circles indicate geodetic observation points of sea bottom.
B
B’
Maximum uplift is located on the east of epicenter of main shock and near the Japan Trench in all models except model Ts.
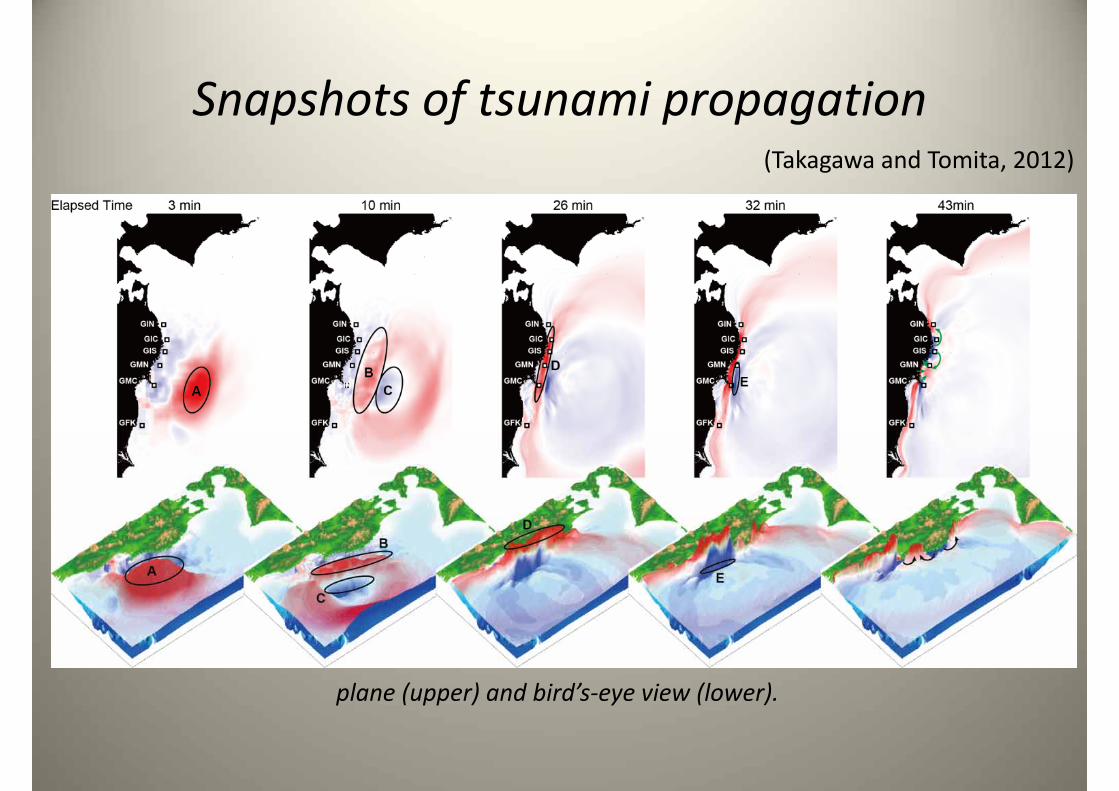
Snapshots of tsunami propagation
plane (upper) and bird’s‐eye view (lower).
(Takagawa and Tomita, 2012)

Disturibution of trace of tsunami height by the 2011 Tohoku earthquake tsunami joint survey group

Difference with overflow above the seawalls (wind waves & tsunami)
Wind waves:
Offshore wave height 0.5mPeriod 4.0s
Tsunami:
Offshore wave height 0.5m,Period 20.0s

Type of Tsunami ForceType 1 Overflow
Flooding Velocity is Low.
Type 2 BoreFlooding Velocity is higher than the overflow. That is supercritical flow.
Flooding Velocity is high with the Impulsive load.
Type 3 Breaking Very close to the coastline
IF the Height of Tsunami is same, then breaking is the maximum.
Large
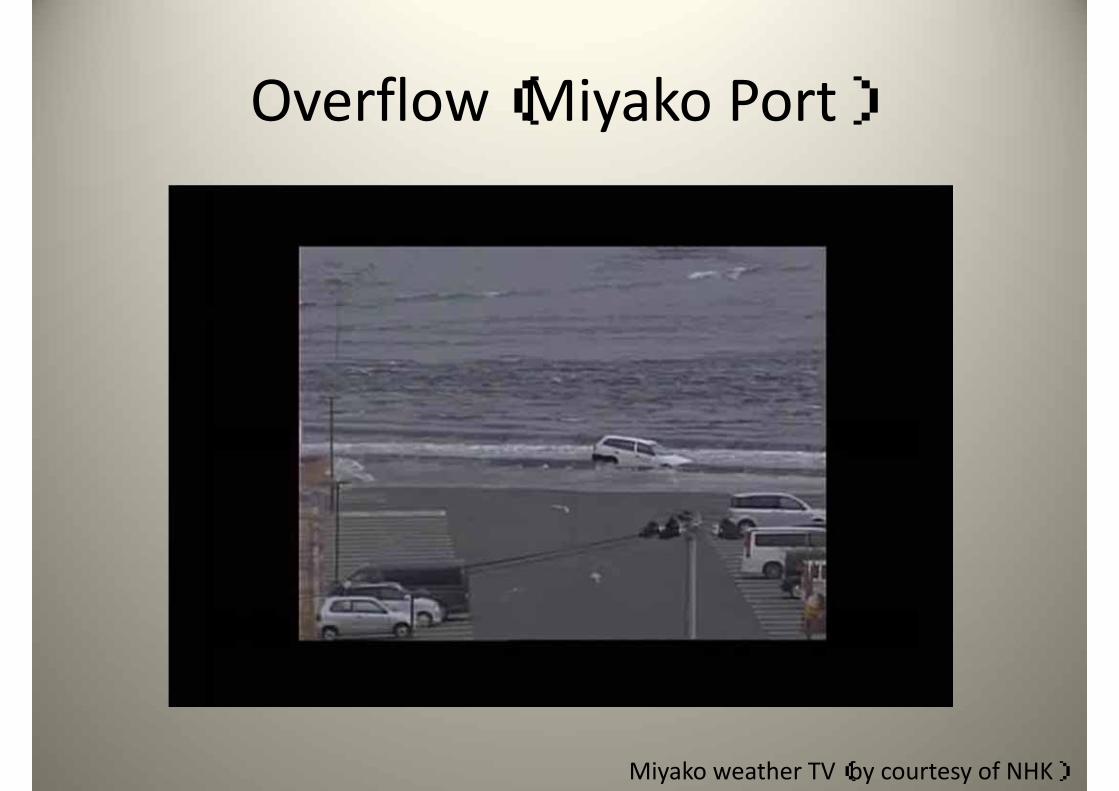
Overflow(Miyako Port)
Miyako weather TV(by courtesy of NHK)

Bore (Sand beach at Sendai)
By courtesy of NHK

Breaking (Kuji fishery port)
taken by a residence
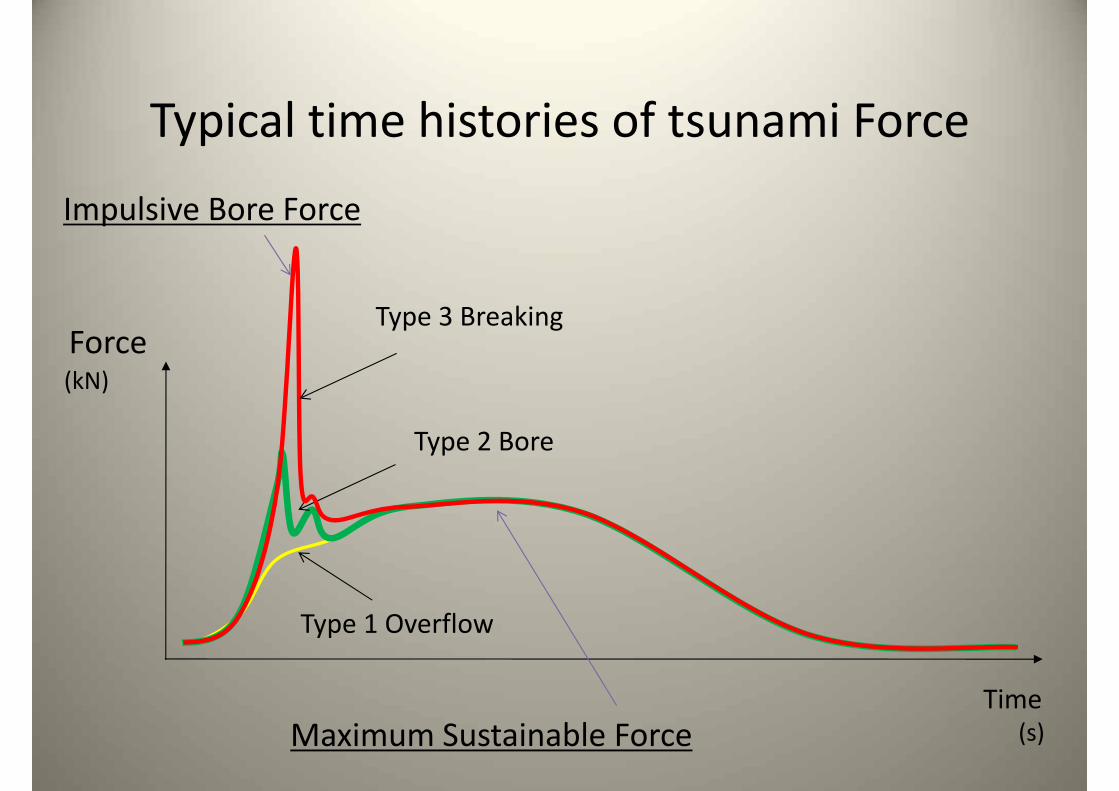
Typical time histories of tsunami Force
Force
Time
(kN)
(s)
Type 1 Overflow
Type 2 Bore
Type 3 Breaking
Impulsive Bore Force
Maximum Sustainable Force

Bore Type Tsunami
Tsunami Height in front of the wall is 2.0m

thickness 60mm
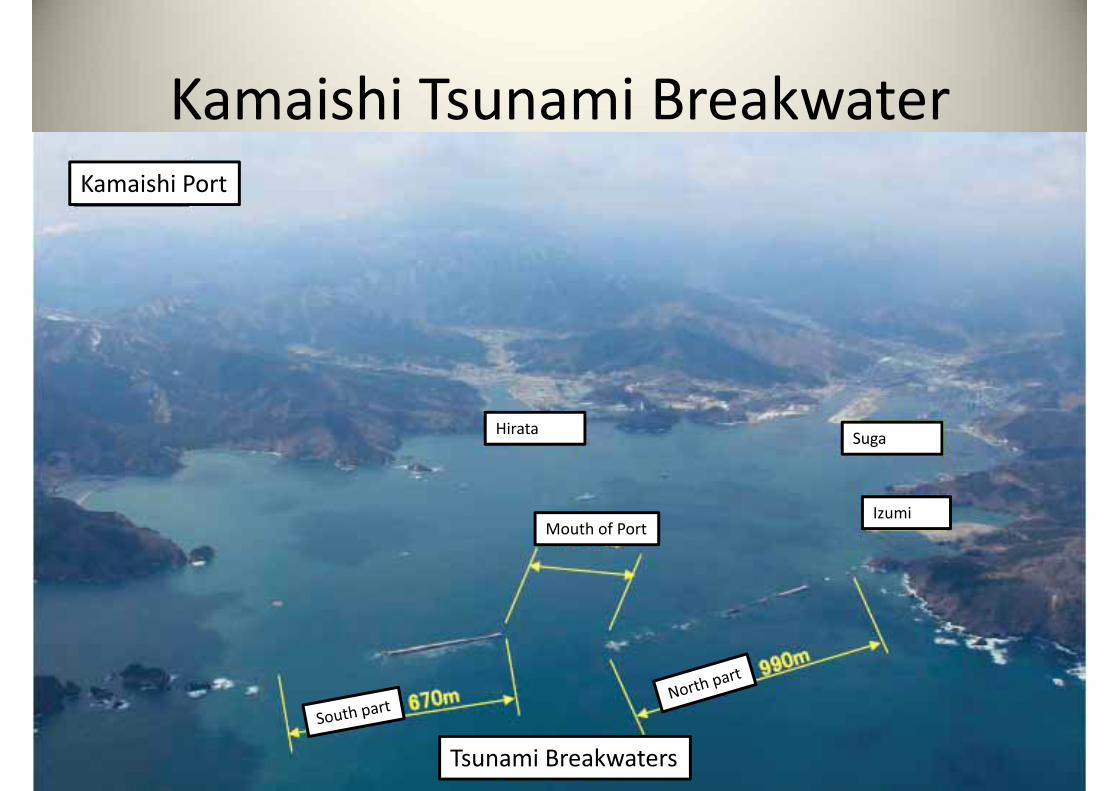
Kamaishi Tsunami Breakwater
SugaHirata
IzumiMouth of Port
Kamaishi Port
Tsunami Breakwaters

Topography of Sea Bed at Kamaishi after tsunami
25th , March, 2011
North Side
South Side

Inside of Port
Outside of Port
Failure of Breakwater at North PartTOHOKU REGIONAL BUREAU MINISTRY OF LAND , INFRASTRUCTURE AND TRANSPORT
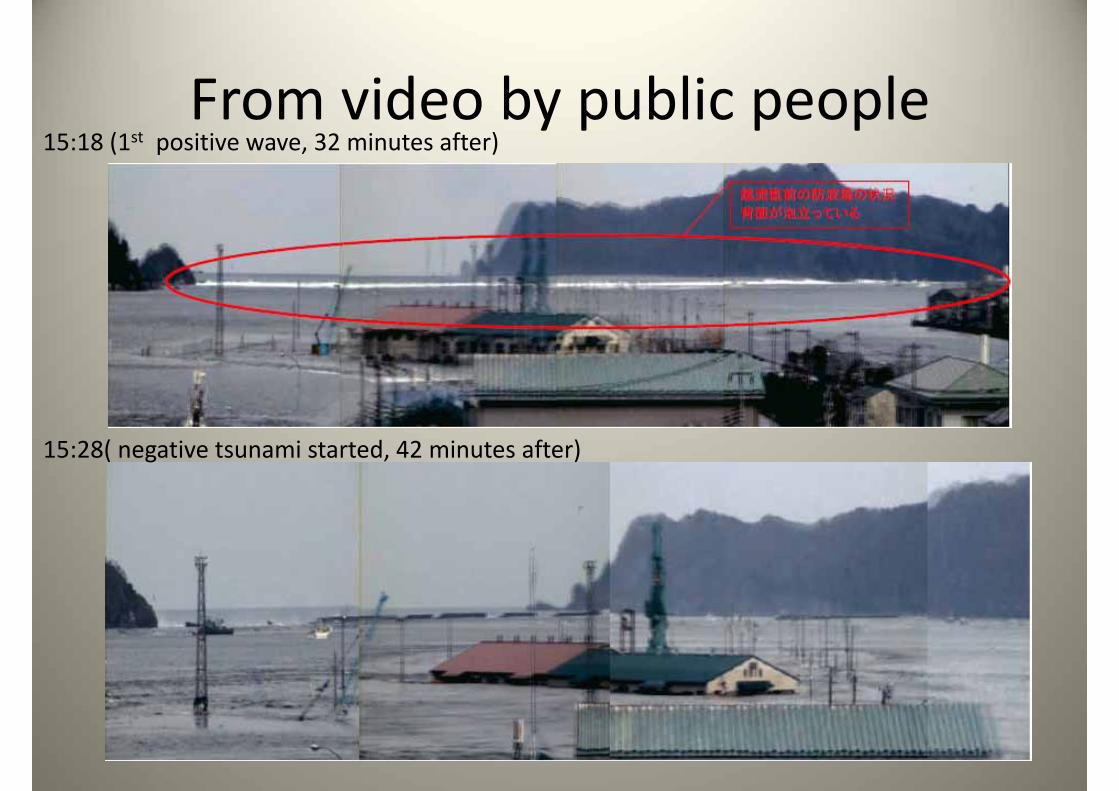
From video by public people15:18 (1st positive wave, 32 minutes after)
15:28( negative tsunami started, 42 minutes after)

North side of Kamaishi breakwater
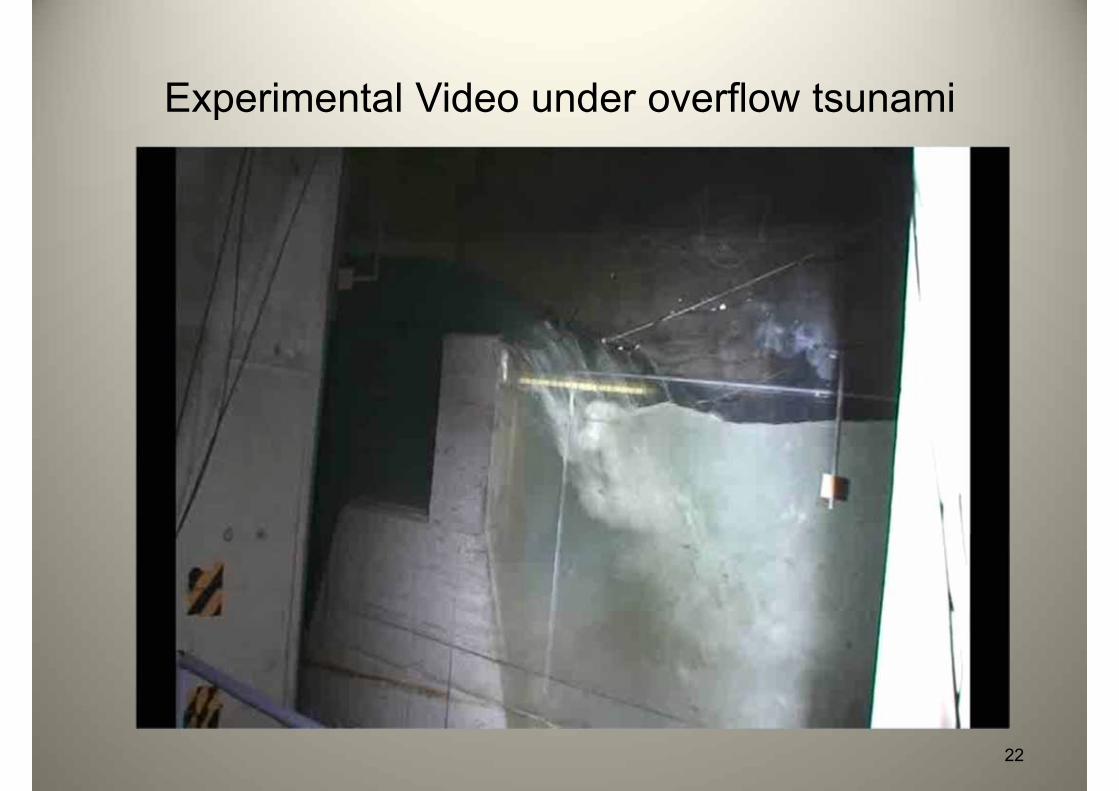
Experimental Video under overflow tsunami
22
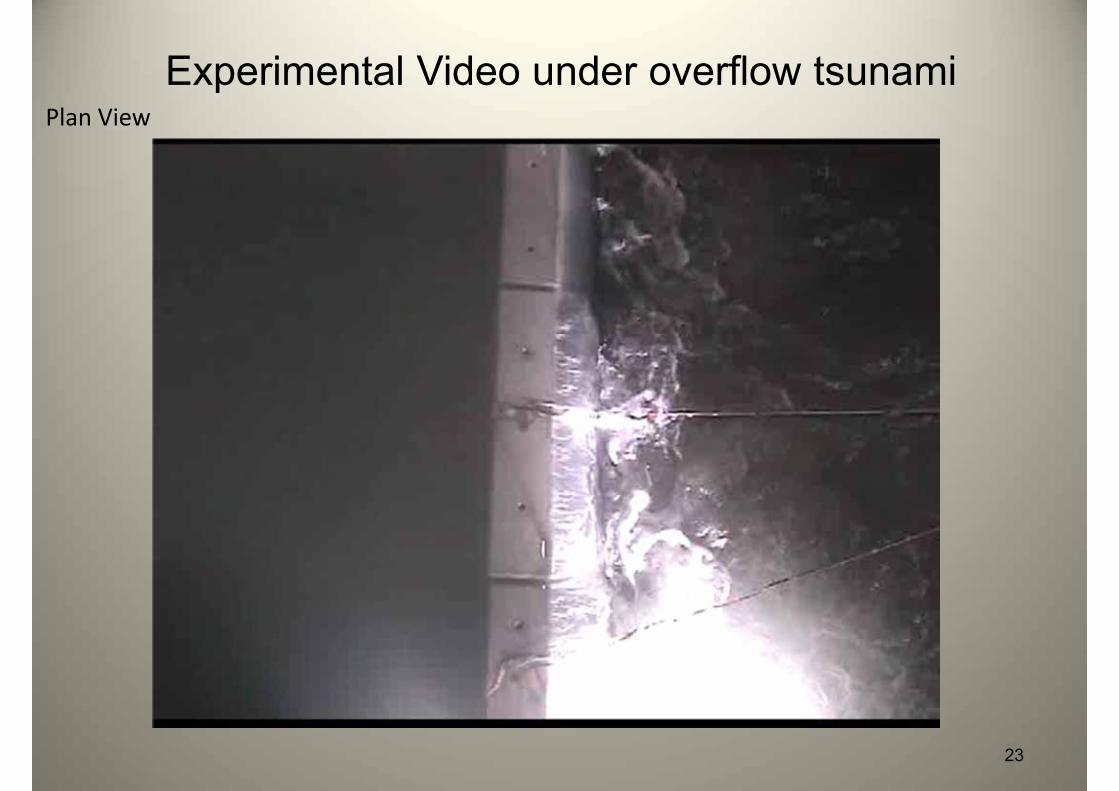
Experimental Video under overflow tsunami
23
Plan View

24

Inside of Port
Outside of Port
Failure of Breakwater at North PartTOHOKU REGIONAL BUREAU MINISTRY OF LAND , INFRASTRUCTURE AND TRANSPORT

Time after earthquake (min)
Wat
er s
urfa
ce e
leva
tion
(m)
with breakwater without
Effect of breakwater (Tomita et. al, 2012)
With Breakwater
Tsunami height (m)Arrival time 6 minutes delay(tsunami height of 4 m)
Without Breakwater
Tsunami height13.7 m → 8.0 m
26

Design policy of physical countermeasures
Tsunami Level Definition Planning or designTsunamiPrevention Level(L1)
Tsunamis that occur frequently and cause extensive damage even though they are not high
To prevent the protected lowland from being flooded, it plans and it designs. ⇒Continued mitigation through physical countermeasures
TsunamiReduction Level(L2)
The largest class of tsunami, which occurs at an extremely low frequency, but which causes enormous damage when it does
It plans and it designs so that it ismade easily not to destroy and tocollapse, and damage should notexpand though the flood of theprotected lowland is permitted.That means ‘resilient’ structures⇒Disaster mitigation by evacuation
It is necessary to estimate two levels of tsunamis, and develop measures to mitigate damage for both of them.

New Earthquake Model(Nankai Trough)
the Disaster Management Council of the Cabinet Office, 2012
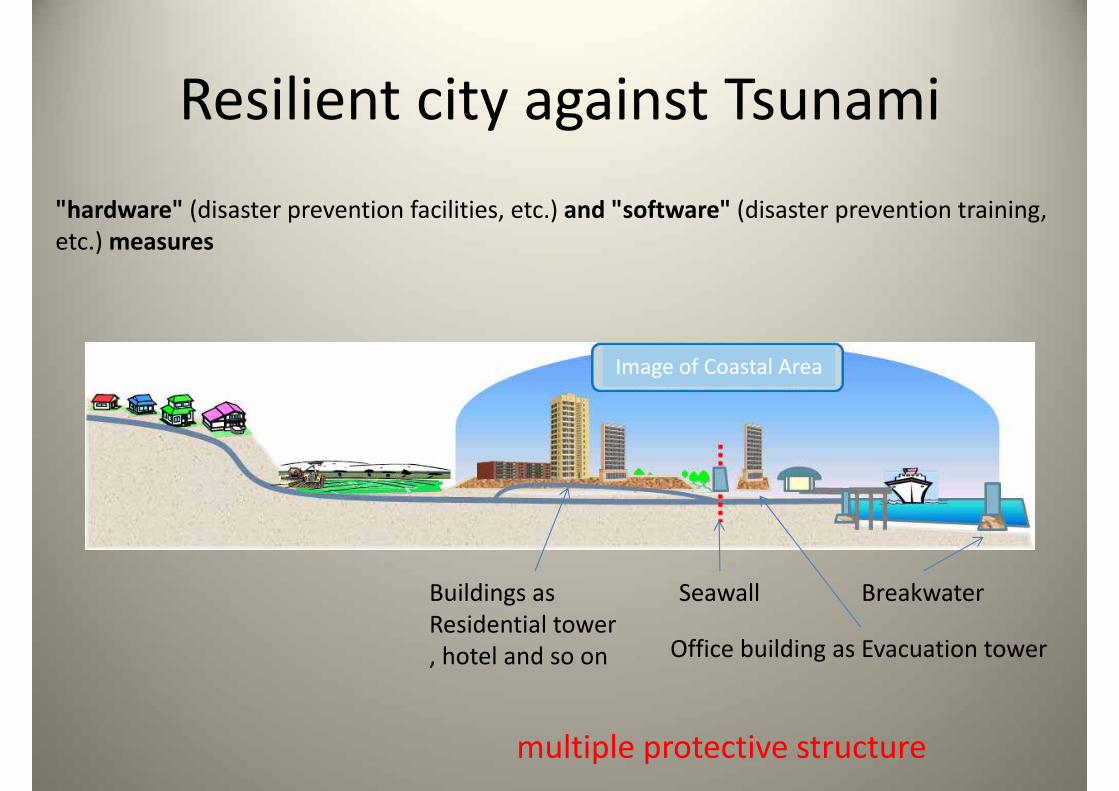
Resilient city against Tsunami
Image of Coastal Area
"hardware" (disaster prevention facilities, etc.) and "software" (disaster prevention training, etc.) measures
Seawall Breakwater
Office building as Evacuation tower
Buildings as Residential tower, hotel and so on
multiple protective structure
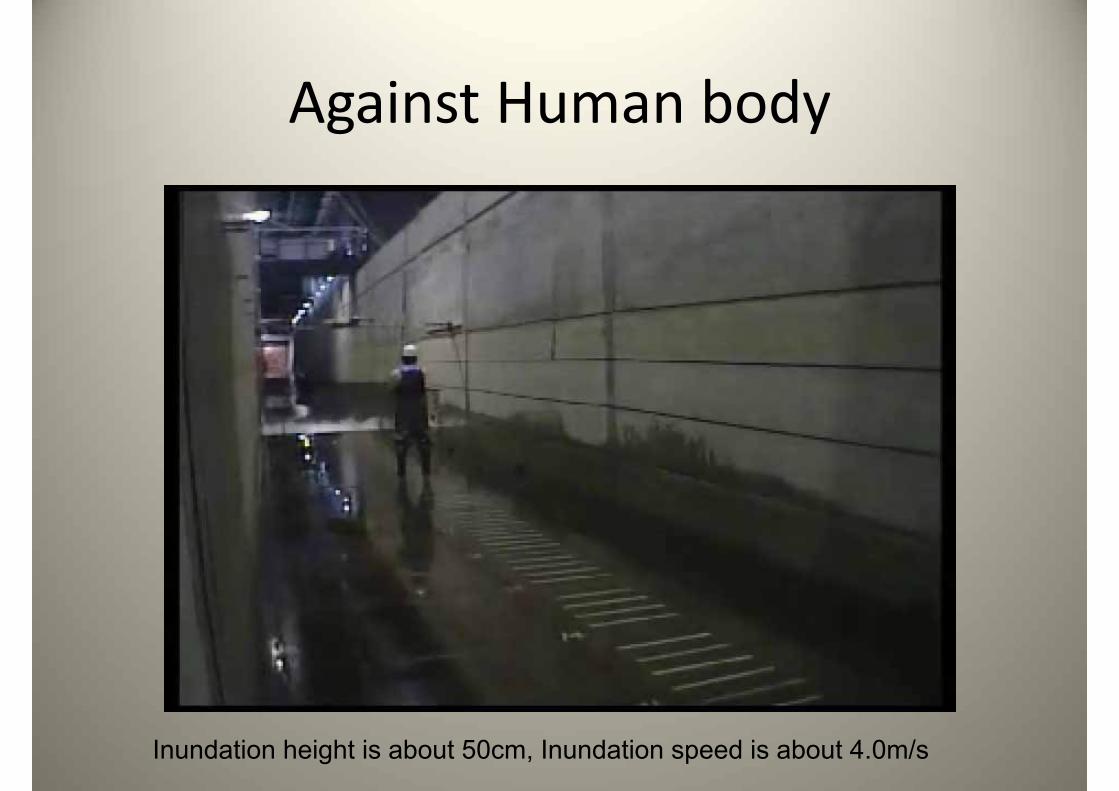
Against Human body
Inundation height is about 50cm, Inundation speed is about 4.0m/s

Lessons from The Great East Japan Earthquake
• The power of the tsunami is greatly different depending on the place and the condition
• The breakwater and seawall cannot prevent the tsunami perfectly, but can help people to evacuate.
• It is important to mitigate the tsunami disaster by using the hardware and software measures.
• Even if the tsunami is very small, people may be washed away by tsunami.