Embed Size (px)
Citation preview

2
Foreword
Groundwater is an essential component of the environment and economy. It sustains
the flow in our rivers and plays an important role in maintaining the fragile
ecosystems. The groundwater dependence of agrarian states like Karnataka is high.
Recent studies indicate that 26 percent of the area of Karnataka State is under over
exploited category and number of blocks is under critical category. In view of the
growing concerns of sustainability of ground water sources, immediate attention is
required to augment groundwater resources in stressed areas. Irrigated agriculture in
the state is putting additional stress on the groundwater system and needs proper
management of the resources.
Central Ground Water Board is providing all technical input for effective management
of ground water resources in the state. The groundwater scenario compiled on
administrative divisions gives a better perspective for planning various ground water
management measures by local administrative bodies. With this objective, Central
Ground Water Board is publishing the revised groundwater information booklet for all
the districts of the state.
I do appreciate the efforts of Dr. K.Md.Najeeb, Regional Director and his fleet of
dedicated Scientists of South Western Region, Bangalore for bringing out this
booklet. I am sure these brochures will provide a portrait of the groundwater
resources in each district for planning effective management measures by the
administrators, planners and the stake holders.
Dr. S. C. Dhiman

3
PREFACE
Ground water contributes to about eighty percent of the drinking water
requirements in the rural areas, fifty percent of the urban water requirements
and more than fifty percent of the irrigation requirements of the nation. Central
Ground Water Board has decided to bring out district level ground water
information booklets highlighting the ground water scenario, its resource
potential, quality aspects, recharge – discharge relationship, vulnerability area
etc., for all the districts of the country. As part of this, Central Ground Water
Board, South Western Region, Bangalore, is preparing such booklets for all
the 30 districts of Karnataka state, incorporating the data up to the period
2011-12.
The Dakshina Kannada district Ground Water Information Booklet has been
prepared based on the information available and data collected from various
state and central government organisations by several hydro-scientists of
Central Ground Water Board with utmost care and dedication. This booklet
has been prepared by Mr. N.Vinayachandran, Scientist-C, under the guidance
of Shri.B.K.Kallapur, Scientist-D, Central Ground Water Board, South Western
Region, Bangalore. The figures were prepared by Sri. J. Sivaramakrishnan,
Assistant Hydrogeologist. The rainfall data provided by Shri H.P.Jayaprakash
Scientist-C.The efforts of Report processing section in finalising and bringing
out the report in this format are commendable.
I take this opportunity to congratulate them for the diligent and careful
compilation and observation in the form of this booklet, which will certainly
serve as a guiding document for further work and help the planners,
administrators, academicians, hydrogeologists and engineers to plan and
manage the water resources in a better way in the district.
(K.Md.Najeeb)
Regional Director
4
GROUND WATER INFORMATION BOOKLET
DAKSHINA KANNADA DISTRICT KARNATAKA
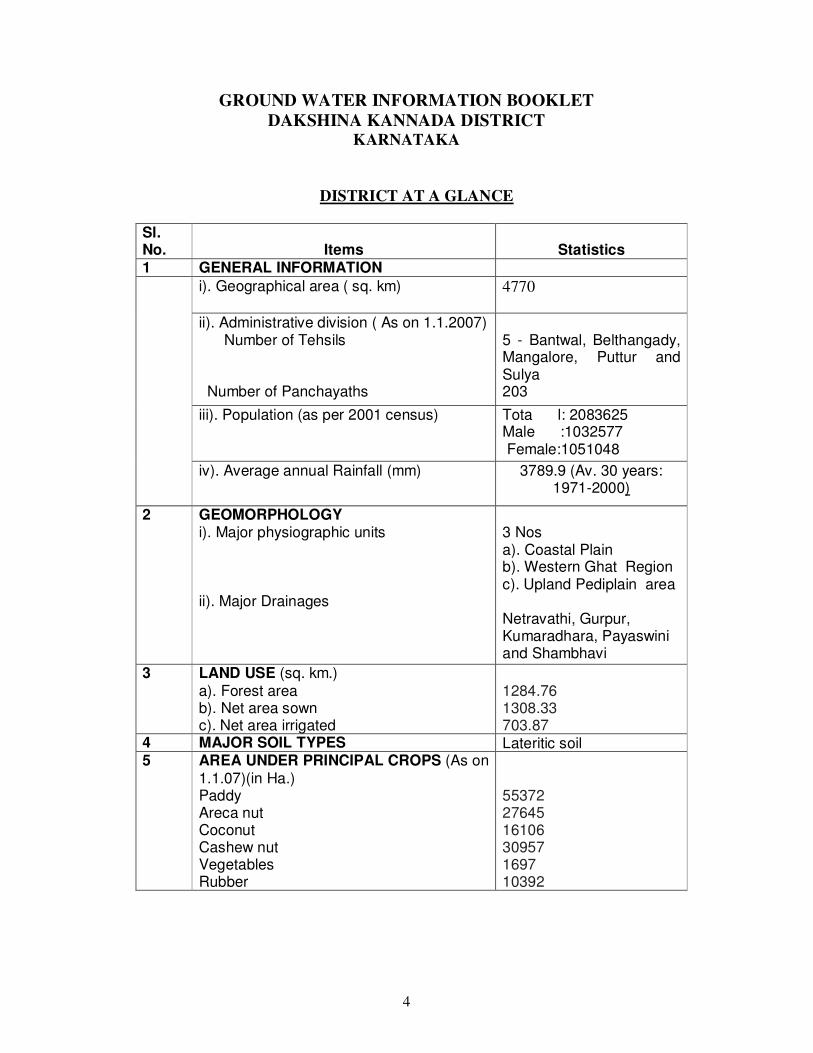
DISTRICT AT A GLANCE
Sl. No.
Items
Statistics
1 GENERAL INFORMATION i). Geographical area ( sq. km) 4770
ii). Administrative division ( As on 1.1.2007) Number of Tehsils Number of Panchayaths
5 - Bantwal, Belthangady, Mangalore, Puttur and Sulya 203
iii). Population (as per 2001 census)
Tota l: 2083625 Male :1032577 Female:1051048
iv). Average annual Rainfall (mm) 3789.9 (Av. 30 years: 1971-2000)
2 GEOMORPHOLOGY i). Major physiographic units ii). Major Drainages
3 Nos a). Coastal Plain b). Western Ghat Region c). Upland Pediplain area Netravathi, Gurpur, Kumaradhara, Payaswini and Shambhavi
3 LAND USE (sq. km.) a). Forest area b). Net area sown c). Net area irrigated
1284.76 1308.33 703.87
4 MAJOR SOIL TYPES Lateritic soil 5 AREA UNDER PRINCIPAL CROPS (As on
1.1.07)(in Ha.) Paddy Areca nut Coconut Cashew nut Vegetables Rubber
55372 27645 16106 30957 1697 10392

5
6 IRRIGATION BY DIFFERENT SOURCES (Area in ha / number of structures) Dugwells Tube / bore wells Tanks / ponds Canals Other sources Net irrigated area
40501 9202 nil nil 18146 70387
7 NUMBERS OF GROUND WATER MONITORING WELLS OF CGWB (As on 31.3.2012 )
49 (dugwells) 08 (pz)
8 PREDOMINANT GEOLOGICAL FORMATIONS
Gneiss, Schist & Granite and alluvium
9 HYDROGEOLOGY
• Major water bearing formations • Pre-monsoon Depth to water level
during 2011, • Post-monsoon Depth to water level
during 2011, • Long term water level trend in 10
years (2001-2010 in m/yr)
Weathered & fractured Gneiss, Schist & Granite and alluvium 4.12 – 15.2 mbgl 0.75 – 8.65 mbgl 58% of the wells show a rise in water level ranging from 0.014 m to 0.12 m, whereas, the remaining wells (42%) show a fall in the range of 0.01m to 0.19 m.
10 GROUND WATER EXPLORATION BY CGWB (As on 31.3.2012)
• Total No of wells drilled EW and OW • Depth Range (m)
• Discharge (Lps) Transmissivity (m2/ day)
29 & 10 16 – 256.61 Negligible – 19.9 1 – 476
11 GROUND WATER QUALITY
• Presence of chemical constituents more than permissible limit)
• Type of water
Nitrate 140ppm (Tokkuru) Ca - Mg bicarbonate to Na Chloride
12 DYNAMIC GROUND WATER RESOURCES in MCM
• Net Annual Groundwater available
• Gross annual GW draft • Projected demand for domestic and
industrial uses upto 2025
• Stage of GW development
312.79 206.45 46.25 66 %
6
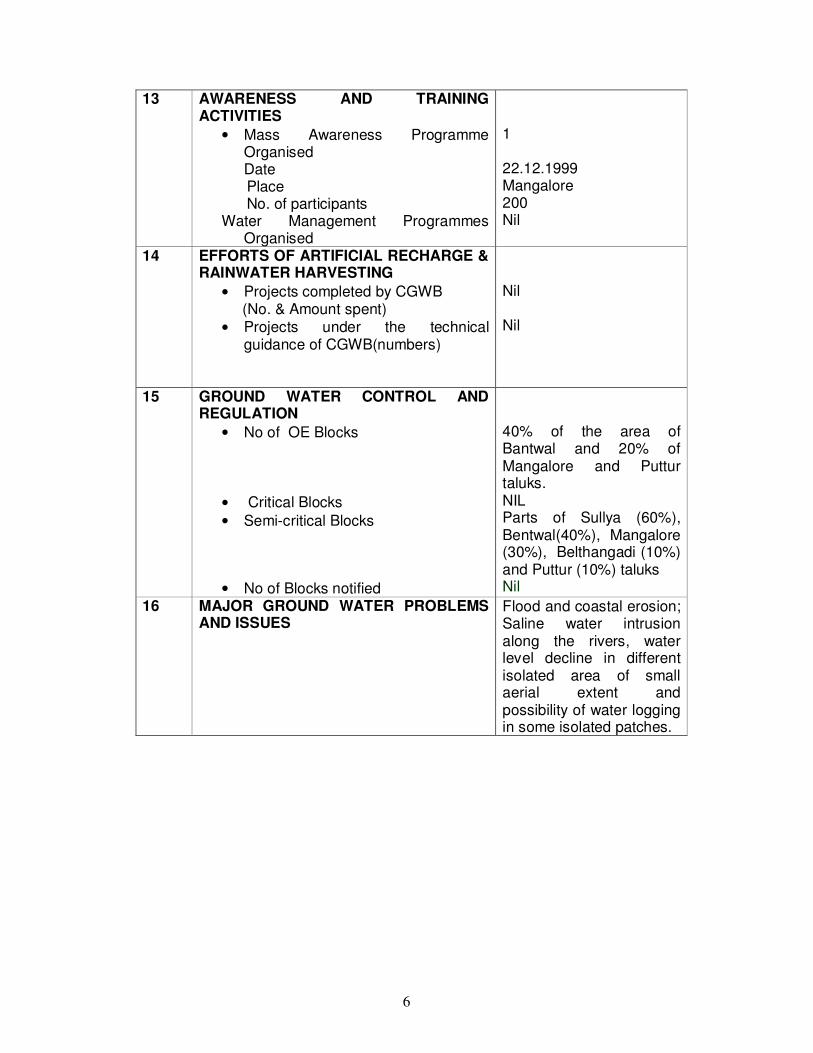
13 AWARENESS AND TRAINING ACTIVITIES
• Mass Awareness Programme Organised Date
Place No. of participants Water Management Programmes
Organised
1 22.12.1999 Mangalore 200 Nil
14 EFFORTS OF ARTIFICIAL RECHARGE & RAINWATER HARVESTING
• Projects completed by CGWB (No. & Amount spent) • Projects under the technical
guidance of CGWB(numbers)
Nil Nil
15 GROUND WATER CONTROL AND REGULATION
• No of OE Blocks
• Critical Blocks
• Semi-critical Blocks
• No of Blocks notified
40% of the area of Bantwal and 20% of Mangalore and Puttur taluks. NIL Parts of Sullya (60%), Bentwal(40%), Mangalore (30%), Belthangadi (10%) and Puttur (10%) taluks Nil
16 MAJOR GROUND WATER PROBLEMS AND ISSUES
Flood and coastal erosion; Saline water intrusion along the rivers, water level decline in different isolated area of small aerial extent and possibility of water logging in some isolated patches.

7
DAKSHINA KANNADA DISTRICT
1.0 Introduction
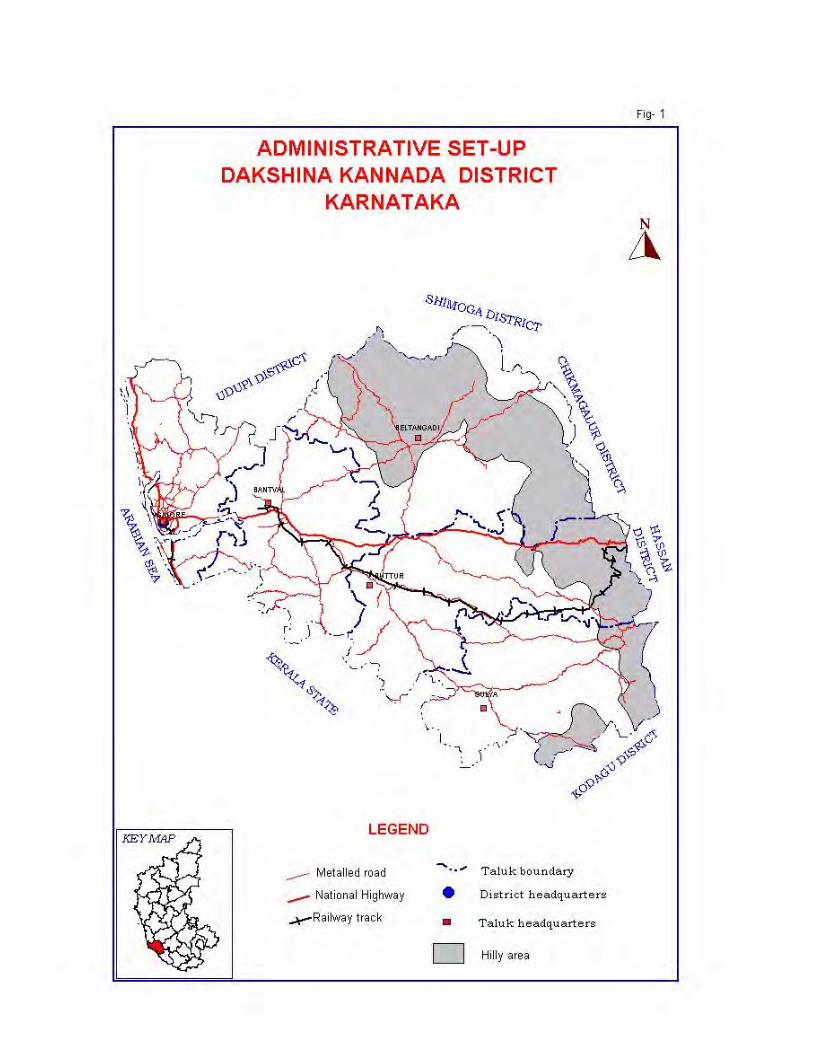
Dakshina Kannada is a maritime district located in the south-western part of Karnataka adjoining the Arabian Sea. The geographical area is 4770 sq. km extending from 12˚,30’,00’’ & 13˚,11’,00’’ north latitudes and 74˚,35’,00’’ & 75˚,33’,30’’ east longitudes. Mangalore town is the district headquarters. Administratively, the district is divided into five taluks viz. Bantwal, Belthangady, Mangalore, Puttur and Sulya (Fig.1). Population of the district (2001 census) is 18 96,403 of which 11, 67, 958 is rural and 7,28,448 is urban. The district is drained by Netravathi, Gurupur, Mulki, Kumaradhara, Payasvini and and Shambhavi rivers which originate in the Western Ghats and flow westwards to join the Arabian Sea(Fig.2). Agriculture is the main activity of the people in the district. The net sown area comprises 28% of the total geographical area. Major crops are paddy, areca nut, coconut, cashew nut, rubber and vegetables. About 57% of the net sown area is irrigated by different sources. Groundwater irrigates about 75% of the irrigated area and the remaining is by surface water sources.
Central Ground Water Board has carried out Systematic Hydrogeological Survey during 1983-84, Reappraisal Hydrogeological Survey and Ground water Exploration in the district during 1989-90. Under exploration programme 26 exploratory wells and 8 observation wells were drilled during the period between 1987 and 1991. Under Hydrology Project 8 piezometers were drilled for observing the water levels.
2.0 Rainfall The average annual rainfall of the district is 3789.9 mm and is received mainly during the southwest monsoon season extending from June to September. About 85% of the annual rainfall occurs during the monsoon months. Post - monsoon season yields about 8% and the balance of annual rainfall from December to March. This district on the West Coast of India experiences a typical maritime climate. The district is marked by heavy rainfall, high humidity and oppressive weather in hot season. Generally, the weather is hot and humid throughout the year. In the eastern part of the district i.e., along the Western Ghats, the weather is comparatively cooler than in the western coastal areas. In the district, all the taluk headquarters are having I.M.D. Raingauge stations. Statistical analysis of rainfall data for the period 1971 to 2000 are presented in the table given below.
Table 1. Statistical Analysis, Seasonal and Annual Rainfall, Dakshin Kannada district
Mean
mm
Std.
Dev.
mm
Coef.
Var.
%
Mean
mm
Std.
Dev.
mm
Coef.
Var.
%
Mean
Mm
Std.
Dev.
mm
Coef
.Var.
%
Mean
mm
Std.
Dev.
mm
Coef.
Var.
%
Station
Mar – May Jun – Sep Oct – Dec Annual
Bantwal 191.5 140.6 73.4 3358.3 675.5 20.1 292.1 116.5 39.9 3843.0 678.0 17.6
Belthangadi 234.7 223.8 95.4 3859.4 671.9 17.4 365.4 177.2 48.5 4470.2 653.6 14.6
Mangalore 191.8 165.0 86.0 3168.7 722.0 22.8 299.1 137.8 46.1 3661.4 737.3 20.1
Puttur 204.6 121.6 59.4 3338.9 653.3 19.6 372.6 127.1 34.1 3920.7 671.0 17.1
Sulya 227.5 120.9 53.1 3185.2 580.4 18.2 370.5 113.2 30.6 3790.0 590.2 15.6
8

9

10
3.0 Geomorphology and Soil Types. 3.1 Geomorphology:
Geomorphologically Dakshina Kannada District can be divided broadly into three well-defined physiographic units viz. i) Coastal plain ii) Upland pediplain area iii) Eastern hilly area forming part of the Western Ghats
The Coastal plain is a narrow, thickly populated and intensely cultivated area adjoining the coast. There is considerable extent of barren land along the coast partly because it is sandy, rocky, and marshy. The area near sea is covered with coconut gardens.
The Upland pediplain area interspersed with low hills between the Western Ghats and the coast, which is moderately cultivated with a considerable extent of fallow land, which can be put to agricultural use. The Eastern hilly area in the eastern part of the district is hilly with thick forest cover, which forms part of the Western Ghats. The hills of the area range in elevation from 1200 to 1500m a.m.s.l. and are capped with laterite, which form plateau usually of oval or elongated configuration. The hill ranges are dissected by numerous streams and rivulets. The prominent peaks in the area are Balihalli (1240m), Amadikul betta (1298m) Attiberi Gudda (1522m), Banganabagile Gudda (1513m) etc. 3.2. Soil:
The soil in the district is mostly lateritic type, found distributed in the Pediplain area characterised by high iron and aluminium content. Lateritic soil is mostly red in color and yellow loamy, pale to bright red colours are also seen. Lateritic soil is suitable for Paddy, Sugarcane, Arecanut and Plantation crops, viz. crops like Cardamom & plantains. Loamy red soils are distributed in the lower reaches of valleys. Red lateritic soil is the most dominant soil type in the area. The texture of the soil varies from fine to coarse. The soil in valleys and intermediate slopes is rich in loam whereas in upper slopes it is much coarse in nature. The soil responds well to irrigation and other soil - management practices. Silty and loamy soils are of transported origin and are found mostly along river banks and in valley plains. They have good infiltration capacity and are well-suited for agriculture due to their fertility.
3.3 Surface water:
There are no major or medium irrigation projects in the district. One vented-dam has been built across the river Netravati at Tumbe near Mangalore, to cater to the drinking water need of the town. MI tanks, LI schemes and temporary Mudkattas are the other types of surface water utility structures.
3.3.1 Spring: Seasonal and perennial springs are located in the foothills of hillocks and forests in the district. Thermal spring which is of very rare occurrence in south India has been found in the district. It is called as ‘Bendru Teertha” and located at Irde on Puttur-Panaje road at a distance of 13 km from Puttur. The rock formations exposed in and around the spring are gneisses traversed by veins of quartz and pegmatite on the southern banks of Badantadka river. The temperature of water varied from 35oC to 38oC. In the centre of the spring the temperature varies from 37oC to 38oC. The chemical

11
analysis data of spring water shows T.D.S. of 424 ppm, SiO2, 80.0 ppm, Cl 60 ppm, HCO3 196 ppm, Mg 21 ppm, SO4 61 ppm, CaCO3 121 ppm, Na 81 ppm, K 7.0 ppm and pH 8.2.
4.0 Groundwater Scenario. 4.1 Hydrogeology:
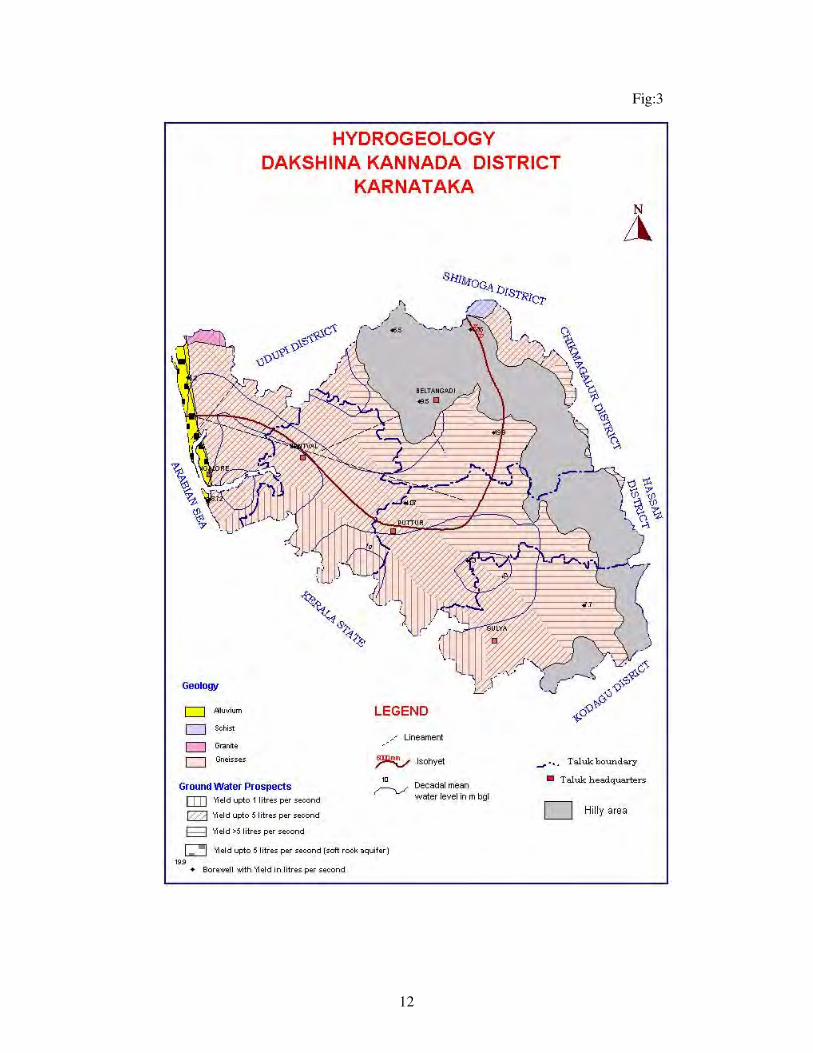
Weathered and fractured gneiss, granite and schist are the major water bearing formations. Alluvial formation of limited thickness and aerial extent is found along the courses of major rivers. Groundwater occurs under phreatic (water table) condition in weathered zones of gneiss, schist and granite and under semi-confined to confined conditions in joints and fractures of these rocks at deeper levels. Weathered and fractured gneiss is the predominant aquifer found in the district followed by schistose and granitic aquifers, which occur as isolated patches in some taluks. The hydrogeology of the district is shown in figure 3.
The depth to water level during pre-monsoon ( May 2011) ranges from 4.12 mbgl to 15.2 mbgl (Fig.4). During post-monsoon (Nov 2011) it ranges from 0.75 mbgl to 8.65 mbgl (Fig.5). The seasonal fluctuation data shows that 36.5% of the wells show rise while, 63.5% of the wells show a fall in water level. The rise in water level ranges from 0.15 m to 16.0 m while, the fall ranges from 0.65 m to 4.62 m. Analysis of the long-term water level trend in the last 10 years (2001-2010) reveals that 58% of the wells show a rise in water level ranging from 0.014 m to 0.12 m, whereas, the remaining wells (42%) show a fall in the range of 0.01m to 0.19 m. The groundwater fluctuation between decadal mean(May2001-2010) and water level in May 2011 shows rise in water level in about 60% of the area with water level rise in the range of 0.088 to 3.986m and fall in the range of 0.031 to 1.68m(fig.6). The groundwater fluctuation between decadal mean(Nov.2001-2010) and water level in Nov. 2011 shows rise in water level in about 90% of the area with water level rise in the range of 0.217 to 3.389m and fall in the range of 0.371 to 0.653 (fig.7).
Borewells drilled under Groundwater Exploration Programme of CGWB ranged up to 200m and the location map of exploratory wells is shown in figure 8.These wells have yielded from less than an lps to 19.9 lps. Though the Transmissivity ranged from 3 to 476 m2/day, it generally ranges from 3 to 20 m2/day. Good yield can be encountered by scientifically pin-pointing the borewell site.
12
Fig:3

13
Fig:4

14
Fig:5

15
Fig:6

16
Fig:7

17
Fig:8

18
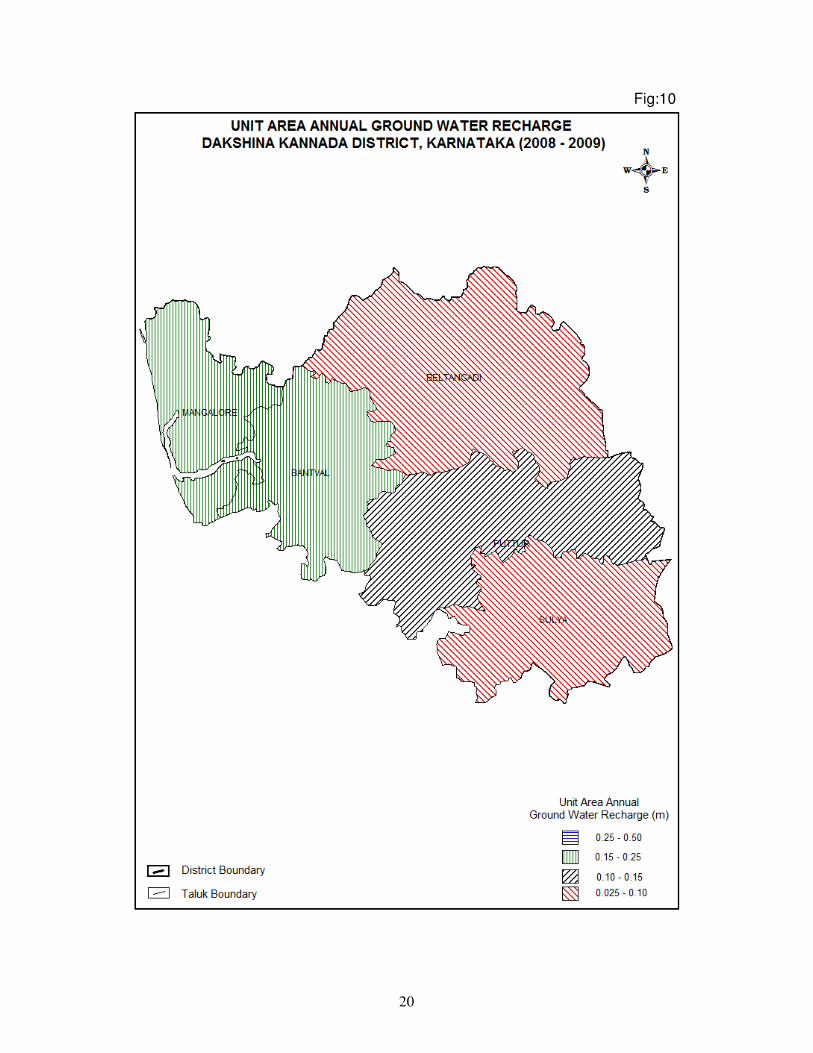
Groundwater Vulnerability area Groundwater being a dynamic resource, getting recharged annually, primarily from the rainfall, is vulnerable to various developmental activities and is prone to deterioration in quality and quantity. The vulnerability is high in certain areas while in other areas it is comparatively stable. Based on it’s susceptibility to various stress factors the district wise vulnerability map is prepared on a regional scale considering the following factors viz. 1. Area under high stage of ground water development falling in over exploited (generally with stage of development more than100%) and critical (generally stage of development within 85-100%) category as on March 2009. 2. Area having intensive cultivation/ area falling under canal command, thus prone to pollution from fertilisers/ insecticides or water logging. 3. Area having fluoride above maximum permissible limit of 1.5ppm 4. Area having nitrate above maximum permissible limit of 45ppm. (Even though nitrate is point source pollution due to anthropogenic activity and as such area cannot be demarcated, for the convenience of the user group, area having high incidence of pollution is marked. Within the marked area there may be points devoid of high nitrate and vice-versa.) 5. Industrial cluster as identified by Central Pollution Control Board, prone for pollution from industries. In some of the districts parts of the area groundwater is vulnerable due to more than one of the above parameters, while in some others the entire district is free from vulnerability. In Dakshina Kannada district contamination of groundwater from fertilizers is observed in Puttur, sullya and Bentwal taluks (fig.9 ) Unit area annual groundwater recharge Sustainability of groundwater resource depends mainly on two factors viz. Annual groundwater recharge and annual groundwater draft. The annual groundwater recharge depends on the quantity and intensity of rain fall, the infiltration characteristics of the soil, the depth to groundwater level, the slope of the area and the geomorphology. The groundwater recharge is assessed separately for the monsoon and non monsoon period due to rainfall as well as due to other sources. The annual groundwater recharge includes all the above. The recharge from other sources includes return seepage from irrigated area, seepage from canals, seepage from water bodies, seepage from influent rivers etc. The recharge can be expressed in metres. In the state of Karnataka, the unit area recharge is grouped into four categories viz. 0.025-0.10m, 0.10-0.15m, 0.15-0.25m and 0.25-0.50m. In Dakshina Kannada district the unit area annual recharge is in the range of 0.025-0.10m in parts of Sullya and Belthangadi taluks and in the range of 0.10-0.15m in Puttur and in the range of 0.15-0.25m in Bentwal and Mangalore taluks (fig.10)

19
Fig: 9
20
Fig:10

21
4.2 Groundwater resources:
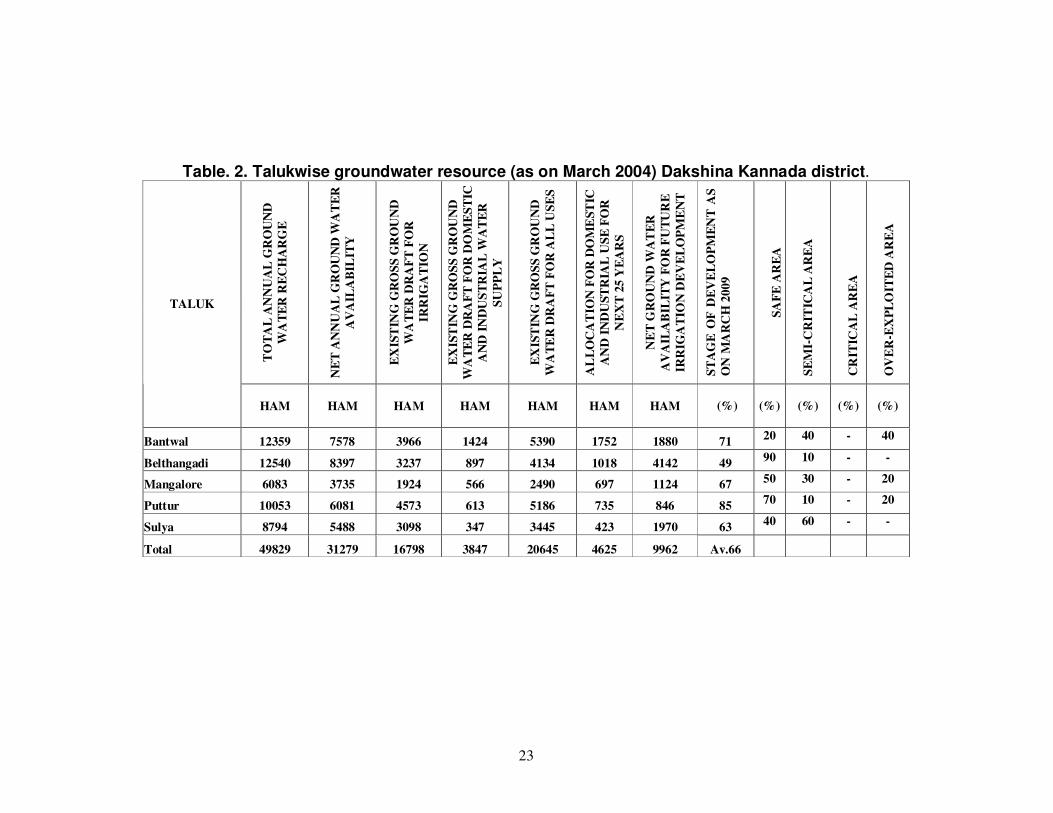
As per the ‘Ground Water Resource Estimation (GEM-1997)’, the annual ground water availability is 31279 Ham; the existing gross groundwater draft for all uses is 20645 Ham; after allocating a resource of 4625 Ham for future industrial and domestic uses, the net groundwater availability for future irrigation development is 9962 Ham. This balance resource can create a ground water irrigation potential of 13250 Ha. The ground water development in the district varies from taluk to taluk with an average development of 66% for the district.
The talukwise groundwater resource (as on March 2009) is given in the table below.
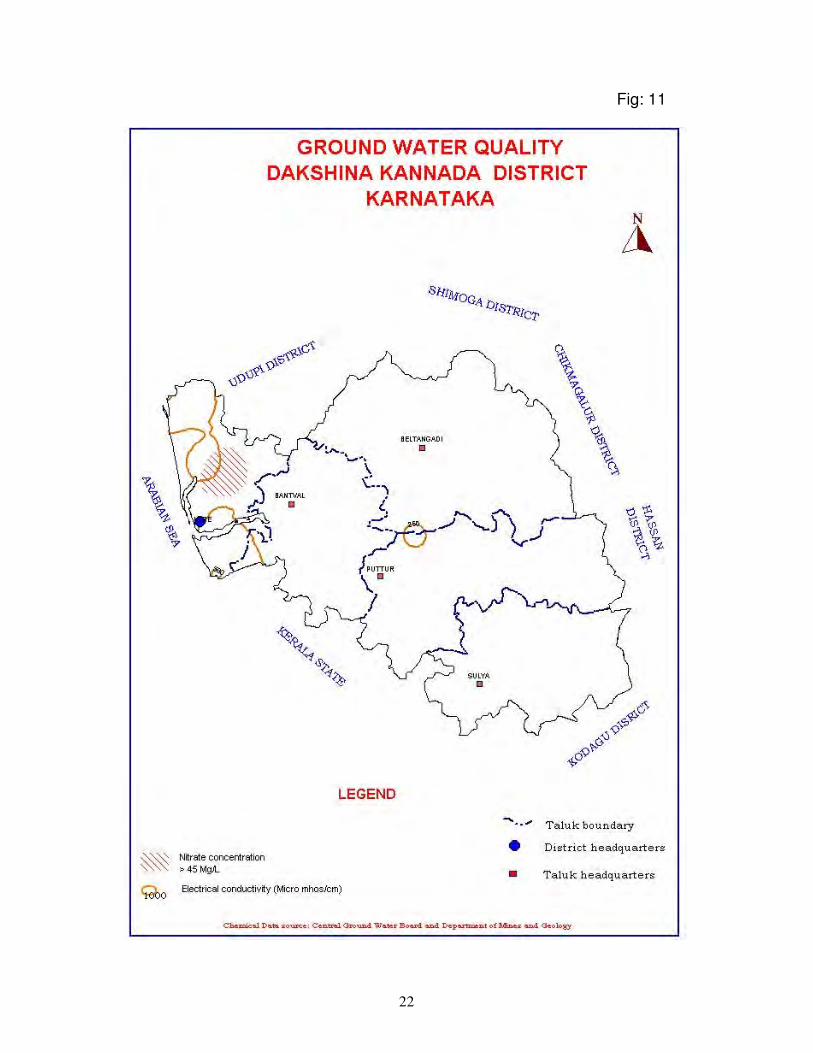
4.3 Groundwater quality:
Groundwater quality is generally good and potable. The specific conductivity of ground water in the district varies from 70-140 micromhos/cm at 25oC. The groundwater quality map is shown in figure 11.
5.0 Groundwater Management Strategy 5.1 Groundwater Development: The average groundwater development of the district is 66%. The resource estimation reveals that the extent of development is the highest in Bantwal taluk (71%) and the least in Belthangadi taluk (49%). In others taluks it is 67% in Mangalore taluk, 85% in Puttur taluk and 63% in Sullya taluk. Net ground water availability for future irrigation development as on March, 2009 in Bantwal taluk is 1880 ha.m., Belthangadi taluk is 4142 ha.m., Mangalore taluk is 1124 ha.m, Puttur taluk is 846 ha.m and Sulya taluk is 1970 ha.m. Categorisation: which is based on stage of groundwater development as well as long-term trend of ground water level indicates that 40% of the area of the Bantwal taluk and 20% each of Puttur and Mangalore taluks are over exploited. Some part of all the taluks fall in Semi- critical category (table 2). Major parts of Puttur (70%) and Belthangadi (90%) are in SAFE category. In these areas groundwater development is on a low-key and hence enough scope exists further groundwater development. There is no much scope for groundwater development in over exploited areas and groundwater regime is to be closely monitored. In these areas, resource augmentation measures are to be implemented (Fig.13).
22
Fig: 11
23
Table. 2. Talukwise groundwater resource (as on March 2004) Dakshina Kannada district.
TO
TA
L A
NN
UA
L G
RO
UN
D
WA
TE
R R
EC
HA
RG
E
NE
T A
NN
UA
L G
RO
UN
D W
AT
ER
AV
AIL
AB
ILIT
Y
EX
IST
ING
GR
OS
S G
RO
UN
D
WA
TE
R D
RA
FT
FO
R
IRR
IGA
TIO
N
EX
IST
ING
GR
OS
S G
RO
UN
D
WA
TE
R D
RA
FT
FO
R D
OM
ES
TIC
AN
D I
ND
US
TR
IAL
WA
TE
R
SU
PP
LY
EX
IST
ING
GR
OS
S G
RO
UN
D
WA
TE
R D
RA
FT
FO
R A
LL
US
ES
AL
LO
CA
TIO
N F
OR
DO
ME
ST
IC
AN
D I
ND
US
TR
IAL
US
E F
OR
NE
XT
25 Y
EA
RS
NE
T G
RO
UN
D W
AT
ER
AV
AIL
AB
ILIT
Y F
OR
FU
TU
RE
IRR
IGA
TIO
N D
EV
EL
OP
ME
NT
ST
AG
E O
F D
EV
EL
OP
ME
NT
AS
ON
MA
RC
H 2
00
9
SA
FE
AR
EA
SE
MI-
CR
ITIC
AL
AR
EA
CR
ITIC
AL
AR
EA
OV
ER
-EX
PL
OIT
ED
AR
EA
TALUK
HAM HAM HAM HAM HAM HAM HAM
(%)
(%)
(%)
(%)
(%)
Bantwal 12359 7578 3966 1424 5390 1752 1880 71 20 40 - 40
Belthangadi 12540 8397 3237 897 4134 1018 4142 49 90 10 - -
Mangalore 6083 3735 1924 566 2490 697 1124 67 50 30 - 20
Puttur 10053 6081 4573 613 5186 735 846 85 70 10 - 20
Sulya 8794 5488 3098 347 3445 423 1970 63 40 60 - -
Total 49829 31279 16798 3847 20645 4625 9962 Av.66

24
Fig:12

25
5.2 Water conservation and Artificial Recharge:
The average rainfall of the district is 3789 mm and average rainy days are 126. The average groundwater development is nearly 66%. In spite of copious rainfall, during summer season many parts of the district face acute scarcity of water due to highly undulating nature of the terrain and unfavourable sub-surface conditions. However, there is scope for arresting the sub-surface flow at suitable locations through the construction of sub-surface dams. The surface runoff can also be arrested by constructing check dams, vented dams etc throughout the district at appropriate places. This can assure availability of water during peak requirement period. Such measures are necessary in areas of Bantwal, Puttur and Mangalore taluks which are categorised as over exploited. Insitu Rainwater Harvesting may ease the problems of seasonal water - scarcity and saline water ingress in coastal stretch.
6.0 Groundwater related issues and problems The district receives more than 3000 mm rainfall annually.
However, inspite of a good amount of rainfall, there are certain problems which need a proper water management strategy. The major problems are i). Flooding and coastal erosion ii). Salinity ingress of coastal aquifers and Inland salinity along river course. iii). Water logging
Flooding and coastal erosion: is the problem in the coastal tract and adjacent the major rivers like Netravati and Gurupur rivers due to incessant rains. The problem worsens during high tide time. Though a complete solution is not possible, construction of a series of checkdams across the rivers and coastal erosion measures along the coast can alleviate this problem during medium intensity rainfall.
Salinity ingress of coastal aquifers : Salinity ingress of coastal aquifers and the inland salinity problem along the major river sides mainly during summer months when seaward fresh water flow in the rivers dwindle are prevalent on a minor scale. To check the movement of saline water ingression inland through river and protect the groundwater. Construction of dams across rivers and streams can reduce the problem. Dams are constructed at many locations already in the area. Water logging: The observation well data of CGWB for November 2011 shows an area of limited extent which have depth to water level with in 2 mbgl. However, in the coastal tract and along the main rivers groundwater lies within 2 to 5mbgl which can be considered to be ‘prone for water logging’.

26
Fig: 13
27
The NHS water level data of CGWB collected during pre-monsoon indicates water level between 2 to 5 mbgl in the coastal plains and alongside the river in Mangalore and Bantwal taluks. Such water logging prone areas are found in different taluks at topographic lows. Proper drainage and exploitation of groundwater will help in improving the situation.
7.0 Awareness and Training Activity: 7.1 Mass Awareness Programme & Water Management: Training Programme: One ‘Mass Awareness Programme’ was conducted in Mangalore during 2001. Lectures on rainwater harvesting and artificial recharge to ground water were given and brochures are distributed. 7.2 Participation in Exhibition, Mela, Fair etc: Nil 7.3 Presentation and Lectures delivered in public forum, Radio/ TV, Institute of repute/ Grassroot associations/ Academic institutions etc : Nil
8.0 Areas Notified by CGWA/SGWA : No area is notified either by
CGWA or SGWA.
9.0 Recommendations: After analyzing the present groundwater scenario in Dakshina
Kannada district, the following recommendations are made to develop and manage ground water on sustainable basis in different parts of the district.
a) Dugwells which are currently in use in the high groundwater development areas may be further deepened to tap more saturated part of the phreatic aquifer and increase the yield.
b) Pinpointing of sites for wells and bore wells in feasible areas should be tried based on scientific investigations to avoid failure of wells.
c) In areas prone to water-logging conjunctive use of surface and groundwater should be practiced. Withdrawing more groundwater through dugwells and shallow borewells reduces the water-logging problem in the command area by declining the groundwater level.
d) Water use efficiency should be achieved by adopting water economy methods like drip irrigation and sprinkler irrigation in a large way in irrigated agriculture to save water.
28
e) Insitu rainwater harvesting is suitable for the villages where ground water carries excess nitrate or affected by high salinity such as in coastal tracts. Rainwater harvesting in hilly areas also offer a solution for drinking water problem.
f) Artificial recharge measures like check-dams, percolation tanks, and point recharge structures shoud be implemented on an extensive scale especially in Critical areas (eg: Bantwal taluk). Suitable artificial recharge structures should be constructed in different terrains which will arrest and store the run-off in rainy season. This stored water will augment recharge to groundwater and also helps in arresting soil erosion and controlling flood.
g) Rejuvenation of existing MI tanks by de-silting would enhance their storage and percolation capacities.
h) Institutional financial assistance should be provided to poor farmers for adopting groundwater augmentation practices such as Rain Water Harvesting and construction of different Artificial Recharge Structures.