Embed Size (px)
Citation preview

Dairy Expansion?
A 2008 Trehane Trust award
Rodney Down N.Sch
Southmead
Higher Wrantage Farm
Wrantage
Taunton
Somerset
TA3 6DF
England
Tel: (+44) 1823 481397
Mobile: (+44) 07980 001319
Email: [email protected]

1
Table of Contents
Table of contents ................................................................................................................1
Acknowledgements ................................................................................................................2
Executive summary ................................................................................................................3
Recommendations ................................................................................................................4
Introduction ................................................................................................................5
Future world dynamics in population and food production ...............................................6
The importance of dairy ................................................................................................................7
The UK dairy industry ................................................................................................................8
Australia .............................................................................................................................9
Russia ...........................................................................................................................12
Hungary ...........................................................................................................................15
New Zealand ...........................................................................................................................17
California ...........................................................................................................................22
The UK ...........................................................................................................................27
Conclusions ...........................................................................................................................29
Appendix ...........................................................................................................................33

2
Acknowledgements
I would like to take this opportunity to thank my sponsors The Trehane Trust. They have opened a
new chapter in my life and helped broadened my knowledge and horizons beyond my wildest
dreams. I feel my whole Nuffield experience is far from over and I will continue in life always
wanting to add to what I have learnt and enjoyed so much over the last eighteen months.
I must thank my wife Claire and two children, Lauren and Harrison both born whilst on my travels.
This experience has benefited them all and we are now a stronger and closer family as a result. My
staff, Dan, Dawid, Alan and Tom have also benefited from being allowed to expand themselves and
flourish in the new found space whilst the boss was away!
And finally to other scholars in the UK and abroad for welcoming me into the Nuffield family and to
all the people from around the world who have, without exception welcomed me and provided
excellent thoughts, information and wisdom on my subject.
Thank you all.
Disclaimer
“The views expressed in this report are entirely my own and do not necessarily represent the views of
the Nuffield Farming Scholarship Trust or the Trehane Trust or my employees or any other associated
bodies.
This Nuffield report has been prepared in good faith on the basis of information available at the date
of publication. The Nuffield Farming Scholarships Trust will not be liable for any loss, damage, cost
or expense incurred arising by reason of any person using or relying on any information in this
publication.
Where products are identified by proprietary or trade names no endorsement or recommendation is
implied. Other products may perform as well or better than those specifically referred to”.
3
Executive Summary
The larger herd size does not automatically lead to increased margins, usually the opposite.
Paid labour units associated with large herds are more difficult to control than ones with
equity partners/share milkers or family members as they have a personal stake in the
business.
The market for the milk produced needs to be reflected in the production system. Volatile
milk prices (hard dairy products) need to be produced by least cost producers. Retailer
aligned even milk supply must receive a premium for increased costs of production and
infrastructure associated with such systems.
Expansion needs to happen in the right place in terms of the environment and resource
availability and sustainability.
Land ownership is essential as the biggest growth comes from land appreciation over the
long term.
The best businesses think about profit first then production.
A mixture of housing and grazing can work, especially in the UK. But all costs must be kept
under control.
Make sure you are the right person for your role in the business.

4
Recommendations
1. Scrutinise every part of the business before expanding. You will often find inefficiencies that
can be addressed to give increased profits before expanding.
2. When you have got it right replicate it on another unit with the help of a partner or share
milker.
3. Match the marketplace with your production system or match your system to the market
place if you have not already done so.
4. Measure, record and benchmark against the best performers. Know your cost of
production.
5. We grow forage easily with an abundance of rainfall. This can lead to a lower cost of
production through less bought- in feeds if utilised correctly. Measure, record and utilise
better.
6. Feed input responses will vary on each farm. Are the systems in place to get the most out of
your inputs, water, dairy cow housing, parlour design, staff expertise and training?
7. Look at potential extra earners, such as methane and slurry nutrients.
8. Don’t let your costs increase to meet the milk price. Keep rigid control of them through
budgeting and planning.
9. Keep your eye on the profit margin not how full the tank is and lock into input and output
prices whenever possible to create a guaranteed margin.
10. Make sure the management style and breed of cow matches the marketplace and your
production system

5
Introduction
Never wanting to be a farmer especially a dairy farmer, I “fell” into it after leaving agricultural
college. Returning home to work on my parents rented farm I soon enjoyed the management and
financial side of the business which was mixed between dairy, beef, arable and sheep.
It soon became apparent I might as well utilise this interest and farm on my own and a tenancy was
sought. Fortunately for me and my wife Claire we managed to secure the tenancy of Higher
Wrantage Farm near Taunton, Somerset in 2002 at the age of 23! It was a 300 acre dairy farm set up
for 180 cows. It was also only 3 miles from my parents’ farm which meant we could “borrow” some
machinery in the early years.
After building numbers and acres we now farm 750 acres carrying 250 dairy cows, 350 followers and
beef and 250 acres of cereals. The business is now at a crossroads as to where next? We would
need significant investment to take cow numbers higher and on a tenanted farm it may be a short
lived investment.
Dairying is however the bread and butter of our business and to expand the other enterprises would
be silly when they contribute so little to the overall profit of the business. That’s why I want to look
at expansion around the world to see how other leading agri businesses have approached this
problem in varying scenarios.
The dairy market as a whole will impact my business as we move towards a freer market so
hopefully I should come back with a greater understanding of the requirements of my product.
I am a simple farmer who understands the workings of my business. I do not want to get into the
science of why and how things work, that is for the academics and experts I employ to help advise
me. For that reason this report is of the journey I have undertaken and how I have come to my
conclusions, some of which have already been implemented on my own farm during my studies.
I want to look at different types of business set up and the management style employed, in terms of
financial planning and arrangements.
The system and its market suitability also interest me. I am, however, probably most concerned
with whether there is a perfect model of efficient utilisation of all assets from feed to labour, land to
water and, if so, is it relevant to us in the UK?
“A single conversation with wise men can be better than years of study”

6
Future world dynamics in population and food consumption
At the current average birth and death rate, the world population is growing by 2 people every
second or 80 000 000 extra mouths to feed every year. At the moment it is thought that there are
6.7 billion people living and it is expected to reach 9 billion by 2050.
These figures are staggering and are happening due to increased life expectancy, lower infant
mortality, better diet, health care and wealth.
All of these people are putting massive strain on our natural resources and it would be naive to think
that this will not affect food production. Like everyday life, we need some of the main staples of
modern existence, oil and water, in order to produce food.
It has now been suggested that we have already reached or are about to reach “peak oil”. This is
when the maximum rate of global oil extraction is reached, after which the rate of extraction goes
into terminal decline. This will have a massive effect on our food producing systems. Fertiliser and
fuel, transport and the competition for land if biofuels are to feature in the long term energy
solution will all be factors affecting our ability to compete and feed the worlds’ population.
Attention is now also being focused on our water efficiency. When the amount of water used to
produce an item of food is calculated the results are quite shocking:-
Product Unit Litres of water used
1 Family car Per car 150 000
Beef (ready to cook) Per KG 15 500 (range 10 000 – 100000)
Bread Per slice 40
Cheese Per KG 5000
Wheat (harvested) Per KG 740
Milk (raw) Per litre 995
All this may not seem important at the moment but when you consider only 2.5% of the worlds’
water is fresh and only 1% is “available”, we are going to see increased competition for this essential
life supporting ingredient. Its efficiency is also going to be questioned in the future. We saw this in
Australia on the Contemporary Scholars’ Conference. Irrigation water was scarce and expensive.
This meant that only the higher value and most responsive crops were being irrigated. Milk was a
long way down the list of efficient foods to produce with the use of irrigation.
All these nutrients involved in food production and in this case, milk, may seem far removed from
the rainy British countryside. Fuel is always only a phone call away and fertiliser has always been
available. But in the future, these factors will have a serious effect on our everyday farming lives. It
would be silly to not consider them when looking at our dairy businesses. The clever investor,
planner, businessman or farmer can see what is coming and hopefully prepare themselves for it.
This will, in turn, lead to profitability and survival.
7
Understanding Dairy production, consumption, trade and expansion worldwide
In order to understand dairy farming outside my farm gate I needed to do some research in order to
steer myself in the right direction. It’s not until you start looking at the facts that you can fully
appreciate just how important the dairy industry is worldwide.
Currently we have around 150 million dairy farmers in the world today, obviously ranging from 1
cow (or sometimes one cow shared!) to circa 30 000 cows per herd. This in turn means that it is
estimated that one billion people world- wide are directly associated with the dairy cow, whether it
is ancillary industries or an actual production job itself. The industry affects more people than I ever
imagined.
Worldwide dairy producers produced an estimated 663 million tonnes in 2007. Since 2002 this
figure has grown each year by between 12 and 18 mill tonnes or 2 – 3% pa. So, although we hear of
our national herd and number of dairy farmers in the UK decreasing, world-wide we are expanding
as a whole. Interestingly China, India and Pakistan contributed to over 60% of this growth.
Amazingly, it is estimated that around 60% of this milk actually reaches a “processor” meaning that
the remainder is sold untreated locally or consumed by the producer at home. This makes India the
largest producer in the world by volume but it is the USA who delivers the most milk to the
processor. The UK is in 10th and 8th place respectively, something we should be proud of as we are
only a small island!
China and India each now have over 1 billion people, yet their per capita milk consumption is less
than 1/3 of the EU. China’s milk consumption per capita is however rising as the population
gradually changes itself to a more westernised diet. As a comparison, the US and the EU each
consume 255kg and 300kg per capita per year and is not really growing.
India’s cow numbers have grown in line with population but with China’s vision of large westernised
farms as well as its diet, cow numbers have jumped by 16% in the last 10 years. Yield per cow has
jumped by only 2% to 4000 litres per cow. From looking at other “developing” countries data, it is
obvious that expansion is driven by the countries demand and this is obtained from an increase in
cow numbers and not so much yield. In the UK, we have seen cow numbers fall and yield increase!
The other big player in world dairying and more importantly world trade is New Zealand. Perfectly
situated to satisfy the rising demand of Asia, New Zealand has found itself exporting over 90% of its
dairy products. With this much product entering the competitive world market, New Zealand
farmers have had to produce milk as cheaply as possible. We will come to this later. It is worth
noting that although over 90% of New Zealands’ dairy product is exported, worldwide only 7% of all

8
dairy product ever reaches the world market. It is amazing how much influence this small 7% can
have on dairy markets in every country around the world.
What does this tell us about the UK?
The UK produces 13 billion litres per annum with around 51% being utilised for the liquid market.
This is the premium end of the market yet our self sufficiency is only quoted as 86%. Is this as a
result of the UK dairy industry producing the wrong product, un-competitiveness or are we simply
unable to satisfy our own market? What was even more disturbing is the fact that we have seen UK
milk production fall by nearly 1% per annum over the last 7 years. This year saw us produce the
lowest amount of milk since milk quota was introduced in 1984.
This decline is seriously damaging for our industry as a whole. If dairy processors cannot procure
enough milk to fill their factories then they are not going to invest nor have confidence in the future.
We will also be losing market share to imports. We then have to compete and under cut them in
order to regain that share. If the decline in UK milk production continues, we will lose critical mass
in the processing sector that will be difficult to regain.
The farmers’ share of the consumer or retail price has also fallen from 60% in 1996 to 35% in 2008.
There are a number of reasons for this. Supermarkets and processors have increased their margin
and reduced the farmer price or farm gate price. Increasing costs over the last few years have also
affected the whole supply chain. This has not been passed onto the consumer but instead passed
back down the line of supply, inevitably ending with a lower price to the farmer.
Production systems in the UK are also more diverse than other countries. I will comment about this
in more detail later but out of all the countries visited the UK has the most diverse range of systems.
From the low input spring calvers to the total confinement, 10 000 litre herds on a total mixed
ration. In each country visited, there seemed to be a set system for producing milk. I initially
thought this was where we are going wrong. We didn’t know which camp we were in. But actually I
think that it is a massive strength we have and something we must build on if we are to maximise
our dairying potential.
Expansion in the UK
From the brief data listed above I think before we expand we need to look at what we are doing
already. I feel this can be summarised as the four “S”
System – Is it the correct production system for your milk?
Size – Optimum size of herd may have already been reached or a long way off!
Suitability – are you as a farmer suitable to running this operation and is the local climate
suitable.

9
Sustainable – with the future concerns over global warming, peak oil and water availability
does the current system prove to be future proof?
The study
Australia
Human Population 20.9 million
Cow Population 1,810,000
Average Yield 5.3 t/cow/year
Milk Consumption 320kg ME per capita/year
Export % Approx 37% of production
Import % Approx 9% of local consumption
Self-sufficiency in Milk 144%
Farmers’ Share on Consumer Price 23%
Australia’s dairy production systems are what could be described as “farming on the limits”.
Without the help of artificial watering of crops, dairying can be virtually impossible in most parts.
Even with the help of watering it is often too expensive to use. This occurs because of the
opportunity cost of using the water allocations in a given area. It is often the case that the farmer is
better to sell the water allocation and not produce the milk.
Does this system satisfy the four “s”?
With climate change the hot topic of the moment, will Australia’s climate become any more suitable
to dairying? I personally cannot see it and, in the Murray Delta where I stayed for a while, it was
entering the seventh consecutive year of drought!
The system however was pretty well matched. Most farms had limited infrastructure and cows were
not housed. This meant that the fixed costs of the farm were well under control. So the suitability
of the most common farms was pretty good as they need to keep costs under control in order to
compete with others in the export market.
Australia is also well placed to satisfy the growing populations of East Asia. This has been the
backbone of all agricultural products in Australia whether it is beef, cereals, sheep or milk. It is
impressive how this is always on the mind of the farmer. Their products are very much tailored
towards the market.
Differing systems
As mentioned above the UK has several different production systems. I did see this in Australia on
my first day of visits. The first farmer was typical of the system in Victoria, low input costs with
minimal capital invested in buildings or infrastructure. This farmer had started from nothing as a
share milker and now owned a sizeable farm. This was done by not investing in buildings and
instead investing in livestock and land. It has proved worthwhile as land prices increased, the
investment has paid off.
10
The next farm visited had invested heavily to increase output on the same area of land. This meant
that he also had to invest in cows but with drought and world market fluctuations, these cows
looked quite different in value terms on different months!
This farm was also extremely dependant on buying in food. Concentrates are just as volatile as any
other world traded commodity. The problem is that they don’t always follow the milk price. This is
where I came across a theme, Milk to feed price. As most Australian farms adopted the low input
system in order to survive volatile markets, it was not something that was talked about very much.
Only the totally housed herds were paying attention as feed prices headed north!
Investment funds
Agriculture has become a “sexy” investment with investors seeing that land prices have steadily
increased over recent history, with commercial and residential assets peaking and the stock market
wavering (at the time of visiting it was before the financial crisis) investors were creating funds in
order for the everyday person to have a slice of the agricultural boom. These funds would either
invest in plc companies associated with agriculture (Monsanto, Bayer etc) or they would actually buy
land and farm it.
I was fortunate enough to visit an investment company with such a fund. My first thoughts were: is
this the way for me to expand? Should we be using the clout and muscle of these investors? They
could buy the land and we could run or rent or have a stake in it?
From my observations it is immensely difficult for them to control. The only way the fund grew was
from the asset value of the land, the farming activities actually lost money. This is mainly down to all
the costs associated with running large units with paid labour and trying to keep control of every
aspect of running a farm.
I am not suggesting these would be a bad investment but the growth can often come from
speculative hype and not so much from bottom line profit and growth.
Bringing the investment and corporate structure to your own business
One such businessman/farmer has looked at the corporate structure of business and employed it on
his own farm with great success.
Mr David Brownhill discussed with the whole group of scholars how he has split the farming
operations and asset ownership in a bid to “take the business forward”
An independent chairman is employed for the farming operations which rent the land from the
holding company. Any purchases then have to be cleared at board level. This then means everything
has to be justified! As this is a family business each family member takes responsibility for each part.
More of his presentation can be viewed at nuffieldinternational.org/csc_conf/2008

11
Lessons learnt from Australia
Before expanding look at the resources needed to run the dairy enterprise. In this case its
water, in terms of reliability, cost and availability.
Look at the market and work backwards in order to find the correct production system.
Family operations will grow more successfully if a corporate structure is employed.

12
Russia
Human Population 142.1 million
Cow Population 9,405,000
Average Yield 3.03 t/cow/year
Milk Consumption 219kg ME per capita/year
Export % Approx 1% of production
Import % Approx 8% of local consumption
Self-sufficiency in Milk 93%
Farmers’ Share on Consumer Price 39%
I wanted to look at another form of expansion, investment abroad with other parties on a much
larger scale.
Russia is outside of the European Union so a whole number of difficulties are encountered in just
getting into the country! Running a business is not much different.
My host, Heartland Farms, entered Russia in 2002 with the aid of a UK investor and two more
minimal investors in Russia (both British who moved to Russia to run the project). It was deemed an
opportunistic move at a time when land prices were low as was agricultural optimism.
The first 12 000 Ha were in full production in 2008. It is a long process with most of the land secured
under 49 year leases. Over the whole farm, (27 000 Ha is the predicted total for 2008/9) 1400
landlords have to be dealt with, meaning in-house lawyers and negotiators are employed.
Cropping is mainly wheat, OSR (winter and spring) and sugar beet. Other crops are being grown as a
trial, mainly potatoes, navy beans, soya and sunflowers.
Yields for the wheat are around 4 – 7t/ha, OSR can yield 1t/ha and sugar beet 25t/ha.
The dairy connection?
Heartland Farms is an exclusively arable operation, but due to the countries policy to increase its
food production, politicians are looking at livestock enterprises more closely.
Heartland’s problem is that the local governor is unwilling to let them have any more land leases
unless they start producing livestock or more importantly milk. This is where I realised something
that I was to later experience in New Zealand – Collaboration and partnerships.
You need to know your own strengths and weaknesses, in this case the people involved with
Heartland knew very little about dairy farming. With investors falling over themselves for a
piece of the agriculture boom, it was relatively easy to find partners with some backing.
13
What was not so apparent at the time but came to light, was how quickly this investment money can
dry up when the financial crisis started to unfold. When this happens the money can disappear as
fast as it arrives.
A different business approach.
When a business is looking for investors as a means to expand and grow, it has to sell itself. I saw
this in Russia yet in the UK a lot of farms are failing to do this.
We need to sell our businesses in order to attract staff and maybe investment or partners. In Russia
margins, yields and profitability is often discussed and a rosier picture was painted, even I felt like I
wanted some more! It is relatively easy to sell yourself and not that expensive.
Create a farm/business logo and have items of clothing made for the staff, they can be given
as Christmas presents and when visiting other farms or hosting visits it is a good way of
presenting someone with a gift and advertising what you do.
Web site and a diary/photo gallery of what is happening means anyone can then look you
up.
Farm sign and tidy appearance. Create a smart look for your business. This affects the
whole industry image. Would you eat out of a restaurant with weeds growing around the
building, rubbish outside and dirty windows?
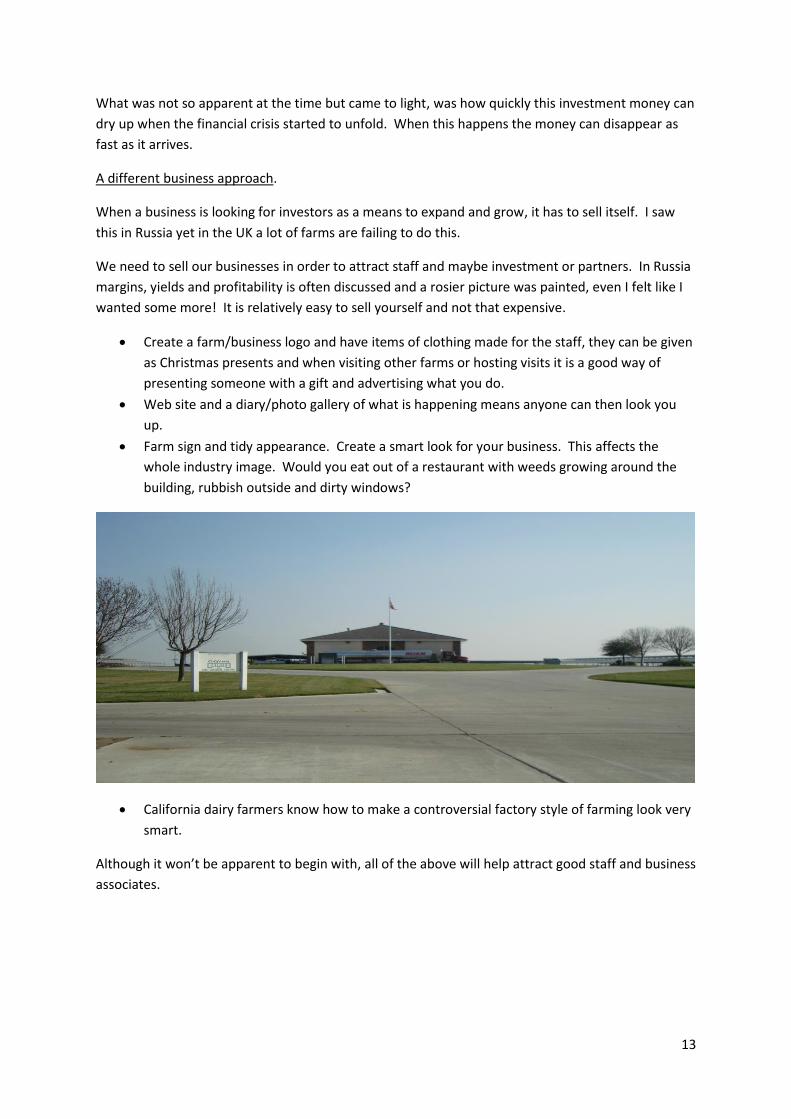
California dairy farmers know how to make a controversial factory style of farming look very
smart.
Although it won’t be apparent to begin with, all of the above will help attract good staff and business
associates.

14
Culture
Russia and Eastern Europe have in history relied on state run farms of massive scale. This has led to
a totally different culture in relation to work. If I were to expand my business interests into these
countries, I would have to employ more labour per unit of output (livestock) because these workers
are only familiar with single task jobs. That is why some of them are so suited to just putting units
on cows, which is happening on many larger UK farms. Massive scales are required to utilise these
workers.
This is why many businesses struggle in Europe. We take our management practises out to the
country and expect them to adopt them but as we all know cultures run deep.
Russia has the largest scale agriculture anywhere in the world. I was fortune enough to have dinner
with a director of Cherkizivo, Russian arable, poultry and processing business that has been floated
on the stock market. It totals 600 000 hectares and will soon reach 1 million. Its aim is to process 60
million chickens per year to go into its own branded products. It also has interests in cows, beef and
pigs and is totally integrated from start to finish!
Russia summary
Difficult bureaucracy and culture make it a difficult and long winded experience and you ideally need
to be resident in the country.
They have more red tape than anywhere else experienced. This means specialist people need to be
employed for each area of red tape and farms have to be large in order to justify them. This then
makes the whole business difficult to control.
It comes back to the people employed. Get the best and Heartland were a good example of this.
A year after I left Russia, the farm was involved in an asset buy out with Volga Farming. Hopefully
this will satisfy the livestock requirement as Volga are involved in a wider range of enterprises.
I was however in love with the country and the opportunities that exist. It also became apparent the
huge amount of land that is not in full production. This is going to cap cereal prices as soon as the
price rises to profitable levels, vast areas of land can be brought back into production with relative
ease.

15
Hungary
Human Population 10.1 million
Cow Population 270,000
Average Yield 6.51 t/cow/year
Milk Consumption 195kg ME per capita/year
Export % Approx 11% of production
Import % Approx 17% of local consumption
Self-sufficiency in Milk 93%
Farmers’ Share on Consumer Price 42%
Magyar Farming Company
This is a true success story of British farmers wanting to expand and exploit opportunities they felt
lay in Eastern Bloc countries. In 1998, Andrew Hunter acting as share holder and managing director
took over a Hungarian farm. Now totalling 1000 cows on 3000 ha, cropping includes cereals and
potatoes. In a bid to expand the business and take up opportunities, the company has recently
expanded into the Ukraine and Serbia.
The key to the success of this business is the management employed at the top. Another important
lesson learnt here is the importance of the agreement set up by all the equity parties involved.
There needs to clear exit and entry strategies for all involved. When Magyar was formed, the tie-in
was for years with only the exit strategy for investors now being looked at. This was done on
purpose as it enabled Andrew and his team to make long term decisions knowing that an equity
partner was not about to jump. Whether it is a family partnership of husband and wife or siblings or
an outside partner, the parameters have to be clear to all involved so that when an interested party
wants to enter or leave, the business is not rocked by such an event.
The dairy
Magyar’s decision to go for the liquid market was obvious, local and premium. As this business was
interested in reinvesting every bit of spare revenue, it needed a good market for its milk. What was
worrying was the volatility of the milk market. The European milk pricing structures seem to follow
the abruptness of the dairy commodity markets with ease!
The culture issue was also seen again with CCTV installed in the milking parlour and everything from
paper towels to fuel having to be locked. On the way home from the farm, we managed to catch a
farmer who was suspected of stealing semen for his own herd!! All this coupled with the language
barrier meant that good management staff could be found but they were limited to ones who were
capable of communicating in English.
The dairy system commonly used in Eastern Europe is the housed system. This is because there are
very few fences around the fields and the climate is extremely hot in the summer and very cold in
the winter. This makes expansion relatively easy. With the massive grants being offered to
agriculture in Hungary, putting the infrastructure in place at the moment for the future is a no
brainer. This farm is thinking of the future now, with the aid of grant aid. Very opportunistic!

16
It is however a relatively high cost system with all food having to be cut and carted. This is why we
see so many farmers on the continent protesting at low milk prices. Their system of production
cannot cope with the troughs in the milk price as they are not that flexible when it comes to
reducing costs.
From the outside looking in, I could see an open grazing system working with large fields to work
with and a New Zealand type system could be set up. The different language and cultures do create
an immediate stumbling block. It would need serious education before it could work. Perhaps the
next generation of Hungarians may be the ones to do this? On suggesting and discussing the
different systems with the managers on the unit, they felt the cold winters would create more of a
problem with a grazing model!
Summary of Hungary
With the right person in charge of the expansion, the investors have gained a hugely
successful business. Timing was near perfect!
Management staff are also key. I feel it would be beneficial to them if they had a training
scheme in place.
The volatility of the milk market and a non flexible system would not be good if the business
was carrying huge debt.
Most EU grants are aimed at this part of Europe making expansion a little easier
Huge amount of red tape makes the UK look relatively free!
Human population is predicted to fall in this part of the world so the dairy market needs to
remain competitive.

17
New Zealand
Human Population 4.2 million
Cow Population 3,917,000
Average Yield 4.41 t/cow/year
Milk Consumption > 350kg ME per capita/year
Export % Approx >90% of production
Import % Approx 3% of local consumption
Farmers’ Share on Consumer Price 39%
I am ashamed to say I travelled to New Zealand with my mind made up. Low cost dairying that was
not going to be suitable to the UK as we have neither the weather nor the soil conditions. I also
thought that they had been “driven” to this system.
The New Zealand dairy system from processing down to production has come a long way in the last
10 years and I would say they are so far ahead of the rest of the world when it comes to matching
the product with the market.
I entered New Zealand just as commodity prices were tripping over the edge from historical highs.
The price Fonterra paid its farmers peaked at nearly 8 NZD per kg of milk solid. This equates to a milk
price of around 33 ppl (2.2 – 2.75 NZD/£. Currency values have varied dramatically during my study).
It has since fallen to 4.4NZD per kg of milk solid in Oct 2009 (approx 14ppl). What was astounding
was that the costs of production I saw varied between 2.8 – 4.5 NZD per kg of milk solid. That left a
good margin in most scenarios and even at its trough the market still managed to cover production
costs!
But surely more litres from an intensive system would mean more profitable litres or was I just
thinking about production not profit. The first farm I stayed on had addressed this in a brilliant way.
The farm was perfectly laid out for the utilisation of grass. Technology was only used to increase
production when the economics allowed. To do this in a way that would not burden a system with
extra infrastructure and costs was very clever. A simple yield recording system was incorporated
into the parlour that allowed concentrate to be fed. There were three feed augers meaning each
ingredient could be changed as economics dictated. It also meant that every cow could theoretically
be fed a different protein mix by simply varying the amounts of each ingredient.
This meant that performance from the herd was running at 2600kgs of milk solids per ha or 33 000
litres per ha!!! How many farms in the UK are creating production figures like this? Many other
farms in the area are producing around 1500 kg/ha milk solids.
This extra production was gained by feeding 2700kg/head per lactation of concentrate (mainly
wheat, rape meal, sodium bicarbonate, minerals and molasses). Because these cows react very well
to the first tranche of concentrate added to the diet the results were fantastic. What was even more
amazing is that this is a similar amount of concentrate to what I feed at home. But this farm made
hardly any silage (surplus grass is cut and used in the winter or dry periods). All the remainder of the
yield came entirely from cheap grazed grass.

18
I would call this system an opportunistic production related investment. When the market dictates a
high milk price returned to the farmer, the feed is turned on which increases yield and the
production of profitable marginal litres. When the milk price is low it is only used selectively or not
at all. The beauty is that nothing has been invested in silage pits, housing or feed pads or machinery.
The Mackenzies’ new dairy shed showing the three augers and gravy or molasses pipe that
drops different combinations depending on the cows yield and milk price!!
New Zealand dairy farming brought home to me the importance of forage utilisation. Their
businesses thrive on the back of it and they make it so simple.
1. Enter covers at 2800 kg/ha DM
2. Residual grazing heights should be 1500 kg/ha DM
3. Measure every week
4. Feed supplements/cull cows or feed extra forage if growth rates are not enough to sustain
the herd intake requirement.

19
On farms that can utilise irrigation the output is quite staggering. 30% of all irrigated land in New
Zealand is now down to dairy production as it’s the easiest way to pay for the infrastructure. This
has mostly happened on the Canterbury Plains as water is more available and the topography more
suitable to centre pivot or lateral irrigation systems and Greenfield sites.
Share milking
I was aware that this happened but not the influence it has on agriculture in general. I first came
across it in Australia but it is New Zealand that has embraced it as a way of climbing the farming
ladder and a way to aggressively grow your dairying business and equity.
I spent the weekend with Leighton Pye at Ashburton who is converting his 5th dairy farm. Most
farms were currently being managed by excellent staff but he was converting the managers to share
milking agreements as a way of delegating the management and risk as his business had grown.
These farms used little technology nor concentrate and his production was lower but so was the cost
of production. Where the farms gained was that on most of the farms he had “wiped them clean”
and laid out the milking shed and tracks in order to gain maximum efficiency. A common theme ran
through all of the units. A milking shed in the centre of the centre pivot irrigator so all the paddocks
were located from the collecting yard!
I can see that share milking can help the UK dairy farmer expand and pass on the business but we
have problems with our system. Many farms have been in the family for years with multiple
generations involved making it difficult to make it work. Also many farms are mixed, making
enterprise clarification more difficult. This is where our culture is hindering progression. We are
simply too emotionally attached to our businesses. New Zealand farms on average change hands
every 8 years. I was surprised by this as you are able to trace the history of every farm back to when
it was settled. Something that I thought they would be proud of and would not want to let go!
Efficiency
We all know that a Greenfield site should be built with maximum efficiency in mind and will
inevitably have an advantage over an older site that has evolved over the last two generations.
What we don’t do in this country is make the fields and paddocks more efficient. Although not so
commonly seen on the north island, the southern islanders that have converted farms to dairying
often wipe the farm clean and start with a clean sheet. This would not be possible in the UK and I
feel the New Zealanders are becoming “conscious” of the environmental element of what has been
happening. It does however create a very efficient dairying platform.
20
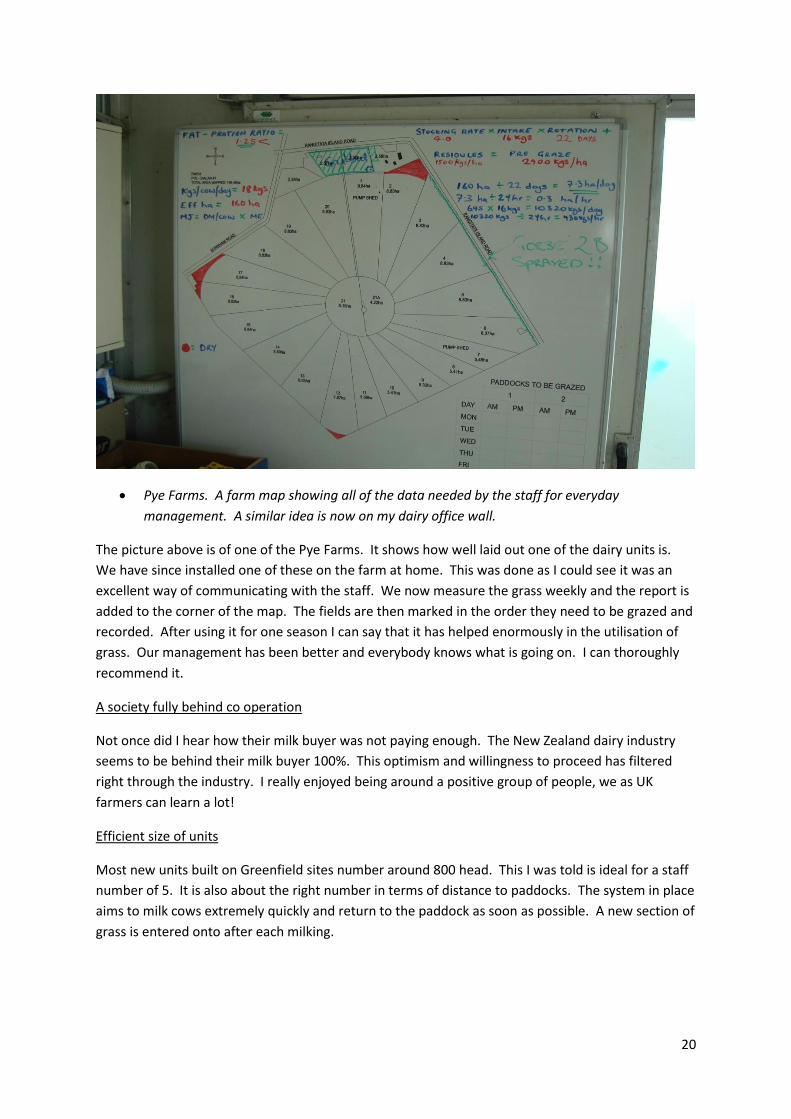
Pye Farms. A farm map showing all of the data needed by the staff for everyday
management. A similar idea is now on my dairy office wall.
The picture above is of one of the Pye Farms. It shows how well laid out one of the dairy units is.
We have since installed one of these on the farm at home. This was done as I could see it was an
excellent way of communicating with the staff. We now measure the grass weekly and the report is
added to the corner of the map. The fields are then marked in the order they need to be grazed and
recorded. After using it for one season I can say that it has helped enormously in the utilisation of
grass. Our management has been better and everybody knows what is going on. I can thoroughly
recommend it.
A society fully behind co operation
Not once did I hear how their milk buyer was not paying enough. The New Zealand dairy industry
seems to be behind their milk buyer 100%. This optimism and willingness to proceed has filtered
right through the industry. I really enjoyed being around a positive group of people, we as UK
farmers can learn a lot!
Efficient size of units
Most new units built on Greenfield sites number around 800 head. This I was told is ideal for a staff
number of 5. It is also about the right number in terms of distance to paddocks. The system in place
aims to milk cows extremely quickly and return to the paddock as soon as possible. A new section of
grass is entered onto after each milking.
21
Empires built
One of the best success stories of dairy farming and expansion comes from visiting Jim van der Poel.
He is a director of Spectrum Dairies and a board member of Fonterra.
Spectrum was started in 2003 by three investors after a “road trip around the south Island”. The
farm business now totals 12 farms with 15 000 cows producing 5.2 million kg of milk solids. It has
also invested in Missouri in the USA where it has 4000 cows on 3 farms.
It is actually relatively simple how the business has grown. This has been achieved through gearing
and share milkers. Each unit utilises share milkers so that its set up costs are reduced. The assets
have luckily grown so that they can be used as leverage and borrowed against for the next unit.
As each share milker has a vested financial interest in the farm, it is also relatively easy to manage.
The ingredients of success in New Zealand
Co operation and collaboration both at processor and farm level (share milkers) has seen
dairy expansion work on a mass scale.
No mixture of enterprises that cloud judgement and financial understanding.
Fluid land market enables farmers to progress
The whole country is behind its farmers
A dairying system that is completely matched to its market, cheap spring milk for
commodities
Fonterra has invested wisely around the world to exploit margins further up the dairy chain
so that its shareholders (the dairy farmers of New Zealand) can benefit.
Plenty of irrigation water from a sustainable source (glacial melt water).
Take home point
Virtually all of the above businesses mentioned have some things in common. They all have
websites to advertise their business to potential share milkers and employees. They all
utilise share milkers as a way of expanding. They all try to own land as a way of increasing
equity and as a good asset base to borrow against and they are all passionate about
farming in a way I have never seen before. They are also all involved in other businesses or
industry activities outside of the farm gate.

22
USA
Human Population 302.7 million
Cow Population 9,158,000
Average Yield 8.66 t/cow/year
Milk Consumption 257kg ME per capita/year
Export % Approx 4% of production
Import % Approx 2% of local consumption
Self-sufficiency in Milk 102%
Farmers’ Share on Consumer Price 50%
California State (CA)
2200 dairy farms
1.5 million cows
21% of all USA milk production
Lower cost of production than the rest of the USA
Expansion has added 1 million cows in the last 10 years!
Flying from New Zealand to California meant that I went from 36 degree heat to 10 degree in less
than 14 hours. It wasn’t just the temperatures that were at each end of the scale, the dairying
systems were as well.
Factory farming with huge outputs needed to cover large capital and input costs would be the
easiest way of summing up the dairy system. Cows housed all year on a total mixed ration producing
a lot of milk.
This was the way I thought I could expand my business at home. It is relatively easy for me to erect a
dairy shed and take on land anywhere in order to grow the food. This meant all infrastructure and
management on one site that should lead to efficiencies and dilution of costs.
The Californian milk market is very strange. Its milk field and market is relatively isolated, by the
Rocky Mountains on the east and the pacific on the west. The state of CA is however the size of the
UK so has got a pretty big home market to satisfy.

23
California milk pricing structure
Payment made to federal collection fund
Milk deliveries
Payment divided up over all
dairy farmers on an average
of all processor payments
The system above explains how the CA dairy farmers arrive at the same price with quota litres
gaining a small premium. It could be described as a similar system to the UK when we had the MMB
(Milk Marketing Board). This has created a level playing field but I could not see that they were any
better off financially or as an industry as a result of it.
Hillmar Cheese is an example of working around the system. A group of farmers set up this
creamery that has now become one of the biggest cheese makers in the world. The farmers
supplying the cheese factory still get the same milk price as the other CA dairy farmers but they also
get a profit dividend from the cheese company.
In a bid to expand the company they have recently set up a factory in Texas.
Mr C. A. Russell kindly met with me during his busy schedule. He runs Claus Dairies and was a
founding member of the Hilmar Company. He has used leverage of his vast land assets in CA and
bought 8000 acres of cropping land in Texas. In a theme seen in New Zealand, many expanding dairy
Milk Processors
(Cheese paying average price)
Federal Milk Fund
(Collects all payments and divides
out revenue)
Quota
(Only held by some farms and does
not always cover all of the milk
delivered) Can be traded and
entitles you to a bonus on
associated litres.
Farmer
Produces milk and is collected by
the dairy
Milk processor
(Liquid paying premium price)
24
business often buy non dairy land. It is cheaper and you can add instant value to it by converting it to
dairy, thus creating a paper profit straight away and you also have a blank sheet to work with.
The worrying part of this aggressive expansion is that the Dalhart region of Texas where the bulk of
the dairy conversions are happening needs huge amounts of irrigation. This water has to come from
an underground aquifer that was established during the last ice age and is not being replenished.
When questioned about this, the opinion of the farmers is that it should last 90 years.
My conclusions were from an environmental point of view. Someone is going to place some
restrictions on this after time and how sustainable is it to build a cheese factory and dairy farms
where you only have 90 years supply of water?
Milk Hedging
Mr Russell was unique on his milk marketing. Not content with owning a share in the biggest cheese
maker in the world he also uses the futures market to hedge his milk price. This is something that
can be done through the Chicargo Mercantile Exchange but is not really adopted by dairy farmers.
Mr Russell believes in seeing a margin and locking into it. He had fixed most of his inputs and fixed
milk at US$18 per hundredweight. The current price was nearer US$10!
Unsustainable on every front?
A theme was developing on my travels, namely “the importance of water and its sustainability”.
Although it is not an issue for UK farmers, it does make us have a competitive edge. The irrigation
water in the Central Valley was failing due to below average or zero snow fall in the mountains that
lie to the East of the valley. Whilst I was visiting the area some farmers were being told that they
had no water for the 2009 growing season. This effectively totally destroys your business. With only
a 3 – 5 inch annual rainfall you can’t really grow much using rainwater in what was originally a
desert!
The rapid expansion of the dairy industry was also unsustainable in my view. The CA dairy industry
had lost sight of its market and they thought that the commodity boom would continue forever! A
conference attended at the World Agriculture Expo was themed on the introduction of actual
production quota similar to what we have experienced in the UK. They were in serious trouble.
The milk price peaked at around $20 USD per hundred weight of milk (30ppl) it had however crashed
to $9.10USD per hundred weight (13.5ppl) whilst I was visiting. With an annual cost of production
running at 20 – 23 ppl these farms were seriously haemorrhaging cash.
From what I was told and what I could see most farms were using equity to stay afloat as they had
very little scope to decrease their costs of production. With a lot of bought in feed ingredients, their
milk price depended immensely on the “milk to feed price” ratio. This is the formula for working out
how many kg of food can be bought with a litre of milk. The dairy farming system in this part of the
US relied 100% on this in order to make a profit.
They had no contracts in place in order to guarantee a milk price with only limited federal
intervention in operation. The dairy industry has expanded so rapidly the dairies could not cope with
all the milk and the liquid processors where buying milk cheaply and making good profits (allegedly)

25
out of the situation. It really was unpleasant to see and I did really feel for some of the businesses
that I visited. Established large businesses were strong enough, providing they were not carrying too
much debt to ride the storm out. As one speaker said at the World Ag Expo “I hope you all paid off
your debts whilst the milk price was high, after all I told you all last year it would never last”
Sexed Semen
This has been widely adopted as a tool to aid aggressive expansion. Currently 45 heifers are born for
every 100 cows in milk. This means that with the current tendered cull scheme was an aid to
reducing production, huge amounts of now low value heifers are entering the system. It also means
that the widely reported culling rates of 40% exist because they can. If it doesn’t fit they kill it!
This is something the aggressive farmer in the UK could adopt more. Fertility needs to be correct to
start with but it would mean the extra cows or second unit is easier to set up requiring less capital
outlay. I have always looked at rearing heifers as buying cows on finance. A little and often payout
in the rearing costs needed to be paid back after milking begins.
Size and efficiencies
The most efficient sizes of herd seem to be 3000 cows utilising one parlour milking 3 times per day.
When expansion happens, they simply replicate it next door. The only extra utilisation of
infrastructure would be a small amount on the slurry and the farm drive!
A spanner in the works
Just as I was beginning to think that housing my cows all year and pushing for yield was not for me I
stumbled across something that makes you think about the large 1000 cow units and the
opportunities that come off the back of such investment.
BioEnergy solutions have emerged when a slurry store is basically covered over and the methane gas
captured. This gas was then “scrubbed” in order to remove other elements present. These were
mainly carbon dioxide and sulphur. This gas was then chilled and pumped straight into the grid
pipeline. The process was so simple it was hard to believe. The company had been set up by a dairy
farmer/entrepreneur and I can see it really taking off. The neighbouring farm had already signed up
and plans were being drawn up for the piping of the gas across to the scrubber which would then
service 2 farms!
This gas was purchased by PG&E (Pacific Gas and Electric) and was marketed as “Natural Gas” along
with a picture of a cow.
The even cleverer bit was the fact that the new farm that was to join the scheme did not have to pay
any capital towards the set up as the company (BioEnergy) financed everything and then paid the
farmer for the gas that was collected.
What I liked about this system is the fact that no other crops need to be grown. It simply uses what’s
already there going to waste. If we are to feed 9 billion people, we can’t really afford to go around
using up land in order to grow crops to produce gas and energy. There is bound to be conflict in the
future.

26
This system does however suit the larger farm and after discussing the system with the company it
could be adopted where the methane and other gases are burned in a converted engine to produce
electricity. It already happens at South West Water’s treatment works at Exeter and other locations.
This electricity can then be sold or utilised on the farm. In this case, there could be a case for it in
the UK as we would also benefit from keeping the rain water out of the slurry pit.
In any expansion, future legislation needs to be considered when planning is taking part. The
legislation in CA is that utility companies like PG&E need to be using 20% renewable by 2010! With
huge dairies across CA, the potential is huge. A 2500 head unit has the potential to produce enough
power for 1000 homes and create thousands of dollars of revenue that at the moment is escaping to
the atmosphere.
Vintage Dairy, Fresno California. BioEnergy’s first methane capture unit. The covered slurry pit has
the optimum 42 days capacity. The scrubber can be seen in the background.
California summary and “take home” messages
High population state which is imposing massive environmental restrictions on dairies. Air
pollution is next on the agenda.
Losing site of the market and competing with low cost producers has cost the farmer
millions.
Sexed semen means culling can be stricter and aids rapid expansion.
The system is extremely rigid and relies heavily on the milk to feed price ratio.
Farmers are unable to lock into higher value milk purchaser contracts. Something I would
not want to return to.
27
UK
Human Population 60.8 million
Cow Population 1,954,000
Average Yield 7.10 t/cow/year
Milk Consumption 264kg ME per capita/year
Export % Approx 20% of production
Import % Approx 31% of local consumption
Self-sufficiency in Milk 86%
Farmers’ Share on Consumer Price 36%
I have visited numerous farms in the UK that have adopted various production systems and I was
able to learn from them all. Our milk market is unique. A farm can lock into a market that suits their
farm and production system.
A liquid supplier needs milk all year round so ideally needs to pay a premium for the extra costs
incurred with this type of system. A cheese or hard product processor can be a little more flexible
with their milk profile. I have encountered many arguments for and against differential pricing but as
I have seen, a high milk price doesn’t always lead to higher profits. In many countries, farmers often
lift the production costs to near the milk price.
Every country is different but I feel it is extremely difficult to pick up a system from another country
and expect it to be 100% correct for our market.
Expansion of my UK based dairy farm.
I feel you really have to look at three main areas whether you are starting a business or expanding
an already established one.
Me, myself or I?
What are your personal strengths and weaknesses? All businesses I saw that were making a success
of growing and expanding knew that the farmer behind it all was not good at everything. They
employ people that are better than them for key and specific jobs.
Sometimes it may take a close friend to help. Ask them what they feel you are like and tell them to
be honest. You might think that you are a good people manager but actually everyone else thinks
that you are lousy!
What part of the business do you enjoy? The usual rule of thumb is that if you don’t enjoy it you
won’t be good at it!
If you are not a good delegator or communicator then how will the business work with more people
involved? Larger operations often require more staff. This is where the share milker utilisation can
help.
28
The market place
This is where the UK is different and I returned home from my travels with more awareness of
where my milk ends up when it leaves the farm gate and what that person requires of me. The
customer is always right, even in farming.
Then match it with the system
If the market you are selling to can have wild price fluctuations then it is complete madness to build
in cost that cannot be removed. If it is concreted or bolted down then is can’t simply be removed
from the cost. Be flexible.
The best businesses I have seen have a rigid 2, 4 or 10 year plan and stick to it. This means that
impulse purchases of equipment are avoided that can, if not planned properly, push up the cost of
production. These costs have also got to be carefully monitored. Again, the best businesses could
tell me how much the labour was, the feed costs or fertiliser cost and most of them knew it without
the need for looking it up on the records.
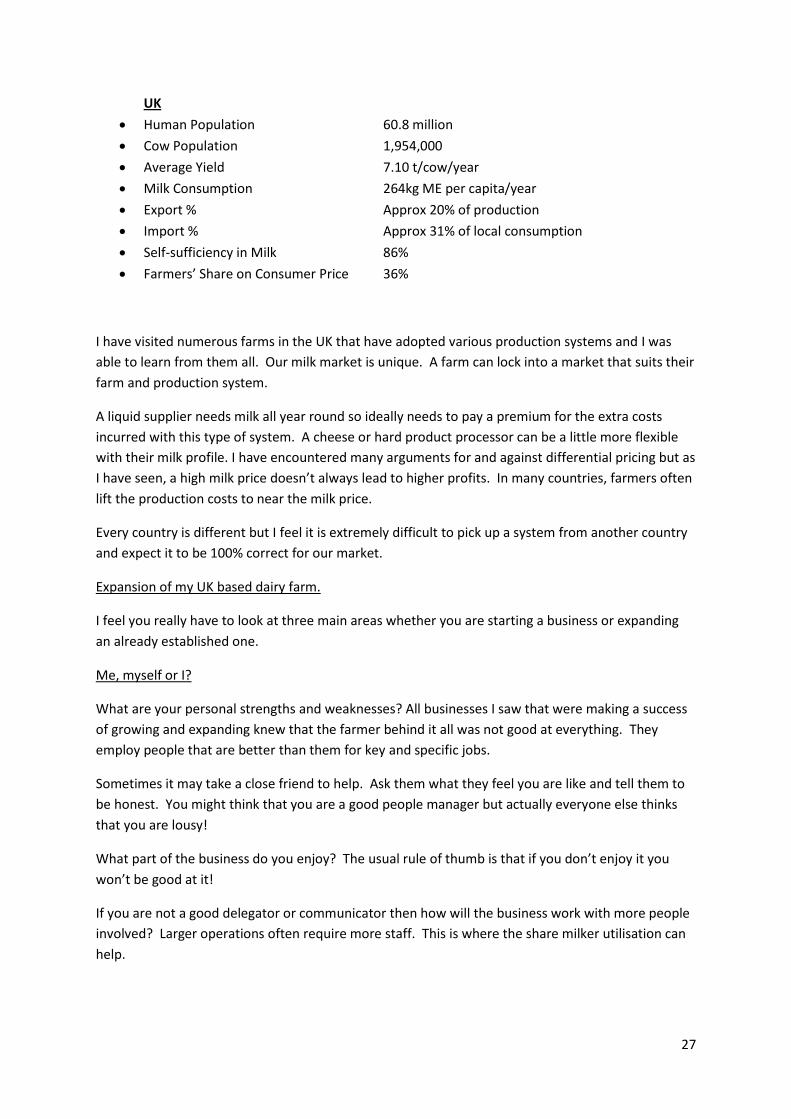
Prices during my study time have varied immensely showing the importance of flexibility and cost
control needed at farm level.
29
Conclusions
When I started my travels in February 2008, oil was peaking at $147 (USD) per barrel and feed wheat
was topping £200 per tonne. A perfect storm had made us all think about our ability to feed the
world and at these prices nearly any type of production system looked OK. By the end of my travels
I had seen oil crash to $37 (USD) per barrel and feed wheat hit £80 per tonne. I think it may have
been the most volatile market situation that any scholar has seen during their travels. This was an
immense help in focusing my mind and not letting the booming markets get me carried away.
The milk price for a non-aligned contract hit 29ppl (excluding seasonality for a 1million litre producer
in the top bands for SCC and Bactoscan) and troughed at 22ppl for the majority although in Ireland
and Northern Ireland prices crashed even further to 17ppl as it was so closely linked to the
commodity markets.
The reason I bring these figures to the attention of this report is that feed costs feature as a major
part of our costs, 20 – 40% typically. When you include fertiliser which follows oil and gas prices it is
an even higher proportion of the costs. These costs will feature heavily as we move forward and try
to feed 9 billion people.
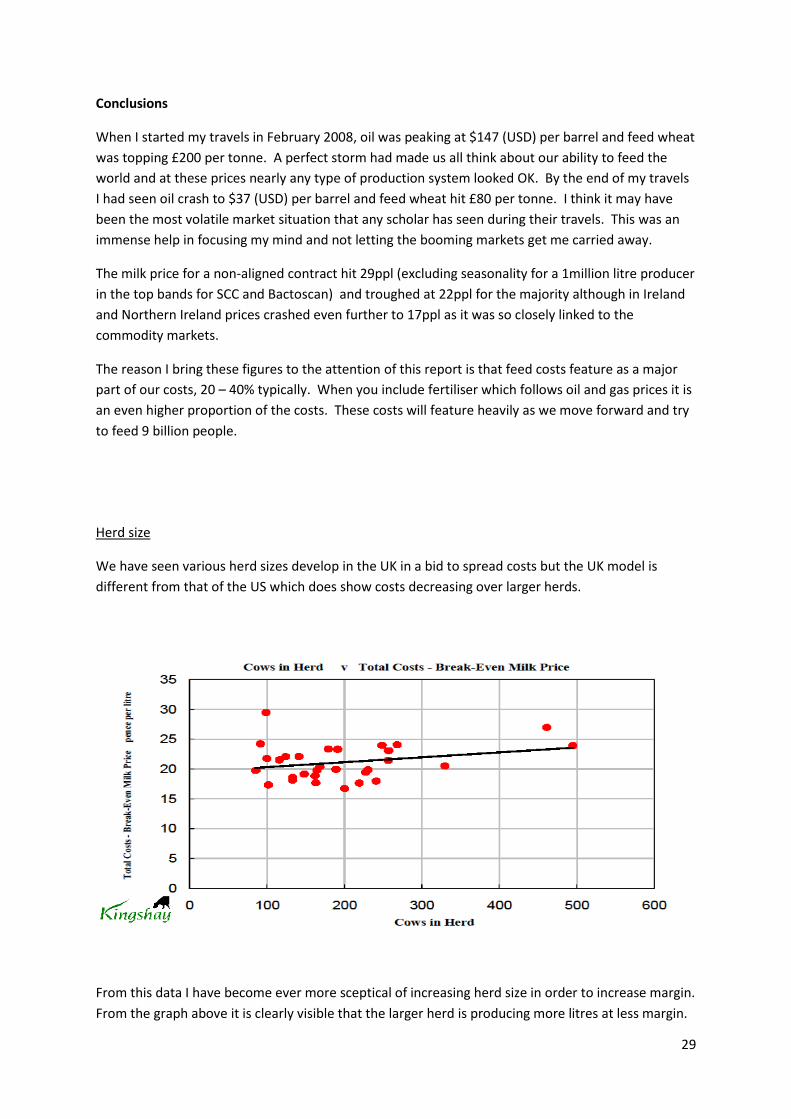
Herd size
We have seen various herd sizes develop in the UK in a bid to spread costs but the UK model is
different from that of the US which does show costs decreasing over larger herds.
From this data I have become ever more sceptical of increasing herd size in order to increase margin.
From the graph above it is clearly visible that the larger herd is producing more litres at less margin.

30
Why?
From the visits I have done in the UK many of these herds have added cows to already stretched
facilities and actually made the whole herd management difficult. It is also very often done with the
same staff so everything becomes pushed to the limit.
This is where the new purposely built unit on a Greenfield site comes into its own. This does happen
but investment has been limited recently due to below cost returns in the UK.
Larger units also rely more heavily on paid labour and this will not usually be as efficient or thorough
as the farmer doing it himself.
This is where the multiple site system with an equity partner or share milker involved comes into its
own as they will have a personal involvement financially in the management of the cow and unit.
Realising that larger herds had increased costs per litre in the UK, my attention therefore switched to
increasing the profitability of what we do already. This can be attacked in a variety of ways:-
Staff. As mentioned above when the unit is larger more staff need to be employed and the
larger the herd the more chance of utilising specially trained staff. If you surround the
business in the best people and train them well, look after them and pay well, success will be
easier for everybody.
Know where your optimum efficiency is going to be
I have realised since travelling how many actual farmers attend open days organised by the Vet
and MDC and leave the staff at home doing the work. We now send all our staff on Johnes disease
workshops, diet workshops and grazing management days. Everybody can then be aware of what
you are trying to achieve!!

31
Where is your business on this scale? You can use this scale for yield as well as number of cows,
even stocking rate, fertiliser usage and staffing numbers.
Forage utilisation and Feed conversion efficiency (FCE)
The average UK farm is not utilising the food that we can grow so cheaply and more importantly
without the use of irrigation. I thought it was just for the low input spring grazers but it is not. Even
the management of conserved forages can be better to aid further utilisation. Since returning home
we have started to measure grass and its consumption resulting to us harvesting the largest amount
of forage off of our land (both grazed and cut). Next year we plan to build on this further. I feel at
this point I need to mention the breed of cow used. I have seen all breeds and crossbreds in nearly
every system and with the correct management they all perform well. It is my feeling that, although
the Holstien has a place in UK genetics, we should be breeding a smaller, coarser and more robust
animal. The crossbred option is obviously the correct one for the spring grazers as has been proven
around the world. If we then bring sexed semen into the system, it can allow higher culling rates of
cows that are wrong for the system. The reason why culling rates are low in many cases is because
cows not suitable to the system are kept on as replacements either home bred or purchased are not
always available or are too expensive.
Feed conversion efficiency
This was seen in different guises in each country. New Zealand used it to a limited extent as you
need to know the exact DM of the grass and the intakes achieved. CA used it on a limited scale and
preferred to use the milk/feed price ratio to gauge profitability. But I failed to find an industry
“target” that has been advertised as a good goal. It seems apparent that it is a good measure of
continued farm performance.

32
The UK market
Nowhere in the world did I find a market like our own. We are relatively free both in options of milk
purchasers and red tape involved. I had many farmers amazed at the fact that a major supermarket
(TESCO) have agreed to pay a guaranteed price to cover the costs of production and most of the
other supermarkets have agreed to pay a premium over the standard price.
The fact that this has happened in the UK had made me feel that this is the place to produce milk.
Even with NVZ regulations which are present in the poultry industry and in nearly every other
country visited in one form or another. Our land is competitively priced compared to other
developed agricultural areas (excluding eastern Europe and Russia as they are not developed in
terms of infrastructure as we are) and we often get more work out per unit of labour than many
other countries.
From what has been experienced, we can improve our efficiencies on many fronts and can improve
profitability from our current average herd size of 100 – 200 cows although I do feel the higher end
of this bracket is more sustainable. The most clever and successful people seem to replicate it on
another site so as not to enter inefficiencies like the graph before illustrated. Get it right then do it
again. This can then utilise share milkers or partnerships if you have multiple sites.
Land ownership
I have seen various business models around the world but nearly all of them either try to own the
land or own the lease. This then creates a stable asset base to borrow against and create security.
Land values always increase over time and this can add to growth of the business.
Changes to my own farm business as a result of my studies.
Installation of a segregation gate so that cows could be split at milking with the lower
yielders now being challenged to graze more. The gate was seen in New Zealand.
Variable rate vacuum pump motor fitted in aid to reduce energy usage. Seen on some farms
in New Zealand. Payback for this investment is 15 months!
Adoption of out wintering cattle on stubble turnips. Numbers have risen for the third year
with 60 in calf heifers and beef grazing all winter.
Marginal litres are now questioned more before we start chasing them.
As a result of me going away, the staff have developed and sadly ones that did not fit the
management style or system identified themselves and have left. The net result is we are
left with the best team we have ever had. Nuffield affects more than just the Scholar!
Red clover leys have been introduced as a way of reducing our Nitrogen usage. With rising
demand for fossil fuels fertiliser is only going to get more expensive.
Dirty water is now stored until the spring and spread on grassland eliminating the need for
the first application of nitrogen. But you do need to analyse it.
We are looking at land ownership and a second unit with greater confidence than before my
travels.

33
Appendix 1
The people who made it happen
Australia 20th February – March 14th 2008
All involved in the Contemporary Scholars Conference
Warakirri Asset Management, Melbourne, Managing Director Ian Rohde
Rabobank Melbourne, Mark Bennett
Dairy Australia, Melbourne, Steve Coates
Garry and Anne Budge, 710 Echuka, Nanneella Rd. Victoria.
Sally Mitchell and Barry Osborne, Torrumbarry. Victoria.
Janet Moxey, The Angle Dairy, Rollands Plains, NSW.
Special thanks must go to Jamie and Anne Snell of Merrigum Victoria, for offering me
accommodation and helping with contacts.
Russia and Hungary 20th – 28th June 2008
Heartland Farms and in particular Colin Hinchley, Richard Willows and George Green.
Magyar Farming Company, Gyor Hungary. In particular Andrew Hunter and Ted de Boer.
New Zealand 11th – 25th January 2009
Special thanks must go to Craige and Roz Mackenzie Reynolds Road, Methven, for allowing me to
use them as a base for my travels.
Leighton Pye, Pye Farming Partnership Ashburton
Sarah Wing
Andy McFarlane
Jeremy Andrews
Wrigley Transport and Dairies.
Jim Van Der Poel Director of Fonterra

34
California 26th January 2009 – 14th February 2009
Leslie Butler from UC Davis California was instrumental in organising 5 days of support and trips.
Nick Adams from Alltech allowed two of his staff to give up 3 days in order to show me different
systems.
Other farms visited were:-
Jack de Young, Riverranch Dairy
Tony de Groot, De Groot Dairies, Hanford
Ray Gene Vedduis
CA Russell , Dairy Farmer in California and Texas and founding member of Hillmar Cheese.
Scott Wicstrom, Wicstrom Jerseys on various sites in California and partner in Hillmar Cheese.
Ralph Perry, Sales Manager for Alltech California.
Pedro Ramos, Regional Manager Alltech Western region.
UC Davis California
Ed de Peters
Dan Sumner
Peter Robinson
Jennifer Heguy
Jerry Higginbotham
World Ag expo Conferences and talks
UK
300 Cow Club, visits joined of interest to my studies were:-
Edinburgh 22nd – 24th April 2008 Dairy expansion and taxation
Harrogate 21st – 22nd April 2009 Metcalf Farms, UK and Russia and Torsten Hemme IFCN Report
findings.
North Wales 20th -21st October 2009 Farming system comparisons, David Wynne Finch and David
Harden.
Cheshire 25th-16th April, Tesco Centre of Excellence, Richard Fair’s 800 cow dairy unit and The Cogent
Sexed Semen operation.

35
Appendix 2
Websites and other supporting evidence
International Farm Comparison Network (IFCN). A tool that every dairy farmer should have on the
shelf! Released every year and now in its 10th. It can be gained from contacting DairyCo or Torsten
Hemme, Chairman. [email protected] or www.ifcndairy.org
www.dairyco.org.uk
www.heartlandfarms.ru/en
www.pyegroup.co.nz
www.volgafarming.com
www.metcalfefarms.co.uk
www.usda.gov
All other contact details available on request.