Embed Size (px)
Citation preview

50
DAFTAR PUSTAKA
1. Powers SK, Howley ET. Exercise physiology: theory and application to
fitness and performance, fourth edition. New York: McGraw-Hill; 2001.
p.407-22.
2. Miller JF, Bujak Z, Miller M. Sports results vs. genera physical fitness level
of junior taekwondo athletes. Journal of Combat and Martial Arts.
2011;1(2):39-44.
3. Subarjah H, Si M. Latihan kondisi fisik [Internet]. 2012 [dikutip pada tanggal
16 Januari 2015]. Diunduh dari:
http://fileupiedu/Direktori/FPOK/JUR_PEND_KESEHATAN_%26_REKRE
ASI/PRODI_ILMU_KEOLAHRAGAAN/196009181986031HERMAN_SU
BARJAH/LATIHAN_KONDISI_FISIK pdf.
4. Bompa TO, Haff G. Periodization: theory and methodology of training.
Illinois: Human Kinetics; 2009. p.67-80.
5. Udiyana I, Kanca I, Sudarmada I. Pengaruh pelatihan modifikasi zig zag run
terhadap peningkatan kecepatan dan kelincahan pada siswa putra peserta
ekstrakulikuler sepak bola SMA PGRI 1 Amlapura Tahun Ajaran 2013/2014.
e-Journal IKOR Universitas Pendidikan Ganesha. 2014;1:1-10.
6. Sheppard J, Young W. Agility literature review: classifications, training and
testing. Journal of sports sciences. 2006;24(9):919-32.

51
7. Vescovi J, Rupf R, Brown T, Marques M. Physical performance
characteristics of high-level female soccer players 12–21 years of age.
Scandinavian journal of medicine & science in sports. 2011;21(5):670-8.
8. Dawes J, Roozen M. Developing agility and quickness. Illinois: Human
Kinetics; 2012. p.1-24.
9. Taskin H. Effect of circuit training on the sprint-agility and anaerobic
endurance. The Journal of Strength & Conditioning Research. 2009; 23(6):
1803-10.
10. Young WB, McDowell MH, Scarlet BJ. Specificity of sprint and agility
training methods. The Journal of Strength & Conditioning Research.
2001;15(3):315-9.
11. Battinelli T. Physique, fitness, and performance. Boca Rotan (United States):
CRC press LLC; 2007. p.5-10.
12. Health skill related fitness [Internet]. [dikutip pada tanggal 16 Januari 2015].
Diunduh dari:
http://www.glencoe.com/sites/common_assets/health_fitness/gln_health_fitne
ss_zone/pdf/heart_rate_monitor_activities/health_skill_related_itness/health_
skill_related_fitness_activity_4.pdf.
13. Ismaryati I. Peningkatan kelincahan atlet melalui penggunaan metode
kombinasi latihan sirkuit pliometrik dan berat badan. Paedagogia. 2008;11(1).
14. Brooks G, Fahey T. Exercise physiology: human bioenergetics and its
application. New York: McGraw-Hill Humanities; 2004. p.3-16.

52
15. Karyono T. Pengaruh metode latihan dan power otot tungkai dan kelincahan
[Disertasi]. Surakarta: Universitas Sebelas Maret. 2011.
16. Young W, James R, Montgomery I. Is muscle power related to running speed
with changes of direction? The Journal of sports medicine and physical
fitness. 2002(42):282-8.
17. Speed and agility [Internet]. [dikutip pada tanggal 16 Januari 2015]. Diunduh
dari:http://www.ucs.mun.ca/~dbehm/Advanced_Fitness_Assessment/Speed_a
nd_Agility.htm.
18. Nimphius S. Increasing agility. In: Joyce D, Lewindo D, editors. High
performance training for sports. Illinois: Human Kinetics; 2014. p.185-8
19. Allford A. Agility - the most misunderstood fitness component? [Internet].
2013 [dikutip pada tanggal 24 Februari 2015]. Diunduh dari:
http://www.thesoccerstore.co.uk/blog/football-coaching/agility-
misunderstood-fitness-component/.
20. Young WB, Henry BDG. Agility and change-of-direction speed are
independent skills: implications for training for agility in invasion sports.
International Journal of Sports Science & Coaching. 2014: 1-14.
21. Ganong WF, Barrett KE. Review of medical physiology. New York:
McGraw-Hill Medical; 2005. p.197-9.
22. Brown L, Ferrigno V. Training for speed, agility, and quickness, 3E. Illinois:
Human Kinetics; 2014. p.2-8.

53
23. Atiq A, Yunitaningrum W. Kekuatan otot tungkai dan kelincahan terhadap
kecepatan dribbling sepak bola di SMAN 1 Tebas. Jurnal Pendidikan dan
Pembelajaran. 2014;3(6):1-12.
24. Tanner R, Gore C. Physiological tests for elite athletes. Illinois: Human
Kinetics; 2013. p.132.
25. Mackenzie B. Performance evaluation tests. USA: Peak Performance. 2005.
p.55-72.
26. Heikkinen D. Physical testing characteristics and technical event performance
of junior alpine ski racers [Disertasi]. Farmington (United States): The
University of Maine. 2003.
27. Pratama I, Budiawan M, Sudarmada I. Pengaruh pelatihan three corner drill
terhadap peningkatan kelincahan dan power. e-Journal IKOR Universitas
Pendidikan Ganesha. 2014;1:1-7.
28. Mackenzie B. Training principles [Internet]. 2000 [dikutip pada tanggal 16
Januari 2015]. Diunduh dari: http://www.brianmac.co.uk/trnprin.htm.
29. Guyton, Hall J. Fisiologi kedokteran. Jakarta: EGC; 2008. h.1339-43.
30. Sidik DZ, Imanudin I, Affari L. Penerapan complex training terhadap
peningkatan kemampuan anaerobik. Jurnal Iptek Olahraga. 2012;14(2):124-
42.
31. Kravitz L, Beltz N, Jonathan N, Mike. Anaerobic metabolic conditioning
[Internet]. 2014 [dikutip pada tanggal 7 Januari 2015]. Diunduh dari:
https://www.unm.edu/~lkravitz/Article%20folder/Anaerobic.pdf.

54
32. Anaerobic exercise for physical fitness [Internet]. 2004 [Dikutip pada tanggal
26 Januari 2015]. Diunduh dari:
http://www.weightawareness.com/topics/doc.xml?doc_id=1360.
33. Bishop D, Girard O, Mendez-Villanueva A. A repeated sprint ability part II:
recommedations for training. Sports Medicine. 2011;41(9):742-56.
34. McArdle WD, Frank I, Katch, Victor LK. Exercise physiology: nutrition,
energy, and human performance. Philadelphia: Lippincott Williams &
Wilkins; 2010. p.480-3.
35. Hawley JA. Specificity of training adaptation: time for a rethink? The Journal
of Physiology. 2008;586(1):1-2.
36. Coburn JW, Malek MH. NSCA's essentials of personal training. Illinois:
Human Kinetics. 2011. p.71-83.
37. Chaleh M, Fatemi R, Shahsavar A. Relationship between speed, agility, and
anaerobic power of 14-16 years elite soccer players. Int J Appl Basic Sci 3.
2012;3(2):427-432.
38. Swadesi, I. Perkembangan dan belajar motorik. Singaraja: Buku Ajar. 2009.

55
Lampiran 1. Ethical Clearance

56
Lampiran 2. Ijin Penelitian

57
Lampiran 3. Informed Consent

58
59
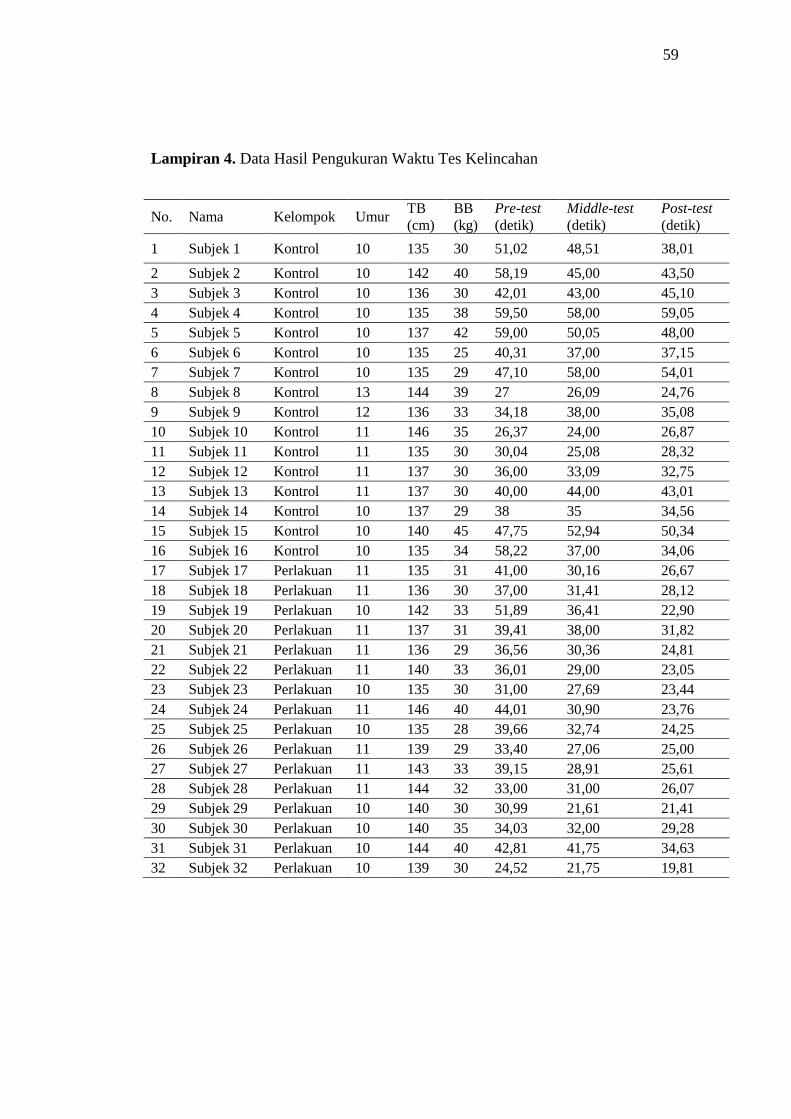
Lampiran 4. Data Hasil Pengukuran Waktu Tes Kelincahan
No. Nama Kelompok Umur TB
(cm)
BB
(kg)
Pre-test
(detik)
Middle-test
(detik)
Post-test
(detik)
1 Subjek 1 Kontrol 10 135 30 51,02 48,51 38,01
2 Subjek 2 Kontrol 10 142 40 58,19 45,00 43,50
3 Subjek 3 Kontrol 10 136 30 42,01 43,00 45,10
4 Subjek 4 Kontrol 10 135 38 59,50 58,00 59,05
5 Subjek 5 Kontrol 10 137 42 59,00 50,05 48,00
6 Subjek 6 Kontrol 10 135 25 40,31 37,00 37,15
7 Subjek 7 Kontrol 10 135 29 47,10 58,00 54,01
8 Subjek 8 Kontrol 13 144 39 27 26,09 24,76
9 Subjek 9 Kontrol 12 136 33 34,18 38,00 35,08
10 Subjek 10 Kontrol 11 146 35 26,37 24,00 26,87
11 Subjek 11 Kontrol 11 135 30 30,04 25,08 28,32
12 Subjek 12 Kontrol 11 137 30 36,00 33,09 32,75
13 Subjek 13 Kontrol 11 137 30 40,00 44,00 43,01
14 Subjek 14 Kontrol 10 137 29 38 35 34,56
15 Subjek 15 Kontrol 10 140 45 47,75 52,94 50,34
16 Subjek 16 Kontrol 10 135 34 58,22 37,00 34,06
17 Subjek 17 Perlakuan 11 135 31 41,00 30,16 26,67
18 Subjek 18 Perlakuan 11 136 30 37,00 31,41 28,12
19 Subjek 19 Perlakuan 10 142 33 51,89 36,41 22,90
20 Subjek 20 Perlakuan 11 137 31 39,41 38,00 31,82
21 Subjek 21 Perlakuan 11 136 29 36,56 30,36 24,81
22 Subjek 22 Perlakuan 11 140 33 36,01 29,00 23,05
23 Subjek 23 Perlakuan 10 135 30 31,00 27,69 23,44
24 Subjek 24 Perlakuan 11 146 40 44,01 30,90 23,76
25 Subjek 25 Perlakuan 10 135 28 39,66 32,74 24,25
26 Subjek 26 Perlakuan 11 139 29 33,40 27,06 25,00
27 Subjek 27 Perlakuan 11 143 33 39,15 28,91 25,61
28 Subjek 28 Perlakuan 11 144 32 33,00 31,00 26,07
29 Subjek 29 Perlakuan 10 140 30 30,99 21,61 21,41
30 Subjek 30 Perlakuan 10 140 35 34,03 32,00 29,28
31 Subjek 31 Perlakuan 10 144 40 42,81 41,75 34,63
32 Subjek 32 Perlakuan 10 139 30 24,52 21,75 19,81

60
Lampiran 5. Hasil Analisis Statistik
Means
Report
Umur TB (cm) BB (kg) Pre-Test (detik) Middle-Test (detik) Post-Test (detik)
Mean 10.563 138.531 32.906 40.2853 35.7972 32.6625
Std. Deviation .7156 3.6099 4.6998 9.63811 9.90065 10.24647
Median 10.000 137.000 31.000 39.2800 32.9150 28.8000
Minimum 10.0 135.0 25.0 24.52 21.61 19.81
Maximum 13.0 146.0 45.0 59.50 58.00 59.05
Normality Test
Descriptives
Statistic Std. Error
Umur
Mean 10.563 .1265
95% Confidence Interval for Mean
Lower Bound 10.304
Upper Bound 10.821
5% Trimmed Mean 10.479
Median 10.000
Variance .512
Std. Deviation .7156
Minimum 10.0
Maximum 13.0
Range 3.0
Interquartile Range 1.0
Skewness 1.457 .414
Kurtosis 2.920 .809
TB (cm)
Mean 138.531 .6381
95% Confidence Interval for Mean Lower Bound 137.230
Upper Bound 139.833
5% Trimmed Mean 138.313
Median 137.000
Variance 13.031
Std. Deviation 3.6099
Minimum 135.0
Maximum 146.0

61
Range 11.0
Interquartile Range 6.5
Skewness .754 .414
Kurtosis -.730 .809
BB (kg)
Mean 32.906 .8308
95% Confidence Interval for Mean
Lower Bound 31.212
Upper Bound 34.601
5% Trimmed Mean 32.674
Median 31.000
Variance 22.088
Std. Deviation 4.6998
Minimum 25.0
Maximum 45.0
Range 20.0
Interquartile Range 5.0
Skewness .956 .414
Kurtosis .218 .809
Tests of Normality
Kolmogorov-Smirnov
a Shapiro-Wilk
Statistic df Sig. Statistic df Sig.
Umur .315 32 .000 .713 32 .000
TB (cm) .227 32 .000 .857 32 .001
BB (kg) .201 32 .002 .887 32 .003
a. Lilliefors Significance Correction
Umur

62
TB (cm)
BB (kg)
Descriptives
Statistic Std. Error
Pre-Test (detik)
Mean 40.2853 1.70379
95% Confidence Interval for Mean
Lower Bound 36.8104
Upper Bound 43.7602
5% Trimmed Mean 40.0656
Median 39.2800
Variance 92.893
Std. Deviation 9.63811
Minimum 24.52
Maximum 59.50
Range 34.98
Interquartile Range 12.77

63
Skewness .603 .414
Kurtosis -.285 .809
Middle-Test (detik)
Mean 35.7972 1.75020
95% Confidence Interval for Mean Lower Bound 32.2276
Upper Bound 39.3668
5% Trimmed Mean 35.3490
Median 32.9150
Variance 98.023
Std. Deviation 9.90065
Minimum 21.61
Maximum 58.00
Range 36.39
Interquartile Range 13.76
Skewness .773 .414
Kurtosis -.076 .809
Post-Test (detik)
Mean 32.6625 1.81134
95% Confidence Interval for Mean
Lower Bound 28.9683
Upper Bound 36.3567
5% Trimmed Mean 31.9822
Median 28.8000
Variance 104.990
Std. Deviation 10.24647
Minimum 19.81
Maximum 59.05
Range 39.24
Interquartile Range 13.02
Skewness 1.013 .414
Kurtosis .218 .809
Tests of Normality
Kolmogorov-Smirnov
a Shapiro-Wilk
Statistic df Sig. Statistic df Sig.
Pre-Test (detik) .127 32 .200* .941 32 .078
Middle-Test (detik) .139 32 .119 .935 32 .053
Post-Test (detik) .164 32 .028 .894 32 .004
*. This is a lower bound of the true significance.
a. Lilliefors Significance Correction

64
Pre-Test (detik)
Middle-Test (detik)
Post-Test (detik)

65
T-Test (Pre-test dan Middle-test)
Group Statistics
Kelompok N Mean Std. Deviation Std. Error Mean
Pre-Test (detik)
Kontrol 16 43.4181 11.43403 2.85851
Perlakuan 16 37.1525 6.34858 1.58715
Middle-Test (detik)
Kontrol 16 40.9225 10.93036 2.73259
Perlakuan 16 30.6719 5.20264 1.30066
Independent Samples Test
Levene's Test
for Equality of
Variances
t-test for Equality of Means
F Sig. t df Sig.
(2-
tailed)
Mean
Difference
Std.
Error
Differenc
e
95% Confidence
Interval of the
Difference
Lower Upper
Pre-Test
(detik)
Equal variances assumed 7.803 .009 1.916 30 .065 6.26563 3.26957 -.41173 12.94298
Equal variances not assumed
1.916 23.446 .068 6.26563 3.26957 -.49089 13.02214
Middle-Test
(detik)
Equal variances assumed 10.184 .003 3.387 30 .002 10.25063 3.02635 4.07000 16.43125
Equal variances not assumed
3.387 21.465 .003 10.25063 3.02635 3.96528 16.53597
Mann-Whitney Test (Post-test)
Ranks
Kelompok N Mean Rank Sum of Ranks
Post-Test (detik)
Kontrol 16 23.31 373.00
Perlakuan 16 9.69 155.00
Total 32
Test Statisticsa
Post-Test (detik)
Mann-Whitney U 19.000
Wilcoxon W 155.000 a. Grouping Variable: Kelompok
Z -4.108 b. Not corrected for ties.
Asymp. Sig. (2-tailed) .000
Exact Sig. [2*(1-tailed Sig.)] .000b

66
Normality Test: Kelompok Perlakuan
Tests of Normality
Kolmogorov-Smirnov
a Shapiro-Wilk
Statistic df Sig. Statistic df Sig.
Pre-Test (detik) .103 16 .200* .976 16 .924
Middle-Test (detik) .158 16 .200* .948 16 .456
Post-Test (detik) .146 16 .200* .941 16 .361
Selisih Pre-Test dengan Middle-Test .141 16 .200* .935 16 .292
Selisih Pre-Test dengan Post-Test .182 16 .160 .854 16 .016
Selisih Middle-Test dengan Post-Test .126 16 .200* .927 16 .219
*. This is a lower bound of the true significance.
a. Lilliefors Significance Correction
Normality Test: Kelompok Perlakuan (Transformasi)
Tests of Normality
Kolmogorov-Smirnov
a Shapiro-Wilk
Statistic df Sig. Statistic df Sig.
Pre - Post Trf .114 16 .200* .969 16 .815
Pre - Mid Trf .185 16 .148 .936 16 .305
Mid - Post Trf .126 16 .200* .927 16 .219
*. This is a lower bound of the true significance.
a. Lilliefors Significance Correction

67
General Linear Model Repeated Anova Test
Descriptive Statistics
Mean Std. Deviation N
Pre-Test (detik) 37.1525 6.34858 16
Middle-Test (detik) 30.6719 5.20264 16
Post-Test (detik) 25.6644 3.80484 16
Multivariate Testsa
Effect Value F Hypothesis df Error df Sig.
factor1
Pillai's Trace .787 25.801b 2.000 14.000 .000
Wilks' Lambda .213 25.801b 2.000 14.000 .000
Hotelling's Trace 3.686 25.801b 2.000 14.000 .000
Roy's Largest Root 3.686 25.801b 2.000 14.000 .000
a. Design: Intercept
Within Subjects Design: factor1
b. Exact statistic
Mauchly's Test of Sphericitya
Measure: MEASURE_1
Within Subjects Effect Mauchly's W Approx. Chi-Square df Sig. Epsilonb
Greenhouse-
Geisser
Huynh-Feldt Lower-
bound
factor1 .432 11.746 2 .003 .638 .671 .500
Tests the null hypothesis that the error covariance matrix of the orthonormalized transformed dependent variables is proportional to an
identity matrix.
a. Design: Intercept
Within Subjects Design: factor1
b. May be used to adjust the degrees of freedom for the averaged tests of significance. Corrected tests are displayed in the Tests of
Within-Subjects Effects table.
Tests of Within-Subjects Effects
Measure: MEASURE_1
Source Type III Sum of
Squares
df Mean Square F Sig.
factor1
Sphericity Assumed 1061.603 2 530.802 46.630 .000
Greenhouse-Geisser 1061.603 1.276 832.223 46.630 .000
Huynh-Feldt 1061.603 1.341 791.410 46.630 .000

68
Lower-bound 1061.603 1.000 1061.603 46.630 .000
Error(factor1)
Sphericity Assumed 341.494 30 11.383
Greenhouse-Geisser 341.494 19.134 17.847
Huynh-Feldt 341.494 20.121 16.972
Lower-bound 341.494 15.000 22.766
Tests of Within-Subjects Contrasts
Measure: MEASURE_1
Source factor1 Type III Sum of
Squares
df Mean Square F Sig.
factor1
Linear 1055.816 1 1055.816 53.991 .000
Quadratic 5.787 1 5.787 1.802 .199
Error(factor1)
Linear 293.330 15 19.555
Quadratic 48.165 15 3.211
Tests of Between-Subjects Effects
Measure: MEASURE_1
Transformed Variable: Average
Source Type III Sum of
Squares
df Mean Square F Sig.
Intercept 46614.114 1 46614.114 788.967 .000
Error 886.237 15 59.082
Estimated Marginal Means
1. Grand Mean
Measure: MEASURE_1
Mean Std. Error 95% Confidence Interval
Lower Bound Upper Bound
31.163 1.109 28.798 33.528
2. factor1
Estimates
Measure: MEASURE_1
factor1 Mean Std. Error 95% Confidence Interval
Lower Bound Upper Bound
1 37.153 1.587 33.770 40.535

69
2 30.672 1.301 27.900 33.444
3 25.664 .951 23.637 27.692
Pairwise Comparisons
Measure: MEASURE_1
(I) factor1 (J) factor1 Mean Difference (I-J) Std. Error Sig.b 95% Confidence Interval for Difference
b
Lower Bound Upper Bound
1
2 6.481* 1.093 .000 3.537 9.425
3 11.488* 1.563 .000 7.277 15.700
2 1 -6.481
* 1.093 .000 -9.425 -3.537
3 5.008* .794 .000 2.870 7.145
3
1 -11.488* 1.563 .000 -15.700 -7.277
2 -5.008* .794 .000 -7.145 -2.870
Based on estimated marginal means
*. The mean difference is significant at the ,05 level.
b. Adjustment for multiple comparisons: Bonferroni.
Multivariate Tests
Value F Hypothesis df Error df Sig.
Pillai's trace .787 25.801a 2.000 14.000 .000
Wilks' lambda .213 25.801a 2.000 14.000 .000
Hotelling's trace 3.686 25.801a 2.000 14.000 .000
Roy's largest root 3.686 25.801a 2.000 14.000 .000
Each F tests the multivariate effect of factor1. These tests are based on the linearly independent pairwise
comparisons among the estimated marginal means.
a. Exact statistic

70
Lampiran 6. Dokumentasi Penelitian
Gambar. Latihan sprint
Gambar. Hexagonal Obstacle Test

71
Lampiran 7. Biodata Mahasiswa
Identitas
Nama : Afifah Preyanka Dumi
NIM : 22010111130115
Tempat/tanggal lahir : Jakarta, 23 Oktober 1993
Jenis kelamin : Perempuan
Alamat : Jalan Sipodang no.8P, Tembalang, Semarang
Nomor Telepon : -
Nomor HP : 087879258653
e-mail : [email protected]
Riwayat Pendidikan Formal
1. SD : SDN Teluk Pucung VII Lulus tahun : 2005
2. SMP : SMPN 1 Bekasi Lulus tahun : 2008
3. SMA : SMAN 1 Bekasi Lulus tahun : 2011
4. S1 : Pendidikan Dokter FK UNDIP Masuk tahun : 2011
Keanggotaan Organisasi
1. HIMA KU Undip Tahun 2012-2013
2. Asian Medical Students’ Association (AMSA) Undip Tahun 2012-2013