Embed Size (px)
Citation preview

Investor Presentation
February 2018
2
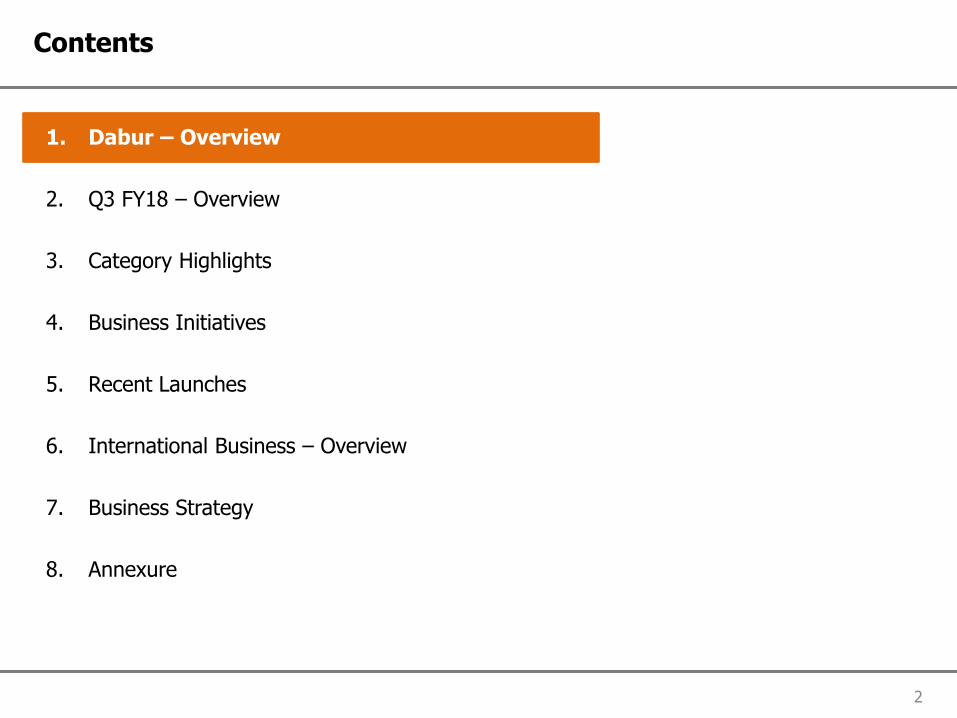
Contents
1. Dabur – Overview
2. Q3 FY18 – Overview
3. Category Highlights
4. Business Initiatives
5. Recent Launches
6. International Business – Overview
7. Business Strategy
8. Annexure

Dabur Red Paste rated as 2nd most trusted brand by the consumers in the Oral Care category by the Brand Equity India’s Most Trust Brand 2017
Dabur Vatika #BraveandBeautiful campaign wins 2 Effies
Dabur moves up 4 Places in Fortune India 500 List; ranked 163 in the list for 2015
Dabur ranked 25 in the list of Best Companies for CSR in India, according to the Economic Times
Dabur India successfully held the first-ever Guinness World Record attempt for the largest simultaneous Nasya Panchkarma Treatment session
3 INR:USD F/X Rate: 64.14
Dabur – Overview
Overview Awards
Established in 1884 – 133 years of trust and excellence
One of the world’s largest in Ayurveda and natural healthcare
Having one of the largest distribution network in India, covering 6 mn+ outlets
20 world class manufacturing facilities catering to needs of diverse markets
Strong overseas presence with ~30% contribution to consolidated sales
Market cap: US$
9.4bn

4
Manufacturing facilities
12 manufacturing locations in India 8 international manufacturing locations
UAE
Egypt
Nigeria
Turkey
Sri Lanka
Bangladesh
Nepal
`
Jammu Baddi
Pantnagar
Sahibabad
Tezpur
Nasik
Silvasa
Pithampur
Narendrapur
Katni
Alwar
Newai
South Africa

5
Distribution network
Rural Urban
Insti Stockist
Wholesaler
GT Stockist
Retailer Retailer
Consumer Consumer Consumer
Factory
C&F
MT Stockist
Retailer
Consumer
Factory
C&F
Super Stockist
Sub Stockist
Distribution reach of 6.3 mn retail outlets; Cover over 40,000 villages directly

6 1. Position basis Nielsen Market Share data MAT Dec’17
Market leader in 6 categories
Leading position in key categories across verticals
Honey Chyawanprash BabyMassage
Oil
Glucose Hair Oils Oral Care SkinCare -
Bleaches
Toilet Cleaners AirFresheners
MosquitoRepellantCreams
Juices
Healthcare Home and Personal Care Foods
#1 #1 #2 #2 #2 #3 #1 #2 #1 #1 #1
#Relative Competitive Position1

7
Building bigger brands
10 bn+ 1 bn+
16 brands with turnover of INR 1bn+ with 3 brands which are 10bn+

8
Contents
1. Dabur – Overview
2. Q3 FY18 – Overview
3. Category Highlights
4. Business Initiatives
5. Recent Launches
6. International Business – Overview
7. Business Strategy
8. Annexure

• Consolidated Profit After Tax (PAT) grew by
13.1%
• Material cost came down from 50.6% of sales to
48.4% of sales
• Operating margin at 20.5% in Q3 FY18 vs 18.0%
in Q3 FY17.
• PAT margin increased from 15.9% to 16.9%
332.1
293.8
Q3 FY18Q3 FY17
9
Q3 FY18 – Consolidated Financials
• Consolidated revenue increased by 6.1% on
reported basis, GST adjusted constant currency
growth was 12.9%
• Domestic business revenue grew by 17.7% led by
volume growth of 13.0%
• International Business grew by 5% on constant
currency basis on the back of strong growth in
GCC, Egypt, SSA and Nepal
• Currency devaluation in overseas markets resulted
in translation loss of INR 66 crore (3.6%)
Revenue Profit After Tax
1,966.4
1,852.9
Q3 FY18Q3 FY17
6.1% 13.1%

10
Q3 FY18 – Impact of GST and Currency on Growth
Consolidated Revenue from Operations
6.1%
12.9%
3.3%
3.6%
Reported Value Growth GST Impact Currency Impact Underlying GST and Currency
Adjusted Growth
Domestic FMCG Revenue
13.0%
17.7% 4.7%
Reported Value Growth GST Impact Underlying GST Adjusted Growth

11
Q3 FY18 – Business Overview
Q3 FY17 Q3 FY18
70.2%
27.0%
2.8%
65.5%
30.5%
4.0%
Domestic International Others
• Contribution of Domestic FMCG increased to 70% from 65% last year
• International Business contributed 27% as compared to 30% last year

18%
16%
6%
7% 24%
5%
10%
14% 18%
15%
6%
6% 23%
5%
10%
17%
12
Domestic FMCG – Category-wise Sales
Q3 FY17 Q3 FY18
• Share of Hair Care category remained stable at 18%
• Oral Care category increased share from 15% to 16%
• Home Care and Health Supplements also increased share by ~1%
• Food decreased from 17% in Q3 FY17 to 14% in Q3 FY18
Hair Care Oral Care Skin Care Home Care Health Supplements Digestives Foods OTC & Ethicals

13
Contents
1. Dabur – Overview
2. Q3 FY18 – Overview
3. Category Highlights
4. Business Initiatives
5. Recent Launches
6. International Business – Overview
7. Business Strategy
8. Annexure

14 Note: Growth figures refer to Like-to-like growth (adjusted for GST)
Home and Personal Care (HPC) – Q3 FY18
• HPC posted a growth of 22.9% in Q3 FY18
• Oral care recorded a growth of 23% driven by increase in penetration,
strengthening foothold in MT, strong growth in South and increase in commerce
sales
– Toothpaste category recorded growth of 26% and gained market share
› Red Toothpaste Franchise continued its growth momentum
› Babool & Meswak recorded strong double digit growth
– Toothpowder category posted growth of 6.2%
• Hair oil category grew by 16.7% on the back of good growth in both coconut
and perfumed oils
• Shampoos category grew by 56% driven by re-launch of Vatika Shampoo
brand and focused marketing initiatives
• Homecare category posted growth of 36% led by strong performance of
Odonil and Sanifresh
• Skin care posted growth of 14.5% driven by double digit growth across
brands
Dabur Gulabari Franchise
Relaunched Vatika Hair Oil in South

• Healthcare vertical posted growth of 16.6% in Q3 FY18
• Health Supplements grew by 19.5% on the back of strong growth of Chyawanprash and Honey
• Dabur Honey reported a strong recovery growing by 33.2% and gaining market share
• Digestives posted growth of 19.3% led by strong performance of Hajmola tablets and Pudin Hara group
• OTC & Ethicals category grew by 8.7% led by good growth in Lal Tail, Honitus, Ashokarishta and Dashmularishta
Asavs
15 Note: Growth figures refer to Like-to-like growth (adjusted for GST)
Healthcare (HC) – Q3 FY18
Hajmola – New TVC Ayurvedic Health Tonic for Women:
Dabur Ashokarishta Dabur Honitus Hot Sip

16 Note: Growth figures refer to Like-to-like growth (adjusted for GST)
Foods – Q3 FY18
• Foods category remained flat during Q3 primarily on account of high
base as Foods had grown at 52% in Q3FY17.
• Shifting of Diwali season & proliferation of value players also impacted sales in
the quarter
• Culinary business impacted by supply issues for some of the key SKUs
• Launched India’s first range of packaged fruit-based Mocktails in a
ready-to-drink format under the Réal brand
• Activ Coconut Water continued to post good sales
• Continued A&P support to increase frequency of consumption
• Focus on innovation and penetration led growth
First Ever TVC For Real Pomegranate
Real Mocktails
Dabur Hommade range with new packaging

17
Contents
1. Dabur – Overview
2. Q3 FY18 – Overview
3. Category Highlights
4. Business Initiatives
5. Recent Launches
6. International Business – Overview
7. Business Strategy
8. Annexure

18
Project Buniyaad – Distribution enhancement
Urban Strategy
Leveraging potential through Channel based approach
Enabling Technology
Using technology to track and improve performance and automate processes
Portfolio Focus
Leveraging split teams for focused portfolio building
Rural Strategy
Split the front line teams into two to increase reach and frequency – Showing significant positive gains
New Avenues of Growth
Leveraging the alternate channels of MT and C&C to grow at a rapid pace
Continue Engagement
Using initiatives and technology to build and continuously motivate the trade and front line teams
Project Buniyaad achieves its direct reach target of 1 mn outlets
916,869 910,095 912,332
1,020,974
Mar-15 Mar-16 Mar-17 Dec-17
Direct Reach – No. of Outlets

19
Consumer/ Marketing Initiatives (1 of 2)
School Contact Programs (Oral Care)
Winter Special Offers on Gulabari
Festive TV Campaign
Generating Trials for Bleach through
Workshops and Seminars
Odonil Zipper – Title Sponsor of ITA Awards
2017
Odonil Zipper - Khushboo on Wheels
Odomos – Associating with Government of Uttar
Pradesh Defeating Diabetes

20
Consumer/ Marketing Initiatives (2 of 2)
Monsoon Campaign for Dabur Chyawanprash
Dabur Honey – Weight Management
New Year Resolutions Campaign
Hajmola branded boats at Chitrakoot Mela, UP
Ayurved Parv
Honitus Hot Sip – TV Campaign
Real Mocktails
Dabur Amla Miss North India

21
Contents
1. Dabur – Overview
2. Q3 FY18 – Overview
3. Category Highlights
4. Business Initiatives
5. Recent Launches
6. International Business – Overview
7. Business Strategy
8. Annexure

Sani Fresh Bathroom Cleaner GlycoDab tablets - Ayurvedic
medicine Odonil Nature Air Freshener –
Fruit Blast
22
Recent Launches
Real Mocktails – Pina Colada and Virgin Mary Odomos Fabric Roll-On

23
Contents
1. Dabur – Overview
2. Q3 FY18 – Overview
3. Category Highlights
4. Business Initiatives
5. Recent Launches
6. International Business – Overview
7. Business Strategy
8. Annexure

• International Business posted 5% growth in constant currency terms during Q3 FY18
• Severe currency devaluation in Egyptian Pound, Naira and Turkish Lira led to significant translation loss of INR 66 crore
impacting ~3.6% of consolidated sales
• GCC markets witnessed a turn around with constant currency growth of 20.0% led by Saudi Arabia which grew by 34%
• Egypt posted strong growth of 45.5% in constant currency
• Sub Saharan Africa posted 23.6% constant currency growth led by localization and distribution expansion initiatives in
Nigeria, South Africa and East Africa
• SAARC markets reported good growth led by Nepal and Pakistan
• Shutdown in Algeria & Yemen led to loss of sales in North African region
• US business of Namaste reported muted performance due to category issues and competitive activity
24
International Business – Q3 FY18
45.5%
20.0% 18.1% 18.0%
2.8%
(15.9%)
23.6%
Egypt GCC Pakistan Nepal Turkey Namaste SSA
Constant Currency Growth Rate – Q3 FY18

25
Consumer & Marketing Initiatives – International
Dentist Advice to go back to Nature
Oral Care Program in UAE Schools
In Store visibility - shampoos
International Dental Conference, Iraq
Dabur Amla – Youtube campaign
Vatika Enrich Oil –Regional Arab TVC Airing
New Packaging for Vatika Hammam Zaith
Vatika Shampoo – Pan Arab TVC

26
Contents
1. Dabur – Overview
2. Q3 FY18 – Overview
3. Category Highlights
4. Business Initiatives
5. Recent Launches
6. International Business – Overview
7. Business Strategy
8. Annexure

27
Business strategy – India Business
• Leadership in Ayurveda –
scientific evidence &
research
• OTC portfolio to be scaled
up through innovation &
brand investments
• Doctor advocacy through
Medico Marketing channel
• Ayurvedic / Herbal focus
• Premiumization &
Differentiation
• Strong innovation agenda
• Potential to expand in
adjacencies within current
categories
• Maintain leadership in Juices
& Nectars category
• Leveraging the Fruit equity
associated with the ‘Real’
brand
• Focus on ‘Healthy’ range of
products
Healthcare Home & Personal Care Foods

28
Business Strategy – IBD
Brands positioned on “Herbal and Natural” platform
Local supply chain & management offers strategic advantage
Leveraging Digital platform to enhance consumer awareness and brand visibility
Strong investments in brands and business
Product portfolio customized to local preferences

29
The next growth wave
Build bigger brands
More than 15 brands in the range of INR >0.1 to 1 bn which can grow to INR 1bn+
Geographical expansion
Expand into overseas focus markets where our brands are relevant – MENA, Africa, SAARC
Consumer Health Strong core competence, low competitive intensity, strong profitability, low penetration
Driving distribution expansion
Direct reach of 1 mn +, increasing the no. of SKUs, rural potential, IT enablement, data analytics
Continued Innovation
NPD pipeline primed to deliver new products in key categories – 4-5 new products every year

30
Contents
1. Dabur – Overview
2. Q3 FY18 – Overview
3. Category Highlights
4. Business Initiatives
5. Recent Launches
6. International Business – Overview
7. Business Strategy
8. Annexure

31 Note: All figures are in INR crores, unless otherwise stated
Consolidated Profit & Loss – Q3 FY18
Q3 FY18 Q3 FY17 Y-o-Y (%) 9M FY18 9M FY17 Y-o-Y (%)
Revenue from operations 1,966.4 1,852.9 6.1% 5,715.4 5,786.8 (1.2%)
Other Income 66.3 83.1 (20.1%) 231.9 233.3 (0.6%)
Total Income 2,032.8 1,936.0 5.0% 5,947.4 6,020.1 (1.2%)
Material Cost 952.3 938.3 1.5% 2,844.0 2,867.1 (0.8%)
% of Revenue 48.4% 50.6% 49.8% 49.5% Employee expense 204.8 189.2 8.3% 612.0 616.5 (0.7%)
% of Revenue 10.4% 10.2% 10.7% 10.7% Advertisement and publicity 185.3 177.2 4.6% 481.1 523.1 (8.0%)
% of Revenue 9.4% 9.6% 8.4% 9.0% Other Expenses 220.5 214.3 2.9% 646.0 688.7 (6.2%)
% of Revenue 11.2% 11.6% 11.3% 11.9% Operating Profit 403.5 333.9 20.8% 1,132.3 1,091.4 3.7%
% of Revenue 20.5% 18.0% 19.8% 18.9%
EBITDA 469.8 416.9 12.7% 1,364.2 1,324.7 3.0%
% of Revenue 23.9% 22.5% 23.9% 22.9%
Finance Costs 13.2 13.9 (5.3%) 39.8 42.4 (6.0%)
Depreciation & Amortization 40.5 33.3 21.6% 119.6 103.3 15.7%
Tax Expenses 83.3 75.2 10.7% 230.1 232.7 (1.1%)
Net profit after tax but before share of profit/(loss) from joint venture
332.9 294.5 13.0% 960.1 946.3 1.5%
% of Revenue 16.9% 15.9% 16.8% 16.4%
Share of profit / (loss) of joint venture
0.2 0.2 (4.7%) 0.4 0.3 27.3%
Non controlling interest 0.9 0.9 (0.4%) 2.4 2.8 (16.3%)
Net profit for the period/year 332.1 293.8 13.1% 958.2 943.8 1.5%
% of Revenue 16.9% 15.9% 16.8% 16.3%

32
Consolidated Balance Sheet (1 of 2)
All figures are in INR crores, unless otherwise stated
Particulars As at 30/09/2017
(Unaudited) As at 31/03/2017
(Audited)
A Assets
1 Non-current assets
(a) Property, plant and equipment 1,508 1,479
(b) Capital work-in-progress 55 42
(c) Investment property 55 55
(d) Goodwill 411 411
(e) Other Intangible assets 12 14
(f) Biological assets other than bearer plants 0 -
(g) Financial assets
(i) Investments 2,486 2,499
(ii) Others 13 12
(g) Other non-current assets 98 102
Total Non-current assets 4,638 4,615
2 Current assets
(a) Inventories 1,000 1,107
(b) Financial assets
(i) Investments 1,041 741
(ii) Trade receivables 767 650
(iii) Cash and cash equivalents 123 163
(iv) Bank Balances other than (iii) above 147 142
(v) Others 56 34
(c) Other current assets 330 280
(d) Assets held for sale 2 -
Total current assets 3,467 3,116
Total Assets 8,105 7,731

33
Consolidated Balance Sheet (2 of 2)
All figures are in INR crores, unless otherwise stated
Particulars As at 30/09/2017
(Unaudited) As at 31/03/2017
(Audited)
B Equity and Liabilities
1 Equity
(a) Equity share capital 176 176
(b) Other Equity 5,100 4,671
Equity attributable to shareholders of the Company 5,276 4,847
Non Controlling Interest 25 25
Total equity 5,301 4,872
2 Non-current liabilities
(a) Financial liabilities
(i) Borrowings 474 471
(ii) Other financial liabilities 1 4
(b) Provisions 56 53
(c) Deferred tax liabilities (Net) 114 108
Total Non-current liabilities 645 636
3 Current liabilities
(a) Financial liabilities
(i) Borrowings 507 440
(ii) Trade payables 1,218 1,303
(iii) Other financial liabilities 96 174
(b) Other current liabilities 189 175
(c) Provisions 106 92
(d) Current tax Liabilities (Net) 42 38
Total Current liabilities 2,158 2,223
Total Equity and Liabilities 8,105 7,731

34
Thank You