Embed Size (px)
Citation preview

Da Players’ Gold StoreWhere we sell gold cheap….real cheap!!!!
Colin Dunn
Mike Gaffney
Mike Oberdorf
Business Problem
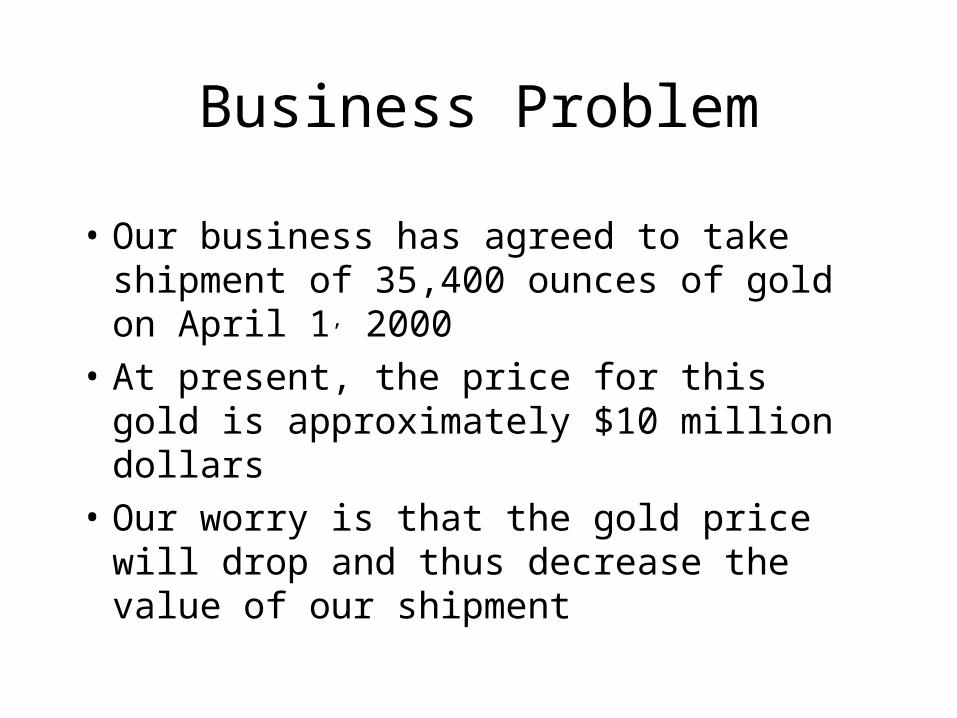
• Our business has agreed to take shipment of 35,400 ounces of gold on April 1, 2000
• At present, the price for this gold is approximately $10 million dollars
• Our worry is that the gold price will drop and thus decrease the value of our shipment
Market View: Gold Prices
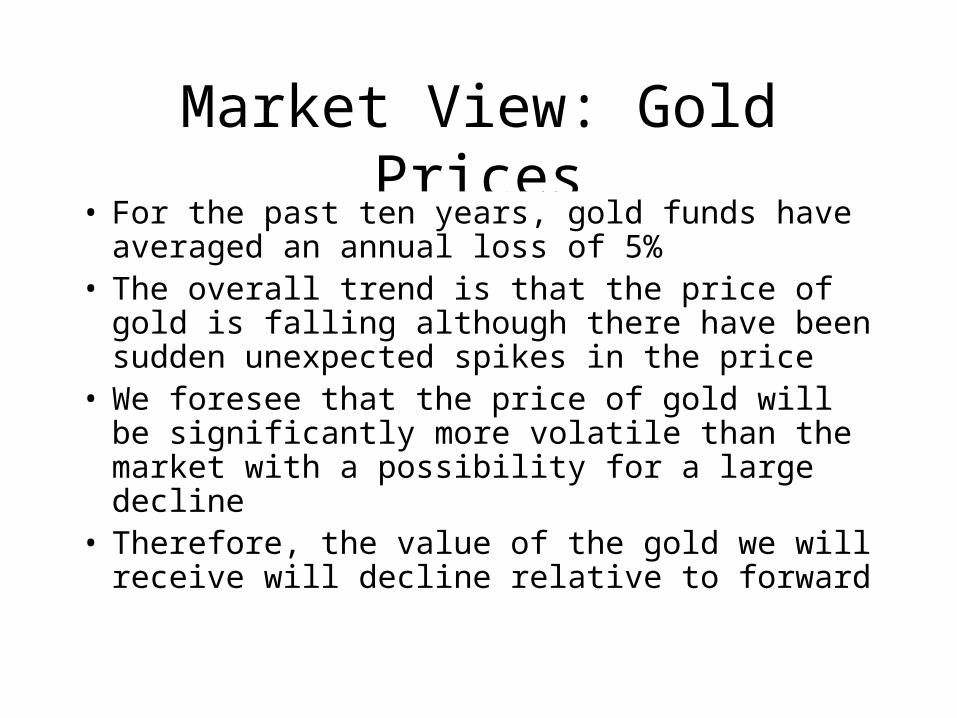
• For the past ten years, gold funds have averaged an annual loss of 5%
• The overall trend is that the price of gold is falling although there have been sudden unexpected spikes in the price
• We foresee that the price of gold will be significantly more volatile than the market with a possibility for a large decline
• Therefore, the value of the gold we will receive will decline relative to forward
Business Risk
• Position: Long Gold (+F)
• On April 1, 2000, we will receive 35,400 ounces
• Being risk averse, we will hedge our position
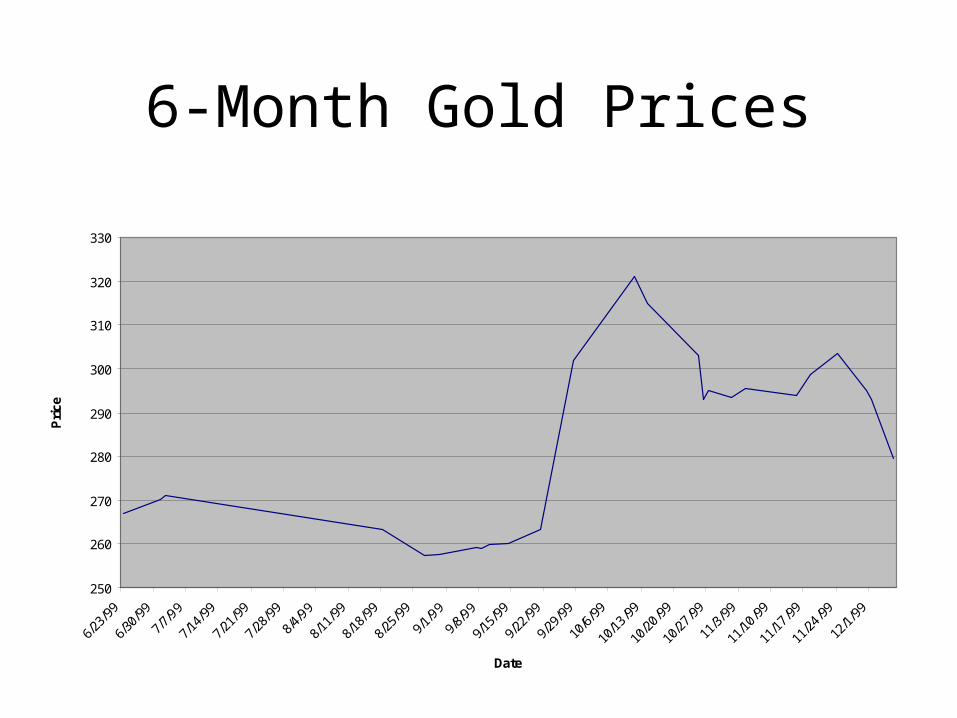
6-Month Gold Prices
250
260
270
280
290
300
310
320
330
6/23/99
6/30/99
7/7/99
7/14/99
7/21/99
7/28/99
8/4/99
8/11/99
8/18/99
8/25/99
9/1/99
9/8/99
9/15/99
9/22/99
9/29/99
10/6/99
10/13/99
10/20/99
10/27/99
11/3/99
11/10/99
11/17/99
11/24/99
12/1/99
Date
Price
Risk Premium Estimate
• We will use a risk premium estimate of 2%• Risk premium estimates for gold have been seen
as high as 5.5%, but this estimate is based on the years 1961-91 which included periods of high inflation
• It does not take into account the 1990s where gold did not perform well
• We believe that the most recent performance of gold prices is more indicative of future prices and therefore are using the 2% risk premium
Maturity Date Differences
• Futures Maturity Date: April 1, 2000
• Options Maturity Date: March 10, 2000
• The options on the futures contracts matures before the actual futures contracts settle
• Therefore, we must make our decision about hedging our position on March 10 when the options mature
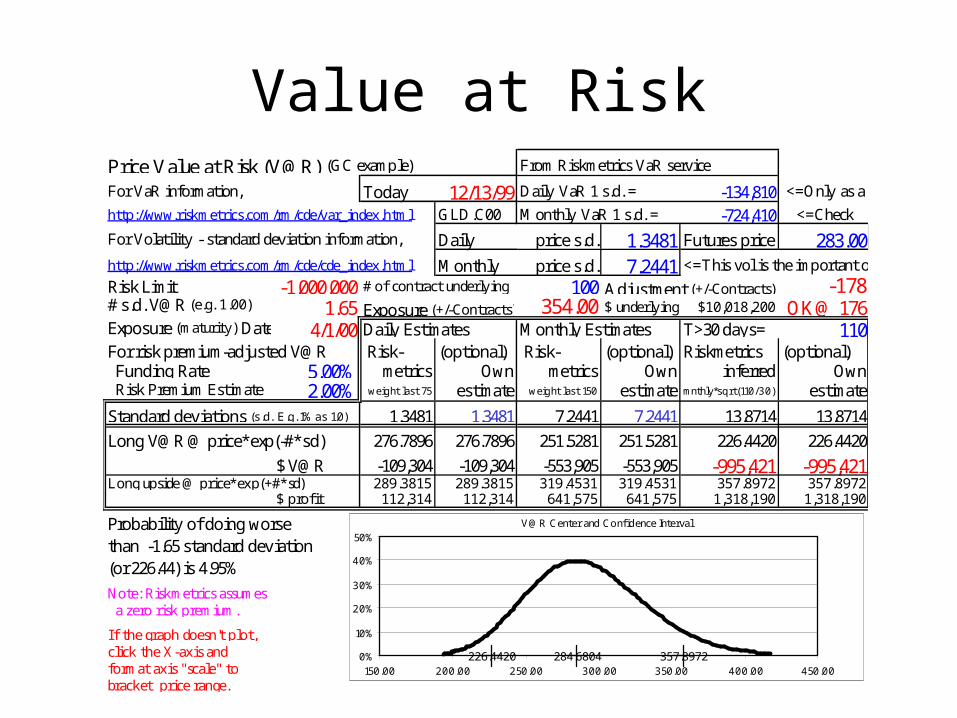
Value at RiskPrice Value at Risk (V@R) (GC example) From Riskmetrics VaR service
For VaR information, Today 12/13/99 Daily VaR 1 s.d. = -134,810 <=Only as a
http://www.riskmetrics.com/rm/cde/var_index.html GLD.C00 Monthly VaR 1 s.d. = -724,410 <=Check
For Volatility - standard deviation information, Daily price s.d. 1.3481 Futures price 283.00http://www.riskmetrics.com/rm/cde/cde_index.html Monthly price s.d. 7.2441 <=This vol is the important one!!
Risk Limit -1,000,000 # of contract underlying 100 Adjustment (+/-Contracts) -178# s.d. V@R (e.g. 1.00) 1.65 Exposure (+/-Contracts) 354.00 $ underlying $10,018,200 OK@ 176Exposure (maturity) Date 4/1/00 Daily Estimates Monthly Estimates T>30 days= 110For risk premium-adjusted V@R Risk- (optional) Risk- (optional) Riskmetrics (optional) Funding Rate 5.00% metrics Own metrics Own inferred Own Risk Premium Estimate 2.00% weight last 75 estimate weight last 150 estimate mnthly*sqrt(110/30) estimate
Standard deviations (s.d. E.g. 1% as 1.0) 1.3481 1.3481 7.2441 7.2441 13.8714 13.8714
Long V@R @ price*exp(-#*sd) 276.7896 276.7896 251.5281 251.5281 226.4420 226.4420
$ V@R -109,304 -109,304 -553,905 -553,905 -995,421 -995,421Long upside @ price*exp(+#*sd) 289.3815 289.3815 319.4531 319.4531 357.8972 357.8972
$ profit 112,314 112,314 641,575 641,575 1,318,190 1,318,190
Probability of doing worsethan -1.65 standard deviation(or 226.44) is 4.95%
Note: Riskmetrics assumes a zero risk premium.
If the graph doesn't plot,click the X-axis andformat axis "scale" tobracket price range.
V@R Center and Confidence Interval
226.4420 284.6804 357.89720%
10%
20%
30%
40%
50%
150.00 200.00 250.00 300.00 350.00 400.00 450.00
Value at Risk (cont’d)
• We are looking to structure our position so that we only have a 5% chance of losing more than 10% (or $1,000,000)
• To structure this position using only futures contracts, we will short 178 contracts which will leave our net position at 176 contracts long
Options Positions
• We have also identified several options positions that can be used to hedge our position
• The next several slides evaluate the different strategies and how to make sure that we don’t get our face RIPPED OFF!!!
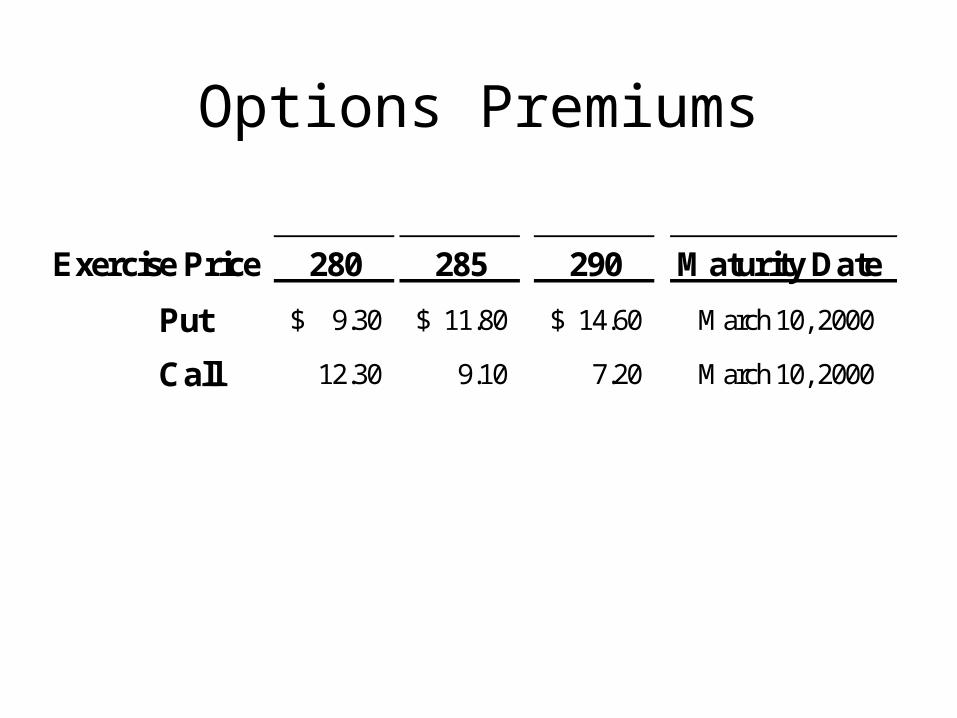
Options Premiums
Exercise Price 280 285 290 Maturity Date
Put 9.30$ 11.80$ 14.60$ March 10, 2000
Call 12.30 9.10 7.20 March 10, 2000
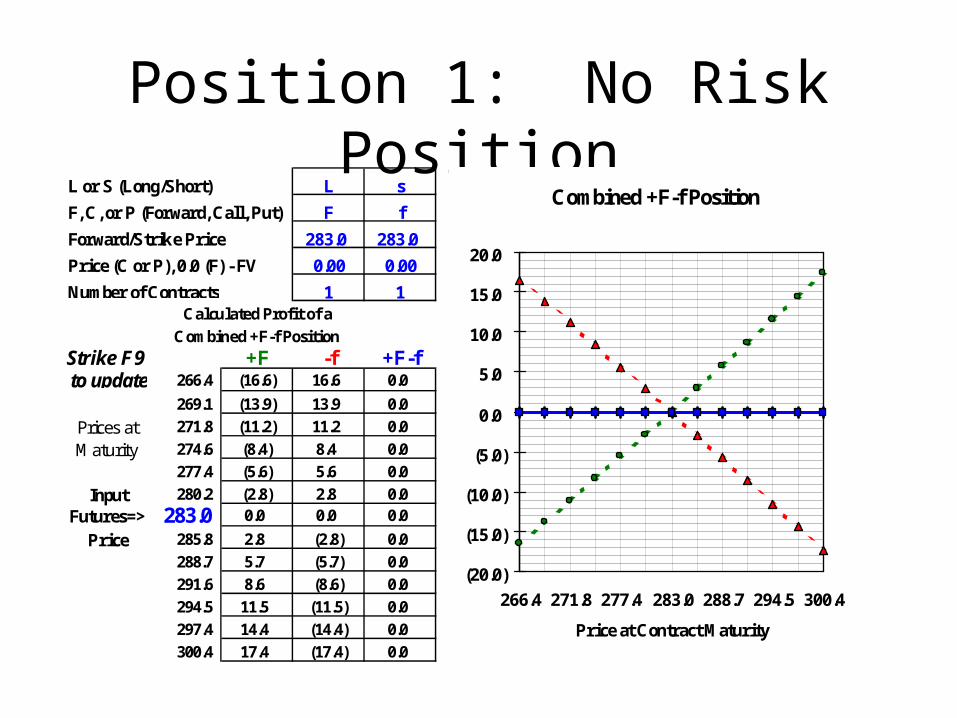
Position 1: No Risk Position
L or S (Long/Short) L s
F, C, or P (Forward, Call, Put) F f
Forward/Strike Price 283.0 283.0
Price (C or P), 0.0 (F) - FV 0.00 0.00
Number of Contracts 1 1Calculated Profit of a
Combined +F-f PositionStrike F9 +F -f +F-f to update 266.4 (16.6) 16.6 0.0
269.1 (13.9) 13.9 0.0Prices at 271.8 (11.2) 11.2 0.0Maturity 274.6 (8.4) 8.4 0.0
277.4 (5.6) 5.6 0.0Input 280.2 (2.8) 2.8 0.0
Futures=> 283.0 0.0 0.0 0.0
Price 285.8 2.8 (2.8) 0.0288.7 5.7 (5.7) 0.0291.6 8.6 (8.6) 0.0294.5 11.5 (11.5) 0.0297.4 14.4 (14.4) 0.0300.4 17.4 (17.4) 0.0
Combined +F-f Position
(20.0)
(15.0)
(10.0)
(5.0)
0.0
5.0
10.0
15.0
20.0
266.4 271.8 277.4 283.0 288.7 294.5 300.4
Price at Contract Maturity
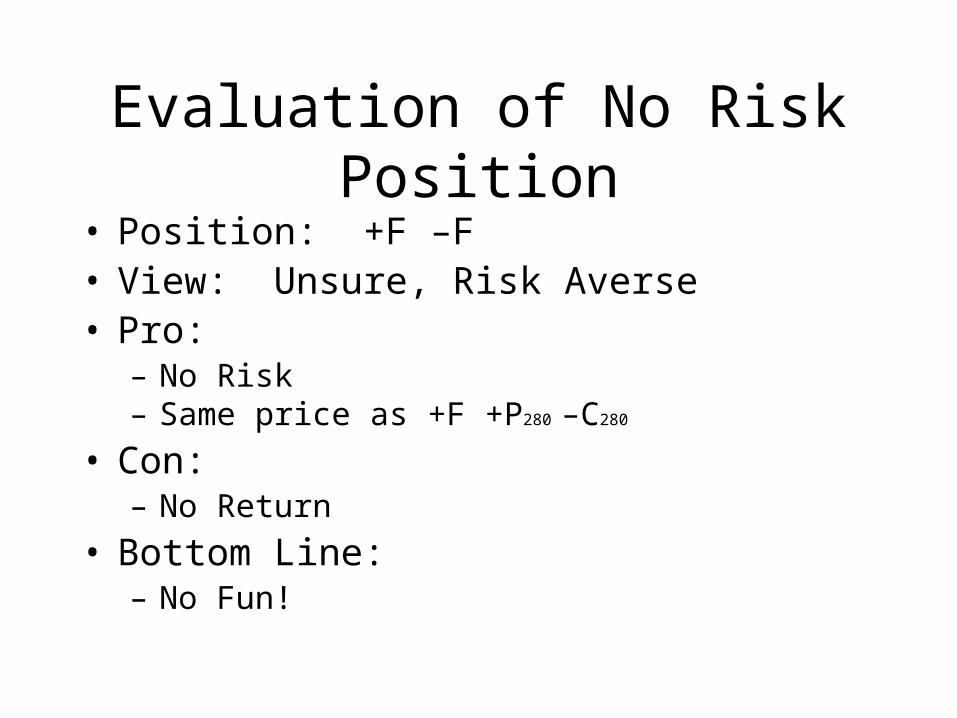
Evaluation of No Risk Position
• Position: +F –F• View: Unsure, Risk Averse • Pro:
– No Risk – Same price as +F +P280 –C280
• Con: – No Return
• Bottom Line: – No Fun!
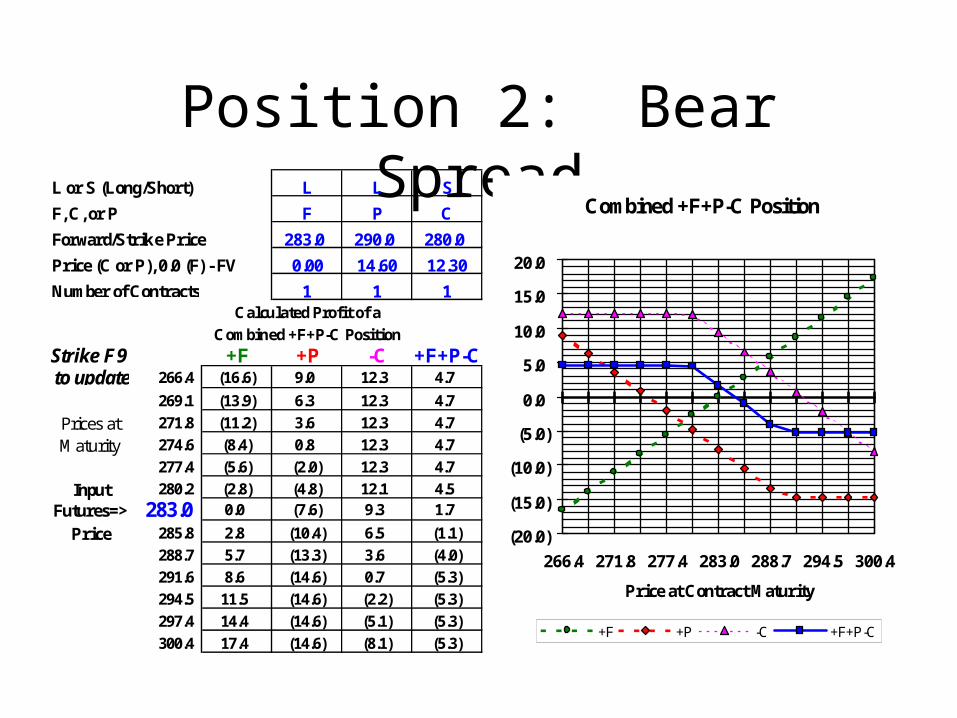
Position 2: Bear SpreadL or S (Long/Short) L L S
F, C, or P F P C
Forward/Strike Price 283.0 290.0 280.0
Price (C or P), 0.0 (F) - FV 0.00 14.60 12.30
Number of Contracts 1 1 1Calculated Profit of a
Combined +F+P-C PositionStrike F9 +F +P -C +F+P-C to update 266.4 (16.6) 9.0 12.3 4.7
269.1 (13.9) 6.3 12.3 4.7Prices at 271.8 (11.2) 3.6 12.3 4.7Maturity 274.6 (8.4) 0.8 12.3 4.7
277.4 (5.6) (2.0) 12.3 4.7Input 280.2 (2.8) (4.8) 12.1 4.5
Futures=> 283.0 0.0 (7.6) 9.3 1.7
Price 285.8 2.8 (10.4) 6.5 (1.1)288.7 5.7 (13.3) 3.6 (4.0)291.6 8.6 (14.6) 0.7 (5.3)294.5 11.5 (14.6) (2.2) (5.3)297.4 14.4 (14.6) (5.1) (5.3)300.4 17.4 (14.6) (8.1) (5.3)
Combined +F+P-C Position
(20.0)
(15.0)
(10.0)
(5.0)
0.0
5.0
10.0
15.0
20.0
266.4 271.8 277.4 283.0 288.7 294.5 300.4
Price at Contract Maturity
+F +P -C +F+P-C
Evaluation of Bear Spread
• Position: +F +Pitm –Citm• View: Limited down, (concern big up)• Pro:
– Makes money atm– Insures against Volatility
• Con: – Fails to capitalize on big down
• Decision: – Low maximum loss but not completely in line with
downward view.
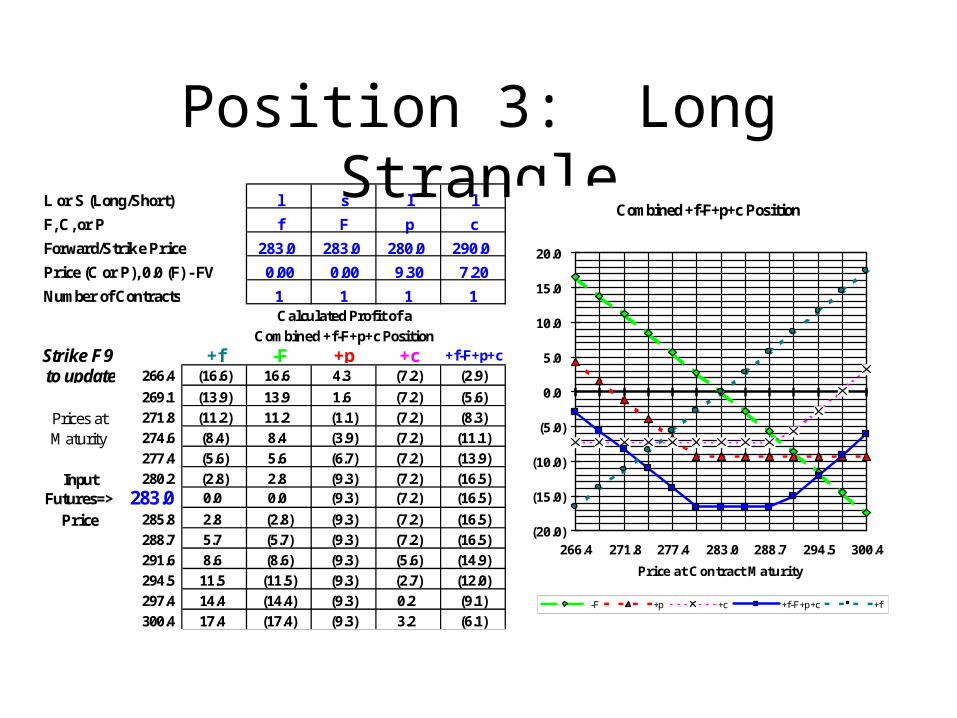
Position 3: Long StrangleL or S (Long/Short) l s l l
F, C, or P f F p c
Forward/Strike Price 283.0 283.0 280.0 290.0
Price (C or P), 0.0 (F) - FV 0.00 0.00 9.30 7.20
Number of Contracts 1 1 1 1Calculated Profit of a
Combined +f-F+p+c PositionStrike F9 +f -F +p +c +f-F+p+c to update 266.4 (16.6) 16.6 4.3 (7.2) (2.9)
269.1 (13.9) 13.9 1.6 (7.2) (5.6)Prices at 271.8 (11.2) 11.2 (1.1) (7.2) (8.3)Maturity 274.6 (8.4) 8.4 (3.9) (7.2) (11.1)
277.4 (5.6) 5.6 (6.7) (7.2) (13.9)Input 280.2 (2.8) 2.8 (9.3) (7.2) (16.5)
Futures=> 283.0 0.0 0.0 (9.3) (7.2) (16.5)
Price 285.8 2.8 (2.8) (9.3) (7.2) (16.5)288.7 5.7 (5.7) (9.3) (7.2) (16.5)291.6 8.6 (8.6) (9.3) (5.6) (14.9)294.5 11.5 (11.5) (9.3) (2.7) (12.0)297.4 14.4 (14.4) (9.3) 0.2 (9.1)300.4 17.4 (17.4) (9.3) 3.2 (6.1)
Combined +f-F+p+c Position
(20.0)
(15.0)
(10.0)
(5.0)
0.0
5.0
10.0
15.0
20.0
266.4 271.8 277.4 283.0 288.7 294.5 300.4
Price at Contract Maturity
-F +p +c +f-F+p+c +f
Evaluation of Long Strangle• Position: +F +Potm +Pitm• View: Volatile (Neutral but slight bias
downward)• Pro:
– Unlimited Gain– Limited Loss– Less expensive than +F +Potm +Pitm
• Con: – Expensive
• Decision: – Largest loss within range of volatility
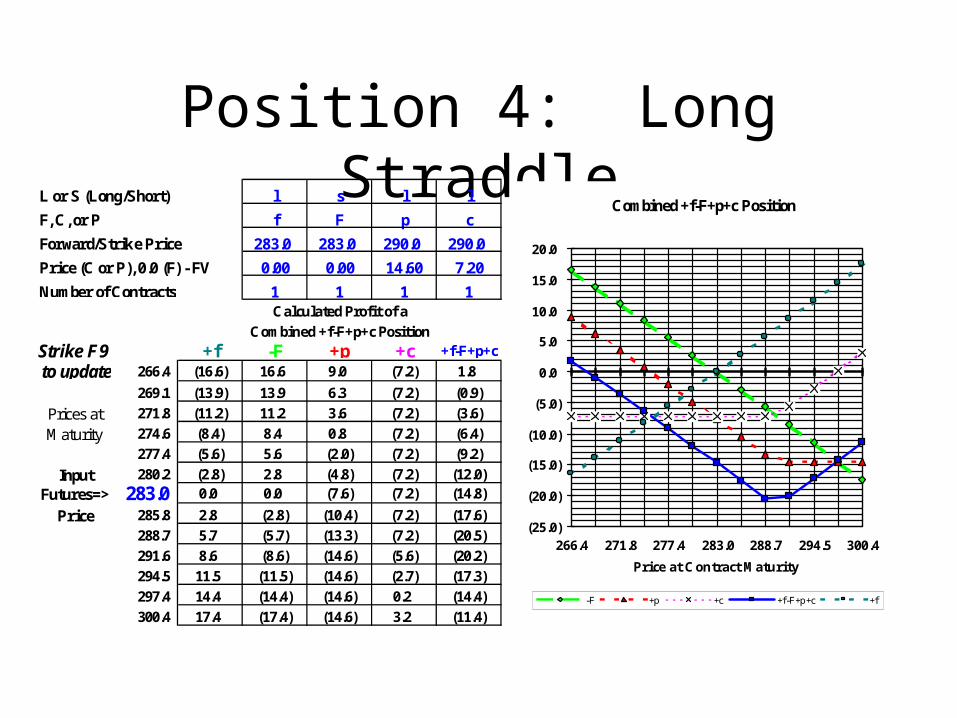
Position 4: Long StraddleL or S (Long/Short) l s l l
F, C, or P f F p c
Forward/Strike Price 283.0 283.0 290.0 290.0
Price (C or P), 0.0 (F) - FV 0.00 0.00 14.60 7.20
Number of Contracts 1 1 1 1Calculated Profit of a
Combined +f-F+p+c PositionStrike F9 +f -F +p +c +f-F+p+c to update 266.4 (16.6) 16.6 9.0 (7.2) 1.8
269.1 (13.9) 13.9 6.3 (7.2) (0.9)Prices at 271.8 (11.2) 11.2 3.6 (7.2) (3.6)Maturity 274.6 (8.4) 8.4 0.8 (7.2) (6.4)
277.4 (5.6) 5.6 (2.0) (7.2) (9.2)Input 280.2 (2.8) 2.8 (4.8) (7.2) (12.0)
Futures=> 283.0 0.0 0.0 (7.6) (7.2) (14.8)
Price 285.8 2.8 (2.8) (10.4) (7.2) (17.6)288.7 5.7 (5.7) (13.3) (7.2) (20.5)291.6 8.6 (8.6) (14.6) (5.6) (20.2)294.5 11.5 (11.5) (14.6) (2.7) (17.3)297.4 14.4 (14.4) (14.6) 0.2 (14.4)300.4 17.4 (17.4) (14.6) 3.2 (11.4)
Combined +f-F+p+c Position
(25.0)
(20.0)
(15.0)
(10.0)
(5.0)
0.0
5.0
10.0
15.0
20.0
266.4 271.8 277.4 283.0 288.7 294.5 300.4
Price at Contract Maturity
-F +p +c +f-F+p+c +f
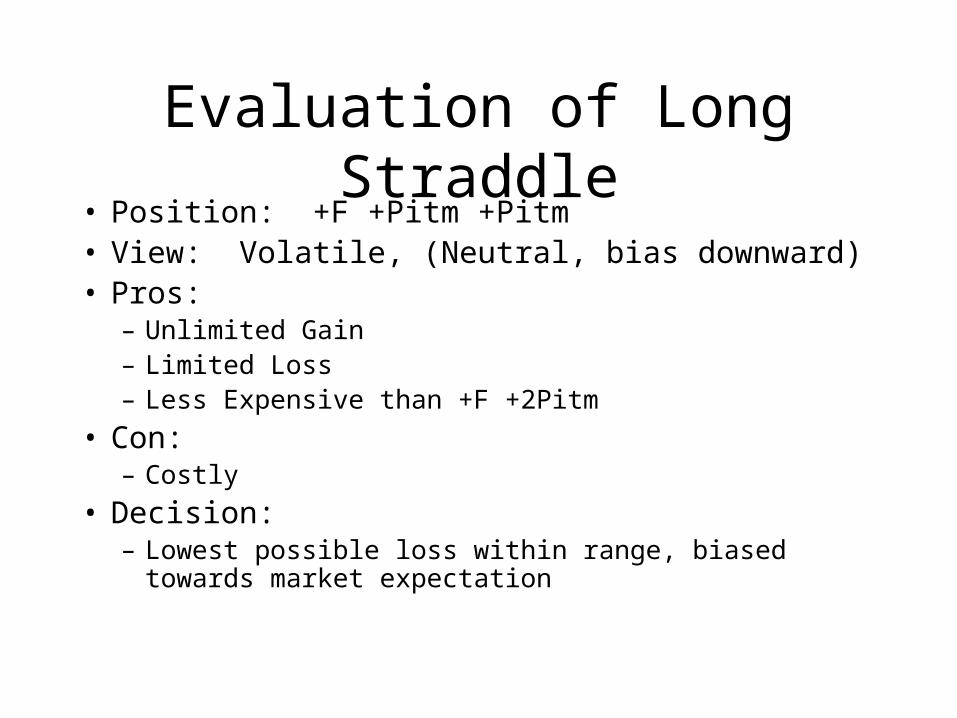
Evaluation of Long Straddle
• Position: +F +Pitm +Pitm• View: Volatile, (Neutral, bias downward)• Pros:
– Unlimited Gain – Limited Loss– Less Expensive than +F +2Pitm
• Con: – Costly
• Decision: – Lowest possible loss within range, biased towards market
expectation
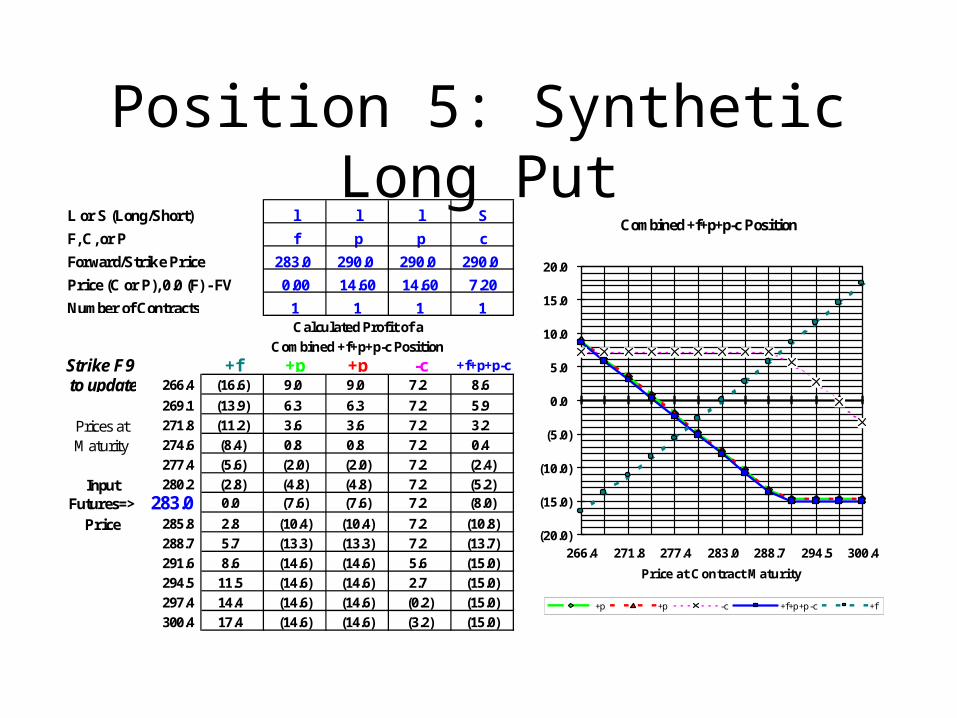
Position 5: Synthetic Long Put
L or S (Long/Short) l l l S
F, C, or P f p p c
Forward/Strike Price 283.0 290.0 290.0 290.0
Price (C or P), 0.0 (F) - FV 0.00 14.60 14.60 7.20
Number of Contracts 1 1 1 1Calculated Profit of a
Combined +f+p+p-c PositionStrike F9 +f +p +p -c +f+p+p-c to update 266.4 (16.6) 9.0 9.0 7.2 8.6
269.1 (13.9) 6.3 6.3 7.2 5.9Prices at 271.8 (11.2) 3.6 3.6 7.2 3.2Maturity 274.6 (8.4) 0.8 0.8 7.2 0.4
277.4 (5.6) (2.0) (2.0) 7.2 (2.4)Input 280.2 (2.8) (4.8) (4.8) 7.2 (5.2)
Futures=> 283.0 0.0 (7.6) (7.6) 7.2 (8.0)
Price 285.8 2.8 (10.4) (10.4) 7.2 (10.8)288.7 5.7 (13.3) (13.3) 7.2 (13.7)291.6 8.6 (14.6) (14.6) 5.6 (15.0)294.5 11.5 (14.6) (14.6) 2.7 (15.0)297.4 14.4 (14.6) (14.6) (0.2) (15.0)300.4 17.4 (14.6) (14.6) (3.2) (15.0)
Combined +f+p+p-c Position
(20.0)
(15.0)
(10.0)
(5.0)
0.0
5.0
10.0
15.0
20.0
266.4 271.8 277.4 283.0 288.7 294.5 300.4
Price at Contract Maturity
+p +p -c +f+p+p-c +f
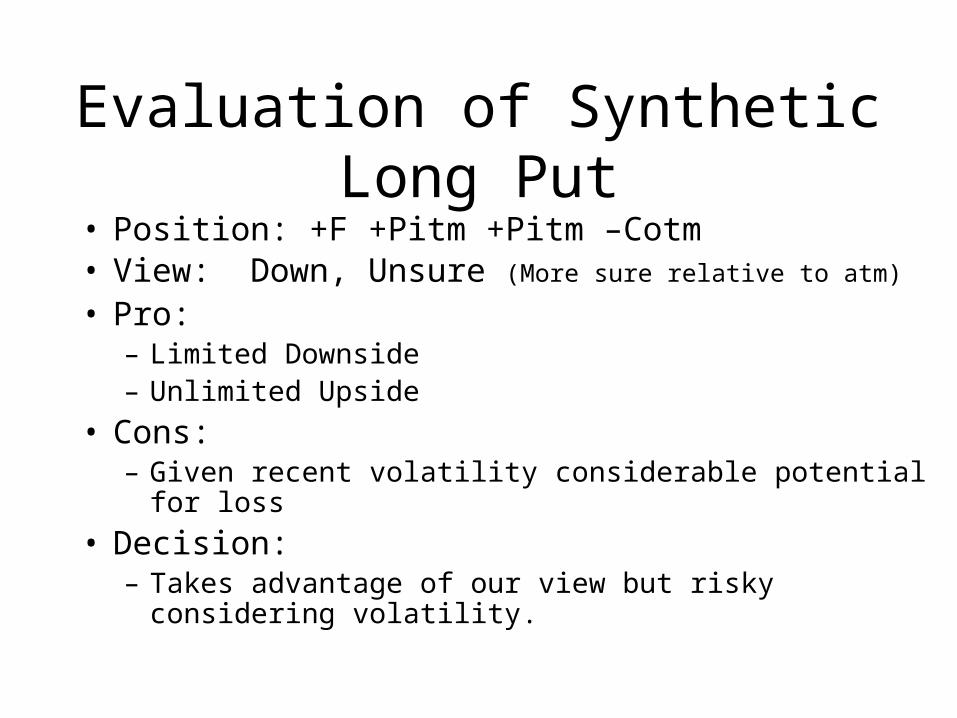
Evaluation of Synthetic Long Put
• Position: +F +Pitm +Pitm –Cotm• View: Down, Unsure (More sure relative to atm)
• Pro:– Limited Downside – Unlimited Upside
• Cons:– Given recent volatility considerable potential for loss
• Decision: – Takes advantage of our view but risky considering volatility.
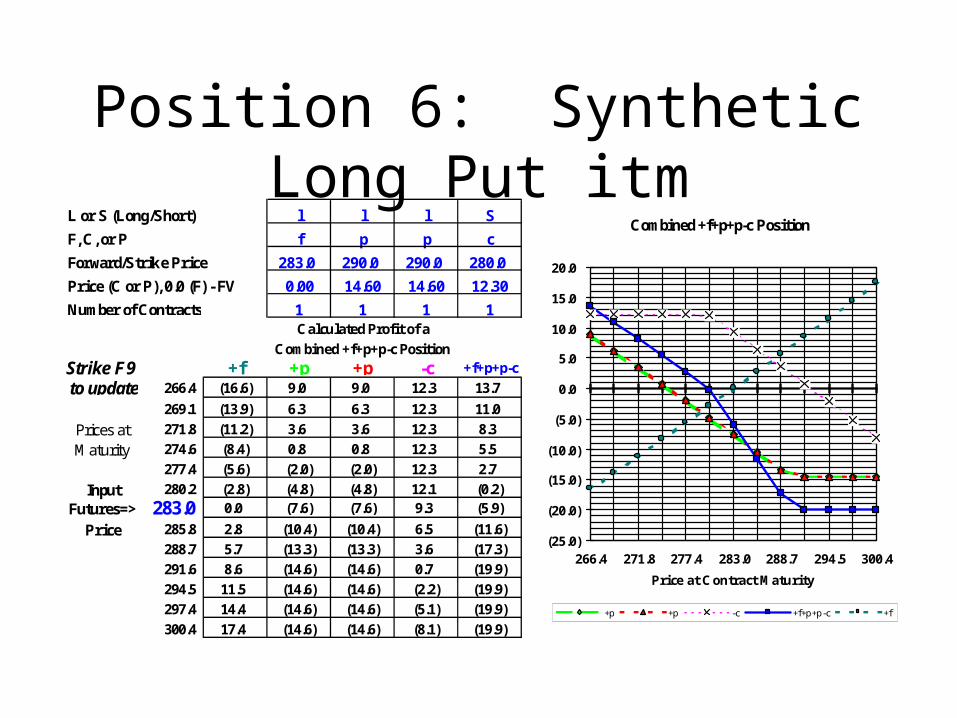
Position 6: Synthetic Long Put itm
L or S (Long/Short) l l l S
F, C, or P f p p c
Forward/Strike Price 283.0 290.0 290.0 280.0
Price (C or P), 0.0 (F) - FV 0.00 14.60 14.60 12.30
Number of Contracts 1 1 1 1Calculated Profit of a
Combined +f+p+p-c PositionStrike F9 +f +p +p -c +f+p+p-c to update 266.4 (16.6) 9.0 9.0 12.3 13.7
269.1 (13.9) 6.3 6.3 12.3 11.0Prices at 271.8 (11.2) 3.6 3.6 12.3 8.3Maturity 274.6 (8.4) 0.8 0.8 12.3 5.5
277.4 (5.6) (2.0) (2.0) 12.3 2.7Input 280.2 (2.8) (4.8) (4.8) 12.1 (0.2)
Futures=> 283.0 0.0 (7.6) (7.6) 9.3 (5.9)
Price 285.8 2.8 (10.4) (10.4) 6.5 (11.6)288.7 5.7 (13.3) (13.3) 3.6 (17.3)291.6 8.6 (14.6) (14.6) 0.7 (19.9)294.5 11.5 (14.6) (14.6) (2.2) (19.9)297.4 14.4 (14.6) (14.6) (5.1) (19.9)300.4 17.4 (14.6) (14.6) (8.1) (19.9)
Combined +f+p+p-c Position
(25.0)
(20.0)
(15.0)
(10.0)
(5.0)
0.0
5.0
10.0
15.0
20.0
266.4 271.8 277.4 283.0 288.7 294.5 300.4
Price at Contract Maturity
+p +p -c +f+p+p-c +f
Evaluation of Synthetic Long Put itm
• Position: +F +Pitm +Pitm +Pitm –Citm• View: Down, (Less unsure than atm)
• Pro:– Limited downside – Unlimited Upside
• Con:– Given recent volatility considerable potential for loss
• Decision:– Maximizes our return based on our view but potential for
loss given vol.
Recommendation
• The Long Straddle capitalizes on our view that the price of Gold will be volatile with a bias downward.
• The second of the two synthetic long puts is also attractive because it fits within our acceptable loss range while maximizing our upward potential given our bias downward. However it is slightly risky because any upward movement results in a significant loss.