Embed Size (px)
Citation preview

D8.5
Final report on the test-bed
Dissemination Level: PU
Dissemination level:
PU = Public, RE = Restricted to a group specified by the consortium (including the
Commission Services), PP = Restricted to other programme participants (including the Commission
Services), CO = Confidential, only for members of the consortium (including the
Commission Services)
Ref. Ares(2016)560010 - 02/02/2016
FP7 – ICT – GA 318137 2 DISCUS
Abstract:
This deliverable summarises the results obtained on the test-beds aimed at demonstrating the key functionalities of the DISCUS long-reach passive optical network (LR-PON). The functionalities demonstrated are both at the physical layer, at protocol and service level. From the physical layer point of view three different types of data traffic were considered for the LR-PON demonstration: 10G symmetric LR-PON traffic, 40G LR-PON downstream and 100G point-to-point over the LR-PON infrastructure. Three different LR-PON architectures were identified for the demonstrations: lollipop for densely populated areas and open-ring for rural, sparsely populated areas, both architectures using Erbium doped fibre amplifiers (EDFAs) as optical amplifiers and also a ‘lollipop’ version using semiconductor optical amplifiers (SOAs). The protocol and control plane demonstration aimed to show how a state of the art long-reach passive optical network (LR-PON) system could be controlled through a software defined networking (SDN) control plane for highly dynamic service provision. The control plane demonstration focused on a fast protection scenario and on dynamic capacity assignment over time and wavelength domains. The protocol and control plane were also integrated together with a full LR-PON physical layer to demonstrate the fast protection scenario.

FP7 – ICT – GA 318137 3 DISCUS
COPYRIGHT
© Copyright by the DISCUS Consortium. The DISCUS Consortium consists of:
Participant
Number Participant organization name Participant org.
short name Country
Coordinator 1 Trinity College Dublin TCD Ireland Other Beneficiaries 2 Alcatel-Lucent Deutschland AG ALUD Germany 3 Nokia Siemens Networks GMBH & CO. KG NSN Germany 4 Telefonica Investigacion Y Desarrollo SA TID Spain 5 Telecom Italia S.p.A TI Italy 6 Aston Universtity ASTON United
Kingdom 7 Interuniversitair Micro-Electronica Centrum
VZW IMEC Belgium
8 III V Lab GIE III-V France 9 University College Cork, National University
of Ireland, Cork Tyndall & UCC Ireland
10 Polatis Ltd POLATIS United
Kingdom 11 atesio GMBH ATESIO Germany 12 Kungliga Tekniska Hoegskolan KTH Sweden
This document may not be copied, reproduced, or modified in whole or in part for any purpose without written permission from the DISCUS Consortium. In addition to such written permission to copy, reproduce, or modify this document in whole or part, an acknowledgement of the authors of the document and all applicable portions of the copyright notice must be clearly referenced. All rights reserved.

FP7 – ICT – GA 318137 4 DISCUS
Authors:
Name Affiliation
Giuseppe Talli Tyndall
Stefano Porto Tyndall
Daniel Carey Tyndall
Nicola Brandonisio Tyndall
Alan Naughton Tyndall
Rene Bonk ALUD
Xin Yin (Scott) IMEC
Marco Ruffini TCD
Seamas McGettrick TCD
Internal reviewers:
Name Affiliation
Paul Townsend Tyndall
Due date: 31/12/2015

FP7 – ICT – GA 318137 5 DISCUS
TABLE OF CONTENTS
1 INTRODUCTION ....................................................................................................................... 6
2 TEST-BED SCENARIOS AND FUNCTIONALITY ............................................................... 7 2.1 PHYSICAL LAYER DEMONSTRATIONS ............................................................................................................ 7 2.2 PROTOCOL AND SERVICES DEMONSTRATIONS ............................................................................................. 9
2.2.1 Demonstration of ultra-fast protection .......................................................................................... 9 2.2.2 Demonstration of dynamic capacity assignment .................................................................... 12
3 TRANSPORTABLE TEST-BED - ECOC 2015 REPORT ................................................. 14
4 PHYSICAL LAYER CHARACTERISATION ........................................................................ 16 4.1 ONUS AND METRO/CORE NODE SETUP ................................................................................................... 16 4.2 LOLLIPOP LR-PON ....................................................................................................................................... 20 4.3 OPEN RING LR-PON .................................................................................................................................... 27 4.4 SOA-BASED LR-PON ................................................................................................................................... 32
4.4.1 Experimental Setup and SOA-based Remote Node ................................................................. 32 4.4.2 Test Parameters and Tasks of the Test-Bed ............................................................................... 34 4.4.3 Experimental Test Results of the SOA-based Remote Node ................................................ 35
4.5 40GB/S DOWNSTREAM ............................................................................................................................... 39 4.5.1 40 Gb/s Downstream with DISCUS EML TX and 3-level Detection APD RX ................ 39 4.5.2 50 Gb/s Downstream with SOA-preamplified DISCUS 3-level Detection PIN RX ...... 41
5 PROTOCOL AND SERVICES CHARACTERISATION ...................................................... 42 5.1 PROTECTION EXPERIMENTS ........................................................................................................................ 43 5.2 DYNAMIC WAVELENGTH CHANNEL ASSIGNMENT .................................................................................... 48
6 SUMMARY AND CONCLUSIONS ......................................................................................... 53
REFERENCES .................................................................................................................................. 55
ABBREVIATIONS ........................................................................................................................... 56

FP7 – ICT – GA 318137 6 DISCUS
1 Introduction
This deliverable summarises the results obtained on the test-beds aimed at demonstrating the key functionalities of the DISCUS long-reach passive optical network (LR-PON). The functionalities demonstrated are both at the physical layer, and at protocol and service level. The test-bed scenarios and the functionalities to be demonstrated were identified in Y1 and Y2 as part of Task 8.1 and reported in D8.1. From the physical layer point of view three different types of data traffic were considered for the LR-PON demonstration: 10G symmetric LR-PON traffic, 40G LR-PON downstream and 100G point-to-point over the LR-PON infrastructure. In D8.1 two different LR-PON architectures were identified for the demonstrations: lollipop for densely populated areas and open-ring for rural, sparsely populated areas, both architectures using Erbium doped fibre amplifiers (EDFAs) as optical amplifiers. In Y3 the decision was taken to introduce a third variant of the LR-PON in the demonstration using semiconductor optical amplifiers (SOAs) as optical amplifiers in a lollipop type of architecture. SOAs have the ability to amplify signals of various modulation formats in 10 THz windows over the entire spectral range from 1250 nm up to 1600 nm. This provides a greater flexibility compared to the EDFAs, which are limited to operate in C- or L-band, and other doped fibre amplifiers which are also limited to specific small wavelength windows. The protocol and control plane demonstration aimed to show how a state of the art LR-PON system could be controlled through a software defined networking (SDN) control plane for highly dynamic service provision. The demonstration was split into two parts: the first part focused on a fast protection scenario, while the second on dynamic capacity assignment over time and wavelength domains. The next section (Section 2) provides details on the physical layer, protocol and control plane demonstration.
Section 3 reports on the demonstration of the DISCUS test-bed carried out at European Conference on Optical Communication, ECOC 2015, which was held in Valencia in September 2015. Polatis hosted the project demonstration in their stand in the exhibition of ECOC 2015. Due to the significant challenges involved with making such a complex demonstrator test-bed portable, a simplified version of the final test-bed, focusing on the fast protection scenario, was built for ECOC 2015. The portable test-bed could still demonstrate the novel features of the DISCUS architecture, integrating the physical layer, protocol and control plane in a single end-to-end network.
Section 4 summarises the results obtained with the various laboratory based test-beds. The physical layer results obtained with the three version of the 10Gb/s symmetric LR-PONs are presented first (lollipop, open-ring and SOA-based lollipop), including the coexistence of the 100Gb/s high capacity point-to-point link. The results on the 40Gb/s downstream implementation, obtained on a separate set-up, are then presented. The protocol and control plane scenarios were also developed and carried out on separate test-beds with a simplified physical layer. The fast protection scenario was finally tested on the complete lollipop physical layer integrating all the required functionalities in a single test-bed.

FP7 – ICT – GA 318137 7 DISCUS
2 Test-bed scenarios and functionality
2.1 Physical layer demonstrations
The physical layer demonstrations are aiming to test the key functional aspects of the three different links that are being supported by the DISCUS architecture in the LR-PON: 10G symmetric LR-PON traffic, 40G downstream LR-PON traffic, and 100G point to point link over the LR-PON infrastructure. Details of the DISCUS LR-PON architecture and of the Metro/Core (M/C) node subsystems on the LR-PON side can be found in D2.1, D2.3, D4.1 and D4.2. From a topology point of view DISCUS aims to design an architecture which can be efficiently applied both to densely populated areas and to rural sparsely populated ones. For this reason the data plane demonstration will focus on two topologies, the single remote node (lollipop) more suited for densely populated areas and the multiple remote nodes (chain topology or open ring) better suited for sparsely populated areas. For a detailed description of the single remote node architecture we refer for D2.1 and D2.3, while the multiple remote nodes chain architecture can be found in D2.3. These topologies can be implemented using EDFAs in the remote nodes or using SOAs. Both amplifier types will be demonstrated with EDFAs being used in the lollipop and chain topology (with the setup developed at Tyndall National Institute) and the SOAs used in a lollipop topology (developed by ALUD and later integrated with the Tyndall setup).
Due to the different level of maturity of the components and subsystems for the three types of links the level of the demonstration will be different. In particular many of the components required by the 10G LR-PON upstream link are still at the prototype or research level. However, DISCUS has worked to fill in the gaps by developing new components and subsystems in WP5. These novel components would enable key aspects of the network control protocol such as dynamic wavelength provisioning. Within the timeframe of the project it has not been possible to reach a development stage of the novel components that would allow the integration with more complex functionality required by the control plane. The risk that these novel components would not be mature for integration has been outlined in the risk section of D8.1. The novel technologies developed in WP5 will hence be tested in separate setups from the main LR-PON demonstrators. The tests will not be reported here, but in the deliverables of WP5. In particular this regards the ONU tuneable transmitter based on slotted Fabry-Perot lasers, the ONU tuneable filter based on silicon photonics and the burst-mode electronic dispersion compensation (BM-EDC).
Components developed for core and metro networks applications with suitable specifications for the LR-PON demonstration are commercially available, even though they might not suitable from a cost perspective for access networks and in some cases with non-optimal specifications. We hence integrated these components in the LR-PON demonstrators in the ONUs and OLTs. In particular we used commercial tuneable enhanced small form-factor pluggable (SFP+) transceiver in the optical network unit (ONU) with the addition of an external tuneable filter and an SOA for burst envelope carving. While the performance of these components is adequate for our application the cost is obviously too high for access networks and integrated solution like the ones developed within the project in WP5 might be the solution to reduce the cost. On the optical line terminal (OLT) side instead of using BM-EDC we used a commercial

FP7 – ICT – GA 318137 8 DISCUS
continuous mode EDC chip with slow tap adaptation. The continuous mode EDC does not allow compensation of bursts with different levels or types of impairments which could be caused by ONUs placed at different distances or by differences in the low cost ONU transmitters, which could introduce for example different levels of distortion due to bandwidth restrictions and SOA patterning. Compared to this commercial continuous mode EDC, which was also developed for different applications, the architecture of the BM-EDC would be simpler with the advantage of lower power consumption in the OLT.
Use of these commercial components allowed the integration of the physical layer with the control plane to demonstrate key aspects of the network control protocol such as dynamic wavelength provisioning and protection switching over the 10G symmetric LR-PON link. The PON protocol was implemented in both ONUs and OLTs using field programmable gate array (FPGA) hardware, which provided the speed and reconfigurability required for these demonstrations Beside these, more integrated demonstrations, the performance of the 10G symmetric link has been evaluated at the physical layer using the bit error rate (BER) before forward error correction (pre-FEC) as the main parameter measured internally in the FPGAs, respectively by the ONU FPGAs for the downstream and in the OLT FPGAs for the upstream. The FPGA code used for the physical layer demonstration does not implement the full protocol used for the service level described in Section 5. However, the physical layer FPGA code implements the full burst structure (guard bands, preamble, synchronisation and burst envelope generation), and allow us to measure more accurately the BER (since the payload is a selectable PRBS) and also allows synchronisation of the burst with test and measurement and diagnostic equipment such as oscilloscopes. The details on the algorithms and the structure of the code implemented in the FPGAs can be found in deliverable D8.2.
The performance of the test-beds has been evaluated in terms of the power and OSNR budget that they can support, which corresponds directly to the number of users supported. An important aspect is the differential loss that is present in the optical distribution network (ODN) due to non-uniformity of the splitter losses, polarisation dependent loss, fibre link losses etc… This differential loss is also part of the cause of dynamic range in the power of the bursts coming from different users. It was hence important to replicate in the demonstration the differential loss that can be found in a real PON in order to test particularly the upstream under a realistic burst dynamic range. In terms of overall length the LR-PON demonstration aimed at reaches of around 100km which are required by the DISCUS network architecture (see deliverable D2.1 and D2.3).
The 40Gb/s downstream, a 3-level duobinary downstream has been studied as part of the evolutionary strategy for high serial rate >10Gbit/s transmission in the downstream direction. Single-carrier 40Gb/s downstream, a 3-level duobinary downstream is used to reduce the component bandwidth requirement and dispersion penalty. The 40G downstream link is at an earlier implementation stage and we are not aiming to demonstrate full integration with control plane and services. However the demonstration of the 40G downstream link will be carried out at the physical layer level, evaluating the link performance as a function of the architectural configuration and network size (split, fibre length). Two physical-layer test-beds have been built in IMEC to evaluate the performance of both avalanche photodiode (APD) and SOA based receiver schemes.
The technology chosen for the 100G point-to-point link is dual-polarisation quadrature-phase-shift-keying (DP-QPSK), which is currently used in metro and core links (see D2.1

FP7 – ICT – GA 318137 9 DISCUS
and D2.3). For the final demo we used a commercial transponder to generate and receive the 100G point-to-point traffic sent through the LR-PON. Service demonstration over this channel is outside the scope of the project, and hence the demonstration is limited to characterising the performance at the physical layer. In particular the impact of the bursty time division multiple access (TDMA) traffic of the PON channels on the DP-QPSK channel has been analysed.
2.2 Protocol and services demonstrations
The aim of the protocol and control plane demonstration was to show how a state of the art LR-PON system could be controlled through a SDN control plane for highly dynamic service provision. The demonstration was split into two parts: the first part focused on a fast protection scenario, while the second on dynamic capacity assignment over time and wavelength domains.
2.2.1 Demonstration of ultra-fast protection
The first demonstration consisted of a LR-PON system, where the SDN control layer, the PON protocol implemented in FPGA hardware and services such as ultra-high definition (UHD) video on demand were fully integrated into a physical layer running over 100km of fibre with a 512 way split. The target scenario was in this case ultra-fast protection of an OLT following a feeder fibre cut (i.e., the common part of the fibre link between the OLT and the remote node where the amplifier and first-stage splitter are located), shown in Figure 2.1.
The protection mechanism works as follows. When the primary feeder fibre is cut, the OLT will detect a loss of light upstream. If the fibre cut is only downstream, the ONUs will also stop any transmission since they experience downstream loss of light, thus
Figure 2.1. Testbed-level view of the setup for the ultra-fast protection scenario.

FP7 – ICT – GA 318137 10 DISCUS
generating loss of light at the OLT. The failure detection triggers a message to the Metro-Core node controller that activates the protection routine at the control plane level. The logical path of the alarm functionality is shown in Figure 2.2.
The demonstration runs an UHD video between the video server and the ONU, passing through the OpenFlow switch and the primary OLT. The failures were triggered automatically by a script, which generated the failure alarm operating on the optical switch every 60 seconds, and reverting to the primary path every other 60 seconds. As a result of the protection, a small amount of data was lost during the reconfiguration time of the optical switch and the re-registration of the ONU. In past experiments we have measured protection times of the order of a few ms for 1:1 protection and 80 ms for 1:N protection with data rerouted over a Europe-wide core network. We can thus infer a protection time for smaller national networks below 50 ms, which would satisfy also business type Service Level Agreements. For the demonstration, the effects of the protection mechanism on the playing video were noticeable but only minor, with the content completely restored within a couple of seconds. This was due to the fact that errors and missing packets on a compressed video stream tend to propagate for a certain time also after the stream is restored.
In order for the LR-PON protocol hardware to work with the network, control plane and LR-PON physical layer a number of interfaces had to be defined and implemented. A block diagram of these LR-PON FPGA hardware’s interfaces is shown in Figure 2.3.
Data is fed from the backplane into the protocol hardware where it is converted from Ethernet type frames to XG-PON encapsulation method (XGEM) frames required by the PON protocol. The backplane interface contains a 10Gb Ethernet PHY and MAC Xilinx IP
Figure 2.2. Logical path of the alarm functionality triggered by loss of upstream light at the OLT.

FP7 – ICT – GA 318137 11 DISCUS
core. The overall status and control of the LR-PON unit is arbitrated by a Microblaze micro-processor controller which can be controlled via the control plane interface. This is currently implemented as a universal asynchronous receiver transmitter (UART) link running at 460800 baud. However it could equally be an Ethernet link. The UART was implemented for simplicity and to allow human readable status/control of the PON during testing when the control plane is not being used. The control plane can arbitrate many different functions of the PON. The control plane interface can set valid ONU serial numbers, change OLT wavelength, request dynamic wavelength assignment (DWA) migration of an ONU, adjust maximum allowed bandwidth allocations for a given Alloc-Id, setup Ethernet to Alloc-Id flow mapping and enable or disable many features of the PON. The control plane can also read the status of the PON device as well as other statistic/debugging registers. This allows the control plane a great deal of access to and control of the PON protocol. The control plane interface is then wrapped in an SDN wrapper which allows the PON to be controlled using an SDN control plane.
The DWA control unit interfaces with the tuneable laser and tuneable filter to allow for dynamic wavelength assignment over the LR-PON. The lasers are connected to the system via an i2C connection and the tuneable filters are controlled over a serial UART connection. Since the timing of the laser and filter switchover can vary depending on model of the unit and the command issued, the DWA interface must run a self-check to ensure that filter and laser are tuned before handing back control of the PON to the protocol hardware.
The physical layer interface allows the protocol layer to work with the physical layer components developed as part of this project. The burst mode receiver in its current implementation requires a reset signal that is tightly synchronized with the start of the
Figure 2.3. Block diagram of the FPGA board interactions with the other test-bed elements.

FP7 – ICT – GA 318137 12 DISCUS
burst. To do this the protocol layer must keep a precise synchronization on the PON and issue the reset at just the right time. This signal delay can be adjusted over the Control plane and is used to ensure error free reception at the OLT. Likewise the ONU must gate its transmission laser to ensure it is not leaking power onto the fibre when it is in the non-transmitting off state. The FPGA development board requires that data be sent continuously to the laser to avoid losing the data clock and so this data cannot be simply switched off. This limitation in the development board was circumvented by using the ONU to control an SOA external to the laser which gates the laser output on and off before it is coupled into the LRPON.
2.2.2 Demonstration of dynamic capacity assignment
The second demonstration carried out was that of providing content to the user with an assured capacity. For this test we did not use the full LR-PON physical layer, because the FPGA image implementing such functions was delivered at a later stage and thus was not part of the LR-PON full integration exercise.
The test-bed architecture is shown in Figure 2.4. The difference from the previous scenario is that here OLT2 is used to provide additional capacity and operates in parallel to OLT1, but on a different wavelength. Here OLTs and ONUs are connected without the fibre lengths; downstream the signals from the two OLTs are multiplexed by a power splitter, while upstream we use a multiplexer, which also operates as a filter in front of the photodiodes of the OLT transceivers. The ONU is equipped with a MEMs-based fast tuneable filter, which is directly controlled by the ONU and has a tuning time of the order of 50ms. Finally both OLTs and the ONUs are equipped with tuneable transmitters.
Figure 2.4. Testbed-level view of the dynamic capacity assignment scenario.

FP7 – ICT – GA 318137 13 DISCUS
The purpose of this demonstration is to showcase a full service-on-demand system operated by the end user, which is able to communicate with the service provider, and from there to the SDN controller. It demonstrates the DISCUS SDN metro-core node controller, its interaction with a web portal that a hypothetical service provider could use to offer services to an end user, and its ability to control the OpenFlow switch, the optical switch, the OLT and the ONU. The SDN controller responds to a request coming from the provider portal, and from that it is able to activate the service (an UHD video on demand in this scenario) and instruct all the network elements required to provide the end-to-end path for the service.
Initially we play the video on demand following the user request through the portal on a best effort service. This plays seamlessly, until we introduce some artificial congestion into the system by generating additional background traffic on a best effort service. At this point, since the video-on-demand (VoD) has the same priority as the background traffic, the video suffers high packet loss and stops playing. It should be noticed that in order to create a congestion situation we limit the rate of the port where the OLT is connected to 1Gb/s. The reason we did not choose 10 Gb/s is that as we get close to the limit of the port rate on the backplane, issues related to inefficiencies of the implemented code arise that are not related to the theoretical working of the developed protocol. Since the switch ports can only be set at rates of 1Gb/s (GigEthernet) or 10Gb/s (10GigEthernet), we were not able to enforce intermediate limits, e.g., 9 Gb/s and had to use 1 Gb/s instead. Since our purpose is to test the control plane functionality, this choice does not affect the validity of the demonstration.
The second part of the experiment shows a user selecting a VoD service with assured quality. This triggers, besides the message to the video server, also a message from the portal to the metro-core node controller to set a CIR parameter in the switch. As the video is now at a higher priority, the demonstration shows the video playing despite the interfering background traffic, as video packets are prioritized with respect to the background best effort traffic.
The third part of the demo assumes that the user puts in a request for a VoD with assured service, but the system is not able to secure a suitable CIR rate in the current PON channel. The controller then redirects the ONU to a different OLT that has spare capacity, working on a different wavelength channel in the same PON. It instructs the current OLT to send a physical layer operation, administration, management (PLOAM) message to the ONU to initiate the change of OLT, which implies, at the ONU side, tuning the laser and the filter in front of the receiver to a different wavelength. The filter and the laser are controlled directly by the ONU. The ONU can then register with the second OLT at the new wavelength. The controller also inserts a new flow entry in the Openflow switch to direct the video source to the second OLT. The change of wavelength was verified by an optical spectrum analyser tapping the downstream optical signal after the ONU filter. It was clear from the demo that the latency between the user commands in the portal to the service provisioning time was below a second.
FP7 – ICT – GA 318137 14 DISCUS
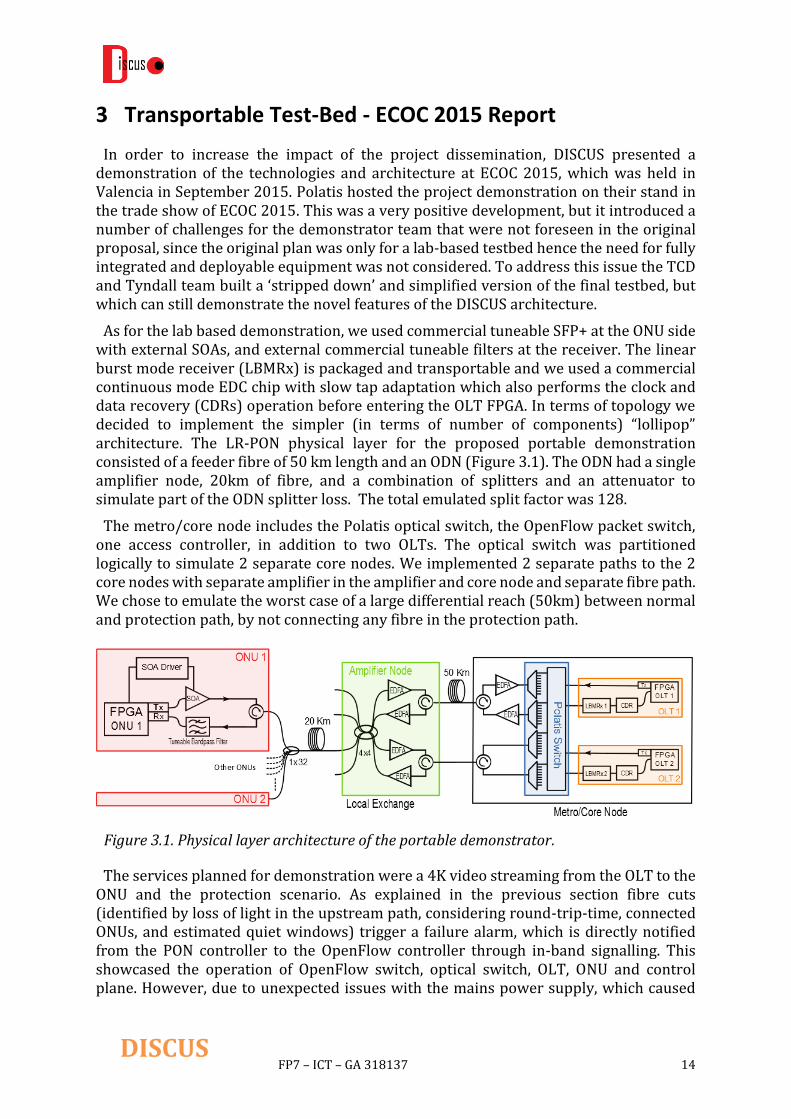
3 Transportable Test-Bed - ECOC 2015 Report
In order to increase the impact of the project dissemination, DISCUS presented a demonstration of the technologies and architecture at ECOC 2015, which was held in Valencia in September 2015. Polatis hosted the project demonstration on their stand in the trade show of ECOC 2015. This was a very positive development, but it introduced a number of challenges for the demonstrator team that were not foreseen in the original proposal, since the original plan was only for a lab-based testbed hence the need for fully integrated and deployable equipment was not considered. To address this issue the TCD and Tyndall team built a ‘stripped down’ and simplified version of the final testbed, but which can still demonstrate the novel features of the DISCUS architecture.
As for the lab based demonstration, we used commercial tuneable SFP+ at the ONU side with external SOAs, and external commercial tuneable filters at the receiver. The linear burst mode receiver (LBMRx) is packaged and transportable and we used a commercial continuous mode EDC chip with slow tap adaptation which also performs the clock and data recovery (CDRs) operation before entering the OLT FPGA. In terms of topology we decided to implement the simpler (in terms of number of components) “lollipop” architecture. The LR-PON physical layer for the proposed portable demonstration consisted of a feeder fibre of 50 km length and an ODN (Figure 3.1). The ODN had a single amplifier node, 20km of fibre, and a combination of splitters and an attenuator to simulate part of the ODN splitter loss. The total emulated split factor was 128.
The metro/core node includes the Polatis optical switch, the OpenFlow packet switch, one access controller, in addition to two OLTs. The optical switch was partitioned logically to simulate 2 separate core nodes. We implemented 2 separate paths to the 2 core nodes with separate amplifier in the amplifier and core node and separate fibre path. We chose to emulate the worst case of a large differential reach (50km) between normal and protection path, by not connecting any fibre in the protection path.
The services planned for demonstration were a 4K video streaming from the OLT to the ONU and the protection scenario. As explained in the previous section fibre cuts (identified by loss of light in the upstream path, considering round-trip-time, connected ONUs, and estimated quiet windows) trigger a failure alarm, which is directly notified from the PON controller to the OpenFlow controller through in-band signalling. This showcased the operation of OpenFlow switch, optical switch, OLT, ONU and control plane. However, due to unexpected issues with the mains power supply, which caused
Figure 3.1. Physical layer architecture of the portable demonstrator.

FP7 – ICT – GA 318137 15 DISCUS
the failure of one of the OLT FPGAs, the scenario could not be completely presented at ECOC (despite working in the lab before and after shipping to ECOC). Hence, only the video streaming was presented.
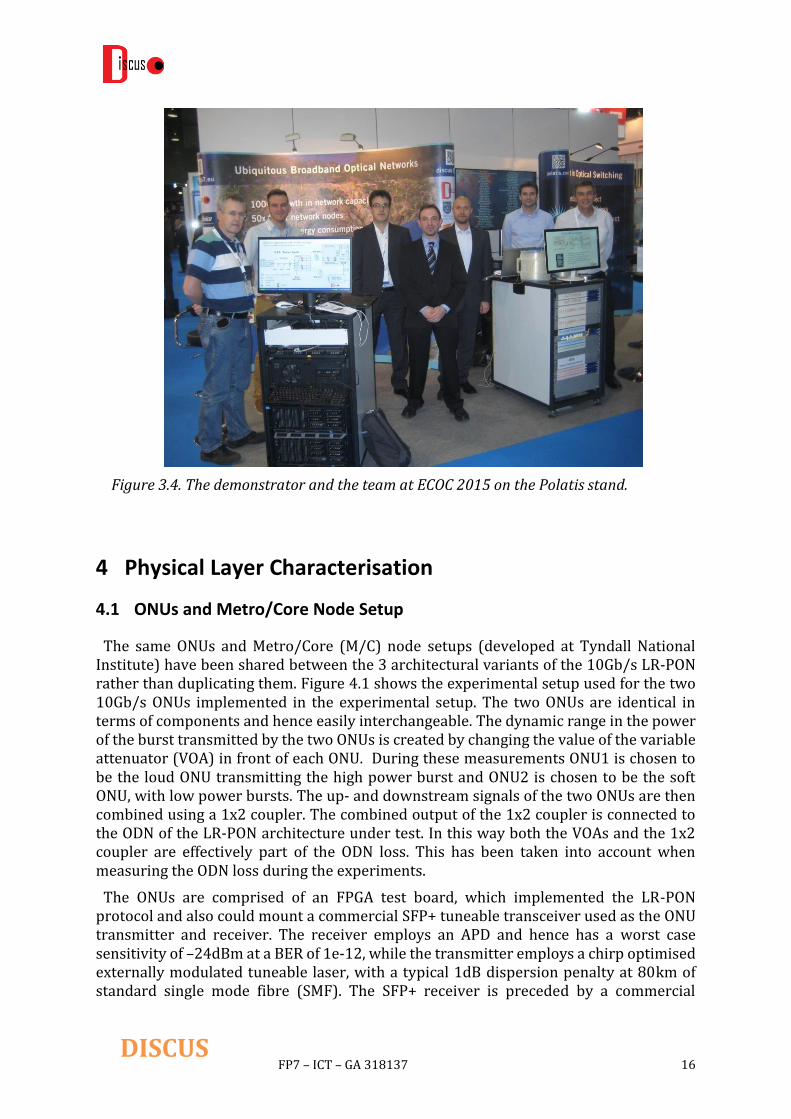
Despite the technical difficulties at the show, the demonstration was very successful and of high impact attracting more than 50 visitors from more than 40 companies (excluding DISCUS partners) that showed interest in the demonstration and the project.
Figure 3.2. Control plane view of the portable demonstrator.
Figure 3.3. Physical layer and control plane racks before being shipped to ECOC.
FP7 – ICT – GA 318137 16 DISCUS
4 Physical Layer Characterisation
4.1 ONUs and Metro/Core Node Setup
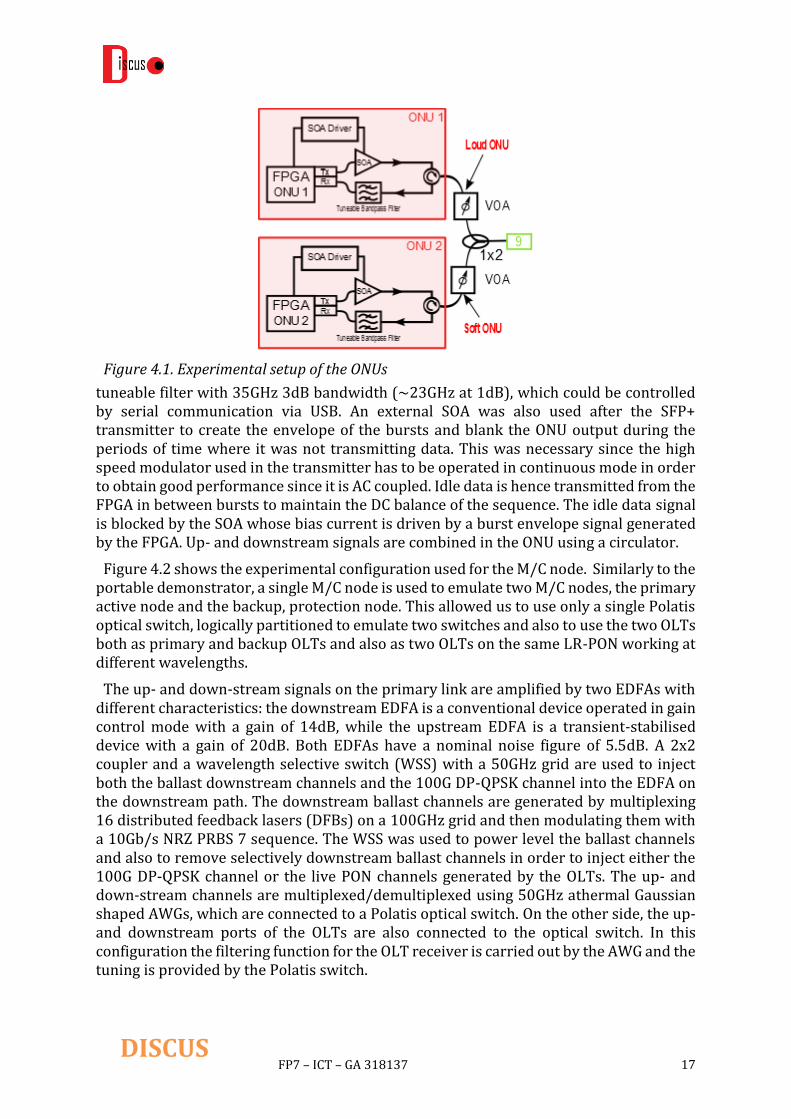
The same ONUs and Metro/Core (M/C) node setups (developed at Tyndall National Institute) have been shared between the 3 architectural variants of the 10Gb/s LR-PON rather than duplicating them. Figure 4.1 shows the experimental setup used for the two 10Gb/s ONUs implemented in the experimental setup. The two ONUs are identical in terms of components and hence easily interchangeable. The dynamic range in the power of the burst transmitted by the two ONUs is created by changing the value of the variable attenuator (VOA) in front of each ONU. During these measurements ONU1 is chosen to be the loud ONU transmitting the high power burst and ONU2 is chosen to be the soft ONU, with low power bursts. The up- and downstream signals of the two ONUs are then combined using a 1x2 coupler. The combined output of the 1x2 coupler is connected to the ODN of the LR-PON architecture under test. In this way both the VOAs and the 1x2 coupler are effectively part of the ODN loss. This has been taken into account when measuring the ODN loss during the experiments.
The ONUs are comprised of an FPGA test board, which implemented the LR-PON protocol and also could mount a commercial SFP+ tuneable transceiver used as the ONU transmitter and receiver. The receiver employs an APD and hence has a worst case sensitivity of –24dBm at a BER of 1e-12, while the transmitter employs a chirp optimised externally modulated tuneable laser, with a typical 1dB dispersion penalty at 80km of standard single mode fibre (SMF). The SFP+ receiver is preceded by a commercial
Figure 3.4. The demonstrator and the team at ECOC 2015 on the Polatis stand.
FP7 – ICT – GA 318137 17 DISCUS
tuneable filter with 35GHz 3dB bandwidth (~23GHz at 1dB), which could be controlled by serial communication via USB. An external SOA was also used after the SFP+ transmitter to create the envelope of the bursts and blank the ONU output during the periods of time where it was not transmitting data. This was necessary since the high speed modulator used in the transmitter has to be operated in continuous mode in order to obtain good performance since it is AC coupled. Idle data is hence transmitted from the FPGA in between bursts to maintain the DC balance of the sequence. The idle data signal is blocked by the SOA whose bias current is driven by a burst envelope signal generated by the FPGA. Up- and downstream signals are combined in the ONU using a circulator.
Figure 4.2 shows the experimental configuration used for the M/C node. Similarly to the portable demonstrator, a single M/C node is used to emulate two M/C nodes, the primary active node and the backup, protection node. This allowed us to use only a single Polatis optical switch, logically partitioned to emulate two switches and also to use the two OLTs both as primary and backup OLTs and also as two OLTs on the same LR-PON working at different wavelengths.
The up- and down-stream signals on the primary link are amplified by two EDFAs with different characteristics: the downstream EDFA is a conventional device operated in gain control mode with a gain of 14dB, while the upstream EDFA is a transient-stabilised device with a gain of 20dB. Both EDFAs have a nominal noise figure of 5.5dB. A 2x2 coupler and a wavelength selective switch (WSS) with a 50GHz grid are used to inject both the ballast downstream channels and the 100G DP-QPSK channel into the EDFA on the downstream path. The downstream ballast channels are generated by multiplexing 16 distributed feedback lasers (DFBs) on a 100GHz grid and then modulating them with a 10Gb/s NRZ PRBS 7 sequence. The WSS was used to power level the ballast channels and also to remove selectively downstream ballast channels in order to inject either the 100G DP-QPSK channel or the live PON channels generated by the OLTs. The up- and down-stream channels are multiplexed/demultiplexed using 50GHz athermal Gaussian shaped AWGs, which are connected to a Polatis optical switch. On the other side, the up- and downstream ports of the OLTs are also connected to the optical switch. In this configuration the filtering function for the OLT receiver is carried out by the AWG and the tuning is provided by the Polatis switch.
Figure 4.1. Experimental setup of the ONUs

FP7 – ICT – GA 318137 18 DISCUS
The PON protocol in the OLT is also implemented using FPGAs. Similarly to the ONUs, the OLT transmitter is implemented using the externally modulated tuneable transmitter of the SFP+ module. Since the downstream is operated in continuous mode no extra components are required in the transmitter. The receiver in the OLT is implemented using a 10Gb/s LBMRx developed by Tyndall National Institute. The device is still in the development stage, but it is packaged with high speed outputs and fibre coupled. For more information on the LBMRx and its performance please refer to [1]. The signal from the LBMRx is then fed to a commercial 10Gb/s CDR unit (Vitesse VSC8240). This chip contains a relatively fast clock recovery unit which can be used in burst mode. The tests shown in D8.3 have shown that this chip can work combined with the LBMRx and the FPGA test board in burst mode provided the burst preamble is of around 1s. The Vitesse VSC8240 also implements continuous mode EDC functionality. A true burst mode EDC would be necessary in a real system in order to compensate for bursts experiencing different amounts of chromatic dispersion and having different pulse distortions [2]. However, we were able to use the Vitesse device in the current testbed since the two ONUs are located at the same distance (and hence experience the same amount of chromatic dispersion) and the two SFP+ transmitters have tight specifications in terms of the pulse shape and chirp. The EDC taps are trained with a continuous mode sequence and then frozen during burst mode operation.
As can be seen in Figure 4.3 (a) the ONUs and the M/C node are connected to a second Polatis optical switch (physically separated from the one in the M/C node). In this way it is possible to easily connect the ONUs and the M/C node to the selected LR-PON architecture (shown as the green oval box) out of the 3 implemented, without having to manually break connections. This configuration proved very useful allowing for a quick reconfiguration of the testbed and also allowed an easier and faster integration of the SOA-based LR-PON developed by ALUD. In Figure 4.3 (a) we can see that the second Polatis switch was also used to route the 100G DP-QPSK channel to the LR- PON on the ONU side. The multi-wavelength traffic, which would be generated in a fully populated LR-PON by the ONUs at the various wavelengths, is emulated in the setup using a wideband optical noise, amplified spontaneous emission (ASE), generated from a cascade
Figure 4.2. Experimental setup of the Metro/Core node

FP7 – ICT – GA 318137 19 DISCUS
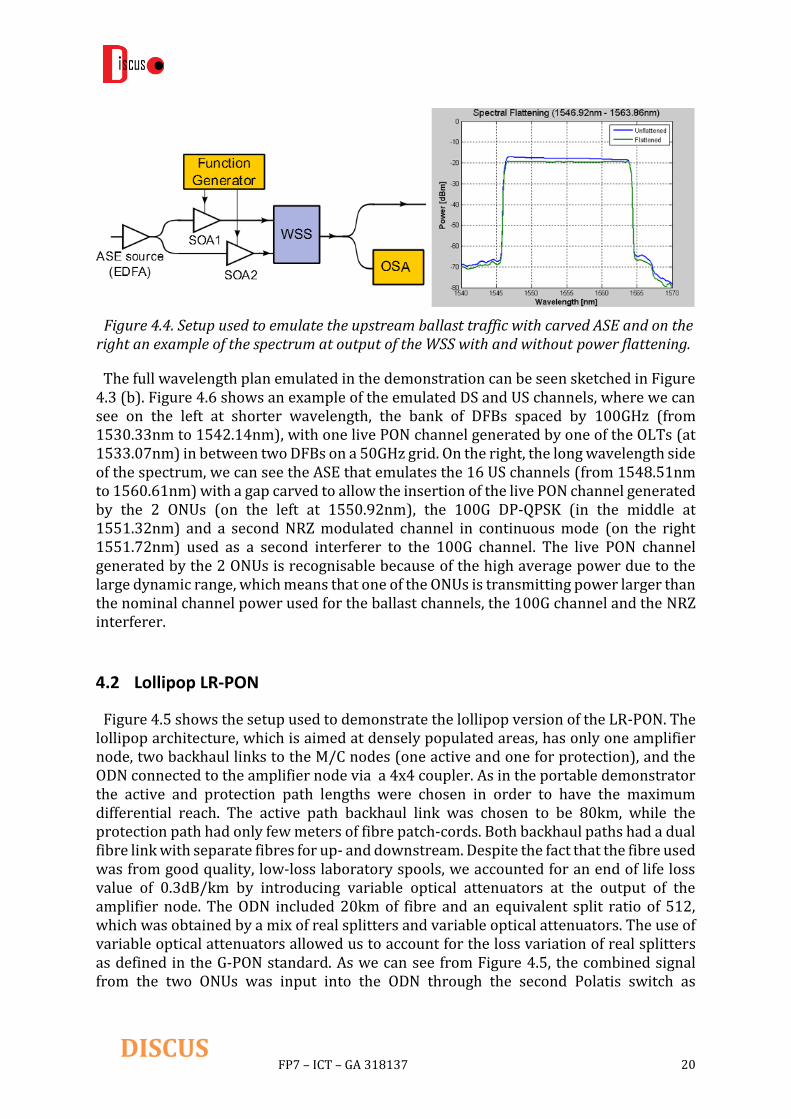
of an EDFA and SOAs (Figure 4.4). The spectral profile of the emulated US channels is carved using a WSS, which is also used to flatten the ASE. The SOAs used to amplify the ASE are driven by a function generator in order to modulate the ballast US channels, which emulates the traffic patterns due to the burst mode operation of the US channels. An optical spectrum analyser (OSA) is used to monitor the spectrum and in particular the wavelength flatness.
(a)
(b)
Figure 4.3. Connections of the ONUs and M/C node to the 3 variants of the LR-PON on the experimental setup (a) and wavelength plan used in demonstration (b).
FP7 – ICT – GA 318137 20 DISCUS
The full wavelength plan emulated in the demonstration can be seen sketched in Figure 4.3 (b). Figure 4.6 shows an example of the emulated DS and US channels, where we can see on the left at shorter wavelength, the bank of DFBs spaced by 100GHz (from 1530.33nm to 1542.14nm), with one live PON channel generated by one of the OLTs (at 1533.07nm) in between two DFBs on a 50GHz grid. On the right, the long wavelength side of the spectrum, we can see the ASE that emulates the 16 US channels (from 1548.51nm to 1560.61nm) with a gap carved to allow the insertion of the live PON channel generated by the 2 ONUs (on the left at 1550.92nm), the 100G DP-QPSK (in the middle at 1551.32nm) and a second NRZ modulated channel in continuous mode (on the right 1551.72nm) used as a second interferer to the 100G channel. The live PON channel generated by the 2 ONUs is recognisable because of the high average power due to the large dynamic range, which means that one of the ONUs is transmitting power larger than the nominal channel power used for the ballast channels, the 100G channel and the NRZ interferer.
4.2 Lollipop LR-PON
Figure 4.5 shows the setup used to demonstrate the lollipop version of the LR-PON. The lollipop architecture, which is aimed at densely populated areas, has only one amplifier node, two backhaul links to the M/C nodes (one active and one for protection), and the ODN connected to the amplifier node via a 4x4 coupler. As in the portable demonstrator the active and protection path lengths were chosen in order to have the maximum differential reach. The active path backhaul link was chosen to be 80km, while the protection path had only few meters of fibre patch-cords. Both backhaul paths had a dual fibre link with separate fibres for up- and downstream. Despite the fact that the fibre used was from good quality, low-loss laboratory spools, we accounted for an end of life loss value of 0.3dB/km by introducing variable optical attenuators at the output of the amplifier node. The ODN included 20km of fibre and an equivalent split ratio of 512, which was obtained by a mix of real splitters and variable optical attenuators. The use of variable optical attenuators allowed us to account for the loss variation of real splitters as defined in the G-PON standard. As we can see from Figure 4.5, the combined signal from the two ONUs was input into the ODN through the second Polatis switch as
Figure 4.4. Setup used to emulate the upstream ballast traffic with carved ASE and on the right an example of the spectrum at output of the WSS with and without power flattening.

FP7 – ICT – GA 318137 21 DISCUS
described in the previous section. The 100G DP-QPSK channel, the emulated multi-channel PON traffic and the additional NRZ interferer channel were also connected to the ODN through the optical switch and coupled into unused ports of various splitters.
In this first version of the LR-PON the optical amplifiers used are EDFAs. The upstream EDFAs are commercial gain transient stabilised modules with 32dB gain and +20dBm maximum output power, while the EDFAs in the downstream are conventional gain controlled EDFAs. In order to reduce the number of high power EDFAs used in the downstream a high power (+30dBm) amplifier was shared between the active and protection path. This configuration has the added advantage that the high power EDFA in the downstream did not have large variations in the input power when switching from active to protection path hence reducing the possible power spikes due to gain transients. By using this amplifier configuration we also had an unused port of the 4x4 coupler which could be used for monitoring purposes. The amplifier provided 30dB of gain, which was more than the protection path required and hence the downstream was attenuated using a VOA. The active path, on the other hand, required a higher gain due to the loss of the 80km link and hence a second EDFA was used as a low gain preamplifier and the overall gain was adjusted using a variable optical attenuator. A dispersion compensating fibre module, equivalent to the inverse of 40km of standard single mode fibre, was also inserted in between the two EDFAs in the active downstream link. The SFP+ transmitter used in the OLT had a dispersion tolerance of ~80km, hence the link was only partially dispersion compensated. The upstream transmitter in the ONU used the same SFP+ modules, but in this case it was not necessary to use optical dispersion compensating modules since we used the electronic dispersion compensation capability of the Vitesse CDR after the LBMRx.
Figure 4.5. Setup of the lollipop LR-PON architecture using EDFAs in the amplifier node.

FP7 – ICT – GA 318137 22 DISCUS
Band blocking filters were also used in front of the upstream amplifiers (RB in the figure) in order to stop the Rayleigh backscatter from the downstream. Because of the high launched power from the amplifier node the Rayleigh backscattering of the downstream was comparable with the power of the upstream signals and hence it was subtracting gain and power from the upstream EDFAs. The spectrum in Figure 4.6 is in fact taken at the monitoring port of the 4x4 splitter, where the downstream channels should not be visible. The spectral channels that can be seen are the Rayleigh backscatter of the downstream channels, and as we can see from the picture they are of comparable power with the upstream signals.
The PON channels generated from the OLTs and the ONUs were characterised in terms of their pre-FEC bit error rate (BER). The BER was measured internally in the FPGAs, respectively by the ONU FPGAs for the downstream and in the OLT FPGAs for the upstream. The FPGA code used for the physical layer demonstration does not implement the full protocol used for the service level demonstrations described in Section 5. However, the physical layer FPGA code implements the full burst structure (guard bands, preamble, synchronisation and burst envelope generation), and allows us to measure the BER more accurately (since the payload is a selectable PRBS) and also allows synchronisation of the burst with test and measurement and diagnostic equipment such as oscilloscopes. The details on the algorithms and the structure of the code implemented in the FPGAs can be found in D8.2.
Figure 4.6. Spectrum taken at the monitor port (port [60] in Figure 9) for the lollipop architecture, where we can see on the right the emulated upstream signals and on the left the Rayleigh backscatter of the downstream channels.

FP7 – ICT – GA 318137 23 DISCUS
The system was tested with down- and up-stream fully loaded (equivalent to 16 ballast channels, 1 live PON channel, and 1 100G DP-QPSK). The downstream operates in continuous mode, but it can present large received power variations due to the differential loss of the ODN. In the case of the lollipop architecture demonstrated with 512 users the minimum ONU receiver power is –30.2dBm (assuming a launched power of +15dBm/channel from the amplifier node EDFA and 45.2dB loss in the ODN due to splitters and fibre). Due to the non-uniform splitter loss specified in the standards (for example G-PON) the ONU received power could present up to 11dB difference for 512 users meaning that the ONU should be able to work from a power 19.2dBm down to 30.2dBm. Figure 4.7 shows the BER measured as a function of the received power at the input of the ONU (before the tuneable filter). As we can see, the BER for the minimum required power level of 30.2dBm is below 10-5, well below the FEC threshold, commonly assumed to be 10-3 for the code used in the XG-PON downstream. Although not shown in the figure the BER is error free (BER better than 10-12) for powers higher than -25dBm and remains error free up to the maximum input power of 19.2dBm. This confirms that the downstream of the lollipop architecture can operate below FEC threshold for the entire power range of an LR-PON with 512 users.
The upstream operates in burst mode and the tests in the demonstrator have been performed as a function of the dynamic range of the bursts transmitted from ONU1 and ONU2. For convenience ONU1 is always the higher power transmitter (loud burst), while ONU2 is always the lower power transmitter (soft burst). Figure 4.8 shows an example of the optical upstream signal after the first coupler (yellow trace), where we can clearly see the difference in power between the high power burst of ONU1 and the low power burst of ONU2 (which is barely visible with this scale on the oscilloscope). The dynamic range of the bursts in Figure 12 is 16dB. In the same figure we can see the electrical trace of the
Figure 4.7. Downstream BER as a function of the power at the input of the ONU receiver (before the tuneable optical filter)
-33 -32 -31 -30 -29 -28 -27 -26 -25
1e-11
1e-10
1e-9
1e-8
1e-7
1e-6
1e-5
1e-4
1e-3
1e-2
Prx
(dBm)
BE
R

FP7 – ICT – GA 318137 24 DISCUS
upstream signal after the CDR unit. We can still notice the burst structure, but the two bursts are of equal amplitude. This is the signal which enters the OLT FPGA, where the bursts are detected, synchronised and the BER is then measured on the payload section.
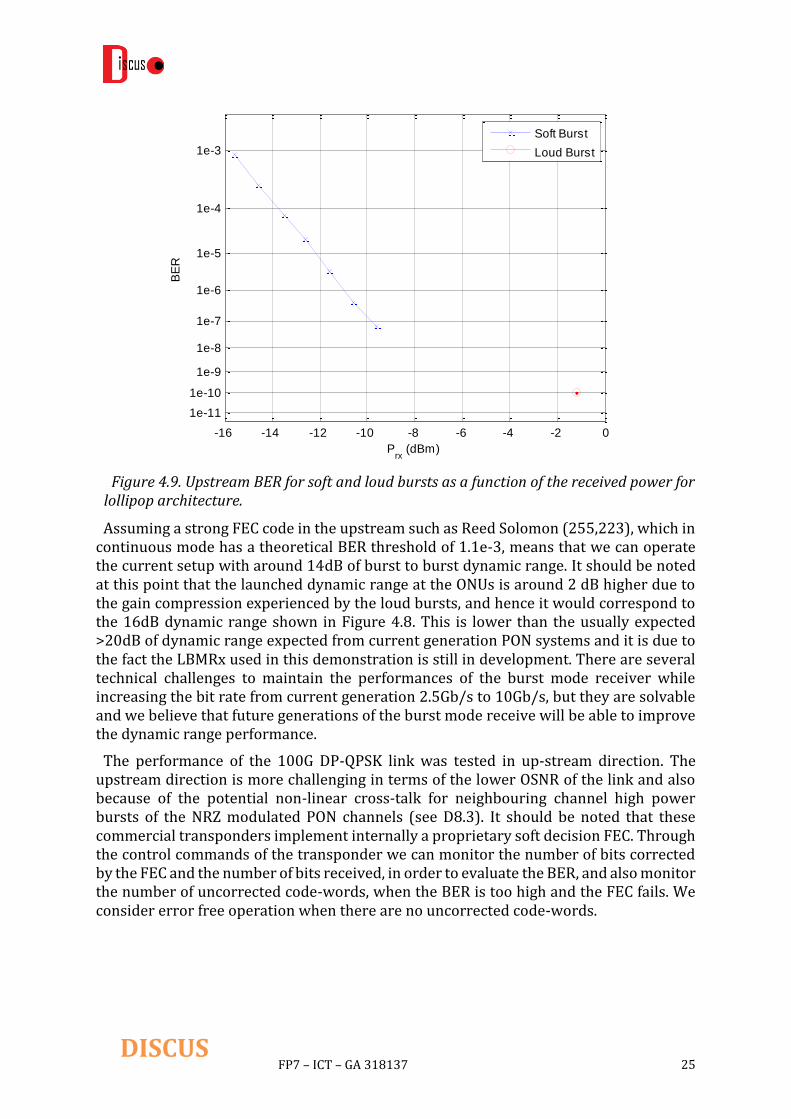
The performance of the upstream has been characterised as a function of the power of the soft and loud bursts. The soft burst is limited by a mix of thermal noise of the receiver and optical noise introduced by the optical amplifier. Figure 4.9 shows the BER measured as a function of the received power at the LBMRx for the soft burst (blue line and symbols). It should be noted that the received power is varied by changing the launched power at ONU2 and hence the optical signal to noise ratio (OSNR) of the signal also varies at each point (decreasing with the received power). The ONSR for the first point of the curve at a received power of -15.6dBm is 19.7dB, while the last point at -9.6dBm has an OSNR of 25.4dB. The loud burst, on the other hand, operates always with high OSNR, but close to the overload of the receiver and hence the BER curve as a function of power is very steep and as we can see in Figure 4.9 only one point could be measured for a received power of -1.2dBm (red circle). For lower power the loud burst was error free, while for higher power the BER was degrading rapidly towards the FEC threshold.
Figure 4.8. Example of the optical upstream signal launched from the ONUs after the first coupler for 16dB dynamic range (yellow trace) and the correspondent electrical signal after the CDR (green trace).
FP7 – ICT – GA 318137 25 DISCUS
Assuming a strong FEC code in the upstream such as Reed Solomon (255,223), which in continuous mode has a theoretical BER threshold of 1.1e-3, means that we can operate the current setup with around 14dB of burst to burst dynamic range. It should be noted at this point that the launched dynamic range at the ONUs is around 2 dB higher due to the gain compression experienced by the loud bursts, and hence it would correspond to the 16dB dynamic range shown in Figure 4.8. This is lower than the usually expected >20dB of dynamic range expected from current generation PON systems and it is due to the fact the LBMRx used in this demonstration is still in development. There are several technical challenges to maintain the performances of the burst mode receiver while increasing the bit rate from current generation 2.5Gb/s to 10Gb/s, but they are solvable and we believe that future generations of the burst mode receive will be able to improve the dynamic range performance.
The performance of the 100G DP-QPSK link was tested in up-stream direction. The upstream direction is more challenging in terms of the lower OSNR of the link and also because of the potential non-linear cross-talk for neighbouring channel high power bursts of the NRZ modulated PON channels (see D8.3). It should be noted that these commercial transponders implement internally a proprietary soft decision FEC. Through the control commands of the transponder we can monitor the number of bits corrected by the FEC and the number of bits received, in order to evaluate the BER, and also monitor the number of uncorrected code-words, when the BER is too high and the FEC fails. We consider error free operation when there are no uncorrected code-words.
Figure 4.9. Upstream BER for soft and loud bursts as a function of the received power for lollipop architecture.
-16 -14 -12 -10 -8 -6 -4 -2 0
1e-11
1e-10
1e-9
1e-8
1e-7
1e-6
1e-5
1e-4
1e-3
Prx
(dBm)
BE
R
Soft Burst
Loud Burst
FP7 – ICT – GA 318137 26 DISCUS
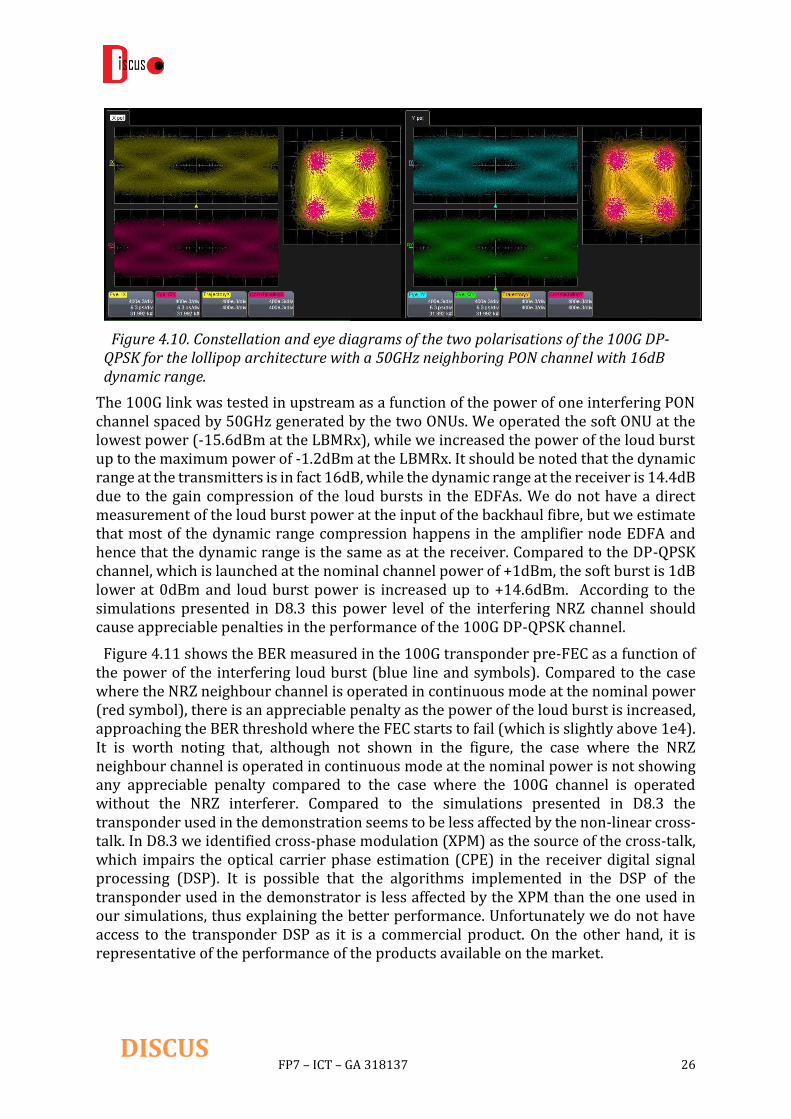
The 100G link was tested in upstream as a function of the power of one interfering PON channel spaced by 50GHz generated by the two ONUs. We operated the soft ONU at the lowest power (-15.6dBm at the LBMRx), while we increased the power of the loud burst up to the maximum power of -1.2dBm at the LBMRx. It should be noted that the dynamic range at the transmitters is in fact 16dB, while the dynamic range at the receiver is 14.4dB due to the gain compression of the loud bursts in the EDFAs. We do not have a direct measurement of the loud burst power at the input of the backhaul fibre, but we estimate that most of the dynamic range compression happens in the amplifier node EDFA and hence that the dynamic range is the same as at the receiver. Compared to the DP-QPSK channel, which is launched at the nominal channel power of +1dBm, the soft burst is 1dB lower at 0dBm and loud burst power is increased up to +14.6dBm. According to the simulations presented in D8.3 this power level of the interfering NRZ channel should cause appreciable penalties in the performance of the 100G DP-QPSK channel.
Figure 4.11 shows the BER measured in the 100G transponder pre-FEC as a function of the power of the interfering loud burst (blue line and symbols). Compared to the case where the NRZ neighbour channel is operated in continuous mode at the nominal power (red symbol), there is an appreciable penalty as the power of the loud burst is increased, approaching the BER threshold where the FEC starts to fail (which is slightly above 1e4). It is worth noting that, although not shown in the figure, the case where the NRZ neighbour channel is operated in continuous mode at the nominal power is not showing any appreciable penalty compared to the case where the 100G channel is operated without the NRZ interferer. Compared to the simulations presented in D8.3 the transponder used in the demonstration seems to be less affected by the non-linear cross-talk. In D8.3 we identified cross-phase modulation (XPM) as the source of the cross-talk, which impairs the optical carrier phase estimation (CPE) in the receiver digital signal processing (DSP). It is possible that the algorithms implemented in the DSP of the transponder used in the demonstrator is less affected by the XPM than the one used in our simulations, thus explaining the better performance. Unfortunately we do not have access to the transponder DSP as it is a commercial product. On the other hand, it is representative of the performance of the products available on the market.
Figure 4.10. Constellation and eye diagrams of the two polarisations of the 100G DP-QPSK for the lollipop architecture with a 50GHz neighboring PON channel with 16dB dynamic range.

FP7 – ICT – GA 318137 27 DISCUS
In summary the physical layer of the lollipop architecture demonstrated is able to operate error free with an ODN differential loss of 16dB, supporting 512 users over a total reach of 100km. The 100G link is also supported by the lollipop architecture using a commercial transponder.
4.3 Open Ring LR-PON
Figure 4.12 shows the setup used to demonstrate the open-ring version of the LR-PON. The open-ring architecture is aimed at sparsely populated, rural areas, where there might not be a large number of customers concentrated around a single local exchange site. In the open ring architecture a number of amplifier nodes (which could be located in the local exchange sites) are chained with the two M/C nodes (active and protection) at each end of the chain, forming a structure analogous to a section of a ring that would be found in today’s metro networks (for more details please refer to deliverable D2.3). Figure 16 shows the open-ring architecture with 4 amplifier nodes, each of them dropping an ODN capable of supporting 128 users. The amplifier nodes are connected together and with M/C nodes via different length links, as can be seen from Figure 4.12, which, including 10km in the ODN, provide a total reach of 110km in the active path and 10km in the protection path. As explained earlier in Section 4.1 the ONUs, the M/C nodes, the 100G DP-QPSK channel and the emulated upstream channels are connected to the network using the second Polatis switch.
Figure 4.11. 100G DP-QPSK channel as a function of the power of the aggressor 10G PON channel for the lollipop.
-2 0 2 4 6 8 10 12 14
1e-7
1e-6
1e-5
1e-4
1e-3
Ploud aggressor
-P100G
(dB)
BE
R
Soft and loud Burst
Continuous Nominal Power

FP7 – ICT – GA 318137 28 DISCUS
Node 4, which is the furthest from the active M/C node, has been used in our tests to connect the two ONUs, the 100G DP-QPSK channel, and the emulated upstream channels. Node 4 has been fully implemented and the ODN connected to it has been implemented using 10km of fibre and a mix of real splitters and variable optical attenuators similarly to the lollipop setup. Node 1 is also fully implemented, but with no ODN connected to it, while node 2 and node 3 are only partially implemented where the loss of the splitters that are not present is taken into account using variable optical attenuators. Similarly to the lollipop, the difference between the end of life fibre loss and the lower loss of the fibre used in the setup was taken into account and adjusted using variable optical attenuators. Even though some of the nodes are not fully implemented for practical reasons, the loss budget and number of optical amplifier in the system (with their gain and saturated output power) are the same as for a fully implemented system.
In contrast to the lollipop setup, in the open ring setup there is no spare port on the 4x4 coupler that we can use to monitor the signal spectrum. In this case the signal spectrum was monitored from the protection upstream link through the second Polatis switch. We can see in Figure 4.13 an example of the spectrum taken at the monitoring port using an OSA. We can see on the right, on the long wavelength side of the spectrum the upstream signals, with the ASE emulating the PON channels, the active live PON channels (with a larger power due to the burst dynamic range), the 100G DP-QPSK channels in between the live PON channel and another 10G NRZ channel. We can also see on the left, short wavelength side, the spectrum of the upstream channels with the ballast channels on a
Figure 4.12. Setup of the open-ring LR-PON architecture.
Monitoring Port

FP7 – ICT – GA 318137 29 DISCUS
100GHz grid and the live PON downstream channel on a 50GHz grid in between two ballast channels. It should be noted that in this case the downstream spectrum is the spectrum of the real channels that are continuing to go through the network after node 4 and not the backscattering as in the lollipop case.
As for the lollipop architecture, the system was tested with down- and up-stream fully loaded (equivalent to 16 ballast channels, 1 live PON channel, and 1 100G DP-QPSK). Also in this case the downstream can operate below FEC threshold for the entire power range of an LR-PON with 128 users dropped at each amplifier node for a total of 512 users. Compared to the lollipop architecture the downstream of the open-ring is less challenging because of the lower loss of the ODN, which means that a lower power can be launched from the last amplifier node.
The upstream has been tested in burst mode as a function of the dynamic range of the bursts transmitted from ONU1 and ONU2. Similarly to the tests on the lollipop architecture the maximum dynamic range tested was 16dB at the transmitters. Compression in the gain of the optical amplifiers for the loud burst meant that the dynamic range was slightly reduced to 15.3dB at the receiver. The dynamic range compression was lower in this case because the optical amplifiers were less saturated compared to the lollipop architecture. Figure 4.14 shows the BER measured as a function of the received power at the LBMRx for the soft burst (blue line and symbols). The ONSR for the first point of the curve at a received power of 15.6dBm is 22.1dB, while the last point at 9.6dBm has an OSNR of 27.5dB. The loud burst, on the other hand, for a received
Figure 4.13. Spectrum taken at the monitor port for the open-ring architecture, where we can see on the right the emulated upstream signals and on the left the spectrum of the downstream channels.

FP7 – ICT – GA 318137 30 DISCUS
power of 1.2dBm (red circle in Figure 4.14) is error free (BER better than 10-10), but, as in the case of the lollipop architecture, close to the overload of the receiver. The BER curve as a function of power is very steep and for higher power the BER degrades rapidly towards the FEC threshold. The OSNR of the open-ring is slightly higher than the lollipop and hence the BER at equivalent received powers is lower allowing the receiver to be operated with a slightly higher dynamic range.
The performance of the 100G DP-QPSK link was also tested in up-stream direction for the open ring architecture. The test was performed as a function of the power of one interfering PON channel spaced by 50GHz generated by the two ONUs. We operated the soft ONU at the lowest power (-16.8dBm at the LBMRx), while we increased the power of the loud burst up to the maximum power of -1.2dBm at the LBMRx. It should be noted that the dynamic range at the transmitters is in fact 16dB, while the dynamic range at the receiver is 15.3dB due to the gain compression of the loud bursts in the EDFAs. Also for the open ring case we do not have a direct measurement of the loud burst power at the input of the backhaul fibre, and in this case the dynamic range compression will change at each amplifier node, but only very slightly since there is a total change of 0.7dB. For similarity with the lollipop case we plot the power difference between the loud burst of PON channel and the DP-QPSK considering the dynamic range at the receiver and that the DP-QPSK channel is maintained 2dB higher than the nominal channel. The power launched in each fibre link will be different since by the design the channel power at the input of each amplifier node is kept constant (see D2.3 and D8.3). As an indication the DP-QPSK power launched in the 40km fibre links is -1dBm while the soft burst has a power of -4dBm and the loud burst power is increased up to +10.6dBm.
Figure 4.14. Upstream BER for soft and loud bursts as a function of the received power for open-ring architecture.
-18 -16 -14 -12 -10 -8 -6 -4 -2 0
1e-11
1e-10
1e-9
1e-8
1e-7
1e-6
1e-5
1e-4
1e-3
Prx
(dBm)
BE
R
Soft Burst
Loud Burst

FP7 – ICT – GA 318137 31 DISCUS
Figure 4.16 shows the BER measured in the 100G transponder pre-FEC as a function of the power of the interfering loud burst (blue line and symbols). Compared to the case where the NRZ neighbour channel is operated in continuous mode at the same power of the DP-QPSK channel (red symbol), there is an appreciable penalty as the power of the loud burst is increased, approaching the BER threshold where the FEC starts to fail (which is slightly above 1e4). The interfering channel seems to have more impact compared to the lollipop case, which is expected given that there are three fibre spans where the non-linear cross-talk can occur (40, 40 and 20km). Even though the powers boosted by the amplifier nodes are lower than the lollipop case the multiple spans of fibre are increasing the effect of XPM. Compared to the simulations presented in D8.3 also for this architecture the transponder used in the demonstration seems to be less sensitive to the XPM non-linear cross-talk.
In summary the physical layer of the open-ring architecture demonstrated is able to operate error free with an ODN differential loss of 16dB, supporting 512 users, with 4 amplifier nodes each supporting 128 users, over a total reach of 100km. The 100G link is also supported by the lollipop architecture using a commercial transponder.
Figure 4.15. Constellation and eye diagrams of the two polarisations of the 100G DP-QPSK for the open-ring architecture with a 50GHz neighbouring PON channel with 16dB dynamic range.
FP7 – ICT – GA 318137 32 DISCUS
4.4 SOA-based LR-PON
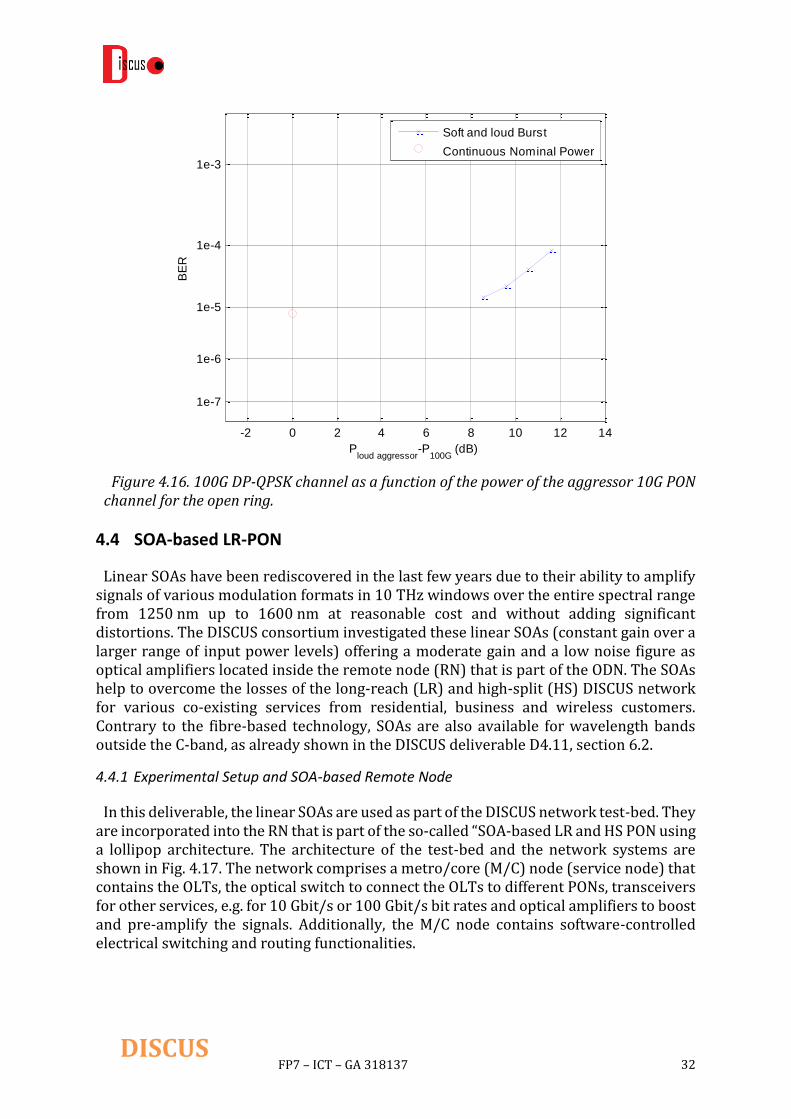
Linear SOAs have been rediscovered in the last few years due to their ability to amplify signals of various modulation formats in 10 THz windows over the entire spectral range from 1250 nm up to 1600 nm at reasonable cost and without adding significant distortions. The DISCUS consortium investigated these linear SOAs (constant gain over a larger range of input power levels) offering a moderate gain and a low noise figure as optical amplifiers located inside the remote node (RN) that is part of the ODN. The SOAs help to overcome the losses of the long-reach (LR) and high-split (HS) DISCUS network for various co-existing services from residential, business and wireless customers. Contrary to the fibre-based technology, SOAs are also available for wavelength bands outside the C-band, as already shown in the DISCUS deliverable D4.11, section 6.2.
4.4.1 Experimental Setup and SOA-based Remote Node
In this deliverable, the linear SOAs are used as part of the DISCUS network test-bed. They are incorporated into the RN that is part of the so-called “SOA-based LR and HS PON using a lollipop architecture. The architecture of the test-bed and the network systems are shown in Fig. 4.17. The network comprises a metro/core (M/C) node (service node) that contains the OLTs, the optical switch to connect the OLTs to different PONs, transceivers for other services, e.g. for 10 Gbit/s or 100 Gbit/s bit rates and optical amplifiers to boost and pre-amplify the signals. Additionally, the M/C node contains software-controlled electrical switching and routing functionalities.
Figure 4.16. 100G DP-QPSK channel as a function of the power of the aggressor 10G PON channel for the open ring.
-2 0 2 4 6 8 10 12 14
1e-7
1e-6
1e-5
1e-4
1e-3
Ploud aggressor
-P100G
(dB)
BE
R
Soft and loud Burst
Continuous Nominal Power

FP7 – ICT – GA 318137 33 DISCUS
The outside plant comprises a 62 km long feeder fibre, the remote node with SOAs and a 2:4 splitter, a 12 km long fibre in the ODN as well as several 3 dB splitters and variable optical attenuators to adapt the loss budget to an equivalent loss of a 1:128 splitter (in each branch of the 2:4 splitter), i.e. a total split ratio of 1:512 is implemented. At the customer location two ONUs are implemented to detect the DS signals. The ONUs transmitter generates burst-traffic of 2 µs length with a 10 Gbit/s non-return to zero (NRZ) on-off-keying (OOK) payload. The burst-operation is enabled by an SOA-gate. More details on the generation and implementation of the various services are presented in section 4.1. As a reminder, in this section, we briefly summarize the services occurring in the downstream and upstream direction, respectively.
The downstream direction, two OLT transmitters (SFP+ modules) operated at 10 Gbit/s in continuous data mode and 16 NRZ 10 Gbit/s ballast channels are present. The ballast wavelengths have a channel spacing of 100 GHz and they are allocated to enclose the OLT DS target channels. The power difference of all DS-signals is within 3 dB. The ONUs are equipped with a tuneable 50 GHz-grid filter followed by an APD.
In the upstream direction, the two burst-mode operated ONUs are allocated to a single wavelength, i.e. they are operated with TDMA. Additionally, a 100 Gbit/s DP-QPSK, a 10 Gbit/s NRZ-OOK in continuous data-mode as well as 14 individually generated and un-modulated ASE ballast channels are present. The TDM-ONUs can have different power levels, i.e. ONU1 is defined to offer the soft packet and ONU2 is defined to offer the loud packet. The burst power ratio can be modified in a way that the power level of the loud packet can be increased while the power level of the soft packet is remained. The soft packet, the 100 Gbit/s, the 10 Gbit/s as well as the each individual ASE-ballast channel have identical power levels at the remote node input. After amplification of the US signals by use of the remote node the data signals are amplified by an EDFA within the M/C node
Figure 4.17. DISCUS network test-bed including the SOAs in the remote node of a lollipop long-reach and high-split access network. The insets show individual pictures of the different network systems and of the remote node.
1531nm
CWDM
pass
reflect
co.
62km
feeder
SOA
Remote
Node12km
ODN
1:2
1:2VOA
“new M/C Node
interface” for single
feeder fiber solution
DS
US
OLT2(FPGA)
OLT1 (FPGA)
OLT2(LBMRx)
OLT1 (LBMRx)
M/C Node: Polatis Optical switch
ONU1(Burst-Generator-SOA)
ONU2(Burst-Generator-SOA)
ONU2(FPGA+tunable filter)
ONU1(FPGA+tunable filter)
100G Rx
(Tx is in the
room next to
the lab)
10G OOK
NRZ ballast
channel
(DS+US)
ASE ballast
50GHZ WSS filter ASE
(unmodulated)
100G DP-QPSK Rx
EDFAs

FP7 – ICT – GA 318137 34 DISCUS
and directed by the optical switch (Polatis) to the different receivers. The TDM-PON ONU’s signals are received by means of a PIN-photodiode, a linear burst-mode receiver (LBMRx) and a commercially available EDC board from Vitesse using predefined taps for 100 km fibre transmission. The 100 Gbit/s signal is received by a coherent receiver. No dispersion compensating fibre is used in the experiments with the SOA-based remote node.
In Fig. 4.18, the SOA remote node is presented. The RN design has already been discussed in DISCUS deliverable D4.11, section 3.3. It comprises of coarse wavelength division multiplexed (CWDM)-filters that separate the US (around 1551 nm) and DS (around 1531 nm) signals. The DS and US bands are individually amplified by the SOAs. A chain of SOAs is implemented to offer the signals to bridge a large loss budget by experiencing 2x the gain over a large range of remote node input powers. Effectively a 2:4 splitter is incorporated into the remote node. This splitter is mimicked by a 1:2 splitter and a 3 dB attenuator in one branch of the 1:2 splitter. The second branch of the 1:2 splitter is used to emulate the noise funnelling (NoFU) challenge occurring in this kind of remote node architecture, as discussed in the DISCUS deliverable D4.3, section 3. In the second branch, we implement just a single SOA to both amplify the 10 Gbit/s NRZ-OOK US signal and to add additional ASE noise to the other US signals. Note that in this branch no additional 3 dB splitter is used to enhance the ASE influence of the SOA1.
The effective small-signal gain of the remote node is 20.5 dB in US and DS direction, respectively and the effective noise figure of the remote node is about 7.5 dB. The 1 dB saturation point is measured around an input power to the remote node of ―10 dBm.
4.4.2 Test Parameters and Tasks of the Test-Bed
Different experimental investigations are performed in DS and US direction to evaluate the performance of the residential 10 Gbit/s system and the performance of the business 100 Gbit/s system (“core bandwidth in access”). The NRZ-OOK 10 Gbit/s ballast channels in DS direction as well as the NRZ-OOK 10 Gbit/s continuous-data operated signal in US direction (e.g. IQ-samples of a fronthaul wireless data stream) are not evaluated.
We investigate the following items:
Figure 4.18. SOA remote node. Gain of “remote note” input to output: @ 1531nm: about 20.5dB (-20dBm input)
@ 1551nm: about 20.5dB (-20dBm input)
NF of “remote note” input to output: about 7.5dB
1:2 splitter
3dB att.
SOA 2
SOA 4
SOA 3
SOA 5
SOA 1
CWDM
1531nm
CWDM
1551nm
CWDM
1531nm
CWDM
1531nm
CWDM
1551nm
Amplification Stage 1 1:4 Splitter Amplification Stage 2
co.
pass refl
passrefl
pass refl
passrefl
refl
co.
co.
co.
co.
G3558309
171: 500mA, 15 C
G3682881
041: 500mA, 15 C
G3682833
206: 500mA,20 C
G3417241174: 500mA,20 C
207: 500mA,20 C
DS
US pass
FP7 – ICT – GA 318137 35 DISCUS
Residential 10 Gbit/s Service
OLT1,2 to ONU1,2 performance evaluation in downstream and upstream
Bit-error ratio (BER) measurements, loss budget evaluation, optical signal-to-
noise ratio (OSNR) measurement, spectra and eye diagram documentation
Influence from 100 Gbit US business service and from “rival” ballast channels
US dynamic tests (loud/soft burst ratio) evaluation (BER measurement)
Investigate influence from noise funnelling in US (switch on/off SOA1)
Business 100 Gbit Service
Evaluate performance of 100 Gbit/s transceiver in US direction
BER measurements
Take spectra and constellation diagrams
Investigate influence from noise funnelling in US (switch on/off SOA1)
Influence from 10Gbit/s “wireless” ballast channels
Influence from 10Gbit/s residential service loud/soft burst ratio in US
4.4.3 Experimental Test Results of the SOA-based Remote Node
Loss budget analysis
A loss budget to allow for 74 km SMF fibre transmission and to bridge a 1:512 split ratio is achieved in the experiments. The performance of the various DS and US services are evaluated at this operating point.
Detailed analysis: The launch power to the feeder (backhaul) fibre in DS direction is +0.7 dBm/ch for the OLT1 test channel. The measured power level behind the first CWDM-filter is ―1 dBm/ch and ―16 dBm/ch behind the 62 km SMF fibre span. This power level is also the input power to the remote node. Note that the total input power to the SOA-based remote node is approximately 12 dB larger. The output power of the remote node is +1 dBm/ch. The power level behind the 12 km ODN fibre span is measured to be ―1.5dBm/ch. The remote node already contains a 2:4 splitter so that a loss budget of 21 dB is required (assuming 3 dB/split stage) to achieve a total split of 1:512 (4 x 128). Thus, the input power to the ONU is adapted to be ―22.5dBm/ch. The 5 dB losses of the circulator and the filter as part of the ONU are not included in the loss budget. However, ―27.5 dBm/ch is impinging the APD inside the ONU receiver providing some margin compared to the back-to-back APD sensitivity at a BER of 1E―3 of about ―30 dBm.
In US direction, the launch power to the ODN fibre is +5 dBm/ch for ONU1 and ONU2. The losses for the 12 km ODN fibre span and the 21 dB losses for the 1:128 split ratio induce total losses of 23.5 dB, i.e. an input power of ―18.5 dBm/ch into the remote node amplifier should be obtained in the best case. However, in our experiments, we even managed to operate the system with an input power of ―21.6 dBm/ch. into the remote node allowing for a higher loss budget. The total power to the remote node is about 12 dB larger in the case that a 0 dB burst ratio is measured and it is even larger for a burst ratio >0 dB. A launch power to the feeder fibre of ―4.6 dBm/ch is achieved, so that ―21 dBm/ch is available into the M/C node EDFA US amplifier, i.e. behind the 62 km feeder fibre and the CWDM filter. This power level is sufficient to provide few dB of margin compared to BtB sensitivity requirements of about ―29 dBm at a BER of 1E―3. Similar power levels are available for the 100 Gbit/s system.
Results for the Residential 10 Gbit/s Service
FP7 – ICT – GA 318137 36 DISCUS
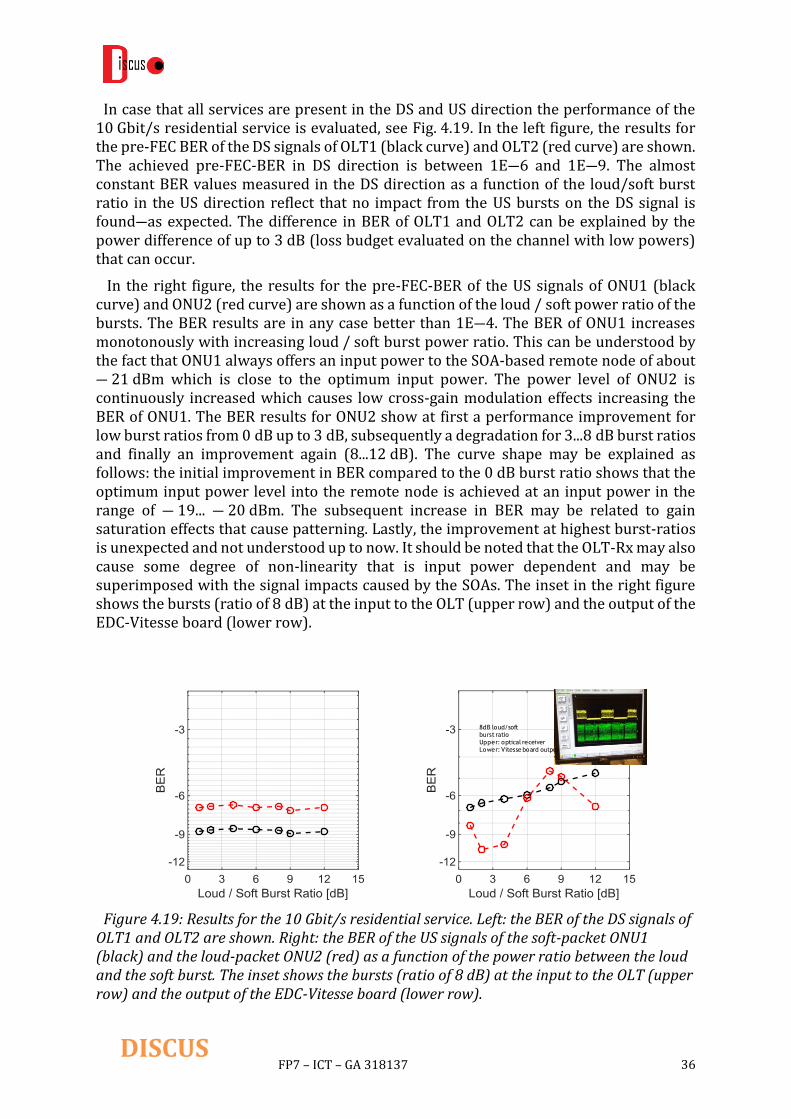
In case that all services are present in the DS and US direction the performance of the 10 Gbit/s residential service is evaluated, see Fig. 4.19. In the left figure, the results for the pre-FEC BER of the DS signals of OLT1 (black curve) and OLT2 (red curve) are shown. The achieved pre-FEC-BER in DS direction is between 1E―6 and 1E―9. The almost constant BER values measured in the DS direction as a function of the loud/soft burst ratio in the US direction reflect that no impact from the US bursts on the DS signal is found―as expected. The difference in BER of OLT1 and OLT2 can be explained by the power difference of up to 3 dB (loss budget evaluated on the channel with low powers) that can occur.
In the right figure, the results for the pre-FEC-BER of the US signals of ONU1 (black curve) and ONU2 (red curve) are shown as a function of the loud / soft power ratio of the bursts. The BER results are in any case better than 1E―4. The BER of ONU1 increases monotonously with increasing loud / soft burst power ratio. This can be understood by the fact that ONU1 always offers an input power to the SOA-based remote node of about ― 21 dBm which is close to the optimum input power. The power level of ONU2 is continuously increased which causes low cross-gain modulation effects increasing the BER of ONU1. The BER results for ONU2 show at first a performance improvement for low burst ratios from 0 dB up to 3 dB, subsequently a degradation for 3...8 dB burst ratios and finally an improvement again (8...12 dB). The curve shape may be explained as follows: the initial improvement in BER compared to the 0 dB burst ratio shows that the optimum input power level into the remote node is achieved at an input power in the range of ― 19... ― 20 dBm. The subsequent increase in BER may be related to gain saturation effects that cause patterning. Lastly, the improvement at highest burst-ratios is unexpected and not understood up to now. It should be noted that the OLT-Rx may also cause some degree of non-linearity that is input power dependent and may be superimposed with the signal impacts caused by the SOAs. The inset in the right figure shows the bursts (ratio of 8 dB) at the input to the OLT (upper row) and the output of the EDC-Vitesse board (lower row).
Figure 4.19: Results for the 10 Gbit/s residential service. Left: the BER of the DS signals of OLT1 and OLT2 are shown. Right: the BER of the US signals of the soft-packet ONU1 (black) and the loud-packet ONU2 (red) as a function of the power ratio between the loud and the soft burst. The inset shows the bursts (ratio of 8 dB) at the input to the OLT (upper row) and the output of the EDC-Vitesse board (lower row).
8dB loud/soft
burst ratio
Upper: optical receiver
Lower: Vitesse board output

FP7 – ICT – GA 318137 37 DISCUS
Additionally, we investigated the influence from a continuous-data and burst-operation in upstream direction. The result for ONU1 shows that no significant influence is experienced: BER of 9.4e―8 in cw-mode and a BER of 1.4e―7 in burst-mode.
The influence from noise funnelling is also investigated. At a fixed loud / soft burst ratio of 8 dB, we evaluated the BER performance of ONU1 and ONU2
for the case that all systems are switched on: ONU1: 3E―6 and ONU2: 2.3E―5
for the case that the 10 G NRZ system in US is off, but SOA1 is on: ONU1: 1.9E―6
and ONU2: 9.3E―5
for the case that SOA1 is switched off: ONU1:5.3E―7 and ONU2: 8.6 E―6.
Obviously, the influence from NoFu is lower than expected from the experiments and theoretical investigations performed in the DISCUS deliverable D4.11, section 3.3.3, 6.2. The decrease in OSNR by switching SOA1 on is about 1.7 dB only (expected 4.5 dB). A possible explanation of this occurrence is a clamping of the US SOAs by DS channels (limited CWDM-DS/US filter suppression ratio). In a general case in which NoFu would cause a larger impact, a careful power management of the US transmitters using power levelling would improve the BER, e.g. performing individual optimization of services with OSNR or power level at the OLT receiver.
Results for the Business 100 Gbit/s Service
The BER results of the 100 Gbit/s DP-QPSK service as a function of the loud / soft burst ratio of the residential 10 Gbit/s service is shown in Fig. 4.20. The pre-FEC-BER results are always better than 1E―3 as long as the burst ratio is below 9 dB (no frame losses detected after FEC used). A monotonic decrease in BER performance is visible for an increasing burst ratio. A constellation diagram is shown on the right in Figure 4.20 for the two polarizations at a burst ratio of 8 dB and a pre-FEC BER of 1.9E―4.
Figure 4.20. Results for the 100 Gbit/s business service. Left: the BER of the 100 Gbit/s DP-QPSK signal as a function of the loud / soft burst ratio of OLT1 and OLT2; Right: constellation diagram for the two polarizations at a burst ratio of 8 dB and a pre-FEC BER of 1.9E–4.
100G received signal:
Pre-FEC BER: 1.9E-4
8dB burst-ratio

FP7 – ICT – GA 318137 38 DISCUS
The BER results can be explained by the fact that with increasing power of the loud-packet from ONU2, the gain of the SOAs will be reduced which causes a phase change induced by the SOA’s alpha-factor causing a phase error on the 100 Gbit/s QPSK system. This phase error increase as a function of the gain suppression (burst ratio) can be seen in Figure 4.21. Obviously, the phase error at a 12 dB burst ratio (right figure) is significantly larger compared to the phase error at a 4 dB burst ratio (left figure).
Spectra
To investigate the influence of the filters and to document the co-existence of the various services in DS and US direction, spectra are measured at different locations along the paths, as shown in Figure 4.22. The left figure shows the spectrum of the US signals behind the 12 km ODN fibre, i.e. at the input to the remote node (branch of SOA5). The figure in the middle shows the spectrum of the US signal at the M/C node input, i.e. in front of the EDFA located within the M/C node. The right figure shows the spectrum of the DS signal at the input to the ONU’s.
First, it becomes obvious that the CWDM-filter cuts the outermost US and DS ballast wavelengths, respectively, i.e. reducing slightly the total input power to the SOAs. However, this effect is expected to improve the BER results just marginally. Second, Rayleigh backscattering seems to occur, see e.g. presence of the DS signals in the US direction, see the middle figure: 1531 nm DS signals present in the US direction (1551 nm). It should be mentioned that the influence on the system performance needs more investigations.
Figure 4.21. Constellation diagram of the 100 Gbit/s service at a burst ratio of 4 dB and 12 dB.
12dB burst ratio4dB burst ratio
Figure 4.22. Spectra at different location of the US and DS.
US signals at SOA Remote Note
input behind 12km ODN fiber US signals at EDFA input in
M/C node
50GHz ASE
power ballast
10G
TD
M100G
D-Q
PSK
10G
NRZ O
OK
DS signals at ONU input
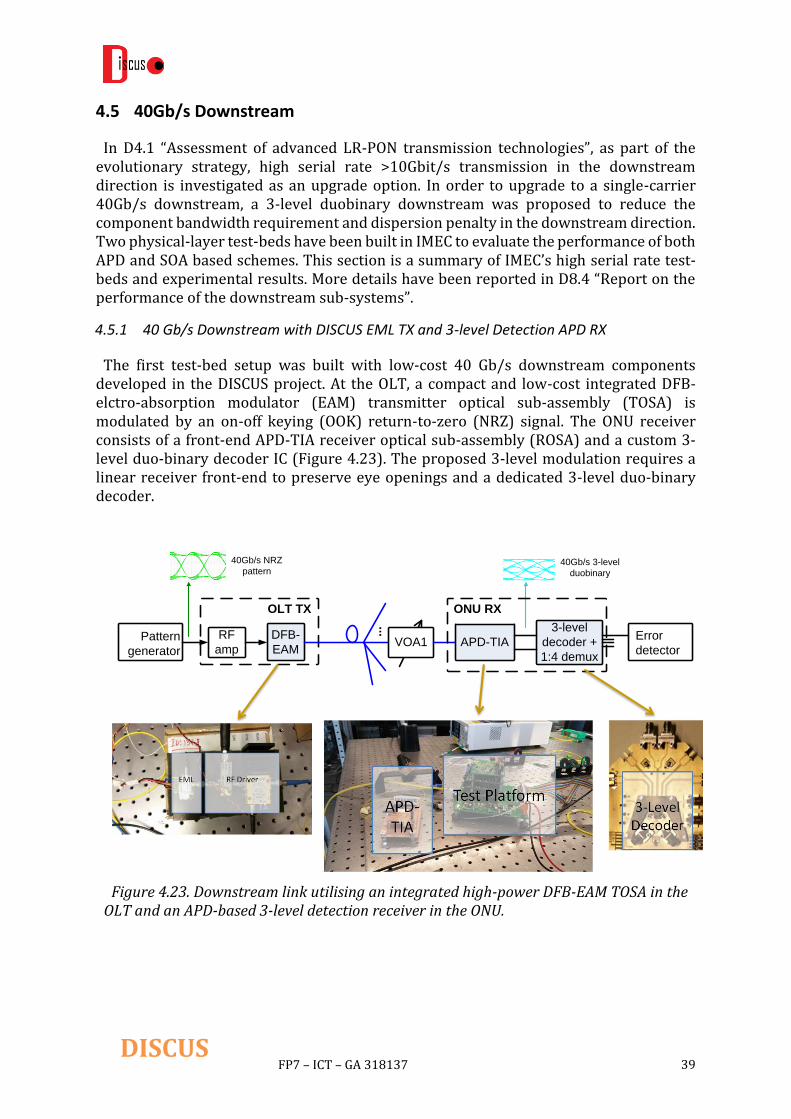
FP7 – ICT – GA 318137 39 DISCUS
4.5 40Gb/s Downstream
In D4.1 “Assessment of advanced LR-PON transmission technologies”, as part of the evolutionary strategy, high serial rate >10Gbit/s transmission in the downstream direction is investigated as an upgrade option. In order to upgrade to a single-carrier 40Gb/s downstream, a 3-level duobinary downstream was proposed to reduce the component bandwidth requirement and dispersion penalty in the downstream direction. Two physical-layer test-beds have been built in IMEC to evaluate the performance of both APD and SOA based schemes. This section is a summary of IMEC’s high serial rate test-beds and experimental results. More details have been reported in D8.4 “Report on the performance of the downstream sub-systems”.
4.5.1 40 Gb/s Downstream with DISCUS EML TX and 3-level Detection APD RX
The first test-bed setup was built with low-cost 40 Gb/s downstream components developed in the DISCUS project. At the OLT, a compact and low-cost integrated DFB-elctro-absorption modulator (EAM) transmitter optical sub-assembly (TOSA) is modulated by an on-off keying (OOK) return-to-zero (NRZ) signal. The ONU receiver consists of a front-end APD-TIA receiver optical sub-assembly (ROSA) and a custom 3-level duo-binary decoder IC (Figure 4.23). The proposed 3-level modulation requires a linear receiver front-end to preserve eye openings and a dedicated 3-level duo-binary decoder.
Figure 4.23. Downstream link utilising an integrated high-power DFB-EAM TOSA in the OLT and an APD-based 3-level detection receiver in the ONU.
DFB-
EAM
RF
ampPattern
generator
Error
detector
OLT TX
VOA1 APD-TIA
3-level
decoder +
1:4 demux
ONU RX
40Gb/s NRZ
pattern40Gb/s 3-level
duobinary
...

FP7 – ICT – GA 318137 40 DISCUS
The measured results were submitted to OFC’16 and accepted for oral presentation [3]. Figure 4.24(a) shows the measured eye-diagram for 20 Gb/s NRZ, 25 Gb/s NRZ, 30 Gb/s NRZ, and 35 Gb/s NRZ. The measured BER curves for those NRZ signals are shown in Figure 4.24(c). The optical power shown here is measured at the input of the APD-TIA (after the VOA). As shown in Figure 4.24(c), NRZ signaling works relatively well when the downstream rate is less than 35 Gb/s. At 35 Gb/s we noticed a decreased performance (measured sensitivity of -17.3 dBm at pre-FEC threshold 1×10⁻³) due to the inter-symbol interference (ISI), which is clearly indicated by the received eye-diagram. Figure 4.24(b) shows the measured 40 Gb/s 3-level duo-binary eye-diagram at the output of the APD-TIA with two open eyes. The 3-level decoder IC was then integrated in the setup and the BER was measured at one of the 4 CML output channels at 10 Gb/s. The measured BER curves for 3 different APD gain settings (i.e. different VAPD voltages) are depicted in Figure 4.24(d). We found that 21.5 V was the optimal VAPD voltage, where the APD gain was around 6.1 dB. Further increasing the VAPD voltage above VAPD,OPT reduces the receiver bandwidth, introducing more ISI in the output eye-diagram and causing sensitivity deterioration. Using the optimal VAPD voltage, the 40 Gb/s 3-level detection experienced a sensitivity improvement of 2.3 dB with respect to 35 Gb/s NRZ transmission. The measured sensitivity of -19.6 dBm at BER=1×10⁻³ resulted in a power budget of 23.4 dB in B2B. Next, we have evaluated the 40 Gb/s 3-level duo-binary link as a function of dispersion. The measured power penalties versus various dispersion values are shown in Figure 4.24(e) together with simulated results in [4]. The positive dispersion points were measured with various lengths of standard single-mode fibre (SSMF), while the negative dispersion points were measured with a tuneable dispersion emulator. We also cross-checked the results of positive dispersion using both the SSMF
Figure 4.24. Experimental results: (a) received NRZ eye-diagrams at the APD-TIA output for different line rates. (b) received 40 Gb/s 3-level duo-binary eye-diagram at the APD-TIA output. (c) measured NRZ BER curves in B2B. (d) optimization of APD gain for 40 Gb/s 3-level duo-binary downstream. (e) measured link power penalty in terms of dispersion in comparison of simulation results.
RX 25Gb/s NRZ
RX 30Gb/s NRZ RX 35Gb/s NRZ
(a) (b)
(c)
FEC Threshold
(e)
RX 40Gb/s 3-level duo-binary
(d)
2.3 dB
FEC Threshold
RX 20Gb/s NRZ
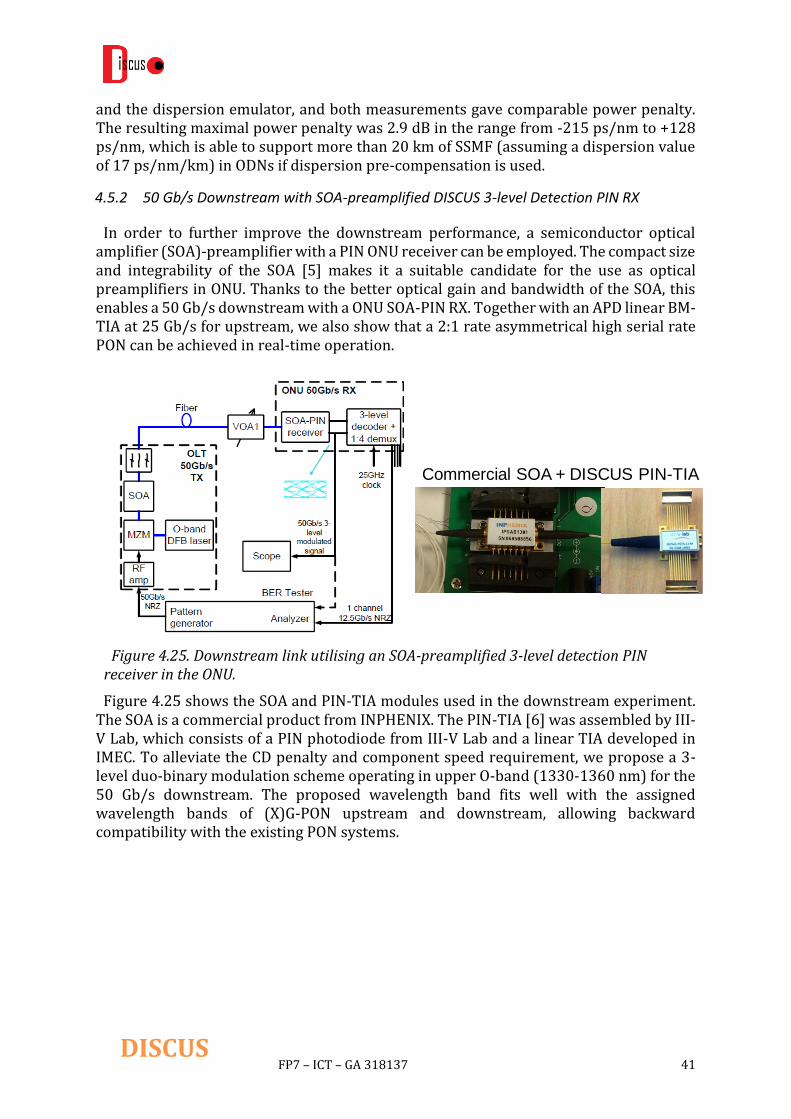
FP7 – ICT – GA 318137 41 DISCUS
and the dispersion emulator, and both measurements gave comparable power penalty. The resulting maximal power penalty was 2.9 dB in the range from -215 ps/nm to +128 ps/nm, which is able to support more than 20 km of SSMF (assuming a dispersion value of 17 ps/nm/km) in ODNs if dispersion pre-compensation is used.
4.5.2 50 Gb/s Downstream with SOA-preamplified DISCUS 3-level Detection PIN RX
In order to further improve the downstream performance, a semiconductor optical amplifier (SOA)-preamplifier with a PIN ONU receiver can be employed. The compact size and integrability of the SOA [5] makes it a suitable candidate for the use as optical preamplifiers in ONU. Thanks to the better optical gain and bandwidth of the SOA, this enables a 50 Gb/s downstream with a ONU SOA-PIN RX. Together with an APD linear BM-TIA at 25 Gb/s for upstream, we also show that a 2:1 rate asymmetrical high serial rate PON can be achieved in real-time operation.
Figure 4.25 shows the SOA and PIN-TIA modules used in the downstream experiment. The SOA is a commercial product from INPHENIX. The PIN-TIA [6] was assembled by III-V Lab, which consists of a PIN photodiode from III-V Lab and a linear TIA developed in IMEC. To alleviate the CD penalty and component speed requirement, we propose a 3-level duo-binary modulation scheme operating in upper O-band (1330-1360 nm) for the 50 Gb/s downstream. The proposed wavelength band fits well with the assigned wavelength bands of (X)G-PON upstream and downstream, allowing backward compatibility with the existing PON systems.
Figure 4.25. Downstream link utilising an SOA-preamplified 3-level detection PIN receiver in the ONU.
Commercial SOA + DISCUS PIN-TIA
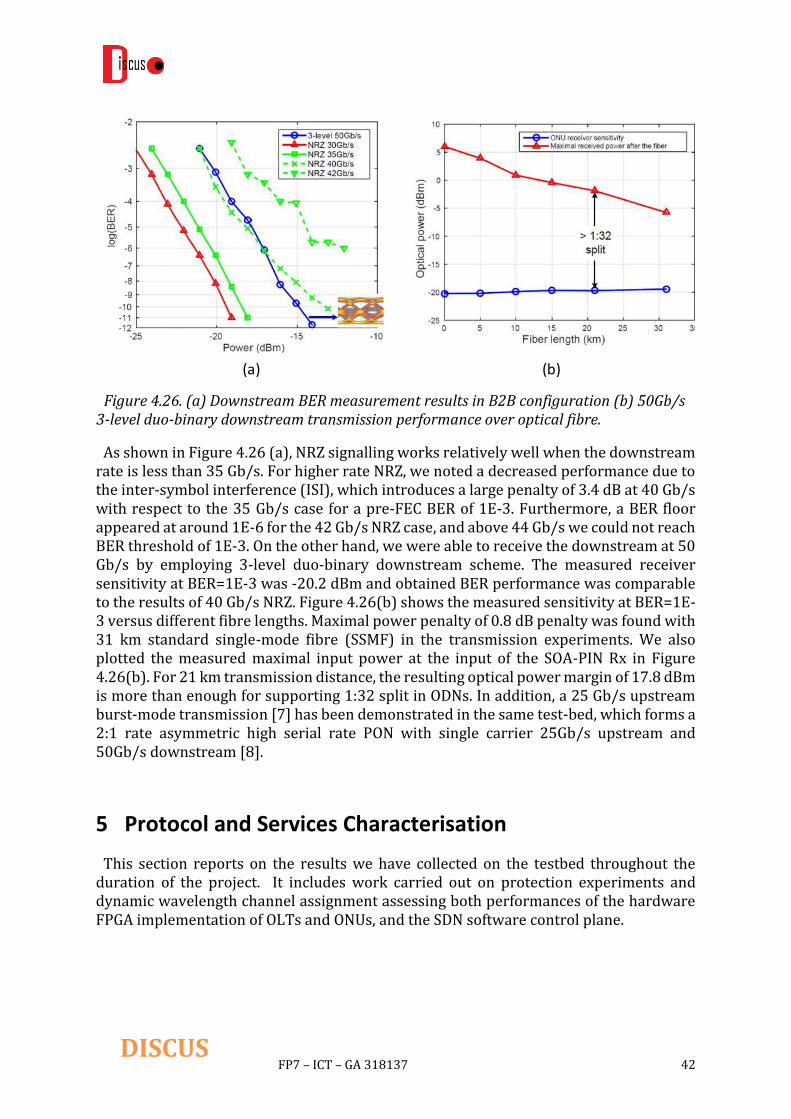
FP7 – ICT – GA 318137 42 DISCUS
As shown in Figure 4.26 (a), NRZ signalling works relatively well when the downstream rate is less than 35 Gb/s. For higher rate NRZ, we noted a decreased performance due to the inter-symbol interference (ISI), which introduces a large penalty of 3.4 dB at 40 Gb/s with respect to the 35 Gb/s case for a pre-FEC BER of 1E-3. Furthermore, a BER floor appeared at around 1E-6 for the 42 Gb/s NRZ case, and above 44 Gb/s we could not reach BER threshold of 1E-3. On the other hand, we were able to receive the downstream at 50 Gb/s by employing 3-level duo-binary downstream scheme. The measured receiver sensitivity at BER=1E-3 was -20.2 dBm and obtained BER performance was comparable to the results of 40 Gb/s NRZ. Figure 4.26(b) shows the measured sensitivity at BER=1E-3 versus different fibre lengths. Maximal power penalty of 0.8 dB penalty was found with 31 km standard single-mode fibre (SSMF) in the transmission experiments. We also plotted the measured maximal input power at the input of the SOA-PIN Rx in Figure 4.26(b). For 21 km transmission distance, the resulting optical power margin of 17.8 dBm is more than enough for supporting 1:32 split in ODNs. In addition, a 25 Gb/s upstream burst-mode transmission [7] has been demonstrated in the same test-bed, which forms a 2:1 rate asymmetric high serial rate PON with single carrier 25Gb/s upstream and 50Gb/s downstream [8].
5 Protocol and Services Characterisation
This section reports on the results we have collected on the testbed throughout the duration of the project. It includes work carried out on protection experiments and dynamic wavelength channel assignment assessing both performances of the hardware FPGA implementation of OLTs and ONUs, and the SDN software control plane.
Figure 4.26. (a) Downstream BER measurement results in B2B configuration (b) 50Gb/s 3-level duo-binary downstream transmission performance over optical fibre.
(a) (b)

FP7 – ICT – GA 318137 43 DISCUS
5.1 Protection experiments
A significant aspect of network design is that of providing protection mechanisms, which are essential to ensure adequate network availability. However, providing redundancy adds costs to the network and so protection mechanisms are mainly limited to the core and metro networks where the cost of adding redundancy to the network can be shared among many users. Access networks for residential users are typically unprotected, and this is reflected in the terms of Service Level Agreements (SLAs) which generally allow for service restoration times of days or weeks. Access networks for business users can instead operate on much stricter SLAs, although businesses normally apply for private line connections and incur high cost to guarantee protection. While ultra-high availability can still be guaranteed to customers willing to absorb its cost through bespoke solutions, a multi-service access network as the one envisaged above requires offering adequate protection at acceptable price in order to satisfy a wide variety of services and customers.
This is especially true for architectures like LR-PON that provide cost savings by promoting larger customer aggregation and bypass of transmission networks that are normally protected: thus special consideration needs to considered to ensure appropriate protection strategies.
Over the course of the Discus project we investigated end-to-end service restoration times for networks using our next generation LR-PON and our SDN controlled control plane for Access and core networks. We did this by implementing and evaluating the three protection scenarios shown in Figure 4.27, namely 1+1 Protection, 1:1 Protection and N:1 projection of the PON access network.
Our first experiment looked at 1+1 protection mechanisms in the LR-PON [9]. 1+1 protection for LR-PON is showed in Figure 4.27(a); this requires downstream data to be replicated at both the primary and backup OLT, and also requires a dedicated backup OLT to remain active to monitor the optical channel. In addition, if, like for the case shown in Figure 4.27(a), the protection is through dual homing, traffic is also replicated through the core.
In our experiments we showed that the PON protocol together with hardware optical monitoring could re-establish control of all ONUs on the PON in as little as 4 - 5ms.
Figure 4.27. A comparison of 1+1, 1:1 and N:1 protection schemes.

FP7 – ICT – GA 318137 44 DISCUS
Although this result represents the fastest possible switchover time when working with the LR-PON, this method also increases the cost of the network as extra capacity is needed both in the access and in the core to duplicate the downstream traffic.
We then progressed this work by showing a 1:1 protection scheme that removed the need for duplicated data in the core [10], see Figure 4.27(b). After failure, our mechanism would restore service in the access while also re-routing traffic through the core. Our experiments showed protection times of 125ms, when re-routing core traffic through a PAN-European core network, although we also made propositions that this could be reduce to about 40 ms by optimizing the controller and reducing the network latency to a more realistic level.
In order to fulfil the goal of the DISCUS architecture to provide cost effective end-to-end solutions for ubiquitous optical access networks, we further expanded our LR-PON protection mechanisms towards dual-homed N:1 protection [11], where each backup OLT can be shared among a number of primary OLTs. As shown in Figure 4.27.(c) in the event of a failure the backup OLT is allocated to the failed PON and data is re-routed to the backup node. Furthermore, the backup OLT is located at a different location to the primary OLT (i.e., dual-homed to a different Metro-Core node) and utilises a backup feeder fibre path. Thus, unlike co-located backup OLTs which only protect the network from OLT board failure, this scheme protects against fibre dig-ups, OLT failure and metro node failure. Since the N:1 protection experiment represents the culmination of all of the work carried out on protection and indeed represents the most realistic and cost effective solution we will only give details of the N:1 projection experiments here. The LR-PON hardware is implemented on Xilinx VC709 boards. The PON hardware is a partial implementation of the XG-PON standard, modified where necessary to allow for longer reach and higher split ratios needed by the Discus architecture. Full details of the FPGA hardware a given in D4.12. Further details of the N:1 protection experiment can be found here [12].
We tested our end-to-end protection service with dual-homed, N:1 backup OLT sharing by combining the optical architecture testbed in Trinity College Dublin and the GÉANT pan-European research network, as shown in Figure 4.28Error! Reference source not found.. The testbeds are connected through two dedicated GE links. Although this link is well below the 10Gb capacity of the LR-PON, having dedicated data links allows us to reliably evaluate latency effects between diverse network elements and the higher-level control layers. The experiment replicates both the metro-access and core networks of a high-speed fixed line telecommunications network. The end-points replicate a data centre generating traffic (located in Frankfurt) and a reception or termination point located on a PON ONU in Dublin. The Metro-Access portion of the network is created in the Optical Network Architecture (ONA) lab in Trinity College Dublin. The Core network is replicated using the GÉANT Openflow testbed facility, which spans continental Europe.

FP7 – ICT – GA 318137 45 DISCUS
The GÉANT OpenFlow facility is a test-bed environment deployed on top of the GÉANT production network. The facility is built on network resources such as software-based OVSwitch OpenFlow switches and interconnecting network links. It is collocated with five of the Points-of-Presence in Vienna (AT), Frankfurt (DE), London (UK), Amsterdam (NL) and Zagreb (HR). The OFELIA Control Framework (OCF) is used by the GÉANT OpenFlow facility to manage requests for slice submission, instantiation, and decommissioning. OCF is a set of software tools for testbed management, which controls the experimentation life cycle such as resource reservation, instantiation, configuration, monitoring.
A server co-located at the DE node acts as the source for data in this experiment. The primary data path in the core is between nodes DE, AT and NL (shown in green in Figure 4.28). The backup path follows the route: DE, HR and UK (shown in red in Figure 4.28). We implement two paths to emulate dual-homed PON network where the primary and the backup OLT are in different locations. Data on the primary data path is routed to the Primary OLT and data on the backup link is routed to the backup OLT. The NL node also hosts the Openflow core network controller which can be used to control which of the two paths data takes to our access network.
The TCD ONA (Optical Network Architecture) is setup as two Metro/Core nodes together with an LR-PON access network. Although we have used one physical switch and server, they are both virtualized to represent independent MC node switches and controllers. The Metro/Access network comprises of a pronto 3780 switch, running release 2.2 (Openflow v1.3 compatible firmware), three Xilinx vc709 development boards, acting as primary OLT, backup OLT and ONU, a glimmerglass MEMs-based optical fibre switch, A Dell T620 with 10G SFP+ cards acting as client machine attached to the ONU and a separate Dell R320 Server acting as access Openflow controller. The Pronto switch is configured as multiple virtual bridges to act as standalone bridges each with a separate Openflow controller. These are connected to a gateway machine on the core side of the network and one of the Primary or backup OLTs on the access side.
The two testbeds, TCD and GÉANT are connected via two dedicated 1Gb links to UK and NL respectively. In our previous experiment in 1:1 protection we utilized tunnelling over the internet for these links. This added a variance to our results that was very hard to measure and account for in our results. Although the dedicated 1Gb links are well below the 10Gb capacity of the GÉANT and TCD testbeds they do offer a stable link that enables us to carry out the protection experiments to the desired precision. The glimmerglass optical switch is connected between the backup-OLT and the ONU which allows the
Figure 4.28. Logical view of combined LR-PON access and SDN Core Network.
FP7 – ICT – GA 318137 46 DISCUS
backup OLT to switch between a number of different PONs allowing us to test the N:1 protection timing. In order to extend Message Queue from TCD testbed to GÉANT, we implemented tunnels to NL and DE.
The TCD ONA testbed has been designed to ensure all tests are easily reproducible, regardless of when they are run and by whom. All testbed components are completely programmable using a Python (v2.7) based object Framework. This allows us to centrally control all testbed components so that test scenarios can be set up quickly and consistently. Likewise all test components log information to a central repository, with clear and consistent messages and time stamps, allowing us to run test scenarios repeatedly allowing for statistical analysis of means and deviations of measurements.
In this scenario, a Python scenario script is initially used to check the status of all relevant components. It uploads a bootstrap configuration to an Openflow Switch, sets up the Openflow controllers, sets up the event logger, configures the optical switch and flashes the FPGA images. The OpenVSwitch (OVS) is restarted and connected to the controller. The switches and ports are defined and associated with the OVS instance. For each switch, the required flows are configured. The testbed controller then links to the OLT and ONU microprocessors to ensure the PON is operational. Finally, the data service on the DE node of the GÉANT network is enabled and end to end operation of the system is confirmed.
Once the experiment starts, data start flowing over the primary link from node DE through AT and NL to our testbed and through the PON to the data sink connected to the ONU. After some time a trigger signal is sent to the primary OLT FPGA which resets the optical channel to simulate a fibre dig up. At this stage the protocol hardware is unaware of the break and packets are lost. The failure detection timeout timer starts and, when it expires, the primary OLT issues an alarm which is sent in band upstream to the Openflow controller. The Openflow access network controller notifies the optical switch to connect the backup OLT path to the failed PON and finally the management controller notifies the backup OLT to take control of the PON. The ONU meanwhile has entered the Loss of Downstream Sync state and will remain there for 100ms or until the backup OLT begins to send synchronization words downstream. If the backup OLT does not take over before the 100ms time out the entire PON will have to be reactivated, and re-ranged to resume transmitting data. Once the backup OLT has taken control of the PON the PON is ready to start receiving data again.
In parallel with the backup OLT taking control of the PON, the Openflow access network controller passes a message to the core network Openflow controller. This causes the core network to redirect data from the primary path to the backup path to emulate more closely the dual homed nature of the Long-Reach PON. When data services resume data is now flowing over the backup-path from DE to HR, UK through our backup OLT to the ONU. Since each of the packets being sent on the PON has a sequence number the ONU can easily work out how many packets were dropped during the switchover. Once this number has been calculated the scenario script is ready to restart a new iteration of the experiment.
Figure 4.29 shows the end to end N:1 dual homed protection time of the LR-PON and SDN core over 50 experimental iterations, using the initial break in the fibre as a reference point. The figure also shows the timing of various events that occur during the protection switch for all 50 experimental iterations.

FP7 – ICT – GA 318137 47 DISCUS
Since the trigger failure event was issued to the FPGA board over a UART it was not possible to read an absolute time value from the FPGA boards for when the break in the primary fibre occurred. However, we were able to work back from the restoration point of traffic by subtracting the outage duration within each cycle. On average, the alert that identifies loss of the primary PON (the E2 event in the figure) occurs 3.5ms after the break. The Openflow controller within the TCD ONA testbed sees the alert 0.59ms (E3) after this and publishes a NetEvent failure alert as well as a GlimEvent event. The NetEvent alerts the GÉANT controller to invoke the alternate path through the core. The GlimEvent event invokes the secondary path in the optical switch. Within this experiment, the GÉANT controller sees the NetEvent event 20.3 ms after the initial failure (E5). Separately, we have measured the asynchronous switchover of the Glimmerglass optical switch as 23ms. Overall, Restoration time of the data traffic is measured as 81.29ms.
The analysis of the path restoration time can be split into three distinct phases. These are the time it takes to detect a failure on the network, the access network recovery time and the core network recovery time. In Figure 4.30 we show how these times stack up to give the 81ms protection figure. As discussed previously the hardware monitoring at the OLT can detect a failure in the network in about 2.5 ms. We can see from the results in Figure 4.29 that a further 1ms is taken for the alarm packet to be created and sent to the Metro core node switch.
We found the access recovery time to be approximately 30 ms, which can be further broken down into time required to tune the optical switch (23 ms) and time needed by protocol to re-establish downstream synchronization (2-3 ms). From our previous work we know that some time may be needed to re-range the ONUs in addition to the synchronization time (between 2 and 4 ms), however in this work we assume that ranging to the backup OLT can be done during normal operation of the PON. The remaining time is needed by the local Openflow controller to communicate with the optical switch to connect the backup OLT.
The core network recovery time happens in parallel to the access network recovery time. The core controller sees the failure event approximately 20 ms after it happens. It then begins to reconfigure the network to reroute data to the backup path. Since we know the latency of this path is approximately 50 ms we can calculate that core network switch over takes approximately 10 ms.
Figure 4.29. Switchover time (milliseconds) for 50 iterations of N:1 protection experiment.

FP7 – ICT – GA 318137 48 DISCUS
The same experiment was reproduced at the final DISCUS demonstration at the Tyndall laboratories where the N:1 access protection test was carried out on the fully integrated demonstrator. The test described in section Error! Reference source not found. and shown in Fig. 2.1, involved the integration of the TCD development of OLT and ONU protocols on FPGA boards, switching access node architecture, SDN access network controller, orchestrator and service portal with the full physical LR-PON physical layer developed by the Tyndall group and described in Error! Reference source not found.. The demonstration showed that the effect of a fibre cut on the display of a UHD video-on-demand service was minimal, showing a service recovery time of the order of 1 to 2 seconds.
5.2 Dynamic wavelength channel assignment
This section describes the tests we carried out in our laboratory at Trinity College Dublin for performance evaluation of our SDN-controlled DWA service.
Figure 4.31 shows the interaction of the control plane components implementing the DWA scenario. While our implementation has focused on the access network controller, we have implemented a lightweight network orchestrator to handle communication to/from the SP (shown in the figure as a Web Portal) and to/from the access controller. We have also implemented a simple OpenFlow-based core controller to enable testing of scenarios through Openflow core networks.
A user can submit (step 1) a service request via a portal indicating the service type (committed and peak capacity, wavelength range and channel allocation type – e.g., shared vs. dedicated), and destination. The request to the portal is passed to the SP, which forwards the request to the network orchestrator (step 2). The orchestrator finds the access node controller where the user is located and forwards the request (step 3). The access controller needs to assess how the capacity can be provided to the user, considering the preferences and abilities expressed by the user (step 4). For example the user might require capacity on a shared channel, but the current channel might not have enough capacity to satisfy the request. The user’s ONU can thus be moved to a different
Figure 4.30. Breakdown of approximate N:1 protection events and timing.

FP7 – ICT – GA 318137 49 DISCUS
channel, provided it is able to tune to one of the available channels. If the capacity is available the access controller proceeds to configure the access switch, OLT and ONU to carry out the connection (step 5) and then confirms the service request to the orchestrator (step 6). The orchestrator confirms the request to the SP, which will pass the information to the web portal to give feedback to the user (step 7).
The main scope of this scenario is to show the dynamic provisioning of a new end-to-end path across the node, thus creating a new flow entry (comprised of pseudowire (PW) and label-switched path (LSP) tags, as required) and also using multi-wavelengths allocation in the PON. This scenario assumes that user traffic is terminated at the MC node, i.e. does not cross transparently the node1.
The DWA experiment we describe here shows the dynamic provisioning of a service using an SDN controller with OpenFlow as southbound interface. It is assumed that while an ONU is receiving a service with a given reserved capacity (which we refer to as service-A) by an OLT (which we refer to as OLT-1), it also requests capacity for an additional service, for example Bandwidth-on-demand (which we refer to as service-B). The scenario is setup so that the wavelength channel used by the ONU does not have enough capacity to support the requested bandwidth-on-demand (BoD) service. The controller needs thus to activate a second OLT (which we refer to as OLT-2), in order to deliver service B. Since the ONU only has one (tuneable) transceiver, both services A and B need to be delivered over the same wavelength, by OLT-2. This implies redirecting service A to OLT-2, which requires communication with the SP to move service A into a different PW which can be routed to OLT-2. The aim of the experiment is to demonstrate the ability of OpenFlow and SDN to handle such end-to-end service provisioning and to measure the time required to provision service-B and the impairment generated for rerouting service-A.
1 Due to the high loss of the PON section, the signal is regenerated and then groomed into appropriate
core transmission channels.

FP7 – ICT – GA 318137 50 DISCUS
It should be noticed that this experiment focuses on the control plane activities rather than on the physical layer. Thus for example the tuneable lasers are tuneable DWDM SFP+ with fast tuning time and precise wavelength locking. While this might not represent the standard for current low-cost ONU devices, we argue that our results remain valid from a control plane timing perspective and additional delays could be accounted for in estimating overall provisioning time of lower-cost transceivers.
A logical view of the testbed components and operations is shown in Figure 4.32 showing the different steps required to provision the service2. Following the user request for a new BoD service-B, the Orchestrator forwards a JSON message to the OF controller (step 1) indicating the capacity requested and the range of wavelengths the ONU can support. Once the controller has verified the capacity availability it acknowledges the orchestrator, which communicates with SP2 to activate the new service-B and with SP1 to reroute service-A into a different PW (Step 2). The orchestrator then informs the core controller to add a new LSP path for routing service B to the correct MC node (step 3). In parallel the Metro-Access controller communicates with OLT-2 through the OpenFlow agent translating OF commands into proprietary control messages sent through the UART interface, indicating to activate its service on the desired wavelength.
The Metro Access controller prepares the physical and link layer between OLT-2 and the ONU. OLT-2 is instructed to set the frequency of its downstream tuneable laser and is given the explicit parameters used to bind the PW to the alloc_id for each of both service-A and service-B (step 4).
The OLT’s and ONU’s do not present native Openflow interfaces, but instead are controlled over a high-speed serial UART running at 406kbps. The Microblaze (i.e., a
2 Although we described the process in sequential steps, some of the actions described are actually
carried in parallel in order to speed up the provisioning process.
Figure 4.31. Dynamic provisioning of bandwidth-on-demand services.

FP7 – ICT – GA 318137 51 DISCUS
simple general purpose processor implemented in the FPGA hardware) on the host FGPA boards presents an interface for directly programming and interrogating PON control registers, which are then accessible over the high-speed UART interface. Run-time control of the PON is executed through the interfaces on OLT-1 and OLT-2 which in turn relay control instructions to the remote ONU using PLOAM messages. The run-time functionality includes configuration of the laser frequencies of the OLT and ONU tuneable lasers and DS tuneable filters, the configuration of alloc_id’s at the ONU for appropriate XGEM packets and the re-homing of ONU from OLT1 to OLT2.
An Openflow agent wrapper around both OLT-1 and OLT-2 was developed so as to present an Openflow v1.4 compatible interface to the Metro-Access Controller. Openflow v1.4 facilitates the control of optical parameters of OpenFlow compatible switches and devices through the ‘OFPPortModPropOptical’ method. These parameters include the transmission centre frequency or wavelength, a frequency offset from the centre frequency and the transmission power level (dB) and are a subset of those which we are looking to control within the PON. Because we need runtime control of additional non-standard parameters, we enhanced both the v1.4 protocol and the agent to allow configuration of the XGEM, Alloc_ID and PseudoWire tags associated to a given flow through the Metro-Access Controller. The controller then installs the new entry for the PW, including meter tables for QoS and capacity reservation in the switch flow table (step 5). In parallel, The Metro Access controller, through a PLOAM message from OLT-1, instructs the ONU to tune the filter to the new wavelength (step 6). A serial link between a secondary UART on the ONU and the tuneable filter, tunes the filter to the new wavelength thereby directing the signal to OLT2. (step 7).

FP7 – ICT – GA 318137 52 DISCUS
The timing results of the testbed experiment are reported in Figure 4.33, averaged over ten testbed runs. From the time the service is requested to the orchestrator (step 0), the orchestrator and access controller introduce a 363 ms processing delay (step 1 as reported in Figure 4.32), after which the access switch receives the OpenFlow commands for updating the PW tags (step 1). The PLOAM message containing the information on the new wavelength channel is then received and acknowledged by the ONU within 13 ms (step 2), triggering it to activate the tuneable filter and laser to the correct wavelength channel and causing the OLT-1 to de-register the ONU. Within additional 118 ms the new wavelength is operational and the ONU registered to the new OLT (step 3). The results show that existing services are only interrupted for about 118 ms, while the time required to provide connectivity to the new service is 494 ms.
Figure 4.32. (a) Operation of SDN control plane to provision service B while operating service A; (b) network state after provisioning os service B and redirection of service A to OLT2.

FP7 – ICT – GA 318137 53 DISCUS
6 Summary and conclusions
The results obtained on the LR-PON test-beds of the DISCUS architecture as part of the work carried out in task 8.4 were presented in this deliverable. Three different LR-PON architectures were tested at the physical layer using a simplified version of the protocol on a 10Gb/s symmetric up- and down-stream link. The test-bed implemented burst mode TDMA operation of the upstream with 2 ONUs transmitting in the same channel. Multichannel operation was also implemented using tuneable components. Although only a single channel could be tested at a time on the 10Gb/s link of ONUs and OLT, the network was fully loaded in up- and down-stream using ballast channels that emulated the presence of additional 16 PON channels. A high capacity 100G link was also tested on the same architectures, showing the possibility to overlay a core-like capacity link on the LR-PON infrastructure carrying also standard PON traffic in other channels. The wavelength domain was used to allocate a point-to-point 100Gb/s DP-QPSK link, which was tested with neighbouring PON channel on a 50GHz grid.
The different LR-PON architectures demonstrated, in the laboratory of Tyndall with the collaboration of ALUD, were: lollipop for densely populated areas and open-ring for rural, sparsely populated areas (both architectures using EDFAs as optical amplifier) and a
Figure 4.33. Timing diagram of the service activation experiment.
FP7 – ICT – GA 318137 54 DISCUS
lollipop architecture using SOAs. The three architectures have different advantages and disadvantages as explored in D2.1, D2.3 and D4.11. However, as demonstrated here they are able to support LR-PON of similar size with 512 users and overall lengths in the order of 100km.
As part of the evolutionary strategy, high serial rate >10Gbit/s transmission in the downstream direction has also been investigated, as an upgrade option, using a single-carrier 3-level duobinary 40Gb/s downstream. Two physical-layer test-beds have been built in IMEC to evaluate the performance of both APD and SOA based schemes. The test-bed using the APD receiver resulted in a power budget of 23.4 dB at BER=1×10⁻³ in B2B and with a maximal power penalty was 2.9 dB in the range from -215 ps/nm to +128 ps/nm. The test-bed using the SOA-PIN scheme was able to operated up to 50Gb/s using a duobinary signalling with an optical power margin of 17.8 dBm for 21 km transmission distance, enough for supporting 1:32 split in ODNs.
The protocol and control plane demonstration presented a software defined networking (SDN) control plane for highly dynamic service provision in a LR-PON system. Two scenarios were demonstrated: a fast protection switchover to a backup OLT due to a failure in the active backhaul link (for example a fibre cut) and a dynamic capacity assignment over time and wavelength domains. The fast protection was demonstrated in an end-to-end scenario with dual-homed, N:1 backup OLT sharing by combining the optical architecture test-bed in Trinity College Dublin and the GÉANT pan-European research network with an overall, restoration time of the data traffic measured as 81.29ms. The same scenario was also tested on the full physical layer of the LR-PON in the Tyndall National Institute laboratories integrating all the required functionalities in a single test-bed. The demonstration showed that the effect of a fibre cut on the display of a UHD video-on-demand service was minimal, showing a service recovery time of the order of 1 to 2 seconds.

FP7 – ICT – GA 318137 55 DISCUS
References
[1] P. Ossieur et al., “A 10Gb/s linear burst-mode receiver in 0.25m SiGe BiCMOS”, IEEE J. Solid-State Circuits, vol. 48, pp. 381-390, Feb. 2013.
[2] S. Porto et al., “Demonstration of 10 Gbit/s burst-mode transmission using a linear burst-mode receiver and burst-mode electronic equalization,” IEEE/OSA J. Opt. Commun., vol.7, no.1, pp.A118-A125, (2015).
[3] Xin Yin, Fabrice Blache, Bart Moeneclaey, Joris Van Kerrebrouck, Romain Brenot, Gertjan Coudyzer, Mohand Achouche, Xing-Zhi Qiu and Johan Bauwelinck, “40-Gb/s TDM-PON Downstream with Low-Cost EML Transmitter and 3-Level Detection APD Receiver”, accepted by OFC’16 for oral presentation.
[4] X. Yin, X. Z. Qiu, G. Torfs, C. Van Praet, R. Vaernewyck, A. Vyncke, J. Verbrugghe, B. Moeneclaey, M. Ruffini, D. B. Payne, and J. Bauwelinck, "Performance evaluation of single carrier 40-Gbit/s downstream for long-reach passive optical network," in Proceeding of 18th International Conference on Optical Network Design and Modeling (ONDM), (IEEE, 2014), pp. 162-167.
[5] C. Caillaud, P. Chanclou, F. Blache, P. Angelini, B. Duval, P. Charbonnier, D. Lanteri, G. Glastre, and M. Achouche, “Integrated SOAPIN Detector for High-Speed Short Reach Applications,” Journal of Lightwave Technology, vol. 33, no. 8, pp. 1596–1601, April 2015.
[6] DISCUS deliverable D5.6, “Report on 40Gb/s downstream duobinary transmitter and 10/40Gb/s APD-TIA test version module”.
[7] X. Yin, J. Verbist, T. De Keulenaer, B. Moeneclaey, J. Verbrugghe, X. Z. Qiu, and J. Bauwelinck, "25Gb/s 3-level burst-mode receiver for high serial rate TDM-PONs", OFC 2015, vol. Th4H.2, Los Angeles, CA, USA, March, 20-24, 2015, pp. 1-3.
[8] Xin Yin, Joris Van Kerrebrouck, Jochem Verbist, Bart Moeneclaey, Xing-Zhi Qiu, Johan Bauwelinck, Delphine Lanteri, Fabrice Blache, Mohand Achouche, and Piet Demeester, "An Asymmetric High Serial Rate TDM-PON with Single Carrier 25Gb/s upstream and 50Gb/s downstream", Journal of Lightwave Technology (JLT), accepted for publication.
[9] S. McGettrick et al., Ultra-fast 1+1 Protection in 10Gb/s Symmetric Long Reach PON. P.6.18, ECOC 2013.
[10] F. Slyne et al.,Design and experimental test of 1:1 End to End Protection for LR-PON using an SDN mult-tier Control Plane., Vol. 3 No. 9 ECOC 2014.
[11] S. McGettrick et al., Experimental End-to-End Demonstration of Shared N:1 Dual Homed Protection in Long Reach PON and SDN-Controlled Core. Paper Tu2E.5, OFC 2015
[12] S.McGettrick et al. Experimental End to End Demonstration of shared N:1 Dual homed protection in SDN-controlled Long Reach PON and Pan-European Core, submitted to Journal of Lightwave Technology, October 2015
FP7 – ICT – GA 318137 56 DISCUS
Abbreviations
LR-PON long-reach passive optical network
EDFA Erbium doped fibre amplifiers
SOA semiconductor optical amplifiers
SDN software defined networking
M/C Metro/Core
BM-EDC burst-mode electronic dispersion compensation
SFP+ enhanced small form-factor pluggable
ONU optical network unit
OLT optical line terminal
BER bit error rate
FEC forward error correction
ODN optical distribution network
APD avalanche photodiode
DP-QPSK dual-polarisation quadrature-phase-shift-keying
TDMA time division multiple access
FPGA field programmable gate arra
UHD ultra-high definition
UART universal asynchronous receiver transmitter
DWA dynamic wavelength assignment
VoD video-on-demand
PLOAM physical layer operation, administration, management
LBMRx linear burst mode receiver
CDR clock and data recovery
SMF single mode fibre
WSS wavelength selective switch
DFB distributed feedback laser
ASE amplified spontaneous emission
OSA optical spectrum analyser
PRBS pseudorandom binary sequence
OSNR optical signal to noise ratio
XPM cross-phase modulation

FP7 – ICT – GA 318137 57 DISCUS
CPE carrier phase estimation
DSP digital signal processing
CWDM coarse wavelength division multiplexed
NoFU noise funnelling
EAM elctro-absorption modulator
TOSA transmitter optical sub-assembly
ROSA receiver optical sub-assembly
SLA Service Level Agreement
OCF OFELIA Control Framework
ONA Optical Network Architecture
OVS OpenVSwitch
PW Pseudowire
LSP Label-Switched Path
BoD bandwidth-on-demand
Version Date submitted Comments
V1.0 27/01/2016 First version sent to the EU.