Embed Size (px)
Citation preview

Case StudyApril 2016
D352410X012
AbstractLouisiana Offshore Oil Port’s (LOOP LLC) primary business interest is offl oading foreign crude oil from tankers moored off the Louisiana coast through a 48-inch diameter, 45-mile long pipeline. Crude oils that enter the pipeline originate from all over the world and vary widely in temperature.
In LOOP’s control center, the pipeline controllers use a software model based leak detection system to monitor the pipeline operation. The model is based on the real time simulation of the fl ow coupled with a thermal model to simulate the heat transfer to and/or from the pipeline and the environment. The ground thermal model is a solution of the heat conduction equation in the ground around the pipeline.
This paper discusses the thermal effects observed during implementation of a leak detection system on the LOOP pipeline, and how those effects were accounted for in order to maintain high levels of leak detection sensitivity.
IntroductionLOOP LLC offl oads crude oil from supertankers, pumps it through a buried pipeline into underground storage in salt dome caverns, and delivers it to refi neries throughout much of the southern and mid-western United States. LOOP’s facilities consist of a Marine Terminal located in the Gulf of Mexico 18 miles off the coast of Southeastern Louisiana, a booster pump station located just inland near Port Fourchon, Louisiana, and the Clovelly Dome Storage Terminal located about 25 miles inland near Galliano, Louisiana.
Practical Implementationof a Leak Detection Systemin a Transient Thermal Environment

Midstream Oil and Gas Solutions
2 www.EmersonProcess.com/Remote
April 2016
The Marine Terminal consists of two connected platforms in water 117 feet deep. This water depth allows VLCC (very large crude carrier) and ULCC (ultra large crude carrier) supertankers with up to 90 feet drafts to moor at one of three Marine Terminal single point moorings. Up to four 6600 horsepower pumps that can be used, if necessary, to inject the crude oil into one of 9 underground storage caverns. The caverns are fi lled with a combination of brine (saturated salt water) on the bottom and crude oil fl oating on top. The brine is displaced when injecting oil into the cavern. To overcome the static pressure of the brine and displace it, the pipeline must effectively pump oil “uphill” from a hydraulic standpoint.
Figure 1. Path of LOOP Pipeline

www.EmersonProcess.com/Remote 3
Midstream Oil and Gas SolutionsApril 2016
The elevation profi le of the LOOP main oil line (Figure 2) is relatively fl at except for the origin of the pipeline at the Marine Terminal platform that is about 117 feet above sea level. From the Marine Terminal platform the pipeline drops vertically to the seabed at about -115 feet ASL. The pipeline then rises gradually with the sea bottom to the shoreline where it is buried until it breaks the surface inside the Fourchon Booster Station. From Fourchon, the pipeline is buried a safe distance under many bayou and canal crossings until it once again surfaces at about 6 feet ASL inside the Clovelly Dome Storage Terminal facility.
InstrumentationLOOP maintains accurate instrumentation at the Marine Terminal, Fourchon, and Clovelly. Pressure transmitters are located at the pipeline origin at Marine Terminal, at both the inlet and outlet of the Fourchon Booster Station, and at the end of the pipeline at the Clovelly Dome Storage Terminal. The distance between pressure transmitters is therefore a little over 20 miles. Each of these is backed up by a nearby identical transmitter. Four temperature transmitters are positioned at the same four locations as the pressure transmitters. Clovelly has a nearby backup temperature transmitter. The Marine Terminal and Clovelly employ densitometers to provide specifi c gravity readings. A backup densitometer is located about a mile upstream of the primary one at Clovelly. The Marine Terminal measures viscosity of the product entering the pipeline.
A set of 7 turbine meters is located on the Marine Terminal and another set of 7 turbine meters is located at Clovelly to provide accurate fl ow measurement. There are 5 sixteen-inch diameter and 2 ten-inch diameter meters at Marine Terminal and 5 sixteen-inch diameter and 2 eight-inch diameter meters at Clovelly. The smaller meters provide accurate fl ow measurement at low fl ow rates that cannot be achieved with the larger meters.
Additional instrumentation is installed along the LOOP main oil line to provide environmental temperature data. The Marine Terminal instruments measure air temperature at the platform, water temperature at the surface, and water temperature near the bottom of the seabed. Fourchon Booster Station has a ground temperature measurement adjacent to the pipeline within the station.
Figure 2. LOOP Elevation Profi le

Midstream Oil and Gas Solutions
4 www.EmersonProcess.com/Remote
April 2016
Pipeline OperationsThe LOOP Main Oil Line transports up to 50 different types of crude oil imported from all parts of the world. The oil is transported in supertankers of various sizes having different onboard pumping equipment. The tanker’s pumping capability is the main factor in establishing the fl ow rate for the pipeline during that tanker’s discharge. A given tanker’s maximum fl ow rate ranges from 40,000 to 90,000 barrels per hour. This rate is highly transient due to tank switches onboard the tanker and switches at Clovelly from empty to full caverns or vice versa. These fl ow rates result in a normal main oil line pressure of 400 to 500 psi at the origin and discharge side of the booster station and 200 to 300 psi at the suction side of the booster station and at the termination.
The result of handling crude oil from such a wide variety of sources is that the product characteristics from one batch to the next always change. One tanker’s discharge is usually followed by the next tanker’s discharge after a brief shutdown of less than half an hour. One supertanker can also offl oad multiple crude types over its typical one or two day discharge. Physical properties of the crude oils transported by LOOP vary greatly. Specifi c gravity ranges from 0.77 to 0.92. Standard viscosity ranges from 1 to 300 centipoise. Product temperature ranges from 60 to 120°F and can change at a rate of over 20°F per hour.
Although the location of South Louisiana in a subtropical climate does not normally produce extreme environmental conditions, seasonal changes are signifi cant. The temperature of the seawater covering the offshore segment of the pipeline ranges from 65° to 87°F. The temperature of the soil/marsh covering the onshore segment of the pipeline ranges from 67° to 85°F. A combination of wintertime environmental conditions and a tanker with a hot cargo can produce a product versus environment temperature difference of 50°F. Conversely, a tanker discharging a cold cargo in summertime can produce a product versus environment temperature difference of -25°F.
The volume of crude oil contained in the LOOP main oil line is approximately 500,000 barrels at standard conditions of 60°F and atmospheric pressure. At operating conditions, the volume ranges from about 494,000 barrels at high product temperatures to about 499,000 barrels at low product temperatures. A tanker with a hot cargo being offl oaded into a much cooler pipeline or a tanker with a cold cargo being offl oaded into a much warmer pipeline is a frequent operational event for the LOOP pipeline. Such an event can result in the rate of change of the pipeline volume due only to temperature changes of up to 900 barrels per hour.
LOOP is aware of the transient thermal environment in which the pipeline is being operated and realizes that any real-time transient model that is used for pipeline leak detection on the main oil line must include a signifi cantly confi gurable and tunable thermal model. The desired result is a sensitive, reliable, robust, and accurate software leak detection system.
Leak Detection SystemIn May 2000, LOOP LLC contracted Emerson (formerly Energy Solutions International) to provide a software-based leak detection system with a real-time transient model for the LOOP main oil line.
The software package installed is named PLDS and is based on the real time simulation of the fl ow in the pipeline with a rigorous transient model driven by SCADA data. The main application of the package is leak detection, but it also provides batch tracking, pig tracking, and other applications.
The system detects leaks in pipelines by performing an accurate transientcompensated volume (mass) balance for defi ned sections of the pipeline each SCADA scan. The volume balance is the net fl ow into the section minus the change in line pack (mass). The net fl ow comes from all fl ow meters, in and out of the pipeline and is named fl ow balance. The change in line pack, is named packing rate and is generated by the model using pressure and temperature measurements. The fl ow balance and packing rate are completely independent. When there are no leaks, the volume balance should be around zero, below the threshold. When leaks occur, the volume balance represents the leak size and should be above the threshold.

www.EmersonProcess.com/Remote 5
Midstream Oil and Gas SolutionsApril 2016
The fl ow model is coupled with a thermal model that handles the energy equation for the pipeline fl uid, the heat transfer in the pipeline surroundings and the handling of ambient temperature beyond the pipeline surroundings.
The pipe surroundings are modeled as a set of 7 concentric shells of identical or different properties, named thermal shells. The fi rst shell is the pipe itself. More shells are confi gured for handling pipe coating and insulation. The inner boundary is the pipe wall, assumed to be at the fl uid temperature and the outer boundary is at a radius less than the burial depth of the pipe. For the transient model the conduction problem is solved numerically with the inner temperature boundary being the pipe wall temperature and the outer boundary being the ground temperature. The conductive heat fl ow at the inner boundary becomes the heat loss or heat gain of the fl uid. The heat fl ow in the fl ow model’s energy equation comes from the heat conduction coeffi cient and fi rst shell temperature from the ground thermal model on the previous time step.
The simulation of the heat transfer from the pipeline into the surroundings is based on the measured ground temperature, with transducers installed at a distance from the pipe. The sensors provide the outer boundary condition temperature to the ground thermal model.
The system must be confi gured with information about the ground, the soil type, the number of concentric thermal shells, the thickness of the thermal shells, the thermal conductivity of the shells, the heat capacity and the density of the shells, to be able calculate the ground thermal profi les in the transient situation surrounding the pipe.
The heat transfer information has to be determined before each thermal shell surrounding the pipe is confi gured. The number of thermal shell types depends upon the types of pipe being used and the terrain in which the pipe is buried. If the same type of pipe is buried underground and then passes through a river, then at least two different thermal shell types would be necessary to describe the properties of the thermal shells, contained in each type.
The biggest challenge in tuning the model is setting the values in the confi guration. There are infi nite numbers of sets of values, but only one set will be physically correct and correspond to reality. A number of sets will work correctly in some situations, but not in other situations.
This initial manual tuning is successful once it results in accurate modeled temperature of the product as it progresses down the pipeline. The combination of a wide range of product temperatures being transported, the pipeline being partly offshore and partly onshore, and seasonal environmental condition variation made the confi guration and tuning of the temperature modeling software an interesting and challenging task for the LOOP project.
Seven months of data (from January 1 to July 31, 2002) were replayed and monitored. In this time frame, over 200 thermal fronts were analyzed. More than 30 batch interfaces had over 15°F difference in temperature.
The remainder of this discussion will focus on just one such thermal interface: a cold batch (Troll) shipped from Norway followed by a hot batch (Mayan) shipped from Mexico.

Midstream Oil and Gas Solutions
6 www.EmersonProcess.com/Remote
April 2016
Case StudyFigure 3 shows linefi ll snapshot of 2 pipelines. The top bar chart is the MOL line where the MAY batch (gray) is pushing the TRL batch (green) out of the line.
Figure 4 shows a snapshot of the modeled temperature profi le (cyan pen) in the MOL line when the hot front reaches Fourchon Station at milepost 20.9.
Figure 3. Linefi ll Chart with 2 Pipelines
Figure 4. MOL Temperature Profi le

www.EmersonProcess.com/Remote 7
Midstream Oil and Gas SolutionsApril 2016
Both Figures 3 and 4 were taken at the same time, on June 4, at 07:08 a.m.
The next graph, Figure 5, represents the trends of 4 temperature measurements along the line. The most recent time is represented to the right of the graph, with older values being to the left. The trend shows the temperature interface between a cold batch and a hot batch. The trend shows 2 days of data. Following the brown pen from left to right, it can be noted that before the early morning on June 4, a cold batch enters the line at 68°F and over time reaches 78°F. Early in the morning on June 4, a hot 110 degree Fahrenheit batch is injected in the line for about 17 hours. At the inlet point in the pipeline at the Marine Terminal, the temperature difference between the hot and the cold batch is 32°F (110-78).
When the product reaches the mid point, at Fourchon station (yellow and cyan pen), the hot product is 100°F and the cold product is 80°F. The temperature difference between the hot batch and cold batch is 20°F at Fourchon station. Downstream at Clovelly (the pipeline outlet) the difference between the hot batch and the cold batch is only 5°F (purple pen).
At Clovelly, after the products traveled 45 miles of pipeline, the hot batch is cooler and the cold batch is warmer. The environment infl uenced the batch temperature: the hot batch is cooler due to heat loss to the cooler ground, and the cold batch is similarly warmer. The warming of the cold batch is signifi cantly enhanced because the preceding hot batch heated up the ground.
There are some discontinuities in the product temperatures and they occur when the pipeline is shut down.
Figure 5. Trends of Temperature Measurements at 4 Points in the Line
Calculated temperatures can be compared with measured temperatures at locations downstream in the pipeline. These trends give detailed information about the accuracy of the model.
The graph trend in Figure 6 shows the calculated temperature (cyan pen) tracking the measured temperature well (brown pen). During the interface transition through Fourchon station (milepost 20.9), the calculated temperature lags several minutes behind the measured temperature. The discrepancy between the measured and calculated temperature reaches 3-4°F during the steepest part of the thermal transition from the cold to the hot product.

Midstream Oil and Gas Solutions
8 www.EmersonProcess.com/Remote
April 2016
The graph trend in Figure 7 shows that during the thermal transition through the Fourchon station, the model calculates an imbalance of 80 barrels per hour (brown pen) - not large enough to exceed the threshold (purple pen) to create a false alarm. An alarm is issued when the brown pen moves above the purple pen. The volume balance (brown pen) is the difference between the fl ow balance (cyan pen) and the packing rate (yellow pen).
Calculated temperatures can be compared with measured temperatures at locations downstream in the pipeline. These trends give detailed information about the accuracy of the model.
The graph trend in Figure 6 shows the calculated temperature (cyan pen) tracking the measured temperature well (brown pen). During the interface transition through Fourchon station (milepost 20.9), the calculated temperature lags several minutes behind the measured temperature. The discrepancy between the measured and calculated temperature reaches 3-4°F during the steepest part of the thermal transition from the cold to the hot product.
The graph trend in Figure 7 shows that during the thermal transition through the Fourchon station, the model calculates an imbalance of 80 barrels per hour (brown pen) - not large enough to exceed the threshold (purple pen) to create a false alarm. An alarm is issued when the brown pen moves above the purple pen. The volume balance (brown pen) is the difference between the fl ow balance (cyan pen) and the packing rate (yellow pen).
Both trends (in Figures 6 and 7) are captured at the same time and have the same time range on the X-axis to allow correlation of thermal events and imbalances.
Figure 6. Trend of Measured Temperature and Calculated Temperature at Fourchon Station

www.EmersonProcess.com/Remote 9
Midstream Oil and Gas SolutionsApril 2016
Figure 7. Leak Detection Trend, Tracking is Good with No False Alarms
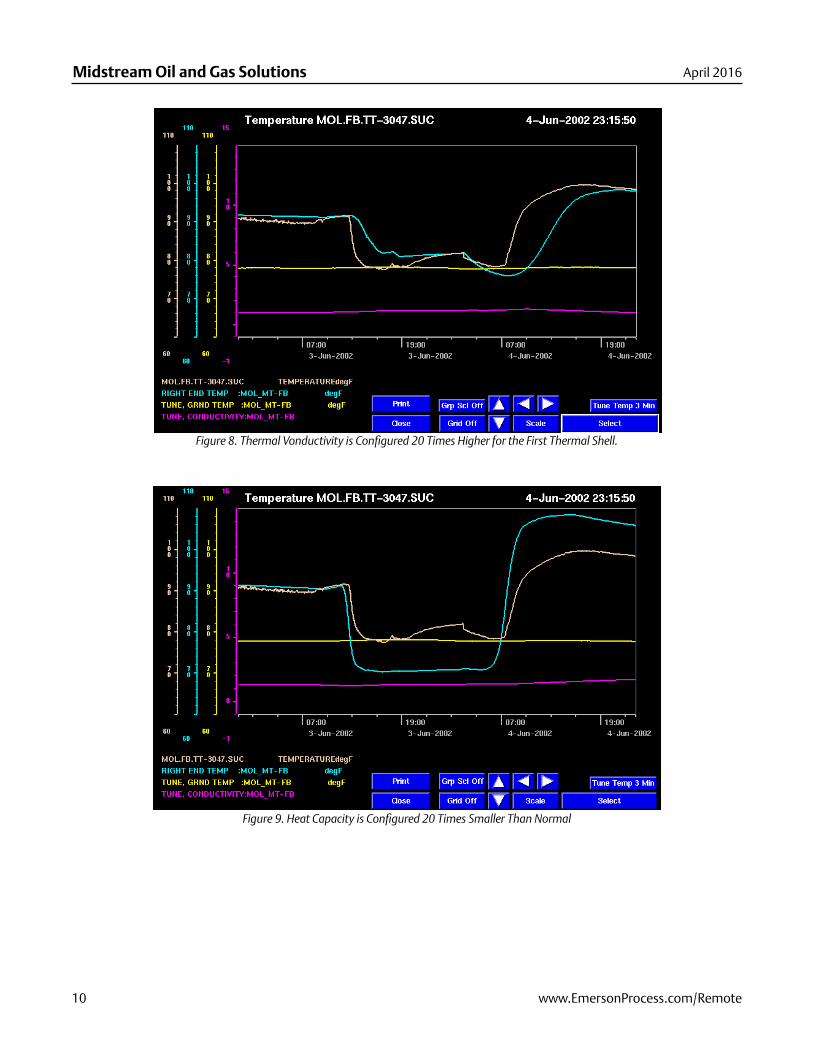
The next two graphs (Figures 8 and 9) show the thermal tracking at Fourchon station when the ground thermal model is not confi gured and tuned properly. In the fi rst abnormal scenario (Figure 8), the thermal conductivity is set 20 times higher for the fi rst thermal shell. The calculated temperature lags behind the measured temperature and several hours elapse before the calculated and measured data match again.
In the second abnormal scenario (Figure 9), the model is confi gured with a heat capacity 20 times smaller than normal. In this case, the discrepancies between the calculated and measured temperatures are large and the model calculates imbalances of 400 barrels per hour - large enough to generate a false alarm (Figure 10).
The trends on Figures 8, 9, and 10 are on same time line.
Midstream Oil and Gas Solutions
10 www.EmersonProcess.com/Remote
April 2016
Figure 8. Thermal Vonductivity is Confi gured 20 Times Higher for the First Thermal Shell.
Figure 9. Heat Capacity is Confi gured 20 Times Smaller Than Normal

www.EmersonProcess.com/Remote 11
Midstream Oil and Gas SolutionsApril 2016
Figure 10. Leak Alarm Generated by the Model. The confi guration is set with a very low heat capacity (20 times smaller than normal).
In other operational scenarios, the pipeline may be shutdown with hot or cold batches in the line. The season with cold ground or warm ground affects the direction of the heat transfer to and/or from the pipeline and the surroundings. The product temperature will move toward the environment temperature, but it will do so very slowly. Pressures in the line are greatly affected by a shutdown, changing several psi per hour. In some prolonged shutdown cases, a slack line condition was developed at the point with the highest elevation in the pipeline (MT). A very long shutdown is required for a pipeline fi lled with cold or hot products to reach the equilibrium with the environment.
During a New Year’s shutdown (4 days from Dec 30, 2001 through Jan 2, 2002), the product cooled off 10°F (from 100°F to 90°F), but did not reach the ground temperature (around 70°F). It is assumed that in wintertime it would take about 2 weeks for a hot product to reach a cold ground temperature. However, this piece of information was important in determining the magnitude of the heat capacity of the thermal shells (as a total). The analyst had to distribute the total heat dissipation through all 7 thermal shells confi gured for the pipeline.
Temperature measurements used for model boundary conditions or for tuning are inaccurate during shutdowns. During a shutdown condition, temperature measurements indicate the ambient temperature (of a small exposed piece of pipe) instead of refl ecting the product temperature in the buried pipe. The temperature measurement for the left end of a pipe segment is used as a boundary condition for the model. The right end temperature measurement is used for automatic tuning and may drive the tuning in a wrong direction if it is inaccurate. This issue forces the model to keep very tight tuning parameters (thermal conductivity and ground temperature) during shutdown conditions. The model slows the thermal tuning, so measurements affected by ambient temperature do not reach and infl uence the model calculations.
The graph trend in Figure 11 illustrates several pipeline shutdown periods where the temperature measurement (brown pen) moves toward the ambient temperature, while the calculated model temperature (cyan pen) changes very little during shutdown conditions.

Midstream Oil and Gas Solutions
12 www.EmersonProcess.com/Remote
April 2016
Figure 11. Trend with Measured and Calculated Temperatures during Numerous Shutdowns
Since moisture content for the buried part of the pipeline changes seasonally and the local weather causes large changes in thermal conductivity, the thermal conductivity calculations would have to be repeated often to accurately refl ect these changes.
Also, the type (mixture of sand, gravel, and cement) and porosity of the concrete that wraps the pipeline offshore is unknown. These unknown values make it diffi cult to accurately determine the thermal conductivity and heat capacity of the concrete. Additionally, the thickness of concrete wrap is uneven along the pipeline.
Diffi culties encountered in handling thermals in the model were:Thermal problems cannot be separated from other operational and instrumentation issues. Errors in thermals show as small-to-
medium size imbalances in longer Leak Detection Periods.Requires large quantity of datasets to be re-played to let the thermals set in. With a batched line, playback of at least several
weeks of data is required.Requires replay of both summer and winter data with thermal interfaces traveling without stops or with prolonged shutdownsRequires replay of hot batches followed by cold batches, and cold batches followed by hot batches.For many fl ow regimes there is ambiguity in the choice of ground temperature and thermal conductivity. There are many
combinations of Ground Temperature and Thermal Conductivity that will produce the correct downstream temperature for a specifi c fl ow regime, but only one combination is physically correct and so only one combination will produce the correct downstream temperature for all fl ow regimes.
With very slow automatic tuning of the thermal conductivity and faster tuning of the ground temperature, variable fl ow conditions will eventually produce correctly tuned values of both parameters. Eventually means, in this case, months – which practically means never, because over such a long period there will be changes in the pipeline operations, instrumentation and ground itself which will invalidate the tuned values.
It is still unknown how long it takes for various products to reach equilibrium with ground temperature.

www.EmersonProcess.com/Remote 13
Midstream Oil and Gas SolutionsApril 2016
At the beginning of the project, after the initial tuning was completed, the model issued a false alarm for each thermal interface with more than 10°F difference between cold and hot batches. Now the leak detection system is free of false alarms caused by the thermal fronts.
Project steps to eliminate false alarms caused by thermal interfaces:The project was started up with thermal confi guration data from an onshore, buried, 18-inch crude oil pipeline (different than LOOP).Temperature measurements along the pipeline were monitored during fl owing and shutdown operation to verify they are not
the primary cause of imbalances for leak detection. The imbalances were due to imperfect knowledge of the factors affecting the heat transfer between the pipe and the ground. The result was that the model temperatures at the end of the pipeline (Clovelly) were correct within 2-3°F while the model temperatures in the center of the pipeline (Fourchon) were off much more (10-12°F).
Verifi ed the thermal conductivity tuning parameters and ground temperature tuning parameters.The heat capacity had to be increased dramatically for LOOP line from those of the 18-inch line. With the increase in heat
capacity, the calculated thermal front lags behind the measurement. After the increase of the heat capacity, the leak detection had only one false alarm for a 6-month period of operation.
Thermal conductivity of the fi rst thermal shell had to be decreased 6-8 times to get the calculated thermal front arrival time and slopes to match the measurement at Fourchon station.
The system was approved and commissioned on April 15, 2002. The cooperation and commitment of both parties - the customer and the vendor - has contributed signifi cantly to the success of this project. This cooperation is expected to continue with the goal of further strengthening the thermal model and getting confi guration parameters even closer to reality.
ConclusionsA complex pipeline like LOOP needs a leak detection system equipped with a rigorous thermodynamic model that avoids the generation of false alarms caused by the thermal interfaces.
The false alarms caused by thermal problems interfere with a leak detection system’s ability to fi nd and locate small leaks.
The process of zeroing in on the right thermal parameters is lengthy, repetitive and requires a full commitment of all the parties involved in the project. Otherwise, it is not possible to achieve accurate modeling results.
BibliographyJerry Modisette – Notes on Ground Heat Flow and the Assignment of Heat Capacities in the Energy Equation
AuthorsBarry GuidrySCADA Programmer / AnalystLeak Detection Software Specialist14 years at LOOP LLCB.S. Electrical Engineering from Louisiana State University in 1988
Vlad CondacseEmersonLeak Detection Software Specialist16 years with PLDS software packageM.S.E.E from Polytechnic Institute, Bucharest, Romania, in 1980

RemoteAutomationSolutions
Remote Automation Solutions Community
Global HeadquartersNorth America and Latin AmericaEmerson Process ManagementRemote Automation Solutions6005 Rogerdale RoadHouston, TX, USA 77072T +1 281 879 2699 F +1 281 988 4445
www.EmersonProcess.com/Remote
EuropeEmerson Process ManagementRemote Automation SolutionsUnit 8, Waterfront Business ParkDudley Road, Brierley HillDudley, UK DY5 1LXT +44 1384 487200 F +44 1384 487258
Middle East and AfricaEmerson Process ManagementRemote Automation SolutionsEmerson FZEPO Box 17033Jebel Ali Free Zone - South 2Dubai, UAET +971 4 8118100 F +1 281 988 4445
Asia PacificEmerson Process ManagementAsia Pacific Private LimitedRemote Automation Solutions1 Pandan CrescentSingapore 128461T +65 6777 8211F +65 6777 0947
D352410X012 / Printed in USA / 04-16
Find us around the corner or around the worldFor a complete list of locations please visit us at www.EmersonProcess.com/Remote
© 2016 Remote Automation Solutions, a business unit of Emerson Process Management. All rights reserved.
Emerson Process Management Ltd, Remote Automation Solutions (UK), is a wholly owned subsidiary of Emerson Electric Co. doing business as Remote Automation Solutions, a business unit of Emerson Process Management. FloBoss, ROCLINK, ControlWave, Helicoid, and OpenEnterprise are trademarks of Remote Automation Solutions. AMS, PlantWeb, and the PlantWeb logo are marks owned by one of the companies in the Emerson Process Management business unit of Emerson Electric Co. Emerson Process Managment, Emerson and the Emerson logo are trademarks and service marks of the Emerson Electric Co. All other marks are property of their respective owners.
The contents of this publication are presented for informational purposes only. While every effort has been made to ensure informational accuracy, they are not to be construed as warranties or guarantees, express or implied, regarding the products or services described herein or their use or applicability. Remote Automation Solutions reserves the right to modify or improve the designs or specifications of such products at any time without notice. All sales are governed by Remote Automation Solutions’ terms and conditions which are available upon request. Remote Automation Solutions does not assume responsibility for the selection, use or maintenance of any product. Responsibility for proper selection, use and maintenance of any Remote Automation Solutions product remains solely with the purchaser and end-user.
Find us in social media
Emerson_RAS
Remote Automation Solutions