Embed Size (px)
Citation preview

The WETFEET – Wave Energy Transition to Future by Evolution of Engineering and Technology
project has received funding from the European Union's Horizon 2020 programme under grant
agreement No 641334.
DATE: January 2016 PROJECT COORDINATOR:
WavEC Offshore Renewables
GRANT AGREEMENT NR: 641334
PROJECT: WETFEET
D2.1 - Designs and specifications of an OWC
able to integrate the negative spring
2
Report with one or more designs and specifications of an OWC able to integrate the negative
spring; enhanced added-mass; survivability submergence and dielectric generators Project WETFEET – Wave Energy Transition to Future by Evolution of Engineering
and Technology
WP No. 2 WP Title System description
Deliverable No. 2.1
Nature (R: Report, P: Prototype, O: Other) R
Dissemination level (PU, PP, RE, CO) PU
Lead beneficiary: WavEC Offshore Renewables
Contributing partners IST, INNOSEA, SSSA
Authors List: Boris Teillant (WavEC)
Yannick Debruyne (WavEC)
António Sarmento (WavEC)
Teresa Simas (WavEC)
Marta Silva (WavEC)
Rui Gomes (IST)
João Henriques (IST)
Maxime Philippe (INNOSEA)
Adrien Combourieu (INNOSEA)
Marco Fontana (SSSA)
Quality reviewer Teamwork & IST
Status (F: final; D: draft; RD: revised
draft):
F
Due Delivery Date: 31/01/2016
Actual Delivery Date: 29/01/2016
Version no. Dates and comments
0 22-Nov-2015 Deliverable structure defined
1 09-Dec-2015 Full draft of chapters 1 & 2
2 23-Dec-2015 Partial draft of chapters 3 & 4 and reviewed chapters 1 & 2
3 18-Jan-2016 Full draft
4 25-Jan-2016 Quality review on the full draft
5 29-Jan-2016 Document revised according to quality review – final version
ready for submission
3
TABLE OF CONTENTS Table of Contents ........................................................................................................................................................ 3
Table of Figures ........................................................................................................................................................... 5
Table of Tables ............................................................................................................................................................. 7
Executive Summary ................................................................................................................................................... 8
List of Acronyms ......................................................................................................................................................... 9
1. INTRODUCTION ............................................................................................................................................... 10
1.1. Context and motivation ........................................................................................................................ 10
1.2. State-of-the art of the OWC device type ......................................................................................... 10
1.3. Contribution of the OWC spar-buoy device to WETFEET objectives ................................. 12
2. OWC SYSTEM DESCRIPTION ....................................................................................................................... 13
2.1. Main components ................................................................................................................................... 13
2.2. Operating principle and energy conversion chain ..................................................................... 14
2.3. Control mechanisms .............................................................................................................................. 15
2.4. Mooring system ....................................................................................................................................... 15
3. INTEGRATION OF BREAKTHROUGHS ..................................................................................................... 18
3.1. Negative spring ........................................................................................................................................ 18
3.2. Enhanced added-mass .......................................................................................................................... 22
3.3. Survivability submergence ................................................................................................................. 24
3.4. Dielectric elastomer generators ........................................................................................................ 27
3.4.1. Manufacturing considerations .................................................................................................. 30
3.5. Preliminary considerations for shared moorings ...................................................................... 30
3.6. Preliminary considerations for the tetra-radial air turbines ................................................. 33
4. MARINE OPERATIONS ................................................................................................................................... 37
5. PRELIMINARY DESIGN .................................................................................................................................. 41
5.1. Design specifications ............................................................................................................................. 41
5.2. Structural loads ....................................................................................................................................... 43
5.2.1. Wave induced loads ....................................................................................................................... 43
5.2.2. Mooring loads .................................................................................................................................. 44
5.3. Methodology for the structural analysis ........................................................................................ 45
5.3.1. Choice of methodology for preliminary structural assessment of the OWC spar
buoy 46

4
5.3.2. Code and standards ....................................................................................................................... 47
5.3.3. External load modelling .............................................................................................................. 47
5.3.4. Internal load assessment ............................................................................................................ 48
5.3.5. Stress assessment .......................................................................................................................... 48
5.3.6. Limit stress ....................................................................................................................................... 48
6. POTENTIAL CHALLENGES ........................................................................................................................... 49
6.1. Structural engineering challenges ................................................................................................... 49
6.2. Environmental impacts ........................................................................................................................ 50
6.3. Cost implications..................................................................................................................................... 54
7. CONCLUSIONS AND FUTURE WORK ....................................................................................................... 57
Bibliography ............................................................................................................................................................... 59
Appendices ................................................................................................................................................................. 63
A. Hydrostatic and dynamic wave loads – theory ................................................................................ 63
B. Orcaflex settings .......................................................................................................................................... 65
C. Hydrostatic and dynamic wave loads – Results............................................................................... 66
5
TABLE OF FIGURES FIGURE 2-1 CROSS-SECTION VIEW OF A TYPICAL DESIGN FOR THE OWC SPAR-BUOY ........................................... 13
FIGURE 2-2 POWER CONVERSION CHAIN OF A FLOATING OWC WITH AN AIR TURBINE ........................................ 14
FIGURE 2-3 TOP VIEW OF A SLACK MOORING SYSTEM WITH THREE BOTTOM MOORED LINES OF AN ISOLATED
OWC SPAR BUOY ...................................................................................................................................................... 16
FIGURE 2-4 REPRESENTATION OF A SINGLE LINE OF THE SLACK-MOORING SYSTEM. THE EXTREME SITUATION
WITH FULLY STRETCHED MOORING CONFIGURATION IS REPRESENTED IN DOTTED LINES ................................ 16
FIGURE 2-5 UPDATED VERSION OF THE SLACK-MOORING SYSTEM WITH TWO ADDITIONAL SECTIONS OF
STUDDED CHAIN ........................................................................................................................................................ 17
FIGURE 3-1 OPTIMIZATION VARIABLES CONSIDERED IN [12]: THE SUBMERGED MASS PARAMETERS ARE CIRCLED
IN RED ........................................................................................................................................................................ 23
FIGURE 3-2 SUBMERGENCE STRATEGY FOR SURVIVABILITY: FROM OPERATIONAL EQUILIBRIUM POSITION (ON
TOP) TO THE FULLY SUBMERGED POSITION (CENTER) AND THE RECOVERY OF THE SUBMERGED BODY TO
OPERATIONAL MODE VIA RESTORING FORCES (BOTTOM) ..................................................................................... 25
FIGURE 3-3 SCHEME OF THE APPROACH FOR THE PRELIMINARY LAYOUT AND DIMENSIONING OF THE DIELECTRIC
ELASTOMER GENERATOR DEG FOR THE OWC SPAR BUOY .................................................................................. 28
FIGURE 3-4 SCHEMATIC REPRESENTATIONS OF TWO POSSIBLE SOLUTIONS FOR THE INSTALLATION OF THE
DIELECTRIC ELASTOMER GENERATOR FOR THE OWC SPAR BUOY ..................................................................... 29
FIGURE 3-5 SCHEMATIC TOP-VIEW OF AN ARRAY OF THREE OWC SPAR BUOYS WITH SHARED MOORING LINES
AND ANCHORING POINTS ......................................................................................................................................... 32
FIGURE 3-6 CONCEPTUAL TOP VIEW OF A PENTAGON-SHAPED ARRAY OF 5 OWC SPAR BUOYS WITH RIGID OR
NON-RIGID CONNECTIONS ....................................................................................................................................... 33
FIGURE 3-7 NEW TURBINE WITH RADIAL-FLOW ROTOR CONFIGURATION .............................................................. 34
FIGURE 3-8 THE RADIAL-FLOW TURBINE ROTOR ...................................................................................................... 34
FIGURE 3-9 PERSPECTIVE REPRESENTATION OF THE CURVED-DUCT MANIFOLD, WITH A) TRAPEZOIDAL, B)
CIRCULAR AND C) ELLIPTICAL EXIT SECTIONS ....................................................................................................... 35
FIGURE 3-10 THREE-POSITION AXIALLY-SLIDING VALVE .......................................................................................... 35
FIGURE 3-11 EFFICIENCY COMPARISON BETWEEN THE RADIAL ROTOR TETRARADIAL TURBINE, THE BIRADIAL
TURBINE, THE AXIAL IMPULSE TURBINES WITH MOVEABLE GUIDE VANES (MGV) AND FIXED GUIDE VANES
(FGV) AND THE WELLS TURBINE. ........................................................................................................................... 36
FIGURE 4-1 REPRESENTATION OF THE LIFT POINTS FOR THE LIFTED LOAD-OUT STRATEGY WITH THE BUOY
HORIZONTAL.............................................................................................................................................................. 38
FIGURE 4-2 REPRESENTATION OF THE WET TRANSPORT OPERATION ..................................................................... 38
FIGURE 4-3 SCHEMATIC REPRESENTATION OF THE DEFLATION OF THE AUXILIARY FLOATER DURING THE
INSTALLATION OF THE OWC SPAR BUOY ............................................................................................................... 39
FIGURE 5-1 REAL PART OF THE DIFFRACTION PRESSURE CALCULATED BY WAMIT™ (HMAX ,TP,MAX)- 12 M
DIAMETER OWC SPAR BUOY ................................................................................................................................... 44

6
FIGURE 5-2 ORCAFLEX SCREENSHOT: OWC 1 BEHAVIOUR IN 100-YR STORM ...................................................... 45
FIGURE 5-3 PROCESS TO PROVIDE THE FINAL PRELIMINARY DESIGN FROM INITIAL GUESS ................................... 46
FIGURE 5-4 SLICES ALONG THE HULL ......................................................................................................................... 47
FIGURE 6-1 P-Δ EFFECT DUE TO PITCH ANGLE .......................................................................................................... 49
FIGURE 6-2 THE ENVIRONMENTAL IMPACT ASSESSMENT STEPWISE APPROACH: THEORETICAL STEPS ........... 51
FIGURE 6-3 IMPACT OF THE DISCOUNT RATE ON THE LCOE .................................................................................. 56

7
TABLE OF TABLES TABLE 1-1 INSIGHT ON THE FIVE OWC TYPES DEFINED BY FALCÃO ET AL.[5] ...................................................... 11
TABLE 3-1 DIMENSION AND DATA OF HYPOTHETIC TURBINE PTO AND PEAK-EQUIVALENT DEG-PTO ............ 29
TABLE 3-2 NUMBER OF 4-METERS MEMBRANE REQUIRE TO PROVIDE THE EQUIVALENT PEAK-POWER ............. 30
TABLE 3-3 TOTAL LENGTH OF MOORING LINE ELEMENT FOR ONE OWC SPAR BUOY UNIT ................................... 31
TABLE 5-1 SPECIFICATIONS OF THE THREE GEOMETRIES CONSIDERED FOR THE PRELIMINARY DESIGN STUDY . 41
TABLE 5-2 MOORING SPECIFICATIONS OF THE THREE GEOMETRIES CONSIDERED FOR THE PRELIMINARY DESIGN
STUDY ........................................................................................................................................................................ 42
TABLE 5-3 SUMMARY OF THE ENVIRONMENTAL LOAD CONDITIONS CONSIDERED FOR THE PRELIMINARY DESIGN
................................................................................................................................................................................... 43
TABLE 5-4: MAXIMUM PANEL SIZE IN WAMIT™ ...................................................................................................... 43
TABLE 5-5 MOORING LOADS IN 100-YR STORM ........................................................................................................ 45
TABLE 6-1 PRELIMINARY IDENTIFICATION OF KEY STRESSORS AND ENVIRONMENTAL RECEPTORS OF THE
BREAKTHROUGHS CONSIDERED. .............................................................................................................................. 52
TABLE 6-2 EXAMPLES OF CRITERIA TO BE USED IN THE ENVIRONMENTAL IMPACTS EVALUATION OF THE
BREAKTHROUGHS. .................................................................................................................................................... 53
TABLE 6-3 EXPECTED IMPACTS OF THE DIFFERENT BREAKTHROUGHS ON THE LCOE COMPONENTS ................. 56

8
Executive Summary This report presents Deliverable 2.1 of the WETFEET H2020 project – Report with one or
more designs and specifications of an OWC able to integrate the negative spring; enhanced
added-mass; survivability submergence and dielectric generators. It consists of an
introductory description of the integration of the proposed breakthroughs into the OWC spar
buoy along with a preliminary design analysis of the device.
After an initial system description of the OWC spar buoy without breakthrough features, each
proposed breakthrough concept is presented. The working principle of the breakthrough
ideas is accompanied with a scientific or technical justification highlighting their step-change
potentials with respect to a “classic” OWC spar buoy as it has been explored to-date in the
literature.
Additionally, further considerations on the OWC spar buoy are included in this report, namely:
Marine operation strategies to allow the load-out, transportation, installation and
retrieval of the OWC spar buoy,
Preliminary design and structural analysis to identify the key structural requirements
for the reference case of the OWC spar buoy (without featuring the breakthroughs)
Potential environmental and cost impacts introduced by the breakthrough features
The deliverable concludes with a path toward the realization of the necessary studies to
assess more precisely the potential impacts associated with each of the breakthrough. This
numerical work will feed deliverable 2.3 and other work packages which are focusing
specifically on some of the breakthroughs.
9
List of Acronyms AEP Annual Energy Production
CAPEX Capital Expenditures
DE Dielectric Elastomers
DEG Dielectric Elastomer Generator (to refer to the whole generator)
EAM Enhanced Added-Mass
EIA Environmental Impact Assessment
FEM Finite Element Method
FLS Fatigue Limit State
IRR Internal Rate of Return
LCOE Levelized Cost of Electricity
NPV Net Present Value
NS Negative Spring
OPEX Operational Expenditures
OWC Oscillating Water Column
PTO Power Take-Off
TRL Technology Readiness Level
TPL Technology Performance Level
WEC Wave Energy Converter
WP Work Package
10
1. INTRODUCTION 1.1. Context and motivation
Within the framework of the WETFEET H2020 EU funded project, a set of breakthroughs have
been identified to address the obstacles that have been delaying the path towards
commercialization of the wave energy sector. These breakthroughs are applied to two wave
concepts, the OWC spar-buoy and the Symphony, under development by members of the
consortium.
Work Package (WP) 2 of the WETFEET project serves as a technical base over which the
development of the breakthroughs can be constructed. In this context, this initial report is
intended to verify whether the proposed breakthroughs for the OWC spar buoy can be
properly implemented. For this purpose, a global preliminary analysis of the OWC was
conducted with three major objectives:
Define the OWC spar buoy system specifications
Deploy a set of tools relevant to the analysis of the core engineering challenges
associated with the OWC spar buoy
Engage with the integration of the breakthroughs to the OWC spar buoy
1.2. State-of-the art of the OWC device type
Over the course of the past 35 years, many R&D programs have investigated wave energy with
the objective to accelerate the commercialization and exploit the potential of this vast source
of renewable energy. Although technical feasibility has been demonstrated for a number of
concepts, the wave energy sector longs to witness evidence of the expected technological
convergence. There still exists a large diversity of WEC designs and it remains unclear which
one(s) is (are) the best positioned to make a significant contribution to the energy market.
Among the various wave energy concepts, OWC-WECs have received significant attention from
the research community since the early studies on wave energy in the late 70s and early 80s.
The basic working principle of an OWC consists of a surface piercing chamber with a
submerged opening in which an oscillating air-water interface is subject to time-varying
pressure due to the action of the incoming wave field.

11
There exist several literature survey papers related to research and development associated
with OWC concepts [1]–[5]. The most recently published review article by Falcão and
Henriques [5] classifies OWC devices into 5 types, namely:
Fixed-structure OWCs
Breakwater-integrated OWCs
Floating-structure OWCs
Floating-structure WECs with interior OWCs
Multi OWC devices
Table 1-1 attempts to provide some general insight into the past and current status of each of
the above five OWC types. One should note that some OWC devices may fall into more than
one category. To date, there is a relative significant difference of Technology Readiness Level
(TRL) between these OWC types ranging from proof of concept until pre-commercial
prototypes.
Moreover, onshore and offshore OWC technologies are hardly comparable due to the contrast
in the engineering challenges they have to face. While onshore device are either mounted on
fixed structure or to a breakwater, nearshore and offshore OWC devices typically require a
mooring system and a complete electrical transmission system to the shore. Being offshore
allows the exploitation of resources with higher energetic potential.
TABLE 1-1 INSIGHT ON THE FIVE OWC TYPES DEFINED BY FALCÃO ET AL.[5]
OWC type TRL
range
Examples of device
development
Key advantages Key disadvantages
Fixed-structure
OWCs
4-7 Islay prototype, Pico
plant, LIMPET, …
Accessibility
Survivability
Grid distance
Limited resource
Visual impact
Shore noise emission
Breakwater-
integrated
OWCs
4-7 Sakata plant, Mutriku
plant, Civitavecchia
plant, …
Accessibility
Survivability
Shared infrastructure
Grid distance
Limited resource
Design constraints
Shore noise emission
Floating-
structure OWCs
3-5 OE buoy, OceanLinx
Mk3, Mighty Whale,
OWC spar buoy, …
Offshore resource
Visual impact
Accessibility
O&M
Grid distance
Floating-
structure WECs
with interior
OWCs
2-3 U-Gen, Crowley et al.
[6], Kurniawan et al.
[7], …
Offshore resource
Visual impact
Enclosed PTO
Accessibility
O&M
Grid distance
Multi OWC
devices
2-4 Seabreath, LEANCON,
V-shaped 32 OWCs …
Modularity
Scalability
Power quality
Accessibility
O&M
Control

12
1.3. Contribution of the OWC spar-buoy device to WETFEET objectives
Pioneer researchers of wave energy had already investigated the concept of an axisymmetric
floating OWC, sometimes called OWC spar buoy [8]–[10]. More recently, a report
commissioned by the British Department of Trade & Industry [11] indicated that OWC spar
buoy is considered the lower risk and most economic buoy among three OWC floating
configurations.
In the WETFEET project, it is expected to build upon some recent optimization studies carried
out by members of the consortium [12]–[14]. More specifically, breakthroughs ideas will be
the subject of initial engineering analysis to assess their potential for cost-reductions. In a
report by Sandia National Laboratory [15], several pathways for cost-reductions of OWC were
identified. Among these pathways, one can associate the breakthroughs that will be the object
of a preliminary study in the present report:
Improved power conversion: both the Dielectric Elastomer Generators (DEG) and the
tetra-radial turbine aim at enhancing the power conversion chain
Optimized structural design and device profile: implementing the Negative Spring (NS),
the Enhanced Added-Mass (EAM) and the survivability submergence will result in a
more efficient and resilient structural design
Array optimization: shared moorings through rigid and non-rigid connections are
intended to have an overall positive impact on the cost of electricity
Increased system reliability: submergence under harsh environmental conditions as
well as DEG endeavour to improve the overall lifecycle reliability
While bottom-fixed, breakwater and floating ducted OWC device types have been largely
investigated, there is arguably less published work on the OWC spar buoy. The low TRL of the
OWC spar buoy (i.e. in the range 2-3) adduces the implementation of innovative and step-
changing concepts leading to lower cost of electricity while demanding affordable R&D effort.
13
2. OWC SYSTEM DESCRIPTION 2.1. Main components
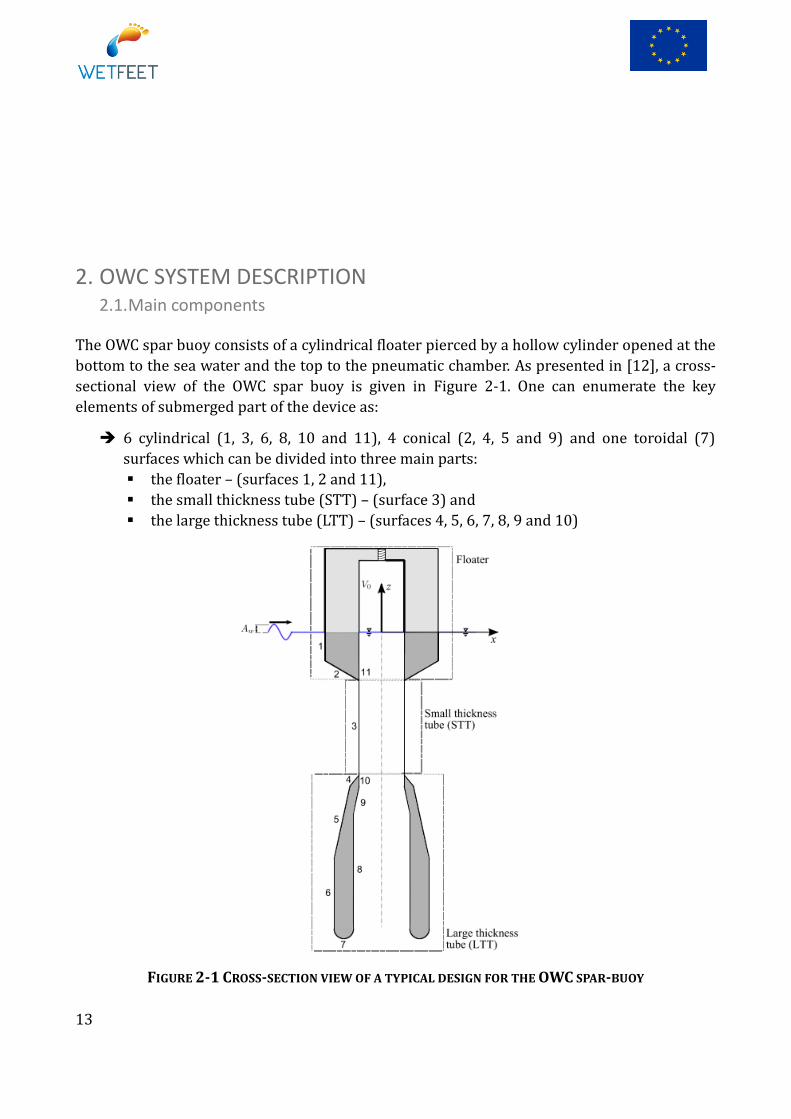
The OWC spar buoy consists of a cylindrical floater pierced by a hollow cylinder opened at the
bottom to the sea water and the top to the pneumatic chamber. As presented in [12], a cross-
sectional view of the OWC spar buoy is given in Figure 2-1. One can enumerate the key
elements of submerged part of the device as:
6 cylindrical (1, 3, 6, 8, 10 and 11), 4 conical (2, 4, 5 and 9) and one toroidal (7)
surfaces which can be divided into three main parts:
the floater – (surfaces 1, 2 and 11),
the small thickness tube (STT) – (surface 3) and
the large thickness tube (LTT) – (surfaces 4, 5, 6, 7, 8, 9 and 10)
FIGURE 2-1 CROSS-SECTION VIEW OF A TYPICAL DESIGN FOR THE OWC SPAR-BUOY
14
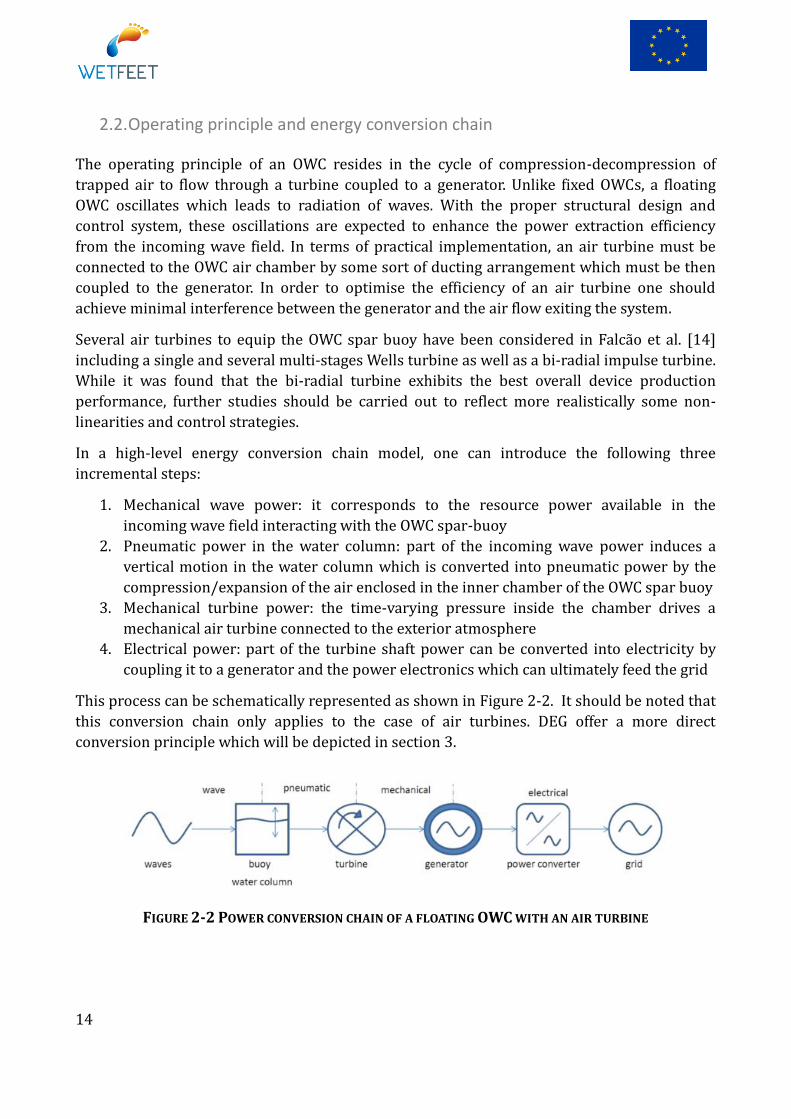
2.2. Operating principle and energy conversion chain
The operating principle of an OWC resides in the cycle of compression-decompression of
trapped air to flow through a turbine coupled to a generator. Unlike fixed OWCs, a floating
OWC oscillates which leads to radiation of waves. With the proper structural design and
control system, these oscillations are expected to enhance the power extraction efficiency
from the incoming wave field. In terms of practical implementation, an air turbine must be
connected to the OWC air chamber by some sort of ducting arrangement which must be then
coupled to the generator. In order to optimise the efficiency of an air turbine one should
achieve minimal interference between the generator and the air flow exiting the system.
Several air turbines to equip the OWC spar buoy have been considered in Falcão et al. [14]
including a single and several multi-stages Wells turbine as well as a bi-radial impulse turbine.
While it was found that the bi-radial turbine exhibits the best overall device production
performance, further studies should be carried out to reflect more realistically some non-
linearities and control strategies.
In a high-level energy conversion chain model, one can introduce the following three
incremental steps:
1. Mechanical wave power: it corresponds to the resource power available in the
incoming wave field interacting with the OWC spar-buoy
2. Pneumatic power in the water column: part of the incoming wave power induces a
vertical motion in the water column which is converted into pneumatic power by the
compression/expansion of the air enclosed in the inner chamber of the OWC spar buoy
3. Mechanical turbine power: the time-varying pressure inside the chamber drives a
mechanical air turbine connected to the exterior atmosphere
4. Electrical power: part of the turbine shaft power can be converted into electricity by
coupling it to a generator and the power electronics which can ultimately feed the grid
This process can be schematically represented as shown in Figure 2-2. It should be noted that
this conversion chain only applies to the case of air turbines. DEG offer a more direct
conversion principle which will be depicted in section 3.
FIGURE 2-2 POWER CONVERSION CHAIN OF A FLOATING OWC WITH AN AIR TURBINE

15
2.3. Control mechanisms
To date, control systems for wave energy have been primarily developed with the objective of
maximizing the power absorption or, more recently, maximizing directly the generated
electrical power output of the devices. In the context of OWCs, control mechanisms have been
predominantly implemented by means of valves which can regulate the level of air flow to
drive the air turbine. Two valves are typically employed [2]:
Relief valve: mounted in parallel with the turbine and connects the chamber with the
outside atmosphere with the purpose of avoiding turbine stall for very large flow rates.
High-speed stop valve: installed in series with the turbine to lock the air flow with the
purpose of latching control or controlling the flow rate.
In practice, the majority of control law algorithm cannot circumvent the need for short-term
wave forecasting. The wave prediction requirements essentially concern the need to inform
the controller with values of free surface elevations or wave excitation forces. Such
requirement originates from the non-causality of the optimal PTO force [16]. A recent
comparative study of two methods for short-term wave forecasting at the Pico plant [17],
shows that sensors measuring the free surface elevation up-wave of the plant and also the
wave elevation inside the chamber are necessary for accurate estimations. Other auxiliary
equipment commonly used for control mechanisms include a data acquisition system, power
electronics and a servo-computer.
Concerning the OWC spar buoy, Henriques et al. [18] tested a simple generator control law
both numerically and experimentally using a dry test rig. Relief valve and high-speed stop
valve have also been considered to control the threshold limits of the generator rotational
speed. Future work should seek a solution to cope with the large pressure difference observed
between the pneumatic chamber and the atmosphere.
2.4. Mooring system
The OWC spar buoy device uses a slack-mooring system with three equally-spaced mooring
lines, connecting the buoy to the sea bottom, as shown in Figure 2-3 from a top view
perspective. The mooring line configuration experimentally tested at Plymouth university’s
wave tank for a scaled version of a 16 meter diameter buoy at 80 meter water depth is
presented in Figure 2-4 [19].

16
FIGURE 2-3 TOP VIEW OF A SLACK MOORING SYSTEM WITH THREE BOTTOM MOORED LINES OF AN
ISOLATED OWC SPAR BUOY
FIGURE 2-4 REPRESENTATION OF A SINGLE LINE OF THE SLACK-MOORING SYSTEM. THE EXTREME
SITUATION WITH FULLY STRETCHED MOORING CONFIGURATION IS REPRESENTED IN DOTTED LINES
Under extreme wave conditions, it was observed that the mooring system of Figure 2-4 can
become fully stretched (situation represented in dotted line), which results in abnormal
mooring loads. This occurs for the mooring line closer to the wave source when it is oriented
with the wave direction, as presented in Figure 2-4.
17
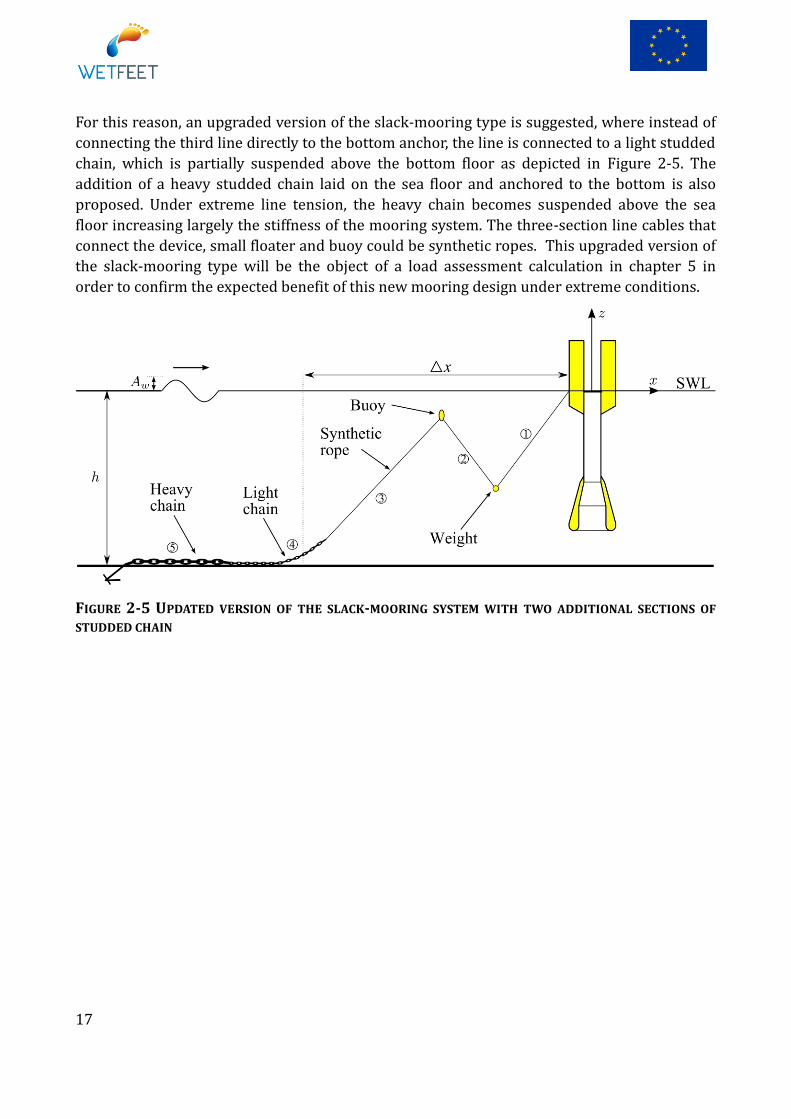
For this reason, an upgraded version of the slack-mooring type is suggested, where instead of
connecting the third line directly to the bottom anchor, the line is connected to a light studded
chain, which is partially suspended above the bottom floor as depicted in Figure 2-5. The
addition of a heavy studded chain laid on the sea floor and anchored to the bottom is also
proposed. Under extreme line tension, the heavy chain becomes suspended above the sea
floor increasing largely the stiffness of the mooring system. The three-section line cables that
connect the device, small floater and buoy could be synthetic ropes. This upgraded version of
the slack-mooring type will be the object of a load assessment calculation in chapter 5 in
order to confirm the expected benefit of this new mooring design under extreme conditions.
FIGURE 2-5 UPDATED VERSION OF THE SLACK-MOORING SYSTEM WITH TWO ADDITIONAL SECTIONS OF
STUDDED CHAIN
18
3. INTEGRATION OF BREAKTHROUGHS This chapter comprises the core elements serving as basis for the implementation of the
breakthroughs into the OWC spar-buoy. For each of the four breakthroughs previously
identified (NS, EAM, submergence and DEG), the following initial considerations will be made:
Technical description of the concepts with scientific background,
Highlighting the breakthrough potential of the concept for wave energy applications,
Proposing suitable and relevant architectures on how to integrate the breakthrough
concepts into the OWC spar-buoy,
Reviewing the existing numerical models to analyze the breakthroughs and
Strategy for developing (and/or coupling) the relevant numerical tools that are
currently missing or incomplete to carry out the relevant engineering analysis and
performance assessment
Preliminary high level considerations for two other breakthroughs (tetra-radial air turbine
and shared moorings) are included although there will receive dedicated treatment in other
work packages of the WETFEET project.
3.1. Negative spring
The OWC spar buoy can be considered as a heaving point absorber WEC because:
The horizontal dimensions (e.g. buoy diameter) are much smaller than the typical
wavelength of fully-developed seas.
The body structure and internal free surface of the water column are primarily moving
in heave.
The OWC spar buoy operates by using the relative heaving motion between the internal water
free surface and buoy structure. Each of these has its natural frequency which should be
sufficiently apart for the device to be efficient in a wide frequency range. To achieve optimal
power absorption conditions from a hydrodynamic standpoint, it has been shown that one
should aim to bring the heaving point absorber in resonance with the incoming waves [20],
[21]. However, this requires having buoys with large dimensions and mass. This results from
the usually large hydrostatic spring associated with heaving devices. A way to circumvent this
is to use a negative spring mechanism to compensate the very strong hydrostatic spring-like
effect, therefore resulting in a smaller and less stiff device.
19
Under a sinusoidal wave excitation with frequency and amplitude and under the linear
potential flow theory, the complex amplitude of the body heaving oscillation is given by:
(3-1)
Where is excitation force coefficient (in N/m) that only depends on the frequency of the
incident wave (and not on the body oscillation), is the hydrodynamic radiation damping of
the body (in N.s/m), and are the hydrodynamic added mass and the body mass (both in
kg), respectively, represents an external damping (in N.s/m, produced by any external
power take-off equipment and/or by viscous dissipation), represents an external spring
(in N/m, due to the power take-off equipment, the mooring lines, or any other process or
mechanism) and is the hydrostatic stiffness coefficient (in N/m) of the body.
The mathematical problem described in Eq. (3-1) corresponds to a “classic” mass-spring-
damper physical system for which the natural angular frequency (in rad/s) can be readily
determined as:
(3-2)
Theoretically, the maximum mean power (in W) of a single mode WEC can be achieved
under the following condition [22]:
(3-3)
Where:
is the complex excitation force due to the incoming waves (amplitude in N, phase in
rad)
is the hydrodynamic reactance of the body which relates to the total damping of the
system (in N.s/m)
From Eq. (3-3), the optimal velocity amplitude (in m/s) of the WEC in this mode of
absorption can be derived:
(3-4)
To achieve the optimum power absorption conditions enunciated in Eq. (3-3) or (3-4), there
exist (at least) two alternatives entirely equivalent:
Phase and amplitude control which forces the oscillation velocity to be in phase with
the excitation force and also that the velocity amplitude satisfies Eq. (3-4),
20
Reactive control or complex-conjugate control which essentially consists of cancelling
the inherent reactance of the system through a PTO reactance compensation.
While the above two control strategies have been the object of intense R&D effort over the
past three decades (see the review article by Ringwood et al. [16]), sub-optimal power
absorption conditions have also been investigated more recently. Moreover, it can be shown
that, from a PTO mechanism perspective, power absorption maximization leads to the
following conditions on the PTO stiffness, , and the PTO damping, :
(3-5) (3-6)
where is the mooring stiffness coefficient (in N/m)
In the case of heaving point absorber like the smaller designs of the OWC spar buoy, the
hydrodynamic stiffness is the dominant term in Eq. (3-5) (as long as the diameter of the
buoy remains relatively small, i.e below 12 meters) which means that has to be negative
for optimum control. To counterbalance this term with the objective to approach optimal
power absorption conditions, it emanates that the external spring (which includes the
terms and ) can be devised to approach or deviate from the resonance frequency
(see Eq. (3-2)), depending on the objectives of the design and application.
Negative springs (NS) are mechanical concepts which aim at improving the performance of
resonant WECs by tuning (usually by acting on ) over a wider range of incoming
wave frequencies than just the natural frequency of the structure. By nature, NS are unstable
systems when deviated from their equilibrium position. This property is key to reducing the
stiffness of heaving point absorber WECs and thus significantly improving the energy density
performance (e.g. ratios of annual energy production per unit of mass, per unit area or per
unit of PTO force).
Concepts exploiting the NS effects are currently under development by some researchers and
technology developers. In particular, the WaveSpring patented technology [23] which is part
of the CorPower wave energy device has been the object of several studies over recent years
[24], [25]. The WaveSpring provides phase control by a NS mechanical arrangement that
inherently widens the response bandwidth of point absorbers without the need for real-time
wave information or prediction algorithms.
In the case of the CorPower point absorber device, the NS module acts directly on the linear
mechanism of the buoy. This avoids the losses associated with transmitting large reciprocating
energy flows through the PTO system, a challenge that has limited the practical use of phase
control methods known as reactive control. Experimental wave tank testing of a 1:16 scaled
CorPower device [25] featuring pressurized cylinders to simulate the NS arrangement have
shown promising results, in particular:
21
Three times higher ratio of absorbed energy to significant PTO force.
Mooring line forces with maximum values less than 2.5 times the mean tension
Another experiment conducted at the wave basin of Aalborg university tested a single rotor of
the WEPTOS pitching WEC device with two different NS setups [26]. While no conclusive
performance improvement was noticeable from the physical model testing campaign
(probably due to frictional losses), a simple numerical model indicates positive benefits in
terms of efficiency of the device over a broader wave spectrum compared to the configuration
without NS.
Also recently, Zhang and Yang [27] developed a wave-to-wire numerical time domain model
capable of simulating the effects of non-linear snap through PTO mechanisms which resemble
very much the WaveSpring concept proposed for the CorPower device. Zhang and Yang [27],
[28] demonstrated that negative spring effects have the potential to increase the power
capture performance of heaving point absorbers in both regular and irregular waves. Further
insight regarding the impact of the relative difference between the natural frequency of the
body and the incoming wave frequency is given. The effects of the PTO damping coefficient
and the significant wave height on the power capture performance of the negative spring
concept are similar to those of the linear WEC.
Unlike the mechanical spring arrangement proposed by others, alternative NS concepts will be
investigated for the OWC spar buoy. Instead of controlling the PTO mechanism, these
alternative methods directly act on the hydrodynamic properties of the device. In the project,
two negative spring methods that use hydrostatic effects associated with the shape of the
OWC spar structure, will be explored to produce a negative spring effect without requiring any
mechanical or electrical component. This is expected to increase the level of reliability of the
system as problems associated with the fatigue of mechanical or pneumatic springs are
avoided. These two NS methods can be used in other heaving point absorbers but the
extension to other heaving devices other than OWC will not be undertaken in WETFEET.
The first NS method is intrinsically non-linear and as such requires non-linear numerical
modelling. An in-house partially non-linear code will be used at WavEC to study this effect.
This non-linear time-domain code computes the Froude-Krylov and hydrostatic forces [29],
[30] taking into consideration the actual position of the body and water free-surface, instead
of their mean position. To further improve the realism of the numerical simulations the most
promising configurations will be analysed with a fully non-linear Computational Fluid
Dynamic (CFD) tool [31]. This modelling approach will allow improving the understanding of
viscous effects (including vortex shedding) both in the water column flow and external flow.
The second NS method on the other hand is intrinsically linear and will be studied with linear
wave models in the frequency and time domains. If time allows it, CFD will be used to assess
viscous effects.
The work to be undertaken will address the impact of the two negative spring methods on the
device performance and motions and also on the stability of the device. For each OWC

22
geometry a parametric analysis will be taken to understand the effect of the main relevant
geometrical parameters.
3.2. Enhanced added-mass
An intrinsic geometric characteristic of the OWC spar buoy is the addition of a submerged
mass which allows for the enhancement of the added mass. The primary aim of this so-called
Enhanced Added Mass (EAM) is to reduce the device natural frequency in order to tune it in
accordance to the frequency of the predominant incoming waves while preserving the
hydrostatic stability.
One of the benefit of choosing an enlarged submerged shape (with concentrated added mass)
at the bottom of a spar floating structure is essentially to avoid having a structure with a
substantially longer draft which would be potentially more expensive and not suitable for
shallow to intermediate water depth. There exist a few different ways of increasing the added
mass (flat plates, horizontal cylinders, spherical ballast, etc); however, structural constraints
should be accounted for when designing the submerged structure.
Moreover, the submerged mass should preferably be located deep enough in order to reduce
the interference with the optimized radiation characteristics of the floater (which is essential
to maximize power absorption in the case of WECs). Therefore, the added mass coefficient of
the submerged mass should be roughly frequency independent (and so equal to the infinite-
frequency added mass coefficient).
In [12], Gomes et al. optimize simultaneously 5 design parameter variables of the OWC spar
buoy in terms of average annual power available to the turbine, denoted, . The length
and the thickness of the submerged mass along with the internal diameter at the bottom of
the OWC spar buoy are part of these 5 design variables (see red circles in Figure 3-1). The
distance between the floater and the submerged mass and the internal diameter of the spar
buoy are the other two optimization design variables (see black circles in Figure 3-1).
Although it is difficult to conclude on the most favourable size for the submerged mass based
on the results from [12], some valuable insight can be retrieved, including:
The submerged mass should be placed deep enough to avoid radiative effects with
negative impact on (confirmation of the previous statement)
There exist a region where the relative values of and lead to optimal

23
FIGURE 3-1 OPTIMIZATION VARIABLES CONSIDERED IN [12]: THE SUBMERGED MASS PARAMETERS ARE
CIRCLED IN RED
Eventually, the submerged mass also contributes to lowering the gravity centre and so
contributing to the vertical stability of the device. In chapter 5, the preliminary design and
structural analysis will consider reference design cases of the OWC spar buoy already
featuring the EAM following the design optimization results previously obtained in [12]. This
will allow understanding better the stresses that the structure can experience under extreme
load cases.
Future work to investigate further the optimal shape of the submerged mass could consist of
adding a stability criteria to the optimization scheme proposed in [12], which would have to
consider a detailed mass distribution. Replacing the objective function to account for the
added cost incurred by the construction of such submerged mass is also a possibility.
24
3.3. Survivability submergence
The majority of floating WECs, such as the OWC spar buoy, are moored on the surface of the
ocean and - as a result - are fully exposed to storms. This is one of the major causes for the
conspicuous survivability issues affecting wave energy technology (and any surface-floating
structure in the ocean, for that matter).
Given the utmost importance of survivability in the relatively high upfront capital cost of WEC
prototypes deployed offshore, device developers often preferred a retrieval strategy in
anticipation of harsh environmental conditions for floating WEC prototypes during sea-trials.
However, in the context of a commercial array of multi-unit devices, it seems economically
hardly acceptable to rely on the need to hire vessel(s) every time the forecast indicates rough
climate conditions which may damage the devices.
To overcome this issue, one solution is to design the device and its structure in such a way that
they can sustain the vast majority of environmental conditions observed at site. This implies
applying large safety factors in the structural design process. Finding the appropriate trade-off
between safety, cost and performance of the device can thus become a highly complex
equation. Alternatively, devising an on-site survivability strategy allowing the protection of the
device during harsh environmental conditions, which would not require the intervention of
specialized vessel/equipment/personnel, appears to be an attractive solution. For this reason,
device submergence is proposed as a breakthrough concept in the WETFEET project.
Device submergence under extreme conditions is expected to increase survivability and
reduce the structural requirements of mooring lines and possibly of device structure and
components, thus allowing for fewer materials to be used. There are three critical aspects to
consider from a hydrodynamic engineering perspective:
hydrostatic pressure increase due to converter submergence,
the submergence level for significant wave load reduction under storm conditions and
the stability of the converter in the water column, as well as the solutions for water
tightness
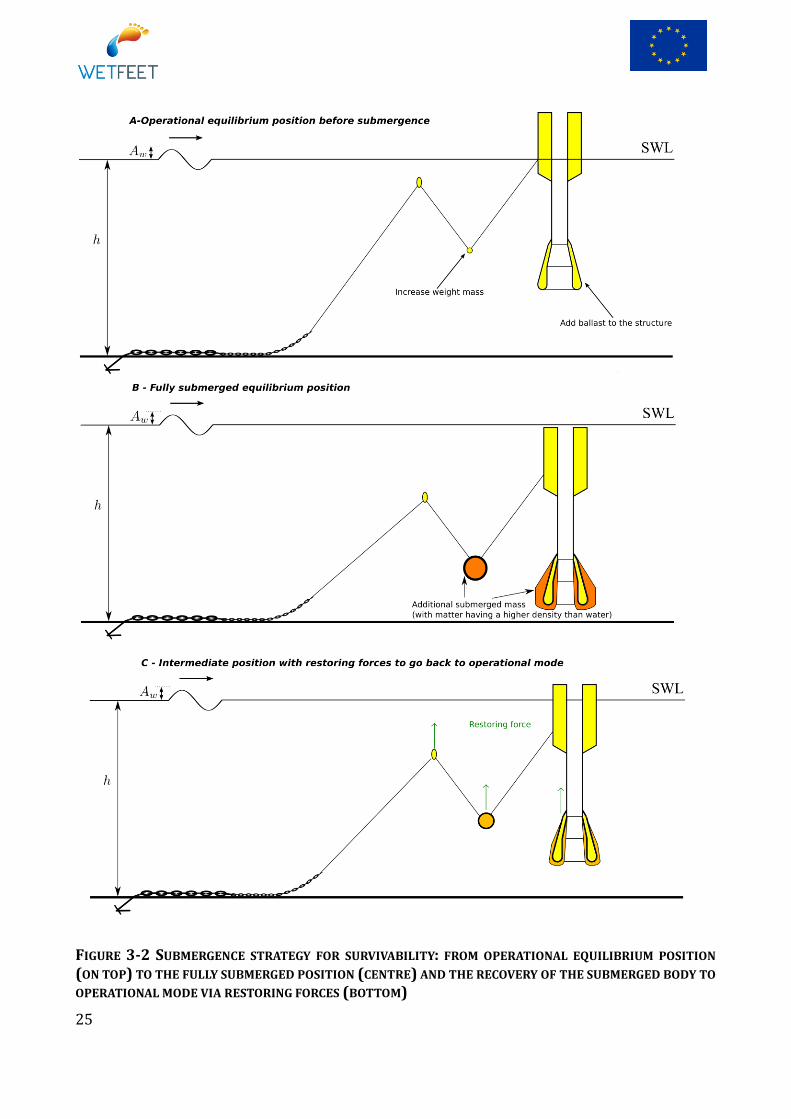
Concerning the OWC spar buoy, it is envisaged to achieve device submergence by:
actively controlling the mooring elements so that a pulling force towards the sea-
bottom is applied to the fairleads of the device
ballasting the structure to increase the submerged mass of the body
a combination of the two previous methods
The combination of these submergence methods is schematically represented in Figure 3-2.
25
FIGURE 3-2 SUBMERGENCE STRATEGY FOR SURVIVABILITY: FROM OPERATIONAL EQUILIBRIUM POSITION
(ON TOP) TO THE FULLY SUBMERGED POSITION (CENTRE) AND THE RECOVERY OF THE SUBMERGED BODY TO
OPERATIONAL MODE VIA RESTORING FORCES (BOTTOM)
26
The feasibility of the proposed submergence strategies will be assessed through various
stages of numerical modelling. First, a frequency domain analysis will be used to quantify the
wave-induced motions of the device (particularly in heave, pitch and roll) at different
submergence depth. For this purpose, the hydrodynamic coefficients of the OWC spar buoy
structure will be computed using the WAMIT boundary element method code. Frequency
domain Response Amplitude Operators (RAOs) can then be plotted to verify the viability of
the wave-induced motions.
To complement the above simplified linear study, the non-linear time domain code Ship@Sea
is going to be utilized. Ship@Sea is based on the strip theory [32] and was originally designed
to simulate the parametric rolling of a vessel. For the purpose of this study, the code is going to
be extended and adapted to the OWC spar buoy. As for the frequency domain calculations in
WAMIT, several draft levels of the OWC spar buoys will be investigated. Time domain motion
responses of the OWC spar buoy will result from this analysis. Together, the two above-
mentioned studies will help de-risking the submergence strategy by assessing the
susceptibility and severity of occurrence of dynamic instabilities in waves of the OWC spar
buoy during the procedure.
Furthermore, the complete behaviour of the submerged device as well as the solicitation of
the mooring lines in storm conditions will be assessed through the Orcaflex™ software.
Orcaflex™ is one the most recognized tools to model the dynamics of ships and offshore cables
such as mooring lines or power cables. On the one hand, static analysis can provide a quick
and accurate numerical assessment of the forces required to submerge and emerge (restoring
forces) the OWC spar buoy (this work shall be conducted as part of WP3 of the WETFEET
project). On the other hand, time-domain simulations of the fully submerged configuration
(see centred Figure 3-2-B) under extreme wave conditions shall provide further insight on the
design requirements for the OWC spar buoy. Finally, physical model testing will also be carried
out in the FloWave tank facility in Edinburgh to assess experimentally the submergence
procedure.
The expected results from these simulations will be compared to the reference case studied in
chapter 5 to assess the additional structural and design requirements associated with the
submergence of the entire device. In turn, this numerical modelling work will support the
feasibility study, the in-depth engineering analysis and the tank testing which will be carried
out in work package 3.
Other critical engineering issues associated with the submergence strategy which shall be
discussed include:
Ensure proper sealing and protection of all on-board electro-mechanic and power
electronic equipment fitted in the OWC spar buoy
Risk of collision with the seabed
Material corrosion, and in particular, the areas of the structure alternatively exposed to
the atmosphere or the ocean/sea environment
27
Fatigue of the critical active parts of the submergence procedure
3.4. Dielectric elastomer generators
The operating principle of a Dielectric Elastomer Generator (DEG) has been conceived less
than a decade ago and it is based on a solid-state deformable transducer made of elastic
polymers that can convert mechanical energy into direct electricity via the variable-
capacitance electrostatic generation principle.
In the context of wave energy harvesting, potential advantages of DEG technology over
traditional PTO systems are: direct drive cyclical operation with good energetic efficiency that
is almost independent of wave period; easier installation and maintenance; and lower costs.
The feasibility of energy conversion from waves to electricity employing a DEG-PTO has been
generally demonstrated in the Future Emerging Technologies EU Project PolyWEC (Pj.Ref.
309139). Specifically, DEGs have been tested in operative condition in scaled laboratory
experiments and show their concrete potentiality as energy converters. Small scale prototypes
in the watt-range have shown experimentally verified wave-to-wire energy densities of 0.7
kJ/kg (i.e. energy converted for each cycle by a unit volume of employed dielectric material)
and conversion efficiencies of nearly 25%, but the concrete perspective is to increase energy
density up 1 kJ/kg and efficiency up to 60-70% in a relative short timeframe by using more
efficient materials. For example, the multinational company WACKER Polymers has recently
released a new product that is specifically dedicated to the application of DEG named Elastosil
Film that is showing extremely promising performances.
However, given that, DEGs are still an emerging technology, they have not yet been considered
for prototypes in the framework of WETFEET project, but the further development of DEG as
future PTO is pursued in a dedicated work package, WP5. Specifically, the main aim of WP5 is
to: 1) conceive and characterize new conducting and dielectric deformable materials (beyond
the sole silicone elastomers investigated within the PolyWEC project) that will be pursued to
enhance DEG performances; 2) as well as to validate their fatigue life and degradation; 3)
develop and verify more accurate models that will be employed for the design and control of
the system.
However, in order to steer the research toward tangible applications, a study is going to be
conducted in order to define DEG-PTO to be integrated into the concrete WEC concepts of
spar-buoy OWC and Symphony. An accurate definition of the layout and dimensioning of a
possible DEG-PTO to be integrated in such WEC concepts should go through an in-depth
hydrodynamic analysis that is not yet available at the current stage of the project. However, it
is possible to draw an initial hypothesis of layout through a preliminary analysis based on
theoretical considerations and on the results of previous experiments conducted by some of
the partners of the consortium. Specifically, the following approach is assumed:
28
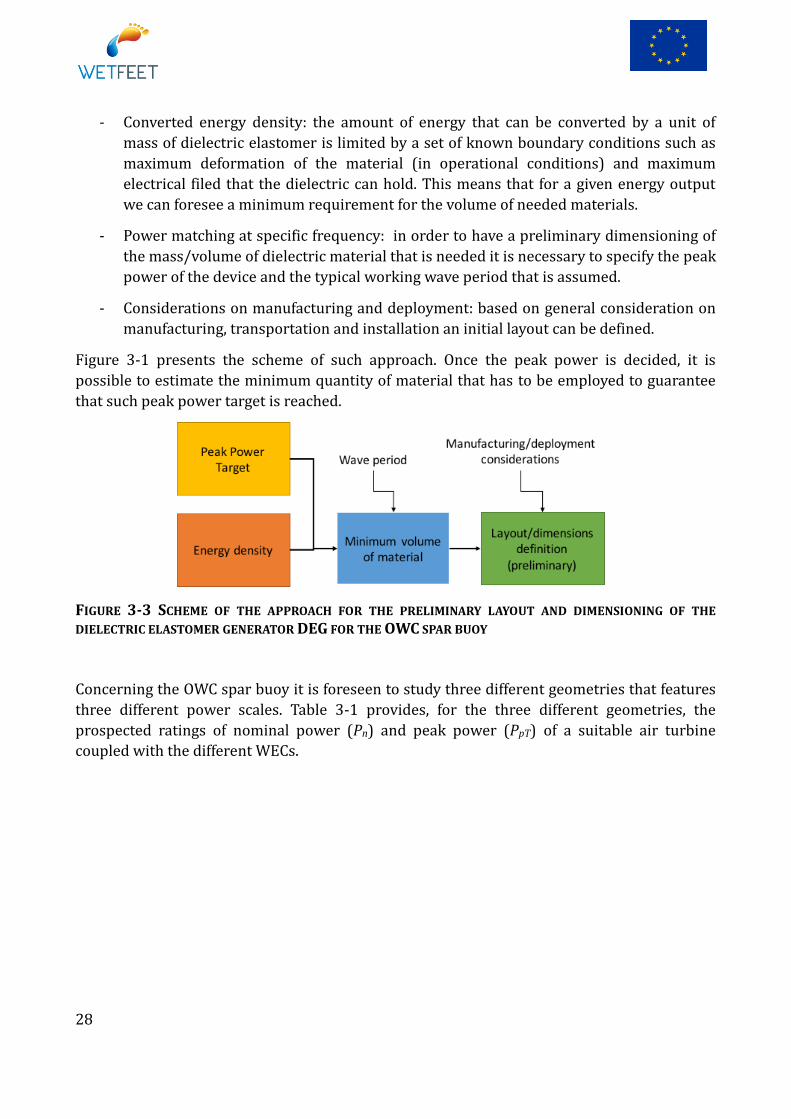
- Converted energy density: the amount of energy that can be converted by a unit of
mass of dielectric elastomer is limited by a set of known boundary conditions such as
maximum deformation of the material (in operational conditions) and maximum
electrical filed that the dielectric can hold. This means that for a given energy output
we can foresee a minimum requirement for the volume of needed materials.
- Power matching at specific frequency: in order to have a preliminary dimensioning of
the mass/volume of dielectric material that is needed it is necessary to specify the peak
power of the device and the typical working wave period that is assumed.
- Considerations on manufacturing and deployment: based on general consideration on
manufacturing, transportation and installation an initial layout can be defined.
Figure 3-1 presents the scheme of such approach. Once the peak power is decided, it is
possible to estimate the minimum quantity of material that has to be employed to guarantee
that such peak power target is reached.
FIGURE 3-3 SCHEME OF THE APPROACH FOR THE PRELIMINARY LAYOUT AND DIMENSIONING OF THE
DIELECTRIC ELASTOMER GENERATOR DEG FOR THE OWC SPAR BUOY
Concerning the OWC spar buoy it is foreseen to study three different geometries that features
three different power scales. Table 3-1 provides, for the three different geometries, the
prospected ratings of nominal power (Pn) and peak power (PpT) of a suitable air turbine
coupled with the different WECs.

29
FIGURE 3-4 SCHEMATIC REPRESENTATIONS OF TWO POSSIBLE SOLUTIONS FOR THE INSTALLATION OF THE
DIELECTRIC ELASTOMER GENERATOR FOR THE OWC SPAR BUOY
Given the expected peak power rates of the turbines it is possible to provide a preliminary
dimensioning of the DEG defining the minimum volume of dielectric material that is required.
Specifically, assuming an energy density of the DEG of 0.7kJ/kg and a wave period of 10s we
obtain the following required volume of materials for the 3-meter, 6-meter and 12-meter
diameter OWC spar buoys: 3=171kg; 6=928kg, 12=3571kg1.
At first instance, the architecture of the Circular-Diaphragm DEG (CD-DEG) is adopted, in
which the deformation of the DEG is obtained through the inflation of a relatively thin
membrane made of alternative layers of conductive and dielectric elastomers (see Figure 3-
2a). In this configuration, the air acts as a compliant reactive component between the water
mass and the DEG which might worsen/influence the dynamic response of the WEC. In a
further version, in order to eliminate the volume of air, architectures where the membrane is
submerged could be considered (Figure 3-2b). In both these architectures, assuming that the
diameter of the membrane is equal to the buoy diameter, the approximate thickness (s) for the
DEG membrane can be calculated (see Table 3-1) for the DEG.
TABLE 3-1 DIMENSION AND DATA OF HYPOTHETIC TURBINE PTO AND PEAK-EQUIVALENT DEG-PTO
Geometry Diameter Turbine Data DEG-PTO Data
Pn PpT PpD s
1 Such relevant amount of material should be considered a major limitation to the technology since it is relevant to remark the raw material can feature a very low-cost of approximately 1-2€/kg.
DEG membrane
Air chamber
SWL
D
SWL
DDEG membrane
Water Column
(a) (b)

30
3-meter 3 m 4 kW 12 kW 12.37 kW 171 kg 25 mm
6-meter 6 m 23 kW 65 kW 65.31 kW 928 kg 33 mm
12-meter 12 m 101 kW 250 kW 253.3 kW 3571 kg 32 mm
3.4.1. Manufacturing considerations
Industrial manufacturing of large DEGs is still a rather unexplored challenge. The simplest and
cheapest manufacturing process that is foreseen to be employed for achieving a multilayer
structure of conductive and dielectric layers is the multi-roll-coating technique. This process is
a continuous production process that applies coating during the rolling process of the raw
material.
However, due limitation in the length of the rolling cylinder of rolling machines the maximum
dimensions of membranes than can be processed are limited. Specifically, it is estimated that
with current production technologies it is foreseen the possibility of manufacturing
membranes with a maximum diameter of 4m. In order to overcome this limitation new roll-
coating machines or different production processes have to be studied.
A different arrangement of membranes could be conceived according to this constraint by
considering the use of multiple 4-meter membranes for the two larger OWC spar buoy
geometries. Specifically, Table 3-2 indicates the number of 4-meter membranes that should be
required for the 6-meter and 12-meter geometries. These are calculated assuming that the
maximum thickness of the multilayer membrane should be below 35 mm in order to limit the
number of layers.
TABLE 3-2 NUMBER OF 4-METERS MEMBRANE REQUIRE TO PROVIDE THE EQUIVALENT PEAK-POWER
Geometry n. of 4-m Ppk Peak
Power
6-meter 3 25.mm 65.9kW
12-meter 9 32mm 253.3kW
3.5. Preliminary considerations for shared moorings
As for the offshore wind sector, if offshore wave energy is to become commercially viable,
farms of multi-unit devices will be deployed at a given site rather than single unit in order to
be able to payback (through the revenue generated by the electricity produced) the significant
upfront capital cost notably due to the electrical grid connection. Due to the relatively low
rated power of full-scale wave energy machines that have been tested to-date (typically less
than 1 MW), it is anticipated that a large number of WEC units would be needed to match the
31
300-500MW offshore wind farms which are now close to be competitive with other renewable
energy plants.
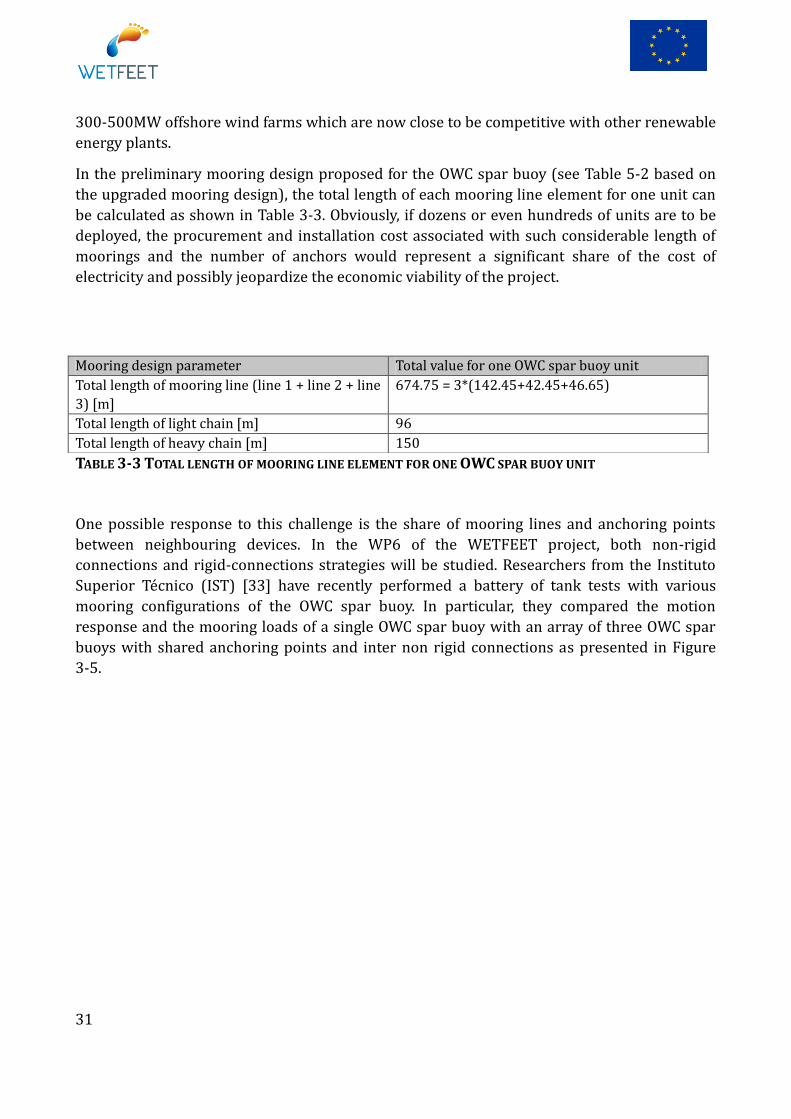
In the preliminary mooring design proposed for the OWC spar buoy (see Table 5-2 based on
the upgraded mooring design), the total length of each mooring line element for one unit can
be calculated as shown in Table 3-3. Obviously, if dozens or even hundreds of units are to be
deployed, the procurement and installation cost associated with such considerable length of
moorings and the number of anchors would represent a significant share of the cost of
electricity and possibly jeopardize the economic viability of the project.
TABLE 3-3 TOTAL LENGTH OF MOORING LINE ELEMENT FOR ONE OWC SPAR BUOY UNIT
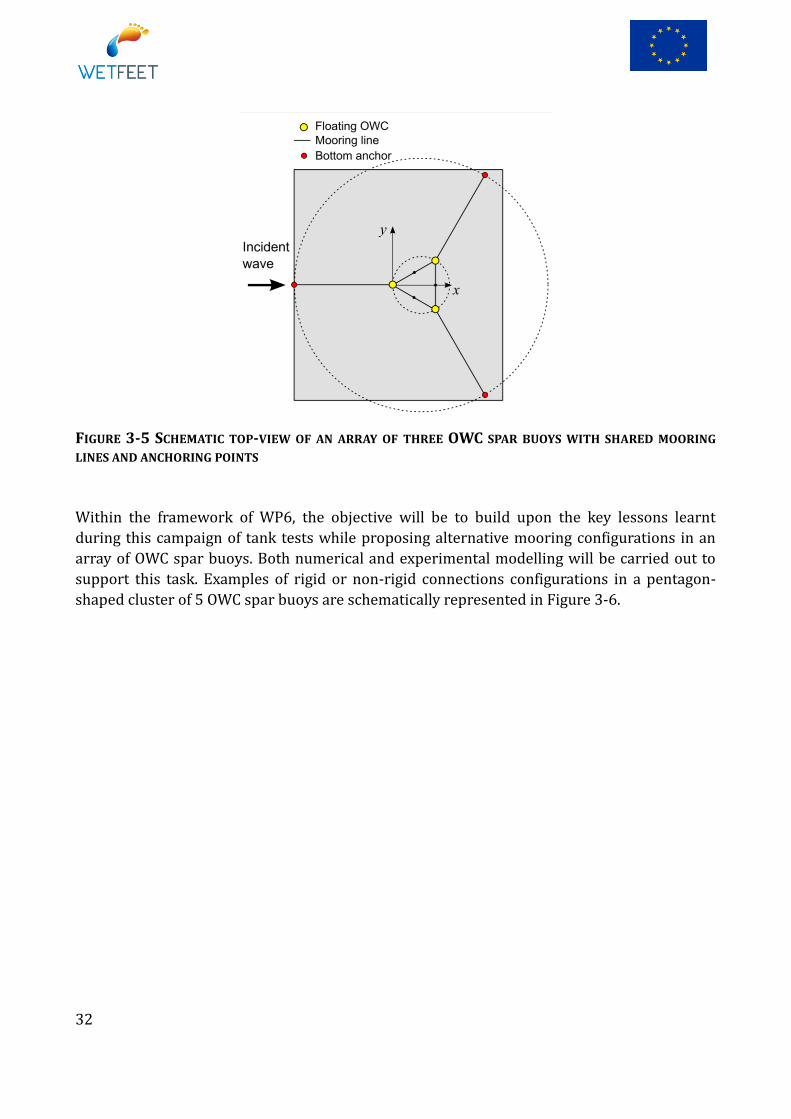
One possible response to this challenge is the share of mooring lines and anchoring points
between neighbouring devices. In the WP6 of the WETFEET project, both non-rigid
connections and rigid-connections strategies will be studied. Researchers from the Instituto
Superior Técnico (IST) [33] have recently performed a battery of tank tests with various
mooring configurations of the OWC spar buoy. In particular, they compared the motion
response and the mooring loads of a single OWC spar buoy with an array of three OWC spar
buoys with shared anchoring points and inter non rigid connections as presented in Figure
3-5.
Mooring design parameter Total value for one OWC spar buoy unit
Total length of mooring line (line 1 + line 2 + line
3) [m]
674.75 = 3*(142.45+42.45+46.65)
Total length of light chain [m] 96
Total length of heavy chain [m] 150
32
FIGURE 3-5 SCHEMATIC TOP-VIEW OF AN ARRAY OF THREE OWC SPAR BUOYS WITH SHARED MOORING
LINES AND ANCHORING POINTS
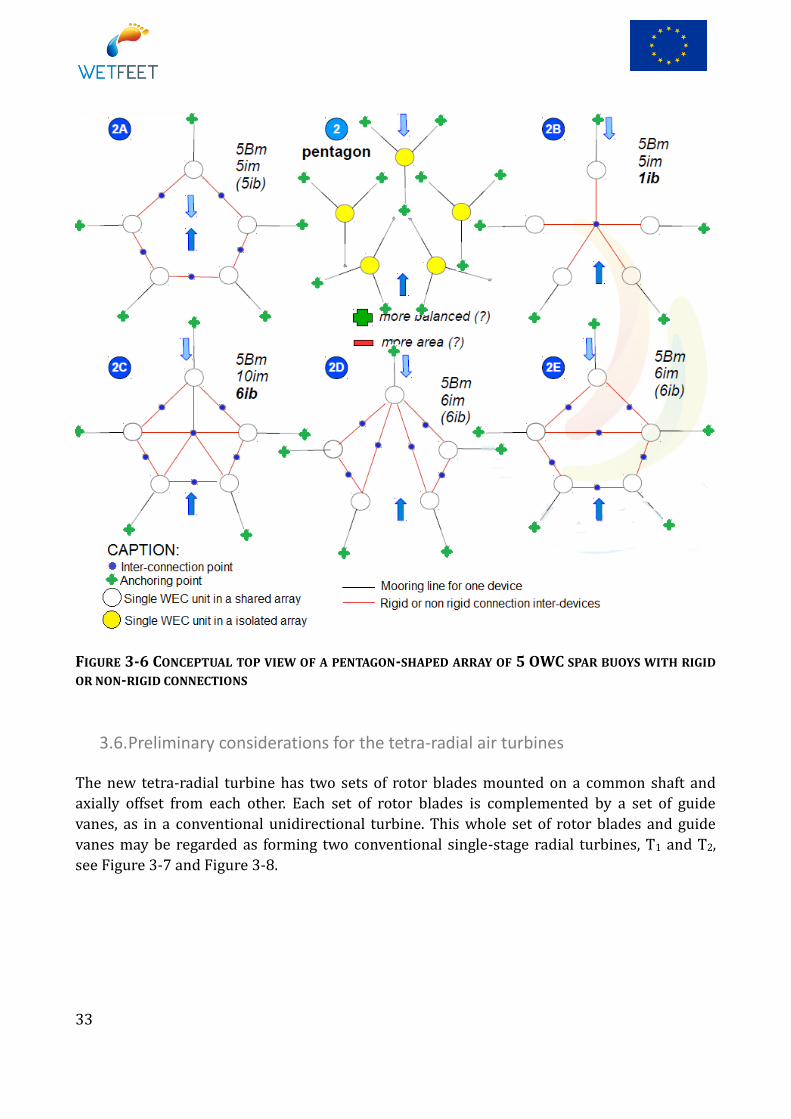
Within the framework of WP6, the objective will be to build upon the key lessons learnt
during this campaign of tank tests while proposing alternative mooring configurations in an
array of OWC spar buoys. Both numerical and experimental modelling will be carried out to
support this task. Examples of rigid or non-rigid connections configurations in a pentagon-
shaped cluster of 5 OWC spar buoys are schematically represented in Figure 3-6.
33
FIGURE 3-6 CONCEPTUAL TOP VIEW OF A PENTAGON-SHAPED ARRAY OF 5 OWC SPAR BUOYS WITH RIGID
OR NON-RIGID CONNECTIONS
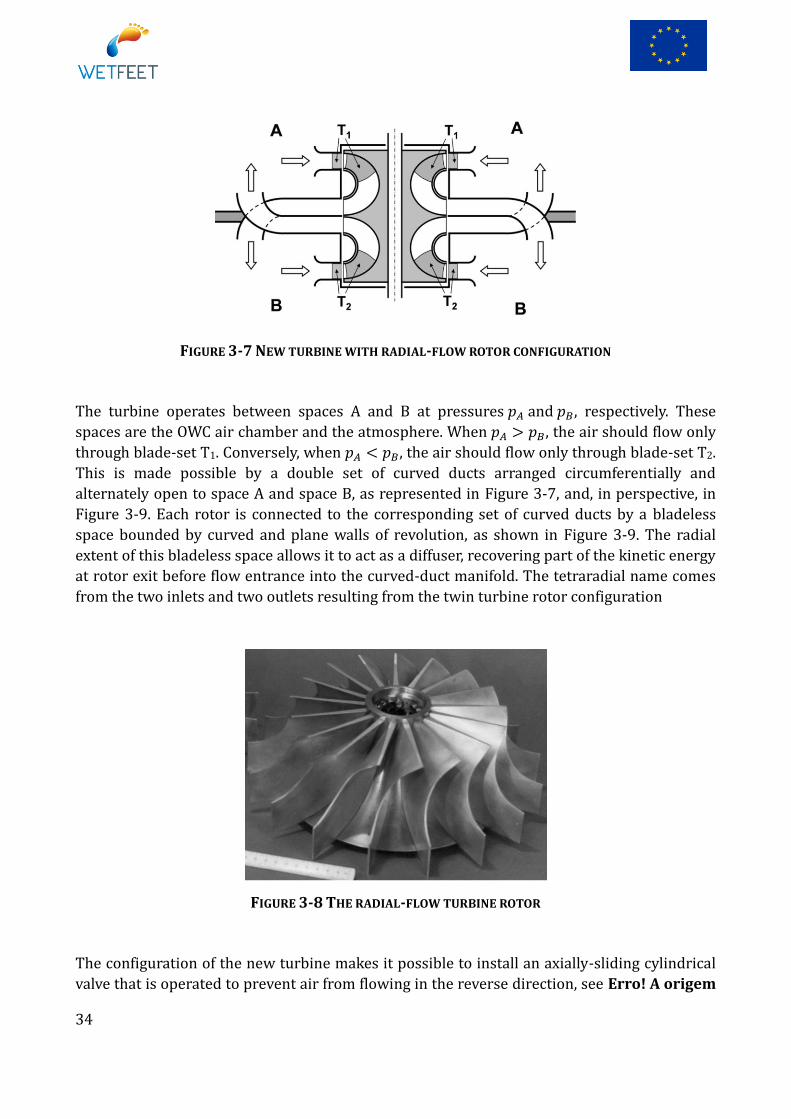
3.6. Preliminary considerations for the tetra-radial air turbines
The new tetra-radial turbine has two sets of rotor blades mounted on a common shaft and
axially offset from each other. Each set of rotor blades is complemented by a set of guide
vanes, as in a conventional unidirectional turbine. This whole set of rotor blades and guide
vanes may be regarded as forming two conventional single-stage radial turbines, T1 and T2,
see Figure 3-7 and Figure 3-8.
34
FIGURE 3-7 NEW TURBINE WITH RADIAL-FLOW ROTOR CONFIGURATION
The turbine operates between spaces A and B at pressures and , respectively. These
spaces are the OWC air chamber and the atmosphere. When , the air should flow only
through blade-set T1. Conversely, when , the air should flow only through blade-set T2.
This is made possible by a double set of curved ducts arranged circumferentially and
alternately open to space A and space B, as represented in Figure 3-7, and, in perspective, in
Figure 3-9. Each rotor is connected to the corresponding set of curved ducts by a bladeless
space bounded by curved and plane walls of revolution, as shown in Figure 3-9. The radial
extent of this bladeless space allows it to act as a diffuser, recovering part of the kinetic energy
at rotor exit before flow entrance into the curved-duct manifold. The tetraradial name comes
from the two inlets and two outlets resulting from the twin turbine rotor configuration
FIGURE 3-8 THE RADIAL-FLOW TURBINE ROTOR
The configuration of the new turbine makes it possible to install an axially-sliding cylindrical
valve that is operated to prevent air from flowing in the reverse direction, see Erro! A origem

35
da referência não foi encontrada. This is made easier by the relatively small size and stroke
of the valve. The valve actuator may be pneumatic, electrical or of other type. The valve may be
used in three positions as represented in Figure 3-10. If the valve actuator is fast enough
(opening and closing times not exceeding a few tens of a second), then this provides a way of
phase-controlling the OWC plant by latching. Latching is known to be an effective way of
substantially increasing the amount of energy absorbed from the waves by oscillating body
devices. Only recently, with the emergence of new turbines like the biradial turbine, has phase
control by latching started to be seriously considered as applicable to OWC converters [34],
[35]. This could be enhanced by the new turbine proposed here.
FIGURE 3-9 PERSPECTIVE REPRESENTATION OF THE CURVED-DUCT MANIFOLD, WITH A) TRAPEZOIDAL, B)
CIRCULAR AND C) ELLIPTICAL EXIT SECTIONS
FIGURE 3-10 THREE-POSITION AXIALLY-SLIDING VALVE
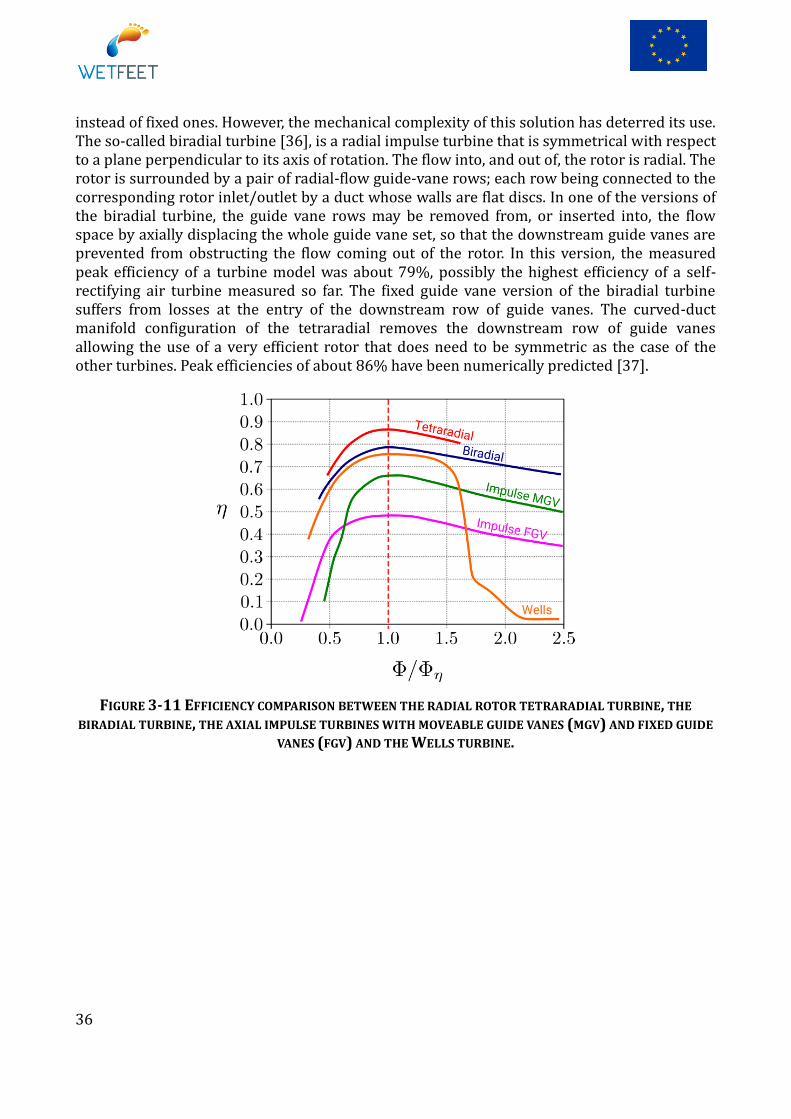
The efficiency of the self-rectifying axial-flow impulse turbine with fixed guide vanes is severely affected by the losses at the entry to the downstream row of guide vanes. Peak efficiencies measured in model testing do not exceed about 50% (as compared with about 75% for the most efficient Wells turbines), see Fig. 3.13. On the other hand, the efficiency curves do not exhibit the sharp drop typical of most Wells turbines. The performance of the axial-flow impulse turbine can improve by about 10 to 15% if moveable guide vanes are used
36
instead of fixed ones. However, the mechanical complexity of this solution has deterred its use. The so-called biradial turbine [36], is a radial impulse turbine that is symmetrical with respect to a plane perpendicular to its axis of rotation. The flow into, and out of, the rotor is radial. The rotor is surrounded by a pair of radial-flow guide-vane rows; each row being connected to the corresponding rotor inlet/outlet by a duct whose walls are flat discs. In one of the versions of the biradial turbine, the guide vane rows may be removed from, or inserted into, the flow space by axially displacing the whole guide vane set, so that the downstream guide vanes are prevented from obstructing the flow coming out of the rotor. In this version, the measured peak efficiency of a turbine model was about 79%, possibly the highest efficiency of a self-rectifying air turbine measured so far. The fixed guide vane version of the biradial turbine suffers from losses at the entry of the downstream row of guide vanes. The curved-duct manifold configuration of the tetraradial removes the downstream row of guide vanes allowing the use of a very efficient rotor that does need to be symmetric as the case of the other turbines. Peak efficiencies of about 86% have been numerically predicted [37].
FIGURE 3-11 EFFICIENCY COMPARISON BETWEEN THE RADIAL ROTOR TETRARADIAL TURBINE, THE
BIRADIAL TURBINE, THE AXIAL IMPULSE TURBINES WITH MOVEABLE GUIDE VANES (MGV) AND FIXED GUIDE
VANES (FGV) AND THE WELLS TURBINE.
37
4. MARINE OPERATIONS Maritime operations requirements are expected to present an important influence in the
design considerations of the OWC spar buoy. Five distinct operations strategies are envisaged:
load-out at the shipyard, transportation to the deployment site, installation, retrieval and
access for maintenance. The oil and gas industry has a large experience in marine operations
with spar structures. However, some operations involve complex and expensive procedures,
e.g. the rental of specific vessels for transportation and installation or the offshore ballasting,
which are avoided for the case of the OWC spar buoy. In fact, the cost of O&G offshore
operations represents a significant part in the whole project. This relative cost becomes even
more significant if the same know-how and infrastructure are applied in wave energy. The
reduction of these costs through the simplification of processes and the use of fewer support
infrastructures is a challenge that all wave energy technologies face.
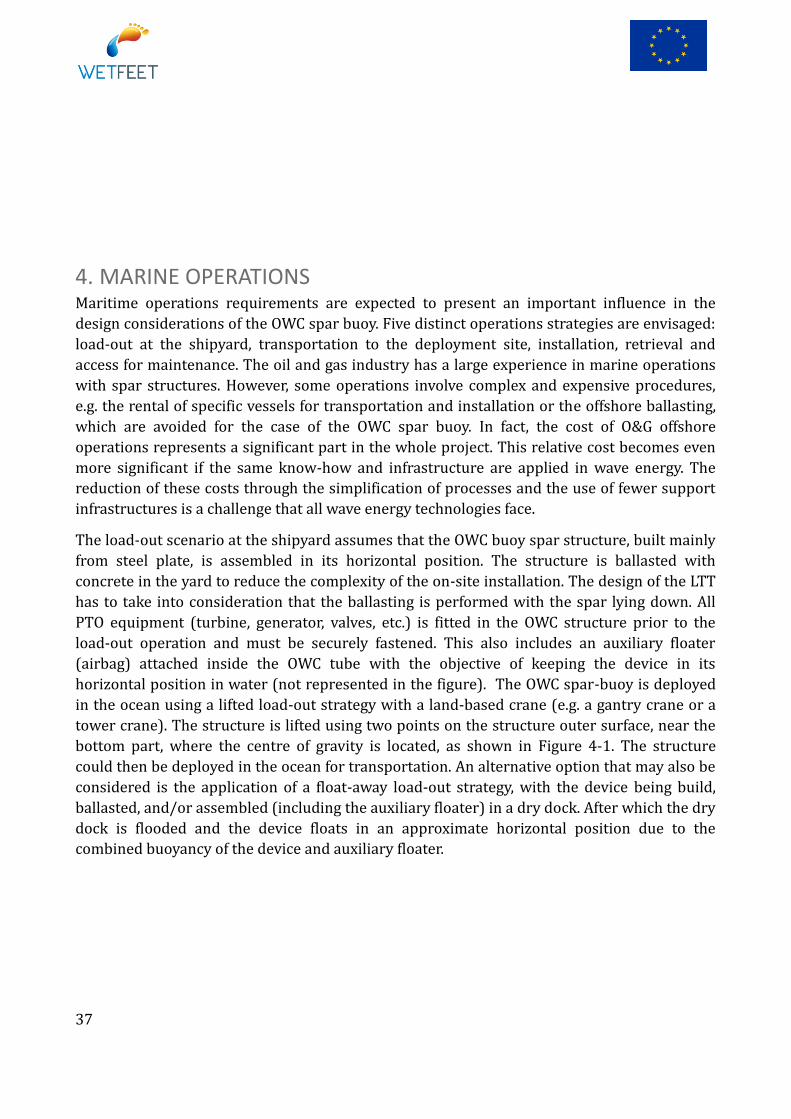
The load-out scenario at the shipyard assumes that the OWC buoy spar structure, built mainly
from steel plate, is assembled in its horizontal position. The structure is ballasted with
concrete in the yard to reduce the complexity of the on-site installation. The design of the LTT
has to take into consideration that the ballasting is performed with the spar lying down. All
PTO equipment (turbine, generator, valves, etc.) is fitted in the OWC structure prior to the
load-out operation and must be securely fastened. This also includes an auxiliary floater
(airbag) attached inside the OWC tube with the objective of keeping the device in its
horizontal position in water (not represented in the figure). The OWC spar-buoy is deployed
in the ocean using a lifted load-out strategy with a land-based crane (e.g. a gantry crane or a
tower crane). The structure is lifted using two points on the structure outer surface, near the
bottom part, where the centre of gravity is located, as shown in Figure 4-1. The structure
could then be deployed in the ocean for transportation. An alternative option that may also be
considered is the application of a float-away load-out strategy, with the device being build,
ballasted, and/or assembled (including the auxiliary floater) in a dry dock. After which the dry
dock is flooded and the device floats in an approximate horizontal position due to the
combined buoyancy of the device and auxiliary floater.
38
FIGURE 4-1 REPRESENTATION OF THE LIFT POINTS FOR THE LIFTED LOAD-OUT STRATEGY WITH THE BUOY
HORIZONTAL
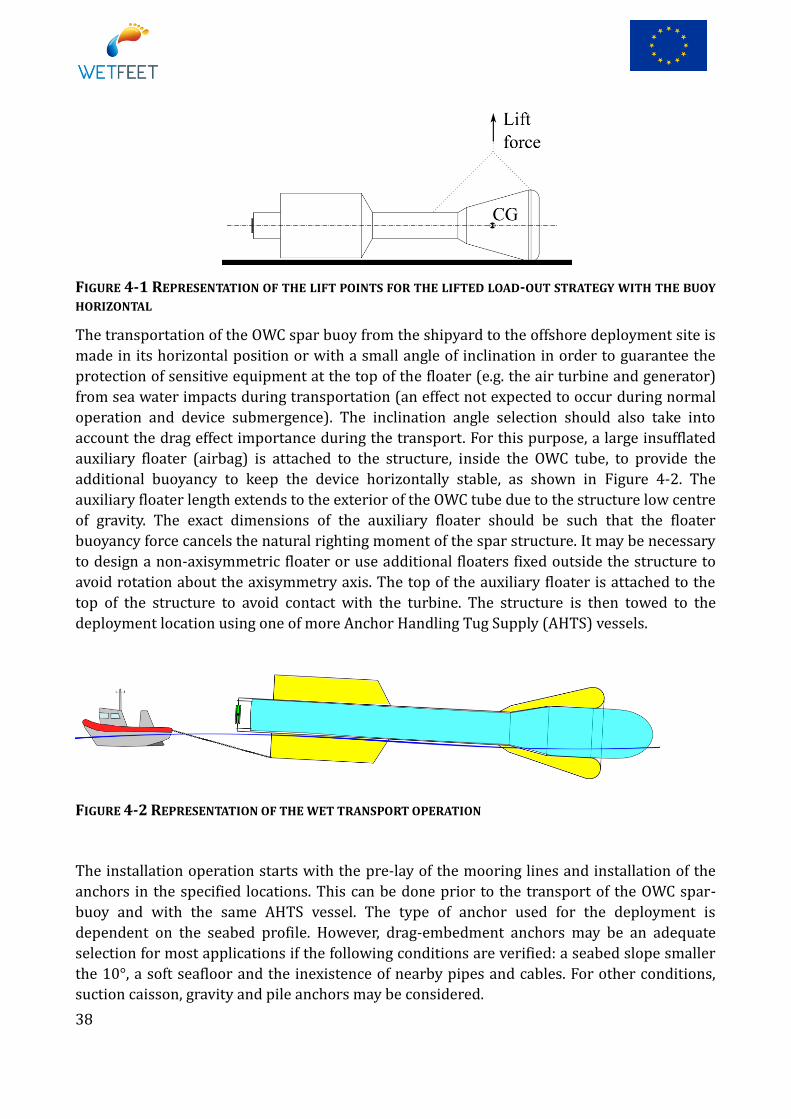
The transportation of the OWC spar buoy from the shipyard to the offshore deployment site is
made in its horizontal position or with a small angle of inclination in order to guarantee the
protection of sensitive equipment at the top of the floater (e.g. the air turbine and generator)
from sea water impacts during transportation (an effect not expected to occur during normal
operation and device submergence). The inclination angle selection should also take into
account the drag effect importance during the transport. For this purpose, a large insufflated
auxiliary floater (airbag) is attached to the structure, inside the OWC tube, to provide the
additional buoyancy to keep the device horizontally stable, as shown in Figure 4-2. The
auxiliary floater length extends to the exterior of the OWC tube due to the structure low centre
of gravity. The exact dimensions of the auxiliary floater should be such that the floater
buoyancy force cancels the natural righting moment of the spar structure. It may be necessary
to design a non-axisymmetric floater or use additional floaters fixed outside the structure to
avoid rotation about the axisymmetry axis. The top of the auxiliary floater is attached to the
top of the structure to avoid contact with the turbine. The structure is then towed to the
deployment location using one of more Anchor Handling Tug Supply (AHTS) vessels.
FIGURE 4-2 REPRESENTATION OF THE WET TRANSPORT OPERATION
The installation operation starts with the pre-lay of the mooring lines and installation of the
anchors in the specified locations. This can be done prior to the transport of the OWC spar-
buoy and with the same AHTS vessel. The type of anchor used for the deployment is
dependent on the seabed profile. However, drag-embedment anchors may be an adequate
selection for most applications if the following conditions are verified: a seabed slope smaller
the 10°, a soft seafloor and the inexistence of nearby pipes and cables. For other conditions,
suction caisson, gravity and pile anchors may be considered.
39
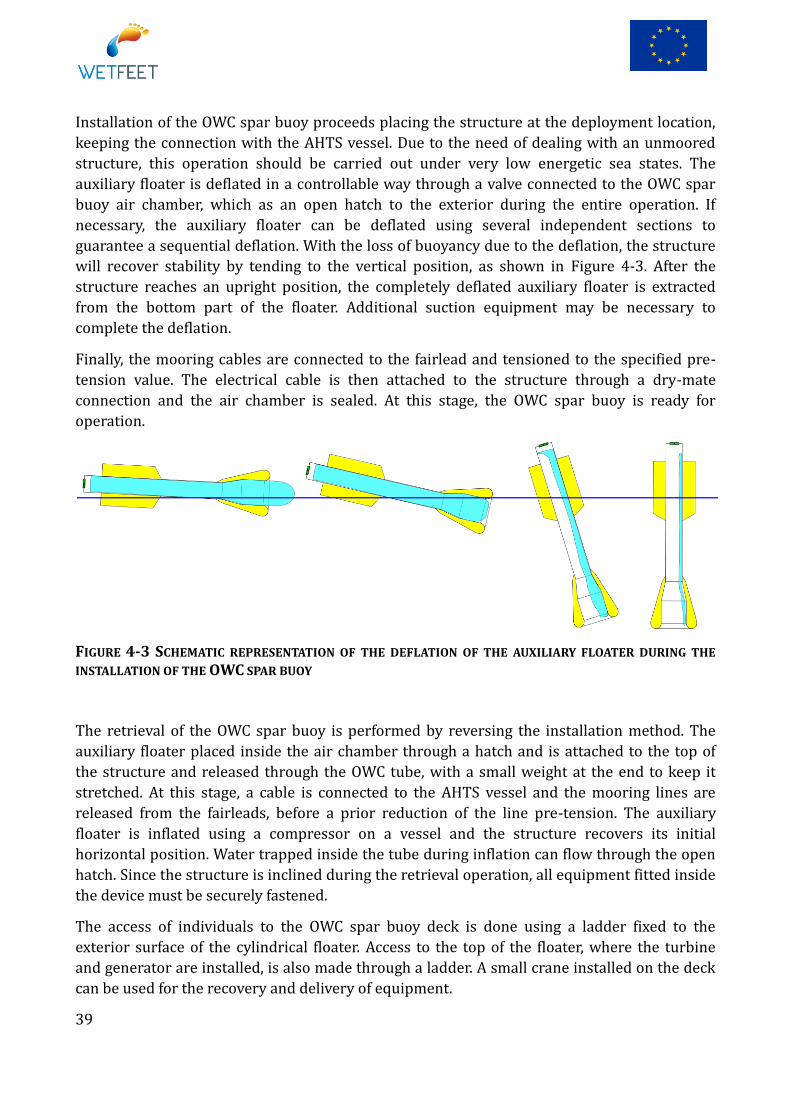
Installation of the OWC spar buoy proceeds placing the structure at the deployment location,
keeping the connection with the AHTS vessel. Due to the need of dealing with an unmoored
structure, this operation should be carried out under very low energetic sea states. The
auxiliary floater is deflated in a controllable way through a valve connected to the OWC spar
buoy air chamber, which as an open hatch to the exterior during the entire operation. If
necessary, the auxiliary floater can be deflated using several independent sections to
guarantee a sequential deflation. With the loss of buoyancy due to the deflation, the structure
will recover stability by tending to the vertical position, as shown in Figure 4-3. After the
structure reaches an upright position, the completely deflated auxiliary floater is extracted
from the bottom part of the floater. Additional suction equipment may be necessary to
complete the deflation.
Finally, the mooring cables are connected to the fairlead and tensioned to the specified pre-
tension value. The electrical cable is then attached to the structure through a dry-mate
connection and the air chamber is sealed. At this stage, the OWC spar buoy is ready for
operation.
FIGURE 4-3 SCHEMATIC REPRESENTATION OF THE DEFLATION OF THE AUXILIARY FLOATER DURING THE
INSTALLATION OF THE OWC SPAR BUOY
The retrieval of the OWC spar buoy is performed by reversing the installation method. The
auxiliary floater placed inside the air chamber through a hatch and is attached to the top of
the structure and released through the OWC tube, with a small weight at the end to keep it
stretched. At this stage, a cable is connected to the AHTS vessel and the mooring lines are
released from the fairleads, before a prior reduction of the line pre-tension. The auxiliary
floater is inflated using a compressor on a vessel and the structure recovers its initial
horizontal position. Water trapped inside the tube during inflation can flow through the open
hatch. Since the structure is inclined during the retrieval operation, all equipment fitted inside
the device must be securely fastened.
The access of individuals to the OWC spar buoy deck is done using a ladder fixed to the
exterior surface of the cylindrical floater. Access to the top of the floater, where the turbine
and generator are installed, is also made through a ladder. A small crane installed on the deck
can be used for the recovery and delivery of equipment.
40
An alternative scenario to this set of operations may be considered for cost reduction if the
construction yard is close to the deployment site (few kilometres) and if the construction yard
has adequate bathymetry for the transportation of the spar structure in the vertical position,
without the use of any auxiliary floating system. In this case, the load-out can be done through
a lifted load-out or a float-away load-out strategy (if the dry dock has enough water depth
when flooded). The device, initially in the horizontal position, will be in its vertical position
when freely floating. An AHTS vessel is used to tow the structure to the deployment location.
Due to the high drag forces induced on the structure, which depends on the towing velocity,
the structure is likely to have a significant inclination angle while being towed. If this
alternative scenario is considered, the load cases should be adapted.
Although the installation strategy is significantly different, a point of comparison with the
OWC spar buoy in the marine renewable field is the Hywind. This concept, developed by
Statoil (Norway), is a spar-type structure that supports a wind turbine. A Hywind full-scale
prototype, a cylindrical spar with a draft of 100 m, was deployed off the coast of Norway in
2009 [38]. Its installation used a more conventional approach, being commissioned to
Technip, a company with large experience in the oil and gas offshore industry. The spar
structure was towed (about 1000 km) horizontally without ballast to sheltered waters near
the deployment site. The floating structure was ballasted with water and rocks. An auxiliary
vessel was fixed to the spar structure during the ballast, tower and turbine installation. The
tower and turbine installation also required a floating crane. The complete prototype was
later transported to the deployment location and fixed to three mooring lines. In that case, the
complexity of the tower and turbine installation and the necessity of auxiliary vessels are
likely to have influenced the selection of the spar structure installation. The method used was
cost-intensive and Statoil launched a challenge to several companies in the marine sector to
develop innovative ideas to simplify and reduce the installation [39]. The main focus of this
challenge was the assembly efficiency of the tower and the turbine, considering the
deployment of several devices.
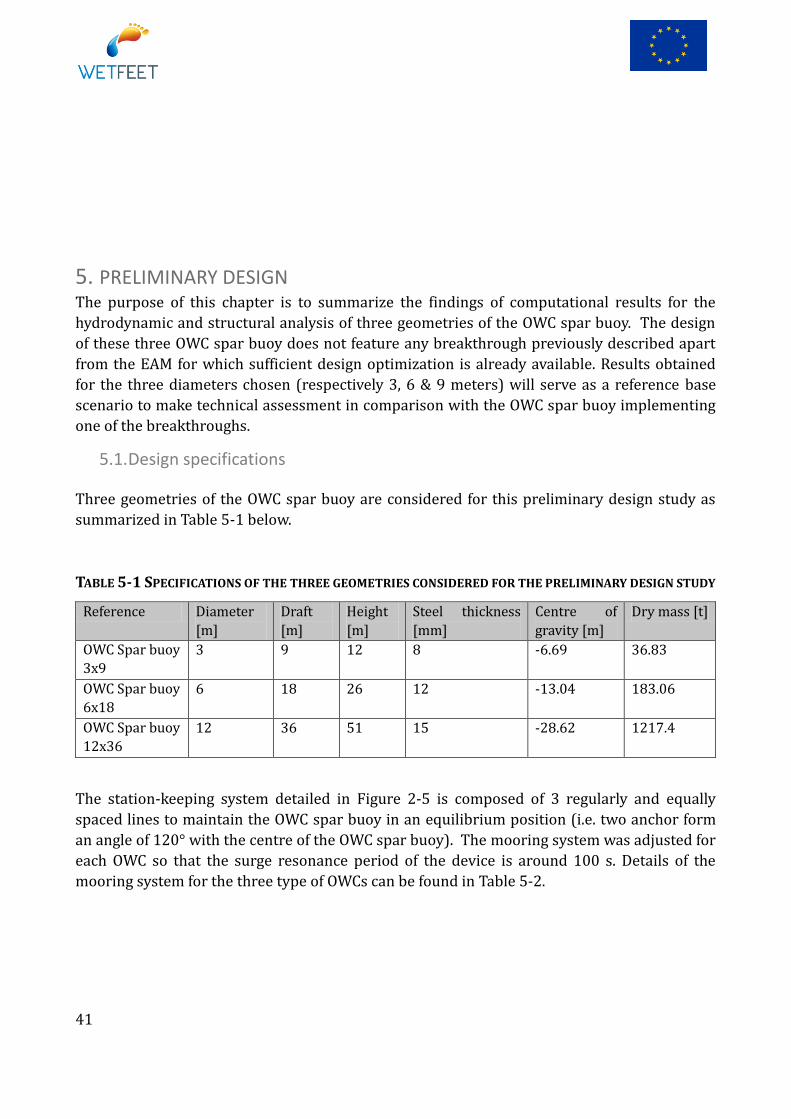
41
5. PRELIMINARY DESIGN The purpose of this chapter is to summarize the findings of computational results for the
hydrodynamic and structural analysis of three geometries of the OWC spar buoy. The design
of these three OWC spar buoy does not feature any breakthrough previously described apart
from the EAM for which sufficient design optimization is already available. Results obtained
for the three diameters chosen (respectively 3, 6 & 9 meters) will serve as a reference base
scenario to make technical assessment in comparison with the OWC spar buoy implementing
one of the breakthroughs.
5.1. Design specifications
Three geometries of the OWC spar buoy are considered for this preliminary design study as
summarized in Table 5-1 below.
TABLE 5-1 SPECIFICATIONS OF THE THREE GEOMETRIES CONSIDERED FOR THE PRELIMINARY DESIGN STUDY
Reference Diameter
[m]
Draft
[m]
Height
[m]
Steel thickness
[mm]
Centre of
gravity [m]
Dry mass [t]
OWC Spar buoy
3x9
3 9 12 8 -6.69 36.83
OWC Spar buoy
6x18
6 18 26 12 -13.04 183.06
OWC Spar buoy
12x36
12 36 51 15 -28.62 1217.4
The station-keeping system detailed in Figure 2-5 is composed of 3 regularly and equally
spaced lines to maintain the OWC spar buoy in an equilibrium position (i.e. two anchor form
an angle of 120° with the centre of the OWC spar buoy). The mooring system was adjusted for
each OWC so that the surge resonance period of the device is around 100 s. Details of the
mooring system for the three type of OWCs can be found in Table 5-2.
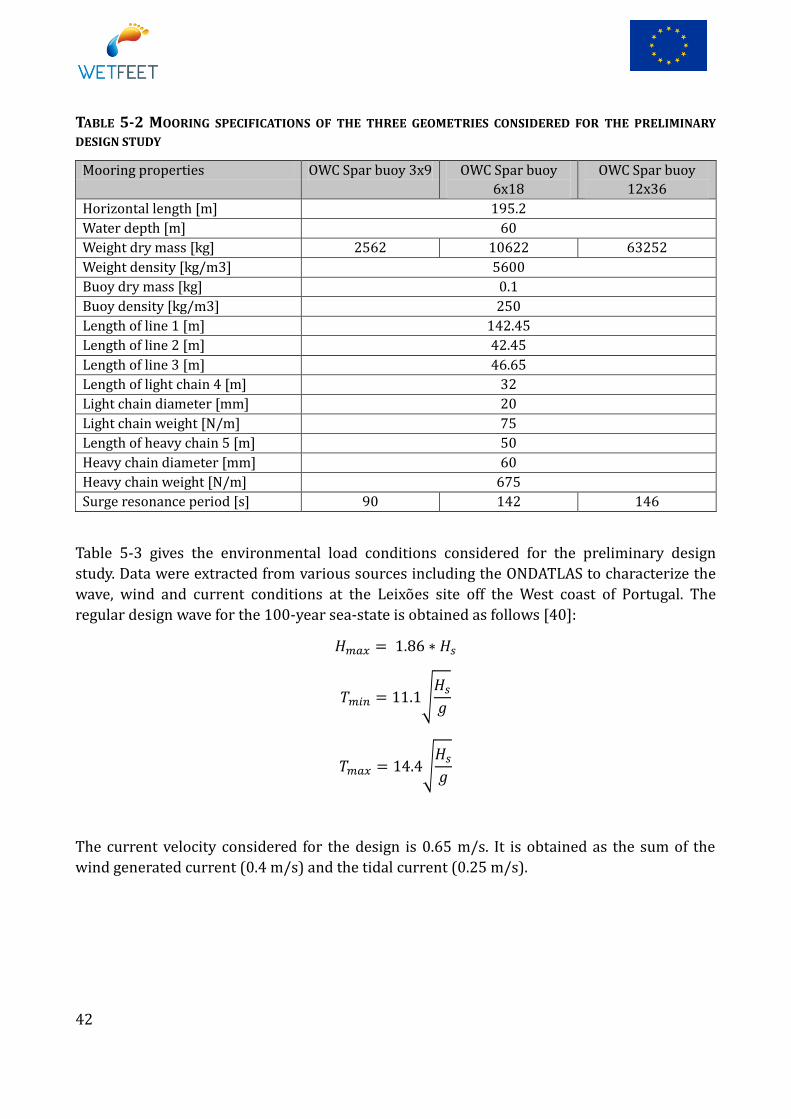
42
TABLE 5-2 MOORING SPECIFICATIONS OF THE THREE GEOMETRIES CONSIDERED FOR THE PRELIMINARY
DESIGN STUDY
Mooring properties OWC Spar buoy 3x9 OWC Spar buoy
6x18
OWC Spar buoy
12x36
Horizontal length [m] 195.2
Water depth [m] 60
Weight dry mass [kg] 2562 10622 63252
Weight density [kg/m3] 5600
Buoy dry mass [kg] 0.1
Buoy density [kg/m3] 250
Length of line 1 [m] 142.45
Length of line 2 [m] 42.45
Length of line 3 [m] 46.65
Length of light chain 4 [m] 32
Light chain diameter [mm] 20
Light chain weight [N/m] 75
Length of heavy chain 5 [m] 50
Heavy chain diameter [mm] 60
Heavy chain weight [N/m] 675
Surge resonance period [s] 90 142 146
Table 5-3 gives the environmental load conditions considered for the preliminary design
study. Data were extracted from various sources including the ONDATLAS to characterize the
wave, wind and current conditions at the Leixões site off the West coast of Portugal. The
regular design wave for the 100-year sea-state is obtained as follows [40]:
The current velocity considered for the design is 0.65 m/s. It is obtained as the sum of the
wind generated current (0.4 m/s) and the tidal current (0.25 m/s).

43
TABLE 5-3 SUMMARY OF THE ENVIRONMENTAL LOAD CONDITIONS CONSIDERED FOR THE PRELIMINARY
DESIGN
Parameter Value
Location coordinates (Leixões) 41° 12.2’ N, 9° 5.3 W
Hs - 100 year period [m] 14.8
Te – 100 year period [s] 17.4
Hmax* [m] 27.53
Tmin* [s] 13.63
Tmax* [s] 17.69
Current speed [m/s] 0.65
5.2. Structural loads
5.2.1. Wave induced loads
In this section, the methodology followed by WavEC to compute the wave pressure induced
loads on the 3 geometries of OWC spar buoy is detailed. At this stage, it is supposed that the
OWC spar buoy is vertically standing still in the water, at equilibrium position.
A WAMIT® model of the OWCs was built using the higher-order discretization method. The
OWC spar buoy geometry is represented by an assembly of panel which size is small enough to
ensure grid independency, so that the results converge and that they provide an accurate
estimation of the hydrodynamic loads per vertical slices (see Table 5-4).
TABLE 5-4: MAXIMUM PANEL SIZE IN WAMIT™
Buoy geometry 3 m diameter 6 m diameter 12 m diameter
Maximum panel area (m2) 0.0028 0.0246 0.1142
At first approach, it is considered that the OWC spar buoy is a 1D hollow beam that extends
along the vertical z axis (pointing upward). The slices were defined such that their upper and
lower limits coincide with the limits of the panels defined by WAMIT (to avoid partial
contributions from some panels to some slices which is difficult to quantify). Analytical
development of the method to calculate the wave-induced loads in the required format for the
structural analysis is given in appendix 7.A.
In order to realize a first structural assessment of the OWC spar buoys, the 3D components of
the forces induced by the hydrodynamic pressure on vertical slices (of height lower than 0.5
m) along the column when a regular wave passes were computed. It is supposed that the OWC
is fixed, and therefore the ‘radiation’ component of the dynamic pressure is neglected. This
radiation pressure should however be included in more refined studies.
The theory behind the calculation of those loadings is detailed in section A. In particular, the
use of dipole panels to model the central column is explained. It can be seen on Figure 5-1 that
the real part of the diffraction pressure on the central column is much lower than on the rest
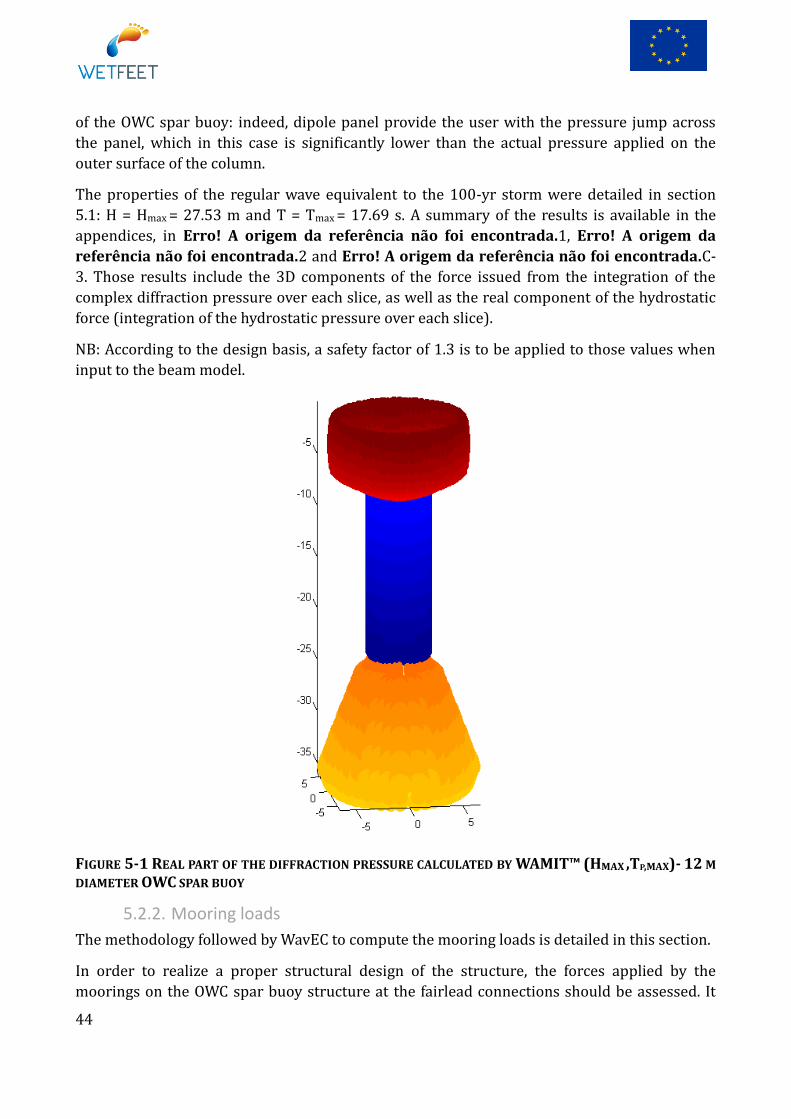
44
of the OWC spar buoy: indeed, dipole panel provide the user with the pressure jump across
the panel, which in this case is significantly lower than the actual pressure applied on the
outer surface of the column.
The properties of the regular wave equivalent to the 100-yr storm were detailed in section
5.1: H = Hmax = 27.53 m and T = Tmax = 17.69 s. A summary of the results is available in the
appendices, in Erro! A origem da referência não foi encontrada.1, Erro! A origem da
referência não foi encontrada.2 and Erro! A origem da referência não foi encontrada.C-
3. Those results include the 3D components of the force issued from the integration of the
complex diffraction pressure over each slice, as well as the real component of the hydrostatic
force (integration of the hydrostatic pressure over each slice).
NB: According to the design basis, a safety factor of 1.3 is to be applied to those values when
input to the beam model.
FIGURE 5-1 REAL PART OF THE DIFFRACTION PRESSURE CALCULATED BY WAMIT™ (HMAX ,TP,MAX)- 12 M
DIAMETER OWC SPAR BUOY
5.2.2. Mooring loads
The methodology followed by WavEC to compute the mooring loads is detailed in this section.
In order to realize a proper structural design of the structure, the forces applied by the
moorings on the OWC spar buoy structure at the fairlead connections should be assessed. It
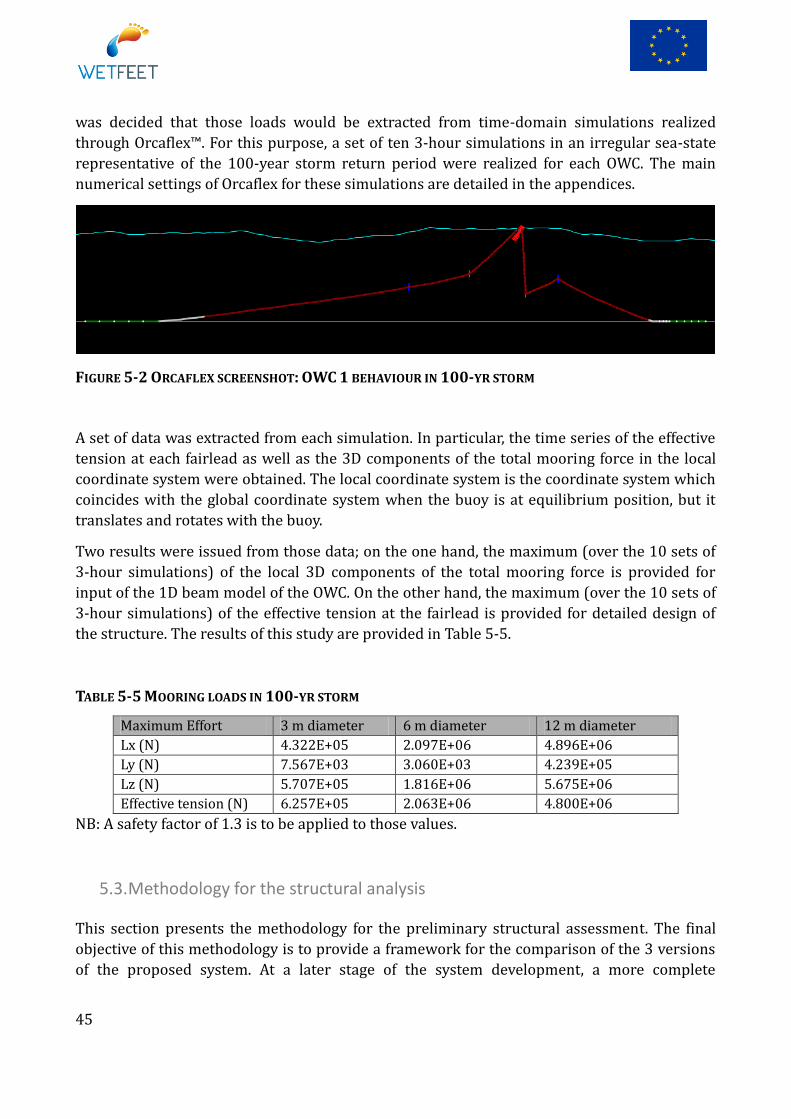
45
was decided that those loads would be extracted from time-domain simulations realized
through Orcaflex™. For this purpose, a set of ten 3-hour simulations in an irregular sea-state
representative of the 100-year storm return period were realized for each OWC. The main
numerical settings of Orcaflex for these simulations are detailed in the appendices.
FIGURE 5-2 ORCAFLEX SCREENSHOT: OWC 1 BEHAVIOUR IN 100-YR STORM
A set of data was extracted from each simulation. In particular, the time series of the effective
tension at each fairlead as well as the 3D components of the total mooring force in the local
coordinate system were obtained. The local coordinate system is the coordinate system which
coincides with the global coordinate system when the buoy is at equilibrium position, but it
translates and rotates with the buoy.
Two results were issued from those data; on the one hand, the maximum (over the 10 sets of
3-hour simulations) of the local 3D components of the total mooring force is provided for
input of the 1D beam model of the OWC. On the other hand, the maximum (over the 10 sets of
3-hour simulations) of the effective tension at the fairlead is provided for detailed design of
the structure. The results of this study are provided in Table 5-5.
TABLE 5-5 MOORING LOADS IN 100-YR STORM
Maximum Effort 3 m diameter 6 m diameter 12 m diameter
Lx (N) 4.322E+05 2.097E+06 4.896E+06
Ly (N) 7.567E+03 3.060E+03 4.239E+05
Lz (N) 5.707E+05 1.816E+06 5.675E+06
Effective tension (N) 6.257E+05 2.063E+06 4.800E+06
NB: A safety factor of 1.3 is to be applied to those values.
5.3. Methodology for the structural analysis
This section presents the methodology for the preliminary structural assessment. The final
objective of this methodology is to provide a framework for the comparison of the 3 versions
of the proposed system. At a later stage of the system development, a more complete
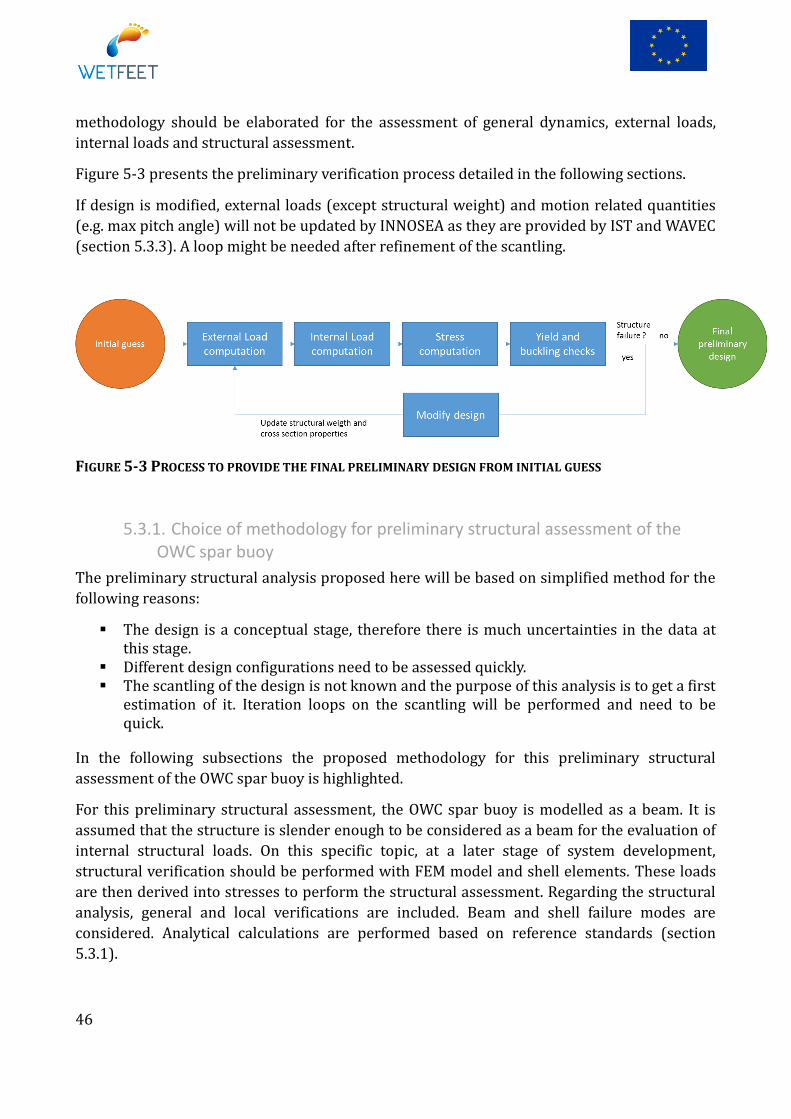
46
methodology should be elaborated for the assessment of general dynamics, external loads,
internal loads and structural assessment.
Figure 5-3 presents the preliminary verification process detailed in the following sections.
If design is modified, external loads (except structural weight) and motion related quantities
(e.g. max pitch angle) will not be updated by INNOSEA as they are provided by IST and WAVEC
(section 5.3.3). A loop might be needed after refinement of the scantling.
FIGURE 5-3 PROCESS TO PROVIDE THE FINAL PRELIMINARY DESIGN FROM INITIAL GUESS
5.3.1. Choice of methodology for preliminary structural assessment of the OWC spar buoy
The preliminary structural analysis proposed here will be based on simplified method for the
following reasons:
The design is a conceptual stage, therefore there is much uncertainties in the data at this stage.
Different design configurations need to be assessed quickly. The scantling of the design is not known and the purpose of this analysis is to get a first
estimation of it. Iteration loops on the scantling will be performed and need to be quick.
In the following subsections the proposed methodology for this preliminary structural
assessment of the OWC spar buoy is highlighted.
For this preliminary structural assessment, the OWC spar buoy is modelled as a beam. It is
assumed that the structure is slender enough to be considered as a beam for the evaluation of
internal structural loads. On this specific topic, at a later stage of system development,
structural verification should be performed with FEM model and shell elements. These loads
are then derived into stresses to perform the structural assessment. Regarding the structural
analysis, general and local verifications are included. Beam and shell failure modes are
considered. Analytical calculations are performed based on reference standards (section
5.3.1).

47
In this preliminary study, only Ultimate Limit State (ULS) will be considered for a limited
number of load cases considered potentially critical at this stage. Fatigue will not be
considered at this stage. On this specific topic, at a later stage of system development, Fatigue
Limit State (FLS) verification should be performed
The spar structure is divided into slices as presented by Figure 5-4.
FIGURE 5-4 SLICES ALONG THE HULL
Each slice is assumed to have constant properties (diameter, thickness, material).
5.3.2. Code and standards
The proposed methodology for the preliminary structural assessment of the OWC Spar Buoy
refers to a number of standards:
DNV-OS-C106 “Structural Design of Deep Draught Floating Units (LRFD Method)” [41] gives guidelines on deep draught floating units structural design.
DNV-RP-F205 “Global Performance Analysis of Deepwater Floating Structures” [42] presents the guidelines on floating structure design regarding motions and external loads.
DNV-OS-C101 “Design of Offshore Steel Structures, General (LRFD Method)” [43] presents a list of structural checks for steel to be studied.
DNV-RP-C202 “Buckling Strength of Shells” [44] presents a methodology to assess the buckling limit stress of cylinder shells.
These guidelines are used only for some aspects, at this preliminary verification stage, the
methodology is not compliant with these guidelines.
5.3.3. External load modelling
The only external load calculated by INNOSEA is the structural weight.
48
All the other external loads (except structural weight) will be provided by IST and WAVEC.
Inertial loads should normally be considered for the structural analysis, especially under large
pitch angle as provided by IST. However if structure motion and accelerations are not
provided to INNOSEA, static equilibrium will be assumed and dynamic inertial loads will be
neglected. This is a substantial assumption for the design of floating structure. On this specific
topic, at a later stage of system development, more investigation will be needed.
All external loads will be assessed by slice along the height of the OWC spar buoy.
Corrosion and marine growth are not considered for this preliminary verification (this should
be considered in a later stage).
5.3.4. Internal load assessment
Beam theory is applied for the calculation of internal loads.
The main assumptions of beam theory are:
The beam is initially straight, of constant section and such as the length of the beam
is large compared to its diameter.
Material of beam is homogenous and isotropic.
Young’s modulus is constant in compression and tension.
Transverse section which are plane before bending remain plain after bending.
Radius of curvature is large compared with dimension of cross sections.
Each layer of the beam is free to expand or contract.
A static equilibrium of the structure is assumed. Both structure ends are assumed to be free.
Equilibrium of each slice submitted to external and internal loads is solved. Doing so, the
internal load in each slice is obtained. All the calculations are analytical.
5.3.5. Stress assessment
From internal loads, the stress assessment is performed following the methodology of DNV-
OS-C106 [41] which refers to DNV-OS-C101 [43].
For the LTT, structural properties of concrete inside ballast zone are neglected. This
assumption may have to be revised depending on the results.
5.3.6. Limit stress
Yielding is checked by comparing Von Mises stress to the yield limit stress of the
material .
Buckling is checked by comparing Von Mises stress to the buckling limit stress, which is
itself computed in accordance to DNV-RP-C202 [44] (as referred by DNV-OS-C101 [43]).
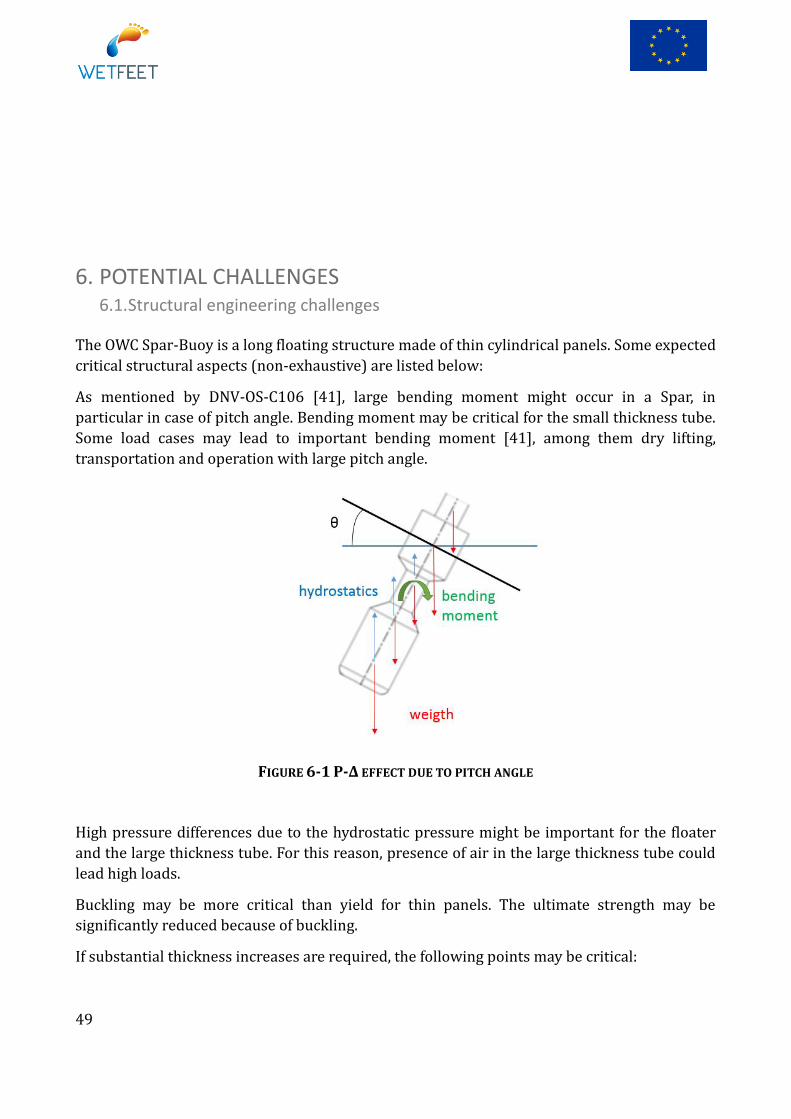
49
6. POTENTIAL CHALLENGES 6.1. Structural engineering challenges
The OWC Spar-Buoy is a long floating structure made of thin cylindrical panels. Some expected
critical structural aspects (non-exhaustive) are listed below:
As mentioned by DNV-OS-C106 [41], large bending moment might occur in a Spar, in
particular in case of pitch angle. Bending moment may be critical for the small thickness tube.
Some load cases may lead to important bending moment [41], among them dry lifting,
transportation and operation with large pitch angle.
FIGURE 6-1 P-Δ EFFECT DUE TO PITCH ANGLE
High pressure differences due to the hydrostatic pressure might be important for the floater
and the large thickness tube. For this reason, presence of air in the large thickness tube could
lead high loads.
Buckling may be more critical than yield for thin panels. The ultimate strength may be
significantly reduced because of buckling.
If substantial thickness increases are required, the following points may be critical:

50
Increase of thickness may lead to excessive structure mass that could impact system
performance.
Excessive thicknesses may lead to unfeasible designs from a manufacturing point of
view.
For these reasons, it could be interesting to change the structure arrangement by adding
longitudinal and/or ring stiffeners. Doing so, it might lead to smaller mass increase. However,
in case such stiffeners were in contact with water, it might alter the hydrodynamic behavior of
the system.
6.2. Environmental impacts
This section of the report aims to define a methodology to quantify the potential
environmental impacts of the described breakthroughs, focusing on their features and on the
general characteristics of the sites where they are supposed to be installed. The
environmental impact analysis will be based on literature available and on experience of
impacts assessment get so far for WEC projects in order to identify the key inputs and
indicators to be assessed in WP7 of the WETFEET project.
The Environment Impact Assessment is a well-known tool, widely accepted to understand and
quantify the impacts of human activities. Its application is nowadays incorporated in
numerous national regulations for licensing human activities, including wave energy
harnessing. The main steps of the EIA approach are presented in Figure 6-2. It is not possible
to apply the full EIA methodology herein (e.g. screening, public involvement), since no
sufficient socio-environmental data is available for the Leixões site under analysis in chapters
5 & 6. However, the methodology will consider the techniques involved to address some of
them namely scoping, impact analysis, mitigation measures, and monitoring activities.
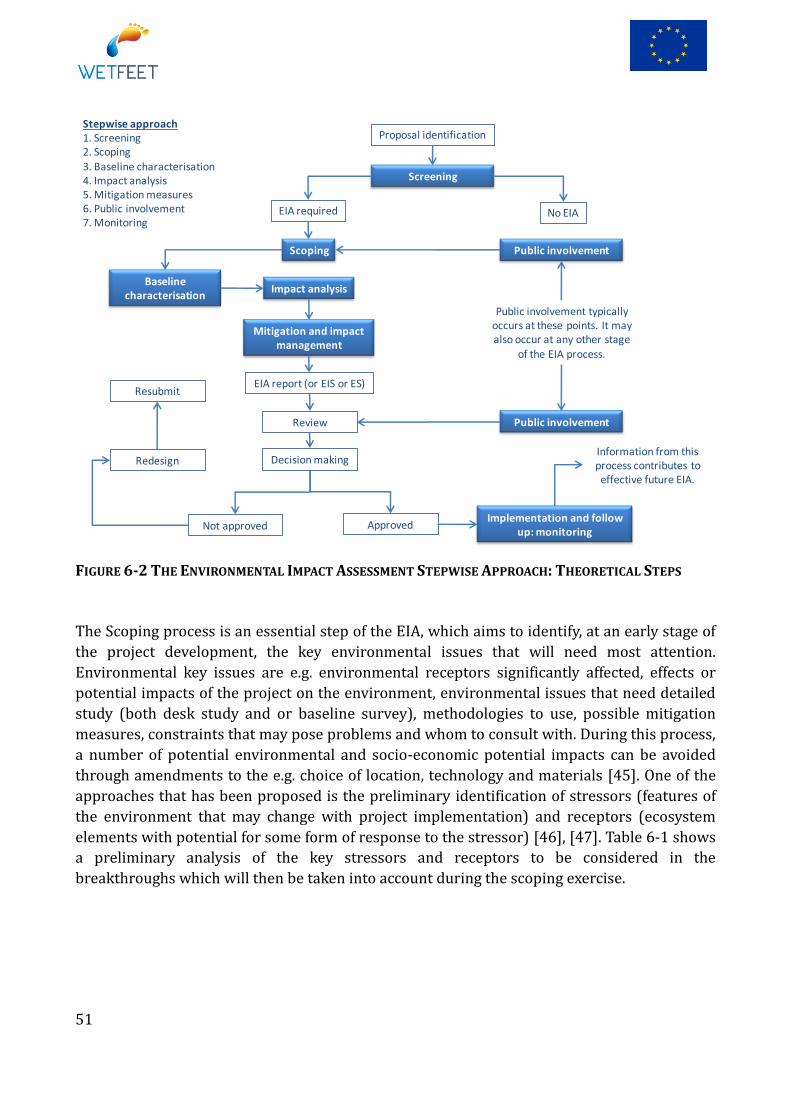
51
FIGURE 6-2 THE ENVIRONMENTAL IMPACT ASSESSMENT STEPWISE APPROACH: THEORETICAL STEPS
The Scoping process is an essential step of the EIA, which aims to identify, at an early stage of
the project development, the key environmental issues that will need most attention.
Environmental key issues are e.g. environmental receptors significantly affected, effects or
potential impacts of the project on the environment, environmental issues that need detailed
study (both desk study and or baseline survey), methodologies to use, possible mitigation
measures, constraints that may pose problems and whom to consult with. During this process,
a number of potential environmental and socio-economic potential impacts can be avoided
through amendments to the e.g. choice of location, technology and materials [45]. One of the
approaches that has been proposed is the preliminary identification of stressors (features of
the environment that may change with project implementation) and receptors (ecosystem
elements with potential for some form of response to the stressor) [46], [47]. Table 6-1 shows
a preliminary analysis of the key stressors and receptors to be considered in the
breakthroughs which will then be taken into account during the scoping exercise.
Proposal identification
Screening
EIA required No EIA
Scoping
Impact analysis
Mitigation and impact management
EIA report (or EIS or ES)
Review
Decision making
Public involvement
Not approved Approved
Redesign
Resubmit
Implementation and follow up: monitoring
Public involvement typically occurs at these points. It may also occur at any other stage
of the EIA process.
Public involvement
Information from this process contributes to effective future EIA.
Stepwise approach1. Screening2. Scoping
3. Baseline characterisation4. Impact analysis5. Mitigation measures6. Public involvement7. Monitoring
Baseline characterisation
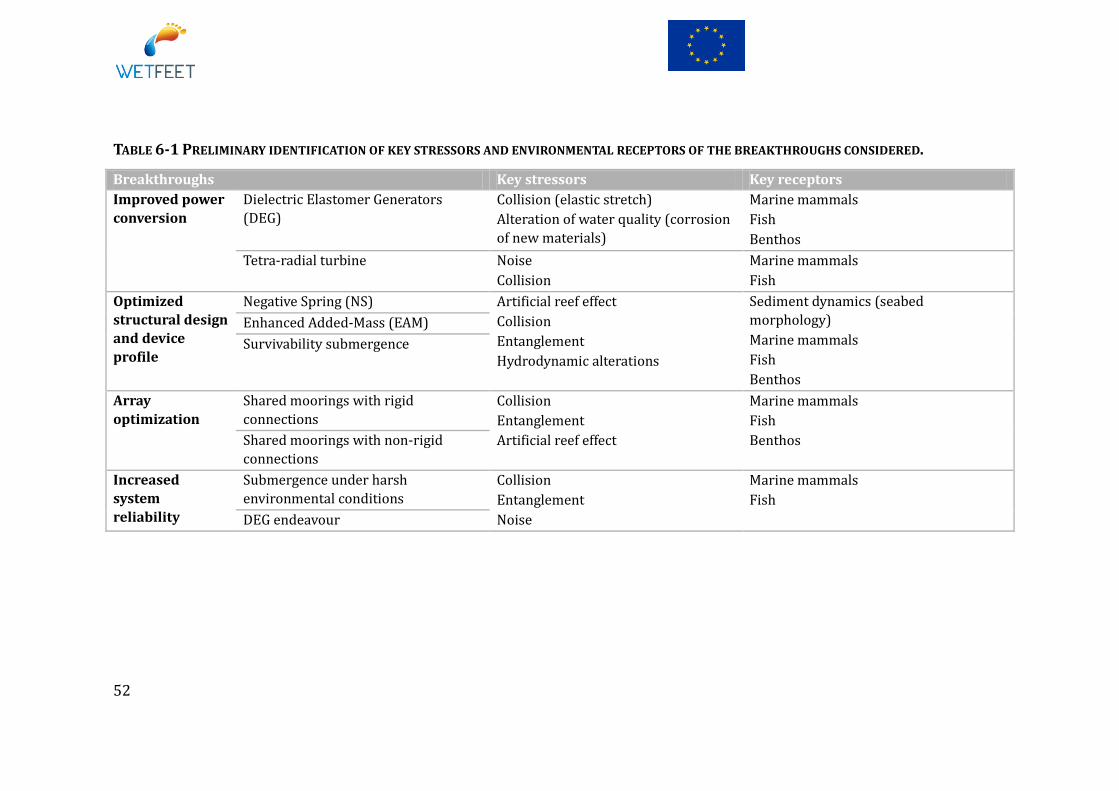
52
TABLE 6-1 PRELIMINARY IDENTIFICATION OF KEY STRESSORS AND ENVIRONMENTAL RECEPTORS OF THE BREAKTHROUGHS CONSIDERED.
Breakthroughs Key stressors Key receptors
Improved power
conversion
Dielectric Elastomer Generators
(DEG)
Collision (elastic stretch)
Alteration of water quality (corrosion
of new materials)
Marine mammals
Fish
Benthos
Tetra-radial turbine Noise
Collision
Marine mammals
Fish
Optimized
structural design
and device
profile
Negative Spring (NS) Artificial reef effect
Collision
Entanglement
Hydrodynamic alterations
Sediment dynamics (seabed
morphology)
Marine mammals
Fish
Benthos
Enhanced Added-Mass (EAM)
Survivability submergence
Array
optimization
Shared moorings with rigid
connections
Collision
Entanglement
Artificial reef effect
Marine mammals
Fish
Benthos Shared moorings with non-rigid
connections
Increased
system
reliability
Submergence under harsh
environmental conditions
Collision
Entanglement
Noise
Marine mammals
Fish
DEG endeavour
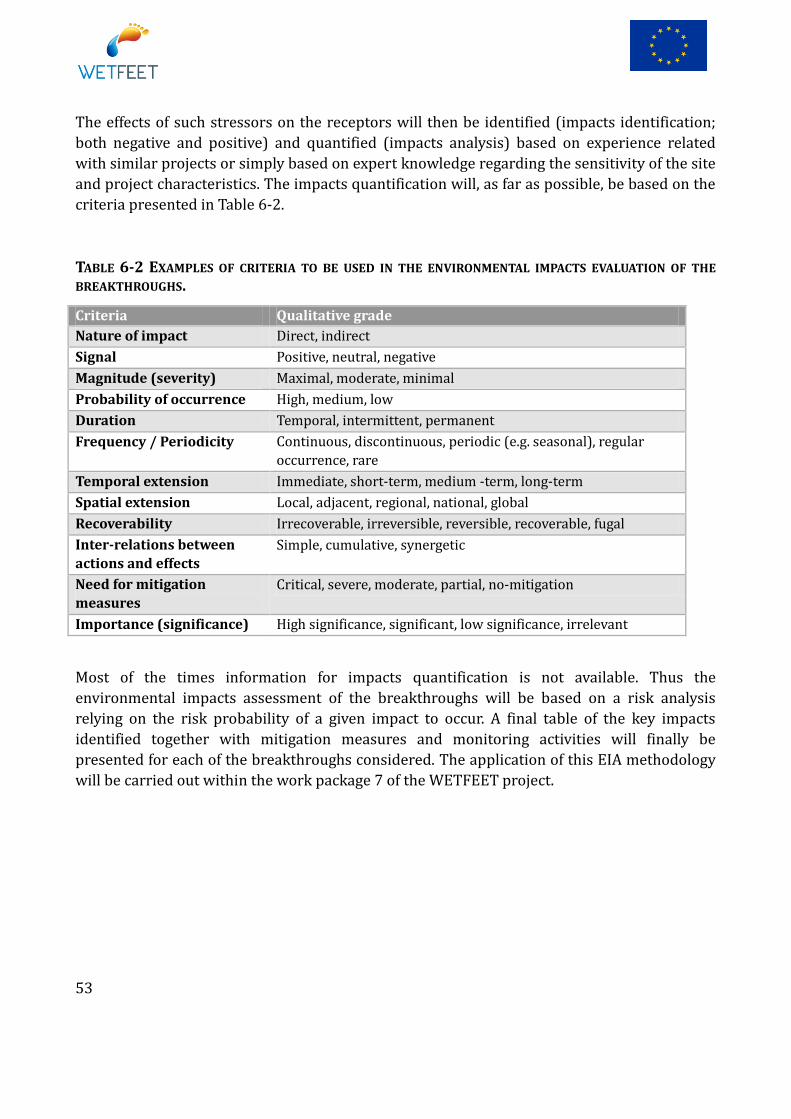
53
The effects of such stressors on the receptors will then be identified (impacts identification;
both negative and positive) and quantified (impacts analysis) based on experience related
with similar projects or simply based on expert knowledge regarding the sensitivity of the site
and project characteristics. The impacts quantification will, as far as possible, be based on the
criteria presented in Table 6-2.
TABLE 6-2 EXAMPLES OF CRITERIA TO BE USED IN THE ENVIRONMENTAL IMPACTS EVALUATION OF THE
BREAKTHROUGHS.
Criteria Qualitative grade
Nature of impact Direct, indirect
Signal Positive, neutral, negative
Magnitude (severity) Maximal, moderate, minimal
Probability of occurrence High, medium, low
Duration Temporal, intermittent, permanent
Frequency / Periodicity Continuous, discontinuous, periodic (e.g. seasonal), regular
occurrence, rare
Temporal extension Immediate, short-term, medium -term, long-term
Spatial extension Local, adjacent, regional, national, global
Recoverability Irrecoverable, irreversible, reversible, recoverable, fugal
Inter-relations between
actions and effects
Simple, cumulative, synergetic
Need for mitigation
measures
Critical, severe, moderate, partial, no-mitigation
Importance (significance) High significance, significant, low significance, irrelevant
Most of the times information for impacts quantification is not available. Thus the
environmental impacts assessment of the breakthroughs will be based on a risk analysis
relying on the risk probability of a given impact to occur. A final table of the key impacts
identified together with mitigation measures and monitoring activities will finally be
presented for each of the breakthroughs considered. The application of this EIA methodology
will be carried out within the work package 7 of the WETFEET project.
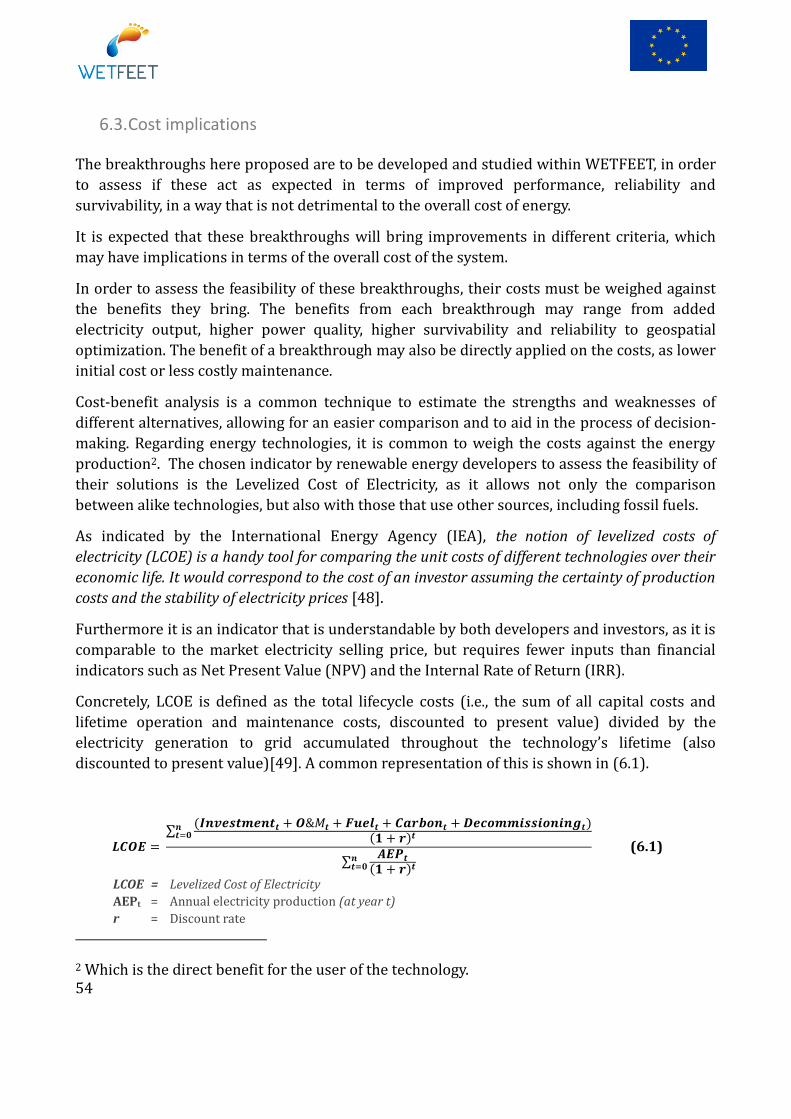
54
6.3. Cost implications
The breakthroughs here proposed are to be developed and studied within WETFEET, in order
to assess if these act as expected in terms of improved performance, reliability and
survivability, in a way that is not detrimental to the overall cost of energy.
It is expected that these breakthroughs will bring improvements in different criteria, which
may have implications in terms of the overall cost of the system.
In order to assess the feasibility of these breakthroughs, their costs must be weighed against
the benefits they bring. The benefits from each breakthrough may range from added
electricity output, higher power quality, higher survivability and reliability to geospatial
optimization. The benefit of a breakthrough may also be directly applied on the costs, as lower
initial cost or less costly maintenance.
Cost-benefit analysis is a common technique to estimate the strengths and weaknesses of
different alternatives, allowing for an easier comparison and to aid in the process of decision-
making. Regarding energy technologies, it is common to weigh the costs against the energy
production2. The chosen indicator by renewable energy developers to assess the feasibility of
their solutions is the Levelized Cost of Electricity, as it allows not only the comparison
between alike technologies, but also with those that use other sources, including fossil fuels.
As indicated by the International Energy Agency (IEA), the notion of levelized costs of
electricity (LCOE) is a handy tool for comparing the unit costs of different technologies over their
economic life. It would correspond to the cost of an investor assuming the certainty of production
costs and the stability of electricity prices [48].
Furthermore it is an indicator that is understandable by both developers and investors, as it is
comparable to the market electricity selling price, but requires fewer inputs than financial
indicators such as Net Present Value (NPV) and the Internal Rate of Return (IRR).
Concretely, LCOE is defined as the total lifecycle costs (i.e., the sum of all capital costs and
lifetime operation and maintenance costs, discounted to present value) divided by the
electricity generation to grid accumulated throughout the technology’s lifetime (also
discounted to present value)[49]. A common representation of this is shown in (6.1).
(6.1)
LCOE = Levelized Cost of Electricity
AEPt = Annual electricity production (at year t)
r = Discount rate
2 Which is the direct benefit for the user of the technology.

55
n = Lifetime of the system
t = Project year, from the start of the project (year 0) to the final year of the project (year n)
This equation can be used for different energy systems, and other cost centres can be added as
needed. For renewable energy systems, which have no fuel or carbon costs, it is common to
simplify the equation down to:
Investment costs, commonly called CAPEX: these are assumed to happen all in year 0,
for the simplicity of the calculation. However this value can be adjusted to account the
time it takes to develop a project. Investment costs can also be divided into
procurement costs (cost of purchasing the elements in a project), installation costs and
administrative costs.
Operational costs, commonly called OPEX: all the cost incurred during the operational
lifetime of the project. For more simple calculations these are can be assumed as fixed
rate throughout the lifetime of the project. However, operational costs are not fixed.
There will be a part of fixed costs related to administrative and other recurrent costs,
but maintenance operations, especially corrective ones, will had a variable element to
the operational costs.
Decommissioning costs are sometimes included in the OPEX, but it is common that
decommissioning costs are not included, as due to the nature of the present value
calculation, its impact on the LCOE is very small.
On the denominator side, the Annual Energy Production (AEP) has the role of offsetting the
costs.
Finally, the discount rate is a measure of time-value, which is the price put on the time that an
investor waits for a return on an investment. Furthermore, the discount rate is also used to
account for the risks and uncertainties of an investment. For a specific project, the discount
rate will be a product of the project developer’s (or investors) desired return on investment3
and the inherent risks of the project that will not only be related to the technology being
deployed but also to the market it will be deployed in [49]–[51].
With the knowledge of how the LCOE is calculated, the breakthroughs proposed in WETFEET
can be assessed by their impact on the different inputs of the equation. Higher added CAPEX
may be offset by higher electricity production or by higher reliability, which translates in
lower OPEX costs. Furthermore, the survivability of the device has an influence on the
perceived risk of the technology, which also has an impact on the LCOE, via a lower discount
rate.
3 This is associated with the weighted average cost of capital (WACC), which determines how much the developer has to pay for others to supply the funds to advance the project. This can come from debt (the cost of capital is the interest rate), equity (with varying costs of capital depending on company profile) and from public funding (which may have a 0 cost of capital).
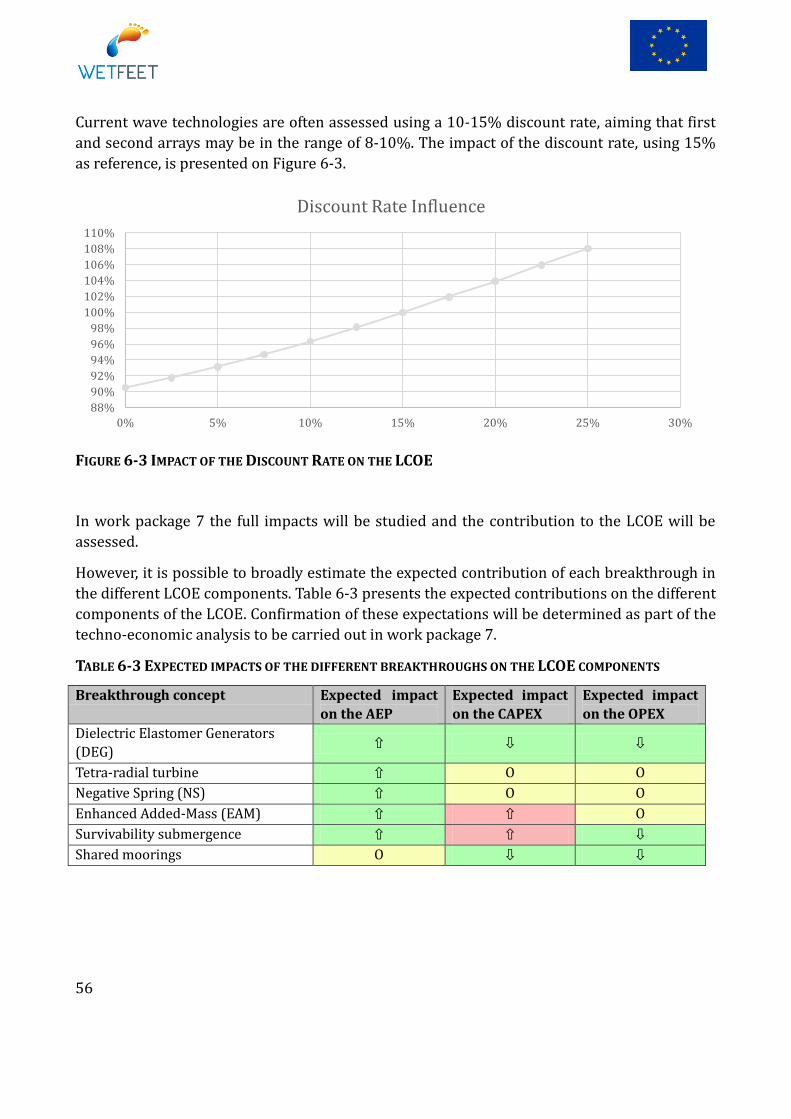
56
Current wave technologies are often assessed using a 10-15% discount rate, aiming that first
and second arrays may be in the range of 8-10%. The impact of the discount rate, using 15%
as reference, is presented on Figure 6-3.
FIGURE 6-3 IMPACT OF THE DISCOUNT RATE ON THE LCOE
In work package 7 the full impacts will be studied and the contribution to the LCOE will be
assessed.
However, it is possible to broadly estimate the expected contribution of each breakthrough in
the different LCOE components. Table 6-3 presents the expected contributions on the different
components of the LCOE. Confirmation of these expectations will be determined as part of the
techno-economic analysis to be carried out in work package 7.
TABLE 6-3 EXPECTED IMPACTS OF THE DIFFERENT BREAKTHROUGHS ON THE LCOE COMPONENTS
Breakthrough concept Expected impact
on the AEP
Expected impact
on the CAPEX
Expected impact
on the OPEX
Dielectric Elastomer Generators
(DEG) ⇧ ⇩ ⇩
Tetra-radial turbine ⇧ O O
Negative Spring (NS) ⇧ O O
Enhanced Added-Mass (EAM) ⇧ ⇧ O
Survivability submergence ⇧ ⇧ ⇩
Shared moorings O ⇩ ⇩
88%
90%
92%
94%
96%
98%
100%
102%
104%
106%
108%
110%
0% 5% 10% 15% 20% 25% 30%
Discount Rate Influence

57
7. CONCLUSIONS AND FUTURE WORK In this deliverable, preliminary design and breakthroughs integration considerations were
depicted with respect to the development of an OWC spar buoy WEC. The potential challenges
raised in the previous chapter will serve as a basis on the decision to select the most
appropriate configurations of the OWC spar buoy for each breakthrough.
Following this work, an iterative process between the structural loads calculation (initiated in
section 5.2) and the structural analysis method developed in section 5.3 will occur in order to
gather sufficient information on the structural challenges associated with the three
geometries of the reference case OWC spar buoy (without featuring any breakthroughs). On
the one hand, this will facilitate bringing down the number of design configurations to be
investigated per OWC spar buoy featuring one of the breakthrough concepts. On the other
hand, this will provide a relevant set of data to discuss on the feasibility and performance of
the proposed breakthrough against the reference case.
Beyond the conceptual and preliminary analysis reported in the present document, the
following future steps will be undertaken to further develop the breakthrough ideas related to
the OWC spar buoy:
Negative springs: the impact on motion and performance introduced by both the IVV
and HNS methods will be investigated. To this extent, linear wave theory will first be
explored for one geometry of the OWC spar buoy. Due to the non-linear effects
associated with the HNS method, a partial time-domain code will also be utilized.
Finally, the most promising configurations may be the object of CFD simulations if time
allows. This work will be carried out jointly under work packages 2 & 3 (with reference
to the tasks 2.2, 2.3, 2.4 & 3.2).
Enhanced added-mass: alternative optimization schemes than the one proposed in
Gomes et al. [12] will be established to reflect stability criteria and/or cost
implications. Both the design variable and associated constraints as well as the
objective function will be modify to further analyse the submerged mass located at the
bottom of the OWC spar buoy.
Submergence for survivability: various submergence depth levels will be analysed by
both the linear frequency-domain WAMIT code and the non-linear Ship@Sea code for
one geometry of the OWC spar buoy (i.e one of the three diameters explored in this
report). Dynamic behaviour and mooring forces under full submergence of the OWC

58
spar buoy will be further studied using the commercial OrcaflexTM. A connection with
task 3.1 will be made to ensure continuity of the workflow about this breakthrough
Dielectric elastomer generators: it is intended to engage the coupling effort between
the hydrodynamic and electro-mechanical modelling of the proposed architectures for
the OWC spar buoy featuring DEG. The two OWC spar buoy DEG configurations
proposed in Figure 3-4 will be studied assuming one fixed diameter for comparison
purposes. A Finite Element Method tool will be used to have a more accurate
estimation of the DEG membrane dimensions for the two OWC spar buoy
configurations.
The other two breakthrough concepts (tetra-radial air turbine and array breakthroughs)
considered in this report will not be the object of further work within the frame of the work
package 2 since they have dedicated tasks already engaged respectively in work packages 4 &
6.
The overriding goal of the work which is developed in the present deliverable and the
subsequent deliverable 2.3 is to shoulder the technical judgement of the breakthroughs ideas
into the OWC spar buoys. For this purpose, specialized numerical tools are exploited allowing
statements with respect to the technical performance and design suitability of the proposed
configurations. Ultimately, this work serves as a basis to carry on the assessment of the most
auspicious breakthrough ideas in the remaining of the WETFEET project.
59
BIBLIOGRAPHY [1] N. Delmonte, D. Barater, F. Giuliani, P. Cova, and G. Buticchi, “Review of Oscillating Water
Column Converters,” IEEE Trans. Ind. Appl., 2015.
[2] F.-X. Faÿ, J. C. C. Henriques, M. Marcos, and E. Robles, “Review of control strategies for oscillating water column wave energy converters,” in 11th European Wave and Tidal Energy Conference, 2015, no. 1.
[3] T. V. Heath, “A review of oscillating water columns,” Philos. Trans. R. Soc. A Math. Phys. Eng. Sci., vol. 370, no. 1959, pp. 235–245, 2012.
[4] A. F. de O. Falcão and P. A. . Justino, “OWC Wave energy devices with air-flow control,” Ocean Eng., vol. 26, pp. 1275–1295, 1999.
[5] A. F. de O. Falcão and J. C. C. Henriques, “Oscillating-water-column wave energy converters and air turbines: A review,” Renew. Energy, vol. 85, pp. 1391–1424, 2016.
[6] S. . Crowley, R. Porter, and D. . Evans, “A submerged cylinder wave energy converter with internal sloshing power take off,” Eur. J. Mech. - B/Fluids, vol. 47, pp. 108–123, 2014.
[7] A. Kurniawan, D. Greaves, and J. Chaplin, “Wave energy devices with compressible volumes,” Proc. R. Soc. A, vol. 470, 2015.
[8] M. E. McCormick, “Analysis of wave energy conversion buoy,” J. Hydronautics, vol. 8, no. 3, pp. 77–82, 1974.
[9] M. E. McCormick, “A modified linear analysis of wave energy conversion buoy,” Ocean Eng., vol. 3, no. 3, pp. 133–144, 1976.
[10] T. W. T. Whittaker and F. A. Mc Peake, “Design Optimization of Axi-symmetric Tail Tube Buoys,” in International Union of Theoretical and Applied Mechanics, D. . Evans and A. F. de O. Falcão, Eds. Berlin, Germany: Springer, 1986.
[11] DTI, “Near Shore Floating Oscillating Wave Column: Prototype Development and Evaluation,” 2004.
[12] R. P. F. Gomes, J. C. C. Henriques, L. M. C. Gato, and A. F. de O. Falcão, “Hydrodynamic optimization of an axisymmetric floating oscillating water column for wave energy conversion,” Renew. Energy, vol. 44, pp. 328–339, 2012.
[13] A. F. de O. Falcão, J. C. C. Henriques, and J. J. Cândido, “Dynamics and optimization of the OWC spar buoy wave energy converter,” Renew. Energy, vol. 48, pp. 369–381, 2012.
[14] A. F. de O. Falcão, J. C. C. Henriques, L. M. C. Gato, and R. P. F. Gomes, “Air turbine choice and optimization for floating oscillating-water-column wave energy converter,” Ocean Eng., vol. 75, pp. 148–156, 2014.
[15] D. Bull and M. E. Ochs, “Technological Cost-Reduction Pathways for Oscillating Water Column Wave Energy Converters in the Marine Hydrokinetic Environment,” 2013.
[16] J. V Ringwood and G. Bacelli, “Energy-Maximizing Control of Wave-Energy Converters,” IEEE Control Syst. Mag., vol. 35, no. October, pp. 30–55, 2014.
60
[17] F. Paparella, K. Monk, V. Winands, M. Lopes, D. Conley, and J. V. Ringwood, “Up-wave and autoregressive methods for short-term wave forecasting for an oscillating water column,” IEEE Trans. Sustain. Energy, vol. 6, pp. 171–178, 2015.
[18] J. C. C. Henriques, R. P. F. Gomes, L. M. C. Gato, A. F. de O. Falcão, E. Robles, and S. Ceballos, “Testing and control of a power take-off system for an OWC spar-buoy wave energy converter,” Rewable energy, vol. 85, pp. 714–724, 2014.
[19] F. X. C. Fonseca, “Testing of a 1:32 scale model of a floating oscillating water column system for wave energy conversion,” Instituto Superior Técnico, University of Lisbon, 2014.
[20] K. Budal and J. Falnes, “A resonant point absorber of ocean-wave power,” Nature, vol. 256, pp. 478–479, 1975.
[21] D. V Evans, “A theory for wave-power absorption by oscillating bodies,” J. Fluid Mech., vol. 77, no. 1, pp. 1–25, 1976.
[22] J. Falnes, Ocean Waves and Oscillating Systems. Cambridge University Press, 2002.
[23] J. Hals Todalshaug, “Wave Energy Convertor,” WO 2015107158 A12015.
[24] “CorPower Ocean,” 2015. [Online]. Available: http://www.corpowerocean.com. [Accessed: 01-Dec-2015].
[25] J. Hals Todalshaug, G. Steinn Àsgeirsson, E. Hjálmarsson, P. Pires, M. Guérinel, J. Maillet, M. Lopes, and P. Möller, “Tank testing of an inherently phase controlled Wave Energy Converter .,” in 11th European Wave and Tidal Energy Conference, 2015.
[26] S. Peretta, P. Ruol, L. Martinelli, A. Tetu, and J. P. Kofoed, “Effect of a negative stiffness mechanism on the performance of the WEPTOS rotors,” in 6th International Conference on Computational Methods in Marine Engineering, 2015.
[27] X. Zhang and J. Yang, “Power capture performance of an oscillating-body WEC with nonlinear snap through PTO systems in irregular waves,” Appl. Ocean Res., vol. 52, no. AUGUST, pp. 261–273, 2015.
[28] X. Zhang, J. Yang, and L. Xiao, “Numerical Study of an Oscillating Wave Energy Converter with Nonlinear Snap - Through Power - Take - Off Systems in Regular Waves,” in 33rd International Conference on Ocean Offshore Arctic Engineering, 2014, pp. 225–230.
[29] M. Guerinel, A. S. Zurkinden, M. Alves, and J. N. A. Sarmento, “Validation of a partially nonlinear time domain model using instantaneous Froude-Krylov and hydrostatic forces,” in European Wave and Tidal Energy Conference, EWTEC, 2013.
[30] M. Peñalba Retes, A. Merigaud, J. Gilloteaux, and J. V. Ringwood, “Nonlinear Froude-Krylov force modelling for two heaving wave energy point absorbers,” in 10th European Wave and Tidal Energy Conference, 2015, pp. 1–10.
[31] M. Peñalba Retes, G. Giorgi, and J. V Ringwood, “A Review of non-linear approaches for wave energy converter modelling,” in 11th European Wave and Tidal Energy Conference, 2015, no. 1, pp. 1–10.
61
[32] S. Ribeiro E Silva and C. Guedes Soares, “Prediction of parametric rolling in waves with a time domain non-linear strip theory model,” Ocean Eng., vol. 72, pp. 453–469, 2013.
[33] L. M. C. Gato, A. F. de O. Falcão, J. C. C. Henriques, R. P. F. Gomes, P. Vicente, F. Fonseca, J. Varandas, and L. Trigo, “MARINET Report - Dynamics of oscillating water column spar-buoy wave energy converters deployed in array and its survivability in extreme conditions,” 2015.
[34] J. C. C. Henriques, A. F. de O. Falcão, R. P. F. Gomes, and L. M. C. Gato, “Latching control of an OWC spar-buoy wave energy converter in regular waves,” J. Offshore Mech. Arct. Eng., vol. 135, pp. 56–64, 2013.
[35] J. C. C. Henriques, L. M. C. Gato, A. F. de O. Falcão, E. Robles, and F.-X. Faÿ, “Latching control of a floating oscillating-water-column wave energy converter,” Renew. Energy, vol. 90, no. JANUARY, pp. 229–241, 2016.
[36] A. F. de O. Falcão, L. M. C. Gato, and E. P. a S. Nunes, “A novel radial self-rectifying air turbine for use in wave energy converters. Part 2. Results from model testing,” Renew. Energy, vol. 53, pp. 159–164, 2013.
[37] A. F. de O. Falcão, L. M. C. Gato, J. C. C. Henriques, J. E. Borges, B. Pereiras, and F. Castro, “A novel twin-rotor radial-inflow air turbine for oscillating-water-column wave energy converters,” Energy, vol. 93, pp. 2116–2125, 2015.
[38] Statoil, “Statoil - HyWind demo,” 2009. [Online]. Available: http://www.statoil.com/no/TechnologyInnovation/NewEnergy/RenewablePowerProduction/Offshore/Hywind/Pages/HywindPuttingWindPowerToTheTest.aspx.
[39] Statoil, “Statoil - Innovate challenge on the installation methods for the HyWind,” 2012. [Online]. Available: http://innovate.statoil.com/challenges/hywind/pages/default.aspx.
[40] Det Norske Veritas, “DNV-RP-C205 Environmental Conditions and Environmental Load,” 2010.
[41] DNV-OS-C106: Structural Design of Deep Draught Floating Units / Spars, vol. DNV-OS-C10. 2012.
[42] DNV-RP-F205: Global Performance Analysis of Deepwater Floating Structures, vol. DNV-RP-F20. 2009.
[43] Det Norske Veritas, “DNV-OS-C101 Design of Offshore Steel Structures - General (LRFD Method),” 2011.
[44] DNV-RP-C202: Buckling Strength of Shells, vol. DNV-RP-C20. 2013.
[45] T. C. Simas, A. C. Moura, D. Thompson, R. S. Batty, J. Norris, and G. Harrison, “Environmental Assessment for Ocean Energy Schemes: Useful Tools and Case Studies,” in The Proceedings of the 20th (2010) International Offshore and Polar Engineering Conference, 2010.
[46] G. McMurray, “Wave energy ecological effects workshop ecological assessment briefing paper,” Ecol. Eff. Wave Energy Dev. Pacific Northwest, p. 25, 2008.

62
[47] G. W. Boehlert and A. B. Gill, “Environmental and ecological effects of ocean renewable energy development: a current synthesis,” 2010.
[48] IEA, “Projected Costs of Generating Electricity,” 2010.
[49] W. Short and D. J. Packey, “A Manual for the Economic Evaluation of Energy Efficiency and Renewable Energy Technologies,” 1995.
[50] Carbon Trust, “Cost estimation methodology,” 2006.
[51] “Discount rates for low carbon and renewable generation technologies,” Committee on Climate Change, Apr. 2011.
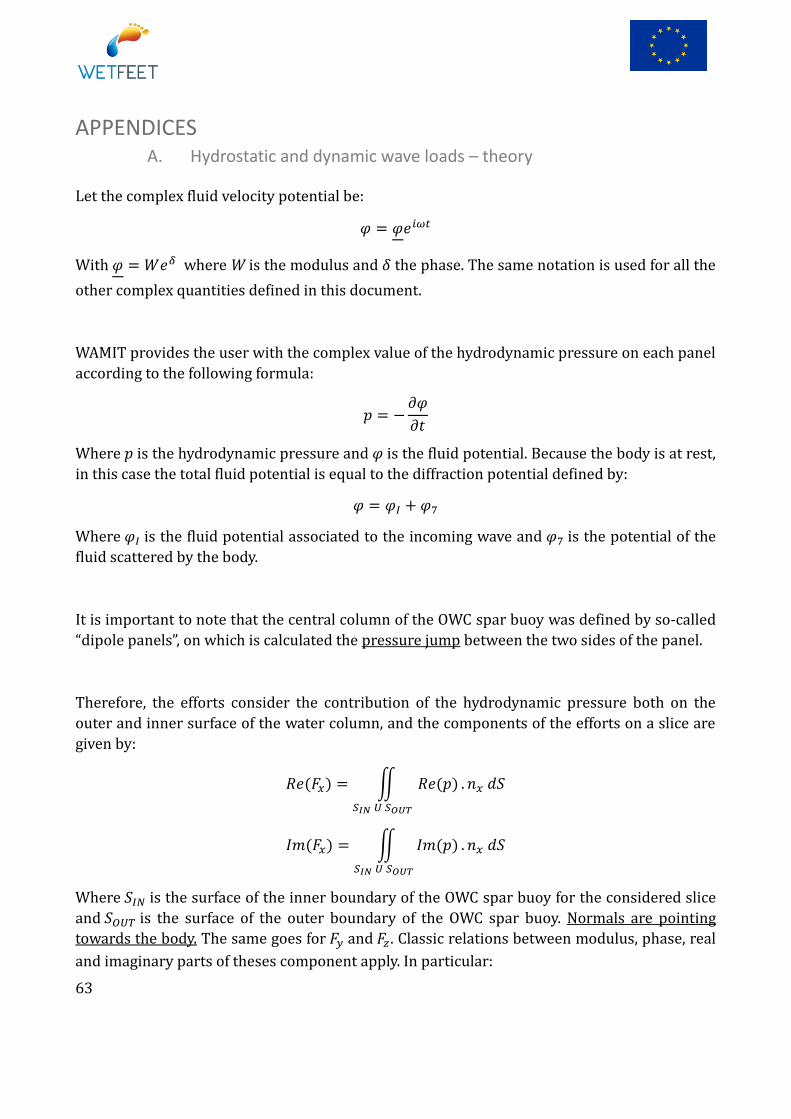
63
APPENDICES A. Hydrostatic and dynamic wave loads – theory
Let the complex fluid velocity potential be:
With where W is the modulus and the phase. The same notation is used for all the
other complex quantities defined in this document.
WAMIT provides the user with the complex value of the hydrodynamic pressure on each panel
according to the following formula:
Where is the hydrodynamic pressure and is the fluid potential. Because the body is at rest,
in this case the total fluid potential is equal to the diffraction potential defined by:
Where is the fluid potential associated to the incoming wave and is the potential of the
fluid scattered by the body.
It is important to note that the central column of the OWC spar buoy was defined by so-called
“dipole panels”, on which is calculated the pressure jump between the two sides of the panel.
Therefore, the efforts consider the contribution of the hydrodynamic pressure both on the
outer and inner surface of the water column, and the components of the efforts on a slice are
given by:
Where is the surface of the inner boundary of the OWC spar buoy for the considered slice
and is the surface of the outer boundary of the OWC spar buoy. Normals are pointing
towards the body. The same goes for and . Classic relations between modulus, phase, real
and imaginary parts of theses component apply. In particular:
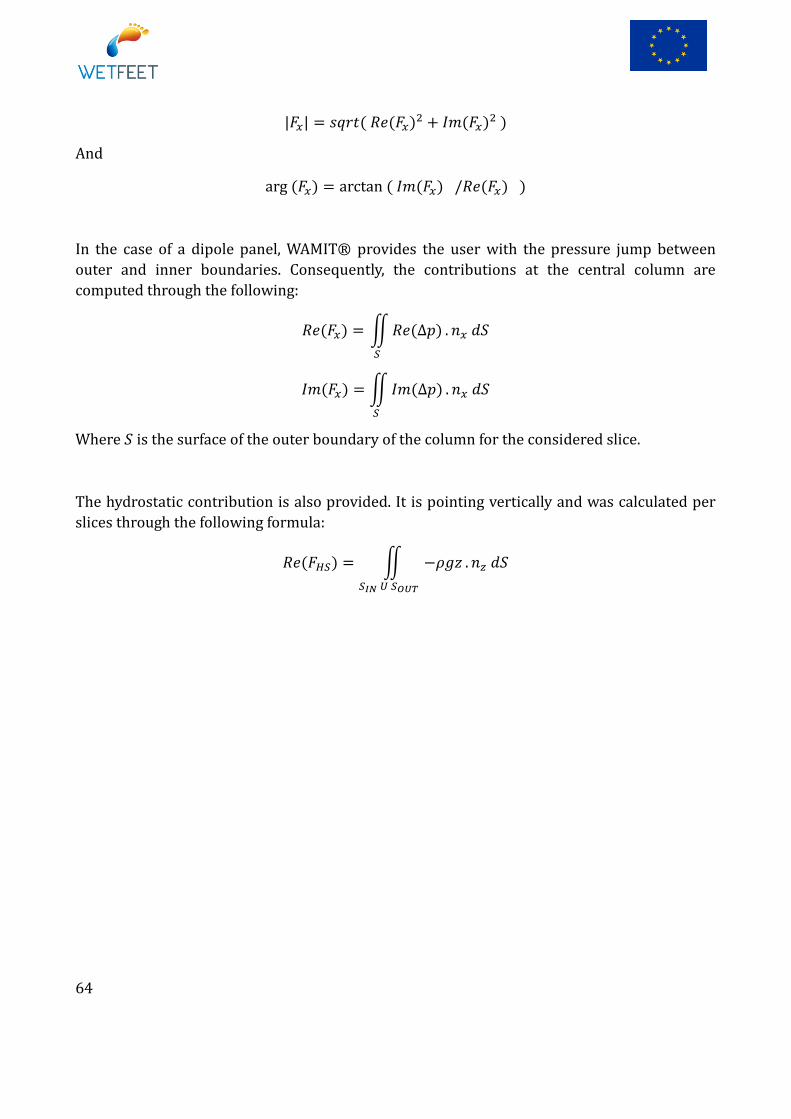
64
And
In the case of a dipole panel, WAMIT® provides the user with the pressure jump between
outer and inner boundaries. Consequently, the contributions at the central column are
computed through the following:
Where is the surface of the outer boundary of the column for the considered slice.
The hydrostatic contribution is also provided. It is pointing vertically and was calculated per
slices through the following formula:
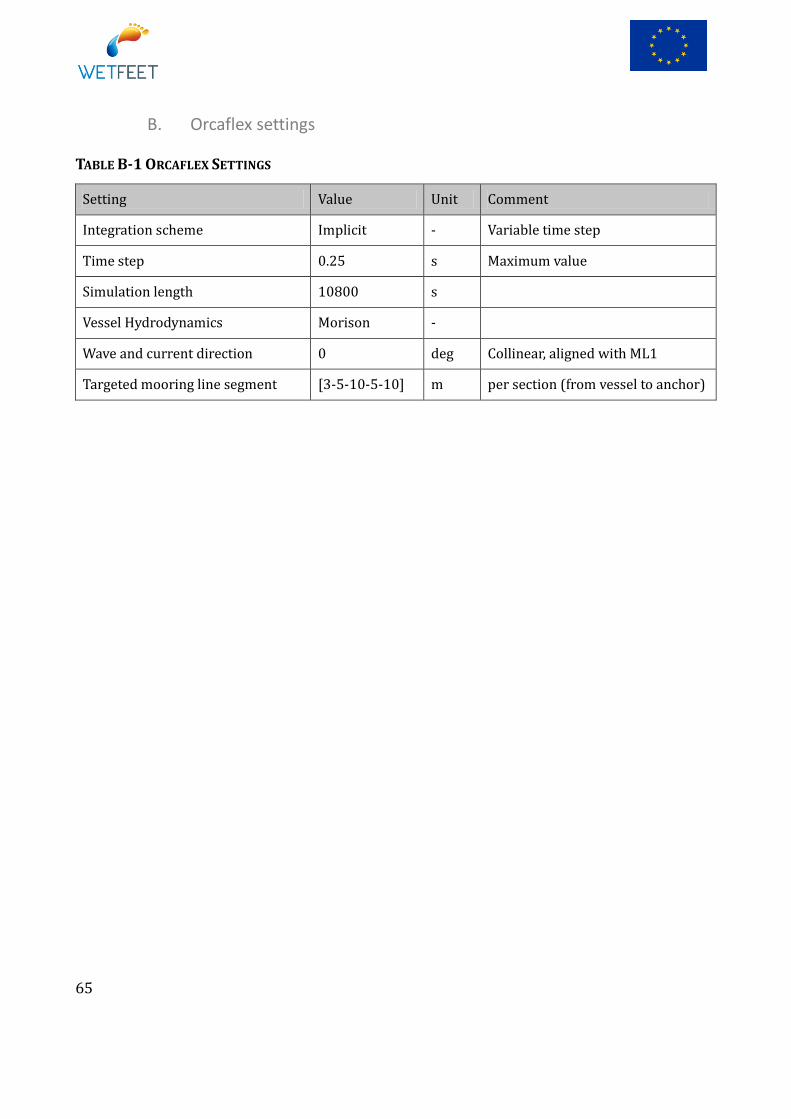
65
B. Orcaflex settings
TABLE B-1 ORCAFLEX SETTINGS
Setting Value Unit Comment
Integration scheme Implicit - Variable time step
Time step 0.25 s Maximum value
Simulation length 10800 s
Vessel Hydrodynamics Morison -
Wave and current direction 0 deg Collinear, aligned with ML1
Targeted mooring line segment [3-5-10-5-10] m per section (from vessel to anchor)
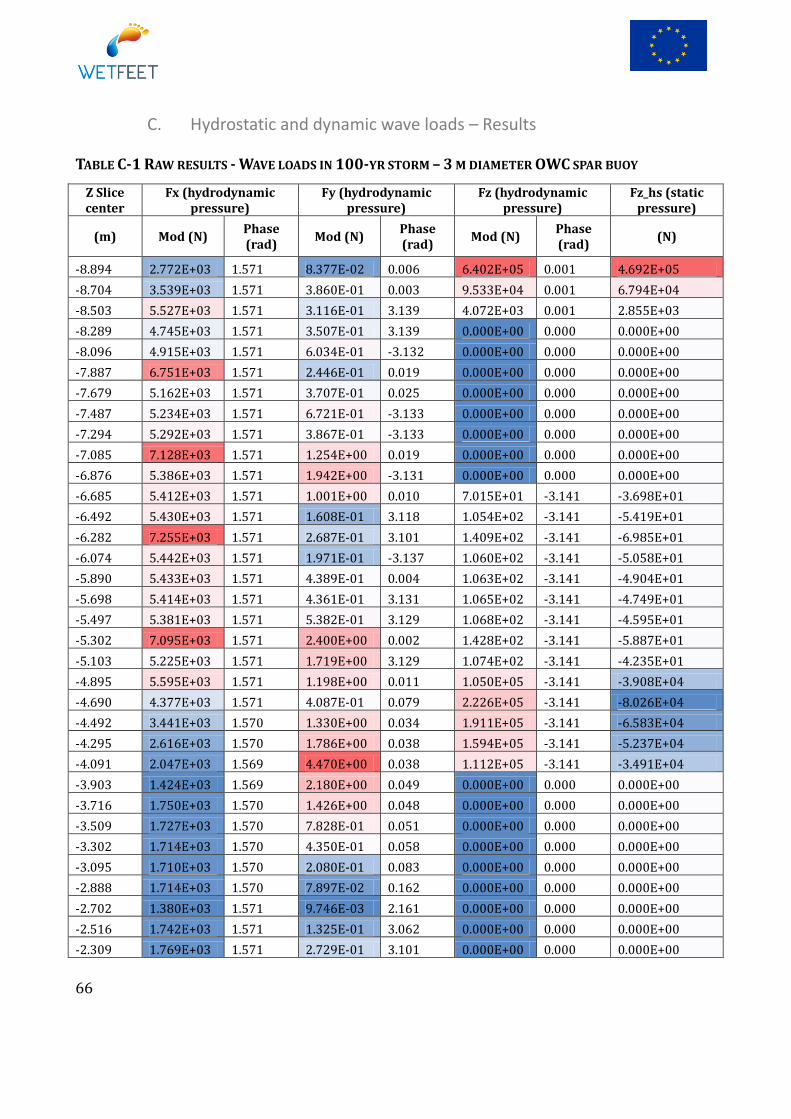
66
C. Hydrostatic and dynamic wave loads – Results
TABLE C-1 RAW RESULTS - WAVE LOADS IN 100-YR STORM – 3 M DIAMETER OWC SPAR BUOY
Z Slice center
Fx (hydrodynamic pressure)
Fy (hydrodynamic pressure)
Fz (hydrodynamic pressure)
Fz_hs (static pressure)
(m) Mod (N) Phase (rad)
Mod (N) Phase (rad)
Mod (N) Phase (rad)
(N)
-8.894 2.772E+03 1.571 8.377E-02 0.006 6.402E+05 0.001 4.692E+05
-8.704 3.539E+03 1.571 3.860E-01 0.003 9.533E+04 0.001 6.794E+04
-8.503 5.527E+03 1.571 3.116E-01 3.139 4.072E+03 0.001 2.855E+03
-8.289 4.745E+03 1.571 3.507E-01 3.139 0.000E+00 0.000 0.000E+00
-8.096 4.915E+03 1.571 6.034E-01 -3.132 0.000E+00 0.000 0.000E+00
-7.887 6.751E+03 1.571 2.446E-01 0.019 0.000E+00 0.000 0.000E+00
-7.679 5.162E+03 1.571 3.707E-01 0.025 0.000E+00 0.000 0.000E+00
-7.487 5.234E+03 1.571 6.721E-01 -3.133 0.000E+00 0.000 0.000E+00
-7.294 5.292E+03 1.571 3.867E-01 -3.133 0.000E+00 0.000 0.000E+00
-7.085 7.128E+03 1.571 1.254E+00 0.019 0.000E+00 0.000 0.000E+00
-6.876 5.386E+03 1.571 1.942E+00 -3.131 0.000E+00 0.000 0.000E+00
-6.685 5.412E+03 1.571 1.001E+00 0.010 7.015E+01 -3.141 -3.698E+01
-6.492 5.430E+03 1.571 1.608E-01 3.118 1.054E+02 -3.141 -5.419E+01
-6.282 7.255E+03 1.571 2.687E-01 3.101 1.409E+02 -3.141 -6.985E+01
-6.074 5.442E+03 1.571 1.971E-01 -3.137 1.060E+02 -3.141 -5.058E+01
-5.890 5.433E+03 1.571 4.389E-01 0.004 1.063E+02 -3.141 -4.904E+01
-5.698 5.414E+03 1.571 4.361E-01 3.131 1.065E+02 -3.141 -4.749E+01
-5.497 5.381E+03 1.571 5.382E-01 3.129 1.068E+02 -3.141 -4.595E+01
-5.302 7.095E+03 1.571 2.400E+00 0.002 1.428E+02 -3.141 -5.887E+01
-5.103 5.225E+03 1.571 1.719E+00 3.129 1.074E+02 -3.141 -4.235E+01
-4.895 5.595E+03 1.571 1.198E+00 0.011 1.050E+05 -3.141 -3.908E+04
-4.690 4.377E+03 1.571 4.087E-01 0.079 2.226E+05 -3.141 -8.026E+04
-4.492 3.441E+03 1.570 1.330E+00 0.034 1.911E+05 -3.141 -6.583E+04
-4.295 2.616E+03 1.570 1.786E+00 0.038 1.594E+05 -3.141 -5.237E+04
-4.091 2.047E+03 1.569 4.470E+00 0.038 1.112E+05 -3.141 -3.491E+04
-3.903 1.424E+03 1.569 2.180E+00 0.049 0.000E+00 0.000 0.000E+00
-3.716 1.750E+03 1.570 1.426E+00 0.048 0.000E+00 0.000 0.000E+00
-3.509 1.727E+03 1.570 7.828E-01 0.051 0.000E+00 0.000 0.000E+00
-3.302 1.714E+03 1.570 4.350E-01 0.058 0.000E+00 0.000 0.000E+00
-3.095 1.710E+03 1.570 2.080E-01 0.083 0.000E+00 0.000 0.000E+00
-2.888 1.714E+03 1.570 7.897E-02 0.162 0.000E+00 0.000 0.000E+00
-2.702 1.380E+03 1.571 9.746E-03 2.161 0.000E+00 0.000 0.000E+00
-2.516 1.742E+03 1.571 1.325E-01 3.062 0.000E+00 0.000 0.000E+00
-2.309 1.769E+03 1.571 2.729E-01 3.101 0.000E+00 0.000 0.000E+00

67
Z Slice center
Fx (hydrodynamic pressure)
Fy (hydrodynamic pressure)
Fz (hydrodynamic pressure)
Fz_hs (static pressure)
(m) Mod (N) Phase (rad)
Mod (N) Phase (rad)
Mod (N) Phase (rad)
(N)
-2.101 1.803E+03 1.571 7.530E-01 3.120 0.000E+00 0.000 0.000E+00
-1.900 2.049E+03 1.571 8.884E-01 3.120 1.909E+05 0.001 2.687E+04
-1.702 3.379E+03 1.571 6.753E-01 3.125 3.382E+05 0.001 4.295E+04
-1.499 5.080E+03 1.571 3.214E-01 3.121 2.081E+05 0.001 2.406E+04
-1.305 5.024E+03 1.571 1.460E-01 3.108 0.000E+00 0.000 0.000E+00
-1.114 5.559E+03 1.571 2.005E-02 3.013 0.000E+00 0.000 0.000E+00
-0.905 6.287E+03 1.571 8.667E-03 2.310 0.000E+00 0.000 0.000E+00
-0.705 5.199E+03 1.571 2.093E-01 3.123 0.000E+00 0.000 0.000E+00
-0.509 6.246E+03 1.571 4.132E-02 0.123 0.000E+00 0.000 0.000E+00
-0.294 6.386E+03 1.571 2.917E-01 3.136 0.000E+00 0.000 0.000E+00
-0.093 5.552E+03 1.571 1.065E-01 0.048 0.000E+00 0.000 0.000E+00
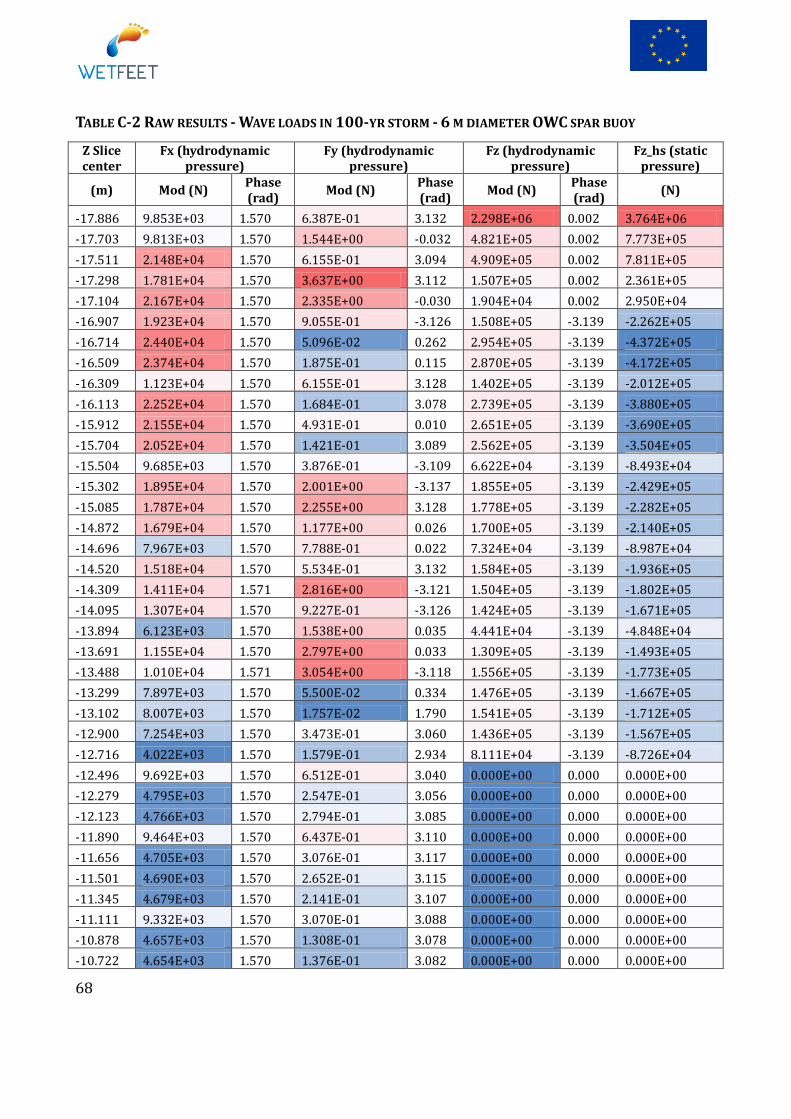
68
TABLE C-2 RAW RESULTS - WAVE LOADS IN 100-YR STORM - 6 M DIAMETER OWC SPAR BUOY
Z Slice center
Fx (hydrodynamic pressure)
Fy (hydrodynamic pressure)
Fz (hydrodynamic pressure)
Fz_hs (static pressure)
(m) Mod (N) Phase (rad)
Mod (N) Phase (rad)
Mod (N) Phase (rad)
(N)
-17.886 9.853E+03 1.570 6.387E-01 3.132 2.298E+06 0.002 3.764E+06
-17.703 9.813E+03 1.570 1.544E+00 -0.032 4.821E+05 0.002 7.773E+05
-17.511 2.148E+04 1.570 6.155E-01 3.094 4.909E+05 0.002 7.811E+05
-17.298 1.781E+04 1.570 3.637E+00 3.112 1.507E+05 0.002 2.361E+05
-17.104 2.167E+04 1.570 2.335E+00 -0.030 1.904E+04 0.002 2.950E+04
-16.907 1.923E+04 1.570 9.055E-01 -3.126 1.508E+05 -3.139 -2.262E+05
-16.714 2.440E+04 1.570 5.096E-02 0.262 2.954E+05 -3.139 -4.372E+05
-16.509 2.374E+04 1.570 1.875E-01 0.115 2.870E+05 -3.139 -4.172E+05
-16.309 1.123E+04 1.570 6.155E-01 3.128 1.402E+05 -3.139 -2.012E+05
-16.113 2.252E+04 1.570 1.684E-01 3.078 2.739E+05 -3.139 -3.880E+05
-15.912 2.155E+04 1.570 4.931E-01 0.010 2.651E+05 -3.139 -3.690E+05
-15.704 2.052E+04 1.570 1.421E-01 3.089 2.562E+05 -3.139 -3.504E+05
-15.504 9.685E+03 1.570 3.876E-01 -3.109 6.622E+04 -3.139 -8.493E+04
-15.302 1.895E+04 1.570 2.001E+00 -3.137 1.855E+05 -3.139 -2.429E+05
-15.085 1.787E+04 1.570 2.255E+00 3.128 1.778E+05 -3.139 -2.282E+05
-14.872 1.679E+04 1.570 1.177E+00 0.026 1.700E+05 -3.139 -2.140E+05
-14.696 7.967E+03 1.570 7.788E-01 0.022 7.324E+04 -3.139 -8.987E+04
-14.520 1.518E+04 1.570 5.534E-01 3.132 1.584E+05 -3.139 -1.936E+05
-14.309 1.411E+04 1.571 2.816E+00 -3.121 1.504E+05 -3.139 -1.802E+05
-14.095 1.307E+04 1.570 9.227E-01 -3.126 1.424E+05 -3.139 -1.671E+05
-13.894 6.123E+03 1.570 1.538E+00 0.035 4.441E+04 -3.139 -4.848E+04
-13.691 1.155E+04 1.570 2.797E+00 0.033 1.309E+05 -3.139 -1.493E+05
-13.488 1.010E+04 1.571 3.054E+00 -3.118 1.556E+05 -3.139 -1.773E+05
-13.299 7.897E+03 1.570 5.500E-02 0.334 1.476E+05 -3.139 -1.667E+05
-13.102 8.007E+03 1.570 1.757E-02 1.790 1.541E+05 -3.139 -1.712E+05
-12.900 7.254E+03 1.570 3.473E-01 3.060 1.436E+05 -3.139 -1.567E+05
-12.716 4.022E+03 1.570 1.579E-01 2.934 8.111E+04 -3.139 -8.726E+04
-12.496 9.692E+03 1.570 6.512E-01 3.040 0.000E+00 0.000 0.000E+00
-12.279 4.795E+03 1.570 2.547E-01 3.056 0.000E+00 0.000 0.000E+00
-12.123 4.766E+03 1.570 2.794E-01 3.085 0.000E+00 0.000 0.000E+00
-11.890 9.464E+03 1.570 6.437E-01 3.110 0.000E+00 0.000 0.000E+00
-11.656 4.705E+03 1.570 3.076E-01 3.117 0.000E+00 0.000 0.000E+00
-11.501 4.690E+03 1.570 2.652E-01 3.115 0.000E+00 0.000 0.000E+00
-11.345 4.679E+03 1.570 2.141E-01 3.107 0.000E+00 0.000 0.000E+00
-11.111 9.332E+03 1.570 3.070E-01 3.088 0.000E+00 0.000 0.000E+00
-10.878 4.657E+03 1.570 1.308E-01 3.078 0.000E+00 0.000 0.000E+00
-10.722 4.654E+03 1.570 1.376E-01 3.082 0.000E+00 0.000 0.000E+00

69
Z Slice center
Fx (hydrodynamic pressure)
Fy (hydrodynamic pressure)
Fz (hydrodynamic pressure)
Fz_hs (static pressure)
(m) Mod (N) Phase (rad)
Mod (N) Phase (rad)
Mod (N) Phase (rad)
(N)
-10.488 9.304E+03 1.570 3.248E-01 3.095 0.000E+00 0.000 0.000E+00
-10.255 4.653E+03 1.570 1.860E-01 3.104 0.000E+00 0.000 0.000E+00
-10.099 4.656E+03 1.570 1.940E-01 3.106 0.000E+00 0.000 0.000E+00
-9.943 4.660E+03 1.570 1.943E-01 3.107 0.000E+00 0.000 0.000E+00
-9.710 9.336E+03 1.570 3.571E-01 3.105 0.000E+00 0.000 0.000E+00
-9.476 4.678E+03 1.570 1.456E-01 3.098 0.000E+00 0.000 0.000E+00
-9.321 4.687E+03 1.570 1.142E-01 3.089 0.000E+00 0.000 0.000E+00
-9.087 9.403E+03 1.570 1.366E-01 3.061 0.000E+00 0.000 0.000E+00
-8.854 4.718E+03 1.570 3.845E-02 3.001 0.000E+00 0.000 0.000E+00
-8.698 4.731E+03 1.570 3.920E-02 2.996 0.000E+00 0.000 0.000E+00
-8.542 4.745E+03 1.570 5.332E-02 3.023 0.000E+00 0.000 0.000E+00
-8.309 9.535E+03 1.570 1.532E-01 3.047 0.000E+00 0.000 0.000E+00
-8.075 4.793E+03 1.570 7.578E-02 3.036 0.000E+00 0.000 0.000E+00
-7.919 4.811E+03 1.570 4.250E-02 2.950 0.000E+00 0.000 0.000E+00
-7.686 9.682E+03 1.570 9.348E-02 0.160 0.000E+00 0.000 0.000E+00
-7.452 4.874E+03 1.570 1.274E-01 0.050 0.000E+00 0.000 0.000E+00
-7.296 4.898E+03 1.570 1.468E-01 0.038 0.000E+00 0.000 0.000E+00
-7.141 4.923E+03 1.570 1.192E-01 0.041 0.000E+00 0.000 0.000E+00
-6.907 9.928E+03 1.570 2.664E-02 0.321 0.000E+00 0.000 0.000E+00
-6.674 5.009E+03 1.570 7.784E-02 3.088 0.000E+00 0.000 0.000E+00
-6.518 5.041E+03 1.570 7.037E-02 3.074 0.000E+00 0.000 0.000E+00
-6.284 1.019E+04 1.570 2.239E-01 0.058 0.000E+00 0.000 0.000E+00
-6.051 5.149E+03 1.570 3.821E-01 0.022 0.000E+00 0.000 0.000E+00
-5.895 5.190E+03 1.570 5.150E-01 0.017 0.000E+00 0.000 0.000E+00
-5.739 5.232E+03 1.570 5.354E-01 0.015 0.000E+00 0.000 0.000E+00
-5.506 1.060E+04 1.570 5.615E-01 0.013 0.000E+00 0.000 0.000E+00
-5.272 5.371E+03 1.570 1.939E-01 0.007 0.000E+00 0.000 0.000E+00
-5.117 5.417E+03 1.570 7.234E-01 0.008 0.000E+00 0.000 0.000E+00
-4.917 8.744E+03 1.570 3.279E+00 0.010 1.899E+05 0.002 7.233E+04
-4.696 8.661E+03 1.570 1.528E+00 0.007 4.844E+05 0.002 1.788E+05
-4.502 1.101E+04 1.570 5.915E-01 0.011 5.767E+05 0.002 2.036E+05
-4.302 1.516E+04 1.570 5.469E-01 0.006 7.357E+05 0.002 2.472E+05
-4.100 1.729E+04 1.570 8.758E-01 0.017 7.739E+05 0.002 2.465E+05
-3.894 2.203E+04 1.570 1.078E+00 -3.111 0.000E+00 0.000 0.000E+00
-3.684 2.124E+04 1.570 3.734E-01 -0.004 0.000E+00 0.000 0.000E+00
-3.500 1.755E+04 1.570 4.566E-01 -3.054 0.000E+00 0.000 0.000E+00
-3.326 1.996E+04 1.570 6.166E-02 -2.884 0.000E+00 0.000 0.000E+00
-3.133 2.208E+04 1.570 5.286E-01 0.030 0.000E+00 0.000 0.000E+00

70
Z Slice center
Fx (hydrodynamic pressure)
Fy (hydrodynamic pressure)
Fz (hydrodynamic pressure)
Fz_hs (static pressure)
(m) Mod (N) Phase (rad)
Mod (N) Phase (rad)
Mod (N) Phase (rad)
(N)
-2.925 2.389E+04 1.570 4.386E-01 0.014 0.000E+00 0.000 0.000E+00
-2.704 2.537E+04 1.570 7.601E-02 -2.774 0.000E+00 0.000 0.000E+00
-2.475 2.650E+04 1.570 2.391E-01 -2.996 0.000E+00 0.000 0.000E+00
-2.299 1.356E+04 1.570 7.758E-03 -1.475 0.000E+00 0.000 0.000E+00
-2.120 2.753E+04 1.570 3.547E-01 0.026 0.000E+00 0.000 0.000E+00
-1.880 2.775E+04 1.570 5.726E-01 0.037 0.000E+00 0.000 0.000E+00
-1.701 1.384E+04 1.570 2.456E-01 0.021 0.000E+00 0.000 0.000E+00
-1.525 2.736E+04 1.570 3.014E-01 -0.025 0.000E+00 0.000 0.000E+00
-1.296 2.662E+04 1.570 1.224E-01 -0.184 0.000E+00 0.000 0.000E+00
-1.075 2.548E+04 1.570 7.052E-02 -0.284 0.000E+00 0.000 0.000E+00
-0.867 2.395E+04 1.570 7.576E-02 -0.047 0.000E+00 0.000 0.000E+00
-0.674 2.203E+04 1.570 5.378E-02 0.285 0.000E+00 0.000 0.000E+00
-0.500 1.971E+04 1.570 5.056E-02 2.846 0.000E+00 0.000 0.000E+00
-0.316 2.436E+04 1.570 3.708E-01 -3.041 0.000E+00 0.000 0.000E+00
-0.107 2.612E+04 1.570 3.792E-01 -3.077 0.000E+00 0.000 0.000E+00
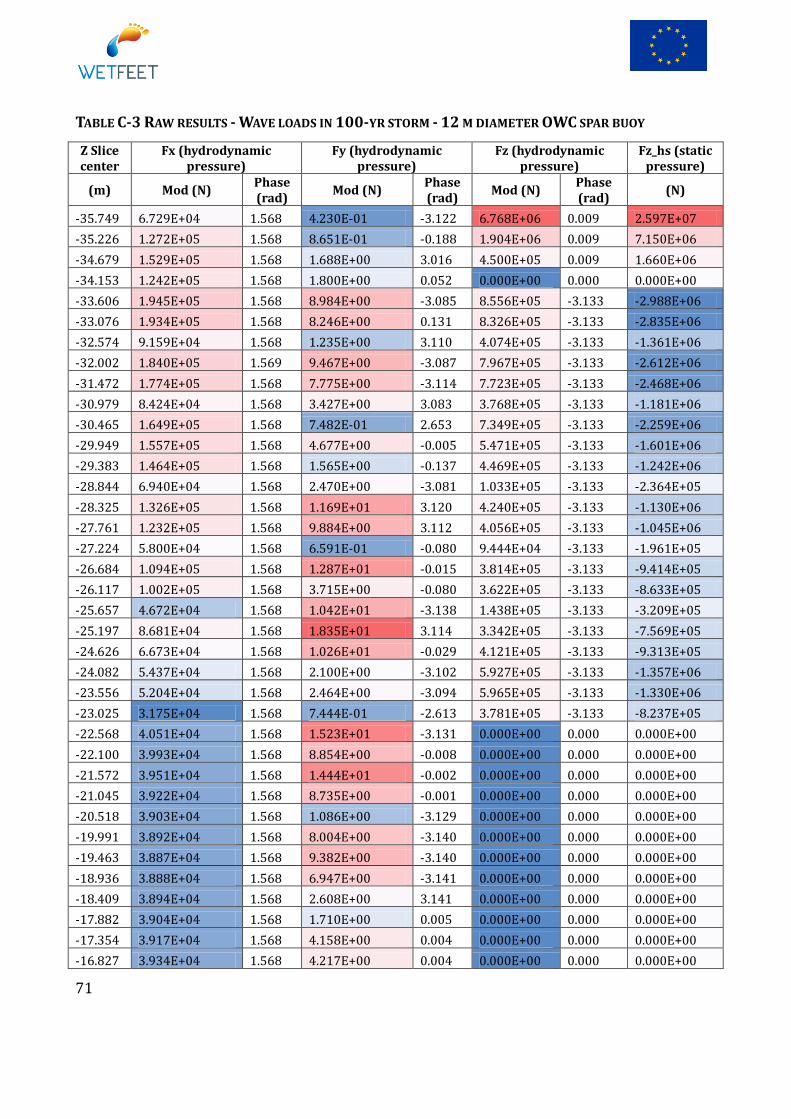
71
TABLE C-3 RAW RESULTS - WAVE LOADS IN 100-YR STORM - 12 M DIAMETER OWC SPAR BUOY
Z Slice center
Fx (hydrodynamic pressure)
Fy (hydrodynamic pressure)
Fz (hydrodynamic pressure)
Fz_hs (static pressure)
(m) Mod (N) Phase (rad)
Mod (N) Phase (rad)
Mod (N) Phase (rad)
(N)
-35.749 6.729E+04 1.568 4.230E-01 -3.122 6.768E+06 0.009 2.597E+07
-35.226 1.272E+05 1.568 8.651E-01 -0.188 1.904E+06 0.009 7.150E+06
-34.679 1.529E+05 1.568 1.688E+00 3.016 4.500E+05 0.009 1.660E+06
-34.153 1.242E+05 1.568 1.800E+00 0.052 0.000E+00 0.000 0.000E+00
-33.606 1.945E+05 1.568 8.984E+00 -3.085 8.556E+05 -3.133 -2.988E+06
-33.076 1.934E+05 1.568 8.246E+00 0.131 8.326E+05 -3.133 -2.835E+06
-32.574 9.159E+04 1.568 1.235E+00 3.110 4.074E+05 -3.133 -1.361E+06
-32.002 1.840E+05 1.569 9.467E+00 -3.087 7.967E+05 -3.133 -2.612E+06
-31.472 1.774E+05 1.568 7.775E+00 -3.114 7.723E+05 -3.133 -2.468E+06
-30.979 8.424E+04 1.568 3.427E+00 3.083 3.768E+05 -3.133 -1.181E+06
-30.465 1.649E+05 1.568 7.482E-01 2.653 7.349E+05 -3.133 -2.259E+06
-29.949 1.557E+05 1.568 4.677E+00 -0.005 5.471E+05 -3.133 -1.601E+06
-29.383 1.464E+05 1.568 1.565E+00 -0.137 4.469E+05 -3.133 -1.242E+06
-28.844 6.940E+04 1.568 2.470E+00 -3.081 1.033E+05 -3.133 -2.364E+05
-28.325 1.326E+05 1.568 1.169E+01 3.120 4.240E+05 -3.133 -1.130E+06
-27.761 1.232E+05 1.568 9.884E+00 3.112 4.056E+05 -3.133 -1.045E+06
-27.224 5.800E+04 1.568 6.591E-01 -0.080 9.444E+04 -3.133 -1.961E+05
-26.684 1.094E+05 1.568 1.287E+01 -0.015 3.814E+05 -3.133 -9.414E+05
-26.117 1.002E+05 1.568 3.715E+00 -0.080 3.622E+05 -3.133 -8.633E+05
-25.657 4.672E+04 1.568 1.042E+01 -3.138 1.438E+05 -3.133 -3.209E+05
-25.197 8.681E+04 1.568 1.835E+01 3.114 3.342E+05 -3.133 -7.569E+05
-24.626 6.673E+04 1.568 1.026E+01 -0.029 4.121E+05 -3.133 -9.313E+05
-24.082 5.437E+04 1.568 2.100E+00 -3.102 5.927E+05 -3.133 -1.357E+06
-23.556 5.204E+04 1.568 2.464E+00 -3.094 5.965E+05 -3.133 -1.330E+06
-23.025 3.175E+04 1.568 7.444E-01 -2.613 3.781E+05 -3.133 -8.237E+05
-22.568 4.051E+04 1.568 1.523E+01 -3.131 0.000E+00 0.000 0.000E+00
-22.100 3.993E+04 1.568 8.854E+00 -0.008 0.000E+00 0.000 0.000E+00
-21.572 3.951E+04 1.568 1.444E+01 -0.002 0.000E+00 0.000 0.000E+00
-21.045 3.922E+04 1.568 8.735E+00 -0.001 0.000E+00 0.000 0.000E+00
-20.518 3.903E+04 1.568 1.086E+00 -3.129 0.000E+00 0.000 0.000E+00
-19.991 3.892E+04 1.568 8.004E+00 -3.140 0.000E+00 0.000 0.000E+00
-19.463 3.887E+04 1.568 9.382E+00 -3.140 0.000E+00 0.000 0.000E+00
-18.936 3.888E+04 1.568 6.947E+00 -3.141 0.000E+00 0.000 0.000E+00
-18.409 3.894E+04 1.568 2.608E+00 3.141 0.000E+00 0.000 0.000E+00
-17.882 3.904E+04 1.568 1.710E+00 0.005 0.000E+00 0.000 0.000E+00
-17.354 3.917E+04 1.568 4.158E+00 0.004 0.000E+00 0.000 0.000E+00
-16.827 3.934E+04 1.568 4.217E+00 0.004 0.000E+00 0.000 0.000E+00
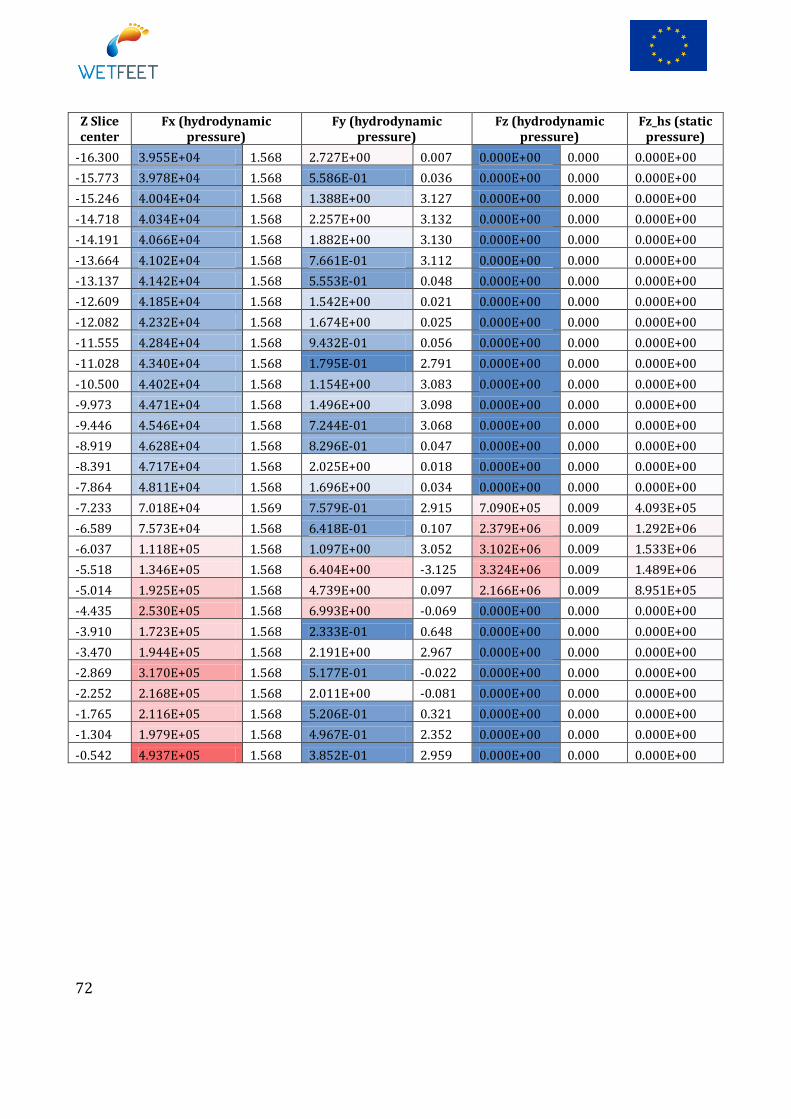
72
Z Slice center
Fx (hydrodynamic pressure)
Fy (hydrodynamic pressure)
Fz (hydrodynamic pressure)
Fz_hs (static pressure)
-16.300 3.955E+04 1.568 2.727E+00 0.007 0.000E+00 0.000 0.000E+00
-15.773 3.978E+04 1.568 5.586E-01 0.036 0.000E+00 0.000 0.000E+00
-15.246 4.004E+04 1.568 1.388E+00 3.127 0.000E+00 0.000 0.000E+00
-14.718 4.034E+04 1.568 2.257E+00 3.132 0.000E+00 0.000 0.000E+00
-14.191 4.066E+04 1.568 1.882E+00 3.130 0.000E+00 0.000 0.000E+00
-13.664 4.102E+04 1.568 7.661E-01 3.112 0.000E+00 0.000 0.000E+00
-13.137 4.142E+04 1.568 5.553E-01 0.048 0.000E+00 0.000 0.000E+00
-12.609 4.185E+04 1.568 1.542E+00 0.021 0.000E+00 0.000 0.000E+00
-12.082 4.232E+04 1.568 1.674E+00 0.025 0.000E+00 0.000 0.000E+00
-11.555 4.284E+04 1.568 9.432E-01 0.056 0.000E+00 0.000 0.000E+00
-11.028 4.340E+04 1.568 1.795E-01 2.791 0.000E+00 0.000 0.000E+00
-10.500 4.402E+04 1.568 1.154E+00 3.083 0.000E+00 0.000 0.000E+00
-9.973 4.471E+04 1.568 1.496E+00 3.098 0.000E+00 0.000 0.000E+00
-9.446 4.546E+04 1.568 7.244E-01 3.068 0.000E+00 0.000 0.000E+00
-8.919 4.628E+04 1.568 8.296E-01 0.047 0.000E+00 0.000 0.000E+00
-8.391 4.717E+04 1.568 2.025E+00 0.018 0.000E+00 0.000 0.000E+00
-7.864 4.811E+04 1.568 1.696E+00 0.034 0.000E+00 0.000 0.000E+00
-7.233 7.018E+04 1.569 7.579E-01 2.915 7.090E+05 0.009 4.093E+05
-6.589 7.573E+04 1.568 6.418E-01 0.107 2.379E+06 0.009 1.292E+06
-6.037 1.118E+05 1.568 1.097E+00 3.052 3.102E+06 0.009 1.533E+06
-5.518 1.346E+05 1.568 6.404E+00 -3.125 3.324E+06 0.009 1.489E+06
-5.014 1.925E+05 1.568 4.739E+00 0.097 2.166E+06 0.009 8.951E+05
-4.435 2.530E+05 1.568 6.993E+00 -0.069 0.000E+00 0.000 0.000E+00
-3.910 1.723E+05 1.568 2.333E-01 0.648 0.000E+00 0.000 0.000E+00
-3.470 1.944E+05 1.568 2.191E+00 2.967 0.000E+00 0.000 0.000E+00
-2.869 3.170E+05 1.568 5.177E-01 -0.022 0.000E+00 0.000 0.000E+00
-2.252 2.168E+05 1.568 2.011E+00 -0.081 0.000E+00 0.000 0.000E+00
-1.765 2.116E+05 1.568 5.206E-01 0.321 0.000E+00 0.000 0.000E+00
-1.304 1.979E+05 1.568 4.967E-01 2.352 0.000E+00 0.000 0.000E+00
-0.542 4.937E+05 1.568 3.852E-01 2.959 0.000E+00 0.000 0.000E+00
![SESAR 2020 - 763601 - D2.1 - Scenarios and Requirements · SESAR 2020 - 763601 - D2.1 - Scenarios and Requirements DeliverableID [D2.1] ProjectAcronym DroC2om Grant: 763601 Call:](https://img.dokumen.tips/doc/110x75/603a54b6ac67ff69d9242d39/sesar-2020-763601-d21-scenarios-and-requirements-sesar-2020-763601-d21.jpg)