Embed Size (px)
Citation preview

Deliverable D11.2
Market Analysis
Due date of deliverable: (T0+24)
Actual submission date: November 14, 2014

Optique Deliverable D11.2 Market Analysis
2
Executive Summary
This document summarizes the first version of deliverable D11.2 “Market Analysis” of project FP7-‐318338 (Optique), an Integrated Project supported by the 7th Framework Programme of the EC. Full information on this project, including the contents of this deliverable, is available online at http://www.optique-‐project.eu/.
The document presents a preliminary market analysis for Optique, starting with the identification of stakeholders in a wider context, and comparing Optique features against competing solutions in the Big Data landscape. Draft value propositions for potential adopters are formulated, and primary barriers to adoption are described from an organizational maturity perspective. A methodology for risk analysis for Optique adoption is provided. Together these pieces form the necessary, basic input for developing business plans and implementation guides for Optique in subsequent project phases.
This deliverable succeeds deliverable D11.1 “Optique Initial Exploitation Report”, and precedes deliverable D11.3 “Business Plan and Implementation Guide”. The objectives served by this deliverable are:
! O11.1: Deliver a business implementation strategy, supported by an assessment model and practical guidelines to adopting Optique in the enterprise.
! O11.2: Deliver a software exploitation strategy, for the benefit of the partners and the European ICT industry, while protecting intellectual property created by the project.
Further work on the market analysis will be carried out in Year 3 of the Optique project, as part of the deliverable D11.3 “Business Plan and Implementation Guide”.
List of Authors
Authors: Kirsti Eikeland (DNV GL) Mansur Abbasi (DNV GL)
Contributors: Tore Hartvigsen (DNV GL) Petter Myrvang (DNV GL) Jean-‐Raphaël Vieille (DNV GL)
Reviewed by: Jarl Magnusson (DNV GL) Thomas Grauer (FOP) Arild Waaler (UiO)

Optique Deliverable D11.2 Market Analysis
3
Contents
Executive Summary ................................................................................................................................................................... 2
List of Authors ......................................................................................................................................................................... 2
Contents .......................................................................................................................................................................................... 3
1 Introduction ........................................................................................................................................................................ 4
1.1 Current Scope ........................................................................................................................................................... 4
1.2 Next Steps ................................................................................................................................................................... 4
2 Stakeholder Analysis ....................................................................................................................................................... 6
2.1 Goals, Incentives and Interest ............................................................................................................................ 7
2.2 Relative Interest and Influence ...................................................................................................................... 10
2.3 Recommended Communication Channels ................................................................................................. 10
3 Gap Analysis ..................................................................................................................................................................... 12
3.1 Key Trends and Drivers ..................................................................................................................................... 12
3.2 Competing Solutions ........................................................................................................................................... 13
3.3 Feature Comparison ........................................................................................................................................... 14
4 Value Proposition .......................................................................................................................................................... 15
4.1 Value and Benefits to End-‐Users ................................................................................................................... 15
4.2 Sample Industrial Use Cases ............................................................................................................................ 17
5 Barriers to Adoption ..................................................................................................................................................... 21
5.1 Organizational Maturity Model ...................................................................................................................... 21
6 Risk Analysis .................................................................................................................................................................... 25
Appendix 1: Feature Comparison ..................................................................................................................................... 26
Appendix 2: Risk Analysis Framework .......................................................................................................................... 29
Appendix 3: The Optique Partner Program ................................................................................................................. 32

Optique Deliverable D11.2 Market Analysis
4
1 Introduction A brief outlook on the market targeted by Optique was presented in deliverable D11.1 “Optique Initial Exploitation Plan”. This report presents the results of the first iteration on a more detailed market analysis. The goal of this analysis is to identify the market context, contribution and competitive position of Optique, serving as key inputs for future dissemination and commercialization activities, i.e. work to be addressed in deliverable D11.3 “Business Plan and Implementation Guide”.
1.1 Current Scope In the first iteration, emphasis has been put on evaluating Optique from a business point-‐of-‐view, complementing the strategic and business impact vision and impact generation strategy for Optique (described in Technical Annex, Part B3).
The first step in this evaluation has been to perform an identification of categories of stakeholders, spanning beyond the list of actors included in the notion of Optique ecosystem (described in Technical Annex, Part B3). The goals and incentives related to Optique adoption are analyzed for each of the identified stakeholder categories and recommendations for suitable communication channels are made. The stakeholder analysis is used both as the starting point and for demarcation of the market analysis’ scope.
The second step has been to identify the technical contribution and uniqueness of Optique in order to position Optique in the space of Big Data and data integration solutions. This is done in the form of a gap-‐analysis comparing features of Optique against current paradigms and approaches to data access and data exploitation.
Thirdly, the value and benefits that Optique aims to deliver to adopting enterprises are described as problem-‐solution statements (value propositions), and exemplified through sample industrial use cases.
Fourthly, to understand the inertia and barriers that organizations may face with respect to adoption of a new paradigm for data retrieval and exploitation, a high-‐level model for organizational maturity has been created. Potential barriers to adoption are classified according to parameters of the organizational maturity model.
Finally (for this iteration) a method for risk analysis of Optique implementation in an adopting organization is provided. Development of the actual risk analysis is deferred until experiences from the Optique alpha package distribution and other dissemination activities are collected.
1.2 Next Steps The market analysis should be updated and extended as part of the work on D11.3 “Business Plan and Implementation Guide” (extending the original scope of D11.3). The continuation should focus on developing and refining the following aspects:

Optique Deliverable D11.2 Market Analysis
5
! Re-‐validate current content and update as necessary.
! Refine characteristics assessed for parameters of organizational maturity (Chapter 5, Barriers to Adoption).
! Risk Analysis (Chapter 6): Develop a generic risk analysis for Optique implementation by an enterprise. Utilize feedback, experience and lessons learnt from the Optique alpha package distribution and other dissemination activities of WP10.
! Assess selected target companies for their level of readiness to successfully adopt Optique. Use the organizational maturity concept and parameters (Chapter 5) and the stakeholder analysis (Chapter 2) as basis for this assessment. Include additional criteria as necessary. Use this assessment as foundation for estimating market size and potential.
Once the above activities have been completed, work on Optique business plans and implementation guides (original scope of D11.3) can be started. Using results from the above, one of the first steps towards a generic business plan would be to develop scenarios for overall costs and benefits of implementing Optique, for each of the end-‐user categories in the stakeholder analysis. (Estimates from Technical Annex, Part B3 could be used if relevant and a specific survey could identify implementation, maintenance and expansion costs for competing paradigms, e.g. traditional Data Warehouse and Business Intelligence solutions).
Optique Deliverable D11.2 Market Analysis
6
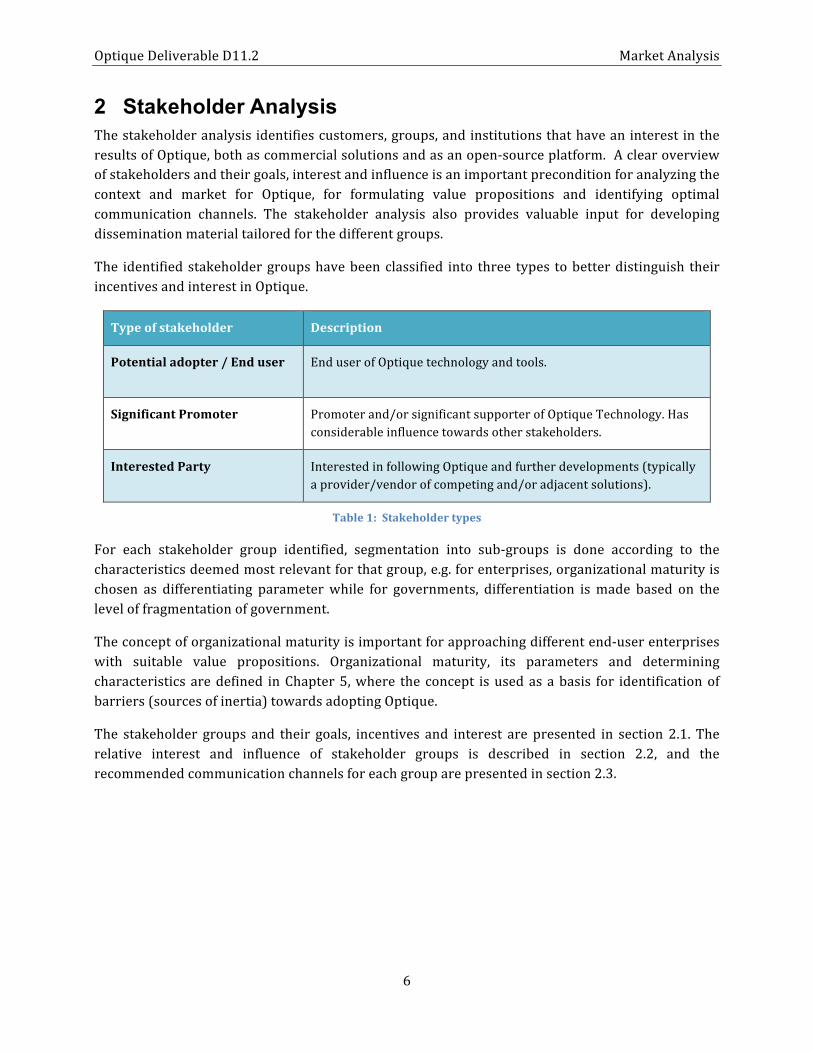
2 Stakeholder Analysis The stakeholder analysis identifies customers, groups, and institutions that have an interest in the results of Optique, both as commercial solutions and as an open-‐source platform. A clear overview of stakeholders and their goals, interest and influence is an important precondition for analyzing the context and market for Optique, for formulating value propositions and identifying optimal communication channels. The stakeholder analysis also provides valuable input for developing dissemination material tailored for the different groups.
The identified stakeholder groups have been classified into three types to better distinguish their incentives and interest in Optique.
Type of stakeholder Description
Potential adopter / End user End user of Optique technology and tools.
Significant Promoter Promoter and/or significant supporter of Optique Technology. Has considerable influence towards other stakeholders.
Interested Party Interested in following Optique and further developments (typically a provider/vendor of competing and/or adjacent solutions).
Table 1: Stakeholder types
For each stakeholder group identified, segmentation into sub-‐groups is done according to the characteristics deemed most relevant for that group, e.g. for enterprises, organizational maturity is chosen as differentiating parameter while for governments, differentiation is made based on the level of fragmentation of government.
The concept of organizational maturity is important for approaching different end-‐user enterprises with suitable value propositions. Organizational maturity, its parameters and determining characteristics are defined in Chapter 5, where the concept is used as a basis for identification of barriers (sources of inertia) towards adopting Optique.
The stakeholder groups and their goals, incentives and interest are presented in section 2.1. The relative interest and influence of stakeholder groups is described in section 2.2, and the recommended communication channels for each group are presented in section 2.3.
Optique Deliverable D11.2 Market Analysis
7
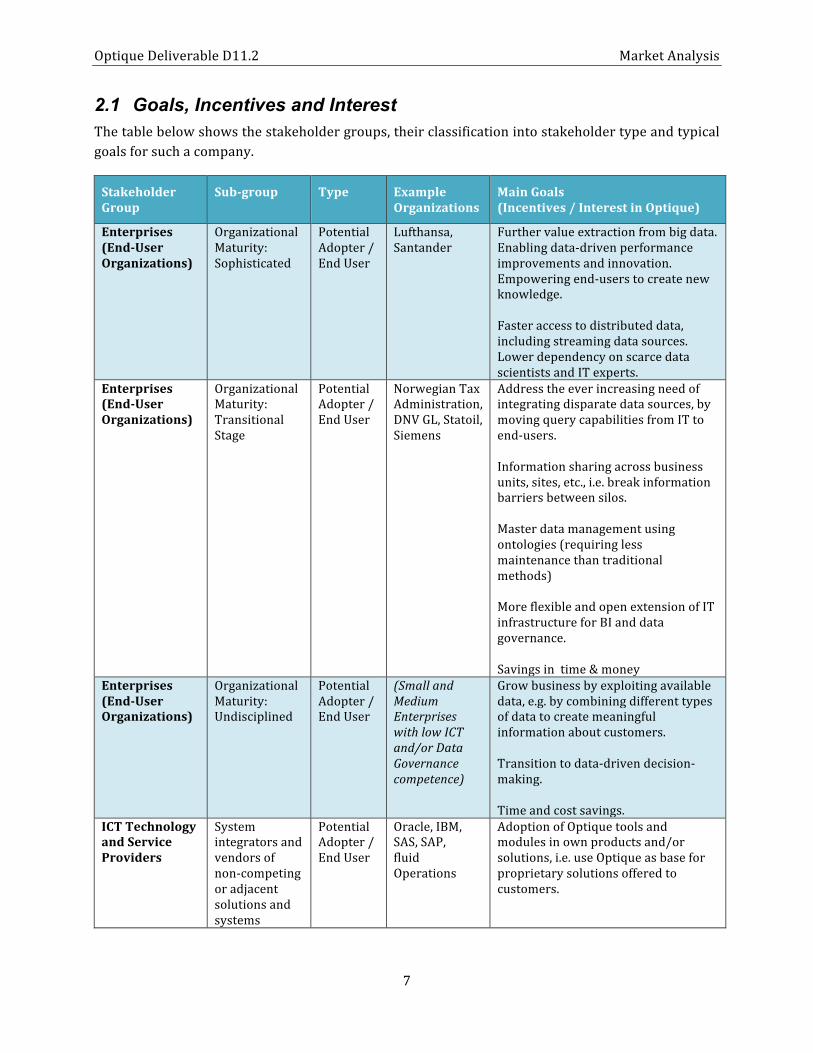
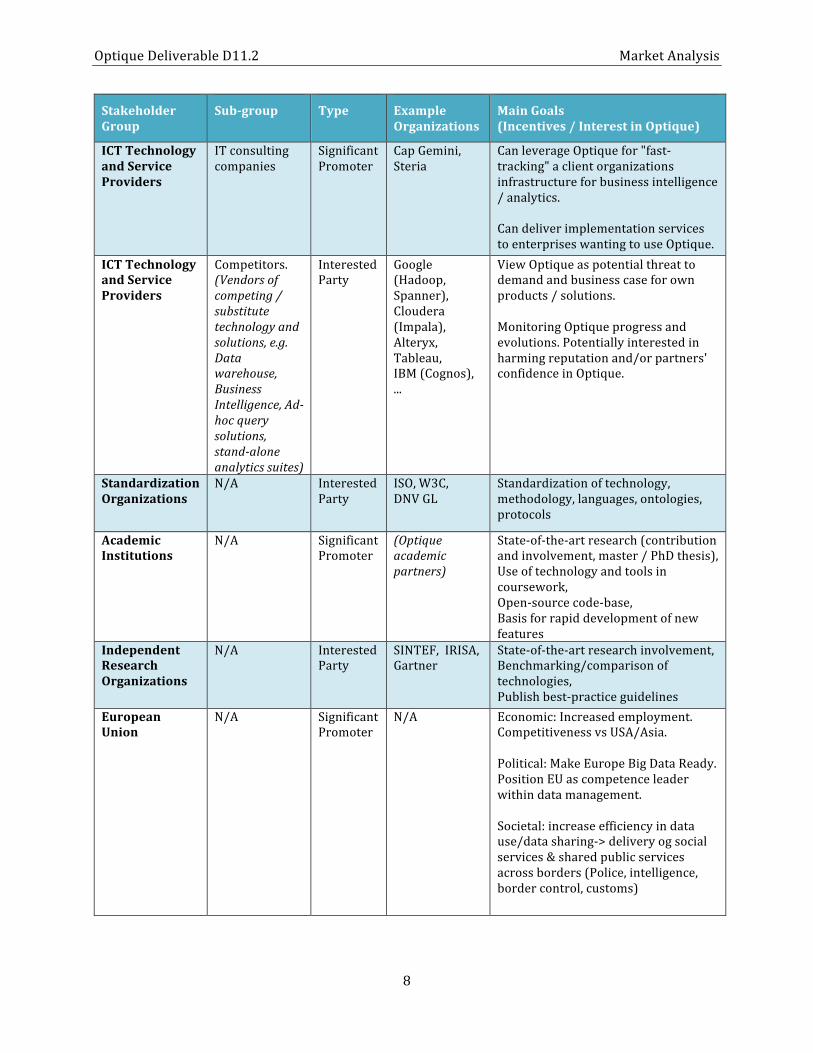
2.1 Goals, Incentives and Interest The table below shows the stakeholder groups, their classification into stakeholder type and typical goals for such a company.
Stakeholder Group
Sub-‐group Type Example Organizations
Main Goals (Incentives / Interest in Optique)
Enterprises (End-‐User Organizations)
Organizational Maturity: Sophisticated
Potential Adopter / End User
Lufthansa, Santander
Further value extraction from big data. Enabling data-‐driven performance improvements and innovation. Empowering end-‐users to create new knowledge. Faster access to distributed data, including streaming data sources. Lower dependency on scarce data scientists and IT experts.
Enterprises (End-‐User Organizations)
Organizational Maturity: Transitional Stage
Potential Adopter / End User
Norwegian Tax Administration, DNV GL, Statoil, Siemens
Address the ever increasing need of integrating disparate data sources, by moving query capabilities from IT to end-‐users. Information sharing across business units, sites, etc., i.e. break information barriers between silos. Master data management using ontologies (requiring less maintenance than traditional methods) More flexible and open extension of IT infrastructure for BI and data governance. Savings in time & money
Enterprises (End-‐User Organizations)
Organizational Maturity: Undisciplined
Potential Adopter / End User
(Small and Medium Enterprises with low ICT and/or Data Governance competence)
Grow business by exploiting available data, e.g. by combining different types of data to create meaningful information about customers. Transition to data-‐driven decision-‐making. Time and cost savings.
ICT Technology and Service Providers
System integrators and vendors of non-‐competing or adjacent solutions and systems
Potential Adopter / End User
Oracle, IBM, SAS, SAP, fluid Operations
Adoption of Optique tools and modules in own products and/or solutions, i.e. use Optique as base for proprietary solutions offered to customers.
Optique Deliverable D11.2 Market Analysis
8
Stakeholder Group
Sub-‐group Type Example Organizations
Main Goals (Incentives / Interest in Optique)
ICT Technology and Service Providers
IT consulting companies
Significant Promoter
Cap Gemini, Steria
Can leverage Optique for "fast-‐tracking" a client organizations infrastructure for business intelligence / analytics. Can deliver implementation services to enterprises wanting to use Optique.
ICT Technology and Service Providers
Competitors. (Vendors of competing / substitute technology and solutions, e.g. Data warehouse, Business Intelligence, Ad-‐hoc query solutions, stand-‐alone analytics suites)
Interested Party
Google (Hadoop, Spanner), Cloudera (Impala), Alteryx, Tableau, IBM (Cognos), ...
View Optique as potential threat to demand and business case for own products / solutions. Monitoring Optique progress and evolutions. Potentially interested in harming reputation and/or partners' confidence in Optique.
Standardization Organizations
N/A Interested Party
ISO, W3C, DNV GL
Standardization of technology, methodology, languages, ontologies, protocols
Academic Institutions
N/A Significant Promoter
(Optique academic partners)
State-‐of-‐the-‐art research (contribution and involvement, master / PhD thesis), Use of technology and tools in coursework, Open-‐source code-‐base, Basis for rapid development of new features
Independent Research Organizations
N/A Interested Party
SINTEF, IRISA, Gartner
State-‐of-‐the-‐art research involvement, Benchmarking/comparison of technologies, Publish best-‐practice guidelines
European Union
N/A Significant Promoter
N/A Economic: Increased employment. Competitiveness vs USA/Asia. Political: Make Europe Big Data Ready. Position EU as competence leader within data management. Societal: increase efficiency in data use/data sharing-‐> delivery og social services & shared public services across borders (Police, intelligence, border control, customs)

Optique Deliverable D11.2 Market Analysis
9
Stakeholder Group
Sub-‐group Type Example Organizations
Main Goals (Incentives / Interest in Optique)
EU Member Country
Low Fragmentation
Potential Adopter / End User
Norway Societal: increase efficiency in data use/data sharing-‐> delivery og social services & shared public services across borders (Police, intelligence, border control, customs)
EU Member Country
High Fragmentation
Potential Adopter / End User
Greece Societal: use/data sharing-‐> delivery og social services & shared public services across borders (Police, intelligence, border control, customs)
Multi-‐Government Partnerships / Coalitions
N/A Significant Promoter
OGP (Open Government Partnership), WEF (World Economic Forum)
Global / regional prosperity, increased responsiveness of governments, economic growth, …
NGOs N/A Potential Adopter / End User
Red Cross, UNICEF, EuroHealthNet, Eurochild, WWF, Amnesty International
Optique as key enabling component for implementing low-‐cost, easily scalable infrastructure supporting shift towards data-‐driven decision making in planning and operations of NGOs activities, as well as information-‐sharing between NGOs (e.g. development of shared regional or global emergency-‐response databases)
Open Source Communities
N/A Significant Promoter
TOPCASED, OnTop
Open source platform for on-‐demand integration of structured, but disparate data sources. Basis for rapid development of new, open source solutions for data access and business intelligence in the Big Data Landscape.
Table 2: Stakeholder groups and goals

Optique Deliverable D11.2 Market Analysis
10
2.2 Relative Interest and Influence The relative interest and influence of identified stakeholder groups is visualized in Figure 1 below. Qualitative assessment of the relative power/influence and incentive/interest enables identification of key stakeholder groups (upper right quadrant in Figure 1). As stakeholder groups of all three types (potential adopter, significant contributor and interested party) end up in the “Key Stakeholder” quadrant, a broad range of communication channels need to be considered.
Figure 1: Relative interest and influence of identified stakeholder groups
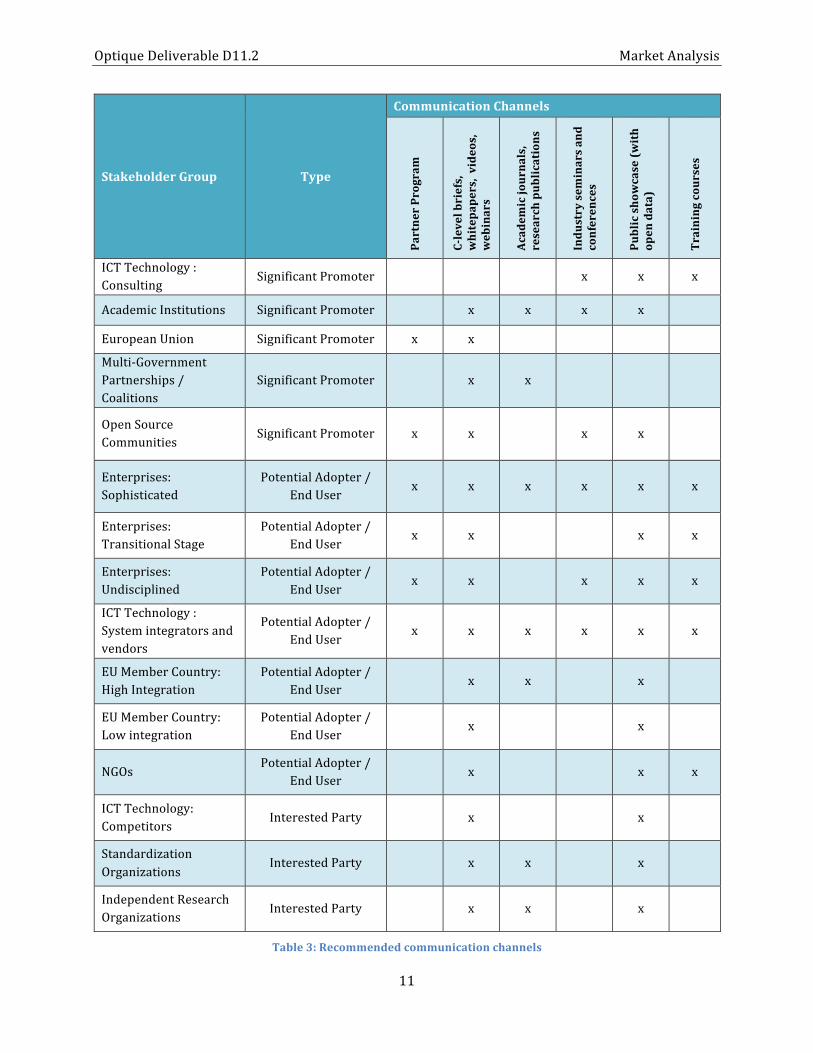
2.3 Recommended Communication Channels The Optique Partner Program is an important part of the overall communication and dissemination strategy of Optique, and provides a context for interacting with key stakeholders. Effective dissemination and stakeholder communication is however dependent on selecting the appropriate communication channels. The most relevant communication channels for each stakeholder group are presented in Table 3 (next page). The Optique Partner Program is described in Appendix 3: The Optique Partner Program
Optique Deliverable D11.2 Market Analysis
11
Stakeholder Group Type
Communication Channels
Partner Program
C-‐level briefs,
whitepapers, videos,
webinars
Academ
ic journals,
research publications
Industry sem
inars and
conferences
Public showcase (w
ith
open data)
Training courses
ICT Technology : Consulting
Significant Promoter
x x x
Academic Institutions Significant Promoter
x x x x
European Union Significant Promoter x x
Multi-‐Government Partnerships / Coalitions
Significant Promoter
x x
Open Source Communities
Significant Promoter x x
x x
Enterprises: Sophisticated
Potential Adopter / End User
x x x x x x
Enterprises: Transitional Stage
Potential Adopter / End User
x x
x x
Enterprises: Undisciplined
Potential Adopter / End User
x x
x x x
ICT Technology : System integrators and vendors
Potential Adopter / End User
x x x x x x
EU Member Country: High Integration
Potential Adopter / End User
x x
x
EU Member Country: Low integration
Potential Adopter / End User
x
x
NGOs Potential Adopter /
End User x
x x
ICT Technology: Competitors
Interested Party
x
x
Standardization Organizations
Interested Party
x x
x
Independent Research Organizations
Interested Party
x x
x
Table 3: Recommended communication channels

Optique Deliverable D11.2 Market Analysis
12
3 Gap Analysis The focus on the gap analysis is to evaluate the Optique solutions’ main features’ and characteristics as a commercially available solution (to address big data challenges). A gap analysis must be done against a baseline. The key trends & drivers (chapter 3.1) identifies major trends within the realm of Optique: Big data and data integration.
Four different approaches to the Big Data and Data integration challenge and as such competitive solutions are detailed in chapter 3.2. The analysis is a qualitative rather than quantitative assessment of competing solutions to be able to identify both the benefits and (potential) shortcomings of the Optique solution.
3.1 Key Trends and Drivers
Big data
Increased connectivity, new capabilities for capturing, storing, processing, presenting, and visualizing data, and in particular large volumes of varied data at high velocity, has developed significantly the past few years. Big Data solutions aim to effectively aid decision – making, allowing users to work more effectively by focusing on accurate information and how to use it when required. The market is showing increasing signs of maturity where big data becomes part of overall information infrastructure, needing master data management, data integration, security and so forth. The question posed by more sophisticated enterprises is moving from “what is big data and how can I use it?” to “how can I get value from big data”. A range of advanced tools have come to the market to help for instance oil and gas operators make sense of this so-‐called ‘Big Data’, in order to understand how to bolster performance across thousands of wells and, in real-‐time, monitor the condition of advanced equipment.
But the technical limitations of today’s computing systems are already struggling to manage the amount of information that some operators are required to handle, sparking a search for smarter ways in which data could, and should, be analyzed.
Data integration The discipline of data integration comprises the practices, architectural techniques and tools for achieving consistent access to, and delivery of, data across the spectrum of data subject areas and data structure types in the enterprise.
Data integration is at the heart of modern information infrastructure. Companies continue to seek a full range of capabilities to address diverse use cases which often include business intelligence (BI) and analytics.
More organizations are selecting data integration tools that provide tight links to data quality tools to support critical initiatives. There is an increasing demand for data to be delivered or processed in real time (or near real time) to match the speed of a business. The data warehouse (DW) must manage a range of data latencies to make data available for use within acceptable service levels.

Optique Deliverable D11.2 Market Analysis
13
Many companies still consider open source programs immature, but more and more information management leaders recognize that the functionality of open-‐source data integration tools is becoming more refined through increasing adoption. Uptake will continue to rise — particularly for well-‐scoped, often small-‐scale deployments and data migration — as deployment of open-‐source software for other infrastructure areas (such as operating systems and DBMSs) grows .
3.2 Competing Solutions The below solutions address to a varying degree the key trends identified, but are well-‐established in the market as approaches and technologies to meet the Big data/ Data integration challenge.
3.2.1 Data Warehouse A data warehouse solution integrates data from one or more disparate sources creates a central repository of data, a data warehouse (DW). Data warehouses store current and historical data by uploading from different sources to be used for reporting purposes. The DBMS market grew by 9.4% in 2013, to $28.7 billion, with a majority of the growth driven by data warehousing. Organizations will continue to modernize existing data warehouse (DW) infrastructure as big data and mixed workload becomes more complex, as integrating big data becomes a requirement, and as cost-‐benefit considerations become a decision factor when persisting data. DW architectures now includes data federation, distributed processing across clusters and in-‐memory DBMSs— the logical DW. Although traditional DW requirements continue to drive most of the market, the DW DBMS market continues to be disrupted by new approaches and, as a result, customers are hesitating when it comes to choosing a DW strategy1.
3.2.2 Business Intelligence Business intelligence (BI) is the set of techniques and tools for the transformation of raw data into meaningful and useful information for business analysis purposes. Often BI applications use data gathered from a data warehouse.
1 Gartner, Inc. | The State of Data Warehousing in 2014, June 2014
Support for big data issues ranks only No. 16 in the list of factors that buyers consider when selecting a data integration technology and vendor. Buyers place most importance on functional capabilities, followed by performance, scalability and the vendor's overall expertise. Buyers even rank the fact that they already use other products from the vendor as slightly more important than support for big data when evaluating products and vendors Source: Gartner Inc, The state of Data integration: Current Practices and Evolving trends (April 2014)

Optique Deliverable D11.2 Market Analysis
14
3.2.3 Ad-Hoc Query and Reporting Solutions The ad hoc Query approach is commonly used to meet a need for answering “one-‐off” questions that are not easily extracted /not included in existing reports. An IT expert will be able to connect or manipulate direct connections between databases (e.g. with SQL queries or the like) to give an answer to that particular question with less effort that re-‐defining the report for such ad-‐hoc queries; In addition, MS excel exports and manipulations are often used for the same purpose.
3.2.4 Stand-Alone Data Analytics / Visualization Tools (e.g. Excel-input-based tools)
Data analytics is the process of examining raw data with the purpose of drawing conclusions about that information Data analytics focuses on inference, the process of deriving a conclusion based solely on what is already known by the researcher Such solutions can often be purchased to solve a specific scope, not necessarily in conjunction with a “big data” initiative or a data warehouse. In general, big data functionality is more and more decoupled from dedicated data storage technologies. Graph analytics will move beyond graph databases; in-‐memory analytics will separate from specialist in-‐memory databases.
3.3 Feature Comparison A high-‐level comparison of Optique against the competing solutions described in section 3.2 has been carried out. The comparison evaluates how features related to finding data, exploring data and exploiting data are realized by Optique and the competing paradigms. The comparison is documented in Appendix 1: Feature Comparison.

Optique Deliverable D11.2 Market Analysis
15
4 Value Proposition This chapter identifies the value and benefits that Optique aims to deliver to adopters (end-‐users). Understanding what disruptive benefits Optique has to offer, and what business problems Optique addresses, is a key input to producing business plans and enterprise implementation guides for Optique.
4.1 Value and Benefits to End-Users The below table describes seven generic problems from a business perspective that enterprises are struggling with today or are likely to experience as they evolve. For each generic problem, the solution offered by Optique is described (using non-‐technical language).
# Problem Solution offered by Optique
VP1 Enterprises have large amounts of high-‐quality data available in disparate data sources, but end-‐users cannot access this data without extensive support of intermediaries e.g. IT experts.
Optique closes the gap between end-‐users and data by enabling flexible, ontology-‐based queries (i.e. queries in a language familiar to the end-‐user). Optique leverages semantic technologies to enable on-‐demand integration of data from disparate sources independent of database structures.
VP2 Value extraction from data in an enterprise is often constrained by pre-‐defined data mappings and limitations of the organization's infrastructure.
Optique leverages semantic technologies to enable on-‐demand integration of data from disparate sources independent of database structures. Optique enables enterprises to explore and discover new relations between data from different sources, and continuously expand data platforms in a cost-‐efficient manner.
VP3 Enterprises have to undertake large efforts and investments to extend their data platforms and integrate new data sources.
The flexibility offered by semantic technologies allows enterprises using Optique to easily scale their data platforms, rapidly deploy and evolve business models with high data dependencies, and avoid costly vendor lock-‐ins.
VP4 Turnaround times for traditional methods of accessing large volumes of data constrain time-‐windows for decision-‐making and lead to suboptimal decisions.
Optique reduces the turnaround time for data access by closing the gap between end-‐users and data sources, eliminating the need for IT experts and proprietary languages and technology in the query process.

Optique Deliverable D11.2 Market Analysis
16
# Problem Solution offered by Optique
VP5 As volumes increase and data is harvested from multiple, unrelated sources, end-‐users of the data have low transparency to the origin, integrity and trustworthiness of the data.
Optique provides increased transparency between data and the end-‐users, informing the end-‐user about the origin of data and all transformations it has undergone, by tracking the data's provenance.
VP6 In many environments, the exponentially growing volumes of data generated by sensors and other MEMS2 units is currently underutilized as a source of valuable information, often due to complexities such as the need for non-‐trivial correlation of real-‐time, streaming data with static data from other sources.
Optique equips experts with the ability to perform “continuous queries” on large-‐scale data streams received from multiple sources in parallel, and combine traditional data querying techniques with statistical methods for trend analysis. This enables data-‐driven business process automation, e.g. predictive diagnostics and automated dispatch of servicing.
VP7 With increased digitalization of business processes, IT infrastructure is becoming a bigger source of risk and enterprises are adopting more flexible and scalable infrastructure solutions leveraging virtualization and cloud computing.
Optique supports elastic computing schemes for distributed query planning and execution, allowing a more optimal utilization of available computing resources. This results in better trade-‐off between completion-‐time for queries and the cost of resource usage.
2 Micro-‐electro-‐mechanical system
Optique Deliverable D11.2 Market Analysis
17
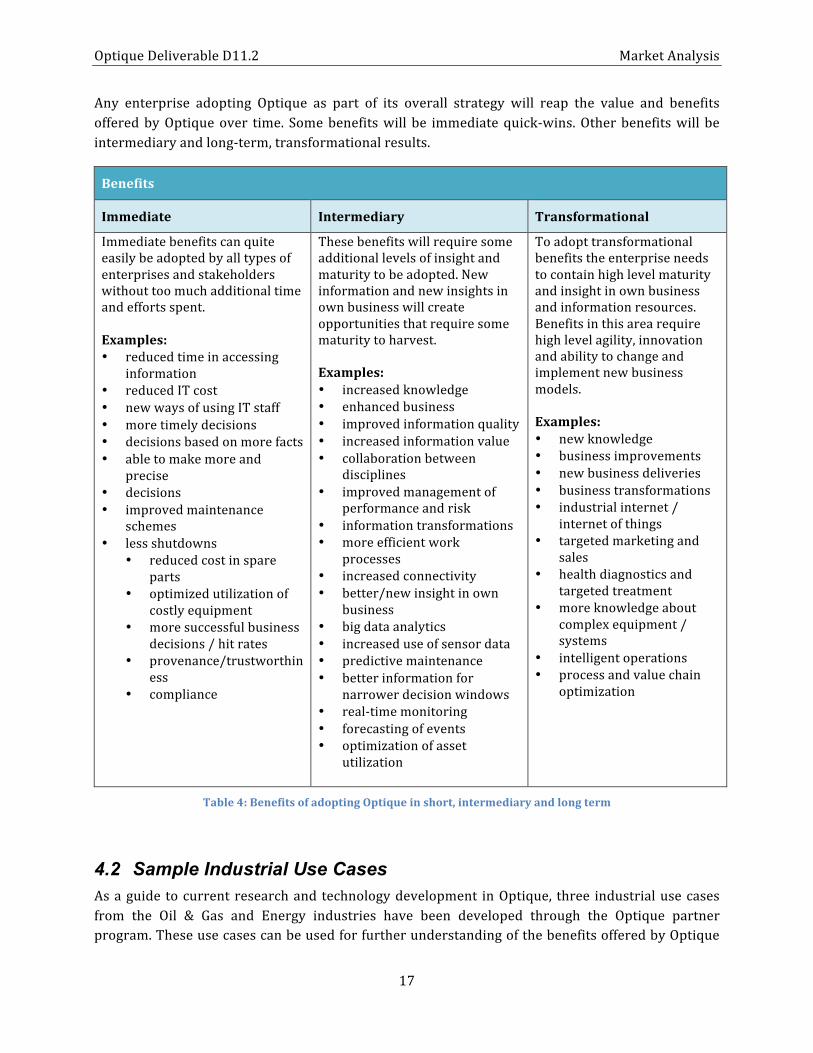
Any enterprise adopting Optique as part of its overall strategy will reap the value and benefits offered by Optique over time. Some benefits will be immediate quick-‐wins. Other benefits will be intermediary and long-‐term, transformational results.
Benefits
Immediate Intermediary Transformational
Immediate benefits can quite easily be adopted by all types of enterprises and stakeholders without too much additional time and efforts spent. Examples: • reduced time in accessing
information • reduced IT cost • new ways of using IT staff • more timely decisions • decisions based on more facts • able to make more and
precise • decisions • improved maintenance
schemes • less shutdowns
• reduced cost in spare parts
• optimized utilization of costly equipment
• more successful business decisions / hit rates
• provenance/trustworthiness
• compliance
These benefits will require some additional levels of insight and maturity to be adopted. New information and new insights in own business will create opportunities that require some maturity to harvest. Examples: • increased knowledge • enhanced business • improved information quality • increased information value • collaboration between
disciplines • improved management of
performance and risk • information transformations • more efficient work
processes • increased connectivity • better/new insight in own
business • big data analytics • increased use of sensor data • predictive maintenance • better information for
narrower decision windows • real-‐time monitoring • forecasting of events • optimization of asset
utilization
To adopt transformational benefits the enterprise needs to contain high level maturity and insight in own business and information resources. Benefits in this area require high level agility, innovation and ability to change and implement new business models. Examples: • new knowledge • business improvements • new business deliveries • business transformations • industrial internet /
internet of things • targeted marketing and
sales • health diagnostics and
targeted treatment • more knowledge about
complex equipment / systems
• intelligent operations • process and value chain
optimization
Table 4: Benefits of adopting Optique in short, intermediary and long term
4.2 Sample Industrial Use Cases As a guide to current research and technology development in Optique, three industrial use cases from the Oil & Gas and Energy industries have been developed through the Optique partner program. These use cases can be used for further understanding of the benefits offered by Optique

Optique Deliverable D11.2 Market Analysis
18
and serve as input to creating business and implementation plans. The three use cases are presented in Appendix A.
4.2.1 The Statoil Use Case The exploration department of oil and gas company Statoil has to find new hydrocarbon reserves in a cost effective way. Ultimately, the only way to prove the presence of a reserve is to drill an exploration well. But since drilling is very expensive, it is important to maximize the chances of success.
To do this, all available data from previous and ongoing exploration and production projects is used to extrapolate a model of the geology of a field. This allows anticipating the presence of hydrocarbon reserves.
Stratigraphy, or the study of rock layers and layering, is an important reference framework used in this work. Several types of stratigraphy are being used. Two are specifically important:
! Chrono-‐stratigraphy: based on the absolute age of a certain rock, and making it possible to reconstruct the geology for a certain moment in the past. Chrono-‐stratigraphy is standardized internationally.
! Litho-‐stratigraphy: based on the study of a given specific type of rock that may have been deposited during a period of time. Litho-‐stratigraphy may vary by sedimentary basin or even from field to field.
Both frameworks can be useful in different context, and sometimes it is required to be able to combine information obtained from data that is described in one or the other.
The data used in exploration at Statoil is primarily found in the historical corporate database, the Exploration & Production Data Store (EPDS). It may also be retrieved from databases that belong to ongoing exploration and development projects, the project databases. These are large and richly structured data stores. The typical work is that exploration experts like geologists, paleontologists, etc. have to extract tables, called snapshots from these large corporate databases, which are then post-‐processed and fed into visual analytics tools, primarily ArcGIS (by Esri).
Simple “standard” snapshots can easily be produced by the domain experts themselves using existing tool support. But in most cases however often – and this is the case covered by Optique – the help of an IT expert is required to extract snapshots containing more specialized information, process which is perceived as time consuming and not very efficient.
Optique will support the formulation and executive execution of queries over data from completed projects, stored in the Exploration & Production Data Store (EPDS), a single, richly structured relational database comprising thousands of tables and thousands of attributes, see below.
The aim is to include the data from running projects into the scope of queries. This data not yet integrated in to EPDS, but spread over several in-‐house “project databases.” These databases have a different, though related structure to EPDS, so query execution will exercise both Optique’s federation and data integration capabilities.

Optique Deliverable D11.2 Market Analysis
19
Including project databases in query execution may imply that up to 100TB of data must be processed within the scope of a single query. Data integration challenges, technological barriers of query federation, and the sheer volume of data make the use of project databases practically impossible with today’s existing tools.
4.2.2 The Siemens Use Case Siemens Energy Services is the leading service partner for an installed fleet of power plants representing approximately one-‐fifth of all large scale and industrial power plants worldwide. Siemens runs several service centers for power plants, each responsible for remote monitoring and diagnostics of many thousands of gas/stream turbines and associated components such as generator and compressors. Diagnosis engineers working at the service centers are informed about any problem detected on site and plan and initiate necessary maintenance activities.
A Siemens engineer access a variety of raw and processed data in order to isolate a problem and to plan appropriate maintenance activities. Fault analysis and maintenance planning is conducted using a variety of tools ranging from MS Excel spreadsheets to highly specialized in-‐house visualization, diagnosis and planning tools. These tools have to work on several TB of time-‐stamped sensor data and several GB of pre-‐processed “event” data (“alarm triggered at time T”). Sensor and event data may grow at 30GB per day (sensor data rate 1 Hz – 1 kHz). The required data is spread over hundreds of tables with identical, very simple structure for sensor readings and several tables with different, very complex structure for event data. Typical queries involve gathering information from a multitude of storage sites.
Currently, feeding data from the sensor and event database into the visualization and interpretation tools constitutes a complex manual process (illustrated in fig.1). If an error report is generated by a service center (dashed line), the diagnosis engineer issues a sequence of separate queries to different data sources in order to provide relevant data for visualization and diagnosis tools (called interpretation tools in Fig.1). Hereby, results of single queries are possibly combined using procedural programs. The processed query results are then supplied to the interpretation tools in order to access and visualize appliance data. For diagnosis situation not initially anticipated, new queries are required, and an IT expert familiar with both the power plant system and the data sources in question has to be involved in formulating the queries using an IDE (fig.1.), taking into account the rather complicated database schemata. Due to necessary low-‐level data encoding which is reflected in complex queries, the IT expert extensively tests and debugs the new queries before making them available in the service dashboard for diagnosis engineers. Thus, unforeseen situations may lead to significant delays of up to several hours or even days.
By utilizing the Optique platform Siemens Energy Services aims at improving the data access for its diagnostics engineers and thereby at more effective service operations. Effective service operations are fundamental in a market being driven primarily by an aging power plant fleet and the rising demand for increasing the efficiency of existing plants.
Optique Deliverable D11.2 Market Analysis
20
4.2.3 The DNV GL Use case (OREDA) OREDA is both a joint industry project and a database with reliability and maintenance data for exploration and production equipment from a wide variety of geographic areas, installations, equipment types and operating conditions. Both offshore subsea and topside and onshore equipment are included. A number of major international Oil & Gas enterprises are participating in the project. Data has been collected since 1983 and has resulted in a large database comprising data from 265 installations and 16.000 equipment units. Some of the data collected and stored are operating and environmental conditions, all failure events related to the equipment and all maintenance records containing data on corrective maintenance linked to the corresponding failure record, and data on preventive maintenance linked to the corresponding inventory record.
OREDA has been selected to be a test case for OPTIQUE and a first implementation is currently being prepared. The intention is to investigate both technical challenges and user experiences with using Optique. Future combined use of Optique and OREDA may include the possibility to combine information from several databases into queries that so far not has been easy to perform. For example by comparing the effect of environmental factors as weather condition over a period of time with the failure rate for a specific type of equipment, can give decision support and cost savings when planning procurement of expensive process equipment.
4.2.4 The DNV GL Use case (Condition Monitoring of Ships) Condition monitoring of machinery has a lot of similar challenges independent of branch. The challenges identified for monitoring of e.g. propulsion systems on ships in operation have a lot of similarities with the challenges described for the Siemens use case. Identical challenges have also been identified by Norwegian railroad (NSB) who has been invited to the Optique Partner Program.
The Compass project is a joint project between DNV GL, Rolls Royce and Farstad, and is sponsored by the Norwegian Research Council. The project is carried out to demonstrate the benefits of collecting machinery and operational data from ships in operation for local and remote processing. The data is transmitted to shore via satellite or manually for remote monitoring and assistance.
Diagnostics and prognostic methods can be developed that operates on the collected data or in real time. The prognosis for cost savings is considerable.

Optique Deliverable D11.2 Market Analysis
21
5 Barriers to Adoption In the context of this report, barriers to adoption signify any restriction for an organizational implementation and use of a technology and the consequent relative inability to prove its value during its lifetime.
Any barrier, perceived or real, to start using a solution will have impact on the perceived risk of engaging with the product and the expected value of the product for the company/organization in question.
We believe that barriers to adoption will vary the most according to companies’ maturity with regards to technology and IT. We have created a “High level Organizational Maturity model” for data integration/big data to address these aspects.
Organizational maturity is defined as a function of the following parameters, which are further described in Table 5.
! Business Model and Process Maturity ! IT Infrastructure Readiness ! Data Integration Readiness ! Data Governance Maturity ! People (Resources, Competence & Management)
The three identified sub-‐categories of enterprises/end-‐users in the Stakeholder analysis are based on the hypothesis that the incentives to adopt a solution like Optique are largely dependent on the maturity of the company. Organizations that are early adopters of technology will normally be found in all three categories of maturity, but will typically exhibit similar patterns such as being data driven and agile when it comes to moving in the market and assessing new technology.
The different sub-‐ categories of enterprises/end-‐users are described by typical traits and goals in the section below.
5.1 Organizational Maturity Model Organizational Maturity: Sophisticated
At this level, the organization perceives information quality and the ability to exchange information across systems without meticulous integrations as necessary for improved business performance. Initiatives are coordinated, but not necessarily strategic. IT departments are hard-‐pressed on providing queries to discipline experts. Top management committed to be data driven; creating structures, processes and incentives to support this. There is still room for improvement, but the organization strives to meet change and remain agile. Typical goals for a company at this level:
! Further value extraction from big data (using analytics on current data) ! Enabling data-‐driven performance improvements and innovation.
Optique Deliverable D11.2 Market Analysis
22
! Empowering end-‐users to create new knowledge. ! Faster access to distributed data, including streaming data sources. ! Lower dependency on scarce data scientists and IT experts
Organizational Maturity: Transitional Stage
At this level, the organizations business and IT leaders Management recognizes the need for information sharing between disciplines and has fragmented initiatives across some systems, and information slowly is becoming an asset rather than a liability (moving away from lack of trust in data or inability to find data). General IT governance guidelines and policies are formalized. The IT department has strong “traditional” experts that are overworked.
Typical goals for a company at this level: ! Address the ever increasing need of integrating disparate data sources, by moving query
capabilities from IT to end-‐users. ! Information sharing across business units, sites, etc., i.e. break information barriers between
silos. ! Master data management using ontologies (requiring less maintenance than traditional
methods) ! More flexible and open extension of IT infrastructure for BI and data governance. ! Automation in business processes ! Savings in time & money
Organizational Maturity: Undisciplined
At this level, the organization the organization is suffering from undermanaged information across the company. Information is usually fragmented and inconsistent across applications/disciplines. The same data may exist in multiple applications, and redundant data is often found in different sources, formats and records. There is no strategic initiative to exploit existing data, but there is some awareness that poor data quality & exploiting of data may inhibit business performance. Typical goals for a company at this level:
! Grow business by exploiting available data, e.g. combining different types of data to create meaningful information about customers.
! Transition to data-‐driven decision-‐making. ! Reduce risk stemming from data problems such as lost customers. ! Time and cost savings.
To conduct an assessment of a company’s maturity, we have listed typical differentiating characteristics for each parameter. A company will have these characteristics to a larger or lesser degree. The list must be further developed in the next iteration. In addition, the assessment on organizational maturity will be relevant for conducting company specific risk assessments as many risks usually are linked to a company’s maturity.

Optique Deliverable D11.2 Market Analysis
23
Parameters Typical characteristics assessed
Business Model and Process Maturity
Conservatism regarding Open source products
Misalignment of incentives to adopt new technology in the business processes
Level of data dependency in the Business Model
Organizational structure (e.g. departmental silos remain the biggest barrier to data sharing as this prevents cross company examination of data sets)
IT Infrastructure Readiness
Vendor lock-‐in in existing contracts
Access rights managed centrally or in the applications
Networks and bandwidth
Standardization across different sites & locations.
Disaster Recovery/ Fail-‐over/Backup strategies
Perceived complexity of the solution to be implemented
Data Integration Readiness Data quality in current systems
Level of commitment to required groundwork on ontologies/vocabularies
Level of understanding of business potential in integrating different sources (realizing that data integration is a critical component of their information infrastructure)
Level of preparation for comprehensive data capture and delivery, linked to metadata management and data governance support
Centralized terminology or Master data management initiatives

Optique Deliverable D11.2 Market Analysis
24
Data Governance Maturity
Enforcement of guidelines and policies for data use and access (life cycle perspective)
Management of Change processes
Level of data security management & resources committed to security
Adherence to standards (Open source standards)
Confidence towards new technology (e.g. implementing ontology maintenance regime)
People (Resources, Competence & Management)
Skills: A significant barrier to succeeding with big data will be building new skills and maintaining the right skills. (New skills can be: process knowledge, statistics, data visualization, data mining, machine learning, and database and computer programming. 3)
IT departments influence on Big Data strategy
End-‐user empowerment and understanding of information
Management understanding of data challenge – ability to view entire organization & data sources
Management commitment to the “long term” focus on ROI (sticking it out until one can reap benefits)
Plans and strategies for collecting and organizing data in a “value creation” context
Table 5: Parameters influencing level of barriers to adoptions
3 Gartner, Inc. | Hype cycle for big data , Aug. 2014 p 5

Optique Deliverable D11.2 Market Analysis
25
6 Risk Analysis It is suggested to postpone the risk analysis development to Task 11.2. The risk analysis will be a generic framework that enables a company to identify critical prerequisites for implementing and operating Optique, and how these potential deficiencies can be mitigated.
In this phase, the project will include experience from the partners using the Alpha package and hands-‐on familiarization with Optique. The future risk analysis can then be empirical and based on the partners own feedbacks and experience. Currently recruiting to the partner program is a major activity of WP11. Partners are expected to represent a multitude of enterprises which will give a good basis for risk analysis.
In addition, the organizational maturity model and the barriers to adoption will provide valuable input to a risk analysis framework and this experience may be gained through further investigation of the Optique partner program.
To be aligned with industry standards within risk management, a framework to conduct risk analysis according to ISO 31000 is suggested in Appendix 2.