Embed Size (px)
Citation preview

00o0
Analysis of HelicopterN Environmental Data:
Indianapolis DowntownHeliport, Wall Street HeliportVolume I Summary
Rosanne M. Weiss D T IcJohn G. Morrow (,(j _LECTEDonald GallagherMark DiMeo APRScott Erlichman
(f- : October 1988
DOT/FAA/CT-TN87/54, I
This document is available to the U.S. publicthrough the National Technical InformationService, Springfield, Virginia 22161.
DSTRI3UtMON STAITE MENT A-~Approved for public releo4m4 !-3
Distribution Unahmited
~US Department of Transportatio
Fedl~eral Aviation Administration
Technical Cent~rAtlantic City International Airport, N.J. 08405
f ............

NOTICE
This document is disseminated under the sponsorshipof the U.S. Department of Transportation in the interest ofinformation exchange. The United States Governmentassumes no liability for the contents or use thereof.
The United States Government does not endorseproducts or manufacturers. Trade or manufacturers'names appear herein solely because they are consideredessential to the objective of this report.

THochical Repgt Decunmwation Poge2. eport me. 2. Govomome Accession N. 3. Recapient's CeotIg No.
_DOT/FAA/CT-TN87/54, 1. Title and Subtitle S. Report OoiANALYSIS OF HELIPORT ENVIRONMENTAL DATA: October 1988INDIANAPOLIS DOWNTOWN HELIPORT, WALL STREET 6. Perfomingoo,.,i.odeHELIPORT, VOLUME I SUMMARY ACD-330
7. AwA.$,) Rosanne M. Weiss, John G. Morrow., . Pe ng Organiao Repot Me.
Donald Gallagher, Mark DiMeo, and Scott Erlichman DOT/FAA/CT-TN87/54, I9. P.$.n.ong Oriaetion Name end Address 10. Work Unit No. (TRAIS)Department of TransportationFederal Aviation Administration 11.'-----....Technical CenterAtlantic City International Airport, NJ 08405 13. Ty .p.u nd Pejrd Co.ved
12. Spefseuing Ageucy NH God AddressDepartment of Transportation Technical NoteFederal Aviation Administration May 1988Rotorcraft Technology, ADS-220 I.4A- fVI00Washington, DC 20590 n
Is. Suplemenary Notes
16 Abstract
uring the summer of 1987 heliport environmental data were collected at theIndianapolis Downtown Heliport and at New York's Wall Street Heliport. Thepurpose of this data collection activity was to obtain measures of rotorwashin the heliport environment due to maneuvering helicopters, and to obtainpilot perceptions and observations concerning maneuvering and parkingseparation criteria. Ten wind vector transmitters were situated at variouslocations around the heliport in order to gather information to describe thefotorwash induced wind speed and direction changes. Pilot interviews werealso conducted at these heliports.,
Volume I of this report documents the results of this activity. It describesthe data collection and analysis methodology and addresses technical as wellas operational issues. It provides graphical descriptions of the heliportenvironment and of wind speed changes due to rotorwash from maneuveringhelicopters, along with analysis of pilot responses.
Volumes II and III provide the plots generated from the New York andIndianapolis Heliport data.
The results of this study will be considered in future modifications of theFederal Aviation Administration (FAA) Heliport Design Advisory Circular (AC)
150/5390-2. (SLO j--- -17. Key Words II. Oistribution Ste0le o.
Heliport Tip Clearance This document is available to theRotorcraft U.S. public through the NationalRotorwash Technical Information Service,Heliport Design Advisory Circular Springfield, Virginia 22161.
19 scr~yClse# (f20. ipot We *iess . (of tii aPegol 21. No. of Pae. 22. Pric.Penn DOT " ""00."Unclassified Uclassifieud 56
F o r m D O T F 1 7 0 0 .7 ( 8- 7 2 ) R e p o d c t i o n of c o m p l e f r P o go o u , i z e J
TABLE OF CONTENTS
Page
EXECUTIVE SUMMARY vii
INTRODUCTION 1
Purpose 1Objectives 1Background i
METHODS 2
Data Collection 2Rotorcraft Types and Pilot Experience 3
DATA PROCESSING AND ANALYSIS 4
Rotorcraft Groupings 4Graphical and Tabular Analysis ( 4
RESULTS 7
Wind Sensor Data 7Pilot Interviews 9Observations 10
CONCLUS IONS 12
APPENDIX
Accesion For
DTIC rAR []Unanno:,,rced ]
ByD:],ti,,Lt,"- I i...............
A: '> : .,,, ,/ ,
iii

LIST OF ILLUSTRATIONS
Figure Page
1 Sensor Placement at Indianapolis 13
2 Sensor Placement at New York 14
3 Sample Questionnaire Used 15
4 Sample Wind Direction Plots (2 sheets) 16
5 Histograms of Wind Observations for the Wall Street Heliport
Approaches (2 sheets) 18
6 Histograms of Wind Velocity Changes for the Wall Street
Heliport Approaches (2 sheets) 20
7 Histograms of Wind Observations for the Wall Street Heliport
Departures (2 sheets) 22
8 Histograms of Wind Velocity Changes for the Wall Street
Heliport Departures (2 sheets) 24
9 Histograms of Wind Direction Changes for the Wall Street
Heliport Approaches (2 sheets) 26
10 Histograms of Wind Direction Changes for the Wall Street
Heliport Departures (2 sheets) 28
11 Histograms of Wind Observations for the Indianapolis Downtown
Heliport Approaches (3 sheets) 30
12 Histograms of Wind Velocity Changes for the IndianapolisDowntown Heliport Approaches (3 sheets) 33
13 Histograms of Wind Observations for the Indianapolis DowntownHeliport Departures (3 sheets) 36
14 Histograms of Wind Velocity Changes for the IndianapolisDowntown Heliport Departures (3 sheets) 39
15 Histograms of Wind Direction Changes for the IndianapolisDowntown Heliport Approaches (3 sheets) 42
16 Histograms of Wind Direction Changes for the IndianapolisDowntown Heliport Departures (3 sheets) 45
17 Plots of Pilot Responses: Comfortable ManeuveringDistances Objects 48
18 Plots of Pilot Responses: Comfortable ManeuveringDistances - Aircraft 49
V

LIST OF TABLES
Table Page
I Type Rotorcraft Aircraft and Number of Operations 5
2 Pilot Experience 6
3 Observed Aircraft by Gross Weight 7
4 Sensor Locations in Feet from the Center of theCorresponding Coverage Area 7
5 Number of Pilots Interviewed by Aircraft Weight Classes 10
6 Comfortable Maneuvering Distances to Object by Weight Class 11
7 Comfortable Maneuvering Distances to Other Aircraft byWeight Class 11
vi

EXECUTIVE SUMMARY
During the summer of 1987 heliport environmental data were collected at theIndianapolis Downtown Heliport and at New York's Wall Street Heliport. Thepurpose of this data collection activity was to obtain unobtrusive measures ofrotorwash in the heliport environment due to maneuvering helicopters, and toobtain pilot perceptions and observations concerning maneuvering and parkingseparation criteria. The two measures of heliport environment recorded were windspeed and wind direction.
Ten wind vector transmitters were placed strategically around both heliports;four around the takeoff/landing area, four adjacent to the taxiway, and two neara parking location. The data collection activities at both Indianapolis and NewYork were conducted only during daylight hours under visual meteorologicalconditions. Observations of such information as visibility, surface windconditions, type rotorcraft in operation, type maneuver being recorded, estimatedhover heights, path of the aircraft, and times of sensor activation were notedfor each operation recorded. Pilot interviews concerning maneuvering and parkingseparation were also conducted.
This report documents the results of this activity. The heliport environment,pilot perceptions, expert observations, and data collection, evaluation andanalysis techniques are described. Data plots of wind speed and direction areincluded for each operation at both heliports. Pilot responses are discussed.
It was determined that, for the types of helicopters observed, high windvelocities due to helicopter rotorwash occur a very small percentage of the timeduring operations at a heliport. The wind velocity distributions are similar forthe parking, taxiway, and takeoff/landing area data.
Pilot interviews indicated that approximately one-third of the pilots werecomfortable with the criteria spelled out in the Heliport Design AdvisoryCircular (AC) 15/5390-2. Other issues concerning tip clearances under differentwind conditions, hovering heights, and light conditions were raised and need tobe studied further.
vii

INTRODUCTION
PURPOSE.
The Federal Aviation Administration (FAA) Technical Center Heliport Parking,Taxiing, and Landing Area Criteria Testing was designed to provide data tovalidate the Heliport Design Advisory Circular (AC) 150/5390-2 current parking
and taxi route separation criteria. This report reviews data collected at
several public use heliports.
OBJECTIVES.
The following objectives were addressed by this portion of the tests:
1. To obtain unobtrusive operational measures of the heliport environment in
terms oL wind speed and direction changes due to rotorwash from maneuvering
helicopters.
2. To obtain pilot input concerning heliport surface maneuvering and parking
separation criteria, and to determine, via observation, the type of operationsbeing conducted at the public use heliports.
BACKGROUND.
The focus of this portion of the test was on the issue of "measurements ofmaneuvering helicopter rotorwash in the heliport environment." The current FAAHeliport Design Advisory Circular states in relation to parking: "Parking may be
accomplished on a paved or unpaved apron, a helipad, or a helideck... . Exceptfor helipads and helidecks located in the Final Approach and Takeoff Area (FATO)or takeoff and landing area, the parking area shall be located such that parkedhelicopters are clear of the approach and departure surfaces and have at least
1/3 rotor diameter but not less than 10 foot (3 m) clearance from a takeoff andlanding area or a fixed or movable object."
In relation to the taxi route: "A cleared right-of-way for taxiing shall beprovided between a takeoff and landing area and a parking area... The taxi
route width shall be at least the larger of:
1. twice the rotor diameter of the largest helicopter which is expected to hovertaxi, or
2. one and one-half rotor diameters of the largest helicopter which is expected
to ground taxi, plus 14 feet (4m).
The centerline-to-centerline separation distance (between taxi routes) shall be
at least the larger of:
1. one and one-half rotor diameters of the largest helicopter which is expected
to hover taxi, or
2. one and one-quarter rotor diameters of the largest helicopter which isexpected to ground taxi, plus 7 feet (2m).

When a hard surface taxiway is provided, it shall be centered within a taxi routeand shall be at least twice the width of the undercarriage of the designhelicopter."
This criteria was based on experience, tempered with engineering judgement.There is little actual environmental or flight data to validate it. It may ormay not reflect the clearances actually needed or desired for surface operationsby rotorcraft pilots. The issue of rotorwash impact on helicopter control and
stability and its effect on required or desired separation criteria had not beenpreviously addressed.
The data collected during this study was designed to measure rotorwash effects onthe surface of operational heliports and obtain pilot perceptions of adequateseparation for taxiing and parking operations at heliports. Expert observationsof hover taxi heights and lateral deviations during each operation, as well asparking separation and environmental obstructions, were recorded.
METHODS
DATA COLLECTION.
LOCATIONS. The environmental data were collected at two operational heliports,the Indianapolis Downtown Heliport and New York's Wall Street Heliport. TheIndianapolis data were collected over a 7-day period in August 1987 during thePan American Games. The New York data collection trip took place over a 3-dayperiod in September 1987, immediately following the opening of the Wall StreetHeliport.
PROCEDURES. Ten Belfort Instrument Company 5-122 HD wind vector transmitterswere used to collect wind data during rotorcraft maneuvers at these twoheliports. These transmitters consist of two major elements: an upper sectioncontaining a wind speed generator attached to an airplane rudder shaped vane, anda fixed, vertical support and connector housing. The wind speed signal generatoris housed in a weatherproof housing and is driven by a six-bladed propeller. Thetransmitter senses both wind speed and direction. It converts these measurementsinto two direct current (dc) voltages, one of which is proportional to both windspeed and the sine of the wind angle, and the other which is proportional to windspeed and the cosine of the wind angle. This information is output on acontinuous basis. The only limitations are the speed of the computer used torecord the data and the inertia of the propellor. The sensors were connected toan interface system which, in turn, provided input data to a Zenith personalcomputer (PC). The data collection rate was 0.667 hertz (Hz). The PC wasprogrammed to read sine and cosine sensor values, sensor number, and time in asequential chronologically ordered manner.
At both heliports, the ten wind vector transmitters were place strategicallyaround the heliport. All sensors were positioned approximately 20 inches abovethe ground. Four sensors were placed around the landing/takeoff area. Foursensors were placed adjacent to the taxiway and two were placed n -r a parkinglocation. At Indianapolis the two at the parking location we-? placed near oneof the two hot refueling locations, while at New York they were actually placedone on each side of a parking spot on the parking barge. Sensor locations for
2

each heliport are depicted in figures 1 and 2. Appendix A contains photos of thesensors at each heliport.
The data collection system was operational during daylight hours only at bothlocations. The weather was visual flight rules (VFR) with clear skies for theentire Indianapolis trip and for 3 of the 4 days in New York. On the fourth dayat New York the weather was marginal VFR with rain and reduced visibility.
Measurements were taken of the distances between parking locations as well as ofthe distance each sensor was from its corresponding coverage area. See figures1 and 2 for the actual locations. Aerial as well as ground photos were taken ofthe equipment and the heliport facilities.
PILOT INTERVIEWS. Between the two heliports, 50 pilots were interviewed.Questions were posed concerning their opinions about the minimal rotor tipclearances distances they feel comfortable with when hovering near obstacles andwhen maneuvering adjacent to parked helicopters. These issues were explored inreference to separation criteria as influenced by rotor downwash. Pilot commentsabout the heliport environment were also logged. Figure 3 is an example of thequestionnaire used.
OBSERVATIONS. The observers were responsible for recording the followinginformation for each heliport operation:
Visibility and windsType rotorcraftType maneuver, ground or hover taxi, approach or departureHover heightPath of helicopter during the maneuverTimes each sensor was activated
The observers activated the data collection system before the helicopter beganmaneuvering and stopped the system after the helicopter either left the area orshut down. Static data were collected prior to the maneuver and for 1 to3 minutes following the maneuver.
When the helicopter passed near each sensor the observer marked the time on aheliport map along with hover height and observed path of the helicopter. Actualor estimated wind conditions and visibility were also logged. At Indianapolisthe rotorcraft type was recorded and its gross weight was determined throughpilot input; while in New York only the rotorcraft type was entered. Grossweight was estimated by the observer since, in many cases, the aircraft arrived,discharged cargo or passengers, and departed without shutting down.
ROTORCRAFT TYPES AND PILOT EXPERIENCE.
On the average there were almost 100 operations per day at the New York facility,while at Indianapolis there were approximately 16 per day. The test period atIndianapolis was during the Pan Am Games, thus, the number of operations per daywas greater than normal. The higher volume of traffic at the New York Heliportwas considered a normal everyday condition. Often the landing, taxiing, andparking areas were simultaneously in use at the New York facility, with seven ormore rotorcraft parked on the barge and two rotorcraft at minimum collective
3

pitch at the loading/unloading area. Simultaneous operations were only observedon occasion at Indianapolis.
Data were collected for various rotorcraft at both facilities under a variety ofoperating conditions. At Indianapolis 114 operations were observed, while288 operations were observed at New York. Of those operations at Indianapolis,data were collected for nine different rotorcraft types. At New York tendifferent types were observed.
See table 1 for a breakdown of rotorcraft operations by type. Although theIndianapolis Heliport is ideally designed for wheeled landing gear helicopters,the majority of the helicopters observed using this facility were skid gearaircraft. The opposite is true at New York. The New York facility is ideallydesigned for skid type rotorcraft, but the majority of those observed werewheeled gear configured.
The majority of the pilots interviewed at both heliports had more than 3000 hoursof flight time (see table 2). This indicates that most of the pilot input camefrom experienced pilots. This was particularly true for those pilots interviewedin New York where all could be considered high time pilots.
DATA PROCESSING AND ANALYSIS
ROTORCRAFT GROUPINGS.
The helicopters observed at these locations were grouped into three classes byweight. Table 3 presents the breakdown of those rotorcraft observed into thethree weight classes.
GRAPHICAL AND TABULAR ANALYSIS.
All plotting done for this project was accomplished using a California Computer'sCalcomp model 1051 drum plotter with FORTRAN software for the DEC's VAX 11/750computer. The individual plots generated were divided into two types: winddirection with speed and wind direction with order of collection.
The wind direction and speed plots show vectors representing wind direction witha numerical value printed at the end of each vector indicating wind speed inknots. The second type plot shows the ',ind direction line with the numericalvalue indicating the order of data collection. Examples of these plots are foundin the results section.
Plots of pilot responses in reference to comfortable maneuvering distances fromobjects as well as from aircraft were also produced using the Calcomp plotter.Histograms were produced on a PC using LOTUS 1-2-3 software. One set ofhistograms shows the percentage of actual observed windspeeds at each 5-knotinterval for each approach and departure by helicopter weight class, and for eachof three heliport surface locations: landing/takeoff, taxiway, and parkingareas. A second set shows percentage of observed wind speed changes by 5-knotintervals. The percentages of wind direction changes by 100 intervals for eachsurface location were also plotted.
4

TABLE 1. TYPE ROTORCRAFT AND NUMBER OF OPERATIONS
Aircraft Type Indianapolis New York
Aerospatiale Astar 17 42
Aerospatiale Twin Dauphin 0 2
Aerospatiale Twin Star 8 10
Agusta A109 0 9
Bell 222B 0 38
Bell 222UT 0 14
Bell Jet Ranger 12 58
Bell Long Ranger 15 49
Bell UH-I 29 0
Boelkow 105 2 14
Boelkow 117 10 0
Hughes/McDonnell Douglas 500 16 0
Robinson R22HP 5 0
Sikorsky S-76 0 52
Total 114 288
Note: 7 days of data collection at Indianapolis, 3 daysat New York.
a m I II I I5

TABLE 2. PILOT EXPERIENCE
Indianapolis Downtown Heliport
Total Flight Time (hrs) Number of Pilots
0-500 2
501-1500 31501-3000 2
> 3000 21
New York - Wall Street
Total Flight Time (hrs) Number of Pilots
0-500 0501-1500 0
1501-3000 3> 3000 19

TABLE 3. OBSERVED ROTORCRAFT CLASSIFIED BY GROSS WEIGHT
<3000 lbs 3000-7000 lbs >7000 lbs
Hughes 500 Astar Bell 222BRobinson R22HP Augusta 109 Bell UT222
Boelkow 105 Boelkow 117Jet Ranger S-76
Long Ranger UH-l
Twin StarTwin Dauphin
RESULTS
WIND SENSOR DATA.
All wind sensor data collected during the aircraft operations were corrected toaccount for sensor bias based on 00 and 0 knots calibration. Volume II of thisreport contains all Wall Street Heliport wind sensor plots. Appendixes A to Fcontains the plots showing wind direction with order of collection, whileappendixes G to L contain plots with wind direction and wind speed. Volume IIIcontains similar plots for the Indianapolis Downtown Heliport data. Samples ofthese plots can be found in figure 4.
With exception of the takeoff/landing area sensors, the placement of the senso'sat the Indianapolis Downtown Heliport were approximately one-half the distancefrom the center of their coverage areas than the corresponding sensors at theWall Street Heliport. These sensor distances for all three areas at both theWall Street Heliport and Indianapolis Downtown Heliport are presented intable 4.
TABLE 4. SENSOR LOCATIONS IN FEET FROM THE CENTER OF THECORRESPONDING COVERAGE AREA
Wall Street Indianapolis
Heliport (ft) Downtown Heliport (ft)
Takeoff/Landing Area 50 48-50Taxiway Area 34-39 14-16Parking Area 30 15
For this data collection activity, an operational period is defined as the timeperiod from just prior to the aircraft's initiating a maneuver to the time whenthe aircraft either shut down or left the area.
Aircraft operating at the Wall Street Heliport during the data collection
activity were representative of only two of the three weight classes. Figure 5presents the histograms of observed wind speeds during operational periods for
7

the three different sensor locations. Results are essentially identical for allthree areas. The duration of an average approach operation for the 3000-7000pound helicopters was 53 seconds. For the weight classes 3000-7000 pounds andgreater than 7000 pounds, at least 65 percent of the approaches at Wall Streetgenerated less than 10 knots of wind at all three surface locations where thesensors were positioned. For the 3000-7000 pound aircraft, high wind conditions(greater than 20 knots) were generated less than 10 percent of the time over allthe approach operational periods. The average high wind conditions lasted lessthan 2 seconds per approach. With aircraft greater than 7000 pounds, theproportion of high wind conditions during these periods were larger, but stillless than 25 percent of the time. For this class an average approach operationlasted 78 seconds, with the high wind conditions being observed a maximum of7 seconds per approach period at the takeoff/landing area. However, it isunknown how long the aircraft was positioned in each area during any givenapproach. There is little difference in the distributions of recorded windspeeds for both classes of aircraft at all three surface locations.
Another measure of the effect of rotorwash is the changes in wind speeds whichwere observed during the operational periods. These changes were generated bycomparing each wind speed measurement to the previous measurement. For extremelyshort time periods (less than 1 second per operation for both classes ofhelicopter) wind speed changes exceeded 20 knots during the operation. For the3000-7000 pound class, 90 percent of the time changes in wind speed were 5 knotsor less at all three locations, while at least 85 percent of the time changeswere 5 knots or less for the 7000+ pound class aircraft. The distributions ofvelocity changes for the Wall Street Heliport approaches are plotted in figure 6.
Compared to the approaches, the departures show similar percentages of high windoccurrences (>20 knots) during operational periods for the taxiway area, andsmaller proportion of higher wind conditions for the takeoff/landing and parkingareas for the 3000-7000 pound class. The percentages at all three locations forthe 7000+ pound weight class departures were lower than for the approaches,particularly for the taxiway and takeoff areas. Figure 7 presents the histogramsfor actual wind speeds during departure operations at Wall Street. However,compared to the approaches the average duration of a departure operation was from20 to 40 seconds longer; 73 seconds for the 3000-7000 helicopters, and117 seconds for the 7000+ pound helicopters. These high wind conditions wereobserved for less than 3 seconds during each 3000-7000 pound aircraft departureand for less than 6 seconds per 7000+ departure period. As with the approaches,it is not known how long the helicopter stayed at each location during thedeparture.
The distribution of the wind speed changes during operational periods fordepartures are similar to the distributions for the approaches. Thesedistributions are plotted in figure 8.
Since loss of lift is a function of wind direction changes, changes in winddirection were also examined as a measure of rotorwash effect. As with the speedchanges, these changes were calculated by comparing each measurement of directionwith the previous measurement.
For the 3000-7000 pound helicopter approaches, a 300 or greater shift in winddirection was observed the largest percentage of the time (23 percent) at the
8

takeoff area. The parking and taxiway areas and all three areas for the7000+ pound helicopters had occurrences of 30 or greater shifts less than12 percent of the time.
For departures, the larger shifts (equal to or greater than 300) occurred no morethan 16 percent of the time at all three locations for both classes of aircraft.The plots in figures 9 and 10 show the distributions of wind direction shifts.
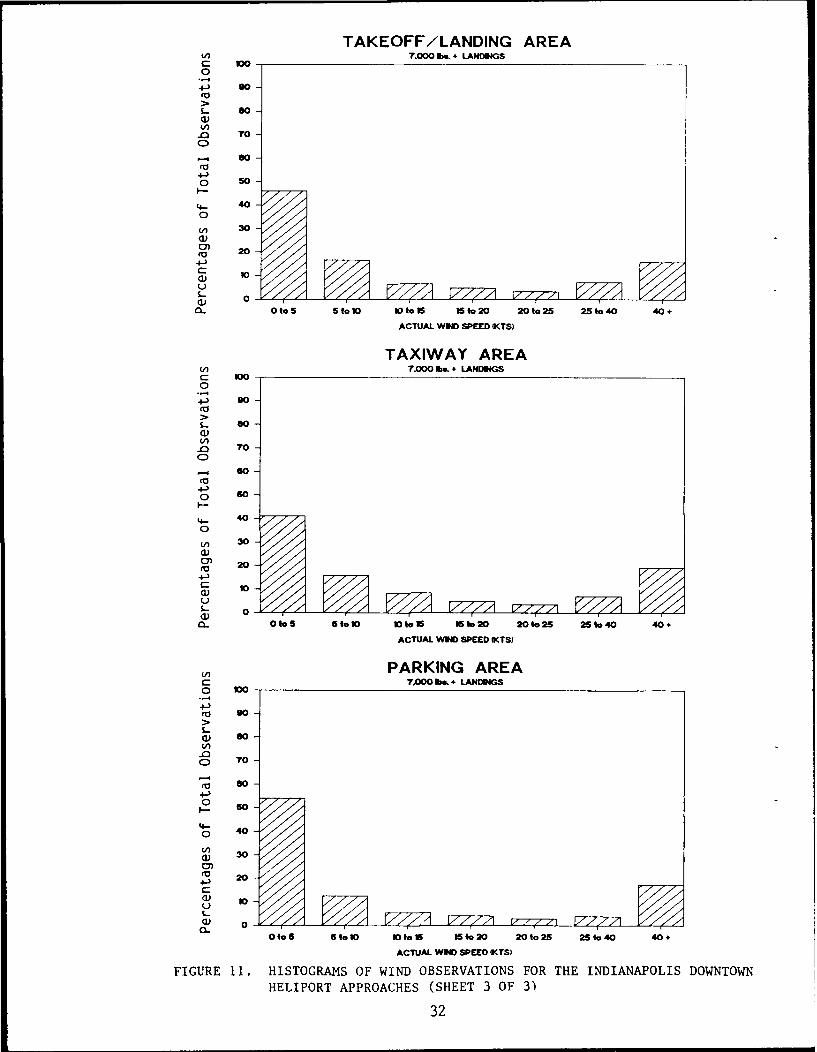
Indianapolis wind speed data for landing operations showed greater occurrences ofthe high wind conditions (>20 knots) at all three locations. Data plots for twoof the three classes of aircraft (<3000 pound and 3000-7000 pound) show similarwind speed distribution results for approach operations at each of the threesensor locations. An average approach for the less than 3000 pound class lasted54 seconds, while for the 3000-7000 pound class it lasted 52 seconds. Duringthese operations at Indianapolis at least 70 percent of the operations generatedspeeds less than 20 knots. The average approach for the 7000+ pound aircraft was65 seconds. For this class of aircraft a larger proportion of wind speedsgreater than 20 knots were observed. Distributions of wind speed changes atIndianapolis were more variable than at the Wall Street Heliport with a largerproportion greater than 20 knots. These distributions are plotted in figures11 and 12.
The larger occurrences of higher wind speeds at the Indianapolis DowntownHeliport, when compared to the Wall Street Heliport, particularly for the parkingand taxiway areas, are due to the sensor locations. At the Wall Street Heliportthe sensors placed around the taxiway and parking areas were approximately twicethe distance from the centerline than at Indianapolis. Also, hover heights atIndianapolis were generally higher than those at New York. Thus, the higherpower requirements at Indianapolis resulted in a larger proportion of higher windspeeds being recorded.
The Indianapolis Downtown Heliport departure data, plotted in figure 13, showsimilar distributions of high winds for all three locations. As with theapproach data, the distributions for wind speed changes are comparable. Theaverage departure for aircraft in the less than 3000 pound class lasted33 seconds. Greater than 70 percent of the wind speed changes were from 0 to10 knots. The average duration for the 3000-7000 pound and 7000+ poundhelicopter departures was 49 to 51 seconds, with at least 60 percent of the windchanges from 0 to 10 knots. The wind speed changes are plotted in figure 14.
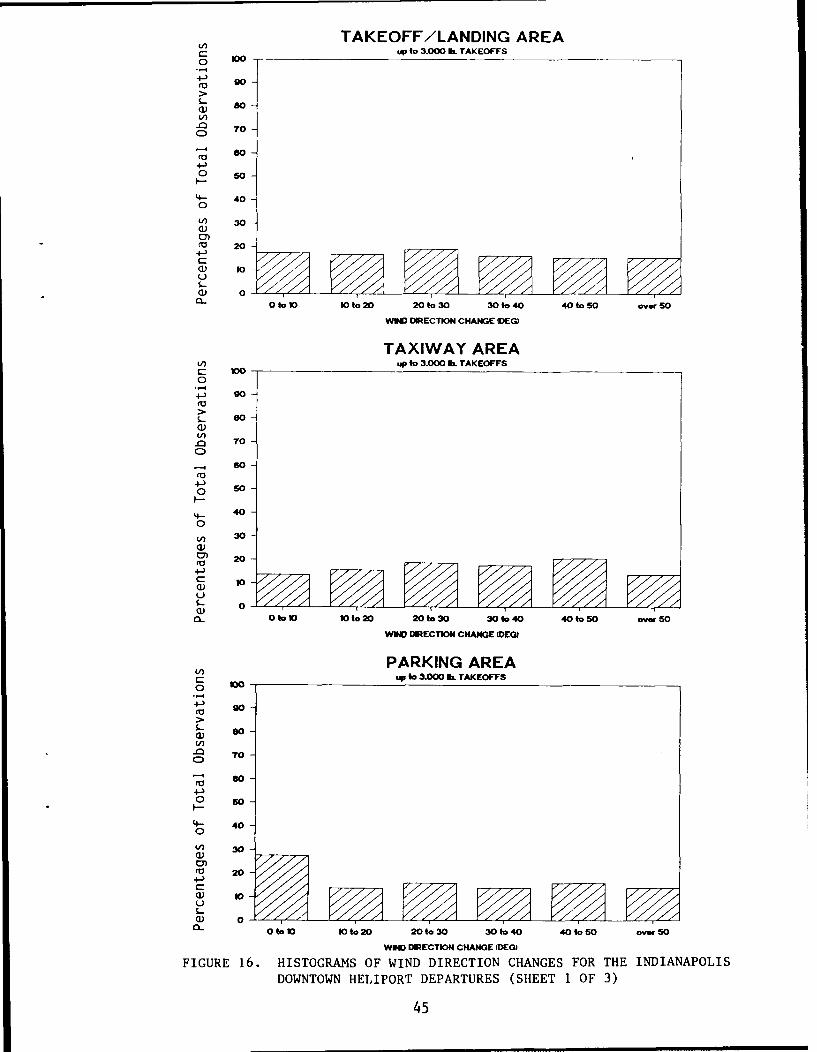
Large shifts in direction (300 or more) were seen more frequently duringapproaches at the Indianapolis Downtown Heliport for all three classes ofhelicopter at all three locations. At least 43 percent of the wind shifts were300 or more. Figure 15 shows the plots of these shifts for the Indianapolisapproaches. For Indianapolis departures these large shifts in direction occurreda similar percentage of the time as the approaches, at least 44 percent of thetime. These shifts are plotted in figure 16.
PILOT INTERVIEWS.
Twenty-eight pilots from Indianapolis and 22 from New York's Wall Street wereasked for their opinions regarding their perception of safe maneuvering distancesbetween objects and other aircraft. Responses concerned rotorwash effect when
9

referenced to maneuvering near aircraft with main rotor blades unsecure. Table 5
shows the breakdown of the number of pilots interviewed by helicopter size.
TABLE 5. NUMBER OF PILOTS INTERVIEWED BY WEIGHT CLASS
Helicopters Helicopters Helicopters<3000 lbs 3000-7000 lbs >7000 lbs
4 24 22
In reference to their perceived comfort levels maneuvering near objeets, pilotsof helicopters in the <3000 pound category responded with distances ranging from
20 to 40 feet. For those flying helicopters in the 3000-7000 pound category thedistances varied from 4 to 100 feet. The >7000 pound helicopter pilot responsesranged from 5 to 80 feet. These responses are listed by weight class in table 6.Figure 17 graphically presents these data with respect to rotor diameter. Forthe aircraft being flown, approximately 70 percent of the pilots responding tothe question about tip clearances from an object expressed preferences for lessthan or equal to 1 rotor diameter.
When asked their perceptions about maneuvering distances from other aircraft, thepilots flying the less than 3000 pound gross weight helicopters answered withdistances varying from 20 to 40 feet. Pilots flying helicopters in the3000-7000 pound weight class gave figures from 8 to 100 feet, while those in the>7000 pound category responded with distances from 4 to 150 feet. Table 7 liststhese pilot responses by weight class. Figure 18 depicts these responses inreference to rotor diameter. The percentage of responses for this question are
similar to the previous one. Seventy-two percent of those responding statedcomfort levels less than or equal to 1 rotor diameter.
In general, pilots felt the distance from objects depended on the stability ofthe object and the pilot's familiarity with the area as well as the winds
conditions. Other pilots based their blade tip clearances on the distancesrecommended in their respective aircraft operators manual.
Many additional comments were received addressing concerns specific to either theIndianapolis or New York Wall Street Heliports.
OBSERVATIONS.
Observations were made at both heliports indicating that, although both areoperating with or using procedures that are not specifically addressed in FederalAviation Regulation (FAR) Part 77, the rotorcraft are being safely maneuvered inand out of these facilities. At Indianapolis, curved approaches/departures wereroutinely performed. Also, at Indianapolis the taxiway is noticeably higher thanthe surrounding terrain, which is very uneven. This irregular, uneven terrain
appears to influence hover height depth perception during hover taxiing, leadingto a large variability in hover heights. Yet, safe maneuvers are continuallybeing conducted.
At Wall Street there was no real controllable approach/departure surface. Thenavigable channel runs close to the end of the pier. Therefore, it was not
10

TABLE 6. CUM#UKTAIL9 W tIMIU bts±A. k9 TO otJt
SY Vfto~t CLAss
tAigo see kigure ii)
Ibittttk 300 b 30.Q.Q000 ibs, >7000 .b
f0-19 feet 3 1
20-29 feet ii30-19 feet i
4d-40 feet 250-100 feet 5 4
1 rotor radii 3 31 rotor diameter 1 1 21.5 rotor diameter 2
TABLE 7. COMFORTABLE MANEUVERING DISTANCES TO OTHER
AIRCRAFT BY WEIGHT CLASS
(Also see figure 18)
Distance <3000 lbs 3000-7000 lbs >7000 lbs
3-9 feet 1 310-19 feet 5 6
20-29 feet 1 2 230-39 feet 1
40-49 feet50-100 feet 2 3 2>100 feet 2
O.1-0. totor 31
2 rotor diameter 2
11

uncommon to observe water vessels ranging from tugboats and yachts to militaryvessels and oil tankers maneuvering at varying distances off the end of the pier.Some of these vessels certainly penetrate the existing Part 77 approach/departuresurfaces of the heliport. These penetrations were caused by both the antennasmounted on some of the craft and the superstructures of others. However, NewYork pilots did not perceive this as a problem.
CONCLUSIONS
From the pilot questionnaire data the following can be said:
1. Although the subject pilots were generally high time pilots (greater than3000 hours), only 30 to 36 percent reported that they were comfortable with thehelicopter/object and helicopter/helicopter separations recommended in theFederal Aviation Administration (FAA) Heliport Design Advisory Circular (AC)150/5390-2 (0.33 rotor diameters but not less than 10 feet).
2. No differences were observed in the distributions of wind velocity for thethree locations: parking, taxiway, and takeoff/landing areas.
3. Wind velocities greater than 20 knots occurred for at most 7 seconds peroperation at Wall Street and 12 seconds at Indianapolis. These durationscorrespond to a maximum of 25 percent of a total operation period at Wall Street;and at most, 34 percent at Indianapolis. The significance of these windvelocities in relation to other aircraft, however, is dependent upon the weightclass and type of aircraft operating in the vicinity.
4. The pilot interviews and observations raised a number of other issues thatneed to be considered. These specific issues were:
a. What rotor tip clearances do pilots recommend when maneuvering/parkinghelicopters under head, tail, and crosswind conditions; and how do theserecommended tip clearances compare to actual performance under these conditions?
b. What rotor tip clearances do pilots recommend when maneuveringhelicopters near both secured and unsecured aircraft and objects; and how dothese recommendations compare to actual performance?
c. At what hover heights are pilots comfortable during taxiing operations?
d. What type surface markings do pilots prefer for safe parking andmaneuvering operations?
Tests and pilot interviews to examine items 4a, 4c, and 4d were subsequentlyconducted and the results will be contained in the Heliport Maneuvering Testsreport, DOT/FAA/CT-TN88/30. Item 4b still needs to be investigated.
12

C-))
< a
CJl
_:r 0
<c<CD C,
LUC)
00.
w 04
M -i Cl C
CDQ-LX< -4=U
k1

-o
00
$44
00
0)/
ccj
00
wz
_j 04zz
C
1.14

LOCATION: DATE:
WIND CONDITIONS: VISIBILITY:
TYPE AIRCRAFT: GROSS WEIGHT:
KIND OF OPERATION:
GROUND TAXI
HOVER TAXI
LANDING
TAKEOFF
PARKING
HOVER IN
GROUND TAXI IN
TOW IN
HOVER HEIGHT: LATERAL PLACEMENT:
ABLE TO TALK TO PILOT7 : YES NO
IF YES:
PILOT FLIGHT TIME:
MINIMAL DISTANCE PILOT WOULD FEEL COMFORTABLE HOVERING/TAXIING
NEAR OBJECTS?
NEAR OTHER AIRCRAFT?
COMMENTS:
FIGURE 3. SAMPLE QUESTIONNAIRE USED
15

C4-)
C. Q 0
A-
-A
No w
o to 0
or ") H
000
CL.0U CXj
0 M
g. U H
,~" C0 ~rr
LU.M: U. CL _ _
cr 0
40 _
00 LU- 0i f< /
- ~ ~- ~16

CL->Luc
LO~ q
Qw /
00
4-0LU4
0:14 eN
(I)
*.0 .
a Sc- 0
(3~Li 0 Dz~
0% w w 0-4cDL w- -- :3
x- z
Lii4
z CL
V atUC, * 4,,;S c~n I0
17

TAKEOFF/LANDING AREALn 3.000 to 7.000 LB. AIRCRAFT LANDINGSr- too-0
4-) gorO
s.- so70-a)
so.0 70
1-
0
c-nO 20
4-)
0--a),
C. OTOS 5to10 00 to 1 15 to 20 20to25 25to40 40+
ACTUAL W4O SPEED KTS)
VTAXIWAY AREAc 3.000 to 7.000 LB. AIRCRAFT LANIGS0 goo-
CO 90
4)
.0
O 70
COSO J/
4- )/ 50
4-0 40
S 30
20t--
n 0 VA V 1 U77; ,0.0
OTOS 5to10 tos 151o20 20 to 25 251o40 40+
ACTUAL WIND SPEED CKTS)
PARKING AREALn 3.000 to 7.000 LB. AIRCRAFT LANDMOS- 000
,,... 690 9
a)
.0 70
0 5O
4- 400
) 30
20
s- 00. OTO 5 5t100 toIs 1to20 20to25 25to40 40
ACTUAL WNO SPEED )KTS)
FIGURE 5. HISTOGRAMS OF WIND OBSERVATIONS FOR THE WALL STREET HELIPORT
APPROACHES (SHEET I OF 2)
18

TAKEOFF/LANDING7.000 lbs. + LANDINGS
o 00 -- _ _ _ _ _ _ _ _
4-)(0 go0
(1) so0V)-0c: 71)
4-)so
o 40 '
307
20 -'
CL 0 -z
01o5 o1 10101O ist t5o 20 20to 25 25 to 40 40+
ACTUAL WIND SPEED
V) TAXIWAY AREAc 7.000 lbs. + LANDNGS
ru 90
so .
-0c) 70
4-)0 50
F-
40
30 -"
20 7
0~Oto5 5to 10 to I I 15to 20 20to 25 25 to 40 40+
ACTUAL WIND SPEED
PARKING AREACA 7,000 lb& + LANDINS
0
4 90
S..- s0a1)
- s0ra
o 50F-
4- 400
V) 30
(0 20 7Z, ~ 7
.. Oto 5 Sto 1O 1 to 15 15 to 20 201o25 25 to 40 40*
ACTUAL WIND SPEED
FIGURE 9. HIISTOGRAMS OF WIND OBSERVATIONS FOR THE WALL STREET HELIPORTAPPROACHES (SHEET 2 OF 2)
19

TAKEOFF/LANDING AREAV) 3.000 to 7.000 b. LANDINGSc" 100-0
.40s 9
L.. 80 -
.0 70
soo
4- 40
0
) 30
CO 20
0) to
0CL OTOS 5110 10115 151o20 201o25 25140 40+
WIND SPEED CHANGE IKTS)
TAXIWAY AREACA 3.000 to 7.000 bL LANDINGS0 100
CO . 9090
- 80 80(1)CA.0 70//I
o so ///0
4- 40 /
00 40
20
0)
a- OTO5 51to10 10 to 115 IS 1*20 20 to 25 25 to 40 40+
WIND SPEED CHA1NGE XKTS)
PARKING AREA
0) 2
c:3.000 to T.000 11L LANDINGS
-4-) 90 10
ro
a)
-0 70-//
0= so ///
0
30//
a=) 0 //
0. 0TO5 56to10 10 to15 156to20 20 to 25 25 to40 40+
WIND SPEED CHANGE lKTS)
C) 3000to7.0 h LNDG
a 10//
FIGURE 6. HISTOGRAMS OF WIND VELOCITY CHIANCES FOR THE WALL STREET HELIPORT
APPROACHES (SHEET 1 OF 2)
20

TAKEOFF/LANDING AREAV) ".000+ IL LANDMNS
o 100
4-)
90 '7
70 ,"
70
o so4-)
07
4- 40 40
30 Xx,
cn
(1) 10"s-
0Oto 5 tol 10 1001 15to 20 201*25 251o40 40 +
WIND SPEED CHANGE (KTS)
Ln TAXIWAY AREAc ~7.000+ Va. LANDINGS
4-)(a 90
soc: 70
so 7
so -4--
0 40
(Aa) 30
2-- 20-7c
01 1s.-
0L0Oto 5teo 0 toefi 15to 20 20 to25 25 to 40 40+
WMD SPEED CHANGE (KTS)
(A PARKING AREAc 7.000. AL LANDINGSo 100-
ca 90 I
a) so0
o: 70
0I- 050
(4-o 40 -
a) 30
.a 20
u 10
a.-
0105 51010 10 to 15 ISto20 209.25 25to40 40 +
WIND SPEED CHANGE (KTS)
FIGURE 6. HISTOGRAMS OF WIND VELOCITY CHANGES FOR THE WALL STREET HELIPORTAPPROACHES (SHEET 2 OF 2)
21

TAKEOFF/LANDING AREAV)3.000 to 7.000 &. TAKEOFFS
'0
90-s- 80
- 400
) 30
(a 204-3
0) 10
a) 0 , ,a- os 5to10 10to15 15 1 20 201025 25140 40+
ACTUAL WIN SPEED KTS)
TAXIWAY AREA3.000 to 7.000 Iba. TAKEOFFS
0... no
90
> eos..(1)V) 70-0
so
40
(4-0
30V)
4-)0) 20Co
c 10
s-
Oto5 500 1001.5 151020 20to25 251040 40+
ACTUAL WM SPEED (KTS)
PARKING AREAV) 3.000 to 7.000 . TAKEOFFSc 1000CO0) 90
s- 80
LI).0 70
0 54 SO
04 40
V 30a)cn20
DEPRTREACHETUA SPEE 2)T
22

TAKEOFF/LANDING AREAV) T.000 On..+ TAKEOFFS
c 100 -0
4 -) 90
so
4-).0 50
0
3 0
ct t
40
20so
C: 10
a
0U) 30-
00+-~9
a) 70u
s-
01 0
0 to
ACUA WH-PE
to
(a
70
00
4-)c: 20
(1 10 Oto
Wo -
0 o5 5to 10 1toe 15 to 20 201o25 25 1e40 40.
ACTUAL WHO SPEED
FICLTRE 7. HISTOGRAMS OF WIND OBSERVATIONS FOR THE WALL STREET HELIPORTDEPARTURES (SHEET 2 OF 2)
23

TAKEOFF/LANDING AREA- 4U- 3.000 to 7.0 . TAKEOFFS0 s0
-
c) so4,)
-o-
o 70
so-
~0I- 60
o 40
() 30
4-3 20
u0)s-0- 0 [-771 .-- 1-.--
01o5 5to10 101*16 115o20 201o25 25o 40 40+
WIND SPEED CHANGE KTS)
TAXIWAY AREAV) 3.000 to 7.000 lb. TAKEOFFSc 100-04-) 90(a
> so-
S 70-
so-ca
4- 40 /
30V)()0) 20 A(a.4-)
s-. 0
(V 20/ 2I4
a_0 to5 5 to10 10115 15 1.20 2,2 25.0 40+
WIND SPE CHANGE OCT51
PARKING AREAc ~3.001.00 toOM TAKEOFFS
0 100-
(a 90
W 0
co 70 /
0-) 50 /
to /
4-) 30a)
u(0
s-0
0106 61.to10 1015 161.20 201to25 251.o40 40+
WO SPEED CHANGE /T5,
FIGURE 8. HISTOGRAMS OF WIND VELOCITY CHANGES FOR.THE WALL STREET HELIPORTDEPARTURES (SHEET 1 OF 2)
24

TAKEOFF/LANDING AREAC 7.000+ b. TAKEOFFS
0 1004-7J
6- 0 77
7-04-'
60
4- 400
V) 30
M~ 20 "
Q) 10 z-
a) 0 V'--f--0*05 5 toO to 0to15 FS to20 20to 25 25to 40 40.
WIND SPEED CHANGE (KTS)
TAXIWAY AREAU) 7.000. b. TAKEOFFS
c 1000
90 9ca
s- so0a)
~O 70
F-7
34 0 -
(a 207
to 50s-
0
00 20 5- o1 oo 6c0 0 5 2 o4 0
4-0-04-) 90OUo>.- _ _ _ _ _ _ _ _ _ _ __ _ _ _ _ _ _ _ _ _ _ _ _
70
4- 90(0
3- 0
00
(0)
o 20

TAKEOFF/LANDING AREAo ~ -3000 to7.000 &. LAND0INGS
4-)to 90o
-0oo 70
0F- so-
4-0 40-
30 30
S20-v/
u 1
CL 0
3.000 t .00 IL LANDINGS
- 100(0
90-
0-0 30-
CD)
soo DETo HNESa
0 so
4-- 40-(0
cn 3
200
- 10-
00
0
so-
0 041 0.2 000 30.0 44.0 auS
W1-IRCIN HNE DG
FIUR 9. HITGASO-IDDRCINCAGSFRTEWL TETHLPR
2026

TAKEOFF/LANDING AREAo o 1 '.000+ ft LANDINGS
4J)
> 90
(3)so so
70
so) S0
so00
40-(AU1)
S 20
to
0-z0 to10 l0l.20 20 to30 30 to40 401.60 ovmSO0
WIND DECTMO CHANGE ONG)
TAXIWAY AREACl)c 7.000+ 11L LANDINS
0e
so-
(a so04-)
'4- 40-0
10-
0) 100
TO-
o o 10-
0O 9so
--
(A~
w) 30cnIV
4J 20
CL 0
04010 109.o20 20 to30 31,0 401060 ovw 80
WIM MECTO CHANGE DEW
FIGURE 9. HISTOGRAMS OF WIND DIRECTION CHANGES FOR THE WALL STREET HELIPORTAPPROACHES (SHEET 2 OF 2)
27

U, TAKEOFF/LANDING AREAO eo.3.000 to T.000 ML TKOFS
800
o: 70-
01-- 504- O0 40-
30 30
S 20-
o 10
0 to 10 10 to20 201to30 30Io40 0I 0 vr5
WID DIRECTION CHANGE (DEG)
TAXIWAY AREA3.000 to7.000 EL TAK(EOFFS
Sgo
.O
.0 o s70
4-
o0 -
10
CL 0 01010 10120 20 to30 040 40 t' 5 evm 0
U, 3A00 to 7.000 & TAK(EOFFS= 100-
0
4-3i go
.0 70-
to4.-
4- 40-0Ln 30U)
0,I 20m
0..to1go0 10o20 20 to30 301.o40 401.o50 avuW
WID DECTION CHANGE MDEG)
FIGURE 10. HISTOGRAMS OF WIND DIRECTION CHANGES FOR THE WALL STREET HELIPORTDEPARTURES (SHEET 1 OF 2)
28

TAKEOFF/LANDING AREA7.000+ b. TAKEOFFS
00
7 0-c:)
so-
0
30-
004- 30a
a) 10
a) 0=2Z0tto 10 to20 201,o 30 t.40 40 to50 oeso
WID DIECTION CHANGE (DEG
TAXIWAY AREACd) 7.000. IL TAKEOFFSa 100 -0
4' 90-
s.- so(3)Cd)
.0 70
CO
20-P
00
02
a:)I
4- ol
4-a 40- 0.0 112 0.0 314 0.0 ouS
0
a)
a)0
s- 60o~z 7-77(1)CL0t4o-0t 0 2 1o 0 3 0 0 5 ~ 6oIN DIETO HNEOC
(U 20

TAKEOFF/LANDING AREAU)up to 3.000 On. LANDINGS
-4
S90
60-
,.0
o: 70-
4-40 50 .
4-" 40 //70 //// Z
(A 30 /
20 -
0 0 /G ) a- ,i
0~Oto5 5to 10 to a 16 o20 20125 254o40 40+
ACTUAL WIND SPEED KTS)
TAXIWAY AREA' uLip to 3.000 Ie. LANDINGSO 90
4-ca go
cu so-
O 70so-,
cC 64-
o 40
U30 D
O- IO
4)
is-
70
ACUA YN PEDOS
o 4o
90-
00
30
a:)
20
-) 10 -
0--a3) IO.//"
0to5 6to10 1015 S 51020 20 to 2S 25 to 40 40+
ACTUAL WID SPEED (KTS)FIGURE 11. HISTOGRAMS OF WIND OBSERVATIONS FOR THE INDIANAPOLIS DOWNTOWN
HELIPORT APPROACHES (SHEET 1 OF 3)
30

TAKEOFF/LANDING AREA3.000 to 7.000 Ibe LANDINGS0 100
.- 44-J
go
sU o
r- 70c:)
so-I-
4- 400
30 /
( a 20 -
a) to
a) 0-0t to5 51010 104to.5 151o20 201o25 251040 40+
ACTUAL WIND SPEED 0TS)
LTAXIWAY AREAc. 3.000 to 7.000 be LANDINGS
(0 90
S-
o) 70
c( 6O
0I- 50-
4-o 40 .
V) 30 z0 30 ,
0to5 5to10 o0115 15 o o 20 20 to 25 25 to 40 40+
ACTUAL WIND SPEED (KTS)
PARKING AREA3.000 to 7.000 b& LANDINGS
0 00-
.0
ra 90-
o 70C) TO
M so
4-o 40
03
(. 20
20
o 0 /za//
01.5 5 to 0 10to15 1510o20 201.25 2510o40 40+
ACTUAL WIN SPEED (KTS)
FIGURE 11. HISTOGRAMS OF WIND OBSERVATIONS FOR THE INDIANAPOLIS DOWNTOWNHELIPORT APPROACHES (SHEET 2 OF 3)
31
TAKEOFF/LANDING AREA7.000 ba. + LANDINGS
a I000
4-) 90so-i
C)
.0 70
0 50F-
4- 400
Ln 3043)
20
to ///
a) 0
0. 0.o5 5to010 10105 15to2O 20to25 251o40 40+
ACTUAL WIND SPEED (KTS)
TAXIWAY AREAV)7,000 Ibi. . LANDINGSc I000
*-'- 90'U
s_ so
a)i-s 70
- Go-CU
0 s0
4- 400m 30
0) 20-to
4-)c
L- 00.. 01o5 5to10 10115 154o20 20025 251o,40 40+
ACTUAL WIND SPEED OKTS)
PARKING AREA7.000 lb.. LANDIGS
0 100
CUl 90
.g
o) 70
So860
0_ so ///
4- 40-
) 30
20
1) 10
01os 51010 10t11 154120 20to25 25 to 40 40+
ACTUAL WIND SPEED (KTS)
FIGURE 11. HISTOGRAMS OF WIND OBSERVATIONS FOR THE INDIANAPOLIS DOWNTOWNHELIPORT APPROACHES (SHEET 3 OF 3)
32

TAKEOFF/LANDING AREAV) up to 3.000 Ib. LANDINGSc o 0-0
go
ra
(A)-0 70
0 s
4- 400 vz
200
L)20 2
c to
00
()
)
00
ra
(A 3
20 70
10
- 0
0 oo
o o 5s-
4.. 40
00
(a 20
a1) 10 -Us.-
0-0. 0o 5 5 to10 1016 15 to20 209to25 259to40 40+
WIND SPEED CHANGE (KTS)
HEIPR PARKINGHE AREA 1OF3C up~~~~a 300h ADG

TAKEOFF/LANDING AREAC 3.000 to 7.000 lb. LANDINGSo 100-
eO 90
() S0
-s
o 70
rO60
4-)
4 40
30
(a 20
C 10
0~Oto5 5to10 10 o 15 15to20 20to25 25to40 40+
WIND SPEED CHANGE (KTS)
TAXIWAY AREA(1) 3.000 to 7.000 2 LANDINGSc 100-0
+- 90-CD
s.- soa)
').0 70C
- 60 "
o so 0F-
40300
Qi)
0') 20
r- 10 ta
a)us-0
°V 0-0.L 0to 5 540o10 10 to 1 156to20 20 to 25 2540o40 40+
WIND SPEED CHANGE KTS)
PARKING AREA(A) 3.0004t7.0AM hL LANDINGSc 100-0
4-) 90
- SO-/ /so ///
a)Li).0 70 -C
0 o 50F-
4- 40 -0
L ) 30
(ta 20-
a) 10 ,us.-
a) 004o5 5to10 10o1 15t020 20to25 25to40 40+
WIND SPEED CHANGE CKTS)
FIGURE 12. HISTOGRAMS OF WIND VELOCITY CHANGES FOR THE INDIANAPOLIS DOWNTOWNHELIPORT APPROACHES (SHEET 2 OF 3)
34

TAKEOFF/LANDING AREAV')c- 7,000+ b. LANDINGS
4-J90
80V)
.0 70C)
4-)o 5O
F-
4- 400
30
(0 20
(1) 10uS.-a) 0-zz- Oto5 5 to 10 10 to 15 15 to 20 201 o25 25 t o40 40+
WIND SPEED CHANGE (TSI
TAXIWAY AREAu) 7.000+ b. LANDINGSc 1000
4-J 90(0
S.. 80
V).0 70
-4 60
O 50
c:)14 - 3 o
20
CO
C 2O
4- 40
0.
a- 0 to 5 5 to 10 101o15 15 to 20 20 to 25 25 to 40 40+
WIND SPEED CHANGE KTS
PARKING AREAU) 7.000. b. LANDINGSc 100-0
4-) go
s- s0a:)
-0 70
0
4- 20o 50 /
10//
0
n 30 3
10 20 / /
0.. 0taS 5 5tao 101.o15 15 to 20 201.o2S 251.o40 40 +
WIND SPEED CHANE KTSI
FIGURE 12. HISTOGRAMS OF WIND VELOCITY CHANGES FOR THE INDIANAPOLIS DOWNTOWNHELIPORT APPROACHES (SHEET 3 OF 3)
35

TAKEOFF/LANDING AREAup to 3.000 b& TAKEOFFSC-
_0_05a0
£,- g104-) 90O
0 Go-0
TO
Bo-
0 so'-
4- 400
(/2 30
CO 204--
10
. O1o5 51010 01s 151o20 20to25 25 to 40 40
ACTUAL WWD SPEED IKTS)
TAXIWAY AREA(-.- up to 3.000 ba. TAKEOFFS
0 go
go-<3) soC)
o so
FI-
4- 40 /0
V 30 ,
0 20 /
c(1) 10u
oi) 0 , Z 20to5 51010 101 5 16 to 20 201025 25 to 40 40+
ACTUAL WND SPEED CKTS)
VPARKING AREAa up to 3.000 bi. TAKEOFFS0 100
4e->
co 90
c() TO /
70
0 6so
00
Co 204-.)c(1) toS.-
0-0-'5 51.10 101.5 15to20 20t025 251.40
ACTUAL WD SPEED OCTS)
FIGURE 13. HISTOGRAMS OF WIND OBSERVATIONS FOR THE INDIANAPOLIS DOWNTOWN
HELIPORT DEPARTURES (SHEET 1 OF 3)
36

TAKEOFF/LANDING AREA3.000 to 7.000 b. TAKEOFFSc' 100o
0CO-4-) go -
L s8- 80
Q)
.M 70
(0o o
o 50I-
4- 400
V) 30
CO 20
U) 10
(1) 0 ,,
0_ Otos 5to10 I to15 15 to 20 201o25 25 to 40 40+
ACTUAL WND SPEED (KTS)
TAXIWAY AREA1/) 3.000 to 7.000 la. TAKEOFFSc 100-0
9Ora
s- 80a)Ul.0 70
0
,- 60O
0 50F-
4 - 400
30
20
0)
3O 20 /
a-. Ota5 5to 10 101.5 t16to20 201*25 25 to 40 40+
ACTUAL WIND SPEED 0(TS)
PARKING AREAC ) 3.000 to 7.000 b&. TAKEOFFS
a10-//
0
4-) 90 CO
- 60U) sQ"o-U)
.0 70
O4-,
0 so ,I-I
4- 400
U) 30
CO 20
U) 10 / I
s- 0 Fol5 5 to 0 1105 151o20 20io25 25 to 40 40,
ACTUAL WIND SPEED (KTS)
FIGURE 13. HISTOGRAMS OF WIND OBSERVATIONS FOR THE INDIANAPOLIS DOWNTOWN
HELIPORT DEPARTURES (SHEET 2 OF 3)
37

TAKEOFF/LANDINGV) 7.000 &+ TAKEOFFS
a 100 -0
S- so
c:)
0 0
0 so
4- 40
(j) 30
~20
00
0..02. 51.20 10 to5 15 to20 201o25 251to40 40+
ACTUAL WIND SPEED (KTS)
TAXIWAY AREA7.000 biL + TAKEOFFS
CO
so-
70-
Co
oo -4-3
4-- 40-0
30 -3
Co 20
a 0
0105 5 to10 solos 151o20 201to25 261.o40 40+
ACTUAL WIND SPEED CKTS)
PARKING AREA7.000. b. TAKEOFFSc 1W0-
0
4 go-
so-a)0 70-
Co-
4-)
4- 400
30 -3
Co 020
a) 10 -
a) 0-01.6 5 t.20 ot0. 151.20 204.25 251.o40 40.
ACTUAL W*1 SPEED (KTS)
FIGURE 13. HISTOGRAMS OF WIND OBSERVATIONS FOR THE INDIANAPOLIS DOWNTOWN
HELIPORT DEPARTURES (SHEET 3 OF 3)
38

TAKEOFF/LANDING AREALn o ups to 3.000 lk TAKEOFFS
0
s- so-
0J 7
c:)
0)
20 20
K) 1Ua) 0
CLotos Sto 1 10 to 15 to 20 20 to 25 25 to 4 0 40+
wPiN SPEED CHANGE (KTS)
TAXI WAY AREALn ~up to 3.000 IL TAY EOVVS
C 100-
4-) 90(V
s- 80 -a)(A
.0 70
4-1 8
o 50-
4- 400
S 30
(a 20c
t0-0-00.5 stelO 10 15 15 to20 20 to 2S 25 t.40 40+
WIND SPEED CHANGE (KTS)
PARKING AREAusp to 3.000 RL TAKEOFFS
0 100
'V0 *
.0
4 000
3020-
0-
00Z
0-0105 5 to 10 100to.5 060to20 200.25 2S5to40 40+
WIND SPEED CHANGE (KTS)FIGURE 14. HISTOGRAMS OF WIND VELOCITY CHANGES FOR THE INDIANAPOLIS DOWNTOWN
HELIPORT DEPARTURES (SHEET 1 OF 3)
39

TAKEOFF/LANDING AREAC 3.000 to 7.000 6. TAKEOFFS
ca 90-
-o-
o: 70-
so-6
0
o 40-
30 300a4- 20r-a)o) 10
CL 0-01.5 5 to10 ID to 5 15 to20 201to25 25 to40 40+
WIND SPEED CHANGE CKTS)
TAXI WAY AREA3.000 to 7.000 IL TAKEOFFS
VD0
90-
> 60-S.-4a)
.0400
4- 50
0030
0) 2 0ct t
C 0
a)otas 5 f.10 0t15 15 to20 20 t.25 2S5t.40 40+0-
WIND SPEED CHANGE (KTS)
U, PARKING AREA3.000 to 7.000 11L TAKEOFFS
o 1o0-
.4-3to 90-
so-
o 70-
ca so
4- 40-
a1) 300)
20
040

TAKEOFF/LANDING AREAc)- 7.000+ b. TAKEOFFS
€o go
90
so s0a 70
- so-o 50
0'- 400
V 30
(a 20
)- 10
(1) 0, ,L 0os 5 to10 101o0 15 to20 20to25 25t040 40+
WIND SPEED CHANGE IKTS)
TAXIWAY AREAc 7.000+ lb. TAKEOFFS0 100
4-s
c) 70
so-.0 9
o 70
4-
0 - 4 0 - / / '(A
4 0
0--
C
Otos 5to10 10 05 151o20 20to25 251o40 40+
WIND SPEED CHANGE (KTS)
PARKING AREAV)c- 7.000+ b. TAKEOFFS0 100
90
5- 60U)
"o 70
(060
4-)O 5I--
4- 400
V) 30
4-)0,0rO 20
+-)S,-
a_ Oo5a 5to10 10 to 15 to 20 20to25 25*o40 40+
WIND SPEED CHANGE (KTS)
FIGURE 14. HISTOGRAMS OF WIND VELOCITY CHANGES FOR THE INDIANAPOLIS
DOWNTOWN HELIPORT DEPARTURES (SHEET 3 OF 3)
41

TAKEOFF/LANDING AREAr- up to 3.000 l. LANDINGSo 100-
( 90
-
o 70
20 so 30 3 .4 0 o6 vt6
90S 804
so _
4-0 40-
) 30-
4-) 20C=
u 10
s-0 xu
0to10 101*20 20to30 30 to 40 401o50 ovw 50
WIND DIRECTION CHANGE (DEG)
TAXIWAY AREAc- up to 3.000 A. LANDINGS
0 to
(a 90
(0 so
0 70so -5
4-)
0
P- 60'-
S 40
00) 30
u
cl- 0-
011 1100 to2D 20 to 30 30o40 40 to 50 ovw 50
WIND DIRECTION CHANGE (DEG)
PARKING AREAFIGUREup to 3.000 It LANDINGS
.,--2
too80
Q1)V/)
5000
.F-4- 40
0V) 30-
CL 0Oto 10 10 to20 20to,30 30to 40 40 to 50 over O
WIND DIRECTION CHANGE (DEG-)
FIGURE 15. HISTOGRAMS OF WIND DIRECTION CHANGES FOR THE INDIANAPOLIS
DOWNTOWN HELIPORT APPROACHES (SHEET 1 OF 3)
42

TAKEOFF/LANDING AREAcA) 3.000 to 7.000 A. LANDINGS(-- 100
0
4-) 90
5- so0
-O 70o
o 50
4- 40
30
V) 0 ,0..00101 0 to 20 201to30 301to40 401050 over 50
WIND DIRECTION CHANGE (DEG)
TAXIWAY AREA(n 3.000 tO 7.000 lb. LANDINGS
(a 200
(0t0
Id-
3.00 70700ILLNIG
0- 80-
(0-
(1)~50
0 40
U0 20
30 -
SOtolO 101o20 20130 30 to 40 40 to 50 overSO
WIND DIRECTION CHANGE (DEG)
PARKING AREA3.000 to 7.000 I. LANDINGS
c1 1010-
0-4-)(a> sos.-
S 70
.-40
so
50 50
F-
40
4- 400
30
U(0
4-)
- 0 ,
0 totO 10 to20 20 to 30 30 to 40 40.50 ovw 50
WIND DIRECTION CHANGE (DEG)
FIGURE 15. HISTOGRAMS OF WIND DIRECTION CHANGES FOR THE INr)IANAPOLISDOWNTOWN HELIPORT APPROACHES (SHEET 2 OF 3)
43

TAKEOFF/LANDING AREA0 7.000+ Ib LANDINGS
•, 100-
ID 7o90
S.-
(0 60
4J
70
F- 50
0 3020
110
o 0
0OtoO 10 10o 20 20to 30 30to 40 40to 50 over 50
WIND DIRECTION CHANGE (IDIEG
TAXIWAY AREA
(
U) 30~) b.LNIG
C o
L 8
..0 70
4- 0
4- 40
0
V) 30
S20
" 00o10 10t20 20t30 30t40 40o50 over50
WIND DIRECTION CHANGE (DEG)
PARKING AREA() 7.000. h. LANDINGSc 100-0
4-) 90o
o 'so
040 30
W 30
U)
(0 20
001010 10to20 204030 30 to 40 40lo50 ovw 50
WIND DIRECTION CHANGE (DEG)
FIGURE 15. HISTOGRAMS OF WIND DIRECTION CHANGES FOR THE INDIANAPOLISDOWNTOWN HELIPORT APPROACHES (SHEET 3 OF 3)
44
(A700 .LNIG
TAKEOFF/LANDING AREAV) up to 3.000 Ib. TAKEOFFS
90 90
S 80
"0 70
oo 60I-.-
4- 400
m 30
t 20
a) 10
(3) 0-, 0 o10 10 to20 20 to 30 301o40 40o50 over 50
WIND DIRECTION CHANGE (DEG)
TAXIWAY AREA(A up to 3.000 Ih. TAKEOFFS0
.4-) 90so
. 80
U).0 70
Bo
0 40
0. 4 00
S 30
U20
Oto O 10to20 20to30 30Io40 40 to 50 over 50WIND DIRECTION CHANGE (DEG)
PARKING AREA0')up to 3.000 IL TAKEOFFS
0 OOso-qSO
V)0 70-(A
so 504-0 SO
4- 400
S 30
10'o 20
us-ma) 0
0 to 10 0 to20 201o30 30 to 40 401o50 over 5 0
WIND DIRECTION CHANGE (DEG)
FIGURE 16. HISTOGRAMS OF WIND DIRECTION CHANGES FOR THE INDIANAPOLIS
DOWNTOWN HELIPORT DEPARTURES (SHEET 1 OF 3)
45

TAKEOFF/LANDING AREA3.000 to 7.000 lb. TAKEOFFS
90
s.- 8
70
so
50 -
40
00
(1) 10T
CL04to 101to20 204.30 30 to40 404.50 ovur50
WIND DIRECTION CHANGE (DEG
TAXIWAY AREALn 3.000 to 7.000 II. TAKEOFFSc __ _ _ __ _ _ _ __ _ _ __ _ _ _ __ _ _ __ _ _ _0
4 90-
(0 7
c:)
.0 70
4 40 40.0-~5CA 3
30 091 -o0 20.0 314
s- 10
(1)
3J00 70T00 AKOF0
(0
oo 60
00
a:)
(0 20
V) 30O
20 ) 10-
a) 0C.. 01.o10 I~tlaD 204to30 301c,40 40 to50 over 50
WIND DIRECTION CHANGE ODG
FIGURE 16. HISTOGRAMS OF WIND DIRECTION CHANGES FOR THE INDIANAPOLIS
DOWNTOWN HELIPORT DEPARTURES (SHEET 2 OF 3)
46

TAKEOFF/LANDING AREA(A 7.000+ IIL TAKEOFFSc: 100
90' 9
s.- so0
c:)
- 60
o so0
4- 400
() 30(3)
S 20--
Q) 50
cl 0to 10 10 to20 20 to 30 30 to40 40to 50 over 50
WINO DIRECTION CHANGE fOEG)
TAXIWAY AREA(A
7.000+ b. TAKEOFFS
o- go -
so-'
70
4o-'
0 50
4- 400
30
20
0) tou
) o-0Oto 10 10to 20 20to 30 30 to 40 40 to 50 ovw 50
WIND DIECTION CHANGE (DEG
(A PARKING AREAo 0 7.000+ b. TAKEOfFS
> 905-
soc) 70
0
40
0)20 -
s-) 1CL- 0
0tto 10 1a20 201030 30 to 40 40Oc50 over 50
weND DECTION CHANGE VEO)
FIGURE 16. HISTOGRA14S OF WIND DIRECTION CHANGES FOR THE INDIANAPOLISDOWNTOWN HELIPORI DEPARTURES (SHEET 3 OF 3)
47

COMFORTABLE MANEUVERINGDAAPOESDBDISTANCES ATLANTIC CITY AIRPORT
NJ. 08405
ABOVE 2I ROTOR DIAMETER-502 692 ON OR BELOW
0 Ii 2
02
0 1/2 ROTOR DIAMETERry 52% ON OR BELOW
-LL
1/3 ROTOR DIAMETER36% ON OR BELOW
0.
1 2
5 10b 20 25 b 35 4b 45 5b ABOVE
ROTOR DIAMETER:(FT.)13000-7000 lb
<3000 lb Aircraft I icat 1 >7000 lb Aircraft
FIGURE 17. PLOTS OF PILOT RESPONSES: COMFORTABLE MANEUVERINGDISTANCES - OBJECTS
48

COMFORTABLE MANEUVERING FATA PROCESS A CENTER
DISTANCES ATLANTIC CITY AIRPORTNJ. 08405
ABOVE 1 ROTOR DIAMETER50 2% 2 2XON OR BELOW
o 2U,
U,
I-
U-
<0
1/2 ROTOR DIAMETER0 51Z ON OR BELOW
LL-2
1/3 ROTOR DIAMETER30% ON OR BELOW
10 15 20 25 b 3t 40 45 50 ABOVEl 50
ROTOR DIAMETER; (FT.) s
I, P.13000-7000 lb
<3000 lb Aircraft >700 lb Aircraft
FIGURE 18. PLOTS OF PILOT RESPONSES: COMFORTABLE MANEUVERING
DISTANCES - AIRCRAFT
49

APPENDIX A
PHOTOS

LIST OF ILLUSTRATIONS
Figure Page
A-I Close Up of a Belfort Instrument Company S-122 HD WindVector Transmitter A-I
A-2 Locations of 5 of the 10 Sensors Used at IndianapolisDowntown Heliport August 1987 A-2
A-3 Locations of 4 of the 10 Sensors Used at New York's WallStreet Heliport September 1987 A-3
U.S. GOVERNMENT PRINTING OFFICE: 1989 - 604-065/80213
A-i

No
L-0
A-1!

0-4
C
E-
cc
'-4
A-2
.. . ..... ... .. H

I
S.; 4$j
I
in
4t 0
ft zH
0)LJCl) NZ (0
C>in
00in 1.4
Cl) ~JHo o~
-14C-n
-. 4Cl) FL
OH'-.4(l)H
ai~.) ,.-l
--4 FL
a
C,-)
--C:
-I.2.4II -U)I; H
0