Embed Size (px)
Citation preview

Ocean Inverse ProblemD. Stammer

August 16, 2004 1
Outline:
1. Review
2. Level of no (known) motion and box inversion
3. Mapping/objective analysis
4. Simple Least Squares
5. Filtering
6. Smoothing and constraining ocean models

August 16, 2004 2
1 History
Modern European knowledge of the ocean began with voyages of discovery by Bartholomew
Dias (1487-1488), Christopher Columbus (1492-1494), Vasco da Gama (1497-1499), Ferdi-
nand Magellan (1519-1522), and many others. They laid the foundation for global trade
routes stretching from Spain to the Philippines in the early 16th century. The routes were
based on a good working knowledge of trade-winds, the westerlies, and western boundary
currents in the Atlantic and Pacific (Couper, 1983: 192-193).
The early European explorers were soon followed by scientific voyages of discovery led
by (among many others) James Cook (1728-1779) on the Endeavour, Resolution, and Ad-
venture, Charles Darwin (1809-1882) on the Beagle, Sir James Clark Ross and Sir John
Ross who surveyed the Arctic and Antarctic regions from the Victory, the Isabella, and
the Erebus, and Edward Forbes (1815-1854) who studied the vertical distribution of life
in the oceans. Others collected oceanic observations and produced useful charts, including
Edmond Halley who charted the trade-winds and monsoons and Benjamin Franklin who
charted the Gulf Stream.

August 16, 2004 3
The ocean is not well known. What we know is based on data collected from only a
little more than a century of oceanographic expeditions supplemented with satellite data
collected since 1978.
Slow ships of the 19th and 20th centuries gave way to satellites toward the end of the
20th century. Satellites now observe the oceans, air, and land. Their data, when fed into
numerical models allows the study of Earth as a system. For the first time, we can study
how biological, chemical, and physical systems interact to influence our environment.
August 16, 2004 4
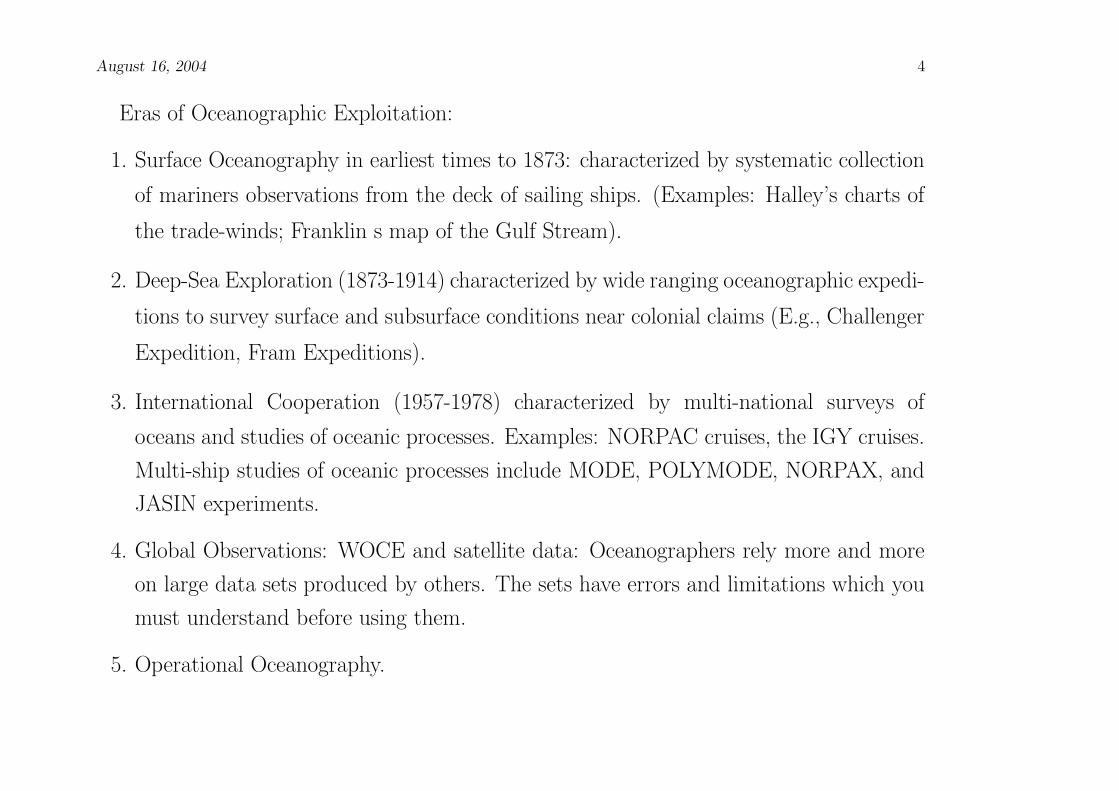
Eras of Oceanographic Exploitation:
1. Surface Oceanography in earliest times to 1873: characterized by systematic collection
of mariners observations from the deck of sailing ships. (Examples: Halley’s charts of
the trade-winds; Franklin s map of the Gulf Stream).
2. Deep-Sea Exploration (1873-1914) characterized by wide ranging oceanographic expedi-
tions to survey surface and subsurface conditions near colonial claims (E.g., Challenger
Expedition, Fram Expeditions).
3. International Cooperation (1957-1978) characterized by multi-national surveys of
oceans and studies of oceanic processes. Examples: NORPAC cruises, the IGY cruises.
Multi-ship studies of oceanic processes include MODE, POLYMODE, NORPAX, and
JASIN experiments.
4. Global Observations: WOCE and satellite data: Oceanographers rely more and more
on large data sets produced by others. The sets have errors and limitations which you
must understand before using them.
5. Operational Oceanography.

August 16, 2004 5
2 Inverse Methods
Three elements of oceanography:
• Ocean observations
• Numerical models
• Theory
Those elements need to be combined for quantitative studies of the ocean and its changes.
For that purpose we have to pay close attention for the differences between theory, models
and observations.
Observations are essential for understanding the ocean. The basic description of the ocean
is sufficient for describing the time-averaged mean circulation of the ocean, and recent work
is beginning to describe the variability.
Few processes have been predicted from theory before they were observed.

August 16, 2004 6
A forward problem: solve a PDE given initial and boudnary conditions. Analytic or
numerical solutions of dynamical equations are necessary.
An inverse problem: infer the ocean circulation, understanding it dynamically, and
forecasting it, through a quantitative combination of theory and observations. Inverse
methods are required to reach this goal.
To solve an inverse problem: an attempt to quantitatively test data against known
dynamical principles. Need quantitative estimates and their uncertainties. In some sense
the estimates of uncertainties are more important the the estimates them self.

August 16, 2004 7
Example:
Laplace-Poisson eq with Dirichlet boundary condition:
∇2Φ = ρ (1)
Solve for Ψ, given ρ in domain D, subject to bc Ψ = Ψ0 on the boundaries δD is typical
forward problem.
Well posed problem:
1. The solution exists.
2. It is unique.
3. It depends smoothly on bc’s.
In general: An elliptic PDE is well posed – solution or its normal derivation are given
on δD. A forward problem could be thought of as a well-posed problem of mathematical
physics.
The inverse problem: find ρ given Ψ in the domain D. The problem is inverse in the
sense that usual known and unknowns have been interchanged. An inverse problem is one
inverse to a corresponding forward problem, interchanging the roles of at least some known
and unknowns.

August 16, 2004 8
Both problems are posed uniquely so fare. However, in the context of noisy data such
a forward problem is automatically ill posed and candidate for a solution by an inverse
method.
August 16, 2004 9
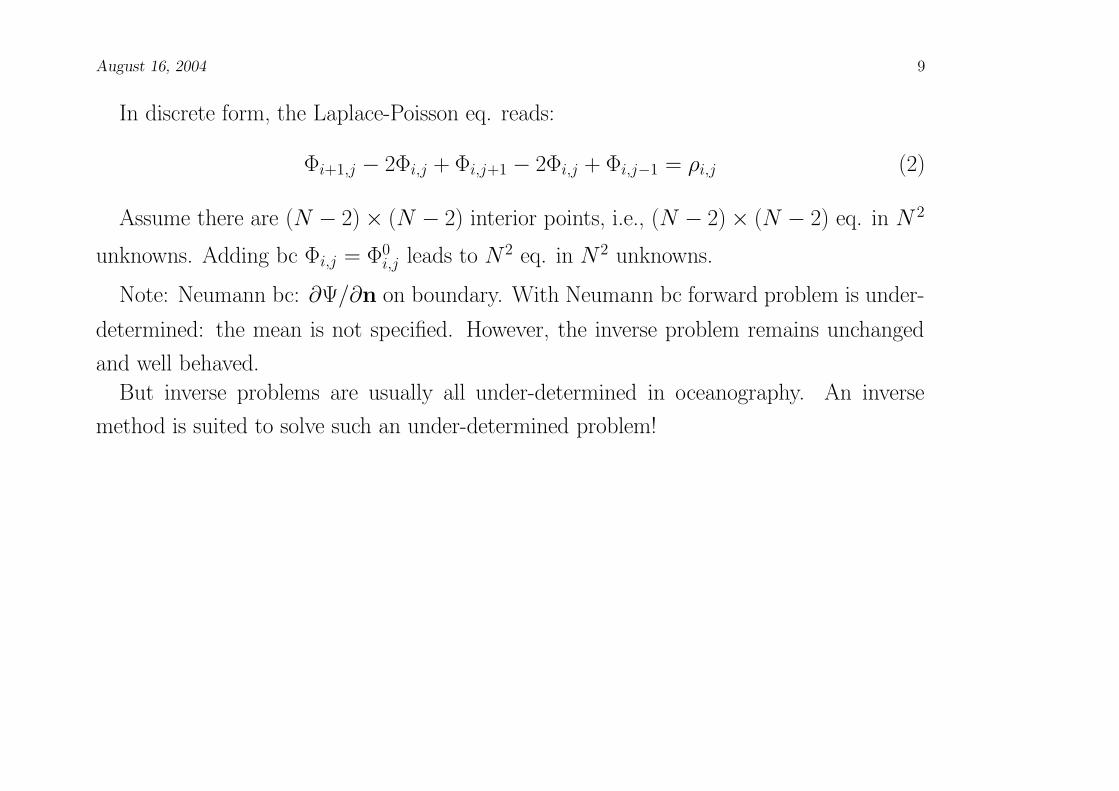
In discrete form, the Laplace-Poisson eq. reads:
Φi+1,j − 2Φi,j + Φi,j+1 − 2Φi,j + Φi,j−1 = ρi,j (2)
Assume there are (N − 2) × (N − 2) interior points, i.e., (N − 2) × (N − 2) eq. in N 2
unknowns. Adding bc Φi,j = Φ0i,j leads to N 2 eq. in N 2 unknowns.
Note: Neumann bc: ∂Ψ/∂n on boundary. With Neumann bc forward problem is under-
determined: the mean is not specified. However, the inverse problem remains unchanged
and well behaved.
But inverse problems are usually all under-determined in oceanography. An inverse
method is suited to solve such an under-determined problem!

August 16, 2004 10
All illposedness owing to the lack of sufficient information is prominent in oceanography.
But there are other forms of ill-posedness and are very important: too much information!
As will follow later: most or all under-determined and overdetermined problems in the
presence of noisy observations can be written as:
Ex + n = y (3)
The problem is to understand the solution x.
But n is a set of unknowns, too! Therefore there are always fewer eq. than unknowns.
Useful inverse methods always recognize and deal with problems of imperfect data. And
again: the importance of making uncertainty estimates in this context can hardly be over-
estimated.
August 16, 2004 11
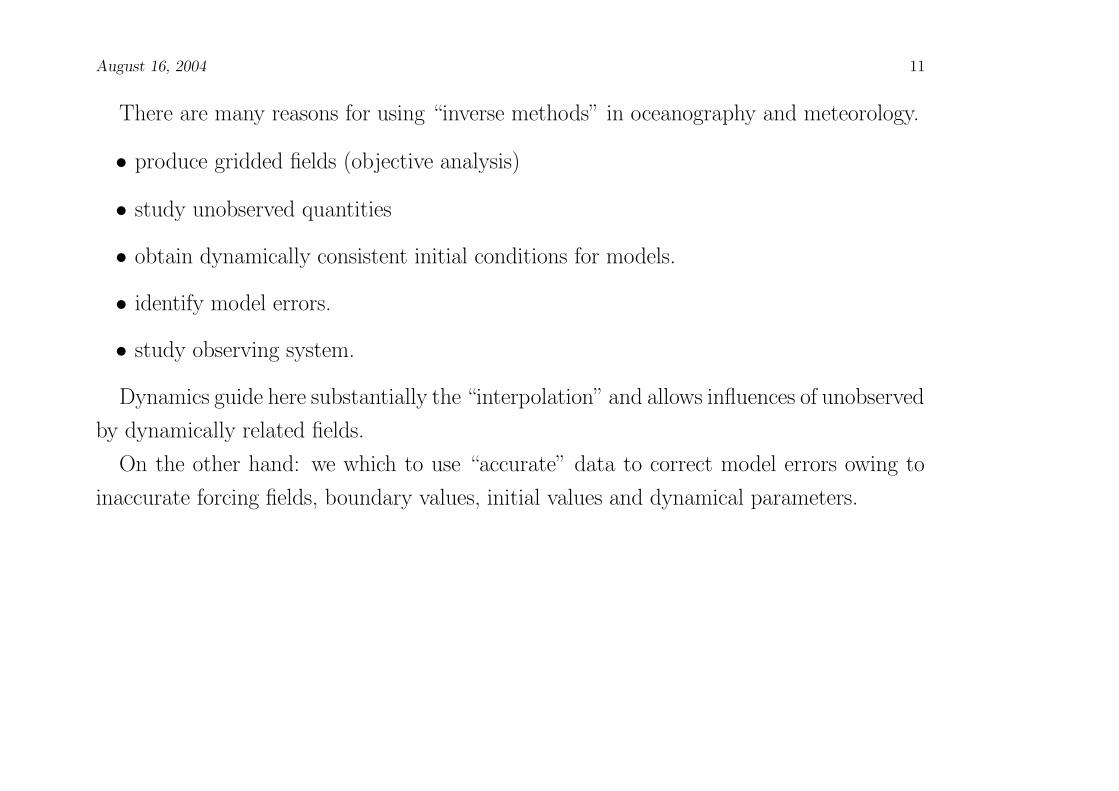
There are many reasons for using “inverse methods” in oceanography and meteorology.
• produce gridded fields (objective analysis)
• study unobserved quantities
• obtain dynamically consistent initial conditions for models.
• identify model errors.
• study observing system.
Dynamics guide here substantially the “interpolation” and allows influences of unobserved
by dynamically related fields.
On the other hand: we which to use “accurate” data to correct model errors owing to
inaccurate forcing fields, boundary values, initial values and dynamical parameters.
August 16, 2004 12
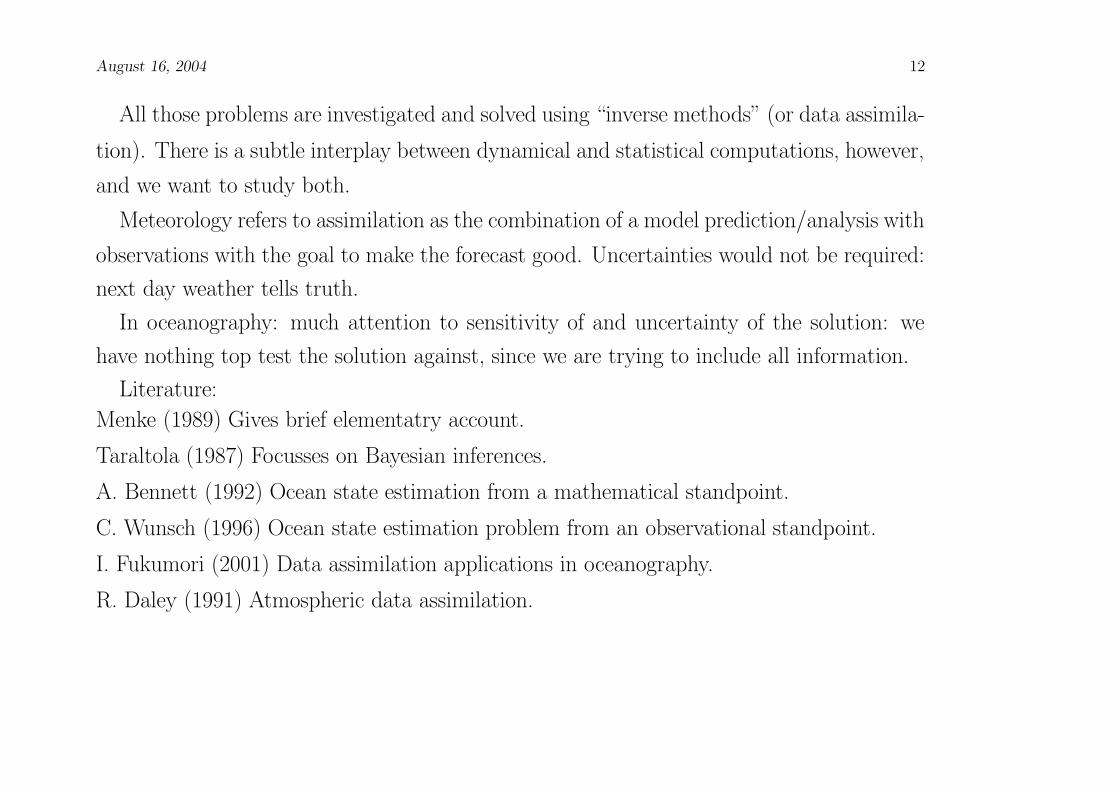
All those problems are investigated and solved using “inverse methods” (or data assimila-
tion). There is a subtle interplay between dynamical and statistical computations, however,
and we want to study both.
Meteorology refers to assimilation as the combination of a model prediction/analysis with
observations with the goal to make the forecast good. Uncertainties would not be required:
next day weather tells truth.
In oceanography: much attention to sensitivity of and uncertainty of the solution: we
have nothing top test the solution against, since we are trying to include all information.
Literature:
Menke (1989) Gives brief elementatry account.
Taraltola (1987) Focusses on Bayesian inferences.
A. Bennett (1992) Ocean state estimation from a mathematical standpoint.
C. Wunsch (1996) Ocean state estimation problem from an observational standpoint.
I. Fukumori (2001) Data assimilation applications in oceanography.
R. Daley (1991) Atmospheric data assimilation.
August 16, 2004 13
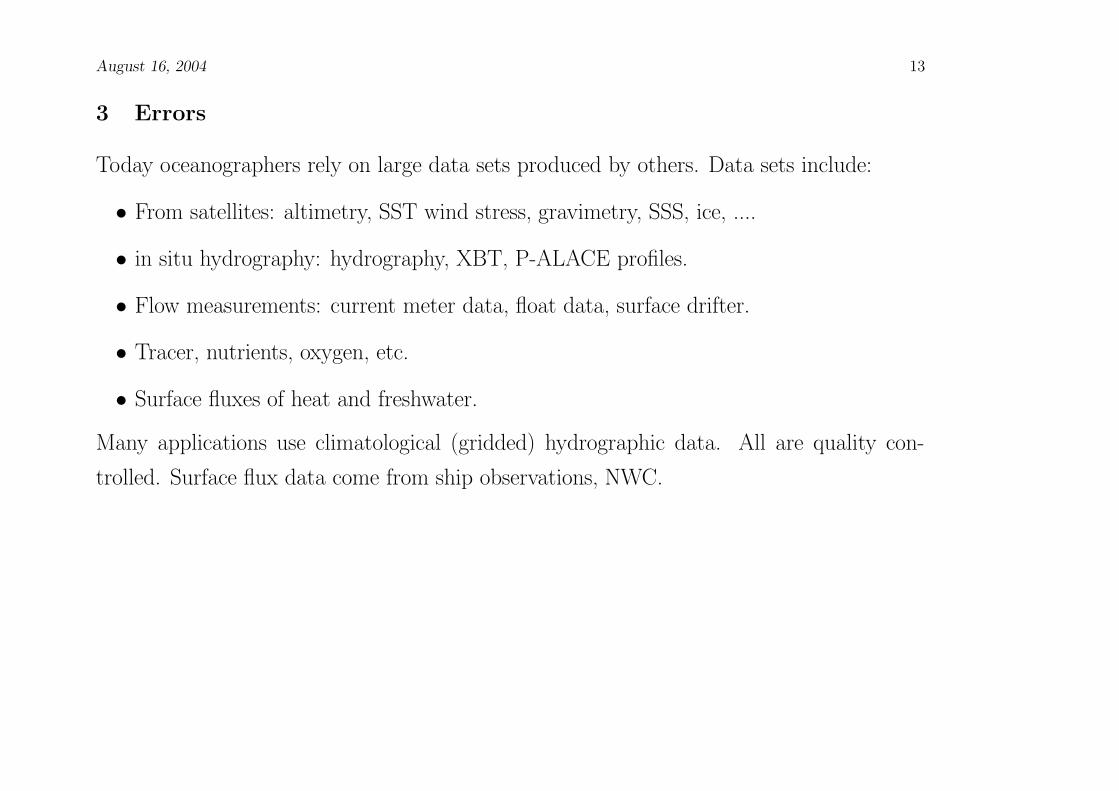
3 Errors
Today oceanographers rely on large data sets produced by others. Data sets include:
• From satellites: altimetry, SST wind stress, gravimetry, SSS, ice, ....
• in situ hydrography: hydrography, XBT, P-ALACE profiles.
• Flow measurements: current meter data, float data, surface drifter.
• Tracer, nutrients, oxygen, etc.
• Surface fluxes of heat and freshwater.
Many applications use climatological (gridded) hydrographic data. All are quality con-
trolled. Surface flux data come from ship observations, NWC.

August 16, 2004 14
All of those sources have errors which often are only purely known. Especially surface
forcing fields have serious problems. Errors include:
• Instrument errors:
• Sampling errors:
Our knowledge about error correlations is rudimentary, and much of the future improve-
ments of OSE will come from better understanding of data and model errors.
As compared to data, our understanding of model errors is worse. Generally it is useful
to make the distinction between:
• Representation error: includes inertial oscillations, eddies, internal wave motion, etc.
• Parameterization error: includes missing or wrong physics in the model.

August 16, 2004 15
4 Box Inversion
The classical problem of oceanography can be described as the question of how to compute
the geostrophic flow field of the ocean from observations easily made from ships. Historically
one used the thermal wind relation and the major issue always was reduced to the missing
integral constant.
f × ρv = −∇p (4)
Despite the best effort of a large number of people, no adequate general method was
found for the determination of the reference velocity on the space and time scale of a
section obtained from a ship.
An umber of ad hoc assumptions were made:
1. geostrophic and hydrostatic balance.
2. the deep ocean is at rest.
3. the ocean is static and laminar.
4. conservation of water masses and tracers.

August 16, 2004 16
Lets write down the equations with convention of velocities positive north and eastward.
a) Consider the total volume moving geostrophically in to and out of an enclosed
volume:N∑
j
Q∑
qρj(q)(vRj(q) + bj)δj∆aj(q) ≈ 0 (5)
• vRj(q) thermal wind in station pair j at depth interval q.
• bj reference level velocity.
• ∆aj(q) differential area.
• δj unit volume.
• (no Ekman flow).
Everything in the equation is known except bj and a slight imbalance is anticipated due
to errors.

August 16, 2004 17
The eq. is a discrete form of a continuous areal integral over the boundary section. It is
one eq. in N unknowns bj.
To solve it, further constraints are useful, e.g., salt conservation:
N∑
j
Q∑
qρj(q)Sj(q)(vRj(q) + bj)δj∆aj(q) ≈ 0 (6)
or conservation of mass between density intervals ρi < ρ < ρi+1:
N∑
j
qi+1(j)∑
qi(j)ρj(q)(vRj(q) + bj)δj∆aj(q) ≈ 0 (7)

August 16, 2004 18
The collection of these and other similar eqt. can be written as
Ex + n = y (8)
where
x = (b1, b2, ..., bN)T reference velocity vector. (9)
n = (n1, n2, ..., nN)T noise vector. (10)
y = (y1, y2, ..., yN )T observations. (11)
E coefficient matric.
The heart of geostrophic inverse problems is the extraction of useful information from
such an eq. given the fact that they are usefully under-determined (ill-conditioned inverse
problems).

August 16, 2004 19
Inverse problems are solved in oceanography for:
1. parameter estimation: x, R
2. hypothesis testing: y = Ex
3. which data determine x (observing system design).
In the early days of oceanography the mathematical machinery required to deal with
theses problems did not exist. Further more the presence of ocean variability on small
scales makes the problem by fare more complicated. This did lead to use full ocean GCMs
today.

August 16, 2004 20
5 Interpolation
Maps are fundamental for the interpretation of satellite data. Creating them requires
always some kind of gridding and interpolation. Underlying this process is the notion that
there is some of continuous function, T (x, t), which we desire to reconstruct from discrete
and often un-evenly sampled (gappy) and noisy data.
We need some elementary notation.
Let
R = < yiyj > = R(ri, rj) (12)
be the covariance of y. If
Rij = R(|ri − rj|) (13)
then y is called isotropic.
Let r0 be a location where an interpolated value y(r0) of a measurement is required:
d = yi + ni (14)

August 16, 2004 21
For the measurement and noise ni holds:
< n(ri)n(rj) >= N(|ri − rj|) (15)
The field we seek to map has the statistics given by R and the noise is uncorrelated with
the value of y:
< y(ri)n(rj) >= 0 alli, j (16)
Under usual conditions the interpolated value is a weighted average of the observation
y(r0) =∑
iBj(r0)d(rj) = B(r0)d (17)
The variance of the difference between the true value at r0 and our interpolated value is
then given by
E =< (y(r0) − y(r0))2 >=< (Bd− y(r0))
2 > (18)

August 16, 2004 22
The Gauss-Markov theorem states that the minimum of the error variance is reached
when B is chosen as
B = R(r0, rj)[R(rj, rk) + N(rj, rk)]−1 (19)
R(r0, rj) = R(r0, r1),R(r0, r2), ....,R(r0, rn) (20)
The minimum of E is then given as
Emin = R(r0, r0) −R(r0, rj)[R(rj, rk) + N(rj, rk)]−1RT (rj, rk) (21)
There are several important properties of the Gauss-Markov theorem.
1. No other choice of B leads to smaller errors; i.e., E is optimal.
2. No other linear combination could lead to a better estimate under the stated conditions.
A map (satellite data or anything else) is then simply a two-dimensional interpolation
to a grid, sufficiently regular to be contourable, of a field that initially was observed along
a swath or a track or any irregular manner. To be useful, any of this map needs to be
accompanied by an estimation error map. We note that the error map depends only on the
prior statistics and the data distribution, but not on the actual numbers. It can therefore
be evaluated prior to any data being taken.

August 16, 2004 23
6 Least Squares
Let t be an independent variable which might be time or space coordinates, or simply an
index. Suppose a set of measurements, e.g. T(t), have been made at times ti, i = 1, .., n.
Suppose we have reasons to believe that there is a linear relation between T and t:
T(t) = a + bt (22)
y(t) = T(t) + n(t) = a + bt + n(t) (23)
where n(t) is the noise and we want to determine the coefficients a and b in a least-squares
manner.
The observations lead to n equations which can be written in matric notation as
Aq = y − n (24)
We are seeking a value of q = (a, b) that minimizes the sum-squares of the differences
between Aq and y:
min : δ = (Aq − y)T (Aq − y) (25)
Differentiation with respect to a and b and demanding that the derivatives vanish will

August 16, 2004 24
lead to
ATAq = ATy (26)
and
q = (ATA)−1ATy (27)
Several examples of the results are shown in the next figures and one needs to ask a great
deal of questions about its meaning.

August 16, 2004 25
7 Filters
The early inversion application in the ocean were focused on static ocean circulation prob-
lems. However, the ocean is highly variable as satellite data show. So over the years the
focus shifted from static to fully time dependent problems and from simple models to full
4-dimensional models of the ocean circulation. The extension to include one more indepen-
dent coordinate - time - does not pose any principle extra problems. Rather it is just an
extension of the previous methods.
The goal is to make estimates by combining a model and data - much like the previous
simple least squares but now using a variety of observations and a full GCM. This is the
case for many years in meteorology for weather prediction problems. In the ocean the same
methods were adopted. However, the emphasis is more on hindcast and descriptions of the
time-varying dynamics. This requires different approaches and foci.

August 16, 2004 26
If done properly, inferences from model/data combinations should be as good as any
one individually or actually better than any one individually. Such model/data problems
are one of statistical inferences with some powerful techniques available. However, several
important stages are involved.
Stage 1 of any estimation problem has to be to understand if a physical model and the
data are statistically consistent. If they are not one should stop.
A model may have adjustable parameters which can bring the model and the data into
consistency and then the estimation procedure becomes an attempt to find those parameters
in addition to the state. Alternatively or in addition the data error covariance matrix R(t)
me be considered incompletely known and one can use the procedure to improve it as part
of the estimation procedure (adaptive filtering).

August 16, 2004 27
An estimation procedure can be thought of as an interpolation in space and time: given
a set of observations in space and time, use the model dynamics to estimate various state
vector elements at various times of interest. Standard equations for the model and data are:
x(t + 1) − A(t)x(t) + Bq(t) + Γu(t), 0 < t < tf−1 (28)
E(t)x(t) + n(t) = y(t), t < t < tf (29)
n(t) − 0, < n(t)n(t)T >= R(t), < n(t)n(t′) >= 0, t = t′ (30)
< u >= 0, < u(t)u(t)T >= Q(t) (31)
x(o) = x0, < (x(o) − x(0))(x(o) − x(0))T >= P (0) (32)
This general form permits one to grapple with reality.
August 16, 2004 28
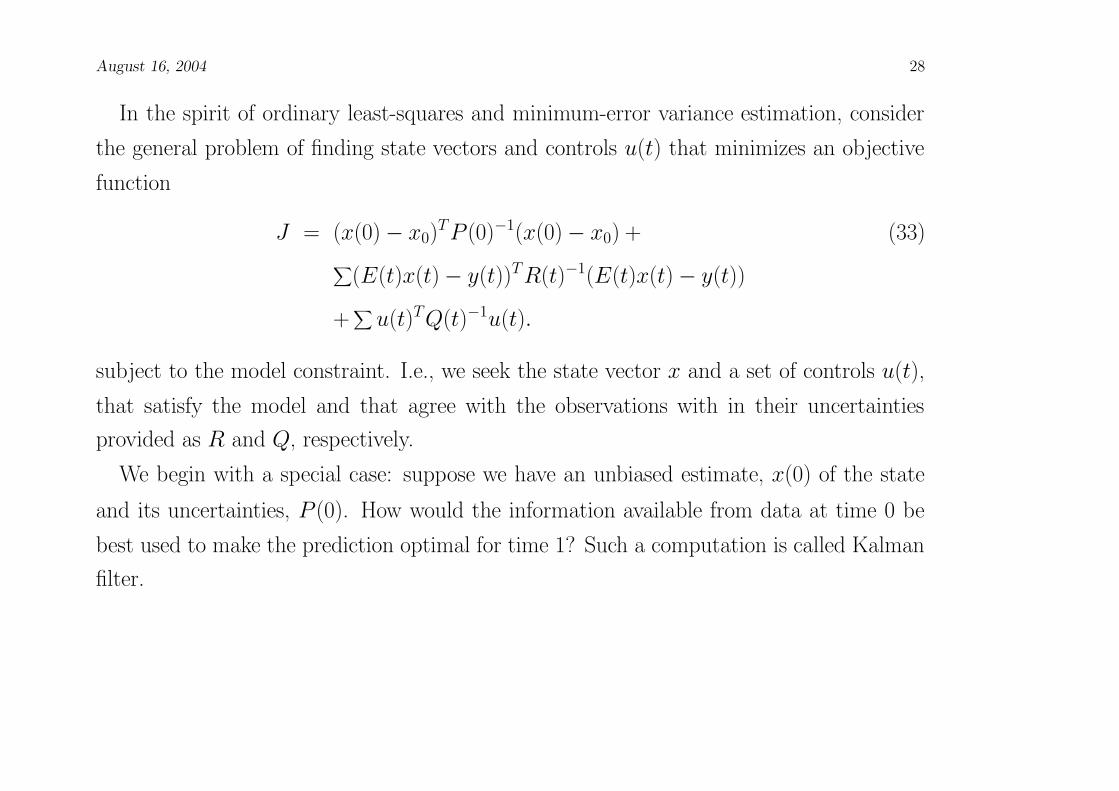
In the spirit of ordinary least-squares and minimum-error variance estimation, consider
the general problem of finding state vectors and controls u(t) that minimizes an objective
function
J = (x(0) − x0)TP (0)−1(x(0) − x0) + (33)
∑(E(t)x(t) − y(t))TR(t)−1(E(t)x(t) − y(t))
+∑
u(t)TQ(t)−1u(t).
subject to the model constraint. I.e., we seek the state vector x and a set of controls u(t),
that satisfy the model and that agree with the observations with in their uncertainties
provided as R and Q, respectively.
We begin with a special case: suppose we have an unbiased estimate, x(0) of the state
and its uncertainties, P (0). How would the information available from data at time 0 be
best used to make the prediction optimal for time 1? Such a computation is called Kalman
filter.

August 16, 2004 29
There are four steps involved:
1. Make forecast using the model with the known control terms Γu set to zero.
2. Calculate the uncertainty of this forecast.
3. Do the weighted average of the forecast with the observations, the weighting being
chosen to reflect the relative uncertainties.
4. Compute the uncertainties of the final weighted average.
x̃(t,−) = A(t − 1)x̃(t − 1) + B(t − 1)q(t − 1) (34)
P (t,−) = A(t − 1)P (t − 1)A(t − 1) + ΓQ(t − 1)ΓT (35)
x(t) = x̃(r,−) + K(t)[y(t) − E(t)x̃(t,−)] (36)
K(t)P (t,−)E(t)T [E(t)P (t,−)E(t)T + R(t)]−1 (37)
P (t) = P (t,−) − K(t)E((t)P (t,−), t < t < tf (38)

August 16, 2004 30
The problem was reduced to finding the minimum of the cost function:
J = (x(1,−) − x(1))TP (1,−)−1(x(1,−) − x(1)) + (39)∑
(E(1)x(1) − y(1))TR(1)−1(E(1)x(1) − y(1))

August 16, 2004 31
8 Smoothers
Minimizing J subject to the model is still the goal. However, the strategy here is to combine
all available data with the model in a “whole domain approach” to get better estimates by
using data from the past and the future at the same time.
As before
x(t + 1) − A(t)x(t) + Bq(t) + Γu(t), 0 < t < tf−1 (40)
E(t)x(t) + n(t) = y(t), t < t < tf (41)
n(t) − 0, < n(t)n(t)T >= R(t), < n(t)n(t′) >= 0, t = t′ (42)
< u >= 0, < u(t)u(t)T >= Q(t) (43)
x(o) = x0, < (x(o) − x(0))(x(o) − x(0))T >= P (0) (44)
where Q and R are the model and data error covariances.

August 16, 2004 32
Similar to ordinary least squares we seek again the minimum error variance estimate (and
for Gauss system maximum likelyhood estimate):
J = (x(0) − x0)TP (0)−1(x(0) − x0) + (45)
∑(E(t)x(t) − y(t))TR(t)−1(E(t)x(t) − y(t))
+∑
u(t)TQ(t)−1u(t).
subject to the model constraint.
We seek x(t), 0 ≤ T ≤ tf , u(t), 0 ≤ T ≤ tf−1 that satisfy the model and the data within
their uncertainties.
As for simple LS problems we have to go back after the fact and test results and their
consistency.
J = (x(0) − x0)TP (0)−1(x(0) − x0) + (46)
∑(E(t)x(t) − y(t))TR(t)−1(E(t)x(t) − y(t))
+∑
u(t)TQ(t)−1u(t)
−2∑
µ(t + 1)T [x(t + 1) − Ax(t) − Bq(t) − Γu(t)].
We turn constrained problem into unconstrained one by solving th enormal equations.

August 16, 2004 33
1/2∂J/∂u(t) = Q−1u(t − 1) + ΓTµ(t) = 0 (47)
1/2∂J/∂µ(t) = x(t) − Ax(t − 1) − Bq(t − 1) − Γu(t − 1) = 0 (48)
1/2∂J/∂x(0) = P (0)−1(x(0) − x̃(0)) + ATµ(1) = 0 (49)
1/2∂J/∂x(t) = E(t)R(t)−1[E(t)x(t) − y(t)] − µ(t) + ATµ(t + 1) (50)
1/2∂J/∂x(tf) = E(tf)TR(tf)−1[E(tf)x(tf) − y(tf)] − µ(tf) = 0 (51)
For a non-linear GCM these equations will be solved iteratively.