Embed Size (px)
Citation preview
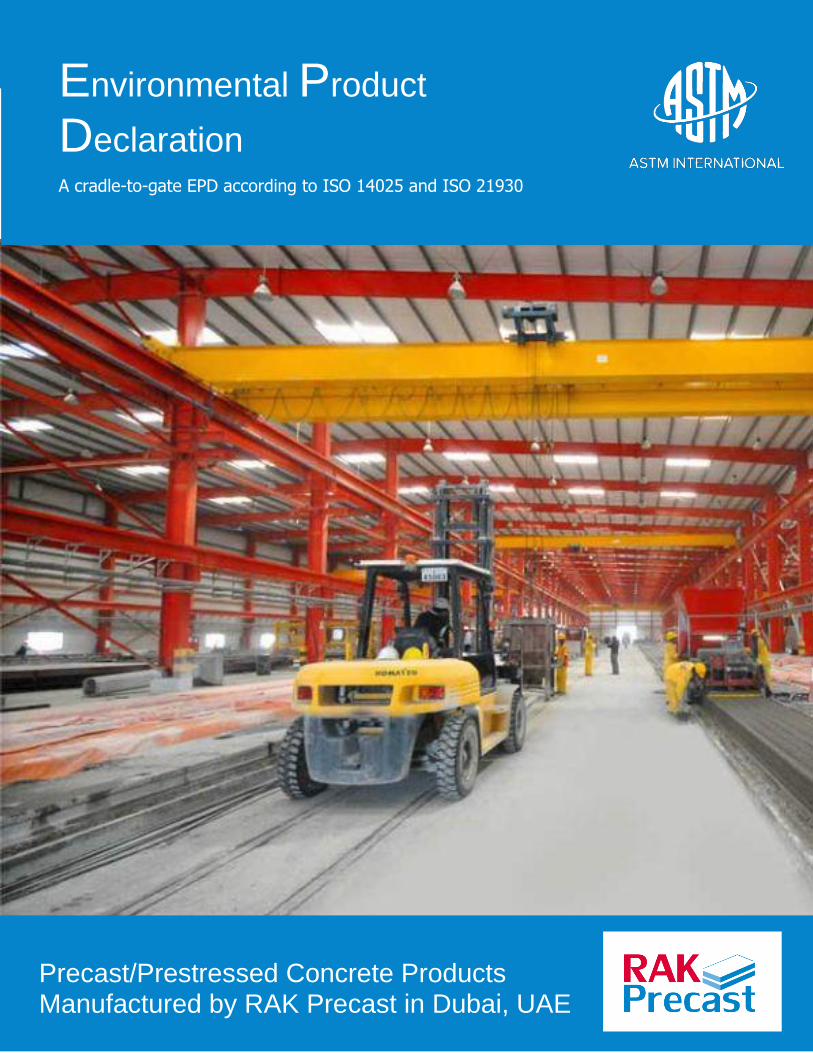
Environmental Product Declaration
Environmental Product
Declaration
A cradle-to-gate EPD according to ISO 14025 and ISO 21930
Precast/Prestressed Concrete Products Manufactured by RAK Precast in Dubai, UAE

Environmental Product Declaration
NORMAL-WEIGHT AND LIGHT-WEIGHT CONCRETE
MASONRY UNITS AS MANUFACTURED BY MEMBERS OF
THE CANADIAN CONCRETE MASONRY PRODUCERS
ASSOCIATION (CCMPA)
We have a proven track record, for precast, pre-engineered buildings and
associated civil engineering works which have significantly reduced construction
cost & time for many of our clients. Within a short period, our group of companies
are held in esteem throughout the construction industry of the area due to its
conscious planning, maintaining honorable relationships with customers,
and high-level jobsite performance.
About RAK Precast
RAK PRECAST is one of the
biggest factories in UAE with
production capacity that can reach
up to 1000 m3/day. We have two
precast factories located in UAE
and one factory in Iraq. Our
factory established in Dubai
Industrial City includes the latest
automated precast systems.
2
Environmental Product Declaration
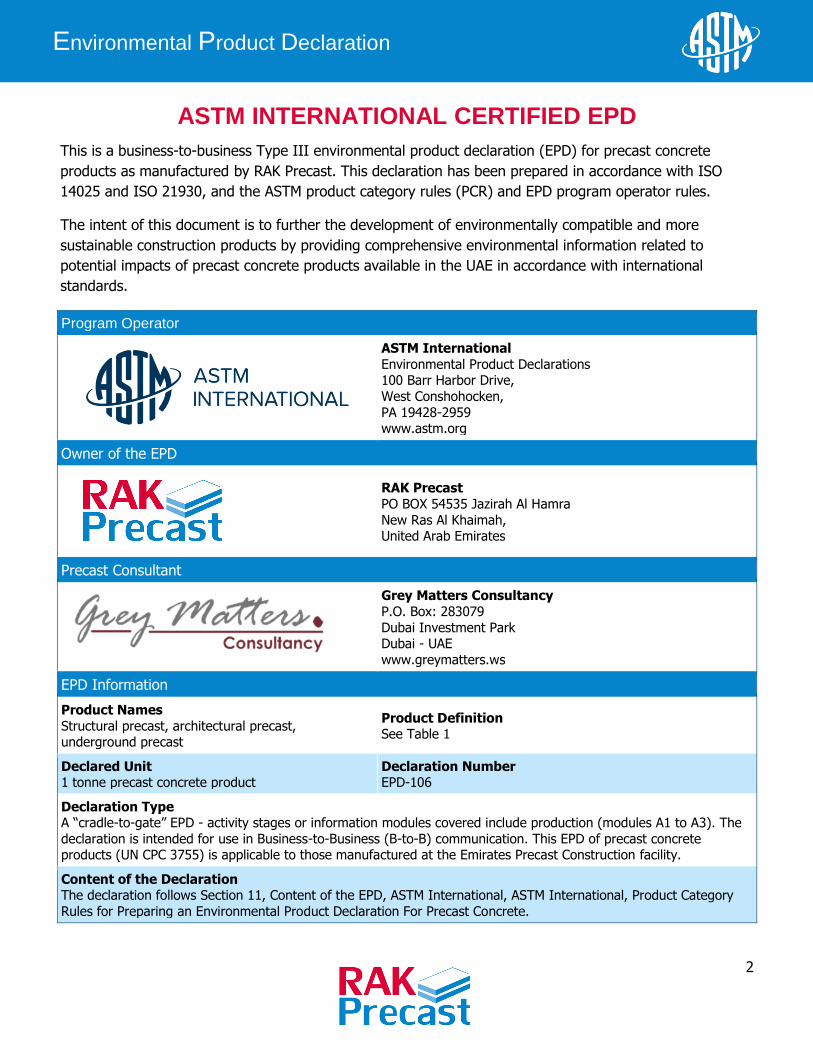
ASTM INTERNATIONAL CERTIFIED EPD
This is a business-to-business Type III environmental product declaration (EPD) for precast concrete
products as manufactured by RAK Precast. This declaration has been prepared in accordance with ISO
14025 and ISO 21930, and the ASTM product category rules (PCR) and EPD program operator rules.
The intent of this document is to further the development of environmentally compatible and more
sustainable construction products by providing comprehensive environmental information related to
potential impacts of precast concrete products available in the UAE in accordance with international
standards.
Program Operator
ASTM International
Environmental Product Declarations 100 Barr Harbor Drive,
West Conshohocken,
PA 19428-2959 www.astm.org
Owner of the EPD
RAK Precast
PO BOX 54535 Jazirah Al Hamra
New Ras Al Khaimah, United Arab Emirates
Precast Consultant
Grey Matters Consultancy
P.O. Box: 283079
Dubai Investment Park Dubai - UAE
www.greymatters.ws
EPD Information
Product Names
Structural precast, architectural precast, underground precast
Product Definition See Table 1
Declared Unit 1 tonne precast concrete product
Declaration Number EPD-106
Declaration Type A “cradle-to-gate” EPD - activity stages or information modules covered include production (modules A1 to A3). The
declaration is intended for use in Business-to-Business (B-to-B) communication. This EPD of precast concrete products (UN CPC 3755) is applicable to those manufactured at the Emirates Precast Construction facility.
Content of the Declaration The declaration follows Section 11, Content of the EPD, ASTM International, ASTM International, Product Category
Rules for Preparing an Environmental Product Declaration For Precast Concrete.
3
Environmental Product Declaration
EPD Information
Declaration Comparability Limitation Statement
The following ISO statement indicates the EPD comparability limitations and intent to avoid any market distortions or
misinterpretation of EPDs based on the ASTM’s PCR, 2015: ▪ EPDs from different programs (using different PCR) may not be comparable.
▪ Declarations based on the ASTM PCR are not comparative assertions; that is, no claim of environmental superiority may be inferred or implied.
Applicable Countries United Arab Emirates
Date of Issue May 14 2019
Period of Validity 5 years
EPD Prepared by
Matt Bowick, Athena Sustainable Materials Institute
280 Albert Street, Suite 404 Ottawa, Ontario, Canada, K1P 5G8
[email protected] [email protected]
This EPD was independently verified by ASTM in accordance with ISO 14025:
Timothy Brooke, ASTM International
100 Barr Harbor Dr. West Conshohocken, PA 19428
Internal External
X
EPD Project Report Information
EPD Project Report
A Cradle-to-Gate Life Cycle Assessment of Precast Concrete Products Manufactured by RAK Precast in the Emirate of Dubai, UAE
The report is available upon request at [email protected].
EPD Project Prepared by
Matt Bowick, Athena Sustainable Materials Institute 280 Albert Street, Suite 404
Ottawa, Ontario, Canada, K1P 5G8
This EPD and EPD project report were independently verified by in accordance with ISO 14025 and the
reference PCR:
Thomas Gloria, Ph.D. (LCACP ID: 2008-03)
Industrial Ecology Consultants
Email: [email protected]
PCR Information
Reference PCR
ASTM International, Product Category Rules for Preparing an
Environmental Product Declaration For Precast Concrete (based on ISO 21930:2007, an alternative to EN 15804
standard)
Date of Issue March 2015
PCR review was conducted by:
Nicholas Santero, PE International (Chairperson) Christine Subasic, Consulting Architectural Engineer
Juan Tejeda, ORCO Block Company
Contact information available upon request at [email protected].
4
Environmental Product Declaration
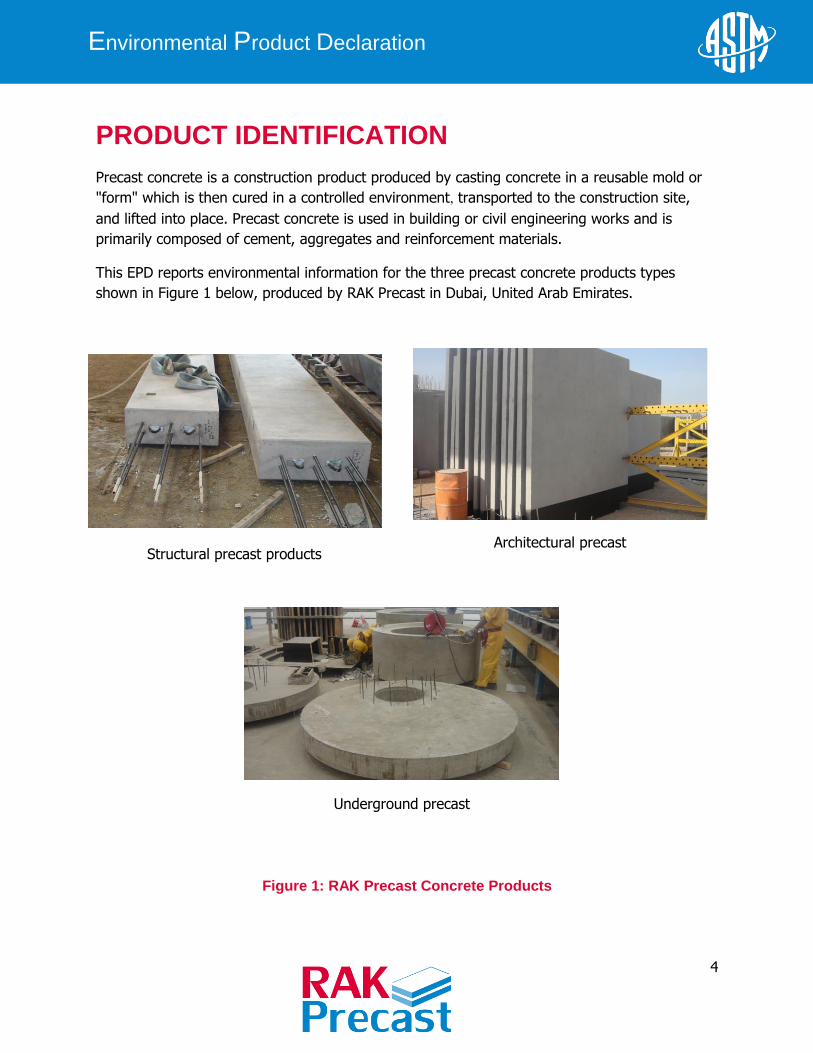
PRODUCT IDENTIFICATION
Precast concrete is a construction product produced by casting concrete in a reusable mold or
"form" which is then cured in a controlled environment, transported to the construction site,
and lifted into place. Precast concrete is used in building or civil engineering works and is
primarily composed of cement, aggregates and reinforcement materials.
This EPD reports environmental information for the three precast concrete products types
shown in Figure 1 below, produced by RAK Precast in Dubai, United Arab Emirates.
Figure 1: RAK Precast Concrete Products
Structural precast products
Architectural precast
Underground precast

5
Environmental Product Declaration
Environmental information for products composed seven different concrete mix designs are
reported in this EPD — see Table 1 for a summary of the products covered.
Table 1: Summary of Products Applicable to this EPD
Concrete Mix Design Compressive
Strength Product Types
(rebar design range, kg per m3 product)
RAKP/CM/001 50 MPa ▪ Precast solid slabs (100-120) ▪ Precast beams (100-150) ▪ Precast stairs (80-100)
RAKP/CM/002 40 MPa ▪ Precast insulated wall panels (60-66.7) ▪ Precast non-insulated wall panels (80-85)
RAKP/CM/003 40 MPa ▪ Precast insulated wall panels (60-66.7) ▪ Precast non-insulated wall panels (80-85) ▪ Precast footings (70-80)
RAKP/CM/004 15 MPa ▪ Non-load-bearing light-weight partitions (0)
RAKP/CM/005 50 MPa ▪ Prestressed girders (200-250) ▪ Prestressed beams (100-150)
RAKP/CM/006 50 MPa
▪ Precast columns (100-150) ▪ Precast beams (100-150) ▪ Precast footings (70-80) ▪ Precast manholes (80-90)
RAKP/CM/007 50 MPa ▪ Precast solid slabs (100-120)
DECLARED UNIT
The declared unit is 1 tonne of precast concrete product.
MATERIAL CONTENT
Table 2 through Table 14 below present the material content by input material for the various
precast concrete products, as provided by Emirates Precast Construction.
To provide LCA results applicable to any future construction project, the rebar quantities of the
six concrete mixes designs were varied between according to typical quantities, in increments of
5 kg/m3 or 10 kg/m3. It is intended that users of the EPD can reference the LCA results
applicable to their design or interpolate between results.

6
Environmental Product Declaration
Table 2: Material Content for Precast Insulated Panels – kg per m3 product
Material
RAKP/CM/002 RAKP/CM/003
Rebar = 60 kg/m3
Rebar = 63.3
kg/m3
Rebar = 66.7
kg/m3
Rebar = 60 kg/m3
Rebar = 63.3
kg/m3
Rebar = 66.7
kg/m3
Water 98.9 98.8 98.7 98.9 98.8 98.7
Portland Cement 176.2 176.1 175.9 162.5 162.3 162.2
Slag Cement (GGBFS) 98.9 98.8 98.7 98.9 98.8 98.7
Silica Fume 0.0 0.0 0.0 13.8 13.7 13.7
Crushed Coarse Aggregate, 20mm 452.1 451.6 451.2 452.1 451.6 451.2
Crushed Coarse Aggregate, 10mm 216.2 216.0 215.8 216.2 216.0 215.8
Crushed Fine Aggregate, 0-5mm 406.2 405.8 405.4 406.2 405.8 405.4
Natural Fine Aggregate, dune sand 157.2 157.1 156.9 157.2 157.1 156.9
Admixture - plasticizer 3.9 3.9 3.9 3.9 3.9 3.9
Rebar 60.0 63.3 66.7 60.0 63.3 66.7
EPS Insulation 10.2 10.2 10.2 10.2 10.2 10.2
Total 1,680 1,682 1,684 1,680 1,682 1,684
Table 3: Material Content for Precast Non-insulated Panels – kg per m3 product
Material RAKP/CM/002 RAKP/CM/003
Rebar = 80 kg/m3
Rebar = 85 kg/m3
Rebar = 80 kg/m3
Rebar = 85 kg/m3
Water 149.3 149.2 149.5 149.4
Portland Cement 265.9 265.7 245.5 245.3
Slag Cement (GGBFS) 149.3 149.2 149.5 149.4
Silica Fume 0.0 0.0 20.8 20.8
Crushed Coarse Aggregate, 20mm 682.1 681.6 683.0 682.5
Crushed Coarse Aggregate, 10mm 326.2 326.0 326.6 326.4
Crushed Fine Aggregate, 0-5mm 612.9 612.5 613.7 613.3
Natural Fine Aggregate, dune sand 237.2 237.1 237.6 237.4
Admixture - plasticizer 5.9 5.9 5.9 5.9
Rebar 80 85 80 85
Total 2,509 2,512 2,512 2,515
Table 4: Material Content for Precast Solid Slabs – kg per m3 product
Material
RAKP/CM/001
Rebar = 100 kg/m3
Rebar = 105 kg/m3
Rebar = 110 kg/m3
Rebar = 115 kg/m3
Rebar = 120 kg/m3
Water 164.9 164.8 164.7 164.6 164.4
Portland Cement 153.0 152.9 152.8 152.7 152.6
Slag Cement (GGBFS) 278.4 278.2 278.0 277.9 277.7
Silica Fume 32.6 32.6 32.5 32.5 32.5
Crushed Coarse Aggregate, 20mm 671.3 670.9 670.5 670.0 669.6
Crushed Coarse Aggregate, 10mm 325.8 325.6 325.4 325.2 325.0
Crushed Fine Aggregate, 0-5mm 602.2 601.8 601.5 601.1 600.7
Natural Fine Aggregate, dune sand 236.9 236.8 236.6 236.5 236.3
Admixture - plasticizer 6.9 6.9 6.9 6.9 6.9
Rebar 100 105 110 115 120
Total 2,572 2,576 2,579 2,582 2,586
7
Environmental Product Declaration
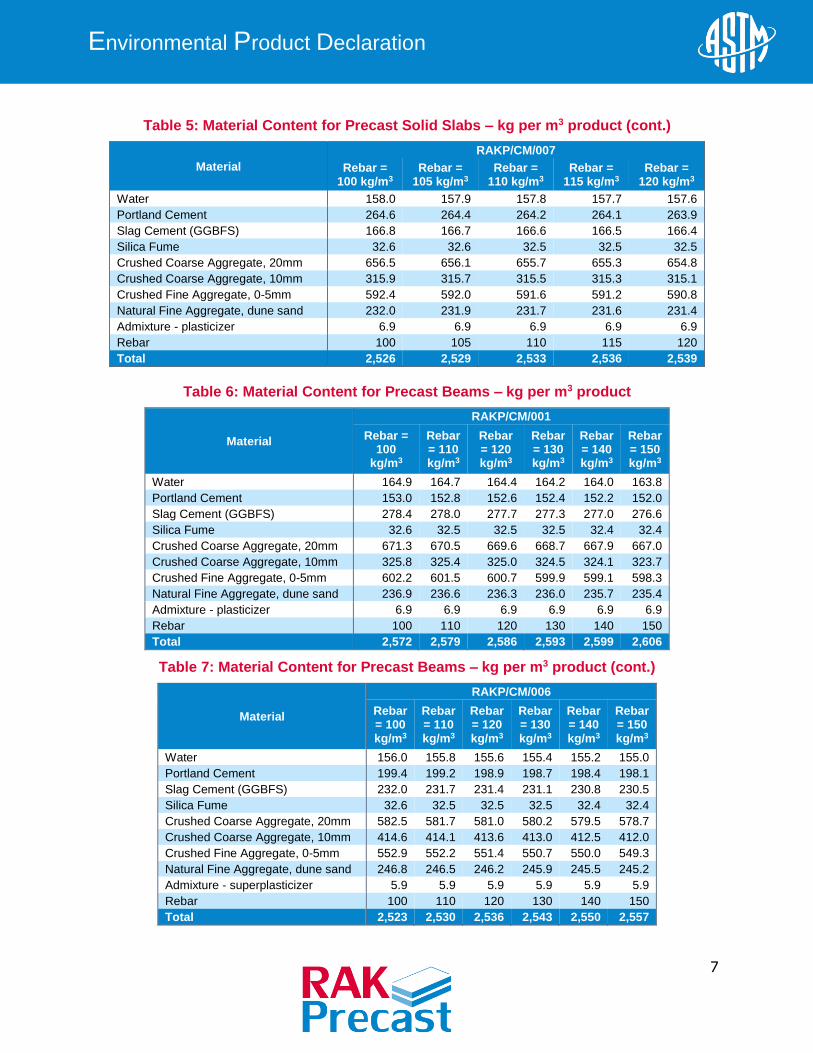
Table 5: Material Content for Precast Solid Slabs – kg per m3 product (cont.)
Material
RAKP/CM/007
Rebar = 100 kg/m3
Rebar = 105 kg/m3
Rebar = 110 kg/m3
Rebar = 115 kg/m3
Rebar = 120 kg/m3
Water 158.0 157.9 157.8 157.7 157.6
Portland Cement 264.6 264.4 264.2 264.1 263.9
Slag Cement (GGBFS) 166.8 166.7 166.6 166.5 166.4
Silica Fume 32.6 32.6 32.5 32.5 32.5
Crushed Coarse Aggregate, 20mm 656.5 656.1 655.7 655.3 654.8
Crushed Coarse Aggregate, 10mm 315.9 315.7 315.5 315.3 315.1
Crushed Fine Aggregate, 0-5mm 592.4 592.0 591.6 591.2 590.8
Natural Fine Aggregate, dune sand 232.0 231.9 231.7 231.6 231.4
Admixture - plasticizer 6.9 6.9 6.9 6.9 6.9
Rebar 100 105 110 115 120
Total 2,526 2,529 2,533 2,536 2,539
Table 6: Material Content for Precast Beams – kg per m3 product
Material
RAKP/CM/001
Rebar = 100
kg/m3
Rebar = 110 kg/m3
Rebar = 120 kg/m3
Rebar = 130 kg/m3
Rebar = 140 kg/m3
Rebar = 150 kg/m3
Water 164.9 164.7 164.4 164.2 164.0 163.8
Portland Cement 153.0 152.8 152.6 152.4 152.2 152.0
Slag Cement (GGBFS) 278.4 278.0 277.7 277.3 277.0 276.6
Silica Fume 32.6 32.5 32.5 32.5 32.4 32.4
Crushed Coarse Aggregate, 20mm 671.3 670.5 669.6 668.7 667.9 667.0
Crushed Coarse Aggregate, 10mm 325.8 325.4 325.0 324.5 324.1 323.7
Crushed Fine Aggregate, 0-5mm 602.2 601.5 600.7 599.9 599.1 598.3
Natural Fine Aggregate, dune sand 236.9 236.6 236.3 236.0 235.7 235.4
Admixture - plasticizer 6.9 6.9 6.9 6.9 6.9 6.9
Rebar 100 110 120 130 140 150
Total 2,572 2,579 2,586 2,593 2,599 2,606
Table 7: Material Content for Precast Beams – kg per m3 product (cont.)
Material
RAKP/CM/006
Rebar = 100 kg/m3
Rebar = 110 kg/m3
Rebar = 120 kg/m3
Rebar = 130 kg/m3
Rebar = 140 kg/m3
Rebar = 150 kg/m3
Water 156.0 155.8 155.6 155.4 155.2 155.0
Portland Cement 199.4 199.2 198.9 198.7 198.4 198.1
Slag Cement (GGBFS) 232.0 231.7 231.4 231.1 230.8 230.5
Silica Fume 32.6 32.5 32.5 32.5 32.4 32.4
Crushed Coarse Aggregate, 20mm 582.5 581.7 581.0 580.2 579.5 578.7
Crushed Coarse Aggregate, 10mm 414.6 414.1 413.6 413.0 412.5 412.0
Crushed Fine Aggregate, 0-5mm 552.9 552.2 551.4 550.7 550.0 549.3
Natural Fine Aggregate, dune sand 246.8 246.5 246.2 245.9 245.5 245.2
Admixture - superplasticizer 5.9 5.9 5.9 5.9 5.9 5.9
Rebar 100 110 120 130 140 150
Total 2,523 2,530 2,536 2,543 2,550 2,557

8
Environmental Product Declaration
Table 8: Material Content for Prestressed Beams – kg per m3 product
Material RAKP/CM/005
Rebar = 100 kg/m3
Rebar = 110 kg/m3
Rebar = 120 kg/m3
Rebar = 130 kg/m3
Rebar = 140 kg/m3
Rebar = 150 kg/m3
Water 150.1 149.9 149.7 149.5 149.3 149.1
Portland Cement 120.4 120.3 120.1 120.0 119.8 119.7
Slag Cement (GGBFS) 289.3 288.9 288.5 288.1 287.8 287.4
Silica Fume 35.5 35.5 35.4 35.4 35.4 35.3
Crushed Coarse Aggregate, 20mm 588.4 587.6 586.9 586.1 585.4 584.6
Crushed Coarse Aggregate, 10mm 422.5 422.0 421.5 420.9 420.4 419.8
Crushed Fine Aggregate, 0-5mm 554.8 554.1 553.4 552.7 552.0 551.3
Natural Fine Aggregate, dune sand 246.8 246.5 246.2 245.9 245.5 245.2
Admixture - superplasticizer 5.9 5.9 5.9 5.9 5.9 5.9
Rebar 100 110 120 130 140 150
Total 2,514 2,521 2,528 2,535 2,541 2,548
Table 9: Material Content for Prestressed Girders – kg per m3 product
Material RAKP/CM/005
Rebar = 200 kg/m3
Rebar = 210 kg/m3
Rebar = 220 kg/m3
Rebar = 230 kg/m3
Rebar = 240 kg/m3
Rebar = 250 kg/m3
Water 148.1 147.9 147.7 147.5 147.4 147.2
Portland Cement 118.9 118.7 118.6 118.4 118.3 118.1
Slag Cement (GGBFS) 285.5 285.2 284.8 284.4 284.0 283.7
Silica Fume 35.1 35.0 35.0 34.9 34.9 34.9
Crushed Coarse Aggregate, 20mm 580.8 580.1 579.3 578.5 577.8 577.0
Crushed Coarse Aggregate, 10mm 417.1 416.6 416.0 415.5 414.9 414.4
Crushed Fine Aggregate, 0-5mm 547.7 547.0 546.2 545.5 544.8 544.1
Natural Fine Aggregate, dune sand 243.6 243.3 243.0 242.7 242.4 242.0
Admixture - superplasticizer 5.8 5.8 5.8 5.8 5.8 5.8
Rebar 200 210 220 230 240 250
Total 2,583 2,590 2,596 2,603 2,610 2,617
Table 10: Material Content for Precast Columns – kg per m3 product
Material RAKP/CM/006
Rebar = 100 kg/m3
Rebar = 110 kg/m3
Rebar = 120 kg/m3
Rebar = 130 kg/m3
Rebar = 140 kg/m3
Rebar = 150 kg/m3
Water 156.0 155.8 155.6 155.4 155.2 155.0
Portland Cement 199.4 199.2 198.9 198.7 198.4 198.1
Slag Cement (GGBFS) 232.0 231.7 231.4 231.1 230.8 230.5
Silica Fume 32.6 32.5 32.5 32.5 32.4 32.4
Crushed Coarse Aggregate, 20mm 582.5 581.7 581.0 580.2 579.5 578.7
Crushed Coarse Aggregate, 10mm 414.6 414.1 413.6 413.0 412.5 412.0
Crushed Fine Aggregate, 0-5mm 552.9 552.2 551.4 550.7 550.0 549.3
Natural Fine Aggregate, dune sand 246.8 246.5 246.2 245.9 245.5 245.2
Admixture - superplasticizer 5.9 5.9 5.9 5.9 5.9 5.9
Rebar 100 110 120 130 140 150
Total 2,523 2,530 2,536 2,543 2,550 2,557

9
Environmental Product Declaration
Table 11: Material Content for Precast Footings – kg per m3 product
Material RAKP/CM/003 RAKP/CM/006
Rebar = 70 kg/m3
Rebar = 75 kg/m3
Rebar = 80 kg/m3
Rebar = 70 kg/m3
Rebar = 75 kg/m3
Rebar = 80 kg/m3
Water 149.7 149.6 149.5 156.6 156.5 156.4
Portland Cement 245.8 245.6 245.5 200.2 200.1 199.9
Slag Cement (GGBFS) 149.7 149.6 149.5 232.9 232.8 232.6
Silica Fume 20.8 20.8 20.8 32.7 32.7 32.7
Crushed Coarse Aggregate, 20mm 683.8 683.4 683.0 584.7 584.4 584.0
Crushed Coarse Aggregate, 10mm 327.1 326.8 326.6 416.3 416.0 415.7
Crushed Fine Aggregate, 0-5mm 614.5 614.1 613.7 555.0 554.6 554.3
Natural Fine Aggregate, dune sand 237.9 237.7 237.6 247.8 247.6 247.5
Admixture - plasticizer 5.9 5.9 5.9 0.0 0.0 0.0
Admixture - superplasticizer 0.0 0.0 0.0 5.9 5.9 5.9
Rebar 70 75 80 70 75 80
Total 2,505 2,509 2,512 2,502 2,506 2,509
Table 12: Material Content for Precast Stairs – kg per m3 product
Material RAKP/CM/001
Rebar = 80 kg/m3
Rebar = 85 kg/m3
Rebar = 90 kg/m3
Rebar = 95 kg/m3
Rebar = 100 kg/m3
Water 165.3 165.2 165.1 165.0 164.9
Portland Cement 153.4 153.3 153.2 153.1 153.0
Slag Cement (GGBFS) 279.1 278.9 278.8 278.6 278.4
Silica Fume 32.7 32.6 32.6 32.6 32.6
Crushed Coarse Aggregate, 20mm 673.1 672.6 672.2 671.8 671.3
Crushed Coarse Aggregate, 10mm 326.6 326.4 326.2 326.0 325.8
Crushed Fine Aggregate, 0-5mm 603.8 603.4 603.0 602.6 602.2
Natural Fine Aggregate, dune sand 237.6 237.4 237.2 237.1 236.9
Admixture - plasticizer 6.9 6.9 6.9 6.9 6.9
Rebar 80 85 90 95 100
EPS Insulation 0.0 0.0 0.0 0.0 0.0
Total 2,558 2,562 2,565 2,569 2,572
10
Environmental Product Declaration
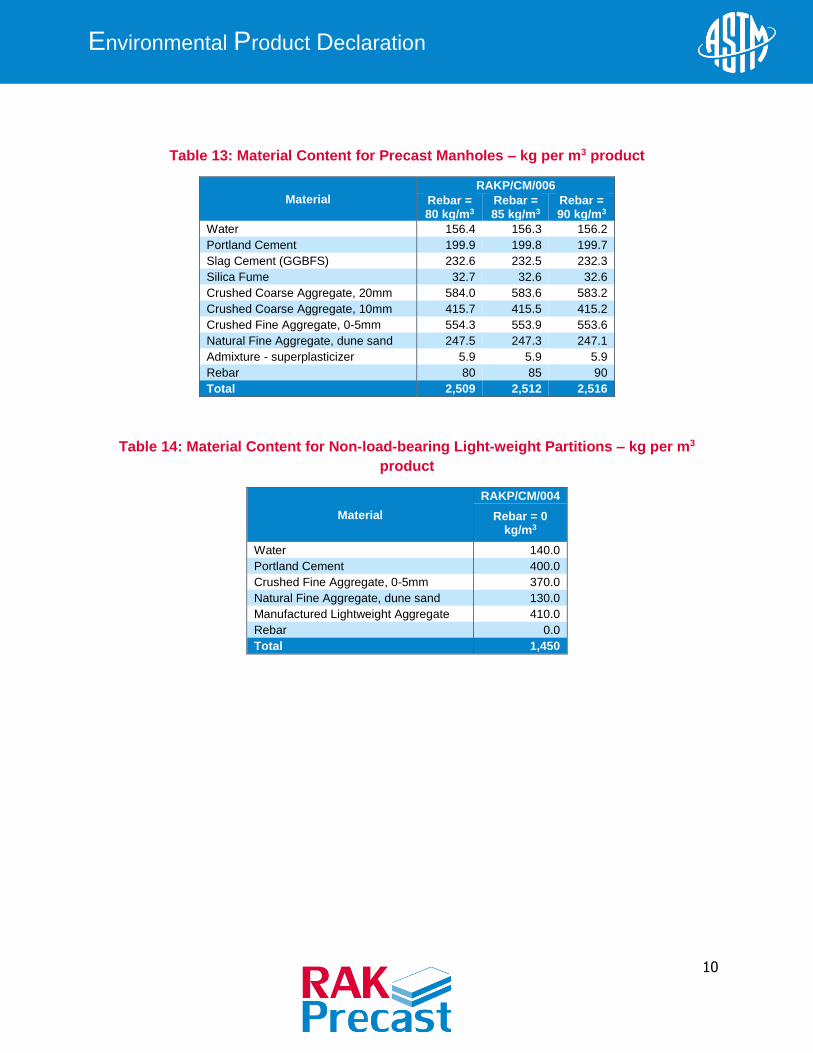
Table 13: Material Content for Precast Manholes – kg per m3 product
Material RAKP/CM/006
Rebar = 80 kg/m3
Rebar = 85 kg/m3
Rebar = 90 kg/m3
Water 156.4 156.3 156.2
Portland Cement 199.9 199.8 199.7
Slag Cement (GGBFS) 232.6 232.5 232.3
Silica Fume 32.7 32.6 32.6
Crushed Coarse Aggregate, 20mm 584.0 583.6 583.2
Crushed Coarse Aggregate, 10mm 415.7 415.5 415.2
Crushed Fine Aggregate, 0-5mm 554.3 553.9 553.6
Natural Fine Aggregate, dune sand 247.5 247.3 247.1
Admixture - superplasticizer 5.9 5.9 5.9
Rebar 80 85 90
Total 2,509 2,512 2,516
Table 14: Material Content for Non-load-bearing Light-weight Partitions – kg per m3
product
Material
RAKP/CM/004
Rebar = 0 kg/m3
Water 140.0
Portland Cement 400.0
Crushed Fine Aggregate, 0-5mm 370.0
Natural Fine Aggregate, dune sand 130.0
Manufactured Lightweight Aggregate 410.0
Rebar 0.0
Total 1,450

11
Environmental Product Declaration
SYSTEM BOUNDARY
As per the ASTM PCR, the system boundary is the product stage, which includes the following
modules:
A1 Raw material supply;
A2 Transport (to the manufacturer); and
A3 Manufacturing.
Figure 2 shows the production stage system boundary for precast concrete products.
Figure 2: Product Stage (module A1 to A3) System Boundary
12
Environmental Product Declaration
LIFE CYCLE ASSESSMENT
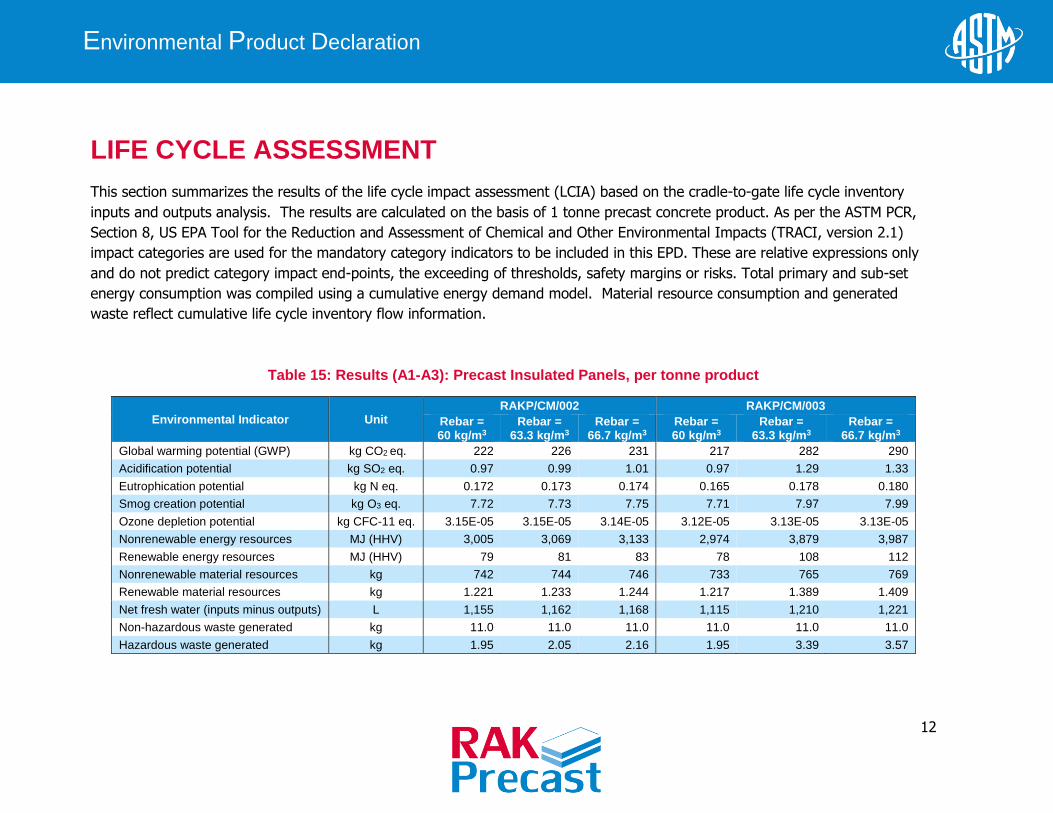
This section summarizes the results of the life cycle impact assessment (LCIA) based on the cradle-to-gate life cycle inventory
inputs and outputs analysis. The results are calculated on the basis of 1 tonne precast concrete product. As per the ASTM PCR,
Section 8, US EPA Tool for the Reduction and Assessment of Chemical and Other Environmental Impacts (TRACI, version 2.1)
impact categories are used for the mandatory category indicators to be included in this EPD. These are relative expressions only
and do not predict category impact end-points, the exceeding of thresholds, safety margins or risks. Total primary and sub-set
energy consumption was compiled using a cumulative energy demand model. Material resource consumption and generated
waste reflect cumulative life cycle inventory flow information.
Table 15: Results (A1-A3): Precast Insulated Panels, per tonne product
Environmental Indicator Unit RAKP/CM/002 RAKP/CM/003
Rebar = 60 kg/m3
Rebar = 63.3 kg/m3
Rebar = 66.7 kg/m3
Rebar = 60 kg/m3
Rebar = 63.3 kg/m3
Rebar = 66.7 kg/m3
Global warming potential (GWP) kg CO2 eq. 222 226 231 217 282 290
Acidification potential kg SO2 eq. 0.97 0.99 1.01 0.97 1.29 1.33
Eutrophication potential kg N eq. 0.172 0.173 0.174 0.165 0.178 0.180
Smog creation potential kg O3 eq. 7.72 7.73 7.75 7.71 7.97 7.99
Ozone depletion potential kg CFC-11 eq. 3.15E-05 3.15E-05 3.14E-05 3.12E-05 3.13E-05 3.13E-05
Nonrenewable energy resources MJ (HHV) 3,005 3,069 3,133 2,974 3,879 3,987
Renewable energy resources MJ (HHV) 79 81 83 78 108 112
Nonrenewable material resources kg 742 744 746 733 765 769
Renewable material resources kg 1.221 1.233 1.244 1.217 1.389 1.409
Net fresh water (inputs minus outputs) L 1,155 1,162 1,168 1,115 1,210 1,221
Non-hazardous waste generated kg 11.0 11.0 11.0 11.0 11.0 11.0
Hazardous waste generated kg 1.95 2.05 2.16 1.95 3.39 3.57

13
Environmental Product Declaration
Table 16: Results (A1-A3): Precast Non-insulated Panels, per tonne product
Environmental Indicator Unit RAKP/CM/002 RAKP/CM/003
Rebar = 80 kg/m3
Rebar = 85 kg/m3
Rebar = 80 kg/m3
Rebar = 85 kg/m3
Global warming potential (GWP) kg CO2 eq. 245 250 238 243
Acidification potential kg SO2 eq. 1.07 1.09 1.06 1.09
Eutrophication potential kg N eq. 0.211 0.212 0.201 0.202
Smog creation potential kg O3 eq. 9.67 9.68 9.65 9.67
Ozone depletion potential kg CFC-11 eq. 4.59E-05 4.59E-05 4.55E-05 4.55E-05
Nonrenewable energy resources MJ (HHV) 2,951 3,014 2,903 2,966
Renewable energy resources MJ (HHV) 81 83 81 83
Nonrenewable material resources kg 1,086 1,088 1,073 1,074
Renewable material resources kg 1.510 1.522 1.505 1.516
Net fresh water (inputs minus outputs) L 1,074 1,080 1,014 1,020
Non-hazardous waste generated kg 16.5 16.5 16.5 16.5
Hazardous waste generated kg 1.78 1.89 1.78 1.88
Table 17: Results (A1-A3): Precast Solid Slabs, per tonne product
Environmental Indicator Unit RAKP/CM/001
Rebar = 100 kg/m3
Rebar = 105 kg/m3
Rebar = 110 kg/m3
Rebar = 115 kg/m3
Rebar = 120 kg/m3
Global warming potential (GWP) kg CO2 eq. 225 229 234 238 243
Acidification potential kg SO2 eq. 1.21 1.23 1.25 1.27 1.30
Eutrophication potential kg N eq. 0.162 0.162 0.163 0.164 0.165
Smog creation potential kg O3 eq. 9.65 9.67 9.68 9.69 9.70
Ozone depletion potential kg CFC-11 eq. 4.30E-05 4.29E-05 4.29E-05 4.29E-05 4.29E-05
Nonrenewable energy resources MJ (HHV) 2,977 3,038 3,099 3,159 3,220
Renewable energy resources MJ (HHV) 90 92 94 96 98
Nonrenewable material resources kg 1,049 1,051 1,052 1,054 1,055
Renewable material resources kg 1.498 1.509 1.520 1.531 1.542
Net fresh water (inputs minus outputs) L 755 761 767 773 779
Non-hazardous waste generated kg 16.5 16.5 16.5 16.5 16.5
Hazardous waste generated kg 2.15 2.25 2.35 2.45 2.54

14
Environmental Product Declaration
Table 18: Results (A1-A3): Precast Solid Slabs, per tonne product (cont.)
Environmental Indicator Unit RAKP/CM/007
Rebar = 100 kg/m3
Rebar = 105 kg/m3
Rebar = 110 kg/m3
Rebar = 115 kg/m3
Rebar = 120 kg/m3
Global warming potential (GWP) kg CO2 eq. 265 269 273 278 282
Acidification potential kg SO2 eq. 1.20 1.23 1.25 1.27 1.29
Eutrophication potential kg N eq. 0.216 0.217 0.218 0.218 0.219
Smog creation potential kg O3 eq. 10.31 10.32 10.33 10.35 10.36
Ozone depletion potential kg CFC-11 eq. 4.55E-05 4.54E-05 4.54E-05 4.54E-05 4.54E-05
Nonrenewable energy resources MJ (HHV) 3,227 3,289 3,351 3,412 3,474
Renewable energy resources MJ (HHV) 90 92 94 96 98
Nonrenewable material resources kg 1,075 1,076 1,078 1,080 1,081
Renewable material resources kg 1.554 1.565 1.576 1.587 1.598
Net fresh water (inputs minus outputs) L 1,097 1,103 1,109 1,115 1,121
Non-hazardous waste generated kg 16.5 16.5 16.5 16.5 16.5
Hazardous waste generated kg 2.19 2.29 2.39 2.49 2.59
Table 19: Results (A1-A3): Precast Beams, per tonne product
Environmental Indicator Unit RAKP/CM/001
Rebar = 100 kg/m3
Rebar = 110 kg/m3
Rebar = 120 kg/m3
Rebar = 130 kg/m3
Rebar = 140 kg/m3
Rebar = 150 kg/m3
Global warming potential (GWP) kg CO2 eq. 225 234 243 251 260 268
Acidification potential kg SO2 eq. 1.21 1.25 1.30 1.34 1.38 1.42
Eutrophication potential kg N eq. 0.162 0.163 0.165 0.166 0.168 0.170
Smog creation potential kg O3 eq. 9.65 9.68 9.70 9.73 9.75 9.77
Ozone depletion potential kg CFC-11 eq. 4.30E-05 4.29E-05 4.29E-05 4.28E-05 4.28E-05 4.28E-05
Nonrenewable energy resources MJ (HHV) 2,977 3,099 3,220 3,340 3,460 3,579
Renewable energy resources MJ (HHV) 90 94 98 102 106 109
Nonrenewable material resources kg 1,049 1,052 1,055 1,059 1,062 1,065
Renewable material resources kg 1.498 1.520 1.542 1.563 1.585 1.606
Net fresh water (inputs minus outputs) L 755 767 779 791 803 815
Non-hazardous waste generated kg 16.5 16.5 16.5 16.5 16.4 16.4
Hazardous waste generated kg 2.15 2.35 2.54 2.74 2.93 3.13
15
Environmental Product Declaration
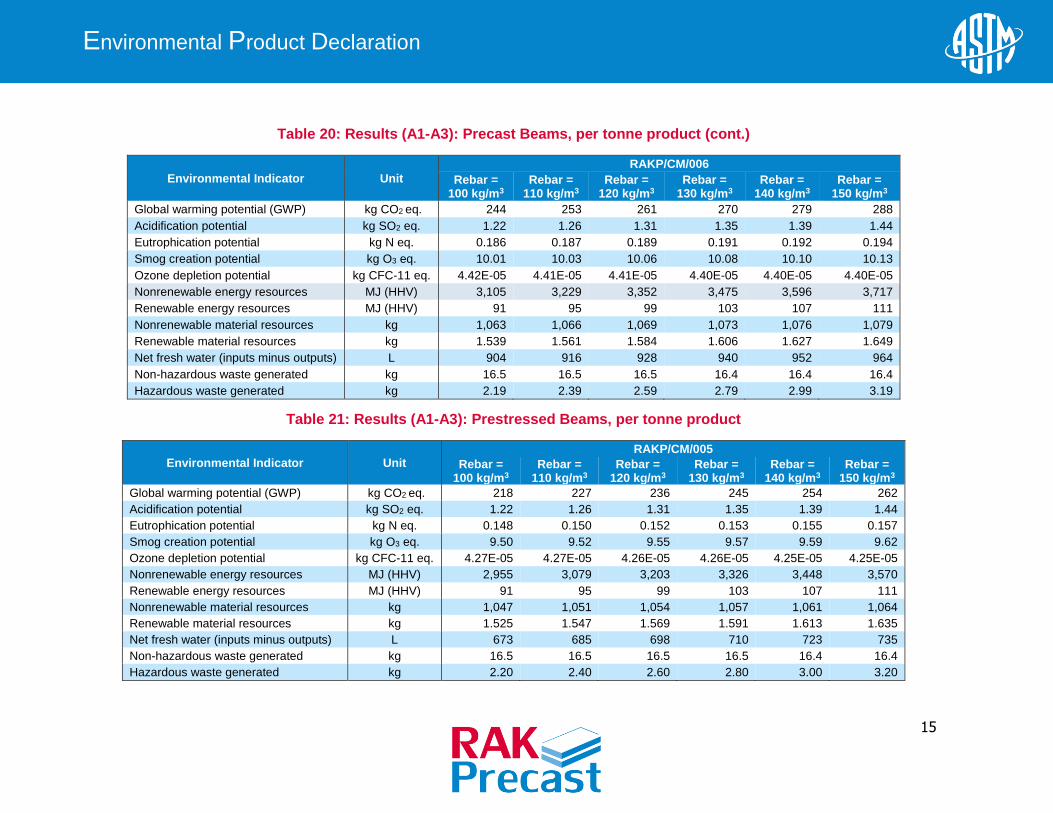
Table 20: Results (A1-A3): Precast Beams, per tonne product (cont.)
Environmental Indicator Unit
RAKP/CM/006
Rebar = 100 kg/m3
Rebar = 110 kg/m3
Rebar = 120 kg/m3
Rebar = 130 kg/m3
Rebar = 140 kg/m3
Rebar = 150 kg/m3
Global warming potential (GWP) kg CO2 eq. 244 253 261 270 279 288
Acidification potential kg SO2 eq. 1.22 1.26 1.31 1.35 1.39 1.44
Eutrophication potential kg N eq. 0.186 0.187 0.189 0.191 0.192 0.194
Smog creation potential kg O3 eq. 10.01 10.03 10.06 10.08 10.10 10.13
Ozone depletion potential kg CFC-11 eq. 4.42E-05 4.41E-05 4.41E-05 4.40E-05 4.40E-05 4.40E-05
Nonrenewable energy resources MJ (HHV) 3,105 3,229 3,352 3,475 3,596 3,717
Renewable energy resources MJ (HHV) 91 95 99 103 107 111
Nonrenewable material resources kg 1,063 1,066 1,069 1,073 1,076 1,079
Renewable material resources kg 1.539 1.561 1.584 1.606 1.627 1.649
Net fresh water (inputs minus outputs) L 904 916 928 940 952 964
Non-hazardous waste generated kg 16.5 16.5 16.5 16.4 16.4 16.4
Hazardous waste generated kg 2.19 2.39 2.59 2.79 2.99 3.19
Table 21: Results (A1-A3): Prestressed Beams, per tonne product
Environmental Indicator Unit RAKP/CM/005
Rebar = 100 kg/m3
Rebar = 110 kg/m3
Rebar = 120 kg/m3
Rebar = 130 kg/m3
Rebar = 140 kg/m3
Rebar = 150 kg/m3
Global warming potential (GWP) kg CO2 eq. 218 227 236 245 254 262
Acidification potential kg SO2 eq. 1.22 1.26 1.31 1.35 1.39 1.44
Eutrophication potential kg N eq. 0.148 0.150 0.152 0.153 0.155 0.157
Smog creation potential kg O3 eq. 9.50 9.52 9.55 9.57 9.59 9.62
Ozone depletion potential kg CFC-11 eq. 4.27E-05 4.27E-05 4.26E-05 4.26E-05 4.25E-05 4.25E-05
Nonrenewable energy resources MJ (HHV) 2,955 3,079 3,203 3,326 3,448 3,570
Renewable energy resources MJ (HHV) 91 95 99 103 107 111
Nonrenewable material resources kg 1,047 1,051 1,054 1,057 1,061 1,064
Renewable material resources kg 1.525 1.547 1.569 1.591 1.613 1.635
Net fresh water (inputs minus outputs) L 673 685 698 710 723 735
Non-hazardous waste generated kg 16.5 16.5 16.5 16.5 16.4 16.4
Hazardous waste generated kg 2.20 2.40 2.60 2.80 3.00 3.20
16
Environmental Product Declaration
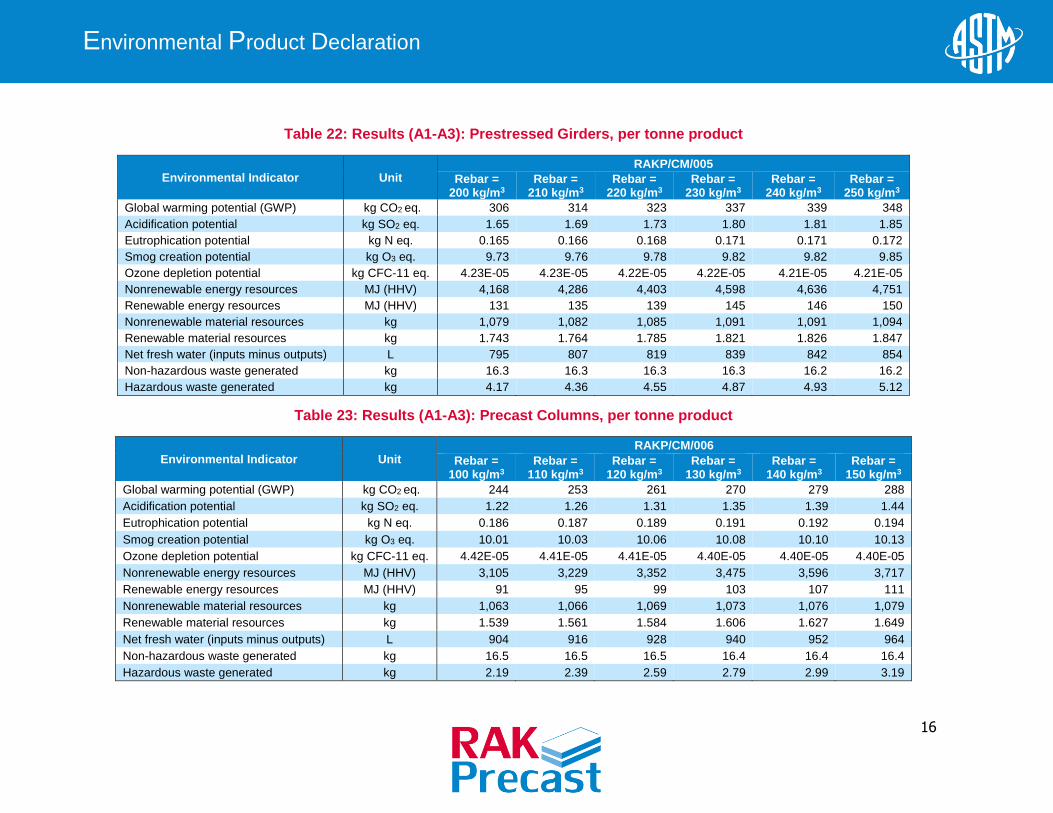
Table 22: Results (A1-A3): Prestressed Girders, per tonne product
Environmental Indicator Unit RAKP/CM/005
Rebar = 200 kg/m3
Rebar = 210 kg/m3
Rebar = 220 kg/m3
Rebar = 230 kg/m3
Rebar = 240 kg/m3
Rebar = 250 kg/m3
Global warming potential (GWP) kg CO2 eq. 306 314 323 337 339 348
Acidification potential kg SO2 eq. 1.65 1.69 1.73 1.80 1.81 1.85
Eutrophication potential kg N eq. 0.165 0.166 0.168 0.171 0.171 0.172
Smog creation potential kg O3 eq. 9.73 9.76 9.78 9.82 9.82 9.85
Ozone depletion potential kg CFC-11 eq. 4.23E-05 4.23E-05 4.22E-05 4.22E-05 4.21E-05 4.21E-05
Nonrenewable energy resources MJ (HHV) 4,168 4,286 4,403 4,598 4,636 4,751
Renewable energy resources MJ (HHV) 131 135 139 145 146 150
Nonrenewable material resources kg 1,079 1,082 1,085 1,091 1,091 1,094
Renewable material resources kg 1.743 1.764 1.785 1.821 1.826 1.847
Net fresh water (inputs minus outputs) L 795 807 819 839 842 854
Non-hazardous waste generated kg 16.3 16.3 16.3 16.3 16.2 16.2
Hazardous waste generated kg 4.17 4.36 4.55 4.87 4.93 5.12
Table 23: Results (A1-A3): Precast Columns, per tonne product
Environmental Indicator Unit RAKP/CM/006
Rebar = 100 kg/m3
Rebar = 110 kg/m3
Rebar = 120 kg/m3
Rebar = 130 kg/m3
Rebar = 140 kg/m3
Rebar = 150 kg/m3
Global warming potential (GWP) kg CO2 eq. 244 253 261 270 279 288
Acidification potential kg SO2 eq. 1.22 1.26 1.31 1.35 1.39 1.44
Eutrophication potential kg N eq. 0.186 0.187 0.189 0.191 0.192 0.194
Smog creation potential kg O3 eq. 10.01 10.03 10.06 10.08 10.10 10.13
Ozone depletion potential kg CFC-11 eq. 4.42E-05 4.41E-05 4.41E-05 4.40E-05 4.40E-05 4.40E-05
Nonrenewable energy resources MJ (HHV) 3,105 3,229 3,352 3,475 3,596 3,717
Renewable energy resources MJ (HHV) 91 95 99 103 107 111
Nonrenewable material resources kg 1,063 1,066 1,069 1,073 1,076 1,079
Renewable material resources kg 1.539 1.561 1.584 1.606 1.627 1.649
Net fresh water (inputs minus outputs) L 904 916 928 940 952 964
Non-hazardous waste generated kg 16.5 16.5 16.5 16.4 16.4 16.4
Hazardous waste generated kg 2.19 2.39 2.59 2.79 2.99 3.19

17
Environmental Product Declaration
Table 24: Results (A1-A3): Precast Footings, per tonne product
Environmental Indicator Unit RAKP/CM/003 RAKP/CM/006
Rebar = 70 kg/m3
Rebar = 75 kg/m3
Rebar = 80 kg/m3
Rebar = 70 kg/m3
Rebar = 75 kg/m3
Rebar = 80 kg/m3
Global warming potential (GWP) kg CO2 eq. 229 233 238 217 221 226
Acidification potential kg SO2 eq. 1.02 1.04 1.06 1.09 1.11 1.13
Eutrophication potential kg N eq. 0.199 0.200 0.201 0.181 0.182 0.182
Smog creation potential kg O3 eq. 9.63 9.64 9.65 9.94 9.95 9.96
Ozone depletion potential kg CFC-11 eq. 4.55E-05 4.55E-05 4.55E-05 4.43E-05 4.43E-05 4.42E-05
Nonrenewable energy resources MJ (HHV) 2,778 2,841 2,903 2,730 2,793 2,856
Renewable energy resources MJ (HHV) 77 79 81 78 80 82
Nonrenewable material resources kg 1,069 1,071 1,073 1,053 1,055 1,056
Renewable material resources kg 1.482 1.494 1.505 1.472 1.483 1.494
Net fresh water (inputs minus outputs) L 1,002 1,008 1,014 867 873 879
Non-hazardous waste generated kg 16.6 16.6 16.5 16.6 16.6 16.5
Hazardous waste generated kg 1.58 1.68 1.78 1.58 1.68 1.79
Table 25: Results (A1-A3): Precast Stairs, per tonne product
Environmental Indicator Unit RAKP/CM/001
Rebar = 80 kg/m3
Rebar = 85 kg/m3
Rebar = 90 kg/m3
Rebar = 95 kg/m3
Rebar = 100 kg/m3
Global warming potential (GWP) kg CO2 eq. 207 212 216 221 225
Acidification potential kg SO2 eq. 1.12 1.15 1.17 1.19 1.21
Eutrophication potential kg N eq. 0.158 0.159 0.160 0.161 0.162
Smog creation potential kg O3 eq. 9.61 9.62 9.63 9.64 9.65
Ozone depletion potential kg CFC-11 eq. 4.30E-05 4.30E-05 4.30E-05 4.30E-05 4.30E-05
Nonrenewable energy resources MJ (HHV) 2,732 2,794 2,855 2,916 2,977
Renewable energy resources MJ (HHV) 82 84 86 88 90
Nonrenewable material resources kg 1,043 1,044 1,046 1,048 1,049
Renewable material resources kg 1.454 1.465 1.476 1.487 1.498
Net fresh water (inputs minus outputs) L 730 736 742 749 755
Non-hazardous waste generated kg 16.6 16.5 16.5 16.5 16.5
Hazardous waste generated kg 1.75 1.85 1.95 2.05 2.15

18
Environmental Product Declaration
Table 26: Results (A1-A3): Precast Manholes, per tonne product
Environmental Indicator Unit RAKP/CM/006
Rebar = 80 kg/m3
Rebar = 85 kg/m3
Rebar = 90 kg/m3
Global warming potential (GWP) kg CO2 eq. 226 230 235
Acidification potential kg SO2 eq. 1.13 1.15 1.18
Eutrophication potential kg N eq. 0.182 0.183 0.184
Smog creation potential kg O3 eq. 9.96 9.97 9.98
Ozone depletion potential kg CFC-11 eq. 4.42E-05 4.42E-05 4.42E-05
Nonrenewable energy resources MJ (HHV) 2,856 2,918 2,981
Renewable energy resources MJ (HHV) 82 85 87
Nonrenewable material resources kg 1,056 1,058 1,060
Renewable material resources kg 1.494 1.505 1.517
Net fresh water (inputs minus outputs) L 879 885 892
Non-hazardous waste generated kg 16.5 16.5 16.5
Hazardous waste generated kg 1.79 1.89 1.99
Table 27: Results (A1-A3): Precast Non-load-bearing Light-weight Partitions, per tonne product
Environmental Indicator Unit RAKP/CM/004
Rebar = 0 kg/m3
Global warming potential (GWP) kg CO2 eq. 477
Acidification potential kg SO2 eq. 1.959
Eutrophication potential kg N eq. 0.732
Smog creation potential kg O3 eq. 24.00
Ozone depletion potential kg CFC-11 eq. 5.87E-05
Nonrenewable energy resources MJ (HHV) 4,567
Renewable energy resources MJ (HHV) 175
Nonrenewable material resources kg 1,142
Renewable material resources kg 5.750
Net fresh water (inputs minus outputs) L 2,426
Non-hazardous waste generated kg 16.5
Hazardous waste generated kg 0.19