Embed Size (px)
Citation preview

i
D-LACTIC ACIDOSIS: STUDIES IN NEONATAL DIARRHEA
AND EFFECTS OF PROCESSING AND STORAGE ON
LACTATE CONCENTRATIONS IN BLOOD
A Thesis Submitted to the College of
Graduate Studies and Research
in Partial Fulfillment of the Requirements
for the Degree of Master of Science
in the Division of Nutrition and Dietetics,
College of Pharmacy and Nutrition
University of Saskatchewan
Saskatoon, Saskatchewan
Canada
By
Jennifer Beth Wright
©Copyright Jennifer Beth Wright, February 2012. All rights reserved.

i
PERMISSION TO USE
In presenting this thesis in partial fulfillment of the requirements for a Postgraduate
degree from the University of Saskatchewan, I agree that the Libraries of this University may
make it freely available for inspection. I further agree that permission for copying of this thesis
in any manner, in whole or in part, for scholarly purposes may be granted by the professor who
supervised my thesis work or, in their absence, by the Dean of the College in which my thesis
work was done. It is understood that any copying or publication or use of this thesis or parts
thereof for financial gain shall not be allowed without my written permission. It is also
understood that due recognition shall be given to me and to the University of Saskatchewan in
any scholarly use which may be made of any material in my thesis.
Requests for permission to copy or to make other use of material in this thesis in whole or
part should be addressed to:
Dean of the College of Pharmacy and Nutrition
110 Science Place
University of Saskatchewan
Saskatoon, Saskatchewan
S7N 5C9

ii
ABSTRACT
D-lactate is a significant contributor to acidosis in diarrheic calves. To ensure an accurate
measure of D- and L- lactate, this study investigated storage dependent changes in D- and L-
lactate concentrations in plasma and serum over time with or without prolonged contact with
blood cells. Further studies investigated if D-lactic acidosis occurs in children with diarrhea and
if a fecal threshold exists in the gastrointestinal tract at which D-lactate enters the systemic
circulation in diarrheic calves.
To determine the stability of D- and L-lactate, blood was obtained from eleven healthy
calves. D- and L-lactate concentrations in all samples separated following collection (serum,
plasma, spiked, untreated) were stable up to 48 hours. L-Lactate concentrations increased
significantly (P < 0.05) by 74.4%, 39.4%, and 40.2% in untreated and spiked serum and spiked
plasma respectively at 48 hours when stored in contact with blood cells. D-Lactate
concentrations in untreated serum stored in contact with blood cells increased significantly, by
82.3%, at 48 hours. For accurate measurements of D- and L-lactate, serum or plasma should
separated from blood cells as soon as possible but can thereafter be stored at 4°C for up to 48
hours.
To determine whether D-lactic acidosis occurs in children with acute diarrhea, blood
samples were obtained from nine children with acute diarrhea, ten months to three years of age.
No cases of D-lactic acidosis (> 3 mmol/L) were found, however, D-lactate concentrations ( x =
0.15) were found to be higher when compared to healthy children.
To determine if a fecal D-lactate threshold exists at which D-lactate enters the blood in
diarrheic calves, blood and fecal samples were obtained from 27 calves. The linear regression
between fecal D-lactate and serum D-lactate was statistically significant however the range of D-
lactate concentrations obtained in this study was not large enough to confirm the fecal threshold
at levels previously reported.
Collectively, these studies contribute to the knowledge of D-lactate, and D-lactic
acidosis, by determining the stability of D- and L-lactate for accurate measurement, revealing
elevated D-lactate concentrations in diarrheic children in comparison to healthy children, and
further investigation of a potential fecal D-lactate threshold.

iii
ACKNOWLEDGMENTS
I would foremost, like to thank my supervisor, Dr. Gordon Zello, for his guidance and
support throughout my graduate program. The knowledge and skills you provided me with
through this work is invaluable. I would also like to thank the members of my Advisory
Committee: Drs. Jane Alcorn, Garth Bruce, and Susan Whiting for providing expertise on all
aspects of this work. Thanks to the physicians and nurses at Royal University Hospital for their
collaboration, patient recruitment, and sample collection and to Dr. Katharina Lohmann, Kim
Burker, and the staff at the Dairy Barn for their work with the calves. This work would not have
been possible without research funding from NSERC and Vitamin Settlement Grant Canada and
personal support from the University of Saskatchewan, Elizabeth Helen McLeod Scholarship
Fund, and Global Partners II/IDRC Student Scholarship.
I would also like to thank my lab-mates: Theodosia Phillips, Marc Morris, Abdulla
Alemmari and Lindsay Tumback for their daily support and thoughtful feedback. I express
sincere gratitude to my friend, and colleague, Binbing Ling, who patiently worked with me to
develop the skills required to complete this study.
Lastly, I would like to thank my friends and family. In particular, I would like to thank
Kelly Delorme-Greyeyes who supported me in this journey from day one. Your patience, love,
and understanding are greatly appreciated. Thanks to my mother Vivian Wright, my sister Audra
Wright-Hoffman, Liam, and Tate for their support and for teaching me the importance of fun,
and the power of laughter, especially during those long work days.
This thesis is dedicated to my father, William Walter Wright, whose constant love,
support, and commitment to life-long learning has been my inspiration. Thank-you Dad.
iv
TABLE OF CONTENTS
PERMISSION TO USE ................................................................................................ i
ABSTRACT ................................................................................................................... ii
ACKNOWLEDGEMENTS ......................................................................................... iii
TABLE OF CONTENTS ............................................................................................. iv
LIST OF TABLES ........................................................................................................ vii
LIST OF FIGURES ...................................................................................................... viii
LIST OF APPENDICES .............................................................................................. x
LIST OF ABBREVIATIONS, SYMBOLS AND ACRONYMS .............................. xi
CHAPTER 1: INTRODUCTION .............................................................................. 1
1.1 Rationale ....................................................................................................... 1
1.2 Hypothesis..................................................................................................... 3
1.3 Objectives .................................................................................................... 3
CHAPTER 2: LITERATURE REVIEW.................................................................. 5
2.1 Diarrhea Pathophysiology ............................................................................. 5
2.1.1 Non-Inflammatory Diarrhea ............................................................. 5
2.1.2 Inflammatory Diarrhea...................................................................... 6
2.2 Diarrhea in Humans and Neonatal Calves .................................................... 7
2.2.1 Pediatric Diarrhea ............................................................................. 7
2.2.1.1 Global Impact of Diarrhea ................................................. 7
2.2.1.2 Defining Pediatric Diarrhea ............................................... 8
2.2.1.3 Etiology ............................................................................. 8
2.2.1.4 Prevention and Treatment ................................................. 9
2.2.2 Diarrhea in Neonatal Calves ........................................................... 12
2.2.2.1 Economic Impact ............................................................. 12
2.2.2.2 Etiology ........................................................................... 13
2.2.2.3 Prevention and Treatment ............................................... 13
2.3 Metabolic Acidosis ..................................................................................... 15

v
2.3.1 Metabolic Acidosis and Anion Gap in Diarrhea ............................. 16
2.4 Lactate ........................................................................................................ 17
2.4.1 L-Lactate and L-Lactic Acidosis .................................................... 18
2.4.2 D-Lactate and D-Lactic Acidosis ................................................... 20
2.4.2.1 D-Lactate Production ...................................................... 20
2.4.2.2 Transport and Metabolism............................................... 22
2.4.2.3 D-lactic Acidosis in Humans ........................................... 23
2.4.2.3.1 Short Bowel Syndrome ................................. 24
2.4.2.4 D-lactic Acidosis in Neonatal Animals with Diarrhea .... 25
2.5 Methodology for the Analysis of D- and L-Lactate ................................... 27
2.5.1 Enzymatic Methods ........................................................................ 27
2.6 Summary .................................................................................................... 29
CHAPTER 3: THE EFFECT OF PREANALYTICAL PROCESSING AND
STORAGE ON BLOOD D- AND L-LACTATE CONCENTRATIONS ............ 31
3.1 Introduction ................................................................................................. 31
3.2 Materials and Methods ................................................................................ 33
3.2.1 Subjects ........................................................................................... 33
3.2.2 Sample Collection and Analysis ..................................................... 33
3.2.3 Enzymatic Kit Validation ............................................................... 35
3.2.4 Statistical Analysis .......................................................................... 35
3.3 Results ........................................................................................................ 36
3.4 Discussion ................................................................................................... 44
CHAPTER 4: D-LACTIC ACIDOSIS IN PEDIATRIC DIARRHEA ................ 45
4.1 Introduction ................................................................................................. 45
4.2 Materials and Methods ............................................................................... 46
4.2.1 Study Design ................................................................................... 46
4.2.2 Study Participant Recruitment ........................................................ 47
4.2.3 Data Collection ............................................................................... 47
4.2.3.1 Medical Health Records .................................................. 47
vi
4.2.3.2 Assessment of Diarrhea Severity .................................... 48
4.2.4 Sample Collection and Analysis..................................................... 48
4.2.4.1 Blood Samples ................................................................. 48
4.2.4.2 Feces Samples ................................................................. 49
4.3 Statistical Analysis ..................................................................................... 50
4.4 Results ........................................................................................................ 50
4.5 Discussion .................................................................................................. 53
CHAPTER 5: INVESTIGATION OF A POTENTIAL D-LACTATE
THRESHOLD IN NEONATAL CALVES WITH DIARRHEA .......................... 57
5.1 Introduction ................................................................................................. 57
5.2 Materials and Methods ................................................................................ 58
5.2.1 Calves .............................................................................................. 58
5.2.2 Sample Collection and Analysis ..................................................... 59
5.2.2.1 Blood Samples ................................................................. 59
5.2.2.2 Fecal Samples .................................................................. 60
5.3 Statistical Analysis ..................................................................................... 60
5.4 Results ......................................................................................................... 61
5.5 Discussion ................................................................................................... 67
CHAPTER 6: GENERAL DISCUSSION AND CONCLUSIONS ...................... 71
REFERENCES .......................................................................................................... 75
APPENDICES ........................................................................................................... 89
Appendix A: Ethics Certificates
Appendix B: D-Lactic Acidosis in Neonatal Diarrhea (Awassa, Ethiopia)
Appendix C: Study Protocols
Appendix D: Consent Forms
Appendix E: Diarrhea Severity Tools from D-Lactic Acidosis in Pediatric
Diarrhea Study
Appendix F: Clinical Assessment Scoring Tools (Neonatal Animals)
vii
LIST OF TABLES
Table 4.1 Description of Bristol Stool Rating Scale ............................................... 48
Table 4.2 Fecal D-lactate concentrations from disposable diaper spiked with
10 mmol/L D-lactate ............................................................................... 50
Table 4.3 Age, gender, and diagnosis of children (n=9) with acute diarrhea at time
of sample collection................................................................................. 51
Table 4.4 Serum D- and L-lactate, pyruvate, and electrolyte concentrations in
children (n=9), ≤5 years of age, with acute diarrhea ............................... 52
Table 5.1 Description of Clinical Assessment Score .............................................. 59
Table 5.2 Clinical assessment scores of Quebec calves (n= 17) with diarrhea ....... 62
Table 5.3 Clinical assessment scores of University of Saskatchewan calves
(n=9) with diarrhea ................................................................................. 63
Table 5.4 Blood electrolyte concentrations in calves (n=23) with diarrhea ............ 64
Table 5.5 Serum and fecal D- and L-lactate concentrations in calves (n=26) with
diarrhea .................................................................................................... 65
viii
LIST OF FIGURES
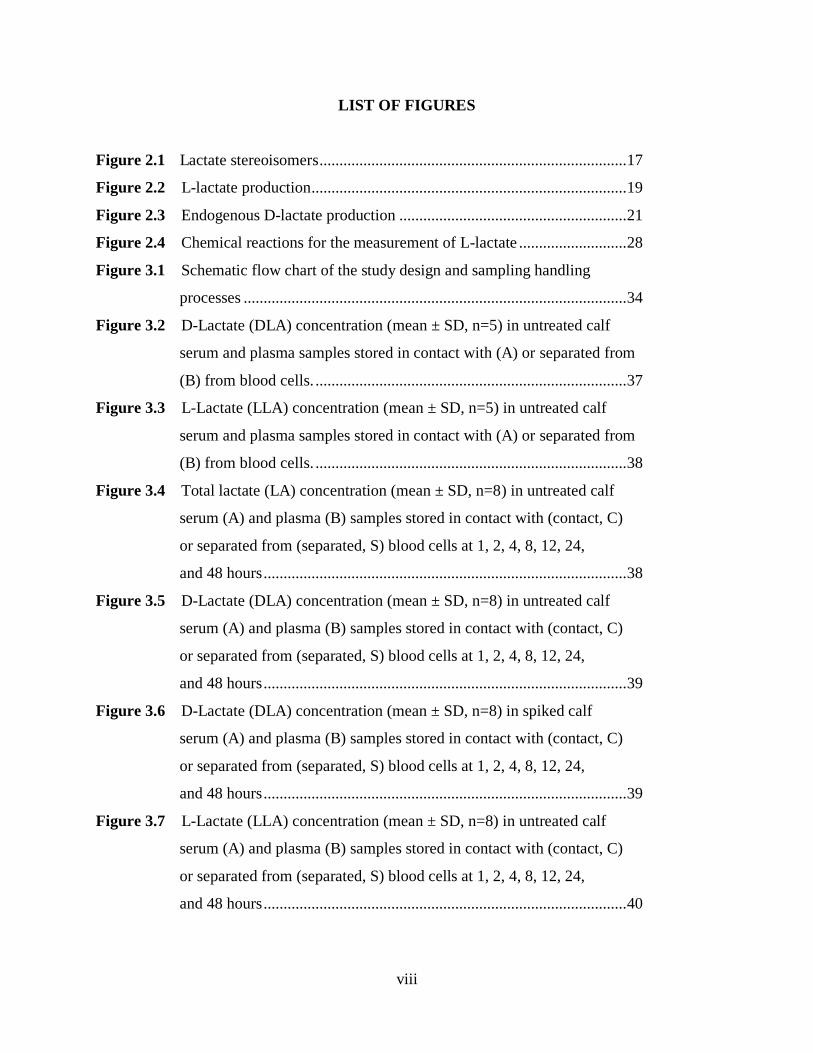
Figure 2.1 Lactate stereoisomers ............................................................................. 17
Figure 2.2 L-lactate production ............................................................................... 19
Figure 2.3 Endogenous D-lactate production ......................................................... 21
Figure 2.4 Chemical reactions for the measurement of L-lactate ........................... 28
Figure 3.1 Schematic flow chart of the study design and sampling handling
processes ................................................................................................ 34
Figure 3.2 D-Lactate (DLA) concentration (mean ± SD, n=5) in untreated calf
serum and plasma samples stored in contact with (A) or separated from
(B) from blood cells. .............................................................................. 37
Figure 3.3 L-Lactate (LLA) concentration (mean ± SD, n=5) in untreated calf
serum and plasma samples stored in contact with (A) or separated from
(B) from blood cells. .............................................................................. 38
Figure 3.4 Total lactate (LA) concentration (mean ± SD, n=8) in untreated calf
serum (A) and plasma (B) samples stored in contact with (contact, C)
or separated from (separated, S) blood cells at 1, 2, 4, 8, 12, 24,
and 48 hours ........................................................................................... 38
Figure 3.5 D-Lactate (DLA) concentration (mean ± SD, n=8) in untreated calf
serum (A) and plasma (B) samples stored in contact with (contact, C)
or separated from (separated, S) blood cells at 1, 2, 4, 8, 12, 24,
and 48 hours ........................................................................................... 39
Figure 3.6 D-Lactate (DLA) concentration (mean ± SD, n=8) in spiked calf
serum (A) and plasma (B) samples stored in contact with (contact, C)
or separated from (separated, S) blood cells at 1, 2, 4, 8, 12, 24,
and 48 hours ........................................................................................... 39
Figure 3.7 L-Lactate (LLA) concentration (mean ± SD, n=8) in untreated calf
serum (A) and plasma (B) samples stored in contact with (contact, C)
or separated from (separated, S) blood cells at 1, 2, 4, 8, 12, 24,
and 48 hours ........................................................................................... 40
ix
Figure 3.8 L-Lactate (LLA) concentration (mean ± SD, n=8) in spiked calf
serum (A) and plasma (B) samples stored in contact with (contact, C)
or separated from (separated, S) blood cells at 1, 2, 4, 8, 12, 24,
and 48 hours ........................................................................................... 40
Figure 5.1 Linear regression between fecal L-lactate and serum L-lactate
in diarrheic calves ................................................................................. 66
Figure 5.2 Linear regression between fecal D-lactate and serum D-lactate
in diarrheic calves ................................................................................. 66
Figure 5.3 Linear regression between fecal D-lactate and fecal L-lactate in
diarrheic calves ...................................................................................... 67
x
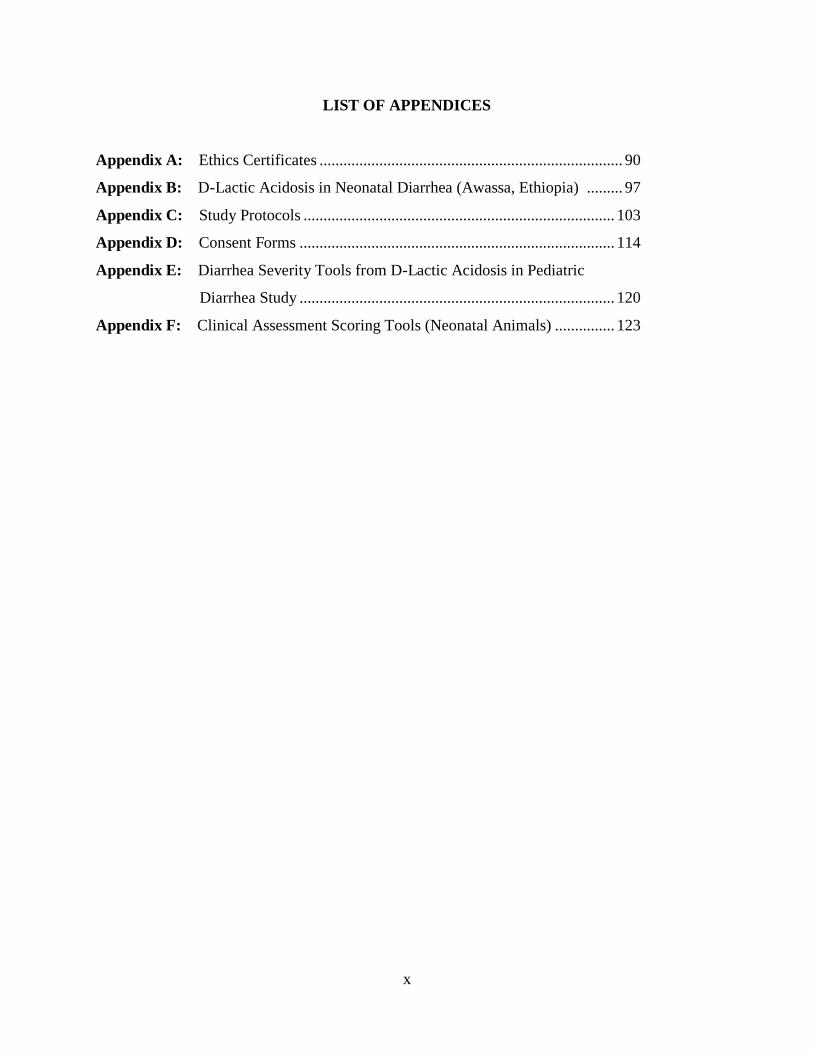
LIST OF APPENDICES
Appendix A: Ethics Certificates ............................................................................ 90
Appendix B: D-Lactic Acidosis in Neonatal Diarrhea (Awassa, Ethiopia) ......... 97
Appendix C: Study Protocols .............................................................................. 103
Appendix D: Consent Forms ............................................................................... 114
Appendix E: Diarrhea Severity Tools from D-Lactic Acidosis in Pediatric
Diarrhea Study ............................................................................... 120
Appendix F: Clinical Assessment Scoring Tools (Neonatal Animals) ............... 123
xi
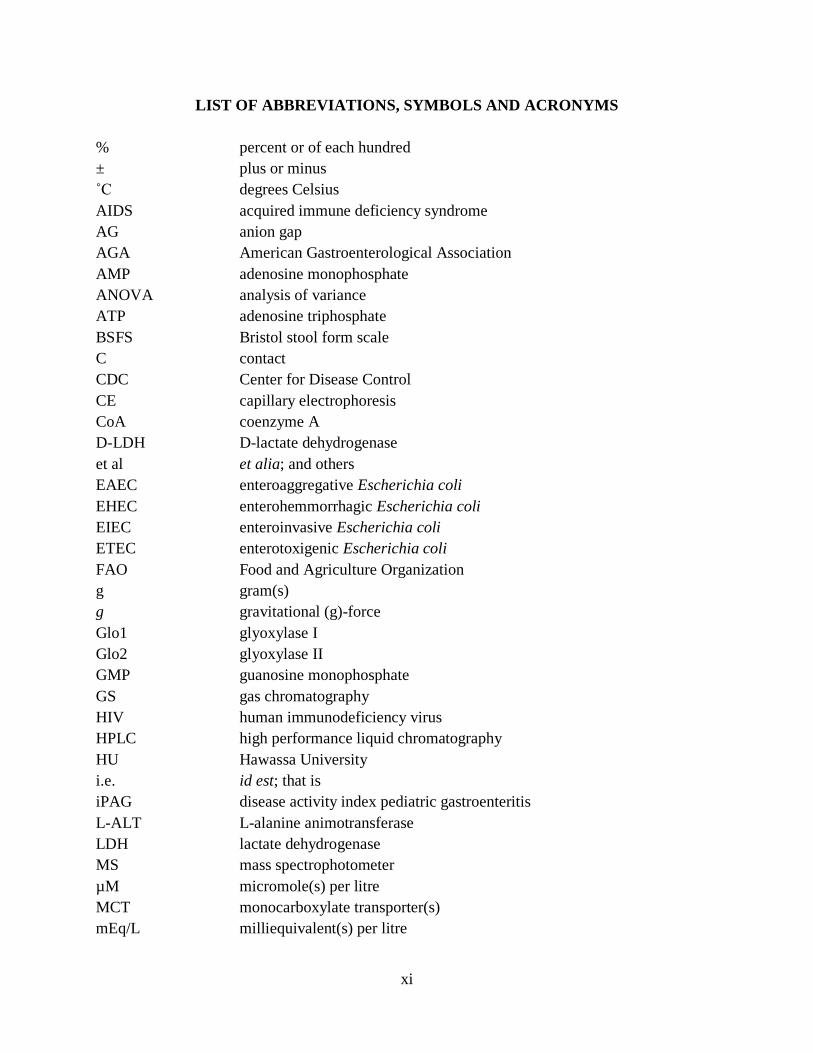
LIST OF ABBREVIATIONS, SYMBOLS AND ACRONYMS
% percent or of each hundred
± plus or minus
˚C degrees Celsius
AIDS acquired immune deficiency syndrome
AG anion gap
AGA American Gastroenterological Association
AMP adenosine monophosphate
ANOVA analysis of variance
ATP adenosine triphosphate
BSFS Bristol stool form scale
C contact
CDC Center for Disease Control
CE capillary electrophoresis
CoA coenzyme A
D-LDH D-lactate dehydrogenase
et al et alia; and others
EAEC enteroaggregative Escherichia coli
EHEC enterohemmorrhagic Escherichia coli
EIEC enteroinvasive Escherichia coli
ETEC enterotoxigenic Escherichia coli
FAO Food and Agriculture Organization
g gram(s)
g gravitational (g)-force
Glo1 glyoxylase I
Glo2 glyoxylase II
GMP guanosine monophosphate
GS gas chromatography
HIV human immunodeficiency virus
HPLC high performance liquid chromatography
HU Hawassa University
i.e. id est; that is
iPAG disease activity index pediatric gastroenteritis
L-ALT L-alanine animotransferase
LDH lactate dehydrogenase
MS mass spectrophotometer
µM micromole(s) per litre
MCT monocarboxylate transporter(s)
mEq/L milliequivalent(s) per litre
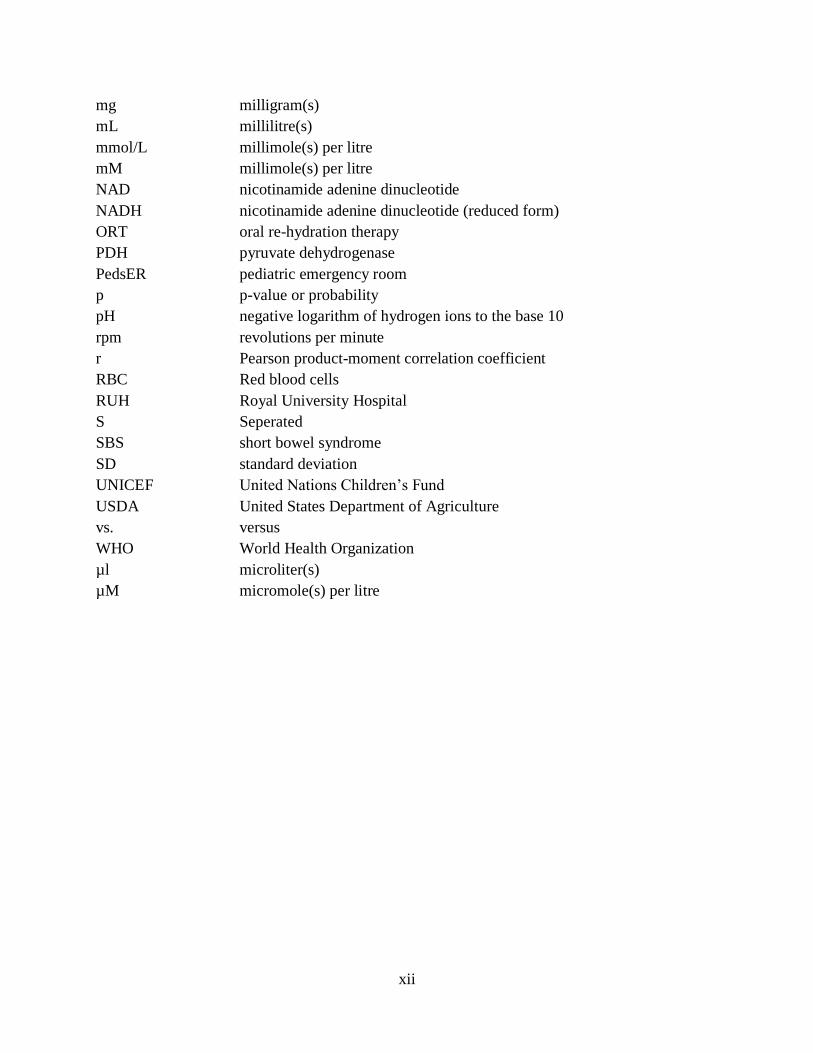
xii
mg milligram(s)
mL millilitre(s)
mmol/L millimole(s) per litre
mM millimole(s) per litre
NAD nicotinamide adenine dinucleotide
NADH nicotinamide adenine dinucleotide (reduced form)
ORT oral re-hydration therapy
PDH pyruvate dehydrogenase
PedsER pediatric emergency room
p p-value or probability
pH negative logarithm of hydrogen ions to the base 10
rpm revolutions per minute
r Pearson product-moment correlation coefficient
RBC Red blood cells
RUH Royal University Hospital
S Seperated
SBS short bowel syndrome
SD standard deviation
UNICEF United Nations Children’s Fund
USDA United States Department of Agriculture
vs. versus
WHO World Health Organization
µl microliter(s)
µM micromole(s) per litre
1
CHAPTER 1
INTRODUCTION
1.1 Rationale
Despite much global effort, advances in research, and updated clinical management
guidelines, diarrhea continues to be a leading cause of mortality and morbidity in animals and
humans worldwide. In neonatal calves, diarrhea accounts for more than 50% of unweaned heifer
deaths (United States Department of Agriculture [USDA], 2008) and results in significant
economic losses in the beef and dairy industries (Barrington, Gay & Evermann, 2002; Gunn,
Naylor, & House, 2009). In children, diarrhea is the second leading cause of death due to
infectious disease and kills more children than acquired immune deficiency syndrome (AIDS),
malaria, and measles combined (United Nations Children’s Fund [UNICEF] & World Health
Organization [WHO], 2009).
Diarrhea is a complex, multi-factorial illness and, in both humans and neonatal calves, the
majority of cases are due to infections of the gastrointestinal tract by bacteria, viruses, and/or
parasites (Guandalini, 2005; Holland, 1990). Regardless of the species, cause, and
pathophysiology, diarrhea can lead to serious clinical consequences including electrolyte
disturbances, dehydration, and metabolic acidosis (Guandalini, 2005; Gunn et al., 2009).
Metabolic acidosis is defined as a disturbance to the body’s acid-base balance, which results in a
decrease of blood pH < 7.35 (Ayers & Warrington, 2008). Metabolic acidosis can lead to serious
clinical complications and, if left untreated, can lead to death. Initially, acidosis commonly
observed in animals and humans with diarrhea was thought to be due to a loss of bicarbonate in
the feces and overproduction of L-lactate in the tissues as a result of dehydration (Kasari, 1999;
Perez, Oster & Rogers, 1987). Research has now shown that acidosis can occur in the absence of
dehydration and that D-lactate, a physiological isomer of L-lactate, is a significant contributor to
acidosis in diarrheic calves (Kasari & Naylor, 1984; Omole, Nappert, Naylor & Zello, 2001;
Ewaschuk, Naylor, Palmer, Whiting & Zello, 2004). D-lactate is produced primarily by
microorganisms in the gastrointestinal tract with very small amounts produced endogenously via
the methylglyoxal pathway in the liver (Uribarri, Oh, & Carroll, 1998).
Clinical symptoms associated with D-lactic acidosis are similar in both humans and animals
and include neurological disturbances such as abnormal motor coordination, including weakness

2
and ataxia (Kasari & Naylor, 1984; Kasari & Naylor, 1986; Lorenz, 2004; Lorenz, Gentile &
Klee, 2005; Lorenz 2009; Abeysekara, Naylor, Wassef, Isak, & Zello, 2007; Coronado, Opal, &
Yoburn, 1995; Uribarri et al., 1998). Slurred speech, blurred vision, confusion, dizziness, lack of
concentration, delirium, and abusive/hostile behaviours has also been documented in humans
(Uribarri et al., 1998; Hove & Mortensen, 1995; Stolberg et al., 1982; Al Chekakie, Al Kotoub,
& Nielsen, 2004). In severe cases, D-lactic acidosis can result in acute encephalopathy and coma
(Grünert et al., 2010; Al Chekakie et al., 2004; Htyte, White, Sandhu, Jones, & Meisels, 2011).
Symptoms vary in duration and appear to be non-specific; therefore, early detection and
diagnosis of elevated blood lactate levels is important for initiating appropriate treatment
including fluid and electrolyte replacement to correct the acidosis, temporary restriction of
carbohydrates, and use of antibiotics to minimize D-lactate producing bacteria and restore
gastrointestinal bacterial flora (Uchida et al., 2004; Al Chekakie et al., 2004).
Pre-analytical conditions including blood storage and processing may influence the stability
of lactate. Studies have shown that delays in processing blood can result in significant
overestimations of lactate levels due to ongoing glycolysis (Vaught, 2006; Calatayud & Tenías,
2003; Boyanton & Blick, 2002). Most research on the stability of lactate focuses on total and/or
L-lactate concentrations; however, little is known about the stability of D-lactate. As high levels
of D-lactate are associated with physical and mental changes in diarrheic calves, determination
of the effects of pre-analytical storage and processing on blood D- and L-lactate is needed to
ensure a reliable measurement of D-lactate concentrations.
In humans, D-lactic acidosis (serum concentration > 3mmol/L) is most often reported as a
rare clinical complication of short bowel syndrome (SBS). Carbohydrate malabsorption, a
complication of SBS, may result in excessive bacterial gastrointestinal fermentation, which
creates an environment that favours the growth of anaerobic bacteria that produce D-lactate.
When D-lactate accumulates in the gastrointestinal tract, it is absorbed into the blood and may
result in D-lactic acidosis (Hove & Mortensen, 1995; Ewaschuk, Naylor, & Zello, 2005;
Petersen, 2005). Identifying D-lactic acidosis in humans with acute diarrhea, in absence of SBS,
has been poorly examined. This warrants investigation because, similarly to SBS, carbohydrate
malabsorption in human infants has been associated with diarrhea and metabolic acidosis with
little detectable bicarbonate in the feces (Sack, Rhoads, A. Molla, A.M. Molla, & Wahed, 1982).
3
It is thus expected that elevated blood D-lactate concentrations, and D-lactic acidosis, may occur
in children with diarrhea.
Elevated fecal D-lactate concentrations observed in diarrheic animals provides evidence that
it is the production of D-lactate via gastrointestinal bacterial fermentation that contributes to D-
lactic acidosis (Omole et al., 2001; Ewaschuk et al., 2004a). Recently, research in diarrheic
lambs and calves suggests that elevated levels of D-lactate begin to appear in the blood only after
high levels are produced in the gastrointestinal tract. Thus, a potential gastrointestinal threshold
may exist for the absorption of D-lactate into the blood of diarrheic neonatal animals
(Abeysekara, 2009; Zello et al., 2009). Further investigation into a potential fecal D-lactate
threshold is warranted in which more diarrheic animals with a wide range of diarrhea severity are
included. Identifying elevated fecal D-lactate levels, early on, in clinical cases of diarrhea may
prove to be a useful biomarker to predict, and ideally prevent, D-lactic acidosis.
1.2 Hypothesis
This project tested the following three hypotheses:
As cellular metabolism continues following blood sample collection, blood D- and L-lactate
concentrations increase over time and in response to different processing procedures
Children (≤ 5 years of age) with acute diarrhea and metabolic acidosis have elevated levels of
blood and fecal D-lactate concentrations
Supra-physiological blood D-lactate concentrations appear after sufficiently high levels of D-
lactate are produced by microbial action in the gastrointestinal tract in neonatal calves (≤15
days of age)
1.3 Objectives
The objectives of this study were:
To examine the stability of D- and L-lactate concentrations in calf blood samples:
a) After prolonged contact of serum and plasma with blood cells
b) After immediate separation of serum and plasma from blood cells via centrifugation
To determine if D-lactic acidosis occurs in children (≤ 5 years of age) who come to hospital
with acute diarrhea and metabolic acidosis
o To investigate the blood parameters that define metabolic acidosis and determine

4
concentrations of D-lactate, L-lactate, and pyruvate in children with acute diarrhea
To examine a wide range of diarrhea severity to determine if a fecal threshold exists in the
gastrointestinal tract at which D-lactate enters the systemic circulation in neonatal calves with
diarrhea

5
CHAPTER TWO
LITERATURE REVIEW
2.1 Diarrhea Pathophysiology
The gastrointestinal tract has a great capacity to handle large volumes of fluid. In
humans, approximately seven to ten litres of fluid (oral fluids, saliva, small intestine secretions
and gastric, bile and pancreatic juices) enters the gastrointestinal tract every 24 hours with very
little loss, approximately 1%, in the feces (Johnson, 2007). The gastrointestinal tract maintains
homeostasis by regulating the absorption and secretion of both fluids and electrolytes (Johnson,
2007). This regulation of fluid is critical to ensure normal gastrointestinal function including
nutrient digestion and absorption (Barrett, 20006; Acra & Ghishan, 1996). When there is a
disturbance to the balance between intestinal absorption and secretion processes, diarrhea occurs.
Diarrhea can result from various mechanisms and/or a combination of mechanisms including
increased intestinal secretion of fluid and electrolytes; decreased absorption of fluid, electrolytes
and nutrients; and/or motility disturbances (Thapar & Sanderson, 2004; Colbère-Garapin et al.,
2007; Guandalini, 2005; Acra & Ghishan, 1996; Casburn-Jones & Farthing, 2004).
Clinically, diarrhea can be classified as acute or chronic. Acute diarrhea has a sudden
onset, generally resolves within fourteen days, and is usually due to an infectious agent. Chronic
diarrhea has been defined as loose stools, with or without an increase in frequency, which lasts
more than four weeks. Many causes of chronic diarrhea exist and include inflammatory bowel
disease, malabsorptive syndrome, and chronic infections (American Gastroenterological
Association [AGA], 1999; Fine & Schiller, 1999). In addition to the duration of the diarrheal
episode, fecal characteristics help guide the treatment and management of diarrhea and is
classified as non-inflammatory or inflammatory (Baldi, Bianco, Nardone, Pilotto, & Zamparo,
2009).
2.1.1 Non-Inflammatory Diarrhea
Non-inflammatory diarrhea is characterized by large volume, watery, and liquid stools. It
is caused by decreased gastrointestinal absorption of water and electrolytes and/or increased
secretion of water and electrolytes into the gastrointestinal tract (Thapar & Sanderson, 2004;
Navaneethan & Giannella, 2008). A loss in the ability of the lumen to absorb water and

6
electrolytes may result from the loss of part of the intestinal absorptive area (i.e. short bowel),
decreased intraluminal digestion (i.e. pancreatic insufficiency), decreased enterocyte cellular
absorptive function (i.e. abnormalities in intestinal transporters) and decreased intestinal transit
(i.e. drugs, toxins, stress) (Thapar & Sanderson, 2004). Increased secretion can be caused by an
increase in the production of secretory cells as in such conditions where enterocytes and/or
absorptive intestinal villi are damaged (i.e. food allergies, celiac disease, viruses). Increased
secretion may also be a result of an up-regulation of secretory pathways activated by secretory
enterotoxins (Farthing, 2000; Thapar & Sanderson, 2004).
Enteric pathogens in non-inflammatory diarrhea usually target the small intestine. Such
pathogens include rotavirus; norovirus; enterotoxigenic Escherichia coli [ETEC]; Vibrio
cholera; Staphylococcus aures; Clostridum perfringens; Giardia Lamblia; and Cryptosporidium
parvum. These pathogens tend not to invade the intestinal wall but attach to the mucosa and
interfere with normal enterocyte absorption and secretion. Several of these pathogens will also
secrete enterotoxins that stimulate increased intestinal secretions (Colbère-Garapin et al., 2007;
Navaneethan & Giannella, 2008).
Non-inflammatory diarrhea can be further classified as osmotic or secretory (Sellin,
2001). Osmotic diarrhea occurs when there is a decrease in the absorption of osmotically active
solutes in the gastrointestinal tract and results in water being drawn into the lumen at a rate
proportional to its concentration. This excess water may exceed the re-absorptive capacity of the
colon and diarrhea occurs (Castro-Rodrígues, Salazar-Lindo, & León-Barúa, 1997; Thapar &
Sanderson, 2004; Acra & Ghishan, 1996; Sellin, 2001). In contrast, in secretory diarrhea the net
secretion of water into the intestinal lumen is caused by the intestinal epithelium itself as a result
of an imbalance between electrolyte secretion and absorption (Baldi et al, 2009; Guarino,
Buccigrossi & Armellino, 2009; Sellin, 2001). Changes may be mediated by cyclic adenosine
monophosphate (AMP) or cyclic guanosine monophosphate (GMP), calmodulin, and changes in
protein kinase activity. Intestinal cells are not damaged. Rather, cellular membrane pumps are
altered and secretion of chloride, sodium, and potassium increases (Gunn et al., 2009).
2.1.2 Inflammatory Diarrhea
Inflammatory diarrhea can be characterized by small volume, mucoid, bloody feces and is
caused by enteric pathogens that target the colon or distal ileum (Navaneethan & Giannella,

7
2008). Enteric pathogens associated with inflammatory diarrhea secrete cytotoxins
(enteroaggregative Escherichia coli [EAEC], enterohemmorrhagic Escherichia coli [EHEC] and
Clostridium difficile), and/or invade the intestinal wall (Shigella spp., Campylobacter spp.,
Salmonella spp., Yersinia spp., enteroinvasive Escherichia coli [EIEC] and E. histolytica), and
cause an acute inflammatory response in the mucosa (Colbère-Garapin et al., 2007; Navaneethan
& Giannella, 2008). Diarrhea is thought to be a result of increased intestinal secretion stimulated
by cytotoxins and inflammatory mediators and/or mucosal damage. Histologically, due to
inflammation, ulceration of the mucosa may be observed and, clinically, stools may test positive
for fecal leukocytes (Navaneethan & Giannella, 2008).
2.2 Diarrhea in Humans and Neonatal Calves
2.2.1 Pediatric Diarrhea
2.2.1.1 Global Impact of Diarrhea
Diarrheal diseases continue to be a global public health concern, especially in children, as
these diseases contribute significantly to human morbidity and mortality. Although the mortality
rate of children under five years of age has fallen within the last twenty years due to oral re-
hydration therapy (ORT), diarrhea continues to be a leading cause of child death (UNICEF &
WHO, 2004). According to Black et al. (2010), diarrhea accounts for an estimated 1.336 million
deaths globally, approximately 15% of total child deaths, with 51% of these deaths occurring in
India, Nigeria, Afghanistan, Pakistan, and Ethiopia. Worldwide, diarrhea is the second cause of
death due to infectious agents following pneumonia and kills more children than AIDS, malaria,
and measles combined (UNICEF & WHO, 2009). Kosek, Bern, & Guerrant (2003) estimated a
global median incidence of 3.2 episodes of diarrhea per child-year in developing countries.
Reduction of diarrhea-related mortality burden is crucial towards achieving the United Nation’s
Millennium Development Goal #4 to, “reduce by two thirds, between 1990 and 2015, the
mortality rate of children under five” (United Nations, 2002).
In both developing and developed countries, diarrheal diseases exerts pressure on existing
health care services, finances, and ultimately affects the child’s quality of life. Children living in
developing countries are more likely to have a higher number of diarrheal episodes, severe
episodes with dehydration, and higher death rate compared to those children living in a middle or
high-income country (O’Ryan, Prado, & Pickering, 2005). The range in the number of diarrheic
8
episodes is dependent on a variety of risk factors including poor infrastructure, crowding,
exposure to farm animals, lower standards in food handling and hygiene, decreased accessibility
to health care, and lower educational levels (O'Ryan et al., 2005). Although, morbidity and
mortality rates associated with diarrhea may be less in developed countries, diarrheal diseases are
still very much a concern. In the United States, between the years of 1993-2003, 1 in 6 children
were hospitalized due to a diarrheal-illness (Fischer, et al., 2007). According to Malek et al.
(2006), diarrhea is associated with 150 000 to 170 000 hospitalizations in the United States
annually and accounts for approximately 13% of all hospitalizations among children with a
median charge of $2051 US dollars per hospitalization (Malek et al., 2006).
2.2.1.2 Defining Pediatric Diarrhea
In children, diarrhea has been formally defined as an increase in stool fluidity above a
normal value of approximately 10 mL/kg per day (Guandalini, 2005; Thapar & Sanderson,
2004). A more practical assessment and diagnosis used in the clinical setting is an unusual
increase of liquid and watery stool at least three times within a 24 hour period (Guandalini, 2005;
O'Ryan et al., 2005) with a particular emphasis on the observation of a change in stool
consistency (WHO, 2005; O'Ryan et al., 2005). A diarrheal “episode” begins with the first 24
hour period that meets the definition of diarrhea and ends with the last diarrhea day, which is
defined as at least two days that do not meet the definition of diarrhea (Lima & Guerrant, 1992).
2.2.1.3 Etiology
Many causes of pediatric diarrhea exist with the majority of cases due to infections of the
gastrointestinal tract. Causes of diarrhea vary with the location, time of year, and the population
group studied (Guandalini, 2005; Dennehy, 2005). An increasing variety of enteric pathogens are
associated with diarrheal diseases, which can be classified into three microbial groups: bacteria,
parasites, and viruses (Guandalini, 2005; Dennehy, 2005). In the United States, 35% of
diarrheal-associated hospitalizations among children under five years of age are attributed to
viral agents, 5% are bacterial, <1% parasites, and 62% are of an unspecified etiology (Malek et
al., 2006). In addition to a large number of viruses, developing countries and areas that have poor
sanitation and food and water contamination have a high risk of infection caused by enteric
bacteria and/or parasites (O'Ryan et al., 2005). More specifically, Shigella spp. contributes to
9
15% of diarrheal associated mortality (Thapar & Sanderson, 2004). Other bacteria known to
cause diarrhea in developing countries include pathogenic Escherichia Coli, Campylobacter,
Yersinia, and Salmonella species. Vibrio cholerae is a concern where sanitation is poor (Thapar
& Sanderson, 2004).
Rotavirus is one the most common pathogens causing diarrhea in children under five
years of age in both the developed and developing world (Fischer et al., 2007). Worldwide, it
causes approximately 600,000 to 875,000 deaths annually and is responsible for 6% of deaths
(Dennehy, 2005). Rotavirus is widespread and most severe in developing countries in which it
has been estimated to be responsible for 60% of diarrheal diseases (Thapar & Sanderson, 2004).
Death associated with this virus often results from dehydration. Similar to other pathogens that
cause infectious diarrhea, rotavirus infects the villous epithelium of the small intestinal mucosa
(villous atrophy), which leads to nutrient malabsorption, increased fermentation in the colon, and
results in watery diarrhea (Cohen, 1991). Vaccines are available but remain costly (Colbère-
Garapin et al., 2007).
The pathogens responsible for enteric infections are commonly ingested through
contaminated food, water, or via person-to-person contact (Carroll & Reimer, 2000). The risk of
developing an infection with several enteric pathogens increases where there is a lack of potable
water (O'Ryan et al., 2005). The likelihood of developing an infection as a result of being
exposed to the pathogens mentioned above is dependent on several factors: frequency of
exposure; the number of pathogens ingested; and host defence factors including gastric acidity,
intestinal motility, normal gastrointestinal flora, and host’s intestinal immunity (Carroll &
Reimer, 2000; Cohen, 1991).
2.2.1.4 Prevention and Treatment
In 2009, UNICEF and WHO published a report detailing a 7-point strategy for diarrhea.
This report includes a treatment package, which aims to reduce death due to diarrhea, and
prevention package, which aims to reduce the total number of cases of diarrhea (UNICEF &
WHO, 2009). Prevention strategies are vital in managing diarrheal disease. Strategies for
prevention are developed to reduce the child’s exposure to those pathogens that cause diarrhea
directly and to reduce the child’s susceptibility to diarrhea through improved health and
nutrition. More specifically, UNICEF & WHO (2009) focus on five prevention elements
10
including rotavirus and measles vaccination; breastfeeding and vitamin A supplementation;
promotion of hand washing with soap; improved water quality and quantity; and community-
wide sanitation promotion.
Treating diarrhea is based on clinical symptoms including the type of diarrhea (watery vs.
bloody), duration (acute vs. chronic) and degree of dehydration. The most common cause of
hospitalization of infants and children with acute diarrhea is due to dehydration. Infants and
children with acute diarrhea are at a higher risk of having more severe dehydration due to a
higher body surface-to-body ratio, higher metabolic rate, smaller water reserves, and their
dependency on others for fluid (King, Glass, Bresee, & Duggan, 2003). Ultimately, the main
treatment goals are to prevent and/or treat dehydration and electrolyte disturbances, replace
ongoing losses, shorten the duration of the illness, and continue normal feeding (Guarino et al.,
2008; Cashburn-Jones & Farthing, 2004; Colletti, Brown, Sharieff, Barata, Ishimine, 2008).
Fluid and electrolyte replacement can be administered orally (i.e. oral rehydration therapy
[ORT]) or intravenously.
Oral rehydration therapy includes rehydration and maintenance fluids with oral
rehydration solutions (ORS) combined with continued feeding (Victora, Bryce, Fontaine &
Monasch, 2000; King et al., 2003). The scientific basis for ORS came from the discovery that
sodium transport was mediated by glucose transport in the small intestine. Transport across the
lumen is made possible by sodium glucose co-transporter 1 (SGLT1). Glucose can then be
transported into the blood via glucose transporter type 2 (GLUT2) (King et al, 2003). As this
coupled transport mechanism does not appear to be impaired in infectious diarrhea the use of
glucose-electrolyte solutions are shown to be effective in treating diarrhea-associated
dehydration. This discovery was initially investigated in cholera; however, ORS has been shown
to be an effective treatment in over 90% of cases despite the cause of diarrhea (Booth, Levine, &
Harries, 1984; WHO, 2005). Although various formulations of ORS exist, the WHO
recommends the use of a reduced osmolarity ORS solution as it decreases the need of
intravenous fluid when compared to higher osmolarity solutions. The ORS recommended by
WHO has a total osmolarity of 245 mOsm/L and contains 75 mmol/L sodium; 65 mmol/L
chloride; 75 mmol/L glucose; 20 mmol/L potassium; and 10 mmol citrate. This ORS solution
provides water and electrolytes to replace loss in acute diarrhea; citrate to prevent or correct base
deficits; and glucose to allow for maximum absorption of sodium and water. When compared to
11
other reduced osmolarity solutions, this formulation reduces stool output by 20% and number of
vomiting episodes by 30% (WHO, 2005).
A review by Hartling et al. (2006) concluded that there are no clinically important
differences between ORT and intravenous treatment in gastroenteritis although ORT did have a
higher risk of paralytic ileus and intravenous fluids increased the risk of intravenous therapy (i.e.
phlebitis). Children with mild to moderate dehydration should be treated with ORT with ORS
solution first, and if treatment should fail, then intravenous fluids should be used. Although
WHO, American Academy of Pediatrics (AAP) and the Center for Disease Control (CDC)
strongly recommend the use of ORT in mild to moderate dehydration it continues to be
underused, especially in North America (Bender, Ozuah, & Crain, 2007). Conversely, in
developing countries, ORTs are the main form of treatment due lack of access and costs
associated with intravenous treatments (Colletti et al., 2008). In addition to ORT, UNICEF &
WHO (2004) recommends daily 20 mg zinc supplements for ten to fourteen days in children
with acute diarrhoea, and 10 mg per day for infants under six months old, to reduce the duration
and severity of diarrhea and to prevent reoccurring episodes. Other pharmacological agents are
available; however, some agents including anti-motility drugs (e.g. loperamide), are not
recommended in infants and children as serious side effects including shock, ileus, nausea,
lethargy and death have been reported (King et al., 2003; Li, Grossman, & Cummings, 2007).
Much attention has been given to the potential role of probiotics in treating and managing
pediatric diarrhea although the mechanisms by which they work are not as fully understood. The
gastrointestinal tract contains over 400 species of bacteria, mainly anaerobic, which play an
important role in the functioning of the mucosal barrier and contribute to overall health by
producing nutrients, protecting the gastrointestinal tract against enteric pathogens, and play a role
in the body’s immune system (Isolauri, et al., 2002; Thomas & Greer, 2010; Balamurugan et al.,
2008). In acute diarrhea, enteric pathogens may disrupt the gastrointestinal tract environment
and, as a result, change the normal microbial flora. Balamurugan et al. (2008) observed fecal
microbial changes in diarrhea including significantly lower numbers of Bacteroides-Prevotella, a
predominant fecal anaerobic bacteria, and Eubacterium rectal and Faecalibacterium prauznitizii.
Changes in the gastrointestinal flora may lead to a decrease in the predominant bacteroides
species and support the growth of acid producing bacteria such as lactic acid (i.e. Lactobacillus).
This may result in an increased production of both D- and L-lactate (Al Chekakie et al., 2004;

12
Uribarri, et al., 1998). The physiological mechanism by which the gastrointestinal tract produces
unusually high amounts of D-lactate is further described in Section 2.4.2.3.1.
Probiotics have been defined by the Food and Agriculture Organization (FAO) & WHO
(2001), as a supplement or part of food, as “live microorganisms which when administered in
adequate amounts confer a health benefit on the host.” A systematic review by Allen, Martinez,
Gregorio, and Dans (2010) reports the use of probiotics in acute diarrhea due to enteric
pathogens may help to restore normal gut flora which in turn is thought to compete and defend
against enteric pathogens for receptor sites on the intestinal surface or compete for intraluminal
nutrients and enhance immune defences. Some probiotics have been found to be effective in
treating acute diarrhea, especially when caused by rotavirus (Szymański et al., 2006; Grandy,
Medina, Soria, Terán & Araya, 2010). The beneficial effects of probiotics are deemed to be
strain and dose dependent and have been observed in acute, watery, and viral diarrhea but not in
invasive bacterial diarrhea (Canani et al., 2007; Guandalini, 2008; Guarino et al., 2009).
Alongside rehydration therapy, the European Society for Paediatric Gastroenterology,
Hepatology, and Nutrition/European Society for Paediatric Infectious Diseases suggest the use of
probiotic strains with proven efficacy and no evidence of antibiotic resistant transfer (i.e.
Lactobacillus GG and Saccharomyces boulardii) (Guarino, 2008).
2.2.2 Diarrhea in Neonatal Calves
2.2.2.1 Economic Impact
Diarrheal diseases are a common cause of morbidity and mortality in young calves. This
complex disease develops most often within the first four weeks of life. Despite advances in
research and prevention/control programs including the increasing use of Salmonella, E. coli,
and clostridia vaccines, diarrhea accounts for more than 50 percent of unweaned heifer deaths
(Berchtold, 2009; USDA, 2008). One-third of surveyed beef-cow operators in the United States
strongly agreed or agreed that calf diarrhea has an economic impact on their operations (USDA,
2010). Diarrhea can have an economic impact on both the beef and dairy industries directly
through financial losses from the loss of calves, cost of treatment, and labour needed to deliver
such treatments (Barrington et al., 2002; Gunn et al., 2009; Walker et al., 1998).
13
2.2.2.2 Etiology
The most common cause of diarrhea in neonatal calves is due to infections of the
gastrointestinal tract and usually more than one pathogen is involved. The most significant
enteric pathogens are enterotoxigenic Escherichia coli (ETEC), Cryptosporidium parvum,
rotavirus, and coronavirus (Foster & Smith, 2009; Gunn et al., 2009). Diarrhea due to
Salmonella is more common in intensive calf rearing systems (Gunn et al., 2009). The cause of
diarrhea also varies with the calf’s age. For example, diarrhea due to ETEC is usually seen in the
first three or four days of life but can also be seen in seven to fourteen days of age with rotavirus.
ETEC attaches to the intestinal epithelium, colonizes and spreads through the small intestine and,
once established, produces heat stable toxins resulting in secretory diarrhea (Foster & Smith,
2009). Cryptosporidium parvum will generally infect calves between one and four weeks of age
and have clinical signs for four to fourteen days. This parasite invades the mucosa and disrupts
the epithelial cells of the small intestine and leads to villus atrophy resulting in impaired nutrient
digestion and absorption and malabsorptive diarrhea. Transmission is via fecal-oral by ingestion
of encysted, sporulated oocysts directly from host to host and contamination of food and/or water
and mechanically via flies (Gunn et al., 2009). Rotavirus is the most common cause of neonatal
diarrhea in calves and affects calves five days to two weeks of age but can also occur within 24
hours of birth in colostrum-deprived calves.
2.2.2.3 Prevention and Treatment
Similar to pediatric diarrhea, the development of prevention strategies is critical in
managing diarrhea. Pathogens that cause diarrhea are almost always present on the farm as
many are found normally at low concentrations in the gastrointestinal tract of healthy cattle
(Gunn et al., 2009). Therefore, most cattle will be exposed to these agents throughout their
lifespan (Barrington et al., 2002). Whether or not neonatal calf diarrhea develops depends on
many risk factors. As most infections causing diarrhea in calves occur within the first few weeks
of life, ensuring adequate intake of colostrum affects the development of a calf’s immune system
and plays a critical role in the prevention of neonatal diarrhea. Passive immunity against enteric
pathogens is associated with colostrum containing high concentrations of antibodies (Saif &
Smith, 1985). For example, cows secrete anti-rotavirus antibodies in colostrum which
ultimately protects against rotavirus until the antibody levels decrease in milk 48 to 72 hours

14
postpartum (Gunn et al., 2009). To reduce the risk of developing diarrhea, prevention strategies
in neonatal calves encompasses minimizing environmental stresses and herd management
conditions, reducing the exposure of pathogens, boosting immunity, and promoting biosecurity
(Saif & Smith, 1985; Radostits & Acres, 1980; Schumann, Townsend, & Naylor, 1990; Gunn et
al., 2009).
Regardless of the cause, neonatal calf diarrhea results in loss of water, electrolytes, and
decreased milk intake which, in turn, can lead to dehydration, electrolyte imbalances, and
acidosis (Smith, 2009). The most common cause of death in diarrheic neonatal calf diarrhea is
due to dehydration and metabolic acidosis. D-lactate has been identified as a significant
contributor to the acidosis found in diarrheic calves (Kasari & Naylor, 1984; Omole et al., 2001;
Ewaschuk et al., 2004a). Production of D-lactate and D-lactic acidosis in neonatal calves is
further described in Section 2.4.2.3.
To restore hydration and correct acidosis, treatment often begins with assessing
dehydration status and administering fluid therapy, orally or intravenously. Oral electrolyte
solutions are considered to be an economical and convenient treatment as it can be initiated on-
farm and is indicated for use in diarrheic calves with dehydration, mild to moderate acidosis,
those who still exhibit a suckle reflex, and at least a partially functional gastrointestinal tract
(Constable, Grügerg & Carstensen, 2009). According to Smith (2009), oral electrolyte solutions
should “supply sufficient sodium to normalize the extracellular fluid volume; provide agents that
facilitate absorption of sodium and water from the intestine; correct the metabolic acidosis
usually present in calves with diarrhea; and provide energy”. Studies demonstrate benefits (i.e.
provide sufficient energy and prevent weight loss) in continuing a milk diet in addition to oral
electrolytes in diarrheic calves (Garthwaite, Drackley, McCoy, & Jaster, 1994; Heath, et al.,
1989). Intravenous fluid therapy is indicated for use in neonatal calves when dehydration is
assessed to be greater than 8% body weight or if the calf exhibits signs of severe depression,
coma, unable to stand, lack of suckle reflex for more than 24 hours or a rectal temperature of less
than 38°C (Berchtold, 1999).
Antimicrobials are often used to treat diarrhea in calves however due to increasing
concerns surrounding antimicrobial resistance, there has been an increasing interest in the use of
probiotics. In contrast to humans, few studies have investigated the use of probiotics in the
treatment of calf diarrhea. Calves who received an oral dose of lactic acid-producing bacteria for

15
ten days proved not effective in preventing Cryptosporidium parvum infection (Harp et al.,
1996). In a clinical setting, Ewaschuk, Zello, & Naylor (2006) tested the use of Lactobacillus
rhamnosus GG to determine whether this probiotic would be useful for reducing the severity of
diarrhea and/or reduce D-lactic acidosis. No significant differences in fecal or serum D-lactate
concentrations were found between the experimental and control group and there was no
significant reduction in mortality. It should, however, be noted that all calves in this study, were
also clinically treated with antimicrobials which may have reduced the number of D-lactate
producing bacteria. In another study, use of Escherichial coli strain Nissle 1917 showed a
significant reduction in the frequency of calf diarrhea when compared to placebo group and,
when used to treat diarrheal illness, showed a shorter period of sickness (vonBuenau et al.,
2005). Further research is still required on specific strains and dosages of probiotics that are
beneficial in the prevention and/or treatment of neonatal calf diarrhea, with no adverse of effects,
before recommendations can be made. Recent attention has shifted to investigating the use of
antimicrobial treatments, analgesic, and anti-inflammatory agents alongside fluid therapy
(Constable, 2009).
2.3 Metabolic Acidosis
As arterial blood must maintain a normal pH (7.35-7.45) for proper organ function, the
acid-base balance in both humans and calves is tightly regulated by the lungs, kidneys, and a
system of buffers (Ayers & Warrington, 2008). Metabolic acidosis is defined as a disturbance to
the acid-base balance with arterial pH < 7.35 and/or low bicarbonate concentration. This
disturbance is due to an increase in blood hydrogen (H+) concentration from the over production,
or excess, of H+ or through the loss of bicarbonate (HCO3
-) ions (Edwards, 2008). An increase
in acid may be caused by increased endogenous production (L- and D-lactic acidosis,
ketoacidosis) or through ingestion of toxic substances such salicylates, methanol, ethylene
glycol, or propylene glycol. Loss of bicarbonate may occur through mechanisms of the kidneys
or gastrointestinal tract (Morris & Low, 2008b). Once metabolic acidosis is suspected, the serum
anion gap is often calculated to diagnose the type and origin of metabolic acidosis:
Anion Gap (AG) = ([Na+] + [K
+]) - ([Cl
-] + [HCO3
-]

16
Through this calculation, metabolic acidosis is divided into either an elevated, or high, anion gap
which is usually caused by an accumulation of organic acids, or normal anion gap, which can be
further divided as normal hypokalemic or normal hyperkalemic (Ayers & Warrington, 2008). A
review by Kraut & Madias (2006) described the variability in reported normal anion gap values,
with healthy human anion gap ranges differing from one clinical laboratory to the next, from
11±2.5mEq/L to 15±2.4mEq/L to 12±4mEq/L, thus stressing the importance of clinicians to be
aware of the normal range for their particular clinical laboratory. Oster, Guido, Perez, &
Materson (1988) defined a normal anion gap as 8-15 mEq/L. In healthy animals, the normal
anion gap also varies and ranges from 3-11 mmol/L (Ewaschuk et al., 2003).
An elevated anion gap is suggestive of an accumulation of (acidic) anions in the body
such as organic acids (e.g. lactic acid, ketoacids) (Morris & Low, 2008a). An anion gap > 30
mEq is usually due to the presence of organic acidosis (i.e. ketoacidosis, lactic acidosis). Values
ranging from 23-30 mEq/L are also indicative of organic acidosis but, in 30% of cases, the acid
is not identifiable and values between 16 and 22 mEq/L are not thought to be very useful for
diagnostic purposes (Oster et al., 1988; Kraut & Madias, 2007).
2.3.1 Metabolic Acidosis and Anion Gap in Diarrhea
Physiological changes and/or insults to the gastrointestinal tract, as in the case of
diarrheal illness, can significantly impact the body’s acid-base equilibrium. Metabolic acidosis
in diarrhea is often described as a result of bicarbonate loss in the feces, associated with
hyperchloremia, and often presents with a normal anion gap (Rose & Post, 2001). In addition
to bicarbonate loss in the feces, acidosis was also thought to be due to an increase in L-lactate
production as a result of hypoxic conditions such as tissue hypoperfusion or tissue hypoxemia
associated with dehydration (Perez et al., 1987). In the case of moderate to severe diarrhea, a
high anion gap may be present (Weizman, Houri, & Ben-Ezer Gradus, 1992; Wang, Butler,
Rabbani, & Jones, 1986; Boonsiri, Tangrassameeprasert, Panthongviriyakul, & Yongvani, 2007).
In a retrospective cohort chart review of 467 children admitted to a pediatric observation unit
with dehydration caused by gastroenteritis, 25% of children had an anion gap greater than 14
mmol/L (mean: 16.7 mmol/L) and ranged from 1-28 mmol/L (Mallory, Kadiesh, Zebrack, &
Nelson, 2006). Elevated anion gaps have also be been observed in diarrheic neonatal animals
(Omole et al., 2001; Ewaschuk, Naylor, & Zello, 2003) and humans with short bowel syndrome
17
(Bongaerts et al., 2000). In clinical cases of metabolic acidosis in humans with short bowel
syndrome, anion gaps ranging from 20-32 mmol/L have been reported (Coronado, Opal, &
Yoburn, 1995; Htyte et al., 2011; James, Black, Kuper, & Saibil, 2010; Munakata et al., 2009;
Puwanant et al, 2005; Zhang, ZW Jiang, J Jiang, Cao, & Li, 2003). The mean anion gap in
diarrheic calves, when compared to healthy calves, may increase by more than 14 mmol/L and
ranges of 7.0-37.5 mmol/L have been reported (Omole et al., 2001; Ewaschuk et al., 2004a).
The anion gap significantly correlates with serum D- and total DL-lactate concentrations but not
with serum L-lactate concentrations as previously thought (Ewaschuk et al., 2003).
Regardless of the type of acidosis that occurs, left untreated, acidosis can lead to serious
complications including death. Acidemia (pH < 7.1) may lead to changes in the structures and
functions of proteins and enzymes which can impose negative effects on the body such as
inhibiting cardiac output; hypotension, hypoperfusion of organs; hyperkalemia; hypercalcemia;
hypercalciuria; and increased protein catabolism (Ayers & Warrington, 2008).
2.4 Lactate
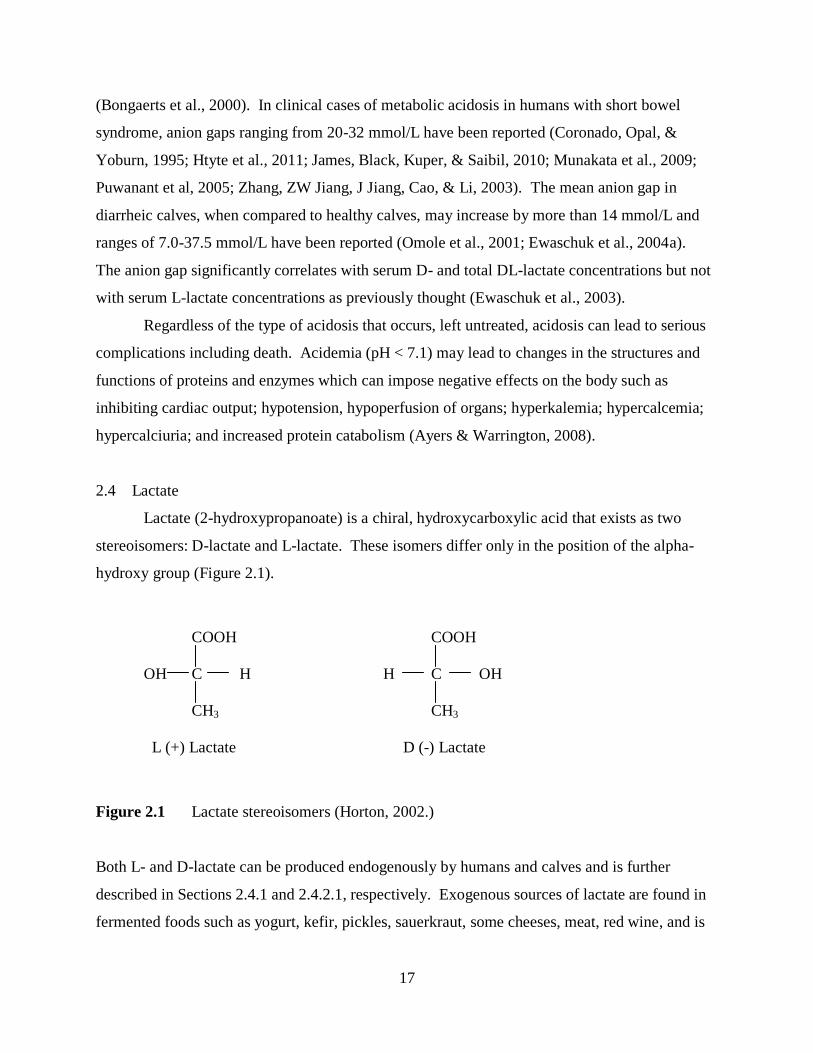
Lactate (2-hydroxypropanoate) is a chiral, hydroxycarboxylic acid that exists as two
stereoisomers: D-lactate and L-lactate. These isomers differ only in the position of the alpha-
hydroxy group (Figure 2.1).
COOH COOH
OH C H H C OH
CH3 CH3
L (+) Lactate D (-) Lactate
Figure 2.1 Lactate stereoisomers (Horton, 2002.)
Both L- and D-lactate can be produced endogenously by humans and calves and is further
described in Sections 2.4.1 and 2.4.2.1, respectively. Exogenous sources of lactate are found in
fermented foods such as yogurt, kefir, pickles, sauerkraut, some cheeses, meat, red wine, and is

18
used as a food additive. When these foods are consumed by healthy individuals the lactate
contained in these foods does not appear to contribute to clinical cases of acidosis as it is likely
amounts consumed are not large enough to exceed an individual’s capacity to metabolize it (de
Vrese & Barth, 1991; Halperin & Kamel, 1996; Haschke-Becher et al., 2008)
2.4.1 L-Lactate and L-Lactic Acidosis
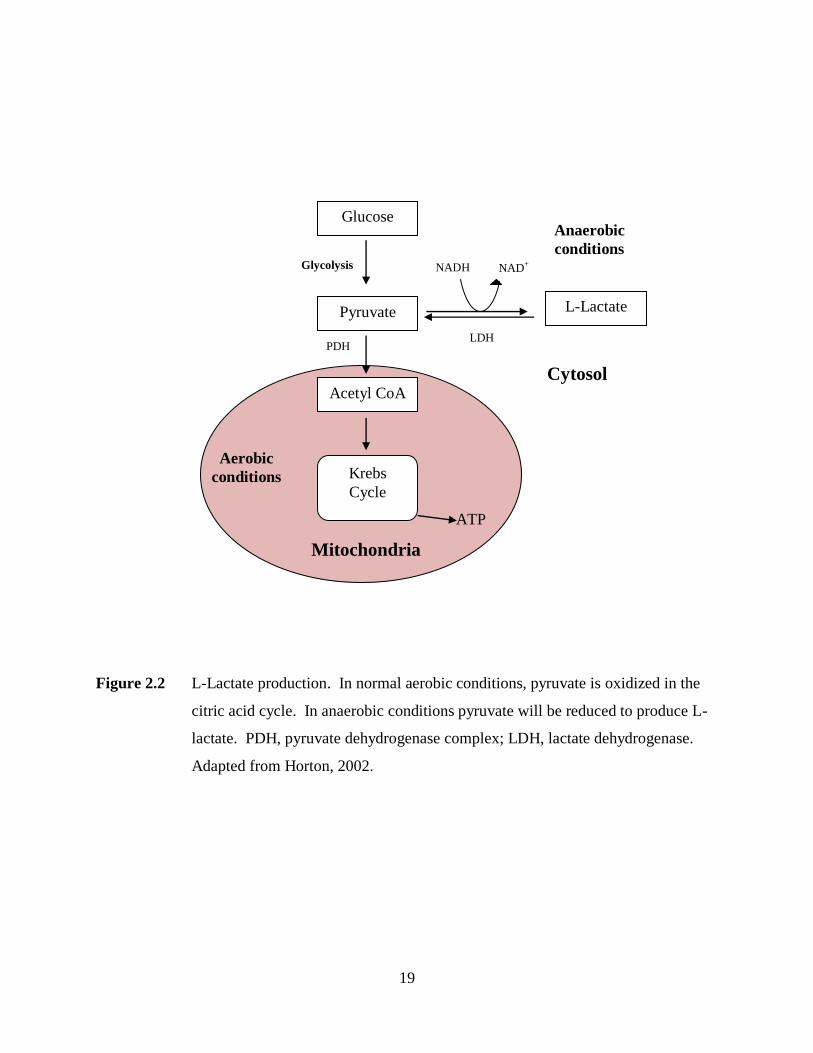
Under physiological aerobic conditions pyruvate, the last product of glycolysis, enters the
mitochondria and is oxidized to acetyl CoA for entry into Krebs cycle for ATP production
(Horton, 2002). When the oxygen supply is insufficient, tissues produce lactate by anaerobic
glycolysis (Figure 2.2). In this pathway, pyruvate is reduced by NADH to produce L-lactate.
This reaction is catalyzed by an enzyme, lactate dehydrogenase (LDH), located in the cell
cytosol (Horton, 2002; Luft, 2001). The production of L-lactate by this pathway makes NAD+
available and allows glycolysis to continue under anaerobic conditions. This reaction is
reversible and, once oxygen becomes available, excess lactate will be metabolized back to
pyruvate (De Backer, 2003). Blood lactate is metabolized by the liver and kidney. In muscle
cells, via the Cori cycle, lactate produced by anaerobic glycolysis travels to the liver where,
through gluconeogenesis, it is converted glucose and returned to the muscles (Vernon &
LeTourneau, 2010). Over the course of the day, approximately 1500 mmol/L of lactate can be
produced (Levy, 2006). In healthy humans and calves, blood lactate levels will range between 1-
2 mmol/L. This blood lactate concentration is considered to be predominately in the form of L-
lactate (Luft, 2001; Vernon & Letourneau, 2010).
In the literature, the term “lactic acidosis” refers to the more commonly known condition
of L- lactic acidosis characterized by hyperlactemia, > 5 mmol/L, and pH < 7.35 (Luft, 2001).
L-lactic acidosis is most often observed in physiological conditions where oxygen delivery to the
tissues is inadequate resulting in tissue hypoxia and production of excess L-lactate (Vernon &
LeTourneau, 2010). L-Lactic acidosis can also occur as a result of impaired L-lactate
metabolism in which excess lactate can result from an overproduction and/or decreased clearance
due to underlying disease (renal and/or hepatic failure, diabetes mellitus, malignancy, systemic
inflammatory response syndrome and HIV), effects of drugs, and inborn errors of metabolism
(Vernon & LeTourneau, 2010).
19
Figure 2.2 L-Lactate production. In normal aerobic conditions, pyruvate is oxidized in the
citric acid cycle. In anaerobic conditions pyruvate will be reduced to produce L-
lactate. PDH, pyruvate dehydrogenase complex; LDH, lactate dehydrogenase.
Adapted from Horton, 2002.
NADH NAD+ Glycolysis
PDH
Glucose
Pyruvate
Acetyl CoA
L-Lactate
LDH
Krebs
Cycle
ATP
Aerobic
conditions
Anaerobic
conditions
Mitochondria
Cytosol

20
2.4.2 D-Lactate and D-Lactic Acidosis
2.4.2.1 D-Lactate Production
Although L-lactate is the predominant form of lactate found in blood, small amounts of
D-lactate are produced endogenously in humans and calves through the glyoxalase pathway in
the cytosol of all cells (McLellan & Thornalley, 1989; Thornalley, 1993). The glyoxylase
system detoxifies and catalyses the conversion of methylglyoxal, a reactive glycating agent,
formed when carbohydrates, lipids, and amino acids are metabolized (Figure 2.3). Through this
system, methylglyoxal is metabolized to D-lactate via the intermediate S-D-lactoylglutathione,
two enzymes: glyoxylase 1 (Glo1) and glyoxylase 2 (Glo2), and reduced glutathione (Kalapos,
2008; Xue, Rabbani & Thornalley, 2011; McLellan & Thornalley, 1989). In healthy
physiological conditions, the amounts of D-lactate produced by this pathway are thought to be
minimal.
D-Lactate is also normally produced in the gastrointestinal tract of humans and animals
through the bacterial fermentation of carbohydrates (i.e. fibre and incompletely digested starch,
lactose, and proteins) (Duncan, Louis, & Flint, 2004; Halperin & Kamel, 1996). A heterogeneous
group of lactic acid producing bacteria is found in the gastrointestinal tract which can produce D-
lactate, L-lactate, or both including gram-positive Streptococcus, Pediococcus, Lactobacillus,
Leuconostoc, Bifidobacterium, and Eubacterium spp. (Duncan et al., 2004; Hove & Mortensen,
1995). Some bacteria also possess DL-lactate racemase, an enzyme that changes one lactate
isomer to the other (Hove & Mortensen, 1995). In healthy humans, colonic lactate is further
metabolized to short chain fatty acids. A study by Bourriaud et al (2004) suggests butyrate is the
major net product of lactate conversions. Total DL-lactate concentrations in human feces are
typically less than 2-3 mmol/L (Hove & Mortensen, 1995; Mortensen, Hove, Clausen, & Holtug,
1991). In healthy neonatal animals, a wide variation of fecal D-lactate concentrations have been
reported in the literature ranging from 1.2-24.4 mmol/L (Omole et al., 2001; Ewaschuk et al.,
2004a; Shimomura & Sato, 2006; Sato & Koiwa, 2008). In calves, Sato & Koiwa (2008)
observed fecal lactate concentrations to be at its highest at one week of age and progressively
decreases with advancing age suggesting newborn calves depend on the colon rather than the
rumen for gut fermentation as they obtain most of their nutrients from liquid milk.

21
Figure 2.3 Endogenous D-lactate production. The glyoxalase pathway produces D-lactate
via the intermediate S-D-lactoglutathione. It uses two enzymes, glyoxalase I and
glyoxalase II, and a catalytic amount of reduced glutathione. Adapted from
(Ewaschuk et al., 2005; Thornalley, 1993)
Despite the D-lactic acid producing bacteria in the gastrointestinal tract and endogenous
production via methylglyoxal pathway, D-lactate does not appear to pose a threat to the acid-
base balance in healthy humans and calves. Only very small amounts, usually unquantifiable
and undetectable by routine laboratory tests, of D-lactate are present in the blood of healthy
humans and calves and accounts for about 1-5% of L-lactate concentrations (McLellan, Phillips,
& Thornalley, 1992). In the literature, D-lactate concentrations in healthy adult humans have
been reported to be less than 0.1 mmol/L (Ewaschuk et al., 2005; Hove & Mortensen, 1995;
McLellan, Phillips, & Thornalley, 1992; de Vrese & Barth, 1991; Herrera, Morris, Johnston &
Griffiths, 2008). Few studies have examined blood D-lactate reference ranges in children.
Connolly, Abrahamsson & Björksten (2005) reported D-lactate concentrations similar to that of
Glucose Proteins Lipids
Methylglyoxal
acetone triose-phosphates aminoacetone
Glyoxalase I
Glyoxalase II
D-Lactate
S-D-Lactoylglutathione
Reduced Glutathione

22
adults ranging from 0.03-0.055 mmol/L while Herrera et al. (2008) reported a mean plasma D-
lactate of 0.011 mmol/L. In healthy neonatal animals, blood D-lactate concentrations of 0.20-
1.40 mmol/L have been reported (Abeysekara, Naylor, Wassef, Isak, & Zello, 2007; Ewaschuk
et al., 2003; Ewaschuk et al., 2004a; Lorenz, 2004).
2.4.2.2 Transport and Metabolism
Once D- and/or L-lactate are produced in the gastrointestinal tract they can be absorbed
into the blood via the large intestinal epithelium. Transport of lactate is achieved via proton-
linked monocarboxylate transporters (MCTs) which are found in almost all tissues including
skeletal muscle, heart, brain, liver and intestinal epithelial cells (Halestrap & Price, 1999). MCTs
have been identified on the apical and basalateral membranes in the colon (Gill et al., 2005).
More specifically, MCT-1 has been identified on the basalateral membranes of colonic
enterocytes and is thought to be the major transport mechanism by which lactate, pyruvate, and
short chain fatty acids enter the systemic circulation from the gastrointestinal tract (Lam,
Felmlee, & Morris, 2009; Iwanaga, Takebe, Kato, Karaki, & Kuwahara, 2006; Gill et al., 2005).
Once in the blood, D-lactate was initially thought to be metabolized very slowly as humans did
not appear to have an enzyme specifically for the D-isomer, D-lactate dehydrogenase (D-LDH)
(Stolberg et al., 1982). To date, a large body of evidence now supports the ability of humans to
effectively metabolize D-lactate (Connor, Woods, & Ledingham, 1983; Oh et al., 1985; Hove &
Mortensen, 1995). After administering human volunteers with 6.4 mmol/kg of racemic DL-
lactic acid, de Vrese, Koppenhoefer, & Barth (1990) reported a D-lactate half life of 28.6 ± 4.3
minutes with less than 2% of D-lactate excreted in the urine during 24 hours following intake
with no significant decrease in blood pH.
In mammals, the enzyme, D-α-hydroxy-acid dehydrogenase, is thought to be responsible
for metabolizing D-lactate to pyruvate and is found to be highly active in the kidney and liver
(Uribarri et al., 1998). This enzyme is non-specific as it contains substrates for other D-2-
hydroxy acids and metabolizes D-lactate to pyruvate at approximately one-fourth the rate that L-
lactate dehydrogenase metabolizes L-lactate (Ewaschuk et al., 2005; Tubbs, 1965). More
recently, hepatic mitochondrial putative D-lactate dehydrogenase has been isolated and is similar
to the D-LDH found in lower organisms (de Bari, Atlante, Guaragnella, Principato, & Passarella,
2002; Flick & Konieczny, 2002). From the blood, lactate enters the liver via proton-dependent
23
MCTs, is transported into the mitochondria and oxidized by putative D-LDH to pyruvate (Poole
& Halestrap, 1993; de Bari et al., 2002).
In the kidney, L- and D-lactate mutually interfere with their renal re-absorption (de Vrese
et al., 1990; Oh et al., 1985). Oh et al. (1985) found complete re-absorption of L-lactate when
blood D-lactate concentrations were less than 3 meq/L; but when D-lactate concentrations
exceeded 3 meq/L, re-absorption of L-lactate was impaired resulting in increased urinary
excretion of this isomer. When compared to the interference of L-lactate with D-lactate, re-
absorption of L-lactate is more efficient (Oh et al., 1985). The mechanisms behind this are not
yet clear but it has been proposed that D- and L-lactate use the same co-transport mechanism
with sodium but with a greater affinity for the L-lactate (Oh et al., 1985). Small amounts of D-
lactate are excreted in the urine and, in healthy adults; urinary D-lactate concentrations have
been reported to be < 0.7 mmol/L (Hove & Mortensen, 1995). In healthy infants and children,
urinary excretion of D-lactate is found to be highest during the first year of life ranging from 6.4-
39.9 mmol/mol creatinine which then decreases and stabilizes from 2.5 to 4 years of age
(Haschke-Becher, Baumgartner, & Bachmann, 2000). D-lactate is also excreted in the urine of
healthy neonatal calves with concentrations ranging from 0.5-7.4 mmol/L (Ewaschuk et al.,
2004a).
2.4.2.3 D-Lactic Acidosis in Humans
In humans, D-lactic acidosis has been defined as “metabolic acidosis accompanied by
increase in serum D-lactate concentration in excess of 3 mmol/L” (Uribarri et al., 1998). Human
cases of D-lactic acid were first described in adults and children in 1979 and 1980, respectively
(Uribarri et al., 1998; Oh et.al, 1979; Schoorel, Biesberts, Blom & van Geldern, 1980). This type
of acidosis is considered to be rare and the majority of cases are reported as a clinical
complication of short-bowel syndrome (Vella & Farrugia, 1998; Hove & Mortensen, 1985; Al
Chekakie et al., 2004; Bongaerts et al., 1995). More recently, Grünert et al. (2010), reported D-
lactic acidosis in a child with carbohydrate malabsorption syndrome of an unknown cause.
Propylene glycol ingestion has also been reported as a cause of D-lactic acidosis (Christopher,
Eckfeldt, & Eaton, 1990; Jorens et al., 2004).
D-Lactic acidosis may or may not include neurological symptoms. Clinical signs and
symptoms appear to be non-specific and vary in duration. A correlation has not been shown
24
between D-lactate levels and the severity of D-lactic acidosis symptoms which include slurred
speech; blurred vision; confusion; disorientation; delirium; dizziness; ataxia; lethargy; lack of
concentration; somnolence; hallucinations; weakness; unsteady gait; irritability; nystagmus; and
even abusive/hostile behaviour (Uribarri, et al., 1998; Stolberg et al., 1982; Al Chekakie et al.,
2004). D-lactic acidosis has also been associated with episodes of encephalopathy and recurrent
encephalopathy (Htyte et al., 2011; Grünert et al., 2010; Munakata et al., 2009; Uribarri et al.,
1998; Abeysekara et al., 2007). Physiological conditions required for the development of D-
lactic acidosis have been proposed by Uribarri et al. (1998) and include: carbohydrate
malabsorption, d-lactic producing colonic bacteria, consumption of large amounts of
carbohydrates, reduced colonic motility, and/or impaired D-lactate metabolism. These
conditions are present, most often, in SBS and its pathophysiology is further described in Section
2.4.2.3.1. Interestingly, these conditions are similar to those found in acute diarrhea, however,
little research has examined whether or not D-lactic acidosis in humans with acute diarrhea in
absence of SBS. Sack et al. (1982) investigated acidosis and carbohydrate malabsorption in
infants with rotavirus diarrhea and found little detectable fecal bicarbonate, but the origin of the
acidosis was never identified.
D-Lactic acidosis occurs as a result of increased D-lactate production caused by excessive
fermentation of carbohydrate in the gastrointestinal tract and accumulation in the blood. High
fecal D-lactate concentrations provide evidence for the intestinal origin of D-lactic acidosis
rather than overproduction via methylglyoxal pathway as described in Section 2.4.2.1 (Hove &
Mortensen, 1995). Stolberg et al. (1982) describe fecal flora in D-lactic acidosis as “markedly
abnormal” with the majority being gram-positive anaerobes known to produce D-lactate
including lactobacillus, eubacterium, and bifidobacterium species. Administration of oral
antibiotics, vancomycin, resulted in the return of “normal” stool flora and less D-lactic produced
by cultured bacteria (Stolberg et al., 1982).
2.4.2.3.1 Short Bowel Syndrome
Short bowel syndrome (SBS) has been defined as inadequate functional bowel to support
nutrient and fluid requirements. In terms of bowel length, 100–120 centimetres (cm) of small
bowel without a colon, 50 cm of small bowel with a colon, or a 70%–75% loss of small bowel
may result in symptoms associated with SBS (Parrish, 2005). As a result of this loss, the ability

25
to digest and absorb nutrients is impaired and diarrhea, dehydration and nutrient deficiencies are
often documented in SBS (Puwanant, Mo-Suwan, & Patrapinyokul, 2005; Bongaerts et al., 1997;
Parrish, 2005).
The pathogenesis of D-lactic acidosis in SBS is well described in the literature. The
shortening, or removal, of the small intestine may result in the malabsorption of fluid and
nutrients. A larger than normal amount of substrate (i.e. carbohydrates) delivered to the colon
increases bacterial fermentation producing an unusually high amount of organic acids (short
chain fatty acids, D- and L-lactic acid). The accumulation of these organic acid results in
decreased lumen pH which, in turn, leads to a loss in the normally predominant bacterial flora,
bacteroides species, and favours the growth of acid-resistant, gram positive, D- and L-lactate
producing anaerobic bacteria (i.e. Lactobacillus) (Al Chekakie et al., 2004; Uribarri, et al.,
1998). Larger than normal amounts of D- and L-lactate acid are then produced in the
gastrointestinal tract and absorbed into the systemic circulation. Once absorbed, L-lactate is
more effectively metabolized which leads to elevated blood D-lactate and D-lactic acidosis
(Hove & Mortensen, 1995; Ewaschuk et al., 2005; Petersen, 2005).
Neurological symptoms associated with D-lactic acidosis may resolve with or without
treatment (Al Chekakie et al., 2004). Treatment of D-lactic acidosis usually begins with fluid
and electrolyte replacement with sodium bicarbonate to correct the acidosis. To reduce the
formation of D-lactate in the gastrointestinal tract, treatment may also include the use of
antibiotics and restriction of carbohydrates to reduce the quantity of substrate for bacterial
fermentation (Uchida et al., 2004; Al Chekakie et al., 2004).
2.4.2.4 D-Lactic Acidosis in Neonatal Animals with Diarrhea
Although a rare condition in humans, D-lactic acidosis is well known and described in
veterinarian medicine as a consequence of grain overfeeding in adult cattle and ruminal drinking
in calves (Gentile et al., 2009; Dunlop & Hammond, 1965; Ewaschuk et al., 2004a). Initially, in
neonatal calf diarrhea, metabolic acidosis was thought to result from the loss of bicarbonate in
the feces and accumulation of L-lactate in the blood as a result of hypoxic conditions associated
with dehydration. In calves, Kasari & Naylor (1984) observed that acidosis can occur in the
absence of dehydration, which suggested there may be a different origin of metabolic acidosis
than previously thought. Omole et al. (2001) examined the spectrum of organic acids in neonatal

26
diarrheic calves with diarrhea. This study found that diarrheic calves had significantly higher
serum concentrations of pyruvic acid, acetic acid, and D- and L-lactic acids. Results of this
study also revealed that acidosis in diarrheic calves is due, in part, to D-lactic acid accumulation
as the serum concentrations of D- and L-lactate were elevated, in comparison to healthy calves,
and accounted for 64% anion gap increase. Further studies investigating D-lactate in neonatal
calves (Abeysekara et al., 2007; Ewaschuk et al., 2003; Ewaschuk, et al., 2004a; Lorenz, 2004;
Lorenz & Lorch, 2009), lambs (Abeysekara, 2009), and goat kids (Bleul et al., 2006) with
diarrhea support these findings.
Similarly to humans, high concentrations of fecal D-lactate suggest that the
gastrointestinal tract is the primary source of D-lactate production in D-lactic acidosis in
neonatal animals with diarrhea (Ewaschuk et al., 2004a; Omole et al., 2001). The process in
which high amounts of D-lactate are produced is thought to be similar to that in SBS but instead
of carbohydrate malabsorption caused by a shortened gastrointestinal tract, malabsorption results
from the villous atrophy caused by diarrheic enteric pathogens (Ewaschuk et al., 2005;
Ewaschuk et al., 2006). Recent research in diarrheic lambs and calves also suggest that high
levels of blood D-lactate appear after high levels of D-lactate are produced in the gastrointestinal
tract. In other words, a potential gastrointestinal threshold may exist for the absorption of D-
lactate into the blood in diarrheic neonatal animals. Using a biphasic (breakpoint) regression
analysis the fecal threshold for D-lactate absorption in lambs and calves was reported to be 10.2
and 8.8 mmol/L, respectively (Abeysekara, 2009; Zello et al., 2009).
D-Lactic acidosis in neonatal calves with diarrhea has been associated with impaired
neurological dysfunction including disturbance of the palpebral and menace reflexes; depression
with weakness and ataxia; impaired posture and behaviour; and coma (Kasari & Naylor, 1984;
Lorenz, 2004). Abeysekara et al (2007) demonstrated that high infusions of D-lactate to calves
can cause acute neurocardiac toxicity; however, the mechanism is not yet clearly understood.
Sodium bicarbonate is usually the treatment of choice for neonatal calves with diarrhea and
acidosis. Once acidosis is corrected and body fluid volume is restored, D-lactate concentrations
are reported to decrease (Kasari & Naylor, 1985; Lorenz & Vogt, 2006). As briefly described in
Section 2.2.2.3, Ewaschuk et al. (2006) investigated whether a probiotic, Lactobacillus
rhamnosus GG would reduce the severity of diarrheal and/or D-lactic acidosis, however, the

27
potential benefits were not clear and further research in the use of probiotics in D-lactic acidosis
is required before recommendations can be made.
2.5 Methodology for the Analysis of D- and L-Lactate
In the clinical setting, analytical methods do not routinely measure D- and L-lactate
concentrations separately (i.e. blood gas and portable lactate analyzers) and assays for specific
D- and L-lactate isomers are generally not available (Talasniemi, Pennanen, Savolainen,
Niskanene & Liesivuori, 2008). Measuring total lactate in biological fluids provides limited
information on the origin of lactate production. Analyzing biological fluids, such as blood and
feces, for each lactate isomer can provide important information on the origin of the acidosis and
clinical diagnosis (i.e. D-lactic acidosis) in order to initiate appropriate and effective medical
treatment. Several methods are available for measuring D- and L-lactate in biological materials
including enzymatic assays, high performance liquid chromatography (HPLC), HPLC coupled
with tandem mass spectrophotometer (HPLC/MS/MS), gas chromatography coupled with mass
spectrophotometer (GC-MS) and capillary electrophoreseis (CE) (Herrera et al., 2008;
Ewaschuk, Naylor, Barabash, & Zello, 2004; Ewaschuk, Zello, Naylor, & Brocks, 2002; Henry,
Marmy Conus, Steenhout, Béguin, & Boulat, 2011). In regards to D-lactate analysis, many of
these methods are used to determine, or diagnose, D-lactic acidosis (> 3 mmol/L). The
enzymatic assay method is described in further detail below.
2.5.1 Enzymatic Methods
Enzymatic assays are commonly used to determine D- and L-lactate concentrations in
biological fluids using ultraviolet or fluorometric detection (Talasniemi et al, 2008; Herrera et
al., 2008; Haschke-Becher et al., 2000; McLellan, Phillips & Thornalley, 1992). For
quantification of L-lactate, the enzymatic method requires two coupled reactions and is based on
the oxidation of lactate to pyruvate by lactate dehydrogenase (LDH) with reduction of NAD+ to
NADH (Figure 2.4, part 1). The second reaction removes pyruvate to shift the equilibrium
towards production of NADH. Pyruvate is converted to L-alanine and 2-oxoglutarate by reacting
with L-glutamate and catalyzed by the enzyme, L-alanine aminotransferase (Figure 2.4, part 2).

28
1. L-lactate + NAD+ pyruvate + NAD + H
+
2. pyruvate + L-glutamate L-alanine + 2-oxolglutarate
Figure 2.4 Chemical reactions for the measurement of L-lactate
The amount of NADH produced in the reaction using spectrophotometry at absorbance of 340
nm is directly proportional to the amount of L-lactate in the sample (Ewaschuk et al., 2002;
Herrera et al., 2008; Talasniemi et al., 2008). D-lactate is measured using the same reactions. In
the first reaction (Figure 2.4, part 1), D-lactate becomes the substrate instead of L-lactate and the
reaction is catalyzed by D-lactate dehydrogenase (D-LDH) instead of lactate dehydrogenase. A
disadvantage of enzymatic methods when measuring D-lactate is the non-specific transformation
of NAD+
to NADH due to oxido-reductases in the samples, which can lead to overestimations of
D-lactate concentrations (Herrera et al., 2008). In response to this effect, modifications to
enzymatic methods have been described including sample deproteinization with perchloric acid
to make the sample protein free (Brandt, Siegel, Waters & Bloch, 1980; McLellan et al., 1992).
Herrera et al. (2008) validated an enzymatic method, which uses a sample blank correction in
which absorption of a sample blank is subtracted from total absorbance. In developing this
method, Herrera et al. (2008) also identified that elevated lactate dehydrogenase activity (>1500
IU/L) and L-lactate concentrations may result in underestimation of D-lactate concentrations,
due to the differences in L-LDH and D-LDH affinity for NAD+. Sample ultrafiltration
procedures are required to remove such interference (Herrera et al., 2008; Marti et al., 1997).
More recently, Nielsen, Pedersen, Lindholt, Mortensen & Erlandsen (2011) pre-treated samples
with sodium hydroxide (NaOH) to inactivate the L-LDH activity in plasma samples.
The advantage of using the enzymatic method is that many commercial assay kits are
readily available (Talasniemi et al. 2008; Herrera et al., 2008; Nielsen, 2011). These kits are, for
the most part, simple to use and require minimal laboratory equipment (i.e. spectrophotometer)
and can be used in areas where access to more advanced laboratory analysis equipment (i.e.
HPLC) may not be available. The quantitation limit for the enzymatic method has also been
L-ALT
LDH
29
shown to be lower in comparison to other analytical methods. For example, an HPLC method
developed by Ewaschuk et al. (2004b) reported a quantitation limit for D- and L-lactate in calf
feces, rumen fluid and urine of 1.0 mmol/L. In serum, the validated lower limit of quantitation
for D-lactate was 0.5 mmol/L (Omole et al. 2001). Using an enzymatic assay method, Nielsen,
Pedersen, Lindholt, Mortensen, & Erlandsen (2011) reported a D-lactate limit of quantification
of 0.010 mmol/L. In addition to quantifying D-lactate in acidosis, the ability to quantify lower
concentrations of D-lactate may prove to be quite beneficial for the investigation of subclinical
elevations of blood D-lactate as observed in such clinical cases of diabetes mellitus (McLellan,
Thornalley, Benn, & Sonksen, 1994).
2.6 Summary
Diarrhea continues to be a leading cause of morbidity and mortality in both children and
neonatal calves. Despite the cause, diarrhea can result in clinical consequences including
electrolyte disturbances, dehydration, and metabolic acidosis. Metabolic acidosis may arise from
excess, or overproduction, of blood H+
through increased endogenous production of acids
including lactic acid or through the loss of bicarbonate via kidneys or gastrointestinal tract
(Edwards, 2007). In diarrhea, it was initially thought that acidosis arose from the loss of
bicarbonate in the feces and increased production of L-lactate. However, research has shown that
in diarrheic neonatal calves D-Lactate is as a significant contributor to metabolic acidosis (Kasari
& Naylor, 1984; Omole, et al., 2001; Ewaschuk et al., 2004a).
D-Lactic acidosis can result in impaired neurological dysfunction and, in severe cases,
lead to encephalopathy and coma (Kasari & Naylor, 1984; Lorenz, 2004; Uribarri et al., 1998).
As D-lactic acidosis differs from that of L-lactic acidosis, it is important to be able to quantify
both D- and L-lactate concentrations in biological fluids for appropriate diagnosis and clinical
treatment. Upon collection of biological samples, pre-analytical conditions such as blood
processing and storage may influence the stability of various solutes in blood samples following
collection. Most research examines the stability of total lactate, D- and L-, and little is known
about the stability of each lactate isomer. Further research is warranted to examine the stability
of D- and L-lactate concentrations in calf blood samples to ensure a reliable measure of D-
lactate.
In humans, D-lactic acidosis is thought to be rare and the majority of cases are reported
30
as a complication of SBS (Vella & Farrugia, 1998; Hove & Mortensen, 1985; Al Chekakie et
al., 2004; Bongaerts et al., 1995). The conditions reported to support the overproduction of D-
lactate in SBS (i.e. carbohydrate malabsorption, D-lactic acid producing bacteria and reduced
colonic motility) are similar to that found in acute diarrhea. Further research examining whether
elevated D-lactate concentrations and/or D-lactic acidosis occurs in children with acute diarrhea
is needed.
A high concentration of fecal D-lactate in humans with SBS and diarrheic animals
suggests that the gastrointestinal tract is the site of D-lactate production in D-lactic acidosis
(Ewaschuk et al., 2004a; Omole et al., 2001; Uribarri et al., 1998). A study suggests that blood
D-lactate concentrations increase only after high levels are produced in the gastrointestinal tract
and a fecal threshold was proposed (Abeysekara, 2009; Zello et al., 2009). As D-lactate
concentrations below 0.05 mmol/L were considered to be not quantified and an arbitrary value of
0.04 mmol/L was used in the statistical calculations, further research examining a wide range of
diarrhea severity and use of an analytical method to detect D-lactate levels below 0.5 mmol/L
(i.e. enzymatic assay method as described in Section 2.5.1) is warranted to confirm this fecal
threshold in the gastrointestinal tract at which D-lactate enters the systemic circulation in
neonatal calves with diarrhea.

31
CHAPTER THREE
THE EFFECT OF PREANALYTICAL PROCESSING AND STORAGE ON BLOOD D-
AND L-LACTATE CONCENTRATIONS
3.1 Introduction
Metabolic acidosis is defined as a disturbance to the body’s acid-base balance (pH <
7.35) and, if left untreated, can lead to serious clinical complications in both humans and animals
(Edwards, 2007). Identifying the underlying cause and major contributing acid is important for
initiating appropriate clinical treatment. Lactic acidosis is one type of elevated anion gap acidosis
resulting from an increased production and/or decreased clearance of lactate (Morris & Low,
2008b). Lactate is a hydroxycarboxylic acid and exists as two stereoisomers, D-lactate and L-
lactate (Horton, 2002). Under healthy physiological conditions, blood lactate concentrations are
predominately in the form of L-lactate whereas D-lactate is present in very low concentrations.
The term “lactic acidosis” generally refers to the more commonly known condition of L-lactic
acidosis observed in physiological conditions where oxygen delivery is inadequate leading to
tissue hypoxia and excess production of L-lactate (Vernon & LeTourneau, 2010). D-Lactate has
been identified as a significant contributor to metabolic acidosis in diarrheic calves (Kasari &
Naylor, 1984; Omole, et al., 2001; Ewaschuk et al., 2004a) and elevated serum D-lactate
concentrations and D-lactic acidosis (serum D-lactate > 3 mmol/L) has been reported in several
species including diarrheic lambs (Abeysekara, 2009; Lorenz & Lorch, 2009) goat kids (Bleul et
al., 2006), and humans with short bowel syndrome (Uribarri et al., 1998). The clinical
presentation of D-lactic acidosis differs from that of L-lactic acidosis. Altered mental and
physical states such as weakness, ataxia, impaired posture and behaviour have been reported and,
in severe cases, acute and recurrent encephalopathy and coma (Kasari & Naylor, 1984; Kasari &
Naylor, 1986; Lorenz, 2004; Lorenz et al., 2005; Forsyth, Moulden & Hull, 1991; Grünert et al.,
2010; Htyte et al., 2011; Jorens et al., 2004).
Changes in blood constituent concentrations may occur after specimen collection.
Serum or plasma samples that are not promptly separated from red blood cells following
collection may contain artifactually high levels of lactate since red blood cells (RBC) can
continue to uptake and metabolize glucose in vitro and produce both isomers of lactate. In
general, it is recommended that serum and plasma for biochemical analysis be separated from

32
cells as soon as possible and held no more than 4 hours at 4°C prior to processing to prevent
ongoing cellular metabolism and transport of analytes between plasma or serum and cellular
components (Tuck et al., 2009). However, outside the clinical and/or laboratory setting, this may
not always be possible. Samples collected in the field may require temporary storage until
transported to a biochemistry laboratory for analysis. This may result in a delay of blood
centrifugation and exposure of the sample to variable temperatures before analysis. Similar
situations may also occur when blood samples are collected from remote areas (i.e. developing
countries) where access to appropriate storage units, a centrifuge, and/or biochemistry
laboratories may be limited. Storage and processing delays may also occur in clinical chemistry
laboratories, which handle large numbers of samples requiring biochemical analysis. Research
has shown that even a fifteen minute delay in processing human whole blood samples at room
temperature, or storage for 1 hour at 4°C, can result in a significant overestimation of initial
lactate levels (Calatayud & Tenías, 2003). Significant changes in lactate concentration over time
have also been documented in human plasma and serum left in prolonged contact with blood
cells (Boyanton & Blick, 2002).
Previous research on lactate stability has only investigated the change in lactate
concentrations. Less is known about the effects of specimen collection and storage on the blood
levels of specific lactate isomers, D- and L-lactate. As D-lactic acidosis is a unique type of
metabolic acidosis with clinical symptoms differing from that of L-lactic acidosis (i.e.
neurological dysfunctions) it is important to be able to quantify both D- and L-lactate
concentrations in blood for proper clinical diagnosis and treatment to prevent acidosis and reduce
overall acidosis associated morbidity and mortality. As blood is not always collected in a
laboratory and/or clinical setting, the effects of processing and storage need to be determined on
both isomers to ensure a reliable measurement of D- and L-lactate concentrations. The
objectives of this study were to examine changes of D- and L-lactate concentrations over time in
serum and plasma stored (a) in contact with blood cells and (b) after separation via
centrifugation.
33
3.2 Materials and Methods
3.2.1 Subjects
As D-lactic acidosis is a well known complication of neonatal calf diarrhea and biological
samples from these animals are often collected in the field, calves were chosen as the subjects in
this study. Blood samples were obtained from eleven healthy Holstein breed calves, seven to
fifteen days of age, from the Dairy Barn of the Department of Animal and Poultry Sciences,
College of Agriculture and Bioresources, University of Saskatchewan. From five of the eleven
calves, both serum and plasma were prepared from the same blood collection. Six of the eleven
calves were used for preparation of either serum (3 calves) or plasma samples (3 calves). This
work was approved by the University of Saskatchewan’s Animal Research Ethics Board, and
adhered to the Canadian Council on Animal Care guidelines for humane animal use (Appendix
A).
3.2.2 Sample Collection and Analysis
Blood (60-120 mL), was collected by jugular venipuncture in manually restrained calves.
Samples were processed as shown in figure 3.1. Immediately following collection (time 0), half
of the blood (30-60 mL) was spiked with DL-lactic acid to achieve a final concentration of 3
mmol/L for each isomer (3 mmol/L D-lactate and 3 mmol/L L-lactate; from now on referred to
as “untreated” samples). The blood samples were spiked to mimic those levels seen in calves
with acidosis. The remaining blood was left untreated (from now on referred to as “untreated”
samples).
For each individual calf, half of the spiked and untreated blood samples, respectively,
were distributed into tubes containing lithium heparin (Vacutainer® PST™ Tubes; BD) for
plasma collection and the remaining blood was distributed into Vacutainer® serum tubes with a
proprietary thrombin-based medical clotting agent and a polymer gel (Vacutainer® Rapid Serum
Tubes; BD or Micro Tube; SARSTEDT) for serum collection. Tubes were allowed to stand for
30 minutes at room temperature. Half of the serum and plasma tubes were then centrifuged for
separation of plasma or serum and the remaining half were stored in contact with blood cells at
4°C.
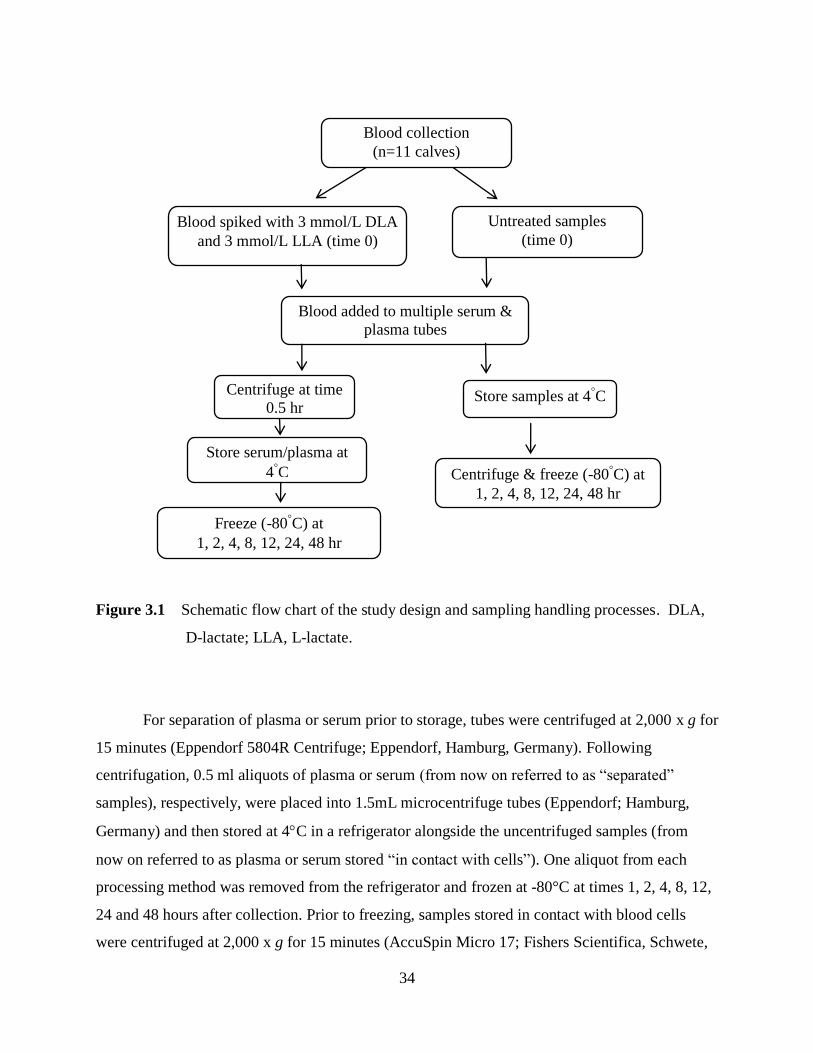
34
Figure 3.1 Schematic flow chart of the study design and sampling handling processes. DLA,
D-lactate; LLA, L-lactate.
For separation of plasma or serum prior to storage, tubes were centrifuged at 2,000 x g for
15 minutes (Eppendorf 5804R Centrifuge; Eppendorf, Hamburg, Germany). Following
centrifugation, 0.5 ml aliquots of plasma or serum (from now on referred to as “separated”
samples), respectively, were placed into 1.5mL microcentrifuge tubes (Eppendorf; Hamburg,
Germany) and then stored at 4C in a refrigerator alongside the uncentrifuged samples (from
now on referred to as plasma or serum stored “in contact with cells”). One aliquot from each
processing method was removed from the refrigerator and frozen at -80°C at times 1, 2, 4, 8, 12,
24 and 48 hours after collection. Prior to freezing, samples stored in contact with blood cells
were centrifuged at 2,000 x g for 15 minutes (AccuSpin Micro 17; Fishers Scientifica, Schwete,
Blood added to multiple serum &
plasma tubes
Blood spiked with 3 mmol/L DLA
and 3 mmol/L LLA (time 0)
Centrifuge at time
0.5 hr
Store serum/plasma at
4˚C
Store samples at 4˚C
Centrifuge & freeze (-80˚C) at
1, 2, 4, 8, 12, 24, 48 hr
Freeze (-80˚C) at
1, 2, 4, 8, 12, 24, 48 hr
Untreated samples
(time 0)
Blood collection
(n=11 calves)
35
Germany) and plasma and serum harvested. As the initial blood processing time following
collection varied, 15 minutes to 1 hour, for statistical comparison, the 1-hour sample was used as
a baseline concentration.
After thawing, D- and L-lactate concentration in serum and plasma samples was
measured using enzymatic assay kits as per manufacturer instructions (Biovision, Mountain
View, CA, USA). The lower and upper detection limits of the assay kits are 0.01-10 mmol/L
and 0.02-10 mmol/L for D-lactate and L-lactate respectively. In order to obtain accurate
measurements within the assay kit detection limits, the serum and plasma spiked with DL-lactic
acid were diluted accordingly. The dilution factors in the spiked serum and plasma samples were
taken into account in the final calculations.
3.2.3 Enzymatic Kit Validation
The enzymatic assays for D- and L-lactate were validated by two researchers. Within
each assay run, lactate standards and blank sample were included for the calibration curve.
Positive and negative controls, standards, blanks, samples, and sample background were
prepared as per manufacturer’s instructions and analyzed in duplicate for each run. Standards
were prepared by diluting an aqueous D-lactate solution (10 mmol/L) with assay buffer in
concentrations of 500 µmol/L, 250 µmol/L, 100 µmol/L, 50 µmol/L, 25 µmol/L, and 10 µmol/L
as per manufacturer’s recommendations. A calibration curve was made in duplicate with each
run and D- and L-lactate concentrations were determined from the calibration curve. Within-run
and between run precision was assayed in each batch by using positive controls in duplicate (CV
was less than 15% for both D- and L-lactate respectively). The mean recovery for the D-lactate
assay ranged from 96%-101% and for the L-lactate assay it ranged from 99.1%-104.8%.
3.2.4 Statistical Analysis
Results are presented as mean ± standard deviation (SD) for all animals. The time-
dependent changes of total, D-lactate, and L-lactate concentrations in samples were analyzed
using an Analysis of Variance (ANOVA) with Ryan-Einot-Gabriel-Welsch F-test as the post hoc
test. As there was variability in blood processing time following initial collection, the 1 hour
time point was chosen as the baseline concentration value to which all subsequent concentrations
were compared. A P-value of < 0.05 was considered to be statistically significant. The changes

36
in total lactate concentrations over time were further analyzed by linear regression. As both
serum and plasma samples from a subset of calves (n=5) were obtained at the same time during
collection, the differences between D- and L-lactate concentrations in serum and plasma were
analyzed by a paired t-test. Again, a P-value of < 0.05 was considered to be statistically
significant. All statistics were calculated, and graphs created, using GraphPad Prism 5 for
Windows (GraphPad Software, San Diego California, USA) and SPSS 13.0 (SPSS Inc., Chicago,
IL, USA).
3.3 Results
When comparing pooled D-lactate concentrations at all time points between untreated
serum and plasma samples stored under the same conditions, D-lactate concentration in serum
samples stored in contact with blood cells (Figure 3.2[A]) and in separated serum samples
(Figure 3.2[B]) were found to be 13.67 % and 13.51% higher, respectively, than corresponding
plasma D-lactate concentrations (P < 0.05). In contrast, L-lactate concentrations in untreated
plasma samples stored in contact with blood cells were found to be 11.78% higher than
corresponding serum L-lactate concentration (P < 0.05; Figure 3.3[A]) There was no difference
between serum and plasma L-lactate concentrations in untreated samples stored separated from
blood cells (Figure 3.3[B]).
In untreated calf serum samples stored in contact with blood cells, total lactate
concentrations (calculated by addition of measured D- and L-lactate concentrations) increased
significantly by 76.4% (4.45 mmol/L compared to 2.52 mmol/L) at 48 hours when compared to 1
hour (Figure 3.4 [A]). No significant differences were observed in total lactate concentrations
when blood was centrifuged following collection and serum was stored separated from blood
cells (Figure 3.4[A]). While a similar trend was observed in plasma samples, the increase over
time in total lactate concentration in samples stored in contact with blood cells was not
significant (Figure 3.4 [B]).
D- and L-lactate concentrations in all samples stored separated from blood cells were
stable up to 48 hours when stored at 4°C (Figures 3.5, 3.6, 3.7 & 3.8). D-lactate in untreated
serum samples stored in contact with blood cells was significantly increased at 48 h (increase of
82.3%; 0.708 mmol/L compared to 0.377 mmol/L; P < 0.05) compared to the 1 hour samples.
(Figures 3.5 [A]). Although there appears to be an increasing trend in D-lactate concentration in
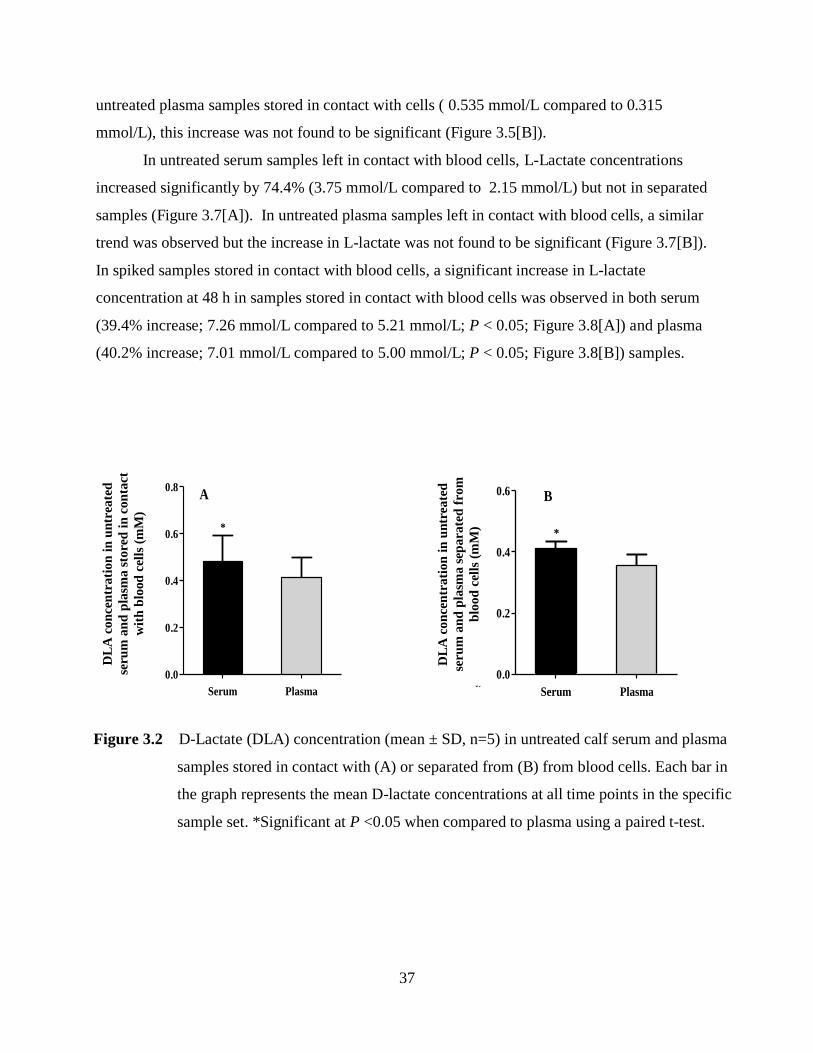
37
untreated plasma samples stored in contact with cells ( 0.535 mmol/L compared to 0.315
mmol/L), this increase was not found to be significant (Figure 3.5[B]).
In untreated serum samples left in contact with blood cells, L-Lactate concentrations
increased significantly by 74.4% (3.75 mmol/L compared to 2.15 mmol/L) but not in separated
samples (Figure 3.7[A]). In untreated plasma samples left in contact with blood cells, a similar
trend was observed but the increase in L-lactate was not found to be significant (Figure 3.7[B]).
In spiked samples stored in contact with blood cells, a significant increase in L-lactate
concentration at 48 h in samples stored in contact with blood cells was observed in both serum
(39.4% increase; 7.26 mmol/L compared to 5.21 mmol/L; P < 0.05; Figure 3.8[A]) and plasma
(40.2% increase; 7.01 mmol/L compared to 5.00 mmol/L; P < 0.05; Figure 3.8[B]) samples.
Serum Plasma
0.0
0.2
0.4
0.6
0.8
*
DL
A c
on
cen
trati
on
in
un
sp
iked
calf
seru
m o
r p
lasm
a
in
co
nta
ct
wit
h b
loo
d c
ell
s (
mM
)
Serum Plasma
0.0
0.2
0.4
0.6
*
DL
A c
on
cen
trati
on
in
un
sp
iked
sep
erate
d c
alf
pla
sm
a o
r s
eru
m (
mM
)
A B
Figure 3.2 D-Lactate (DLA) concentration (mean ± SD, n=5) in untreated calf serum and plasma
samples stored in contact with (A) or separated from (B) from blood cells. Each bar in
the graph represents the mean D-lactate concentrations at all time points in the specific
sample set. *Significant at P <0.05 when compared to plasma using a paired t-test.
DL
A c
on
cen
trati
on
in
un
trea
ted
seru
m a
nd
pla
sma s
tore
d i
n c
on
tact
wit
h b
lood
cel
ls (
mM
)
DL
A c
on
cen
trati
on
in
un
trea
ted
seru
m a
nd
pla
sma s
epara
ted
fro
m
blo
od
cel
ls (
mM
)

38
0 120
2
4
6 C
S
1 2 4 8 24 48
*
Time (hours)
To
tal
LA
co
ncentr
atio
n i
n
cal
f se
rum
(m
M)
0 120
2
4
6 C
S
1 2 4 8 24 48
Time (hours)
To
tal
LA
co
ncentr
atio
n i
n
cal
f pla
sma
(mM
)
A B
Serum Plasma
0
1
2
3
4
*
LL
A c
on
cen
trati
on
in
un
sp
iked
calf
seru
m o
r p
lasm
a
in c
on
tact
wit
h b
loo
d c
ell
s (
mM
)
Serum Plasma
0
1
2
3
4
LL
A c
on
cen
trati
on
in
un
sp
iked
sep
erate
d
calf
seru
m o
r p
lasm
a (
mM
)
A B
Figure 3.4 Total lactate (LA) concentration (mean ± SD, n=8) in untreated calf serum (A) and
plasma (B) stored in contact with (contact, C) or separated from (separated, S) blood
cells at 1, 2, 4, 8, 12, 24, and 48 hours. *Significant at P <0.05 using Ryan-
Einot-Gabriel-Welsch multiple F test. Total lactate (LA) was calculated by adding [D-
lactate] and [L-lactate].
Figure 3.3 L-Lactate (LLA) concentration (mean ± SD, n=5) in untreated calf serum and plasma
samples stored in contact with (A) or separated from (B) from blood cells. Each bar in
the graph represents the mean D-lactate concentrations at all time points in the specific
sample set. *Significant at P <0.05 when compared to plasma using a paired t-test.
LL
A c
on
cen
trati
on
in
un
trea
ted
seru
m a
nd
pla
sma s
tore
d i
n c
on
tact
wit
h b
lood
cel
ls (
mM
)
LL
A c
on
cen
trati
on
in
un
trea
ted
seru
m a
nd
pla
sma s
epara
ted
fro
m
blo
od
cel
ls (
mM
)

39
0 120.0
0.5
1.0
1.5
C
S
1 2 4 8 24 48
Time (hours)
DL
A c
on
cen
trati
on
in
un
treate
d
calf
seru
m (
mM
)
*
0 120.0
0.2
0.4
0.6
0.8
1.0
1 2 4 8 24 48
C
S
Time (hours)
DL
A c
on
cen
trati
on
in
un
treate
d
calf
pla
sma (
mM
)
A B
0 120
2
4
6
8
1 2 4 8 24 48
C S
Time (hours)
DL
A c
on
cen
trati
on
in
spik
ed
calf
seru
m (
mM
)
0 120
2
4
6
8
1 2 4 8 24 48
C S
Time (hours)
DL
A c
on
cen
trati
on
in
spik
ed
calf
pla
sma (
mM
)
A B
Figure 3.5 D-Lactate (DLA) concentration (mean ± SD, n=8) in untreated calf serum (A) and
plasma (B) samples stored in contact with (contact, C) or separated from (separated, S)
blood cells at 1, 2, 4, 8, 12, 24, and 48 hours. *Significant at P <0.05 using Ryan-Einot-
Gabriel-Welsch multiple F test.
Figure 3.6 D-Lactate (DLA) concentration (mean ± SD, n=8) in spiked calf serum (A) and
plasma (B) samples stored in contact with (contact, C) or separated from (separated, S)
blood cells at 1, 2, 4, 8, 12, 24, and 48 hours.

40
0 120
2
4
6
1 2 4 8 24 48
C
S *
Time (hours)
LL
A c
on
cen
trati
on
in
un
treate
d c
alf
seru
m (
mM
)
0 120
2
4
6
1 2 4 8 24 48
C
S
Time (hours)
LL
A c
on
cen
trati
on
in
un
treate
d c
alf
pla
sma (
mM
)
A B
0 120
2
4
6
8
10
1 2 4 8 24 48
C
S*
Time (hours)
LL
A c
on
cen
trati
on
in
spik
ed
calf
seru
m (
mM
)
0 120
2
4
6
8
10
1 2 4 8 24 48
*
C
S
Time (hours)
LL
A c
on
cen
trati
on
in
spik
ed
calf
pla
sma (
mM
)
A B
Figure 3.8 L-Lactate (LLA) concentration (mean ± SD, n=8) in spiked calf serum (A) and
plasma (B) samples stored in contact with (contact, C) or separated from (separated, S)
blood cells at 1, 2, 4, 8, 12, 24, and 48 hours. *Significant at P <0.05 using Ryan-Einot-
Gabriel-Welsch multiple F test.
Figure 3.7 L-Lactate (LLA) concentration (mean ± SD, n=8) in untreated calf serum (A) and
plasma (B) samples stored in contact with (contact, C) or separated from (separated,
S) blood cells at 1, 2, 4, 8, 12, 24, and 48 hours. *Significant at P <0.05 using Ryan-
Einot-Gabriel-Welsch multiple F test.
41
3.4 Discussion
For some assays, serum and plasma samples are considered to be equivalent while for
others (i.e. bile acids, potassium, aldolase, lactate dehydrogenase) results obtained from serum
and plasma samples can differ significantly to the point that clinical decisions are altered (Miles,
Roberts, Putnam & Roberts, 2004). In this study, D-lactate concentration in calf serum left in
contact with, and separated from, blood cells were 13.67 % and 13.51% higher respectively
when compared to plasma. L-lactate concentration in calf plasma stored in contact with blood
cells was 11.78 % higher when compared to calf serum stored in contact with blood cells. The
magnitude of change between plasma and serum D- and L-lactate concentrations is not likely
large enough to alter clinical decisions and treatment. However, although the difference between
plasma and serum in D- and L-lactate concentrations may be small, it is important to establish a
standard collection method and samples should be handled in the same way throughout the entire
analytical process (Tuck et al., 2009).
In laboratory investigations, stability has been defined as “the capability of a sample for
analysis to retain the initial property of a measured constituent for a period of time within
specified limits when the sample is stored under defined conditions” (WHO, 2002). Processing
and storage of biological samples can have significant effects on stability and analytical
reliability. Identification of pre-analytical conditions that cause significant increases in D- and
L-lactate concentrations can be useful in preventing unreliable research conclusions, assessments
of D- and L-lactate concentrations, and potentially prevent unnecessary treatment interventions.
This study was conducted for two reasons. First, elevated concentrations of D-lactate, rather
than L-lactate, are associated with the neurological dysfunctions observed in diarrheic calves
with acidosis and secondly, although samples are often collected outside of a clinical/laboratory
setting, little is known about the effect of pre-analytical processing and storage on the stability
specific D- and L-lactate isomers. This study investigated the stability of both lactate isomers,
D- and L-lactate, over time, in serum and plasma samples stored at 4°C. Samples were stored
after separation by centrifugation or in contact with blood cells.
In this study, total lactate increased over time in serum samples stored in contact with
blood cells which is consistent with the literature. The concentration difference reached
statistical significance (p< 0.05) at 48 hours when compared to the 1 hour reference samples. At
room temperature, Boyanton and Blick (2002) reported that serum or plasma with prolonged
42
contact with blood cells prior to centrifugation and analysis can result in significant increases in
total lactate concentrations at four hours. The difference in time reaching statistical significance
may be due to the difference in study storage temperatures, as colder temperatures have been
shown to slow the production of lactate (Astles et al., 1994), and may suggest a species and age
difference.
This study further demonstrated that D-lactate concentrations in untreated serum samples
stored in contact with blood cells increased over time and differed significantly from the 1 hour
reference samples at 48 hours (P < 0.05). Though not statistically significant, a trend towards
increased D-lactate concentration over time was also seen in the untreated plasma samples stored
in contact with blood cells. D-lactate production may continue after blood is collected and stored
as a result of the glyoxylase metabolic pathway. This pathway is present in the cytosol of all
cells, including erythrocytes (McLellan & Thornalley, 1989; Thornalley, 1993). The glyoxylase
system detoxifies and catalyses the conversion of methylglyoxal, a reactive glycating agent,
formed when carbohydrates, lipids, and amino acids are metabolized. Through this system,
methylglyoxal is metabolized to D-lactate (Kalapos, 2008; Xue et al., 2011; McLellan &
Thornalley, 1989). Increases in sample concentration of D-lactate due to this ongoing
glyoxylase system in cells will likely be progressive over time since, once accumulated in vitro,
D-lactate cannot undergo further metabolism (Karg et al., 2009; McLellan & Thornalley, 1989).
One can speculate that continued storage of plasma samples would have eventually resulted in a
significant rise in D-lactate concentrations.
This study also observed that L-lactate concentration increased over time, in untreated
and spiked serum samples, and in spiked plasma samples stored in contact with blood cells. This
progressive increase in blood L-lactate is likely due to ongoing glycolysis, in vitro, between the
time of blood collection and measurement of lactate concentration. After the collection of blood,
if plasma and serum are left in prolonged contact with cells, additional L-lactate can be produced
from glucose by all cellular constituents of blood, including platelets, through ongoing glycolysis
(Astels et al., 1994). Glycolysis is the metabolic pathway by which glucose is converted to
pyruvate and the enzymes required for this process are found in the cytoplasmic compartment of
cells. Pyruvate in collected blood will be reduced to lactate by the enzyme lactate
dehydrogenase. In this process, NADH is oxidized to NAD+
and becomes available for the
glyceraldehyde- 3-phosphate dehydrogenase reaction in the glycolysis pathway. As a result,
43
blood glucose concentration will decrease and L-lactate concentration will increase over time
(Horton et al., 2002; Astels et al., 1994). However, as this study did not measure glucose
concentrations, we can only speculate that this may be one of the mechanism by which this study
observed, over time, increases in L-lactate concentration. In addition, although spiked blood
samples were examined in this study and showed a significant difference in serum and plasma L-
lactate concentration at 48 hours, care should be taken when extrapolating these results to
subjects with clinical cases of acidosis. Further studies should investigate the storage dependent
changes in D- and L-lactate concentrations in serum and plasma, over time, in animals with
clinical acidosis.
As many blood components (i.e. proteins, enzymes, hormones, biochemical substance)
are generally more stable at low temperatures and in serum/plasma, it is recommended that
following collection, cells be separated from serum or plasma and kept cool or frozen during
transport to the laboratory for analysis (Peng et al., 2010; Stahl & Branslund, 2005). This study
demonstrated that both D- and L-lactate concentrations in calf serum and plasma following
separation from blood cells 0.5 hours following collection can be measured for up to 48 hours
when stored at 4°C. The stability of both D- and L-lactate concentrations may be explained by
the immediate separation of plasma and serum from cells which would likely prevent ongoing
production of L-lactate via glycolysis and/or D-lactate via glyoxylase pathway in the cytoplasm
of cells following collection as previously described. Other studies have demonstrated total
lactate concentrations to be stable in human serum and plasma samples immediately separated
from cells for up to 56 hours at room temperature (25°C) (Boyanton & Blick, 2002) and in rat
plasma samples at 4°C (Peng et al., 2010) however this study’s observations on the stability of
specific lactate enantiomers, D- and L-, following centrifugation and storage at 4°C is new.
In some areas, access to a centrifuge for pre-analytical processing may not be available
(i.e. developing countries, field work) and past research has recommended the use of heparinized
whole blood for lactate analysis (WHO, 2002; Wiese et al., 1997). This would eliminate the
need for centrifugation, however, colorimetric enzymatic assay kits, like the ones used in this
study, could not be used to determine lactate concentrations In these readily available lactate
kits, D- and L-lactate is oxidized by L-lactate dehydrogenase and D-lactate dehydrogenase
respectively and generates proportional color. An alternate analysis of lactate could be used for
whole blood (i.e. blood gas analyzers, portable lactate analyzers); however, these analytical

44
procedures, like centrifuges, may not be available and do not distinguish between the D- and L-
lactate isomers. Even in whole blood, it is well known that delays in processing anywhere from
as little as fifteen minutes to one hour can result in significant increases in total lactate
concentrations (Calatayud & Tenís, 2003; Toffaletti et al., 1992; Astles et al., 1994).
As this study investigated storage at 4°C, further research could investigate the use of
different storage temperatures as some remote areas may not have access to refrigeration
immediately following collection (i.e. ice packs, crushed ice). The use of ice packs and wet ice
have shown to slow down, but not eliminate, the production of total lactate however, again, the
stability of specific D- and L- lactate isomers at these variable temperatures remains unknown
(Seymour et al., 2011, Astles et al., 1994; Andersen et al., 2003; Calatayud & Tenís, 2003).
Future research could also explore the use of different anticoagulants and/or antiglycolytic agents
in test tubes for analysis of D- and L-lactate concentrations. Astles et al. (1994) demonstrated
that the use of antiglycolytic agents, sodium fluoride and potassium oxylate, maintained stable
lactate concentrations at room temperature for up to eight hours while le Roux et al. (2004)
demonstrated that collection tubes treated with sodium fluoride, glyceraldehydes, and potassium
oxylate could inhibit glycolysis for up to 24 hours at room temperature prior to centrifugation.
While the use of different antiglycolytic and anticoagulant agents could be explored for use in
research, these tubes are not commonly available and may not be feasible and/or available for
use in remote areas or in a clinical/diagnostic setting.
It is important to have standard blood collection and processing procedures to ensure
reliable and accurate results for proper clinical diagnosis and/or treatment in the clinical setting
and for research. This study was the first to investigate the stability of individual lactate isomers,
D- and L-, over time, stored with or without contact with blood cells. Given the results of this
study, to ensure a reliable measurement of D- and L- lactate concentrations, serum and/or plasma
samples should be centrifuged and separated from blood cells as soon as possible following
collection to stabilize the samples, but can thereafter be stored at 4°C for up to 48 hours without
noticeable changes in D- or L-lactate concentrations.
45
CHAPTER FOUR
D-LACTIC ACIDOSIS IN PEDIATRIC DIARRHEA
4.1 Introduction
Acute diarrhea remains a public health concern as it continues to be a major cause of
mortality and morbidity among children worldwide. Although the mortality rate of children
under five years of age has decreased, diarrhea continues to be the second leading cause of child
death due to infectious disease following pneumonia (Black et al., 2010; UNICEF & WHO,
2004). According to Black et al. (2010), diarrhea accounts for an estimated 1.336 million deaths
globally, approximately 15% of total child deaths, with 51% of deaths occurring in India,
Nigeria, Afghanistan, Pakistan, and Ethiopia. Pediatric diarrhea has many causes; however, the
majority of reported cases are due to infections of the gastrointestinal tract and are attributed to
viral agents (Guandalini, 2005; Malek et al., 2006). Despite the cause, diarrhea can result in
clinical consequences including electrolyte disturbances, dehydration, and metabolic acidosis
and, if left untreated, can lead to death.
Metabolic acidosis as a result of diarrhea was initially thought to be caused by an
overproduction of L-lactate in the tissues by anaerobic metabolism due to dehydration and/or
loss of bicarbonate in the feces (Kasari, 1999; Perez et al., 1987). Research in neonatal animals
has shown that metabolic acidosis in diarrhea can occur in the absence of dehydration with
associated high blood levels of D-lactate (Kasari & Naylor, 1984; Kasari & Naylor, 1986; Omole
et al., 2001; Ewaschuk et al., 2003; Ewaschuk et al., 2004a). D-Lactate is produced primarily by
microorganisms in the gastrointestinal tract, with very small amounts produced endogenously via
the methylglyoxal pathway (Uribarri et al., 1998; Thornalley, 1993). Elevated concentrations of
fecal D-lactate provide evidence that gastrointestinal bacterial fermentation contributes to the
development of acidosis found in diarrheic animals (Omole et al., 2001; Ewaschuk et al., 2004a).
D-Lactic acidosis in humans has been defined as metabolic acidosis that accompanies an
increase in a serum D-lactate concentration greater than 3 mmol/L (Uribarri et al., 1998). It is a
rare clinical condition that is most often reported as a clinical complication of short bowel
syndrome (SBS). Grünert et al. (2010) recently reported a case of D-lactic acidosis with acute
encephalopathy in a child with a carbohydrate malabsorption syndrome of an unknown cause.
Signs and symptoms of D-lactic acidosis appear to be non-specific and can vary in duration.

46
Symptoms reported include slurred speech; blurred vision; confusion; disorientation; delirium;
dizziness; ataxia; lethargy; lack of concentration; somnolence; hallucinations; weakness;
unsteady gait; irritability; and abusive/hostile behaviour (Uribarri et al., 1998; Hove &
Mortensen, 1995; Stolberg et al., 1982; Al Chekakie et al., 2004). D-lactic acidosis has also been
associated with episodes of encephalopathy in humans (Htyte et al., 2011; Grünert et al., 2010;
Munakata et al., 2009; Uribarri et al., 1998) and, in animal studies; high infusions of D-lactate
can cause acute neurocardiac toxicity (Abeysekara et al., 2007).
Identifying D-lactic acidosis in children with acute diarrhea in the absence of SBS has
been poorly examined. This warrants investigation because, like SBS and congenital
carbohydrate malabsorption disorders, infectious diarrhea (i.e. Rotavirus) may result in
carbohydrate malabsorption and acidosis with little detectable fecal bicarbonate (Sack et al.,
1982). The objective of this study was to determine whether D-lactic acidosis occurs in children
with acute diarrhea and metabolic acidosis. Blood obtained from children was analyzed for the
blood parameters that define metabolic acidosis and included concentrations of D-lactate, L-
lactate, and pyruvate. Fecal D-lactate concentrations were also to be determined. To investigate
fecal D-lactate concentrations from samples collected in disposable diapers containing
polyacrylate granules (gel) a small study was conducted as there is no known method available
to exact D-, L-lactate and pyruvate from disposable diapers. The objective of this was to
determine the recovery of D-lactate from a disposable diaper. If D-lactic acidosis occurs in
children with acute diarrhea, treatment strategies could be altered, and/or compliment current
treatments (i.e. oral and/or parenteral rehydration), to target D-lactate producing bacteria and
reduce the clinical complications of D-lactic acidosis.
4.2 Materials and Methods
4.2.1 Study Design
All infants and/or children (≤ 5 years of age) with acute diarrhea, as defined by the World
Health Organization (2009) as “three or more loose liquid stools per day or more frequently than
normal”, and suspected metabolic acidosis were eligible to participate in the study. The sample
size goal was 30 subjects in order to provide data with statistical significance as determined by
previous D-Lactate studies conducted at University of Saskatchewan (Omole et al., 2001;
Ewaschuk et al., 2003; Ewaschuk et al., 2004a; Abeysekara, 2009). Study participants were to

47
be recruited from Royal University Hospital (RUH) in Saskatoon, Saskatchewan. To minimize
invasiveness, diarrhea was to be severe enough to warrant routine clinical investigation of blood
electrolytes. This blood was then to be saved for analysis of lactate isomers and pyruvate
without further subject burden. To obtain a wide range of diarrhea severity, much work was
completed to initiate a similar study to that of RUH in Awassa, Ethiopia as more severe and
prolonged diarrhea is likely to occur in children living in developing countries. Actions taken
and progress on this study are found in Appendix B. This study was approved by the Biomedical
Research Ethics Board at the University of Saskatchewan (Bio-REB # 03-932) and operational
approval granted from the Saskatoon Health Region (Appendix A).
4.2.2 Study Participant Recruitment
Children (≤ 5 years of age) with acute diarrhea and suspected metabolic acidosis were
recruited for the study by physicians, medical residents, and/or nursing staff in the pediatric
emergency room (PedsER) and two pediatric acute care wards at RUH, Saskatoon,
Saskatchewan. Study participants were initially recruited only through the PedsER however, to
identify those children who may have been missed by the PedsER staff, recruitment expanded to
include the two pediatric acute clinical care wards in November, 2010 (Appendix A). Once
identified as being eligible for the study, the attending physician and/or the nutrition study
coordinator described, in detail, the study to the child’s parent(s) and/or legal guardian(s) and, if
agreeable to participate, consent forms were reviewed and signed.
4.2.3 Data Collection
4.2.3.1 Medical Health Records
The medical health record of all study participants were reviewed for biochemical data
associated with defining metabolic acidosis: sodium, potassium, chloride, bicarbonate (total
carbon dioxide), and anion gap. These parameters were measured by RUH clinical biochemistry
laboratory (Cobas 6000®; Roche Diagnostics, IN, USA) as per hospital protocol. As SBS is one
of the few medical conditions in which D-lactic acidosis is a clinical complication, the
medical condition and/or disease that the child may have may be useful information for future
research. Medication history was also reviewed as diarrhea is associated with the use of some
medications (i.e. antibiotics).

48
4.2.3.2 Assessment of Diarrhea Severity
This study adopted the use of the Bristol Stool Form Scale to assess diarrhea severity
(Table 4.1). The scale classifies stool based on its consistency with seven categories ranging
from “separate hard lumps like nuts” (Type 1) to “watery, no solid pieces, entirely liquid” (Type
7). Once consent was obtained, the participant’s parent(s) and/or legal guardian(s) were asked to
rate the child’s feces using the Bristol Stool Form Scale.
Table 4.1 Description of Bristol Stool Rating Scale
Adapted from Lewis & Heaton, 1997.
4.2.4 Sample Collection and Analysis
4.2.4.1 Blood Samples
Once consent was obtained from the participant’s parent(s) and/or legal guardian(s), the
RUH biochemistry laboratory personnel were instructed to store the remaining pediatric blood
samples, approximately 1mL, drawn for clinical electrolyte/blood gas measurements at -80°C
(Appendix C). The reserved blood was drawn prior to initiation of any medical treatment (i.e.
oral and/or parental rehydration solution). All samples were transported to the Irwin Nutrition
Laboratory at College of Pharmacy and Nutrition, University of Saskatchewan and stored at -
80˚C until analysis. After thawing, samples were analyzed for D-lactate, L-lactate, and pyruvate
using commercially available enzymatic assay kits following the manufacturer instructions
(Biovision, Mountain View, CA, USA). The detection limits of the D- lactate, L-lactate, and
Type 1 Separate hard lumps, like nuts (hard to pass)
Type 2 Sausage-shaped but lumpy
Type 3 Like a sausage but with cracks on its surface
Type 4 Like a sausage or snake, smooth and soft
Type 5 Soft blobs with clear-cut edges (passed easily)
Type 6 Fluffy pieces with ragged edges, a mush stool
Type 7 Water, no solid pieces. Entirely Liquid
49
pyruvate assay kits are 0.01-10 mmol/L; 0.02-10 mmol/L; and 1-200 µmol/L, respectively.
When available, blood gas and electrolyte measurements (i.e. Na+, K
+, Cl
-, CO2, AG) of the
reserved blood sample was obtained from the study participants’ medical health record.
4.2.4.2 Fecal Samples
Fecal samples were obtained by collecting the study participants’ disposable diaper
containing diarrheic feces. This simple stool collection method was chosen to encourage
recruitment of study participants and reduce hospital staff burden. Diapers were temporarily
stored on the hospital ward at -20°C and transported to the Irwin Nutrition Laboratory at College
of Pharmacy and Nutrition, University of Saskatchewan and stored at -80˚C. As there is no
known method available to extract the organic acids, D-lactate, L-lactate and pyruvate, from
disposable diapers a small experiment was conducted to determine whether or not the
compounds of interest could be measured.
A clean, dry diaper was cut into two, 3 cm x 3 cm test strips. The two test strips had
three distinct layers including a topsheet, acquisition/distribution layer containing polyacrylate
granules (gel), and backsheet. One test strip was spiked with 10 mL of 10 mmol/L D-lactate. D-
Lactate was allowed to soak into the test strip for approximately ten minutes. The diaper liner
(topsheet) was removed from the test strip and centrifuged in a 50 mL centrifuge tube (FalconTM
;
BD) at 14,000 rpm for 20 minutes. Liquid extracted from the liner (12.5 µl) was then analyzed
for D-lactate using an enzymatic assay kit as per manufacturer instructions (Biovision, Mountain
View, CA, USA). One gram of diaper polyacrylate granules (absorbent gel) from the core of the
diaper was weighed from the remaining test strips and spiked with 10 mL of 10 mmol/L of D-
lactate. D-Lactate was allowed to soak into the gel for approximately ten minutes. The gel was
then dissolved in 20 mL of distilled water and centrifuged in a 50 mL centrifuge tube (FalconTM
;
BD) at 14,000 rpm for 20 minutes. Liquid extracted from the diaper gel (12.5 µl) was analyzed
for D-lactate using an enzymatic assay kit (Biovision, Mountain View, CA, USA).
In this small experiment, 36.5% and 91.2% of the D-lactate spiked to the disposable
diaper liner and polyacrylate granules (gel) in test strip #1 and test strip #2, respectively, was
recovered (Table 4.2). Although the compound of interest, D-lactate, could be recovered from
the disposable diaper, it is unknown if the study participants’ diapers collected contained urine.
D-lactate is known to be excreted in the urine of healthy infants and children with excretion
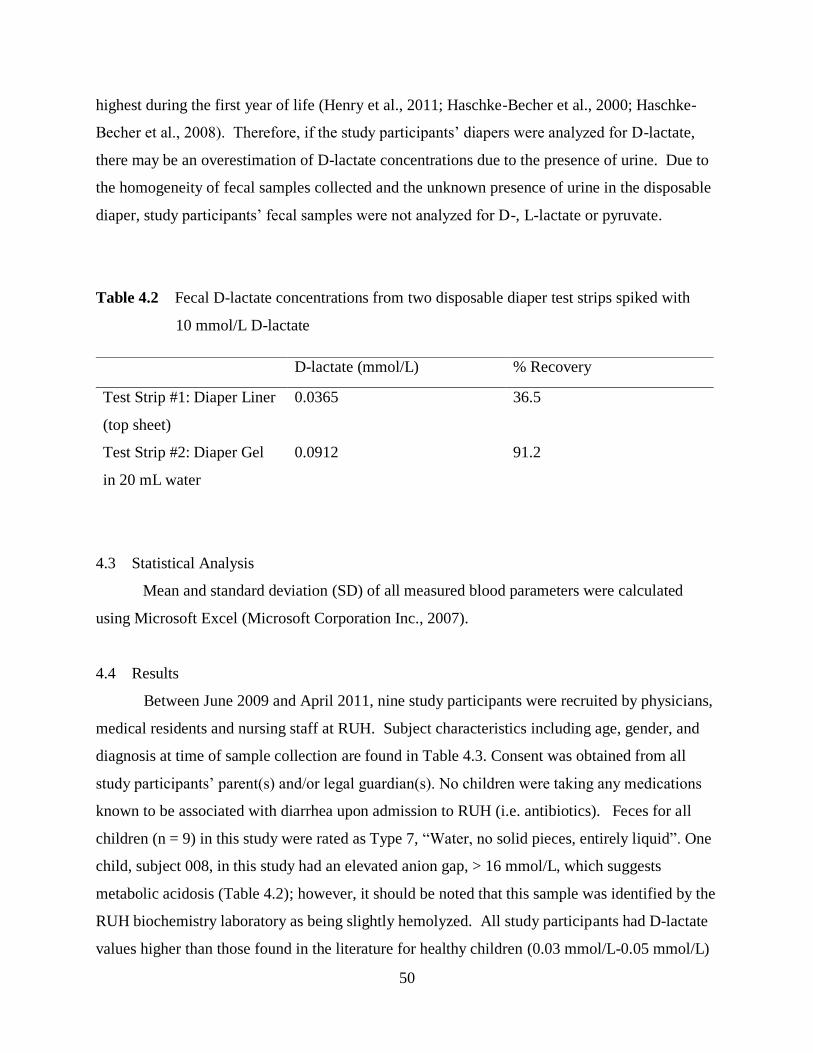
50
highest during the first year of life (Henry et al., 2011; Haschke-Becher et al., 2000; Haschke-
Becher et al., 2008). Therefore, if the study participants’ diapers were analyzed for D-lactate,
there may be an overestimation of D-lactate concentrations due to the presence of urine. Due to
the homogeneity of fecal samples collected and the unknown presence of urine in the disposable
diaper, study participants’ fecal samples were not analyzed for D-, L-lactate or pyruvate.
Table 4.2 Fecal D-lactate concentrations from two disposable diaper test strips spiked with
10 mmol/L D-lactate
4.3 Statistical Analysis
Mean and standard deviation (SD) of all measured blood parameters were calculated
using Microsoft Excel (Microsoft Corporation Inc., 2007).
4.4 Results
Between June 2009 and April 2011, nine study participants were recruited by physicians,
medical residents and nursing staff at RUH. Subject characteristics including age, gender, and
diagnosis at time of sample collection are found in Table 4.3. Consent was obtained from all
study participants’ parent(s) and/or legal guardian(s). No children were taking any medications
known to be associated with diarrhea upon admission to RUH (i.e. antibiotics). Feces for all
children (n = 9) in this study were rated as Type 7, “Water, no solid pieces, entirely liquid”. One
child, subject 008, in this study had an elevated anion gap, > 16 mmol/L, which suggests
metabolic acidosis (Table 4.2); however, it should be noted that this sample was identified by the
RUH biochemistry laboratory as being slightly hemolyzed. All study participants had D-lactate
values higher than those found in the literature for healthy children (0.03 mmol/L-0.05 mmol/L)
D-lactate (mmol/L) % Recovery
Test Strip #1: Diaper Liner
(top sheet)
0.0365 36.5
Test Strip #2: Diaper Gel
in 20 mL water
0.0912 91.2

51
(Connolly et al., 2005). The mean D-lactate concentration was three times higher when
compared to healthy children and 1.5 times higher when compared to healthy adults, < 0.1
mmol/L, (Ewaschuk et al., 2005; Hove & Mortensen, 1995; McLellan et al., 1992; de Vrese &
Barth, 1991; Herrera et al., 2008) in the literature. The mean of all other blood measures, L-
lactate, pyruvate, Na+, K
+, Cl
-, CO2, and AG, were within reference range. No clinical cases of
D-lactic acidosis were observed.
Table 4.3 Age, gender, and diagnosis of children (n=9) with acute diarrhea at time of sample
collection
N/A, not available.
Subject Age (years) Gender Diagnosis
001 0.83 N/A Gastroenteritis
003 1 Male Gastroenteritis
004 2 Female Gastroenteritis
005 1 Male Gastroenteritis
007 3 Female Gastroenteritis
008 1 Female Gastroenteritis
009 N/A Male N/A
010 2 Male
Dehydration secondary
to gastroenteritis
011 1 Male N/A
Mean (n=8) 1.48
SD 0.773

52
Table 4.4 Serum D- and L-lactate, pyruvate, and electrolyte concentrations in children (n=9), ≤ 5
years of age, with acute diarrhea
N/A, not available; AG, anion gap; *Connolly, Abrahamsson & Bjöorkstén (2005); ** Ewaschuk
et al. (2005); Hove & Mortensen (1995); McLellan et al. (1992) de Vrese & Barth, (1991)
Herrera et al. (2008).
D-lactate
mmol/L
L-lactate
mmol/L
Pyruvate
mmol/L
Na+
mmol/L
K+
mmol/L
Cl-
mmol/L
CO2
mmol/L
AG
mmol/L
Literature
values of
healthy
children
0.03-0.05*
< 0.1 (adult)**
< 2.2 0.03-0.08 135-146 3.5-5.1 100-110 18-27 8-16
001 0.183
1.95 0.044 N/A N/A N/A N/A N/A
003
N/A N/A N/A 137 4.1 104 19 14
004 0.147
1.45 0.051 135 4.2 108 18 9
005 0.228
1.46 0.064 136 4.6 107 18 11
007 0.087
1.27 0.046 151 4.3 131 14 6
008 0.198
2.24 N/A 140 6.4 101 15 24
009 0.085
1.48 0.028 N/A N/A N/A N/A N/A
010 0.125
1.77 0.045 136 3.6 109 18 8
011 0.181 1.68 0.089 N/A N/A N/A N/A N/A
Mean 0.154 1.66 0.052 139 4.53 110 17 12
SD 0.052 0.317 0.02 6.05 0.971 10.7 2 6.48
n = 8 n = 8 n = 7 n = 6 n = 6 n = 6 n = 6 n = 6

53
4.5 Discussion
This study found no clinical cases of D-lactic acidosis in children 10 months to 3 years of
age with acute diarrhea as blood D-lactate concentrations of all study participants was below 3.0
mmol/L. These results were not surprising as upon review of blood electrolytes, most
biochemistry values were within reference range with no indication of metabolic acidosis. One
study participant did have an elevated anion gap which may be indicative of an accumulation of
organic acids; however, since this sample was flagged as slightly hemolyzed, values may have
been overestimated. Hemolysis is usually caused by improper specimen collection, processing
and/or transport and results in the breakage of the red blood cell membrane. As a result of this
breakage, hemoglobin and other intracellular components leak into the surrounding fluid and
cause false elevations of some analytes (i.e. ALT, AST, LDH, magnesium, phosphorus and
potassium) or dilution effects (i.e. glucose, sodium, and chloride) (Lippi, Salvagno, Montagnana,
Brocco, & Guidi, 2006). For this study, induced changes in potassium as a result of hemolysis
could have led to a miscalculation of the anion gap.
A limitation of this study is that the acute diarrhea of the study participants may not have
been severe enough to result in the overproduction of D-lactate in the gastrointestinal tract to
result in elevated blood D-lactate concentrations. In this study, attempts were made to measure
diarrhea severity of the study participants. Initially, the Bristol Stool Form Scale (BSFS) was
used however this tool was validated in adults as a measure of stool transit time rather than as a
means of classifying stool form or assessing/ rating diarrhea severity. It was evident early that
study participants would all classified as a “type 7: water, no solid pieces, entirely liquid”;
therefore no useful information regarding diarrhea severity was obtained using the BSFS in
isolation. In the literature, Johnston, Shamseer, da Costa, Tsuyuki, & Vohra (2010) identified a
lack of consensus on the measurements of pediatric acute diarrhea and there does not appear to
be a standard, validated tool used to assess and/or rate severity in acute pediatric diarrhea. Upon
consultation with Dr. Johnston, permission for the use of an instrument developed by thirty
experts in the field of diarrhea and gastroenteritis was granted. This tool, adopted in respect to
diarrhea frequency and duration from Bliss, Larson, Burr & Savik (2001), is known as the
Disease Activity Index Pediatric Gastroenteritis (iPAG). The iPAG was adapted for this study
and consisted of an assessment/scoring of: stool consistency; diarrheal frequency and duration;
54
vomiting frequency and duration; and fever (Appendix E). Use of this tool confirmed that
diarrhea severity amongst the study participants was, in fact, homogeneous.
Although no clinical cases of D-lactate acidosis were part of this study, 66.7% of study
participants had a D-lactate concentration greater than 0.1 mmol/L which, when compared to the
literature, is higher than that found in healthy adults (de Vrese et al., 1990; Hove et al., 1995;
Ewaschuk et al., 2005). There is limited data on blood D-lactate concentrations found in healthy
children. Connolly et al. (2005) investigated the levels of D-lactate in the blood in infants (n=10)
six and twelve months of age and reported a range of 0.03 mmol/L-0.05 mmol/L (Mean: 0.040 ±
0.018 mmol/L). This study investigated blood D-lactate levels in 24 infants supplemented with
Lactobacillus reuteri ATCC 55730 (n=14) or a placebo (n=10) from birth. Blood D-lactate
concentrations were determined at six months and again at 12 months. This substudy is part of a
much larger double blind, placebo controlled clinical trial in infants (n=232) investigating the
effect of exposure to Lactobacillus reuteri on the development of allergy symptoms in the first
year of a child’s life.
D-Lactate can be effectively metabolized in humans by the liver and is also is found to be
excreted in the urine of children (Connor, et al., 1983; Oh et al., 1985; de Vrese et al, 1990; de
Vrese et al, 1991; Uribarri et al., 1998; Ewaschuk et al., 2005; Haschke-Becher et al., 2000;
Haschke-Becher et al., 2008; Henry et al., 2011). D-lactate metabolism requires transport-
mediated mechanisms. Transport of D-lactate into the blood is achieved via proton-linked
monocarboxylate transporters (Halestrap & Price, 1999). Once in the blood, MCTs play a role in
the transport of D-lactate into the liver in which it can be metabolized to pyruvate via hepatic
mitochondrial putative D-lactate dehydrogenase (de Bari et al., 2002). These hepatic metabolic
processes undergo developmental maturation. As the study participants were eight months to
three years of age, the increase in D-lactate concentrations in this study population may be a
result of immature transport mechanisms. The impact of disease (i.e. diarrhea) on the normal
development and maturation rate of enzyme and transporters involved in D-lactate metabolism
and excretion is also unknown. This may warrant further investigation.
Past research in neonatal animals with diarrhea has shown a positive linear correlation
between fecal and serum D-lactate concentrations. High levels of blood D-lactate appear after
high levels are produced in the gastrointestinal tract and there is evidence to suggest that a
gastrointestinal threshold exists for the absorption of D-lactate into the blood in diarrheic
55
neonatal animals (Abeysekara, 2009; Zello, Abeysekara et al., 2009). Based on this evidence, in
addition to determining blood D-lactate concentration, this study was initially designed to
investigate fecal D-lactate concentrations to determine whether or not this finding holds true in
children with acute diarrhea. As discussed previously in the section 4.2.4.2, fecal samples were
collected in the study participants’ disposable diaper in attempt to increase recruitment of study
participants and reduce the PedsER staff burden. This method of fecal collection presented a
challenge to the researchers as, upon review of the literature, there is no known method available
to extract the organic acids, D-lactate, L-lactate and pyruvate, from disposable diapers. Past
investigations using disposable diapers are generally analyzed for microbiological purposes and
the microorganism of interest can be obtained by scraping the diaper surface with a sterile
scraper (Liang & Redlinger, 2003). Modern disposable diapers contain polyacrylate granules, a
superabsorbent polymer, which can absorb up to 300 times its weight in water (Kosemund et al.,
2009; European Disposables and Nonwovens Association, 2008). D-Lactate, L-lactate, and
pyruvate are water soluble; therefore, these organic acids may distribute into the absorbent gel
found in disposable diapers and by merely scraping the surface of the diaper the analysis could
underestimate the actual concentrations of D-lactate, L-lactate and pyruvate in the fecal samples.
Results from the small experiment described in 4.2.4.2 demonstrated that D-lactate is distributed
into, and can be extracted, from a disposable diaper containing polyacrylate granules. D-Lactate
was not bonded to the polyacrylate granules but rather distributed in the water phase surrounding
the granules. As D-lactate was recovered in both the disposable diaper liner and polyacrylate
gel, all diaper layers should be included in analysis. Although the compound of interest can be
recovered, due to the homogeneity of samples collected, the absence of metabolic acidosis, and
the unknown presence of urine in the disposable diaper, this study did not analyze fecal samples
for D-lactate, L-lactate, or pyruvate.
This study is one of few to investigate whether or not D-lactic acidosis occurs in children,
eight months to three years of age, with acute diarrhea in the absence of short bowel syndrome.
Ewaschuk (2004) conducted a similar study. However, blood D-lactate concentrations were not
detectable and/or not quantifiable due to the limit of quantification, 1.0 mmol/L, of the high
performance liquid chromatography assay used. It is possible that the incidence of D-lactic
acidosis in children with acute diarrhea may not be to the extent seen in neonatal animals.
Perhaps this may be explained by differing gastrointestinal physiology, and/or metabolism of D-

56
lactate, that exists between species or perhaps it may be due, in part, that children are often
assessed and treated for illness much sooner than that of animals. Regardless, this research does
warrant further investigation as only nine children were recruited for this study, in which all
samples were homogenous in regards to the severity of diarrhea. Future investigation with more
varying diarrhea severity, including more severe cases with acidosis, may reveal that D-lactic
acidosis does, in fact, occur in children with acute diarrhea and treatment strategies could be
altered to target the D-lactate producing bacteria. Future studies should also investigate fecal D-
lactate concentrations as it is possible that a high D-lactate concentration in a disposable diaper,
regardless if the diaper contained urine or not, may still prove to be a useful biomarker for D-
lactic acidosis. Conversely, it may also be beneficial to explore alternate fecal sample collection
methods to accurately determine fecal D-lactate concentrations in children less than five years of
age with acute diarrhea. As clinical signs and symptoms of D-lactic acidosis are variable and
non-specific, if a gastrointestinal threshold for the absorption of D-lactate into the blood exists in
children with acute diarrhea determination of fecal D-lactate concentration may prove to be a
useful biomarker. Future research could investigate potential treatments to predict, and ideally
prevent D-lactic acidosis and its clinical consequences from occurring.
57
CHAPTER FIVE
INVESTIGATION OF A POTENTIAL FECAL D-LACTATE THRESHOLD IN
NEONATAL CALVES WITH DIARRHEA
5.1 Introduction
In humans and animals, D-lactate, a physiological isomer of lactate, is produced mainly
through the bacterial fermentation of carbohydrates (i.e. fibre and incompletely digested starch,
lactose, and proteins) in the gastrointestinal tract with small amounts produced endogenously
through the glyoxalase pathway in the liver (Ewaschuk et al., 2005; Duncan et al., 1996;
Thornalley, 1994). Under healthy physiological conditions, D-lactate does not pose a threat to
the body’s acid-base balance. However, in neonatal animals with diarrhea, elevated blood D-
lactate concentrations, > 3 mmol/L, have been reported and is a significant contributor to
metabolic acidosis (Omole et al., 2001; Ewaschuk et al., 2004a). High concentrations of fecal D-
lactate in diarrheic calves suggest the gastrointestinal tract is the source of D-lactate production
in D-lactic acidosis (Ewaschuk et al., 2004a; Omole et al., 2001).
The most common cause of death in neonatal calf diarrhea is dehydration and metabolic
acidosis (Smith, 2009). D-Lactic acidosis in neonatal calves with diarrhea has been associated
with impaired neurological dysfunction including disturbance of the palpebral and menace
reflexes; depression with weakness and ataxia; impaired posture and behaviour (Kasari &
Naylor, 1984; Lorenz, 2004). In serious cases, D-lactic acidosis has been associated with
episodes of encephalopathy and coma (Forsyth et al., 1991; Grünert et al., 2010; Htyte et al.,
2011; Jorens et al., 2004). Abeysekara et al. (2007) also reported that D-lactate has direct
neurotoxic effect in calves; however, the exact mechanism is not yet known.
Recent research in diarrheic lambs and calves suggest that high levels of blood D-lactate
appear only after high levels of D-lactate are produced in the gastrointestinal tract. In other
words, a potential gastrointestinal threshold may exist for the absorption of D-lactate into the
blood of diarrheic neonatal animals (Abeysekara, 2009; Zello, Abeysekara et al., 2009).
In these studies D-lactate was measured using an HPLC system as described by Omole et al.
(1999) and Ewaschuk et al. (2002). For statistical purposes and the biphasic (break-point)
regression analysis, concentrations that were not detectable by HPLC in this study were assigned
a value of 0 and concentrations below the limit of quantitation were assigned an arbitrary value.
58
As many serum values were below the limit of quantitation, the analysis in these studies implies
a straight line at low serum and fecal concentrations and does not appear to increase until fecal
D-lactate concentrations reached approximately 10 mmol/L. It is not known if the calculated
threshold concentrations for absorption would be similar if D-lactate concentrations were plotted
using quantified values as opposed to the assigned value. Further investigation is also warranted
to include more diarrheic animals with a wide range of diarrhea severity. The objective of this
study is to examine a wide range of diarrhea severity to determine if a fecal D-lactate threshold
exists in the gastrointestinal tract at which D-lactate enters the systemic circulation in neonatal
calves with diarrhea. Identifying elevated fecal D-lactate levels, early on, in clinical cases of
diarrhea may prove to be a useful biomarker to predict, and ideally prevent, D-lactic acidosis.
5.2 Materials and Methods
5.2.1 Calves
Blood and fecal samples were obtained from 17 diarrheic claves, less than four weeks of
age, from a research farm in Quebec, Canada. The calves were housed in individual pens and fed
a commercial milk replacer (crude protein: 22%; protein of animal origin: 22%; fat: 17%;
sodium: 0.65%; Calcium: 0.8%; Phosphorus: 66%; Vitamin A 40,000 UI/kg; Vitamin D3: 4000
UI/Kg; Vitamin E: 150 UI/Kg) twice daily and did not have access to water or hay. Depending
the severity of the diarrhea, oral antibiotics (a mixture of neomycin, tetracycline and colistin)
may have been added to the milk replacer. Calves were selected for this study on the basis of
having spontaneously occurring diarrhea. All calves were assessed (Appendix F) and assigned a
clinical assessment score based on physical appearance and behaviour; food and water intake;
rectal temperature; and fecal characteristics (Table 5.1). To ensure a wide variety of diarrhea
severity, additional blood and fecal samples were obtained from ten calves, less than four weeks
of age, admitted for treatment of diarrhea to the Western College of Veterinary Medicine at
University of Saskatchewan. Again, these calves were selected on the basis of having clinical
signs of diarrhea and assigned a clinical assessment score. This study was approved by the
University of Saskatchewan’s Animal Research Ethics Board, and adhered to the Canadian
Council on Animal Care guidelines for humane animal use (Appendix A).

59
Table 5.1 Description of Clinical Assessment Score
Physical Appearance and Behavior Score for this calf
0
1
2
3
Normal, bright and alert
Mildly lethargic
Dull, nasal discharge, not interested in food
Recumbent, cannot be roused
Food and water intake
0
1
2
3
Normal
Decreased, does not finish meal
Eats less than half of meal
Doesn’t eat at all
Rectal temperature
0
1
2
3
Normal (T = 38-39)
Fever (39 < T < 40)
Fever (T > 40)
Hypothermia (T < 37.5)
Character of Feces
0
1
2
3
Normal
Soft but do not soak through bedding
Watery (soak through bedding)
Watery and animal appears dehydrated (eyes sunken)
Other
0
2
No abnormal findings
Coughing, colic, wobbly etc.
5.2.2 Sample Collection and Analysis
5.2.2.1 Blood Samples
Blood samples were collected from each calf prior to any medical treatment. Blood was
drawn (5-10 mL) from the jugular vein of each diarrheic calf and allowed to clot at room
temperature for 20 minutes. Once clotted, the blood was centrifuged for fifteen minutes at
1500×g, serum transferred to a clean tube, and frozen at -80°C until analysis. Serum samples
from Quebec, Canada were transported on dry ice to the Irwin Nutrition Laboratory, University
of Saskatchewan. All samples were stored frozen at -80°C until analysis. After thawing, all
blood samples were analyzed for D- and L-lactate using commercially available enzymatic assay
kits following the manufacturer instructions (Biovision, Mountain View, CA, USA). The lower

60
and upper detection limits of the assay kits are 0.01-10 mmol/L and 0.02-10 mmol/L for D-
lactate and L-lactate respectively.
5.2.2.2 Fecal Samples
Approximately 10-15 g of feces was collected from each diarrheic calf. In Quebec,
immediately following collection, liquid nitrogen was used to snap-freeze each fecal sample.
Samples were then transported to the Irwin Nutrition Laboratory, University of Saskatchewan on
dry ice and stored at -80°C until analysis. Fecal samples (10-15 g) were also collected from
diarrheic calves at the University of Saskatchewan and immediately frozen at -80°C until
analysis. On the day of analysis, samples were thawed on ice and homogenized in water (weight
to volume ratio of 1:4) using a Polytron homogenizer (Brinkmann Instruments; Rexdale,
Canada) for one minute. The homogenate was then centrifuged at 2,000×g for ten minutes at
room temperature (AccuSpin Micro 17; Fishers Scientifica, Schwerte, Germany). The
supernatant was collected and filtered through a 10K VWR® centrifugal filter (VWR
International, LLC; Radnor, PA, USA) at 2,000 × g for ten minutes. The filtrate was then
collected and analyzed for D- and L-lactate using enzymatic assay kits as per manufacturer
instructions (Biovision, Mountain View, CA, USA). In order to obtain accurate measurements
within the D- and L-lactate assay kit detection limits, the filtrate was diluted with D- or L-lactate
assay buffer supplied by the manufacturer.
5.3 Statistical Analysis
D- and L-lactate concentrations of blood and fecal samples are presented as mean ±
standard deviation (SD) and were calculated using Microsoft Excel (Microsoft Corporation Inc.,
2007). To quantify the relationship between serum and fecal D- and L-lactate concentrations and
between fecal D- and fecal L-lactate concentrations, Pearson’s product moment coefficients of
correlations were determined. A linear regression analyzed the relationships. All graphs were
created, using GraphPad Prism 5 for Windows (GraphPad Software, San Diego California,
USA).

61
5.4 Results
At the time of sample collection, calves (n=17) from Quebec appeared normal, bright and
alert with normal food and water intake with the exception of one calf, whose physical
appearance and behaviour was dull with nasal discharge; not interested in food and did not eat at
all (Table 5.2). Rectal temperature was normal (38-39°C) for all calves. In regards to fecal
characteristics, all calves were scored as 2: watery (soak through bedding) feces. Collectively,
diarrheic calves had biochemical parameters within normal range (Table 5.4). Upon review of
individual calves, two calves had a pH < 7.35, which is indicative of metabolic acidosis, but
there were no clinical cases of D-lactic acidosis. The anion gap, which is often used to diagnosis
metabolic acidosis, could not be calculated as chlorine was not determined during the blood gas
analysis.
Calves (n=9) from the University of Saskatchewan exhibited a wide range of diarrhea
severity, from mild to severe (Table 5.3). One calf did not have a clinical assessment. Calves
had varying physical characteristics ranging from normal, bright, and alert to recumbent. Fecal
characteristics also varied and scored from 0 to 3: ‘normal’ to ‘watery’ and ‘animal appears
dehydrated’. In regards to dehydration, calves were clinically assessed to be mildly (33.3%),
moderately (33.3%), and severely dehydrated (22.2%). One calf was well hydrated and one calf
was not assessed for hydration status. Six calves (85.7%) had acidosis as blood pH < 7.28 and,
upon calculation, four of the six calves were found to have an elevated anion gap. Biochemical
parameters were not available for three calves.
The mean ± SD of serum and fecal D- and L-concentrations are presented in Table 5.5.
Upon review of individual calf data, D-lactic acidosis (serum D-lactate >3 mmol/L) was present
in three diarrheic calves and two diarrheic calves had elevated serum L-lactate concentrations
(>2 mmol/L). These samples were from calves admitted to the Western College of Veterinary
Medicine at University of Saskatchewan. There was no significant linear regression between
fecal L-lactate and serum L-lactate concentrations in this study, P > 0.05 (Figure 5.1).
However, the linear regression between fecal D-lactate and serum D-lactate was statistically
significant at P < 0.0001. Increases in fecal D-lactate levels will likely result in increasing serum
D-lactate levels (Figure 5.2). There was no significant linear regression found between fecal D-
lactate and fecal L-lactate concentrations (Figure 5.3).

62
Table 5.2 Clinical assessment scores of Quebec calves (n= 17) with diarrhea
Physical
appearance
& behavior
Food &
water
intake
Rectal
temperature
Character
of Feces
Other
365 (A)
2 3 0 2 0 365 (B) 0 1 0 2 0 8283
0 0 0 2 0 8239
0 0 0 2 0 8232 0 0 0 2 2 8266 0 0 0 2 0 8242 0 0 0 2 0 8216 0 0 0 2 0 8320 0 0 0 2 0 8228
0 0 0 2 0 8315 0 0 0 2 2 8227 0 0 0 2 0 8329 0 0 0 2 0 8225 0 0 0 2 0 8323 0 0 0 2 0 8233 0 0 0 2 0 8255 0 0 0 2 0

63
Table 5.3 Clinical assessment scores of University of Saskatchewan calves (n= 9) with diarrhea
F, female; M, male; TMS, Trace mineralized salt; n/a, not available
S
ex
Age
(days)
Physical
appearance &
behavior
Food
&
water
Rectal
temperature
Character of
Feces
Other Dehydration status Treatment given
716883
F 6 3 3 3 3 reduced gut sounds Severely dehydrated
(12%)
Banamine & TMS
713537 M 4 3 3 3 3 calf died Moderately
dehydrated (7%)
Calf guard at 6h after
birth
716885 F 6 1 1 0 1 n/a Mildly dehydrated
(5%)
Banamine & TMS
717019 M 38 3 3 3 3 euthanized, suspected
viral enteritis (bovine
coronavirus
Severely dehydrated
(10%)
Calf Span (oral
antibiotic), Borgal
(antibacterial agent),
tubing (milk/electrolytes)
716884 F 6 1 0 0 1 n/a Mildly dehydrated
(5%)
Banamine and TMS
714932 F 14 1 1 0 3 grade 3/6 heart murmur,
wet umbilicus, very
pale
Moderately
dehydrated (8%)
Head Start at birth , Calf
Lyte II, Resflor
(antibiotic/anti-
inflammatory)
714932-
15
F 15 0 0 0 3 mucoid white nasal
discharge
Mildly dehydrated Fluid therapy IV and oral
electrolytes
115 F n/a n/a n/a 2 0 none n/a none
815 F n/a 1 1 n/a 1 n/a Not dehydrated Kaopectate, Revibe (oral
electrolyte powder)
63

64
Table 5.4 Blood electrolyte concentrations in calves (n=23) with diarrhea
Healthy
Calves*
mean ± SD
Quebec
Samples
(n=16)
mean ± SD
(range)
U of S Samples
(n=7)
mean ± SD
(range)
All samples
(n=23)
mean ± SD
pH 7.36 ± 0.03 7.41 ± 0.07
(7.23-7.52)
7.21 ± 0.152
(6.91-7.37)
7.35 ± 0.138
Sodium
(mmol/L)
135.6 ± 3.1 138.4 ± 5.66
(133-158)
138.5 ± 9.53
(128.6-153.4)
138.5 ± 6.83
Potassium
(mmol/L)
5.0 ± 0.4 5.14 ± 0.842
(4.4-8.0)
4.70 ± 1.57
(3.19-7.4)
5.00 ± 1.09
Chloride
(mmol/L)
102.4 ± 2.0 N/A 103.7 ± 6.05
(95-113)
N/A
Bicarbonate
(mmol/L)
32.6 ± 2.1 28.2 ± 4.60
(18.2-32.8)
22.1 ± 11.1
(10.3-45.4)
26.4 ± 7.53
Anion Gap 5.6 ± 3.5 N/A 17.5 ± 4.88
(13.3-25.3)
N/A
*As blood gas measurements were not taken from healthy calves in this study, data for
health calves were obtained from a previous study (Omole, 2001); N/A, not available.
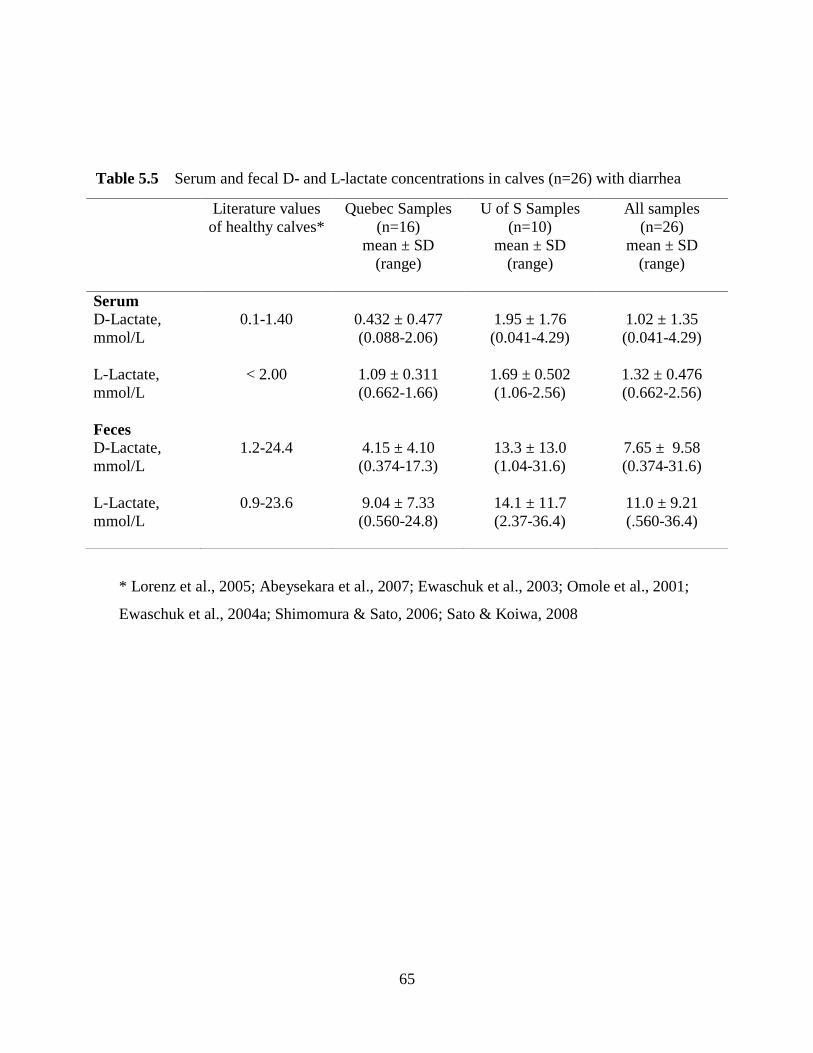
65
Table 5.5 Serum and fecal D- and L-lactate concentrations in calves (n=26) with diarrhea
* Lorenz et al., 2005; Abeysekara et al., 2007; Ewaschuk et al., 2003; Omole et al., 2001;
Ewaschuk et al., 2004a; Shimomura & Sato, 2006; Sato & Koiwa, 2008
Literature values
of healthy calves*
Quebec Samples
(n=16)
mean ± SD
(range)
U of S Samples
(n=10)
mean ± SD
(range)
All samples
(n=26)
mean ± SD
(range)
Serum
D-Lactate,
mmol/L
0.1-1.40 0.432 ± 0.477
(0.088-2.06)
1.95 ± 1.76
(0.041-4.29)
1.02 ± 1.35
(0.041-4.29)
L-Lactate,
mmol/L
< 2.00 1.09 ± 0.311
(0.662-1.66)
1.69 ± 0.502
(1.06-2.56)
1.32 ± 0.476
(0.662-2.56)
Feces
D-Lactate,
mmol/L
1.2-24.4 4.15 ± 4.10
(0.374-17.3)
13.3 ± 13.0
(1.04-31.6)
7.65 ± 9.58
(0.374-31.6)
L-Lactate,
mmol/L
0.9-23.6 9.04 ± 7.33
(0.560-24.8)
14.1 ± 11.7
(2.37-36.4)
11.0 ± 9.21
(.560-36.4)
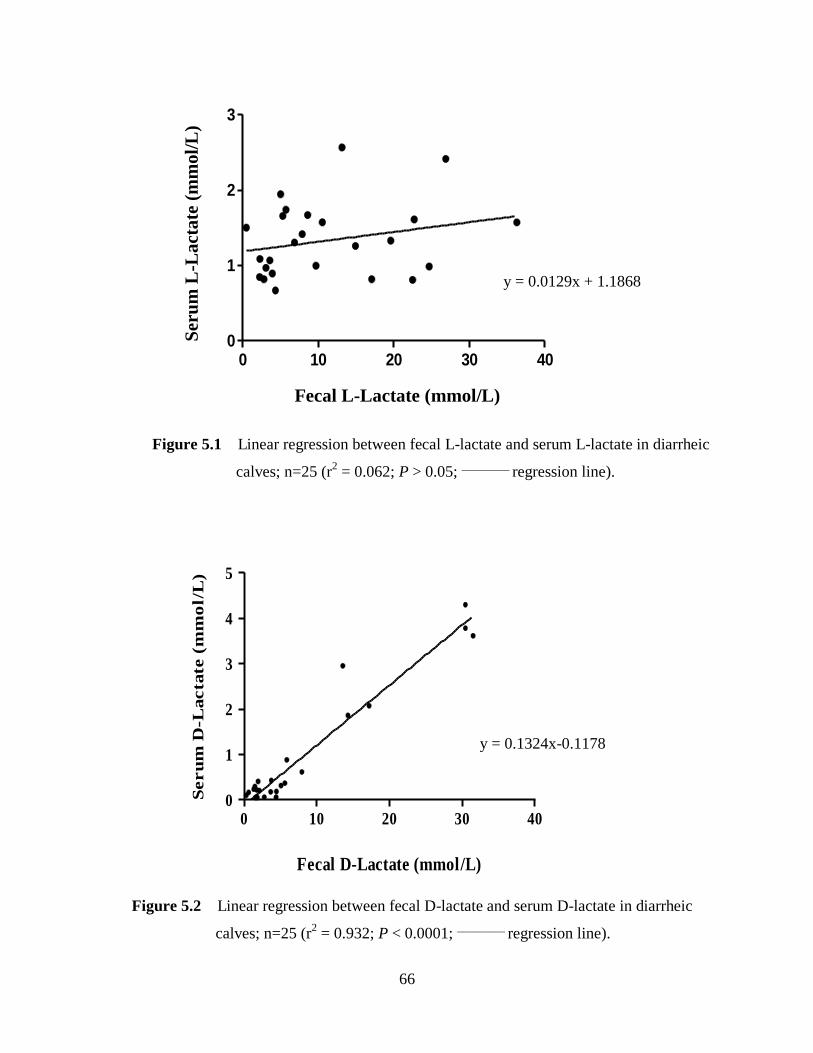
66
Figure 5.1 Linear regression between fecal L-lactate and serum L-lactate in diarrheic
calves; n=25 (r2 = 0.062; P > 0.05;
_________ regression line).
Figure 5.2 Linear regression between fecal D-lactate and serum D-lactate in diarrheic
calves; n=25 (r2 = 0.932; P < 0.0001;
_________ regression line).
-
y = 0.0129x + 1.1868
Fecal D-Lactate (mmol/L)
Seru
m D
-Lacta
te (
mm
ol/
L)
0 10 20 30 400
1
2
3
4
5
Fecal L-Lactate (mmol/L)
Seru
m L
-Lacta
te (
mm
ol/L
)
0 10 20 30 400
1
2
3
y = 0.1324x-0.1178
Ser
um
L-L
act
ate
(m
mol/
L)
Fecal L-Lactate (mmol/L)

67
5.5 Discussion
Past research has shown that D-lactate is a major contributor to acidosis in diarrheic
calves and elevated concentrations of fecal D-lactate found in these calves, when compared to
healthy calves, suggest that the gastrointestinal tract is the site of excess D-lactate production
(Omole et al., 2001; Ewaschuk et al., 2004a). Ewaschuk et al. (2004a) reported a significant
positive correlation between fecal D-lactate concentrations and serum D-lactate concentrations in
calves. This study’s findings are consistent with Ewaschuk et al. (2004a) as fecal D-lactate
concentrations were found to be significantly correlated with serum D-lactate concentrations and
93% of the variance is shared between fecal D-lactate and serum D-lactate. D-lactic acidosis has
been reported in neonatal ruminants as a consequence of grain overfeeding, impaired ruminal
milk fermentation, and neonatal diarrhea (Dunlop & Hammond, 1965; Omole et al., 2001;
Ewaschuk et al., 2004a; Lorenz, 2004; Bleul et al., 2006; Lorenz & Lorch, 2009). In the
gastrointestinal tract, D-lactate is produced by bacterial fermentation of carbohydrates in both
animals and humans (Duncan et al., 2004; Halperin & Kamel, 1996). A loss in the ability to
digest and absorb nutrients may result in malabsorption with abnormally high amounts of
y= 0.4095x + 3.383
Figure 5.3 Linear regression between fecal D-lactate and fecal L-lactate in diarrheic
calves; n=24 (r2 = 0.157; P > 0.05;
_________ regression line).
0 10 20 30 400
10
20
30
40
Fecal D-Lactate (mmole/L)
Fecal L
-L
actate (
mm
ol/L
)
Fecal L-lactate (mmol/L)
Fecal D
-L
actate (
mm
ol/L
)
0 10 20 30 40
0
10
20
30
40
y= 0.3285x + 8.5439

68
carbohydrates being delivered to the large intestine. This results in increased gastrointestinal
fermentation and, ultimately, increased production of D- and L-lactate (Peterson, 2005; Hove &
Mortensen, 1995).
Malabsorption can occur in several clinical conditions, often resulting in diarrhea, and
can be of nutritional origin (e.g. overfeeding, absence and/or deficiency in digestive enzymes) or
due to infection of the gastrointestinal tract by enteric pathogens. In this study, samples from
Quebec were collected from calves with diarrhea likely due to nutritional reasons (i.e. diet) while
samples from University of Saskatchewan were collected from calves with diarrhea likely
resulting from enteric pathogens. Some of the major enteric pathogens involved in neonatal calf
diarrhea (e.g. Cryptosporidium parvum) disrupt the epithelial cells of the small intestine. As a
result, villus atrophy leads to impaired nutrient digestion and absorption, which may lead to
carbohydrate malabsorption (Smith, 2009; Lorenz, 2000). An increase in gastrointestinal
fermentation creates a favourable environment (i.e. acidic) for the growth of acid-resistant lactate
producing bacteria and as a result larger than normal amounts of D- and L-lactate are produced.
When the rate of D-lactate absorption exceeds the body’s ability to metabolize it, D-lactic
acidosis may occur. In this study, the three cases of D-lactic acidosis were observed only in those
calves with diarrhea likely caused by enteric pathogens.
This study showed no significant linear relationship between fecal L-lactate and serum L-
lactate (Figure 5.1). These finding suggests that, in diarrheic calves, both D- and L-lactate are
produced in the gastrointestinal tract however once however once absorbed into the systemic
circulation, L-lactate is likely metabolized more efficiently when compared to D-lactate and does
not result in a proportional increase in serum L-lactate concentration. In the liver, L-lactate is
metabolized to pyruvate by the enzyme L-lactate dehydrogenase (Horton, 2002). D-lactate can
also be metabolized to pyruvate by mitochondrial putative D-lactate dehydrogenase, with activity
found highest in kidney and liver; however its uptake into the mitochondria is less efficient when
compared to L-lactate (DeBari, et al., 2002; Flick & Konieczny, 2002).
D- and L-lactate may also be excreted by the kidneys; however, since both isomers use
the same co-transport mechanism with sodium, it is proposed there is competition for
reabsorption (Oh et. al, 1985). L-Lactate has been shown to be more efficiently reabsorbed by
the renal tubules than D-lactate and this is thought to be a significant way of how the body
reduces elevated blood D-lactate concentrations (Oh et.al, 1985; de Vrese et al., 1990; Uribarri,
69
1998). Oh et al. (1985) proposed that, since renal tubular reabsorption of lactate is reduced by
increased urine volume, less D-lactate may be excreted during volume depletion and result in
elevated blood D-lactate concentrations and/or D-lactic acidosis. In this study, three calves with
D-lactic acidosis were clinically assessed as being dehydrated however urinary D-lactate
concentrations were not determined.
From this study, fecal D-lactate production also appears to be independent of L-lactate
production in the gastrointestinal tract as fecal D-lactate and fecal L-lactate concentrations were
not found to be significantly correlated (Figure 5.3). This study also suggests that as diarrhea
severity increases D-lactate concentrations also increase. Similar results were found in a study
conducted at University of Saskatchewan in neonatal lambs (Abeysekara, 2009). It is evident
from the clinical assessment that the calves from Quebec had less severe diarrhea when
compared to the calves from the University of Saskatchewan clinic. Upon clinical assessment,
diarrheic calves from Quebec, with the exception of one calf, appeared normal, bright, and alert
with normal food and water intake, rectal temperature, and biochemical parameters. No clinical
cases of D- and/or L-lactic acidosis were present. In Saskatchewan, two of the three calves with
D-lactic acidosis were clinically assessed as physically recumbent and could not be roused, were
not eating, hypothermic, and assessed as moderately to severely (7-12%) dehydrated.
A limitation of this study is that the fecal D-lactate concentrations on the higher end of
the data set may be driving the correlation as there were few fecal samples with D-lactate
concentrations greater than 10 mmol/L. As a result, predictions of blood D-lactate
concentrations based on fecal D-lactate concentrations, at this time, are not possible. Abeysekara
et al. (2009) reported a fecal threshold concentration for absorption of D-lactate into the blood of
10.2 mmol/L and 8.8 mmol/L in neonatal lambs and calves, respectively. Fecal and blood
samples in this particular study were analyzed for D-lactate using the HPLC method. Due to the
limit of quantitation, parameters that were not detectable by HPLC were assigned a value of 0
and parameters that were detectable but below the limit of quantification were assigned an
arbitrary value. Using the enzymatic assay, this study was able to plot all absolute D-lactate
concentrations. There is a clustering of fecal D-lactate concentrations below 10 mmol/L and
these results are similar to those of Abeysekara (2009). In this study, however, the range of D-
lactate concentrations, especially those >10 mmol/L, in the fecal samples was not large enough
to conduct a biphasic (break-point) regression analysis. Researchers were unable to determine,
70
at this time, if a fecal threshold concentration exists for the absorption of D-lactate into the blood
in calves with diarrhea.
Further investigation on a larger scale, with varying degrees of diarrhea severity, is
warranted to examine whether or not the fecal D-lactate concentration threshold is confirmed at
levels previously reported. If a threshold for the absorption of D-lactate into the blood exists in
neonatal calves with diarrhea, fecal D-lactate concentrations may prove to be a useful biomarker
to predict and possibly prevent D-lactic acidosis and its resulting neurological impairments.
Future research could then investigate potential treatments that target gastrointestinal D-lactate
producing bacteria. It may also be beneficial to determine whether or not a fecal D-lactate
concentration threshold exists is different species as human children are also prone to acute
diarrhea of infectious origins which result in acidosis. As thoroughly described in the previous
chapter, it is unknown if D-lactate is a significant contributor to the acidosis seen in children
with acute diarrhea and metabolic acidosis.
71
CHAPTER SIX
GENERAL DISCUSSION AND CONCLUSIONS
Diarrhea causes significant mortality and morbidity in several species worldwide. In
animals, diarrheal diseases have a significant economic impact on livestock operations (USDA,
2008). In children, reduction of diarrhea-related mortality is essential towards achieving the
Millennium Development Goal to “reduce by two-thirds, between 1990 and 2015, the mortality
rate of children under five” (United Nations, 2002). Regardless of its cause, diarrheal diseases
can result in clinical consequences including metabolic acidosis. D-Lactate has been identified
as a significant contributor to acidosis in diarrheic calves (Kasari & Naylor, 1984; Omole et al.,
2001; Ewaschuk et al., 2004a) and in humans with short bowel syndrome (Uribarri et al., 1998).
Identifying elevated D-lactate concentrations in children with acute diarrhea in the absence of
short bowel syndrome has been poorly examined. Further research of D-lactate is warranted
given the significant impact of diarrheal diseases and potential role of D-lactate in metabolic
acidosis.
Pre-analytical processing and storage methods have been shown to influence the
stability of various solutes in blood samples following collection (Tuck et al., 2009). Past studies
on lactate stability investigate changes in total lactate concentrations and do not determine the
changes of each specific lactate isomer, D- and L-lactate. This led to the objectives of the
current study as clinical symptoms reported in D-lactic acidosis including weakness, ataxia,
impaired posture and behaviour, and, in severe cases, encephalopathy and coma (Kasari &
Naylor, 1984; Kasari & Naylor, 1986; Lorenz, 2004; Lorenz et al., 2005; Forsyth et al., 1991;
Grünert et al., 2010; Htyte et al., 2011; Jorens et al., 2004) differ from clinical symptoms seen in
L-lactic acidosis. To be able to quantify both isomers, D- and L-lactate, in blood for proper
clinical diagnosis and treatment is important. Therefore, to determine the stability of total, D-
lactate, and L-lactate blood concentrations after prolonged contact of serum and plasma with
blood cells and after immediate separation of serum and plasma via centrifugation, blood
samples were obtained from eleven healthy calves (Chapter 3). Samples were stored at 4°C and
analyzed for D- and L-lactate using an enzymatic assay at 1, 2, 4, 8, 12, 24, and 48 hours
following collection.

72
D-lactate, and L-lactate concentrations in calf serum and plasma, stored at 4°C following
separation from blood cells 0.5 hour post collection, were found to be stable up to 48 hours. In
untreated serum samples when stored in contact with cells, D-lactate concentration was
significantly higher, 82.3%, at 48 hours. L-lactate concentrations increased significantly in
untreated and spiked serum and spiked plasma samples stored in contact with blood cells at 48
hours. Significant differences were also noted in D- and L-lactate concentrations when using a
serum collection tube vs. plasma collection tube.
To our knowledge, this study was the first to investigate the stability of specific lactate
isomers after prolonged contact of serum and plasma with blood cells and after immediate
separation of serum and plasma via centrifugation. Based on the results of this study, to ensure
a reliable measurement of D- and L- lactate concentrations, serum and/or plasma samples should
be centrifuged as soon as possible following collection but can thereafter be stored at 4˚C for up
to 48 h without noticeable changes in D- or L-lactate concentrations.
D-lactic acidosis has been documented in humans as a clinical complication of SBS.
However, identifying elevated concentrations of D-lactate and D-lactic acidosis in children with
acute diarrhea, in the absence of short bowel syndrome has been poorly examined. This
warranted further investigation as infectious diarrhea has been shown to result in carbohydrate
malabsorption and acidosis, similar to that found in SBS (Sack et al., 1982). To determine
whether D-lactic acidosis occurs in children with diarrhea blood samples were obtained from
nine children ≤ 5 years of age with acute diarrhea and suspected metabolic acidosis (Chapter 4).
Samples were analyzed for pyruvate, D- and L-lactate using an enzymatic assay.
No clinical cases of D-lactic acidosis were found in this study’s small population of
children with acute diarrhea. Upon review of blood electrolytes and assessment of diarrhea
severity, children selected for this study were not clinically acidodic and did not have extremely
severe diarrhea. It is possible that the incidence of D-lactic acidosis in children with acute
diarrhea may not be to the extent seen in diarrheic animals; however, this may be because
children in developed countries are often assessed and treated for illness much sooner than that
of animals. Work to conduct a similar study in a developing country, where more severe
diarrhea is likely to occur, was initiated however, to date, no samples have been collected or
analyzed. To adequately study D-lactic acidosis in children, it would be preferred to include a
control group in order to determine a D-lactate concentration range in healthy children ≤ 5 years

73
of age and to include children with wide range of diarrhea severity. If D-lactic acidosis does
occur in children with diarrhea, treatment strategies could be altered to target the D-lactate
producing bacteria.
Although there were no clinical cases of D-lactic acidosis in this study, it is interesting
that as a result of using an enzymatic assay, the researchers were able to detect D-lactate
concentrations at lower levels when compared to a previously used HPLC analytical method
(Ewaschuk et al., 2004b), and 66.7% of children in this study had a D-lactate concentration
greater than that found in healthy adults (> 0.1 mmol/L). As children were 10 months to 3 years
of age, this increase may be a result of immature metabolic mechanisms, however, the impact of
diarrheal diseases on normal development and maturation rate of enzymes and transporters
involved in D-lactate is unknown and may warrant further investigation. Future studies should
also investigate fecal D-lactate concentrations as it is suggested, in animal studies, that a
potential gastrointestinal threshold for the absorption of D-lactate into the blood exists and fecal
D-lactate could prove to be a useful biomarker for D-lactic acidosis.
The final portion of this research aimed to examine a wide range of diarrhea severity to
determine if a fecal D-lactate threshold exists at which D-lactate enters the systemic circulation
in neonatal calves with diarrhea. Blood and fecal samples were obtained from 15 diarrheic
calves (Chapter 5). Electrolytes were measured in the blood and all calves were clinically
assessed. Blood and feces were analyzed for D- and L-lactate using an enzymatic assay. D-
Lactic acidosis (> 3 mmol/L) was present in three diarrheic calves and two calves had elevated
L-lactate concentrations. Fecal D-lactate concentrations were found to be positively correlated
with serum D-lactate concentrations while fecal L-lactate and serum L-lactate was not found to
be significantly correlated. This finding is supported by a past study conducted by Ewaschuk et
al. (2004a). Both D- and L-lactate are produced via gastrointestinal fermentation in the large
intestine. When there is a loss in the body’s ability to digest and absorb nutrients, as observed in
some cases of diarrhea, abnormally large amounts of carbohydrate are delivered to the colon
resulting in increased colonic fermentation and increased production of D- and L-lactate. Both
D- and L-lactate can be absorbed in the systemic circulation. Once in the blood, L-lactate is
thought to be metabolized more efficiently than D-lactate. When the rate of D-lactate absorption
exceeds the body’s ability to metabolize it, D-lactate accumulates in the blood and can lead to D-
lactic acidosis.
74
This study had few fecal D-lactate concentrations greater than 10 mmol/L therefore
predictions of blood D-lactate based on fecal D-lactate are not possible. In a similar study,
Abeysekara (2009) reported a fecal threshold concentration of 10.2 mmol/L and 8.8 mmol/L in
neonatal lambs and calves, respectively but was only able to plot those D-lactate concentrations
greater than 0.05 mmol/L using a HPLC method. Using an enzymatic assay, this study was able
to plot all D-lactate concentrations and a clustering of D-lactate concentrations below 10 mmol/L
was observed, similar to those results of Abeysekara (2009), however the range of D-lactate
concentrations was not large enough to conduct a biphasic (breakpoint) regression analysis.
Further study, with varying degrees of diarrhea severity, should continue to determine whether or
not a fecal threshold exists at the levels previously reported. If a threshold exists, fecal D-lactate
may prove to be a useful biomarker to predict and possibly prevent D-lactic acidosis and its
neurological consequences.
In conclusion, this body of work continues to contribute to the knowledge of D-lactate
and D-lactic acidosis in diarrhea. The effects of pre-analytical processing and storage of specific
lactate isomers was determined and further investigation into a possible fecal D-lactate threshold
was explored. Although D-lactic acidosis did not occur in children with acute diarrhea in this
study, further study is warranted to investigate a wider range of diarrhea severity, the potential
use of fecal D-lactate concentration as a biomarker for elevated blood D-lactate concentrations,
and to further explore the mechanism and/or significance of why children with acute diarrhea
appear to have a higher blood D-lactate concentrations when compared to healthy children.

75
REFERENCES
Abeysekara, S. (2009). D-Lactic Acid Metabolism and Control of Acidosis. PhD thesis,
University of Saskatchewan, Saskatoon, Canada. Retrieved from
http://library2.usask.ca/theses/available/etd-01202009-120329/restricted/Abeysekara-
Saman_PhD_D-lacticAcidosis_ETD.pdf
Abeysekara, S., Naylor, J.M., Wassef, A.W.A., Isak, U., & Zello, G.A. (2007). D-lactic acid-
induced neurotoxicity in a calf model. American Journal of Physiology: Endocrinology and
Metabolism, 293(2), E558-E565.
Acra, S.A., & Ghishan, F.K. (1996). Electrolyte fluxes in the gut and oral rehydration solutions.
Pediatric Clinics of North America, 43(2), 443-449.
Al Chekakie, M.O., Al Kotoub, M.L., & Nielsen, C. (2004). 53-year-old with mental status
changes. Comprehensive Therapy, 30(2), 87-92.
Allen, S.J., Martinez, E.G., Gregorio, G.V., & Dans, L.F. (2010). Probiotics for treating acute
infectious diarrhoea. Cochrane Database of Systematic Reviews, 11, Art. No.: CD003048.
doi:10.1002/14651858.CD003048.pub3.
American Gastroenterological Association medical position statement: guidelines for the
evaluation and management of chronic diarrhea. (1999). Gastroenterology, 116(6), 1461-
1463.
Anderson, O., Haugaard, S.B., Jørgensen, L.T., Sørensen, S., Nielsen, J.O., Madsbad, S., &
Iversen, J. (2003). Preanalytical handling of samples for measurement of plasma lactate in
HIV patients. Scandinavian Journal of Clinical and Laboratory Investigation, 63, 449-454.
Astles, R., Williams, C.P., & Sedor, F. (1994). Stability of plasma lactate in vitro in the presence
of antiglycolytic agents. Clinical Chemistry, 40(7), 1327-1330.
Ayers, P., & Warrington, L. (2008). Diagnosis and treatment of simple acid-base disorders.
Nutrition in Clinical Practice, 23(2), 122-127.
Balamurugan, R., Janardhan, H.P, George, S., Raghava, M.V., Muliyil, J., & Ramakrishna, B.S.
(2008). Molecular studies of fecal anaerobic commensal bacteria in acute diarrhea in
children. Journal of Pediatric Gastroenterology and Nutrition, 46, 514-519.
Baldi, F., Bianco, M.A., Nardone, G., Pilotto, A., Zamparo, E. (2009). Focus on acute diarrhoeal
disease. World Journal of Gastroenterology, 15(27), 3341-3348.
Barrett, K. (2006). Gastrointestinal Physiology. New York: Lange Medical Books/McGraw-
Hill.
76
Barrington, G. M., Gay, J. M., & Evermann, J. F. (2002). Biosecurity for neonatal
gastrointestinal diseases. Veterinary Clinics of North America - Food Animal Practice,
18(1), 7-34.
Bender, B.J., Ozuah, P.O., & Crain, E.F. (2007). Oral rehydration therapy: is anyone drinking?
Pediatric Emergence Care, 23(9), 624-626.
Berchtold, J. (2009). Treatment of calf diarrhea: Intravenous fluid therapy. Veterinary Clinics of
North America - Food Animal Practice, 25(1), 73-99.
Black, R.E., Cousens, S., Johnson, H.L., Lawn, J.E., Rudan, I., Bassani, D.G., Jha, P., Campbell,
H., Walker, C.F., Cibulskis, R., Eisele, T., Liu, L., & Mathers, C. (2010). Global, regional,
and national causes of child mortality in 2008: a systematic analysis. The Lancet, 375
(9730), 1969-1987.
Bleul, U., Schwantag, S., Stocker, H., Corboz, L., Grimm, F., Engels, M., Borel, N., Lutz, H.,
Schönmann, M., Kähn, W. (2006). Floppy kid syndrome caused by D-lactic acidosis in goat
kids. Journal of Veterinary Internal Medicine, 20(4), 1003-1008.
Bongaerts, G., Bakkeren, J., Severijnen, R., Sperl, W., Willems, H., Naber, T., Wevers, R., van
Meuurs, A., & Tolboom, J. (2000). Lactobacilli and acidosis in children with short small
bowel. Journal of Pediatric Gastroenterology and Nutrition, 30(3), 288-293.
Bourriaud, C., Robins, R.J., Martin, L., Kozlowski, F., Tenailleau, E., Cherbut, C., & Michel, C.
(2005). Lactate is mainly fermented to butyrate by human intestinal microfloras but inter-
individual variation is evident. Journal of Applied Microbiology, 99(1), 201-212.
Boyanton, B.L. Jr., & Blick, K.E. (2002). Stability studies of twenty-four analytes in human
plasma and serum. Clinical Chemistry, 48(12). 2242-2247.
Brandt, R.B., Siegel, S.A., Waters, M.G., & Bloch, M.H. (1980). Spectrophotometric assay for
D-(-)-lactate in plasma. Analytical Biochemistry, 102(1), 39-46.
Calatayud, O. & Tenías, J.M. (2003). Effects of time, temperature and blood counts on levels of
lactate in heparinised whole blood. Scandinavian Journal of Clinical & Laboratory
Investigation, 63,311-314.
Canani, R.B, Cirillo, P., Terrin, G., Cesarano, L., Spagnulol, M.I., De Vincenzo, A., Albano, F.,
Passariello, A., De Marco, G., Manguso, F., & Guarino, A. (2007). Probiotics for treatment
of acute diarrhoea in children: randomized clinical trial of five different preparations. BMJ,
335(7615), 340.
Carroll, K., & Reimer, L. (2000). Infectious diarrhea: Pathogens and treatment. Lebanese
Medical Journal, 48(4), 270-277.
77
Casburn-Jones, A.C. & Farthing, M.J. (2004). Management of infectious diarrhea. Gut, 53(2),
296-305.
Castro-Rodríguez, J.A., Salazar-Lindo, E., & León-Barúa. (1997). Differentiation of osmotic
and secretory diarrhoea by stool carbohydrate and osmolar gap measurements. Archives of
Disease in Childhood, 77, 201-205.
Christopher, M., Eckfeldt, J., & Eaton, J. (1990). Propylene glycol ingestion causes D-lactic
acidosis. Laboratory Investigation, 62(1), 114-118.
Cohen, M. (1991). Etiology and mechanisms of acute infectious diarrhea in infants in the United
States. The Journal of Pediatrics, 118(4), S34-S39.
Colbère-Garapin, F., Martin-Latil, S., Blondel, B., Mousson, L., Pelletier, I., Autret, A.,
Francois, A., Niborski, V., Grompone, G., Catonnet, G., & van de Moer, A. (2007).
Prevention and treatment of enteric viral infections: Possible benefits of probiotic bacteria.
Microbes and Infection, 9(14-15), 1623-1631.
Colletti, J.E., Brown, K.M., Sharieff, G.Q., Barata, I., & Ishimine, P. The management of
children with gastroenteritis and dehydration in the emergency department. The Journal of
Emergency Medicine, 35(5), 686-698.
Connolly, E., Abrahamsson, T., & Björkstén, B. (2005). Safety of D (-)-Lactic acid producing
bacteria in the human infant. Journal of Pediatric Gastroenterology and Nutrition, 41, 489-
492.
Connor, H., Woods, H.F., & Ledingham, J.G. (1983). Comparison of the kinetics and utilisation
of D (-) - and L (+)-sodium lactate in normal man. Annals of Nutrition & Metabolism,
27(6), 481-487.
Constable, P.D., Grünberg, W., & Carstensen, L. (2009). Comparative effects of two oral
rehydration solutions on milk clotting abomasal luminal pH, and abomasal emptying rate in
suckling calves. Journal of Dairy Science, 92(1), 296-312.
Constable, P.D. (2009). Treatment of calf diarrhea: antimicrobial and ancillary treatments.
(2009). The Veterinary Clinics of North America. Food Animal Practice, 25(1), 101-120.
Coronado, B.E., Opal, S.M., & Yoburn, D.C. (1995). Antibiotic-induced D-lactic acidosis.
Annals of Internal Medicine, 122(11), 839-842.
de Bari, L., Atlante, A., Guaragnella, N., Principato, G., & Passarella, S. (2002). D-lactate
transport and metabolism in rat liver mitochondria. The Biochemical Journal, 365(Pt 2),
391-403
De Backer, D. (2003). Lactic acidosis. Intensive Care Medicine, 29, 699-702.
78
Dennehy, P. (2005). Acute diarrheal disease in children: Epidemiology, prevention, and
treatment. Infectious Disease Clinics of North America, 19(3), 585-602.
de Vrese, M., Koppenhoefer, B., & Barth, C. (1990). D-lactic acid metabolism after an oral load
of DL-lactate. Clinical Nutrition, 9(1), 23-28.
de Vrese, M., & Barth, C. (1991). Postprandial plasma D-lactate concentrations after yogurt
ingestion. Zeitschrift Für Ernährungswissenschaft, 30(2), 131-137.
Duncan, S. H., Louis, P., & Flint, H. J. (2004). Lactate-utilizing bacteria, isolated from human
feces, that produce butyrate as a major fermentation product. Applied & Environmental
Microbiology, 70(10), 5810-5817.
Dunlop, R.H., & Hammond, P.B. (1965). D-lactic acidosis of ruminants. Annals of the New
York Academy of Sciences, 119(3), 1109-1132.
Edwards, S.L. (2008). Pathophysiology of acid base balance: the theory practice relationship.
Intensive and Critical Care Nursing, 24, 28-40.
Ewaschuk, J.B., Naylor, J.M., & Zello, G.A. (2003). Anion gap correlates with serum D- and
DL-lactate concentration in diarrheic neonatal calves. Journal of Veterinary Internal
Medicine, 17, 940-942.
Ewaschuk, J.B., Naylor, J.M., & Zello, G.A. (2005). D-lactate in human and ruminant
metabolism. Journal of Nutrition, 135(7), 1619-1625.
Ewaschuk, J. B., Naylor, J. M., Palmer, R., Whiting, S. J., & Zello, G. A. (2004a). D-lactate
production and excretion in diarrheic calves. Journal of Veterinary Internal Medicine, 18(5),
744-747.
Ewaschuk, J.B., Naylor, J.M., Barabash, W.A., & Zello, G.A. (2004b). High-performance liquid
chromatographic assay of lactic, pyruvic and acetic acids and lactic acid stereoisomers in
calf feces, rumen fluid and urine. Journal of Chromatography. B, Analytical Technologies
in the Biomedical and Life Sciences, 805(2), 347-351.
Ewaschuk, J.B., Zello, G.A., & Naylor, J.M. (2006). Lactobacillus GG does not affect D-lactic
acidosis in diarrheic calves, in a clinical setting. Journal of Veterinary Internal Medicine,
20(3), 614-619.
Ewaschuk, J.B., Zello, G.A., Naylor, J.M., & Brocks, D.R. (2002). Metabolic acidosis:
separation methods and biological relevance of organic acids and lactic acid enantiomers.
Journal of Chromatography. B, Analytical Technologies in the Biomedical and Life
Sciences, 781(1-2), 39-56.
Farthing, M. (2000). Novel targets for the pharmacotherapy of diarrhoea: A view for the
millennium. Journal of Gastroenterology, 15, G38-G45.

79
Fine, K.D. & Schiller, L.R. (1999). AGA technical review on the evaluation and management of
chronic diarrhea. Gastroenterology, 116(6), 1464-1486.
Fischer, T., Viboud, C., Parashar, U., Malek, M., Steiner, C., Glass, R., Simonsen, L. (2007).
Hospitalizations and deaths from diarrhea and rotavirus among children <5 years of age in
the United States, 1993-2003. The Journal of Infectious Diseases, 195(8), 1117-1125.
Flick, M.J., & Konieczny, S.F. (2002). Identification of putative mammalian D-lactate
dehydrogenase enzymes. Biochemical and Biophysical Research Communications, 295(4),
910-916.
Food and Agriculture Organization (FAO) & World Health Organization (WHO). (2001).
Health and nutritional properties of probiotics in food including powder milk and live lactic
acid bacteria, a joint FAO/WHO expert consultation. Cordoba, Argentina, 1-4 October
2001.
Forsyth, R.J., Mouldon, A., & Hull, D. (1991). D-lactate associated encephalopathy in short
bowel syndrome: management with long-term non-absorbable oral antimicrobials. Clinical
Nutrition, 10(6), 352-355.
Foster, D.M., & Smith, G.W. (2009). Pathophysiology of diarrhea in calves. The Veterinary
Clinics of North America. Food Animal Practice, 25(1), 13-36.
Garthwaite, B.D., Drackley, J.K, McCoy, G.C., & Jaster, E.H. (1994) Whole milk and oral
rehydration solution for calves with diarrhea of spontaneous origin. Journal of Dairy
Science, 77(3), 835-843.
Gentile, A., Sconza, S., Lorenz, I., Otranto, G., Rademacher, G., Famigli-Bergamini, P. & Klee,
W. D-lactic acidosis in calves as a consequence of experimentally induced ruminal
acidosis. Journal of Veterinary Medicine. Physiology, Pathology, Clinical Medicine, 51(2),
64-70.
Gill, R.K., Saksena, S., Alrefai, W.A., Sarwar, Z., Goldstein, J.L., Carroll, R.E., Ramaswamy,
K., & Dudeja, P.K. (2005). Expression and membrane localization of MCT isoforms along
the length of the human intestine. American Journal of Physiology.Cell Physiology, 289(4),
46-52.
Grandy, G., Medina, M., Soria, R., Terán, C.G., & Araya, M. (2010). Probiotics in the treatment
of acute rotavirus diarrhoea. A randomized, double-blind, controlled trial using two
different probiotic preparations in Bolivian children. BMC Infectious Diseases, 10, 253.
Guandalini, S. (2005). Essential pediatric gastroenterology, hepatology, and nutrition. New
York: McGraw-Hill Medical Pub. Division.
Guandalini, S. (2008). Probiotics for children with diarrhea: an update. Journal of Clinical
Gastroenterology, 42 (Suppl 2), S53-S57.

80
Guarino, A., Buccigrossi, B., Armellino, C. (2009). Colon in acute intestinal infection. Journal
of Pediatric Gastroenterology and Nutrition, 48(Suppl 2), S58-S62.
Guarino, A., Albano, F., Ashkenazi, S., Gendrel, D., Hoekstra, J., Shamir, R., Szajewska, H.
(2008). European society for paediatric gastroenterology, hepatology, and
Nutrition/European society for paediatric infectious diseases evidence-based guidelines for
the management of acute gastroenteritis in children in Europe. Journal of Pediatric
Gastroenterology and Nutrition, 46(Suppl 2), S81-S122.
Grünert, S., Schmidts, M., Kenzel, S., Sass, J.O., Greiner, P., Pohl, M., & Hentschel, R. (2010).
D-Lactic acidosis: "Right-left disorientation" in laboratory testing: Acute encephalopathy in
a child with carbohydrate malabsorption syndrome. Journal of Pediatric Gastroenterology
and Nutrition, 50(1), 106-107.
Gunn, A.A., Naylor, J.A., & House, J.K. (2009). Manifestations and management of disease in
neonatal ruminants: Diarrhea. In B.P. Smith (Ed.), Large animal internal medicine, 4th
Ed.
(pp. 340-362). St. Louis: Mosby Elsevier.
Halperin, M. L., & Kamel, K. S. (1996). D-lactic acidosis: Turning sugar into acids in the
gastrointestinal tract. Kidney International, 49(1), 1-8.
Halestrap, A.P., & Price, N.T. (1999). The proton-linked monocarboxylate transporter (MCT)
family: structure, function and regulation. The Biochemistry Journal, 343, 281-299.
Harp, J.A., Jardon, P., Atwill, E.R., Zylstra, M., Checel, S., Goff, J.P., & De Simone, C. (1996).
Field testing of prophylatic measures against Cryptosporidium parvum infection in calves in
a California dairy herd. American Journal of Veterinary Research, 57(11), 1586-1588.
Hartling,L., Bellemare, S., Wiebe, N., Russell, K., Klassen, T.P., & Craig, W. (2006). Oral
versus intravenous rehydration for treating dehydration due to gastroenteritis in children.
Cochrane Database of Systematic Reviews, 3, CD004390 -CD004390.
Haschke-Becher, E., Baumgartner, M., & Bachmann, C. (2000). Assay of D-lactate in urine of
infants and children with reference values taking into account data below detection limit.
Clinica Chimica Acta, 298(1-2), 99-109.
Haschke-Becher, E., Brunser, O., Cruchet, S., Gotteland, M., Haschke, F., & Bachmann, C.
(2008). Urinary D-lactate excretion in infants receiving lactobacillus johnsonii with formula.
Annals of Nutrition Metabolism, 53, 240-244.
Heath, S.E., Naylor, J.M., Guedo, B.L., Petrie, L., Rousseaux, C.G., & Radostits, O.M. (1989).
The effects of feeding milk to diarrheic calves supplemented with oral electrolytes.
Canadian Journal of Veterinary Research, 53(4), 477-485.
81
Henry, H., Conus, M., Steenhout, P., Béguin, A., & Boulat, O. (2011). Sensitive determination
of d-lactic acid and l-lactic acid in urine by high-performance liquid chromatography-
tandem mass spectrometry. Biomedical Chromatography, doi: 10.1002/bmc.1681.
Herrera, D.J., Morris, K., Johnston, C., & Griffiths, P. (2008). Automated assay for plasma D-
lactate by enzymatic spectrophotometric analysis with sample blank correction. Annals of
Clinical Biochemistry, 45(Pt 2), 177-183.
Holland, R. (1990). Some infectious causes of diarrhea in young farm animals. Clinical
Microbiology Reviews, 3(4), 345-375.
Horton, R. (2002). Principles of biochemistry 3rd
ed. New Jersey: Prentice Hall.
Hove, H., & Mortensen, P. B. (1995). Colonic lactate metabolism and D-lactic acidosis.
Digestive Diseases and Sciences, 40(2), 320-330.
Htyte, N., White, L., Sandhu, G., Jones, J., & Meisels, I. (2011). An extreme and life-
threatening case of recurrent D-lactate encephalopathy. Nephrology, Dialysis,
Transplantation, 26(4), 1432-1435.
Isolauri, E., Ribeiro Hda, C., Gibson, G., Saavedra, J., Saliminen, S., Vanderhoof, J., &
Varavithya, W. (2002). Functional foods and probiotics: working group of the first world
congress of pediatric gastroenterology, hepatology and nutrition. Journal of Pediatric
Gastroenterology and Nutrition, 35(Suppl 2), S106-S109.
Iwanaga, T., Takebe, K., Kato, I., Shin-Ichiro, K., & Kuwahara, A. (2006). Cellular expression
of monocarboxylate transporters (MCT) in the digestive tract of the mouse, rat, and humans,
with special reference to slc5a8. Biomedical Research, 27(5), 243-254.
Johnson, L. (c2007). Gastrointestinal physiology (7th ed.). Philadelphia: Mosby Elsevier.
Johnston, B.C., Shamseer, L., da Costa, B.R., Tsuyuki, R.T., & Vohra, S. (2010). Measurement
issues in trials of pediatric acute diarrheal diseases: a systematic review. Pediatrics, 126(1),
e222-231.
Jorens, P.G., Demey, H.E., Schepens, P.J., Coucke, V., Verpooten, G.A., Couttenye, M.M., &
Van Hoof, V. (2004). Unusual D-lactic acidosis from propylene glycol metabolism in
overdose. Journal of Toxicology, 42(2), 163-169.
Kalapos, M.P. (2008). Methylglyoxal and glucose metabolism: a historical perspective and
future avenues for research. Drug Metabolism and Drug Interactions, 23(1-2), 69-91.
Karg, E., Papp, F., Tassi, N., Janáky, T., Wittmann, G., & Túri, S. (2009). Enhanced
methylglyoxal formation in the erythrocytes of hemodialyzed patients. Metabolism Clinical
and Experimental, 58, 976-982.

82
Kasari, T.R. (1999). Metabolic acidosis in calves. The Veterinary Clinics of North America.
Food Animal Practice, 15(3), 473-86.
Kasari, T.R., & Naylor, JM. (1984). Metabolic acidosis without clinical signs of dehydration in
young calves. The Canadian Veterinary Journal, 25(10), 394-399.
Kasari, T.R., & Naylor, J.M. (1986). Further studies on the clinical features and
clinicopathological findings of a syndrome of metabolic acidosis with minimal dehydration
in neonatal calves. The Canadian Journal of Veterinary Research, 50(4), 502-508.
King, C.K., Glass, R., Bresee, J.S., Duggan, C.; Centers for Disease Control and Prevention.
(2003). Managing acute gastroenteritis among children: oral rehydration, maintenance, and
nutritional therapy. MMWR Recommendations and Reports, 52(RR-16), 1-16.
Kosek, M., Bern, C., & Guerrant, R. (2003). The global burden of diarrhoeal disease, as
estimated from studies published between 1992 and 2000. Bulletin of the World Health
Organization, 81, 197-204.
Kosemund, K., Schlatter, H., Ochsenhirt, J.L., Krause, E.L., Marsman, D.S., & Erasala, G.N.
(2009). Safety Evaluation of superabsorbent baby diapers. Regulatory Toxicology and
Pharmacology, 53, 81-90.
Kraut, J.A., & Madias, N.E. (2010). Metabolic acidosis: pathophysiology, diagnosis and
management. Nature Reviews. Nephrology, 6(5), 274-285.
Lam, W.K., Felmlee, M.A., & Morris, M.E. (2010). Monocarboxylate transporter-mediated
transport of gamma-hydroxybutyric acid in human intestinal Caco-2 cells. Drug
Metabolism and Disposition, 38(3), 441-447.
le Roux, C.W., Wilkinson, S.D., Pavitt, D.V., Muller, B.R., & Alaghband-Zadeh, J. (2004). A
new antiglycolytic agent. Annals of Clinical Biochemistry, 41, 43-46.
Levy, B. (2006). Lactate and shock state: the metabolic view. Current Opinion in Critical Care,
12(4), 315-321.
Li, S.T., Grossman, D.C., Cummings, P. (2007). Loperamide therapy for acute diarrhea in
children: systematic and meta-analysis. PLoS Medicine, 4(3), e98.
Liang, S. & Redlinger, T. (2003). A protocol for isolating Helicobacter pylori from fecal
specimens and genotyping using vacA Alleles. Helicobacter, 8(5), 561-567.
Lima, AA. & Guerrant, R.L. (1992). Persistent diarrhea in children: epidemiology, risk factors,
pathophysiology, nutritional impact, and management. Epidemiologic Reviews, 14, 222-
242.

83
Lorenz, I. (2004). Investigations on the influence of serum D-lactate levels on clinical signs in
calves with metabolic acidosis. The Veterinary Journal, 168(3), 323-327.
Lorenz, I., Gentile, A., & Klee, W. (2005). Investigations of D-lactate metabolism and the
clinical signs of D-lactataemia in calves. Veterinary Record, 156 (13), 412-415.
Lorenz, I., & Vogt, S. (2006). Investigations on the association of D-lactate blood
concentrations with the outcome of therapy of acidosis, and with posture and demeanour in
young calves with diarrhoea. Journal of Veterinary Medicine, A, 53(9), 490-494.
Lorenz, I. (2009). D-Lactic acidosis in calves. The Veterinary Journal, 179 (2), 197-203.
Lorenz, I., & Lorch, A. (2009) D-lactic acidosis in lambs. Veterinary Record, 164(6), 174-175.
Luft, F. (2001). Lactic acidosis update for critical care clinicians. Journal of the American
Society of Nephrology, 12 Suppl 17, S15-S19.
Malek, M.A., Curns, A.T., Holman, R.C., Fischer, T.K., Bresee, J.S., Glass, R.I., Steiner, C.A.,
& Parashar, U.D. (2006). Diarrhea- and rotavirus-associated hospitalizations among
children less than 5 years of age: United States, 1997-2000. Pediatrics, 117(6), 1887-1892.
Marti, R., Varela, E., Segura, R.M., Alegre, J., Suriñach, J.M., Pascual, C. (1997).
Determination of D-lactate by enzymatic methods in biological fluids: study of inferences.
Clinical Chemistry, 43(6 Pt 1), 1010-1015.
Miles, R.R., Roberts, R.F., Putnam, A.R., & Roberts, W.L. (2004). Comparison of Serum and
Heparinized Plasma Samples for Measurement of Chemistry Analytes. Clinical Chemistry,
50(9), 1704-1706.
McLellan, A.C., Phillips, S.A., & Thornalley, P.J. (1992). Fluorimetric assay of D-lactate.
Analytical Biochemistry, 206(1), 12-16.
McLellan, A.C., & Thornalley, P.J. (1989). Glyoxalase activity in human red blood cells
fractioned by age. Mechanisms of Aging and Development, 48, 63-71.
McLellan, A.C., Thornalley, P.J., Benn, J., & Sonksen, P.H. (1994). Glyoxalase system in
clinical diabetes mellitus and correlation with diabetic complications. Clinical Science
(Lond), 87(1), 21-29.
Morris, C., & Low, J. (2008a). Metabolic acidosis in the critically ill: Part 1. Classification and
pathophysiology. Anaesthesia, 63(3), 294-301.
Morris, C., & Low, J. (2008b). Metabolic acidosis in the critically ill: Part 2. Causes and
treatment. Anaesthesia, 63(4), 396-411.

84
Mortensen, P.B., Hove, H., Clausen, M.R., & Holtug, K. (1991). Fermentation to short-chain
fatty acids and lactate in human faecal batch cultures. Intra- and inter-individual variations
versus variations caused by changes in fermented saccharides. Scandinavian Journal of
Gastroenterology, 26(2), 1285-1294.
Munakata, S., Arakawa, C., Kohira, R., Fujita, Y., Fuchigami, T., & Mugishima, H. (2009). A
case of D-lactic encephalopathy associated with use of probiotics. Brain & Development,
32(8), 691-694.
Navaneethan, U., & Giannella, R. (2008). Mechanisms of infectious diarrhea. Nature Clinical
Practice Gastroenterology Hepatology, 5(11), 637-647.
Nielsen, C., Pedersen, L.T., Lindholt, J.S., Mortensen, F.V., & Erlandsen, E.J. (2011). An
automated plasma D-lactate assay with a new sample preparation method to prevent
interference from L-lactate and L-lactate dehydrogenase. Scandinavian Journal of Clinical
and Laboratory Investigation, 71(6), 507-514.
Oh, M, Uribarri, J., Alveranga, D., Lazar, I., Bazilinski, N., & Carroll, H. (1985). Metabolic
utilization and renal handling of D-lactate in men. Metabolism, Clinical and Experimental,
34(7), 621-625.
Oh, M., Phelps, K., Traube, M., Barbosa-Saldivar, J., Boxhill, C, & Carroll, H. (1979). D-lactic
acidosis in a man with the short-bowel syndrome. New England Journal of Medicine,
301(5), 249-252.
Omole, O.O., Brocks, D.R., Nappert, G., Naylor, J.M., & Zello, G.A. (1999). High performance
liquid chromatographic assay of (+/-)-lactic acid and its enantiomers in calf serum. Journal
of chromatography. B, Biomedical sciences and application. 727(1-2), 23-29.
Omole, O.O., Nappert, G., Naylor, J.M., & Zello, G.A. (2001). Both L- and D-lactate contribute
to metabolic acidosis in diarrheic calves. Journal of Nutrition, 131(8), 2128-2131.
O'Ryan, M., Prado, V., & Pickering, L. (2005). A millennium update on pediatric diarrheal
illness in the developing world. Seminars in Pediatric Infectious Diseases, 16(2), 125-136.
Parrish, C. (2005). The Clinician's Guide to Short Bowel Syndrome. Practical
Gastroenterology, XXIX (9), 67-106.
Peng, T., Hsu, B., Yang, F., Chao, Y.F., Harn, H., Lee, R. (2010). Stability of blood
biochemistry levels in animal model research: effects of storage condition and time.
Biological Research for Nursing, 11(4), 395-400.
Perez, G.O., Oster, J.R, & Rogers, A. (1987). Acid-base disturbance in gastrointestinal disease.
Digestive Diseases and Sciences, 32(9), 1033-1043.
Petersen, C. (2005). D-lactic acidosis. Nutrition in Clinical Practice, 20(6), 634-645.
85
Poole, R.C. & Halestrap, A.P. (1993). Transport of lactate and other monocarboxylates across
mammalian plasma membranes. The American Journal of Physiology, 264(4 Pt 1), C761-
C782.
Puwanant, M., Mo-Suwan, L., & Patrapinyokul, S. (2005). Recurrent D-lactic acidosis in a child
with short bowel syndrome. Asia Pacific Journal of Clinical Nutrition, 14(2), 195.
Radostits, O.M., & Acres, S.D. (1980). The prevention and control of epidemics of acute
indifferentiated diarrhea of beef calves in Western Canada. The Canadian Veterinarian
Journal, 21(9), 243-249.
Rose, B., & Post, T. (2001). Clinical physiology of acid-base and electrolyte disorders. New
York: McGraw-Hill Medical Pub. Division.
Sack, D.A., Rhoads, M., Molla, A., Molla, A.M., & Wahed, M.A. (1982). Carbohydrate
malabsorption in infants with rotavirus diarrhea. The American Journal of Clinical
Nutrition, 36 (6), 1112-1118.
Saif, L.J., & Smith K.L. (1985). Enteric viral infections of calves and passive immunity.
Journal of Dairy Science, 68(1), 206-228.
Sato, H. & Koiwa, M. (2008). Fecal D- and L-lactate, succinate and volatile fatty acid levels,
and the relationships with fecal acidity and diarrhea in neonatal calves. Animal Science
Journal, 79, 187-192.
Schoorel, E., Giesberts, M., Blom, W., & van Gelderen, H. (1980). D-lactic acidosis in a boy
with short bowel syndrome. Archives of Disease in Childhood, 55(10), 810-812.
Schumann, F.J., Townsend, H.G., & Naylor, J.M. (1990). Risk factors for mortality from
diarrhea in beef calves in Alberta. Canadian Journal of Veterinary Research, 54(3), 366-
372.
Sellin, J.H. (2001). The pathophysiology of diarrhea. Clinical Transplantation, 15(Suppl 4), 2-
10.
Seymour, C.W., Carlbom, D., Cooke, C.R. Watkin, T.R., Bulger, E.M., Rea, T.D., & Baird, G.S.
Temperature and time stability of whole blood lactate: implications for feasibility of pre-
hospital measurement. BMC Research Notes, 4, 169.
Shimomura, Y., & Sato, H. (2006). Fecal D- and L-lactate, succinate, and volatile fatty acid
levels in young dairy calves. The Journal of Veterinary Medical Science, 68(9), 973-977.
Smith, G. W. (2009). Treatment of calf diarrhea: Oral fluid therapy. Veterinary Clinics of North
America - Food Animal Practice, 25(1), 55-72.
86
Stahl, M., & Brandslund, I. (2005). Controlled storage conditions prolong stability of
biochemical components in whole blood. Clinical Chemistry and Laboratory Medicine,
43(2), 210-215.
Stolberg, L., Rolfe, R., Gitlin, N., Merrit, J., Mann, L., Linder, J., & Finegold, S. (1982). D-
Lactic acidosis due to abnormal gut flora: diagnosis and treatment of two cases. The New
England Journal of Medicine, 306(22), 1344-1348.
Szymański, H., Pejcz, J., Chmielarczyk, A., Strus, M., Heczko, P.B. (2006). Treatment of acute
infectious diarrhoea in infants and children with a mixture of three Lactobacillus rhamnosus
strains--a randomized, double-blind, placebo-controlled trial. Alimentary Pharmacology &
Therapeutics, 23(2), 247-253.
Talasniemi, J.P., Pennanen, S., Savolainen, H., Niskanen, L., Liesivuori, J. (2008). Analytical
investigation: assay of D-lactate in diabetic plasma and urine. Clinical Biochemistry,
41(13), 1099-10103.
Thapar, N., & Sanderson, I. (2004). Diarrhoea in children: An interface between developing and
developed countries. The Lancet, 363(9409), 641-653.
Thomas, D.W., Greer, F.R. (2010). Probiotics and prebiotics in pediatrics. Pediatrics, 126(6),
1217-1231.
Thornalley, P.J. (1993). The glyoxalase system in health and disease. Molecular Aspects of
Medicine, 14, 287-371.
Toffaletti, J., Hammes, M.E., Gray, R., Lineberry, B., & Abram, B. (1992). Lactate measured in
diluted and undiluted whole blood and plasma: comparison of methods and effect of
hematocrit. Clinical Chemistry, 38(12), 2430-2434.
Tubbs, P. (1965). The metabolism of D-alpha-hydroxy acids in animal tissues. Annals of the
New York Academy of Sciences, 119(3), 920-926.
Tuck, M.K., Chan, D.W., Chia, D., Godwin, A.K., Grizzle, W.E., Krueger, K.E., Rom, W.,
Sanda, M., Sorbara, L., Stass, S., Wang, W., & Brenner, D.E. (2009). Standard operating
procedures for serum and plasma collection: early detection research network consensus
statement standard operating procedure integration working group. Journal of Proteome
Research, 8, 113-117.
Uchida, H., Yamamoto, H., Kisaki, Y., Fujino, J., Ishimaru, Y., & Ikeda, H. (2004). D-lactic
acidosis in short-bowel syndrome managed with antibiotics and probiotics. Journal of
Pediatric Surgery, 39(4), 634-636.
United Nations. (2002). Road map toward the implementation of the United Nations Millennium
Declaration (General Assembly Document A5 6/3 26). New York: United Nations 2002.
United Nations

87
United Nations Children's Fund (UNICEF) & World Health Organization (WHO). (2004).
WHO/UNICEF Joint Statement: Clinical management of acute diarrhoea. Retrieved form
UNICEF Web site:
http://www.unicef.org/publications/files/ENAcute_Diarrhoea_reprint.pdf
United Nations Children's Fund (UNICEF) & World Health Organization (WHO). (2009).
Diarrhoea: Why children are still dying and what can be done. Retrieved from UNICEF
Web site:
http://www.unicef.org/health/files/Final_Diarrhoea_Report_October_2009_final.pdf
Uribarri, J., Oh, M.S., & Carroll, H.J. (1998). D-Lactic acidosis: A review of clinical
presentation, biochemical features, and pathophysiologic mechanisms. Medicine, 77(2), 73-
82.
USDA. 2008. Dairy 2007, Part II: Changes in the U.S. Dairy Cattle Industry,
1991–2007. USDA-APHIS-VS, CEAH. Fort Collins, CO, #N481.0308
USDA. 2010. Beef 2007–08, Prevalence and Control of Bovine Viral Diarrhea Virus on U.S.
Cow calf Operations, 2007–08 . USDA:APHIS:VS, CEAH. Fort Collins, CO
#587.0810
Vaught, J.B. (2006). Blood collection, shipment, processing and storage. Cancer
Epidemiology, Biomarkers & Prevention, 15(9), 1582-1584.
Vella, A., & Farrugia, G. (1998). D-lactic acidosis: Pathologic consequence of saprophytism.
Mayo Clinic Proceedings, 73(5), 451-456.
Vernon, C., & LeTourneau, J.L. (2010). Lactic acidosis: recognition, kinetics, and associated
prognosis. Critical Care Clinics, 26(2), 255-283.
von Buenau, R., Jaekel, L., Schubotz, E., Schwarz, S., Stroff, T., & Krueger, M. (2005).
Escherichia coli strain Nissle 1917: significant reduction of neonatal calf diarrhea. Journal
of Dairy Science, 88(1), 317-323.
Walker, P.G., Constable, P.D., Morin, D.E., Drackley, J.K., Foreman, J.H., & Thurmon, J.C.
(1998). A reliable, practical, and economic protocol for inducing diarrhea and severe
dehydration in the neonatal calf. Canadian Journal of Veterinary Research, 62(3), 202-213.
Wang, F., Butler, T., Rabbani, G.H., & Jones, P.K. The acidosis of cholera. Contributions of
hyperproteinemia, lactic acidemia and hyperphosphatemia to an increased serum anion gap.
New England Journal of Medicine, 315(5), 1591-1595.
Wang, Q., Lu,Y., & Morris, M.E. (2007). Monocarboxylate transporter (MCT) mediates the
transport of γ-hydroxybutyrate in human kidney HK-2 cells. Pharmaceutical Research,
24(6), 1067-1078.

88
Weizman, Z., Houri, S., & Ben-Ezer Gradus, D. (1992). Type of acidosis and clinical outcome
in infantile gastroenteritis. Journal of Pediatric Gastroenterology and Nutrition, 14(2), 187-
191.
Wiese, J., Didwania, A., Kerzner, R., & Chernow, B. (1997). Use of different anticoagulants in
test tubes for analysis of blood lactate concentrations: Part 2. Implications for the proper
handling of blood specimens obtained from critically ill patients. Critical Care Medicine,
25(11), 1847-1850.
World Health Organization. (2005). The treatment of diarrhoea: A manual for physicians and
other senior health care workers. Retrieved April 3, 2009, from
http://whqlibdoc.who.int/publications/2005/9241593180.pdf
World Health Organization (WHO). (2002). Use of anticoagulants in diagnostic laboratory
investigations & Stability of blood, plasma and serum samples. WHO/DIL/LAB/99.1 Rev.2
Vaught, J.B. (2006). Blood collection, shipment, processing and storage. Cancer Epidemiology,
Biomarkers & Prevention, 15(9), 1582-1584.
Xue, M., Rabbani, N., & Thornalley, P.J. (2011). Glyoxalase in aging. Seminars in Cell &
Developmental Biology, 22(3), 293-301.
Zello, G.A., Abeysekara, S., Ewaschuk, J.B., Alcorn, J., Naylor, J.M., & Lohmann, K. (2009).
The determination of a fecal D-lactate threshold in neonatal ruminants with diarrhea
[Abstract], The Journal of the Federation of American Societies for Experimental Biology,
23 (Meeting Abstract Supplement), 919.5.
Zimmaro Bliss, D.Z., Larson, S.J., Burr, J., Savik, K. (2001). Reliability of a stool consistency
classification system. Journal of Wound, Ostomy, and Continence Nursing, 28(6), 305-313.
89
APPENDICES
Appendix A: Ethics Certificates .......................................................................... 110
Appendix B: D-Lactic Acidosis in Neonatal Diarrhea (Awassa, Ethiopia) ....... 117
Appendix C: Study Protocols .............................................................................. 125
Appendix D: Consent Forms ............................................................................... 136
Appendix E: Diarrhea Severity Tools from D-Lactic Acidosis in Pediatric
Diarrhea Study ............................................................................... 142
Appendix F: Clinical Assessment Scoring Tools (Neonatal Animals) ............... 145

90
Appendix A
Ethics Certificates
Mechanisms of acidosis and acidosis treatment in calves for:
i) The effect of storage on blood D- and L-lactate concentrations in calves and
ii) Investigation of a potential fecal D-lactate threshold in neonatal calves with
diarrhea ............................................................................................................... .......91
D-Lactic acidosis in pediatric diarrhea ...................................................................... 92
Renewal - D-Lactic acidosis in pediatric diarrhea ..................................................... 93
Saskatoon Health Region Operational Approval-D-Lactic acidosis in pediatric
diarrhea ...................................................................................................................... 94
Amended Saskatoon Health Region Operational Approval-D-Lactic acidosis
in pediatric diarrhea ................................................................................................... 95
D-Lactic acidosis in neonatal diarrhea (Awassa, Ethiopia) ...................................... 96

91
92
93
94

95

96
97
Appendix B
D-Lactic Acidosis in Neonatal Diarrhea (Awassa, Ethiopia)
Introduction ................................................................................................................ 98
Materials and Methods ............................................................................................... 99
Study Design .......................................................................................................... 99
Sample Collection ................................................................................................ 100
Results ...................................................................................................................... 101
Study Progress ......................................................................................................... 101
References ................................................................................................................ 102
98
INTRODUCTION
The College of Agriculture and Bioresources and College of Pharmacy and Nutrition at
the University of Saskatchewan have developed a partnership with Hawassa University (HU) in
Awassa, Ethiopia in building and improving the capacity of the HU curriculum development,
teaching, graduate student supervision and research collaboration. Ethiopia is an agrarian country
where small-scale farmers dominate agricultural production. Food insecurity and chronic
malnutrition is a persistent problem and significantly impacts the health and wellbeing of
households (Jufare, 2008). A recent survey conducted by Arcand et al. (2009) identified several
potential areas of research for graduate students including livestock and human health. The
Global Partner II Program provided the UofS student researcher the opportunity to travel to
Awassa, Ethiopia to continue strengthening the research collaboration developed between HU
and UofS and to work jointly with HU graduate students on nutritional research.
Diarrhea in children and neonatal animals continues to be a leading cause of morbidity
and mortality in developing countries. Children are more likely to have a higher number of
diarrheal episodes, severe episodes with dehydration, and higher death rate compared to those
children living in countries living in a middle-or high-income country (O’Ryan, Prado &
Pickering, 2005). In Ethiopia, an estimated 73,341 child deaths were due to diarrhea in 2008
(Black et al., 2010). In neonatal calves, diarrhea related morbidity and death have a significant
impact on the wellbeing of Ethiopian farmers as they are dependent on livestock for food,
income, draught power for crop production and financial security (Wudu, Kelay, Mekonnen &
Tesfu, 2008; Randolph et al., 2007). Metabolic acidosis is a clinical complication of diarrhea in
children and neonatal animals. As previously described, D-lactate, a physiological isomer of L-
lactate, was found to be a significant contributor to acidosis in diarrheic calves (Kasari & Naylor,
1984; Omole, Nappert, Naylor & Zello, 2001; Ewaschuk, Naylor, Palmer, Whiting & Zello,
2004). It is not known if D-lactic acidosis occurs in neonatal animals with diarrhea in Ethiopia.
A previously discussed in Chapter 3, it is also not known if D-lactic acidosis occurs in children,
in the absence of short bowel syndrome, with acute diarrhea. Clinical cases of pediatric diarrhea
in Saskatchewan where health care, for the most part, is readily accessible may not be severe
enough to cause an overproduction of D-lactate in the gastrointestinal tract and D-lactic acidosis.
By conducting a parallel study in Ethiopia, where 85% of the population lives in rural areas and
99
more severe and prolonged diarrhea is likely to occur, a larger sample size can be obtained with a
wider range of diarrhea severity.
If this study shows that children and/or neonatal animals with diarrhea have D-lactic
acidosis, future research may investigate treatments to target the formation of colonic lactate,
specifically the D-lactate producing bacteria, as opposed, or in conjunction with, the buffering or
oral replacement therapies currently used. As use of medicinal remedies (e.g., antibiotics) in
developing countries is costly and not readily available, and due the increasing concerns
surrounding antibiotic resistance, further research could investigate the treatment and prevention
of diarrhea with natural sources of food (e.g., pre and probiotics).
The objectives of this research project were:
To engage and support a nutrition graduate student from HU in a parallel project
to the D-lactic acidosis studies conducted in Saskatoon, Saskatchewan:
o To determine if D-lactic acidosis occurs in children (≤ 5 years of age) who
come to Awassa Referral Hospital with acute diarrhea and metabolic
acidosis in Awassa, Ethiopia
o To determine if D-lactic acidosis occurs in neonatal animals in Awassa,
Ethiopia
To collaborate with Hawassa University (HU) including the Masters of Human
Nutrition [MAHN] program, Awassa Referral Hospital, and Department of
Veterinary Medicine, in carrying out nutrition research
MATERIALS AND METHOD
Study Design
Human Study
For the investigation of D-lactic acidosis in human children, this study is designed to
parallel that of “D-Lactic Acidosis in Pediatric Diarrhea” as previously described in Chapter 3.
Children (≤ 5 years of age) with acute diarrhea, defined as three or more profuse or watery stools
per day, would be eligible for this study. Once parental or legal guardian consent was obtained,
blood and fecal samples would be collected from each study participant and analyzed for D-, L-
lactate and pyruvate concentrations. Again, diarrhea would have to be severe enough to warrant
routine clinical investigation of blood electrolytes.

100
Animal Study
In May 2010, nine goat kids, less than 35 days of age, were selected for blood and fecal
sampling based on clinical signs of diarrhea from a goat and sheep research farm located at
Hawassa University. Control samples (blood and fecal) were also obtained from nine healthy
goat kids from the same research farm. Blood and fecal samples were also obtained from one
diarrheic neonatal calf at a nearby village veterinarian clinic. Animals were selected for this
study on the basis of having clinical signs of diarrhea. All animals were assigned a clinical
depression score and assessed for dehydration and diarrhea type (Appendix F). At the time of
this study, there was no animal ethics board at HU however was approved by the University of
Saskatchewan’s Animal Research Ethics Board, and adhered to the Canadian Council on Animal
Care guidelines for humane animal use (Appendix B).
Sample Collection and Analysis
Human Study
In Ethiopia, all health research involving humans must be approved by the National
Health Research Ethics Committee. As discussed in 2009 with our HU partners and HU
graduate student, a research proposal and ethics application was to be composed by the HU
graduate student with guidance from the UofS researchers. A study proposal and study protocol
was drafted and reviewed by UofS researchers however this document and ethics application was
not submitted to the National Health Research Ethics Committee in Ethiopia before travelling
back in May, 2010. Since human ethic approval was not granted upon my return to Awassa, no
further work could be carried out for the human D-lactate project. Due to unforeseen
circumstances, a research proposal was not submitted to the Ethics Committee therefore no blood
and/or fecal samples have collected to date. The proposed study protocol prepared by the HU
graduate student can be found in Appendix C.
Animal Study
Jugular vein blood samples, approximately 5-10mL, were collected from each animal and
pH was determined immediately (Accumet basic pH meter; Fishers Scientific, Schwerte,
Germany). The blood was then allowed to coagulate at room temperature for 20 minutes,
centrifuged, and serum drawn off and stored at -20˚C. Approximately 20 g of feces was

101
collected from each animal and mixed with 15 mL Thiomerosal, a bacteriostatic agent, and
frozen at -20˚C until analysis (Appendix C).
RESULTS
Two goat kids with diarrhea had blood pH < 7.28, which is indicative of acidosis. Upon
clinical assessment, one kid with indicators of acidosis had no suck. The anion gap, which is
often used to diagnosis metabolic acidosis, could not be calculated as researchers did not have
access to a blood gas and electrolyte analyzer. Upon clinical assessment, the diarrheic calf had a
weak menace but demonstrated normal suck, palpebral and tactile responses, and ability to stand.
The blood pH of this calf was not indicative of acidosis.
STUDY PROGRESS
Serum and fecal samples were to be analyzed for D- and L-lactate using enzymatic assay
kits (Biovision, Mountain View, CA). The analysis for this project required the use of a
microplate reader, which was determined to be available at HU. However, the UofS student
researcher was unaware that this piece of equipment had never been used prior to this study and
no one within the department had any knowledge of its use. Due to some difficulties in set-up
(i.e. misplacement of software) and technological difficulties (i.e. unable to obtain required
optical density for microplate) samples could not be analyzed while the UofS student researcher
was in Awassa, Ethiopia however technical skills and instruction on the use of the analytical kits
was provided to the HU graduate student recruited for the study. Sample collection and analysis
was to continue once the UofS student researcher left Ethiopia however, to date; no additional
samples have been collected and/or analyzed.

102
REFERENCES
Black, R.E., Cousens, S., Johnson, H.L., Lawn, J.E., Rudan, I., Bassani, D.G., Jha, P., Campbell,
H., Walker, C.F., Cibulskis, R., Eisele, T., Liu, L., & Mathers, C. (2010). Global, regional,
and national causes of child mortality in 2008: a systematic analysis. The Lancet, 375
(9730), 1969-1987.
Casburn-Jones, A.C., & Farthing, M.J.G. (2004). Management of Infectious Diarrhoea. Gut,
53(2), 296-305.
Jufare, A.T. (2008). Livelihood Adaptation, Risks and Vulnerability in Rural Wolaita, Ethiopia.
(PhD Thesis, Norwegian University of Life Sciences, Norway. Retrieved from
http://www.umb.no/statisk/noragric/publications/phdtheses/ayele_fulltext_thesis.pdf
O'Ryan, M., Prado, V., & Pickering, L.K. (2005). A millennium update on pediatric diarrheal
illness in the developing world. Seminars in Pediatric Infectious Disease, 16(2), 125-136.
Wudu, T., Kelay, B., Mekonnen, H.M., & Tesfu, K. (2008). Calf morbidity and mortality in
smallholder dairy farms in Ada’a Liben district of Oromia, Ethiopia. Tropical Animal
Health and Production, 24(2), 74-80.
103
Appendix C
Study Protocols
D-Lactic acidosis in pediatric diarrhea .................................................................... 104
Revised D-lactic acidosis in pediatric diarrhea ....................................................... 105
Comparison of Fecal and Serum D-lactate concentration in diarrheic calves for:
Investigation of a potential fecal D-lactate threshold in neonatal calves
with diarrhea ........................................................................................................ 106
D-Lactic acidosis in pediatric diarrhea (Awassa, Ethiopia) .................................... 108
D-Lactic acidosis in animal neonatal diarrhea (Awassa, Ethiopia) ........................ 111
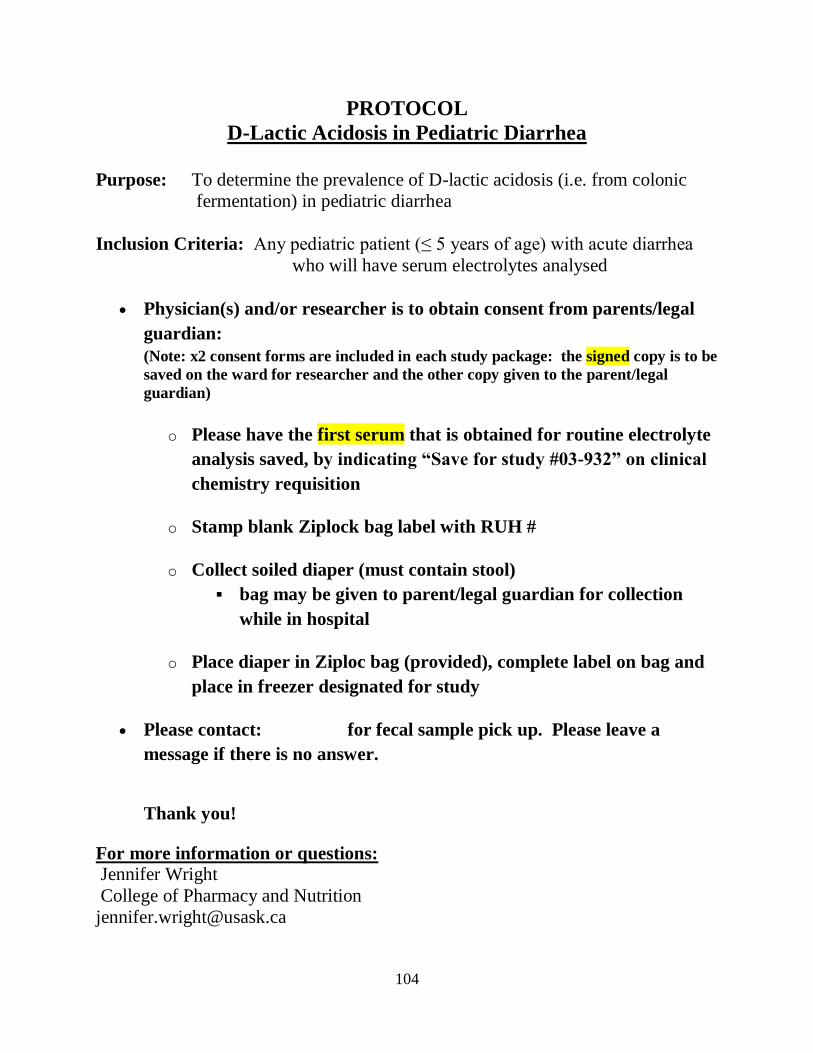
104
PROTOCOL
D-Lactic Acidosis in Pediatric Diarrhea
Purpose: To determine the prevalence of D-lactic acidosis (i.e. from colonic
fermentation) in pediatric diarrhea
Inclusion Criteria: Any pediatric patient (≤ 5 years of age) with acute diarrhea
who will have serum electrolytes analysed
Physician(s) and/or researcher is to obtain consent from parents/legal
guardian:
(Note: x2 consent forms are included in each study package: the signed copy is to be
saved on the ward for researcher and the other copy given to the parent/legal
guardian)
o Please have the first serum that is obtained for routine electrolyte
analysis saved, by indicating “Save for study #03-932” on clinical
chemistry requisition
o Stamp blank Ziplock bag label with RUH #
o Collect soiled diaper (must contain stool)
bag may be given to parent/legal guardian for collection
while in hospital
o Place diaper in Ziploc bag (provided), complete label on bag and
place in freezer designated for study
Please contact: 371-7115 for fecal sample pick up. Please leave a
message if there is no answer.
Thank you!
For more information or questions: Jennifer Wright
College of Pharmacy and Nutrition
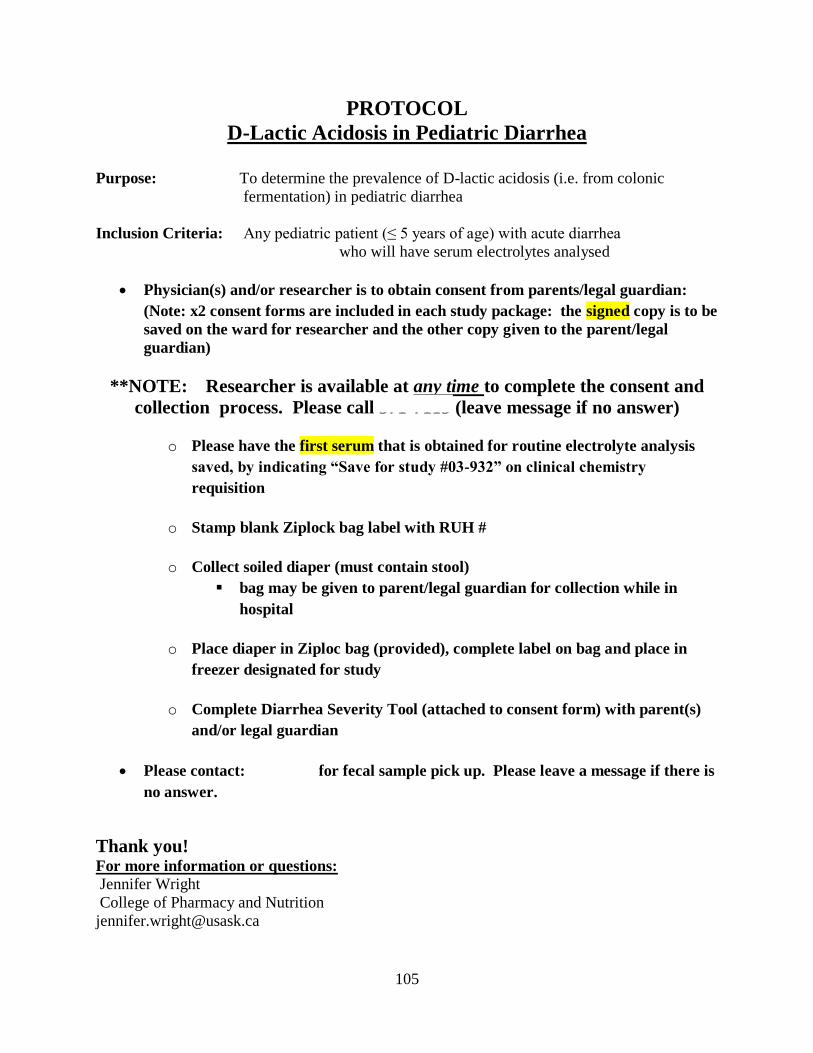
105
PROTOCOL
D-Lactic Acidosis in Pediatric Diarrhea
Purpose: To determine the prevalence of D-lactic acidosis (i.e. from colonic
fermentation) in pediatric diarrhea
Inclusion Criteria: Any pediatric patient (≤ 5 years of age) with acute diarrhea
who will have serum electrolytes analysed
Physician(s) and/or researcher is to obtain consent from parents/legal guardian:
(Note: x2 consent forms are included in each study package: the signed copy is to be
saved on the ward for researcher and the other copy given to the parent/legal
guardian)
**NOTE: Researcher is available at any time to complete the consent and
collection process. Please call 371-7115 (leave message if no answer)
o Please have the first serum that is obtained for routine electrolyte analysis
saved, by indicating “Save for study #03-932” on clinical chemistry
requisition
o Stamp blank Ziplock bag label with RUH #
o Collect soiled diaper (must contain stool)
bag may be given to parent/legal guardian for collection while in
hospital
o Place diaper in Ziploc bag (provided), complete label on bag and place in
freezer designated for study
o Complete Diarrhea Severity Tool (attached to consent form) with parent(s)
and/or legal guardian
Please contact: 371-7115 for fecal sample pick up. Please leave a message if there is
no answer.
Thank you! For more information or questions: Jennifer Wright
College of Pharmacy and Nutrition
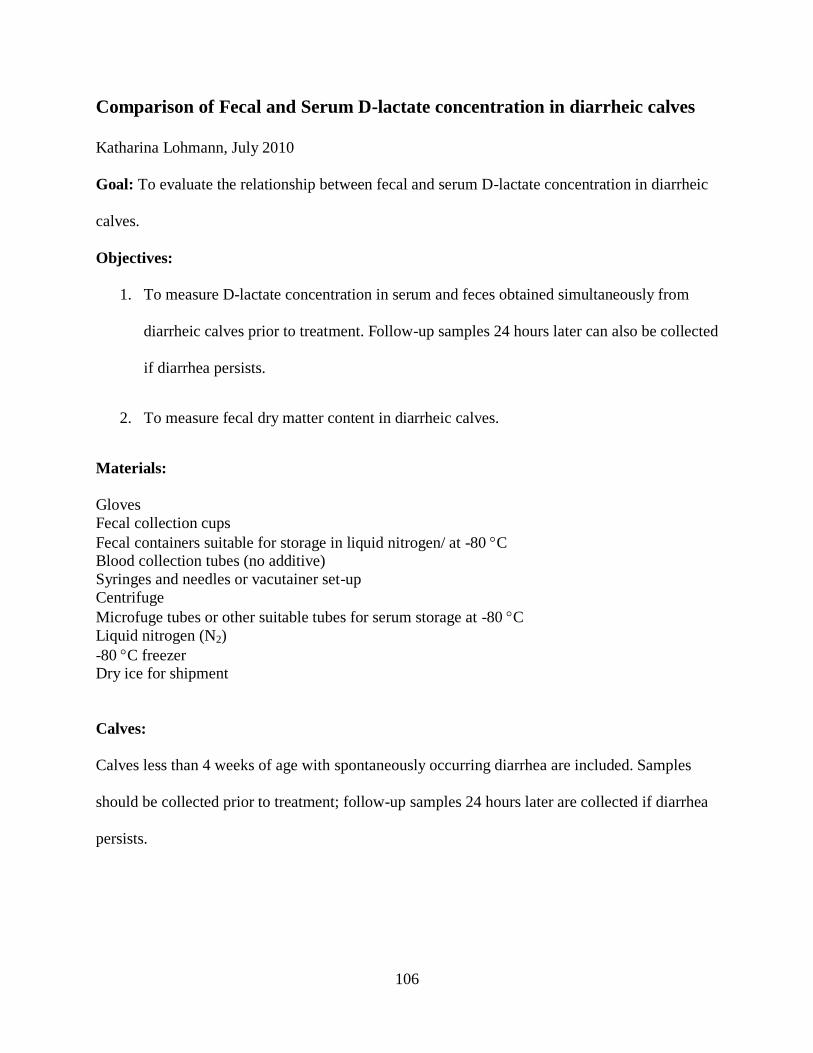
106
Comparison of Fecal and Serum D-lactate concentration in diarrheic calves
Katharina Lohmann, July 2010
Goal: To evaluate the relationship between fecal and serum D-lactate concentration in diarrheic
calves.
Objectives:
1. To measure D-lactate concentration in serum and feces obtained simultaneously from
diarrheic calves prior to treatment. Follow-up samples 24 hours later can also be collected
if diarrhea persists.
2. To measure fecal dry matter content in diarrheic calves.
Materials:
Gloves
Fecal collection cups
Fecal containers suitable for storage in liquid nitrogen/ at -80 C Blood collection tubes (no additive)
Syringes and needles or vacutainer set-up
Centrifuge
Microfuge tubes or other suitable tubes for serum storage at -80 C
Liquid nitrogen (N2)
-80 C freezer Dry ice for shipment
Calves:
Calves less than 4 weeks of age with spontaneously occurring diarrhea are included. Samples
should be collected prior to treatment; follow-up samples 24 hours later are collected if diarrhea
persists.

107
Collection protocol:
1. Label the blood collection tube, serum storage tube, fecal collection cup and fecal storage
container with the calf number, date and time of collection.
2. Fill out a calf record sheet including the clinical assessment score.
3. Collect a blood sample from the jugular vein or tail vein into a serum tube (5-10 ml).
Allow sample to clot at room temperature for 20 minutes.
4. Wearing gloves, collect a fecal sample (10-15 grams) into a collection cup. If necessary,
transfer the sample into a clean container prior to freezing.
5. Immediately after collection, snap freeze fecal sample in liquid N2. Ensure the container
is properly sealed to avoid leakage or entry of liquid N2 into the sample.
6. Once the blood sample is clotted, centrifuge for 15 minutes at approximately 3000 rpm
(1500 g). Transfer serum into the serum storage tube and freeze at -80 C.
Shipping:
Ship samples on dry ice to avoid thawing. Ship to:
Katharina Lohmann
Department of Large Animal Clinical Sciences
WCVM, University of Saskatchewan
52 Campus Drive
Saskatoon, SK S7N5B4
Phone (306) 966 7157
Fax (306) 966 7159
Email [email protected]

108
PROTOCOL
D-Lactic Acidosis in Pediatric Diarrhea
Investigators:
Principal Investigator: Dr. Gordon Zello, College of Pharmacy & Nutrition, University of
Saskatchewan, Canada
Co-investigator: Dr. Yfru Beyene, College of Health Sciences, Hawassa University,
Awassa, Ethiopia
Graduate Students: Biniam Amare, Hawassa University, Ethiopia
Jennifer Wright, University of Saskatchewan, Canada
Contacts: Canada- Jennifer Wright
Ethiopia- Biniam Amare
Purpose: To determine the prevalence of D-lactic acidosis in pediatric diarrhea
Inclusion Criteria: Any pediatric patient (< 5 years of age) with clinical signs of diarrhea, defined as 3 or more profuse or watery stools per day
Please contact: +251916824539 or +251462210060 to notify possible study
participant.
Once consent is obtained by researcher:
Please have serum that is obtained for normal investigation of the patient based on
the inclusion criteria, save it by indicating “Save for D-lactate study”
Take 50g feces and place it in a white plastic jars, label on jar with subject #, and
place in freezer
Please fill out form provided
Thank you!
For more information or questions: Biniam Amare
Institute of Nutrition, Food Science and Technology,
Hawassa University
P.O.Box 05
Awassa, Ethiopia

109
D-Lactic Acidosis in Pediatric Diarrhea Collection Form
Subject
Stool Saved? If so, check box
Serum Saved? If so, check box
Mark level of severity **
Duration of diarrhea
Maximum number of diarrhea
Duration of vomiting
Maximum number of vomiting episodes
Temperature (oC)
Dehydr
ation Treatment
1
2
3
4
5
6
7
** Refer to the Clerk or Vesikari severity scoring scales given below
Annex: The Clark and Vesikari severity scoring scales for the evaluation of gastroenteritis in
children (one of the two scales will be selected based on the capacity of the hospital)
The physician, nursing staff, and/or research assistant will observe and classify the severity of
diarrhea based on either of the following severity scoring scale.
Clark
Point value
1 2 3
Diarrhea
Number of stools/per 2-4 5-7 8
Duration in days 1-4 5-7
Vomiting
Number of
emeses/day
1-3 4-6
Duration in days 2 3-5
Rectal temperature
Temperature (oC) 38.1-38.2 38.3-38.7
Duration in days 1-2 3-4
Behavioural symptoms/signs
Description Irritable/less
playful
Lethargic/listless Seizure
Duration in days 1-2 3-4
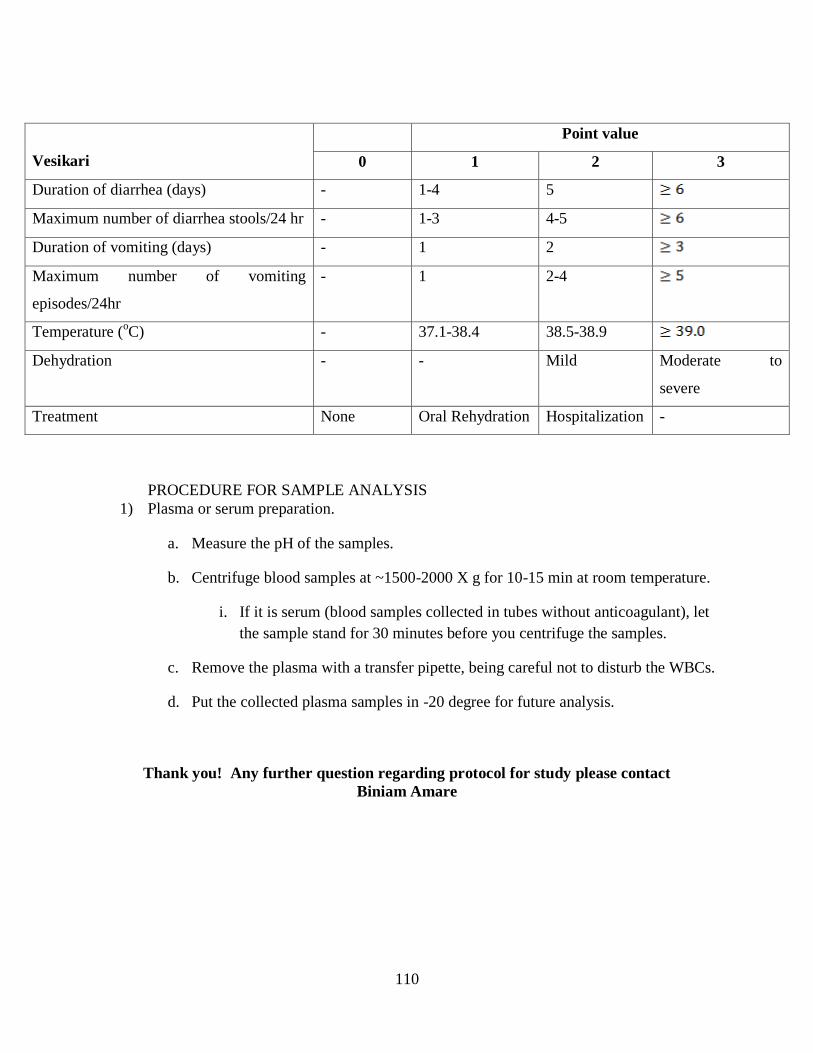
110
Vesikari
Point value
0 1 2 3
Duration of diarrhea (days) - 1-4 5
Maximum number of diarrhea stools/24 hr - 1-3 4-5
Duration of vomiting (days) - 1 2
Maximum number of vomiting
episodes/24hr
- 1 2-4
Temperature (oC) - 37.1-38.4 38.5-38.9
Dehydration - - Mild Moderate to
severe
Treatment None Oral Rehydration Hospitalization -
PROCEDURE FOR SAMPLE ANALYSIS
1) Plasma or serum preparation.
a. Measure the pH of the samples.
b. Centrifuge blood samples at ~1500-2000 X g for 10-15 min at room temperature.
i. If it is serum (blood samples collected in tubes without anticoagulant), let
the sample stand for 30 minutes before you centrifuge the samples.
c. Remove the plasma with a transfer pipette, being careful not to disturb the WBCs.
d. Put the collected plasma samples in -20 degree for future analysis.
Thank you! Any further question regarding protocol for study please contact
Biniam Amare
111
Protocol for D-Lactic Acidosis in Animal Neonatal Diarrhea
Investigators:
Principal Investigator: Dr. Gordon Zello, College of Pharmacy & Nutrition,
University of Saskatchewan, Canada
Co-investigator: Dr. Kassahun Asmare, Veterinary Medicine, Hawassa
University, Ethiopia
Graduate Students: Biniam Amare, Hawassa University, Ethiopia
Jennifer Wright, University of Saskatchewan, Canada
Contacts: Canada- Jennifer Wright
Ethiopia- Biniam Amare
Title: Prevalence of D-lactic acidosis in neonatal animals
Objective: To determine if D-lactic acidosis occurs in diarrheic neonatal animals
in Awassa, Ethiopia
Methodology:
**Phone Biniam at 09-16-82-45-39 and let Biniam know that a sample has been taken.
Leave a message if there is no answer.**
Study Design
Neonatal animal inclusion criteria: clinical signs of diarrhea, defined as 3 or more profuse or watery stools per day
Sampling (serum and feces) of neonatal animals at University Hawassa, Ethiopia will be conducted throughout the year. We hope to ensure the coverage of at least 15 cases per
species over the course of one year.
Blood (5-10ml) and fecal (approximately 50g [solid] or 100ml [liquid]) samples will be
collected from diarrheic neonatal animals.
o Blood will be analyzed for pH and allowed to clot. Serum will be drawn off for
determination of organic acid concentration (D-,L- and pyruvate) at Department
of Veterinary Medicine at Hawassa University.
o Fecal samples to be frozen as soon as possible after collection
In order to have a control, whenever samples are collected from diarrheic cases samples
112
(blood and feces) will be taken from a healthy neonatal animal of the same age and
species.
Serum and fecal samples will be stored at -20°C until analysis.
Serum and feces will be analyzed for D-, L-lactate, and pyruvate via colorimetric assay
kits (Biovision #K667-100, K607-100 and K609-100 respectively) at Hawassa
University.
Procedure
Upon finding a potential diarrheic neonatal animal appropriate for study:
Record animal #, species, age & sex on Record Sheet A (attached)
Assess clinical signs according to scale provided and record depression score for each animal upon admission on Record Sheet B
Assess dehydration according to Sheet C and record % dehydration on Record
Sheet A
Assess diarrhea type according to Sheet D and record diarrhea type on Record
Sheet A
Address both questions on the bottom of Record Sheet A
Take initial samples from animal (see instructions below) o Blood for PH and drawing off serum (5-10ml)
o Feces (~20 g)-cream coloured containers
If possible, obtain sample from healthy neonatal animal of same species, record
animal #, species, age, & sex
o indicate on record sheet/labels if sample healthy (control) or diarrheic
All samples should be well labelled with date, animal #, contents, name of (labels provided)
All samples to be analyzed at Hawassa University (serum & feces) should be stored in freezer (-20°C)
Sample Collection
Blood
A blood sample will be collected from the jugular vein of the neonatal animal in a collection tube and pH will be determined

113
Serum organic acid concentration will be collected into a non-heparinized (containing no anticoagulant) collection tube.
o The blood will be allowed to coagulate at room temperature for 20 min,
centrifuged, and serum drawn off
o Transfer serum to clean vial, label with date and case number
o Serum samples will be stored in a freezer (-20°C) until analysis.
Feces
Fecal samples (20g) will be collected into a cream colored plastic container (provided)
containing Thiomerosal
o Collected feces should be dissolved in 20 ml of 1% sodium ethylmercuric
thiosalicylate (thiomerosal; ICN Biomedicals Inc., Aurora, Ohio, USA) solution
(a bacteriostatic agent) to minimize bacterial growth.
Thiomersal is a toxic substance, containing a small amount of mercury. Therefore you should not spill or contact thiomersal with exposed skin. Always use gloves (provided)
when sampling or handling.
Fecal samples to be stored in freezer (-20°C)
Samples to be analyzed via assay kits as previously described at Hawassa University.
Thank you! Any further question regarding protocol for study please contact
Biniam Amare

114
Appendix D
Consent Forms
D-Lactic Acidosis in Pediatric Diarrhea .................................................................. 115
Investigation of a Potential Fecal D-Lactate Threshold in Neonatal Calves
with Diarrhea .......................................................................................................... 117
115
SUBJECT INFORMATION AND CONSENT FORM
STUDY TITLE: D-Lactic Acidosis in Pediatric Diarrhea
PRINCIPAL INVESTIGATOR: Dr. Garth Bruce
SUB-INVESTIGATORS and/or STUDENT RESEARCHERS: Dr. G.A. Zello, Dr. J. Alcorn, Jennifer
Wright, M.Sc. (Candidate)
FUNDING AGENCY: Natural Sciences and Engineering Research Council of Canada (NSERC)
CONTACT NUMBER: Jennifer Wright, M.Sc. Candidate (306) 371-7115
________________________________________ _______________________________
INTRODUCTION
Your child is being asked to take part in this research because he/she has been admitted to the Royal
University Hospital for acute gastroenteritis and is experiencing diarrhea (2 or more profuse or watery
stools per day). Participation is voluntary and it is up to you if you wish your child enrolled in this study.
If you do decide that your child will take part in this study, you are still free to withdraw your child at any
time and without giving any reasons for your decision. If you do not wish your child to participate, your
child will not lose the benefit of any medical care to which your child is entitled or is presently receiving.
WHO IS CONDUCTING THE STUDY? This study is being conducted by the College of Pharmacy and Nutrition at the University of
Saskatchewan. Funding for this study is provided by the Natural Sciences and Engineering Research
Council of Canada (NSERC). The investigators or staff will not receive any direct financial benefit from
conducting this study, other than their regular salary.
WHY IS THIS STUDY BEING DONE?
The purpose of this study is to investigate the prevalence of D-lactic acidosis in children with diarrhea.
Diarrhea results in changes in blood pH. Blood pH is normally neutral but in some children with diarrhea
it becomes more acidic. Research originating from Dr. Zello’s research group at the University of
Saskatchewan showed that in animals the increase in blood acidity is due to a compound called D-lactic
acid produced by bacteria present in the gut. It is not known if it is the same in humans. The purpose of
the study is to evaluate if the type and severity of diarrhea in children is associated with the presence of
D-lactic acid.
WHAT DOES THE STUDY INVOLVE?
We are requesting your permission to use leftover blood samples that are normally discarded after routine
diagnostic tests have been done and to collect a sample of your child feces. Your child medical care will
not be delayed or affected in any way. If you agree, the researcher will ask you 6 questions to help rate
the severity of your child’s diarrhea and a small amount of expelled feces will be collected. Blood
samples that are ordered as part of routine care that are no longer needed for diagnostic purposes will be
saved. Blood and feces samples will be transported to the Irwin Nutrition Research Laboratory at the
University of Saskatchewan and analyzed for D- and L-lactic acid content. Your child’s medical chart
will also be reviewed for medical history, current medications and the results of the routine blood tests to
116
compare with the lactic acid levels measured as part of this study. Blood samples will be destroyed at the
end of the study.
WHAT ARE THE RISKS AND BENEFITS OF PARTICIPATING IN THIS STUDY?
There are no risks to your child from participation in this study. There will not be any direct benefits to
your child. It is hoped the information gained from this study can be used in the future to benefit other
children with a similar condition.
WHAT HAPPENS IF I DECIDE TO WITHDRAW? Your child’s participation in this research is voluntary. If you choose to enter your child in the study and
then decide to withdraw later, you may ask that the samples be destroyed by contacting the study doctor.
All data collected about you during your enrolment will be retained for analysis.
WHAT WILL THE STUDY COST ME?
You will not be charged for any research-related procedures. You will not be paid for participating in this
study. You will not receive any compensation, or financial benefits for being in this study, or as a result of
data obtained from research conducted under this study.
WILL MY TAKING PART IN THIS STUDY BE KEPT CONFIDENTIAL? In Saskatchewan, the Health Information Protection Act (HIPA) protects the privacy of your personal
health information. Your child’s confidentiality will be respected. No information that discloses your
child’s identity will be released or published without your specific consent to the disclosure. However,
research records and medical records identifying your child may be inspected in the presence of the
Investigator and the University of Saskatchewan Research Ethics Board for the purpose of monitoring the
research. However, no records, which identify your child by name or initials, will be attached to any
information. The results of this study may be presented in a scientific meeting or published, but your
child’s identity will not be disclosed.
WHO DO I CONTACT IF I HAVE QUESTIONS ABOUT THE STUDY? If you have any questions or desire further information about this study before or during participation,
you can contact anyone of the researchers: Jennifer Wright (306) 371-7115, Dr. G Zello (306) 966-5825,
Dr. J. Alcorn (306) 966-6365, Dr. G. Bruce (306) 966-8117.
If you have any concerns about your child’s rights as a research subject and/or your child’s
experiences while participating in this study, contact the Chair of the Biomedical Research
Ethics Board (Bio-REB) of the University of Saskatchewan, at 306-966-4053. The Research
Ethics Board is a group of individuals (scientists, physicians, ethicists, lawyers and members of
the community) that provide an independent review of human research studies. This study has
been reviewed and approved on ethical grounds by the Biomedical Research Ethics Board (Bio-
REB) of the University of Saskatchewan.
CONSENT TO PARTICIPATE I agree to have my child participate in this study. I give permission to the use and disclosure of my child’s
de-identified personal health information collected for the research purposes described in this form. I
understand that by signing this document I do not waive any of my child’s legal rights. I will be given a
signed copy of this consent form.
Printed name of parent/legal guardian: Signature Date
Printed name of person obtaining consent: Signature Date

117
WESTERN COLLEGE OF VETERINARY MEDICINE
UNIVERSITY OF SASKATCHEWAN
REQUEST FOR OWNER CONSENT TO PARTICIPATION IN RESEARCH
Title of Proposal: Mechanisms of acidosis and acidosis treatment in calves
Principle Investigators and Co Investigators:
Katharina L. Lohmann, Med Vet, PhD, DACVIM
Associate Professor, Department of Large Animal Clinical Science, WCVM
Phone: (306) 966 7178
Gordon A. Zello, B.Sc., M.Sc., Ph.D.
Professor of Nutrition and Dietetics, College of Pharmacy and Nutrition, University of
Saskatchewan
Funding Source: National Sciences and Engineering Research Council (NSERC)
PLEASE READ CAREFULLY BEFORE SIGNING
You have been asked to enter in a research study
investigating the mechanisms of acidosis and acidosis treatment in calves. This study is part of a
larger research program funded by the National Sciences and Engineering Research Council
(NSERC). The research findings are to be distributed in scientific journals and are not intended
to be used commercially.
Purpose and Objectives of the Study
Acidosis (increased acidity of the blood) is a common complication of diarrheic disease
(“scours”) affecting calves, and has a significant economic impact on the cattle industry.
Acidosis contributes to disease severity, treatment cost and poor outcome of calf scours.
Previous research has identified D-lactate produced by intestinal bacteria as an important
contributor to calf acidosis. However, the mechanisms leading to accumulation of D-lactate, as
well as its metabolism and excretion remain incompletely understood. This study investigates the
relative contribution of D-lactate to naturally occurring acidosis in calves, and aims to detect the
intestinal “threshold” at which systemic D-lactic acidosis occurs. The ultimate goal of our
research program is to design better preventative and treatment strategies in order to reduce the
death rate associated with acidosis in calves.
Voluntary Participation
Participation is entirely voluntary, so it is up to you to decide whether or not to enter your calf in
this study. Before you decide, it is important for you to understand what the research involves.
This consent form will explain why the research is being done, and what will happen to your calf
during the study.
You are indicating your consent to participation by signing this form. If you do decide to enter
your calf in this study, you are still free to withdraw at any time and without giving any reasons
for your decision, however, all data collected about your animal during its enrolment in the study

118
will be retained for analysis. If you do not wish to participate, you do not have to provide any
reason for your decision, nor will you lose the benefit of any veterinary care your calf is
receiving.
Confidentiality
While absolute confidentiality cannot be guaranteed, every effort will be made to ensure that the
information collected for this study is kept entirely confidential. Your name or any identifying
characteristics of your calf will not be attached to any information, nor mentioned in any study
report, nor be made available to anyone except the research team. Your identity or that of your
calf will not be revealed in any publications arising from this study.
Description of the Research
Basic information including age, breed and gender, presenting complaint and history, diagnosis,
outcome (survival or non-survival) and (if applicable) reasons for non-survival is recorded
anonymously from the calf’s medical record. Blood is collected and is used for standard blood
gas analysis and measurement of serum D-lactate concentration. As most of this information is
usually obtained as part of the diagnostic work-up, blood volume taken for this study in addition
to blood taken for other diagnostic procedures will not exceed 10 mls. A fecal sample will be
obtained as soon as possible after admission, and processed for measurement of D-lactate
concentration.
Risks and Discomforts
Risks and discomforts are limited to blood collection and fecal sample collection as all other
tests are performed on the samples and not the animals themselves. Blood sampling and fecal
sampling is a standard diagnostic procedure in veterinary medicine and is considered to inflict
minimal discomfort. There is, however, the potential for unforeseeable risks related to sample
collection.
Financial implications
There will be no cost to you for entering your calf in this study. You will not be charged for any
of the procedures performed solely for research purposes. All costs for the diagnosis,
management and treatment of your calf are your responsibility. There will be no reimbursement
for entering your animal in this study.
Further Questions, Findings
If you have any questions about this study or desire further information about the study before or
after entering your animal, you can contact Dr. Katharina Lohmann at (306) 966 7178.
Signatures
□ I have read or have had this read to me and understood the consent form.
□ I understand that all of the information collected will be kept confidential and that the results
will only be used for scientific purposes.
□ I understand that I am entering my animal in this study voluntarily.
□ I freely consent to entering my animal in this study.
□ I have been told that I will receive a dated and signed copy of this form.
□ I am at least 18 years of age and am the legal owner of the animal or am authorized to make
decisions regarding this animal on the owner’s behalf.
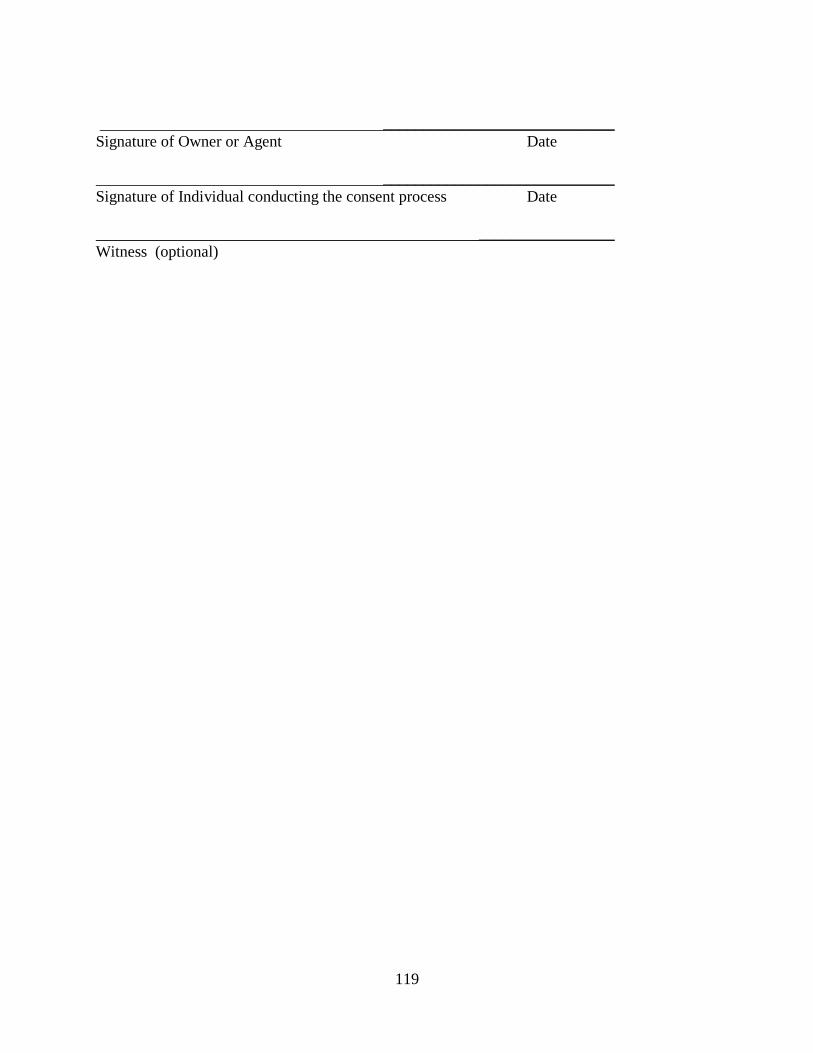
119
_____________________________
Signature of Owner or Agent Date
_____________________________
Signature of Individual conducting the consent process Date
_________________
Witness (optional)

120
Appendix E
Assessment of Diarrhea Severity
D-Lactic acidosis in pediatric diarrhea (Bristol Scale) ........................................... 121
Revised D-lactic acidosis in pediatric diarrhea (iPAG) .......................................... 122
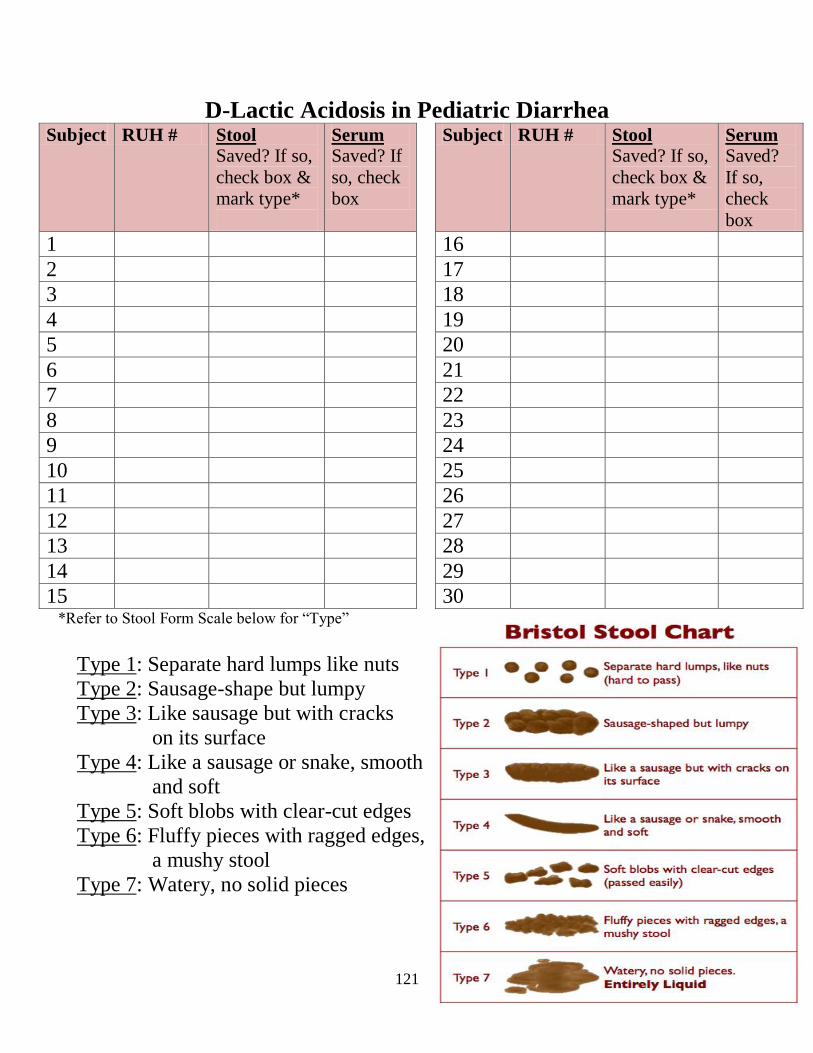
121
D-Lactic Acidosis in Pediatric Diarrhea Subject RUH # Stool
Saved? If so,
check box &
mark type*
Serum Saved? If
so, check
box
Subject RUH # Stool Saved? If so,
check box &
mark type*
Serum Saved?
If so,
check
box
1 16
2 17
3 18
4 19
5 20
6 21
7 22
8 23
9 24
10 25
11 26
12 27
13 28
14 29
15 30 *Refer to Stool Form Scale below for “Type”
Type 1: Separate hard lumps like nuts
Type 2: Sausage-shape but lumpy
Type 3: Like sausage but with cracks
on its surface
Type 4: Like a sausage or snake, smooth
and soft
Type 5: Soft blobs with clear-cut edges
Type 6: Fluffy pieces with ragged edges,
a mushy stool
Type 7: Watery, no solid pieces

122
D-Lactic Acidosis in Pediatric Diarrhea
Subject #: ________
1) Stool Consistency Classification System
Hard and Formed Soft but Formed Loose & Unformed Liquid
Having a hard or firm texture and
retaining a definite shape like a
banana, cigar or marbles
Retains its general shape;
has a texture that appears like
butter
Lacking any shape of its own; having a
texture that appears like hot cereal
Like water
2) Diarrheal Frequency
Diarrhea Stools in Preceding 24 hours?
Please insert exact #____, and check corresponding box
Stool Consistency 0 stools 1 – 4 stools 5 – 8 stools ≥9 stools
Loose & Unformed
Or Liquid Stool(s)
□ □ □ □
3) Duration of Diarrhea
Number of Days with Diarrhea (in previous 13 days)?
Please insert exact #____, and check corresponding box
Stool Consistency 0 days 1 – 2 days 3 - 4 days ≥5 days
Loose & Unformed
Or Liquid Stool(s)
□ □ □ □
4) Vomiting Frequency
Episodes of Vomiting in Preceding 24 hours?
Please insert exact #____, and check corresponding box
Vomiting 0 episodes 1 episode 2 episodes ≥3 episodes
Yes □ □ □ □
5) Duration of Vomiting
Number of Days with Vomiting (in the previous 13 days)?
Please insert exact #____, and check corresponding box
Vomiting 0 days 1 – 2 days 3 - 4 days ≥5 days
Yes □ □ □ □
6) Fever
Temperature? Please insert exact #____, and check corresponding box
Axillary ≤37.3°C
(≤99.1°F)
37.4 to 38.1°C
(99.3 to 100.6°F)
38.2 to 38.9°C
(100.7 to 102°F)
≥39.0°C
(≥102.2°F)
Yes □ □ □ □

123
Appendix F:
Clinical Assessment Scoring and Calf Record Tools
Investigation of a potential fecal D-lactate threshold in neonatal calves with
diarrhea .................................................................................................................... 124
D-Lactic acidosis in animal neonatal diarrhea (Awassa, Ethiopia) ......................... 126
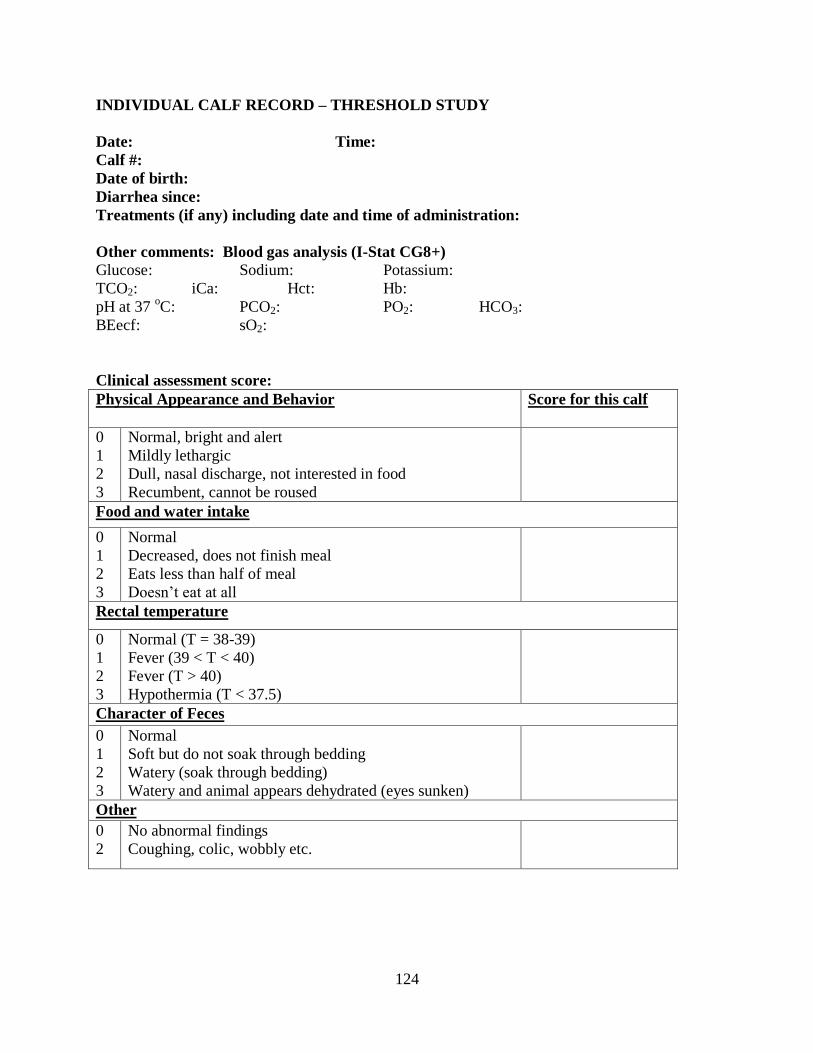
124
INDIVIDUAL CALF RECORD – THRESHOLD STUDY
Date: Time:
Calf #:
Date of birth:
Diarrhea since:
Treatments (if any) including date and time of administration:
Other comments: Blood gas analysis (I-Stat CG8+)
Glucose: Sodium: Potassium:
TCO2: iCa: Hct: Hb:
pH at 37 oC: PCO2: PO2: HCO3:
BEecf: sO2:
Clinical assessment score:
Physical Appearance and Behavior Score for this calf
0
1
2
3
Normal, bright and alert
Mildly lethargic
Dull, nasal discharge, not interested in food
Recumbent, cannot be roused
Food and water intake
0
1
2
3
Normal
Decreased, does not finish meal
Eats less than half of meal
Doesn’t eat at all
Rectal temperature
0
1
2
3
Normal (T = 38-39)
Fever (39 < T < 40)
Fever (T > 40)
Hypothermia (T < 37.5)
Character of Feces
0
1
2
3
Normal
Soft but do not soak through bedding
Watery (soak through bedding)
Watery and animal appears dehydrated (eyes sunken)
Other
0
2
No abnormal findings
Coughing, colic, wobbly etc.

125
DESCRIPTION OF THE DAILY CLINICAL SCORING METHOD
Body weight:___ Kg
Depression score (maximum score of 9)
Suck reflex: 0 = strong and coordinated
1 = weak but chewing
2 = absent
Attitude: 0 = Normal behaviour, alert, gets up when approached, interested in
surroundings.
1 = Depressed, reluctant to stand, must be stimulated to get up
2 = Unable to stand, even with help. Calf in sternal recumbency
3 = Calf in lateral recumbency (sometimes comatose/collapsed)
Hydration Status Score (maximum score of 2)
0 = Normal hydration, skin tent < 2
1 = Moderate dehydration, eyeball slightly sunken (enophtalmia), and skin tent > 2 s but < 4 s.
2 = Obvious dehydration, eyes sunken with an easily perceptible distance between the eyeball
and the eyelid, dry nose, skin tent persists > 5 seconds
Warmth of oral cavity and external limb temperature of the hock and fetlock.
0 = normal (warm)
1 = cool oral cavity and extremity temperature
2 = very cold oral cavity and extremity temperature
Eye skin turgor Number, size, color and proximity from the limbus of the vessels from
the sclera (maximum score of 3)
0 = Normal (<2), they do not reach the limbus
1= Greater in number (<4), at least 1 reaches the limbus, color is still pink, size is normal
2 = Greater in number (>4), at least 2 reach the limbus, color is red, size is mildly increased.
3 = Greater in number (>6), at least 3 reach the limbus, color is purple, size is greatly increased.
Umbilicus Pain, size, dryness, presence of pus (maximum score of 3)
0 = Normal, pencil size, dry, and painless
1 = Bigger than normal, but dry and painless
2 = Bigger than normal, wet or painful
3 = Bigger than normal, with pus draining and evidence of pain (any presence of internal
umbilical swelling ranks as a 3 and should be described as involving arteries/urachus or vein)
Fecal Score Consistency (maximum score of 3)
0 = normal (firm, pasty)
1 = Feces softer than normal, semi-solid, but no diarrhea on the tail
2 = liquid diarrhea, but not profuse; wet tail
3 = Profuse watery diarrhea, wet tail, soiled pen, or any indication of blood in feces (but not
normal feces with a small amount of blood).

126
RECORD SHEETS for___________________________(Diarrhea and Acidosis Trial)
Record Sheet A: Information upon admission
1. Diet prior to diarrheic episode:
2. Standard of care for __________:
ID
Number
Date Diarrheic
or
Control?
Date
of
Birth
Sex Total
Depression
Score
(Sheet B)
%
Dehydration
(Sheet C)
Diarrhea
Type
(Sheet D)
Comments

127
Record Sheet B: Clinical signs upon admission
_________ (insert animal species) Diarrhea and Acidosis Trial
ID Number Date Suck* Menace* Palpebral* Tactile* Ability
to Stand*
Total
Comments
* Please refer to Record Sheet B Scoring System

128
Record Sheet B Scoring System
Variable Method of Assessment Score Interpretation
Suck Index finger in mouth 0 Normal (strong suck, can feel tongue
exerting pressure)
1 Weak suck (can feel little pressure
inside mouth, calf not eager to suck)
2 No suck
Menace Animal’s reaction (blinking)
when a researchers hand moves
quickly and stops abruptly in
front of calf’s
0 Normal (blinks strongly and quickly)
1 Weak (blinking is clearly delayed and
calf may not respond to all hand
movements)
2 No menace (animal won’t blink in
response to hand movement)
Palpebral Animal’s reaction (blinking)
when researchers touches the
calf’s third eyelid Scoring
similar to menace
0 Normal (blinks strongly and quickly)
1 Weak (blinking delayed and calf may
not respond to all hand movements)
2 No menace (animal won’t blink in
response to hand movement)
Tactile Pen used to poke the calf on the
back
0 Normal (animal twitches strongly and
quickly after each poke)
1 Weak (won’t respond to all pokes &
twitches are weak)
2 No tactile response (No detectable
response to poke)
Stand Animal’s ability to stand 0 Normal (animal can easily stand on its
own)
1 Depressed ability to stand (animal has
to be lifted slightly in order to stand)
2 Recumbent (Animal cannot stand)
Abeysekara, S. (2009). D-Lactic Acid Metabolism and Control of Acidosis. (PhD thesis,
University of Saskatchewan, Saskatoon, Canada). Retrieved from
http://library2.usask.ca/theses/available/etd-01202009-120329/restricted/Abeysekara-
Saman_PhD_D-lacticAcidosis_ETD.pdf
Kasari, T. & Naylor, J. (1986). Further Studies on the Clinical Features and Clinicopathological
Findings of a Syndrome of Metabolic Acidosis with Minimal Dehydration in Neonatal
Calves. Can J Vet Res, 50, 502.
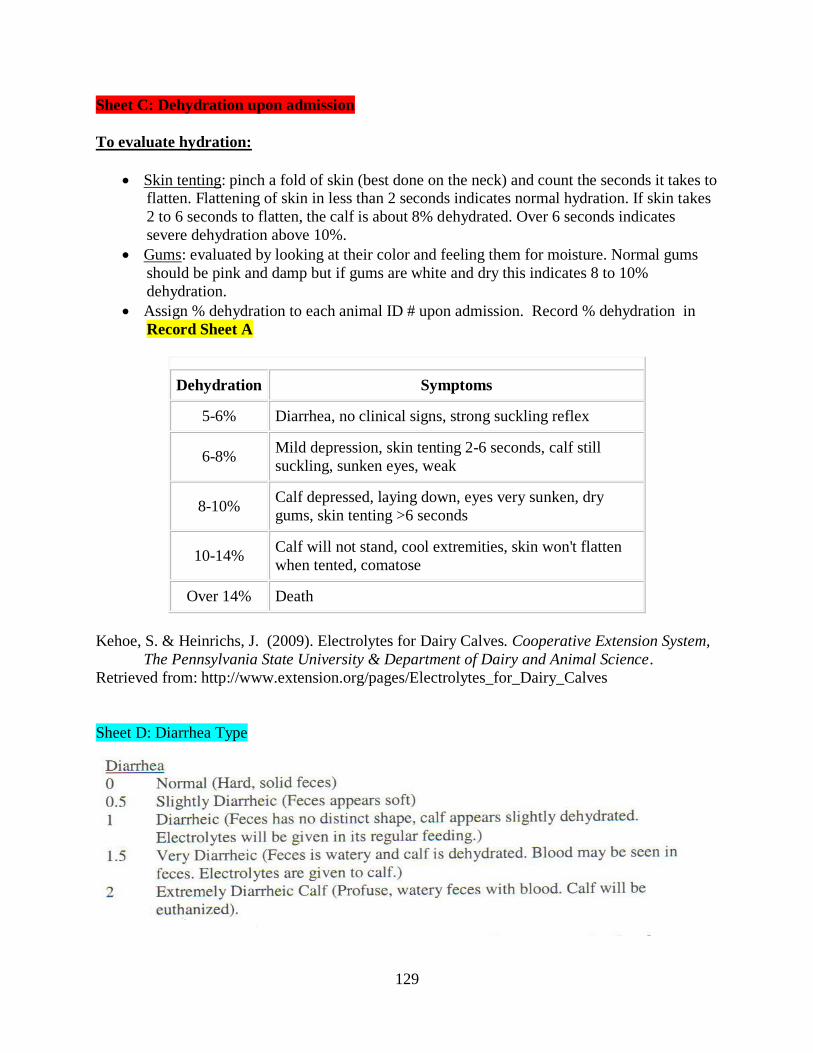
129
Sheet C: Dehydration upon admission
To evaluate hydration:
Skin tenting: pinch a fold of skin (best done on the neck) and count the seconds it takes to flatten. Flattening of skin in less than 2 seconds indicates normal hydration. If skin takes
2 to 6 seconds to flatten, the calf is about 8% dehydrated. Over 6 seconds indicates
severe dehydration above 10%.
Gums: evaluated by looking at their color and feeling them for moisture. Normal gums
should be pink and damp but if gums are white and dry this indicates 8 to 10%
dehydration.
Assign % dehydration to each animal ID # upon admission. Record % dehydration in
Record Sheet A
Dehydration Symptoms
5-6% Diarrhea, no clinical signs, strong suckling reflex
6-8% Mild depression, skin tenting 2-6 seconds, calf still
suckling, sunken eyes, weak
8-10% Calf depressed, laying down, eyes very sunken, dry
gums, skin tenting >6 seconds
10-14% Calf will not stand, cool extremities, skin won't flatten
when tented, comatose
Over 14% Death
Kehoe, S. & Heinrichs, J. (2009). Electrolytes for Dairy Calves. Cooperative Extension System,
The Pennsylvania State University & Department of Dairy and Animal Science.
Retrieved from: http://www.extension.org/pages/Electrolytes_for_Dairy_Calves
Sheet D: Diarrhea Type


![Biosensors based on electrochemical lactate detection … · clearance by liver and kidney, the accumulated concentration of lactic acid results in lactic acidosis [8]. ... monitored](https://img.dokumen.tips/doc/110x75/5b6d03227f8b9aed178ca8cd/biosensors-based-on-electrochemical-lactate-detection-clearance-by-liver-and.jpg)