Embed Size (px)
Citation preview

D. Allen DavisSchool of Fisheries, Aquaculture and Aqautic Sciences, Auburn University.

When asked to talk…
Thought about possible titles
• Can’t we learn from Asia shrimp farmers?
• After 17 years of production, why haven’t I figure feed management out?
• Are shrimp smarter than me?
• Return of the candy man: Candy on demand!
THE USE OF AUTOMATED FEEDING SYSTEMS FOR THE PRODUCTION OF PACIFIC WHITE
SHRIMP Litopenaeus vannamei: A RESEARCH PERSPECTIVE.
Davis, D. A.*
C. Ullman, M. Rhodes, R. Novriadi, and A. Swanepoel

Feed storageQuality control
• Quantity received
• Inspections for damaged bags
Inventory procedures
• First in first out
• Minimal inventory, based on constraints of the operation.

Basics of feeding
1. Diet must be properly stored to keep it “fresh”.
2. Nutrition and feeding practices go hand in hand.
a) Diet is worthless unless properly applied.
b) Application is worthless unless the diet is nutritious.
c) If it is not consumed it is expensive fertilizer.

Feeding programsAll feeding programs must account for
–Site specific conditions
–Historical results (typical growth rates, seasonal variations)
–Anticipated problems (stresses, disease, temperature, etc.)
–Learn from mistakes

A number of tools are available for feed management of shrimp.
• Observation - Feeding trays (partial or all)
• Programed - Feeding tables– Published
– In house
• Taro cards/crystal ball/psychic hot line– www.facade.com/tarot/
• Most people use a combinations of various methods.

Understanding Feed Management

Feeding on demand –Linkage of feed inputs with a responses with a reward.

=
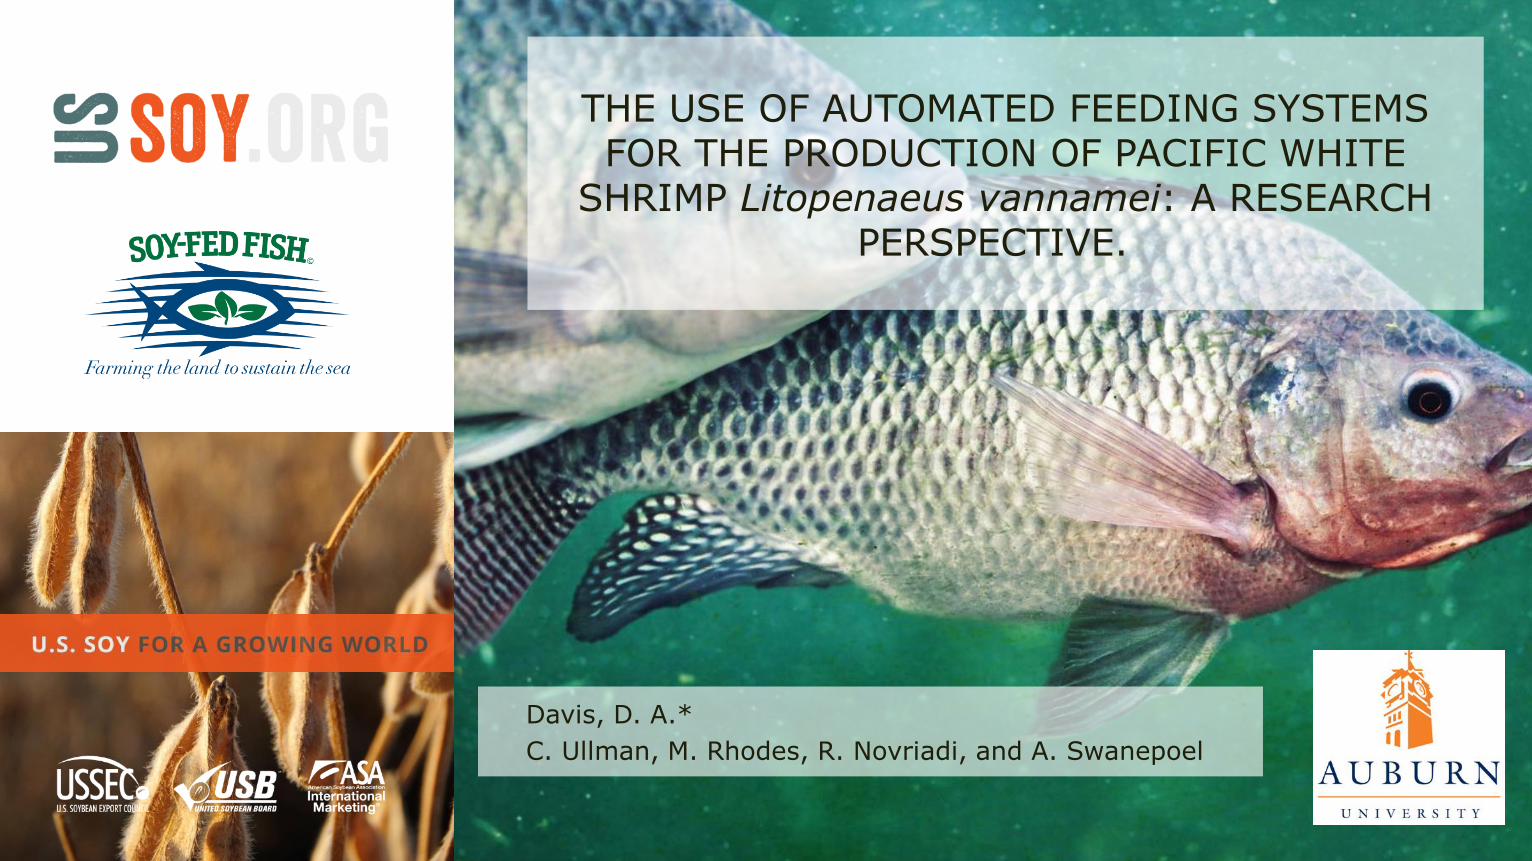
Is there a new paradigm in feed management of shrimp based on feedback?
How would it work?

17 years and still learning!

Feed inputs based on two feedings per day for shrimp at around 35/m2.
0
20
40
60
80
100
120
140
160
0 2 4 6 8 10 12 14 16
Kg
/ha
/da
y
Week
Historic 40% protein 30% protein Feed curve 2006 Fixed 2017

At two feedings per day
Our best management strategy is to restrict the feed
1. Promotes the use of natural foods.
2. Ensures shrimp are hungry so they clean
up all the food.
3. Promotes improved FCR without
sacrificing growth.
4. Improves pond bottom quality.

At two feeding per day. Why has growth not increased when feed is increase?
0
20
40
60
80
100
120
140
160
0 5 10 15

Example of outdoor tanks and feed inputs.
0%
20%
40%
60%
80%
100%
120%
1 2 3 4 5 6

260270280290300310320330340350360
Biomass
0,70
0,72
0,74
0,76
0,78
0,80
0,82
0,84
0,86
0,88
FCR
1,10
1,15
1,20
1,25
1,30
1,35
1,40
1,45
kg shrimp/kg feed
9
10
10
11
11
12
12
13
Final wt

Shrimp Feeding Video


What effects feed intake and growth?

Response of 0.3 g shrimp in a green water system to feed that was pre leached for varying periods.
0
500
1000
1500
2000
2500
3000
0 60 120 180 240 300 360 420
Pe
rcen
t ga
in
Time feed was leached
After about 1 hr in the water
the nutritional value decreases
1: LEACHING

Response of shrimp (5g) to a commercial feed using multiple feedings to allow a range of times.
0
0,05
0,1
0,15
0,2
0,25
0,3
0,35
0,4
0 100 200 300 400
Time in minutes
Gra
ms o
f fe
ed
pe
r sh
rim
p
2: FEED INTAKE

Remember the automatic feeder is a tool
1) Allow more feedings (same quantity less time in water)
2) Spreads out nutrient loading
3) Reduces labor for multiple feeding

Feeders come in all shapes sizes & configurations.

Objectives 2016 production
▪ Evaluate different feeding
techniques
▪ hand feeding
▪ timer feedings
▪ automatic feeding with acoustic
feedback
▪ Compare
▪ growth performance
▪ production
▪ water quality
▪ economic returns

Materials & Methods
▪ Pond preparation:
▪ Bottom tilled
▪ Filled brackish water
▪ Fertilized (sechii disk
reading 25-40cm)
Pond characteristics:
➢ 16, 0.1 ha-ponds
➢ 1 m average depth
➢ HDPE lined pond
➢ 25-cm of soil

Materials & Methods
Stocking
• PL nursed for 17 days
• 76.3 ± 18.0 mg juveniles stocked to 16 ponds
• Stocking density: 17 shrimp/m2
Feeding
• Equally fed during first 4 wks
• Feed 40% CP/9% Lipid (1.5mm)
• High soy production diet
• 36%CP/8%CL (2.4mm) from week 4-16

Ingredient %
Soybean meal 50.00
Poultry by-product meal 8.00
Corn Gluten meal 8.00
Wheat 23.10
Dicalcium phosphate 3.13
Fish Oil Top dress 3.00
Fish Oil Mixer 2.00
Bentonite 1.50
Lecithin 1.00
Vitamin premix 0.12
Mineral premix 0.12
Tiger C 0.02
Copper sulfate 0.01
Protein 37.22
Lipid 7.01
Fiber 2.56
Moisture 10.18
Ash 8.55
Phosphorus 1.20
High Soy feed formulation
Proximate analysis by University of Missouri Agricultural Experiment Station Chemical Laboratories (Columbia, MO, USA).

Feeding Techniques
Trt 1=Standard feeding protocol (SFP):
FCR 1.2, growth rate 1.3 g/wk and mortality 25%/16 wk
Ration divided into 2 hand feedings/day
Trt 2= SFP plus 15% more from weeks 8-16
Trt 3= SFP divided into 6 feedings/day using solar timer feeders
Trt 4=AQ1 automatic feeders with acoustic feedback
Max 12kg/day feeding only between 7am-7pm

AQ1 Sound Feeding System (SF200)

On Site Water Quality
• Aeration at night at 10 hp/ha• Temperature, DO, pH, and salinity
– Three times daily
• TAN and Secchi were monitored weekly
Parameter SFP SFP + 15% Timer Acoustic
Salinity (ppt) 11.93 11.71 12.03 11.83
Morning Dissolved Oxygen (mg/L) 4.50 4.59 4.60 4.39
Afternoon Dissolved Oxygen
(mg/L)
9.86 9.07 9.25 9.14
Night Dissolved Oxygen (mg/L) 8.81 8.38 8.02 8.00
Average pH 8.02-9.00 8.04-8.90 7.95-8.84 7.98-8.79
Average Temperature (°C) 29.9-32.1 30.0-32.1 29.9-32.1 30.1-32.3

Water Quality Samples shipped to Auburn at week 0, 4, 8-16 for Analysis
• Chlorophyll a by membrane filtration, acetone-methanol
extraction of phytoplankton, and spectroscopy
• Total Ammonia Nitrogen by the Salicylate method
• Nitrite-nitrogen by the Diazotization method
• Nitrate-nitrogen by the Szechrome NAS reagent method
• Total Nitrogen by Ultraviolet Spectrophotometric
Screening method
• Total Phosphorus by Ascorbic Acid method
• Soluble Reactive Phosphorus by Ascorbic Acid method
• Total Suspended Solids and Total Suspended Volatile
Solids
• Turbidity by Nephelometry
• Conductivity and Salinity
• Biological Oxygen Demand


Growth response of shrimp stocked at 18 shrimp/m2 and offered various feeding strategies.
0
5
10
15
20
25
30
35
40
45
0 10 20 30 40 50 60 70 80 90 100 110 120
Weig
ht (g
)
Days of culture
Standard Feeding
Increase Feed 15% at Week 8
Solar Feeding-standar feed ration (Equal feedings at 8am, 10am, 12pm, 2pm, 4pm, and 6pm)
AQ1 - self adjusting to demand with 10 kg maximum load
AQ1
6 feeding
2 feedings

Growth and Production after 16 weeks of culture at 17 shrimp/m2.
TreatmentYield
(kg/ha)
Final
Wt. (g)
%
SurvivalFCR
Weight
Gain
(g/wk)
Biomass
(kg)
Body Wt.
Fed (%)
Final
#/pond
SFP1 3,068.5a 23.55a 75.8 0.94 1.47a 303.27a 5.95 13,031
SFP+15% 3,032.5a 24.65a 72.2 1.04 1.54a 301.81a 6.51 12,341
Timer* 3,294.3a 28.66b 66.9 0.98 1.79b 325.91a 6.15 11,502
Acoustic 4,568.8b 35.91c 73.9 1.14 2.24c 452.48b 7.19 12,679
P-Value 0.0016 <.0001 0.3112 0.0598 <.0001 0.0016 0.0557 0.3067
PSE2 226.60 1.1703 2.9779 0.0468 0.0731 22.389 0.2887 514.25
*One pond excluded due to low DO and high mortality

0
1000
2000
3000
4000
5000
6000
0
5
10
15
20
25
30
35
40
SFP SFP + 15% Timer AQ1
Feed
Inp
ut (k
g/h
a)
Fin
al W
t. (
g)
Treatment
Final Wt and Feed Input
Final Wt. (g) Feed (Kg/ha)
c
b
b
aa
a a
a

0
10
20
30
40
50
60
70
80
90
100
41-50($1.40/lb)
36-40($1.50/lb)
31-35($1.55/lb)
26-30($1.60/lb)
21-25($1.65/lb)
16-20($1.80/lb)
11-15($2.00/lb)
6-10($2.00/lb)
% D
istr
ibu
tion
Count Per Pound(Value)
Distribution of Shrimp by Size Class
SFP SFP + 15% Timer AQ1

Quick and Dirty Economics (4 Ponds)SFP SFP + 15% Timer AQ1
Shrimp Sales ($/ha) $ 11,810 $ 11,776 $ 13,446 $ 21,198
Feed ($/ha) $ (2,840) $ (3,102) $ (3,158) $ (5,289)
Equipment* ($/ha) $ - $ - $ (589) $ (5,630)
Income Less Cost ($/ha) $ 8,969 $ 8,674 $ 9,698 $ 10,278
Income over SFP ($/ha) $ (295) $ 728 $ 1,309
Income over SFP ($/ha)
(costs amortized over 5 years)$ (295) $ 1,199 $ 5,813
*Equipment cost only includes equipment not needed for SFP

Objectives 2017 production
▪ Evaluate different feeding
techniques
▪ Standard hand feeding
▪ Timer feedings (115 and 130%)
▪ Automatic feeding with acoustic
feedback
▪ Standard Protocol (38 shrimp/m2)

Stocking 38 shrimp/m2

Standard Hand Feeding
2 x day (SFR)
Automatic Feedback
Ad libitumAutomatic 6 x day
115 and 130% SFR

Feed inputs for shrimp stocked at 38 shrimp/m2
0
20
40
60
80
100
120
140
160
180
0 7 14 21 28 35 42 49 56 63 70 77 84 91 98 105 112 119
Kg/h
a
Days of culture
Sandard Feeding Feeder 115% Feeder 130% AQ1 AQ2 AQ3
Harvest?

Growth rate of shrimp stocked at 38 shrimp/m2
0
5
10
15
20
25
30
0 10 20 30 40 50 60 70 80 90 100 110 120
Weig
ht
(g)
Days of culture
Sandard Feeding Feeder 115 Feeder 130 AQ1
Planed
harvest

We called a met to discuss production!
• Feed inputs 150 kg/day
– Aeration capacity is maximum
• Growth rates
– > 20 g shrimp
– > 3 - 4 g/wk growth
• Statistical resolution of all treatments.

They contemplated harvest dates.

Scientifically chose a new date.
Considered
• How soon can we organize.
• What is the football schedule.
• Holiday conflicts.

Feed inputs for shrimp stocked at 38 shrimp/m2
0
20
40
60
80
100
120
140
160
180
0 7 14 21 28 35 42 49 56 63 70 77 84 91 98 105 112 119
Kg/h
a
Days of culture
Sandard Feeding Feeder 115% Feeder 130% AQ1 AQ2 AQ3
Harvest at 90 day

Growth rate of shrimp stocked at 38 shrimp/m2
0
5
10
15
20
25
30
35
40
0 10 20 30 40 50 60 70 80 90 100 110 120
Weig
ht
(g)
Days of culture
Sandard Feeding Feeder 115 Feeder 130 AQ1

TrtFeed
(kg/ha)
Yield
(kg/ha)
Individual
weight (g)
Survival
(%)FCR
$ of Feed/kg
shrimp
produced (usd)
Value
($/ha)
SFP 5250a 4843a 19.74a 63.9 1.13 1.06 32,982a
Timer 15 6212b 5629a 25.15b 58.5 1.12 1.09 44,279ab
Timer 30 6797c 6416ab 27.52c 61.2 1.07 1.04 52,687bc
AQ1* 9002d 7430b 32.04d 60.9 1.24 1.2 65,587c
P- Value <.0001 0.008 <.0001 0.7486 0.4099 0.3663 0.0007
PSE3 11.12 399.4 0.6059 3.4735 0.0628 0.0591 358.4
Table 1. Production results (n=4) for Litopenaeus vannamei cultured in 0.1 ha ponds over a 13-week (90 day) culture period. * n=3
Quick Economics

What have we learned?

Positive take home message
1. Increase feed input and growth rates is possible but only with increased number of feeding.
– Increased # feedings clearly improves performance even at same level feed
inputs

Positive take home message
Typical production cycle to > 20 g shrimp 120 days
1. Automated feeding systems ~ 60 day to 20 g on best treatment
2. On demand feeding clearly improves feed inputs and growth. Essentially doubling both growth and feed inputs.
3. Results on FCR will depend on your starting point.
1. Conservative feeder – may go up a little
2. Over feeding – FCR will go down

Considerations1. Technical issue with feeders
▪ Perch for birds
▪ Batteries and/or motors can fail
▪ Rain or high moisture can clog feeder
2. Feed is dispersed by impact
▪ Breaks feed & creates fines.

My opinion
1.Production model must change.
1. Growth rates, nutrient loading and oxidation
requirements (aeration capacity).
2.Cost is easily covered by production improvements.

My opinion
3. How you figure this investment depends…
1. Duplication of DO monitoring or aeration controls?
2. Pond layout and electricity
3. Number of ponds
4. Automation has numerous advantages…the future is here embrace it.

Questions or comments