Embed Size (px)
Citation preview

Cytoskeleton-based forecasting of stemcell lineage fatesMatthew D. Treisera, Eric H. Yanga, Simon Gordonova, Daniel M. Cohend, Ioannis P. Androulakisa,c, Joachim Kohnb,Christopher S. Chend, and Prabhas V. Moghea,c,1
aDepartment of Biomedical Engineering, bNew Jersey Center for Biomaterials and Department of Chemistry and Chemical Biology,and cDepartment of Chemical and Biochemical Engineering, Rutgers University, Piscataway, NJ 08854, dDepartmentof Bioengineering, University of Pennsylvania, Philadelphia, Pennsylvania 19104,
Edited by Robert Langer, Massachusetts Institute of Technology, Cambridge, MA, and approved November 13, 2009 (received for review August 24, 2009)
Stem cells that adopt distinct lineages cannot be distinguishedbased on traditional cell shape. This study reports that higher-ordervariations in cell shape and cytoskeletal organization that occurwithin hours of stimulation forecast the lineage commitment fatesof human mesenchymal stem cells (hMSCs). The unique approachcaptures numerous early (24 h), quantitative features of actinfluororeporter shapes, intensities, textures, and spatial distribu-tions (collectively termed morphometric descriptors). The largenumber of descriptors are reduced into “combinations” throughwhich distinct subpopulations of cells featuring unique combina-tions are identified. We demonstrate that hMSCs cultured onfibronectin-treated glass substrates under environments permis-sive to bone lineage induction could be readily discerned withinthe first 24 h from those cultured in basal- or fat-inductive condi-tions by such cytoskeletal feature groupings. We extend the utilityof this approach to forecast osteogenic stem cell lineage fatesacross a series of synthetic polymeric materials of diverse physico-chemical properties. Within the first 24 h following stem cellseeding, we could successfully “profile” the substrate responsive-ness prospectively in terms of the degree of bone versus nonbonepredisposition. The morphometric methodology also providedinsights into how substrates may modulate the pace of osteogeniclineage specification. Cells on glass substrates deficient in fibronec-tin showed a similar divergence of lineage fates, but delayedbeyond 48 h. In summary, this high-content imaging and single cellmodeling approach offers a framework to elucidate and manipu-late determinants of stem cell behaviors, as well as to screen stemcell lineage modulating materials and environments.
biomaterials ∣ differentiation ∣ imaging and modeling ∣ stem cells ∣actin organization
Stem cells exhibiting pluripotency may be extracted from humanembryonic tissues (1), obtained from reprogrammed somatic cells(2) or isolated from niches within adult tissues including the bonemarrow. Human mesenchymal stem cells (hMSCs) isolatedfrom adult bone marrow can be steered to differentiate into amultitude of terminal cell types relevant to tissue engineering(3) by manipulating surface chemistry (4), material mechanics(5), and/or applied growth factor mixtures (3).
At present, the guided differentiation of stem cells remainsdifficult because the mechanisms that govern the passage fromuncommitted stem cells toward differentiated cells have yet tobe completely identified. Hindering this identification furtheris the reliance on traditional endpoint assays to assess lineage,which often require weeks to months of culture and providelimited early assessment of cell behavior. Methods such as genemicroarrays allow for the classification of stem cell maturationinto distinct stages (6), however such methods treat heteroge-neous groupings as single populations and are unable to followthe kinetics of mechanisms underlying lineage commitment.These issues slow the pace of screening and discovery of promis-ing material and soluble factor treatments for stem cell tissueregeneration.
During the process of lineage commitment, cells undergo anumber of morphological changes relating to differences in thespatial distribution and expression of key cytoskeletal proteins(7, 8). While differentiation is often accompanied by changesin cell shape, studies have demonstrated that cell shape in turnregulates cellular differentiation (9–12). Cytoskeletal compo-nents, particularly actin and its downstream effectors, are strongmediators of hMSC differentiation toward the osteoblastic line-age, with early cytoskeletal organization having a large effecton longer-term functions (13, 14). This study presents a “high-content” imaging methodology where quantitative features ofactin fluororeporter shapes, intensities, textures, and spatial dis-tributions (morphometric descriptors) are defined and utilized toassess cell behavior. Of central interest to the present study iswhether the spatial and structural organization of the cytoskele-ton in general, and actin in particular, encode the predilection ofcultured stem cells to differentiate toward particular cell fates. Ifso, high-content analyses of stem cell lineage commitment couldprovide predictive measures of long-term cell behaviors at earlytime points for the effective screening of biomaterials; real timemeasures of stem cell fates and identification of when lineagecommitment is determined; cell-by-cell based analysis that is ableto capture the heterogeneity of sample populations; and theability to parse out lineage commitment in stem cells influencedby multiple stimuli.
ResultshMSC Adopt Distinct Differentiation Outcomes That Are Not Apparentfrom Early Cell Shape/Morphology. Human bone-marrow-derivedMSCs demonstrate differentiation behaviors that are dependentupon both cell seeding density and growth factors. Traditionally,adipogenic differentiation of hMSCs is observed at high density(25,000 cells per cm2) in media supplemented with dexametha-sone, indomethacin, insulin and isobutylmethylxanthine; whileosteogenic differentiation of hMSC is induced at low density(1,000–3,000 cells per cm2) with supplementation of dexametha-sone, ascorbate and β-glyerophosphate (3). By culturing cellsat 3,000 cells per cm2 on fibronectin-treated glass, we observeddistinct differentiation fates after two weeks in adipogenic (AD)(Fig. 1A), basal (Fig. 1B), and osteogenic (OS) induction media(Fig. 1C). At 3,000 cells per cm2 on fibronectin-coated glassin AD media (Fig. 1A), which is well below the optimal seedingdensity for adipogenic differentiation, hMSCs displayed evi-dence of both osteoblastic and adipocytic differentiation at twoweeks as assessed by Fast Blue and Oil Red O staining (FBOR)
Author contributions: M.D.T., E.H.Y., and S.G. performed research; M.D.T., E.H.Y., S.G.,and D.M.C. analyzed data; M.D.T., E.H.Y., I.P.A., J.K., C.S.C., and P.V.M. wrote the paper;D.M.C., I.P.A., J.K., C.S.C., and P.V.M. designed research.
The authors declare no conflict of interest.
This article is a PNAS Direct Submission.1To whom correspondence should be addressed. E-mail: [email protected]
This article contains supporting information online at www.pnas.org/cgi/content/full/0909597107/DCSupplemental.
610–615 ∣ PNAS ∣ January 12, 2010 ∣ vol. 107 ∣ no. 2 www.pnas.org/cgi/doi/10.1073/pnas.0909597107
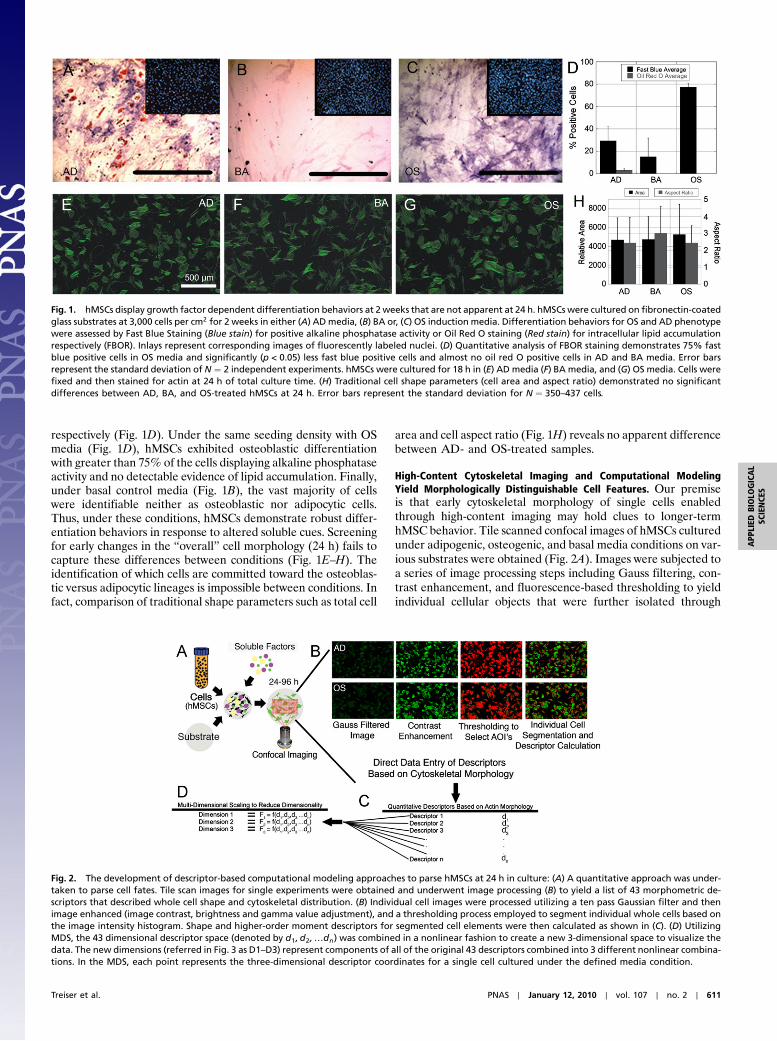
respectively (Fig. 1D). Under the same seeding density with OSmedia (Fig. 1D), hMSCs exhibited osteoblastic differentiationwith greater than 75% of the cells displaying alkaline phosphataseactivity and no detectable evidence of lipid accumulation. Finally,under basal control media (Fig. 1B), the vast majority of cellswere identifiable neither as osteoblastic nor adipocytic cells.Thus, under these conditions, hMSCs demonstrate robust differ-entiation behaviors in response to altered soluble cues. Screeningfor early changes in the “overall” cell morphology (24 h) fails tocapture these differences between conditions (Fig. 1E–H). Theidentification of which cells are committed toward the osteoblas-tic versus adipocytic lineages is impossible between conditions. Infact, comparison of traditional shape parameters such as total cell
area and cell aspect ratio (Fig. 1H) reveals no apparent differencebetween AD- and OS-treated samples.
High-Content Cytoskeletal Imaging and Computational ModelingYield Morphologically Distinguishable Cell Features. Our premiseis that early cytoskeletal morphology of single cells enabledthrough high-content imaging may hold clues to longer-termhMSC behavior. Tile scanned confocal images of hMSCs culturedunder adipogenic, osteogenic, and basal media conditions on var-ious substrates were obtained (Fig. 2A). Images were subjected toa series of image processing steps including Gauss filtering, con-trast enhancement, and fluorescence-based thresholding to yieldindividual cellular objects that were further isolated through
Fig. 1. hMSCs display growth factor dependent differentiation behaviors at 2 weeks that are not apparent at 24 h. hMSCs were cultured on fibronectin-coatedglass substrates at 3,000 cells per cm2 for 2 weeks in either (A) ADmedia, (B) BA or, (C) OS induction media. Differentiation behaviors for OS and AD phenotypewere assessed by Fast Blue Staining (Blue stain) for positive alkaline phosphatase activity or Oil Red O staining (Red stain) for intracellular lipid accumulationrespectively (FBOR). Inlays represent corresponding images of fluorescently labeled nuclei. (D) Quantitative analysis of FBOR staining demonstrates 75% fastblue positive cells in OS media and significantly (p < 0.05) less fast blue positive cells and almost no oil red O positive cells in AD and BA media. Error barsrepresent the standard deviation of N ¼ 2 independent experiments. hMSCs were cultured for 18 h in (E) AD media (F) BA media, and (G) OS media. Cells werefixed and then stained for actin at 24 h of total culture time. (H) Traditional cell shape parameters (cell area and aspect ratio) demonstrated no significantdifferences between AD, BA, and OS-treated hMSCs at 24 h. Error bars represent the standard deviation for N ¼ 350–437 cells.
Fig. 2. The development of descriptor-based computational modeling approaches to parse hMSCs at 24 h in culture: (A) A quantitative approach was under-taken to parse cell fates. Tile scan images for single experiments were obtained and underwent image processing (B) to yield a list of 43 morphometric de-scriptors that described whole cell shape and cytoskeletal distribution. (B) Individual cell images were processed utilizing a ten pass Gaussian filter and thenimage enhanced (image contrast, brightness and gamma value adjustment), and a thresholding process employed to segment individual whole cells based onthe image intensity histogram. Shape and higher-order moment descriptors for segmented cell elements were then calculated as shown in (C). (D) UtilizingMDS, the 43 dimensional descriptor space (denoted by d1; d2;…dn) was combined in a nonlinear fashion to create a new 3-dimensional space to visualize thedata. The new dimensions (referred in Fig. 3 as D1–D3) represent components of all of the original 43 descriptors combined into 3 different nonlinear combina-tions. In the MDS, each point represents the three-dimensional descriptor coordinates for a single cell cultured under the defined media condition.
Treiser et al. PNAS ∣ January 12, 2010 ∣ vol. 107 ∣ no. 2 ∣ 611
APP
LIED
BIOLO
GICAL
SCIENCE
S
segmentation (Fig. 2B). Analysis of each object yielded 43 cytos-keletal shape-, intensity-, and texture-based descriptors of wholecell and individual filament morphology for each cell (Fig. 2C; SIText, Fig. S1). Using multidimensional scaling (MDS), key com-binations of these 43 descriptors were reduced into 3 dimensions(Fig. 2D; SI Text, Fig. S2).
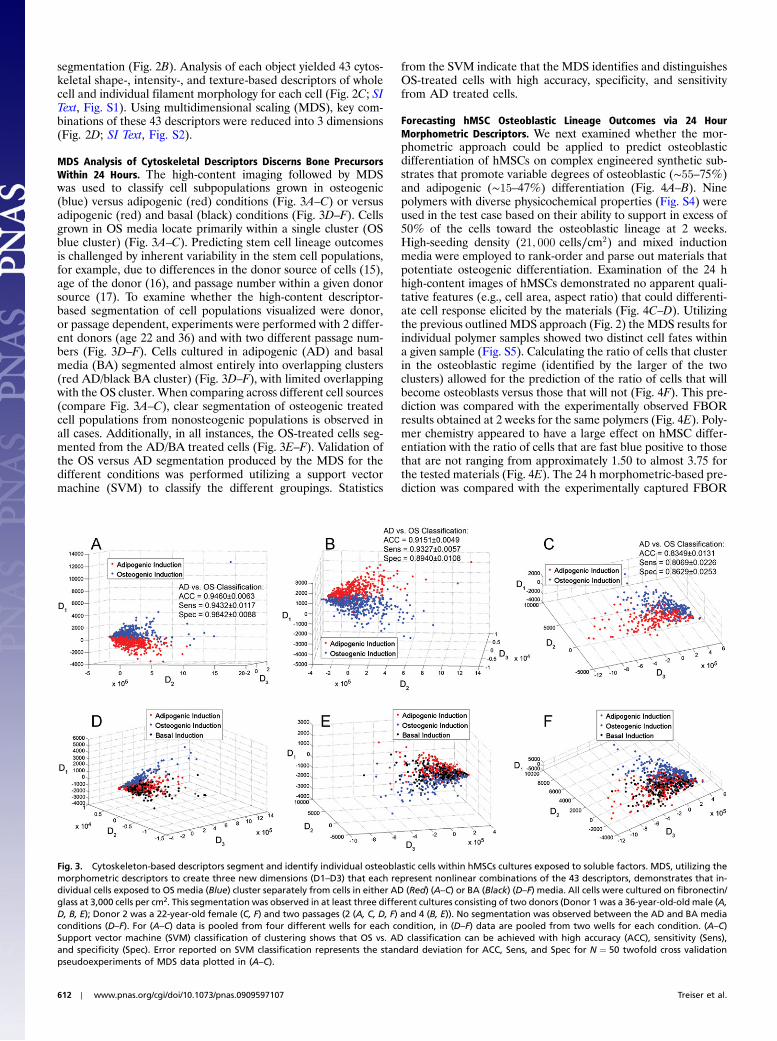
MDS Analysis of Cytoskeletal Descriptors Discerns Bone PrecursorsWithin 24 Hours. The high-content imaging followed by MDSwas used to classify cell subpopulations grown in osteogenic(blue) versus adipogenic (red) conditions (Fig. 3A–C) or versusadipogenic (red) and basal (black) conditions (Fig. 3D–F). Cellsgrown in OS media locate primarily within a single cluster (OSblue cluster) (Fig. 3A–C). Predicting stem cell lineage outcomesis challenged by inherent variability in the stem cell populations,for example, due to differences in the donor source of cells (15),age of the donor (16), and passage number within a given donorsource (17). To examine whether the high-content descriptor-based segmentation of cell populations visualized were donor,or passage dependent, experiments were performed with 2 differ-ent donors (age 22 and 36) and with two different passage num-bers (Fig. 3D–F). Cells cultured in adipogenic (AD) and basalmedia (BA) segmented almost entirely into overlapping clusters(red AD/black BA cluster) (Fig. 3D–F), with limited overlappingwith the OS cluster. When comparing across different cell sources(compare Fig. 3A–C), clear segmentation of osteogenic treatedcell populations from nonosteogenic populations is observed inall cases. Additionally, in all instances, the OS-treated cells seg-mented from the AD/BA treated cells (Fig. 3E–F). Validation ofthe OS versus AD segmentation produced by the MDS for thedifferent conditions was performed utilizing a support vectormachine (SVM) to classify the different groupings. Statistics
from the SVM indicate that the MDS identifies and distinguishesOS-treated cells with high accuracy, specificity, and sensitivityfrom AD treated cells.
Forecasting hMSC Osteoblastic Lineage Outcomes via 24 HourMorphometric Descriptors. We next examined whether the mor-phometric approach could be applied to predict osteoblasticdifferentiation of hMSCs on complex engineered synthetic sub-strates that promote variable degrees of osteoblastic (∼55–75%)and adipogenic (∼15–47%) differentiation (Fig. 4A–B). Ninepolymers with diverse physicochemical properties (Fig. S4) wereused in the test case based on their ability to support in excess of50% of the cells toward the osteoblastic lineage at 2 weeks.High-seeding density (21; 000 cells∕cm2) and mixed inductionmedia were employed to rank-order and parse out materials thatpotentiate osteogenic differentiation. Examination of the 24 hhigh-content images of hMSCs demonstrated no apparent quali-tative features (e.g., cell area, aspect ratio) that could differenti-ate cell response elicited by the materials (Fig. 4C–D). Utilizingthe previous outlined MDS approach (Fig. 2) the MDS results forindividual polymer samples showed two distinct cell fates withina given sample (Fig. S5). Calculating the ratio of cells that clusterin the osteoblastic regime (identified by the larger of the twoclusters) allowed for the prediction of the ratio of cells that willbecome osteoblasts versus those that will not (Fig. 4F). This pre-diction was compared with the experimentally observed FBORresults obtained at 2 weeks for the same polymers (Fig. 4E). Poly-mer chemistry appeared to have a large effect on hMSC differ-entiation with the ratio of cells that are fast blue positive to thosethat are not ranging from approximately 1.50 to almost 3.75 forthe tested materials (Fig. 4E). The 24 h morphometric-based pre-diction was compared with the experimentally captured FBOR
Fig. 3. Cytoskeleton-based descriptors segment and identify individual osteoblastic cells within hMSCs cultures exposed to soluble factors. MDS, utilizing themorphometric descriptors to create three new dimensions (D1–D3) that each represent nonlinear combinations of the 43 descriptors, demonstrates that in-dividual cells exposed to OS media (Blue) cluster separately from cells in either AD (Red) (A–C) or BA (Black) (D–F) media. All cells were cultured on fibronectin/glass at 3,000 cells per cm2. This segmentation was observed in at least three different cultures consisting of two donors (Donor 1 was a 36-year-old-old male (A,D, B, E); Donor 2 was a 22-year-old female (C, F) and two passages (2 (A, C, D, F) and 4 (B, E)). No segmentation was observed between the AD and BA mediaconditions (D–F). For (A–C) data is pooled from four different wells for each condition, in (D–F) data are pooled from two wells for each condition. (A–C)Support vector machine (SVM) classification of clustering shows that OS vs. AD classification can be achieved with high accuracy (ACC), sensitivity (Sens),and specificity (Spec). Error reported on SVM classification represents the standard deviation for ACC, Sens, and Spec for N ¼ 50 twofold cross validationpseudoexperiments of MDS data plotted in (A–C).
612 ∣ www.pnas.org/cgi/doi/10.1073/pnas.0909597107 Treiser et al.

staining. A high correlation (Pearson correlation coefficient ¼0.87) results between the MDS-based 24 h predictions and the2 week experimental values (Fig. 4F).
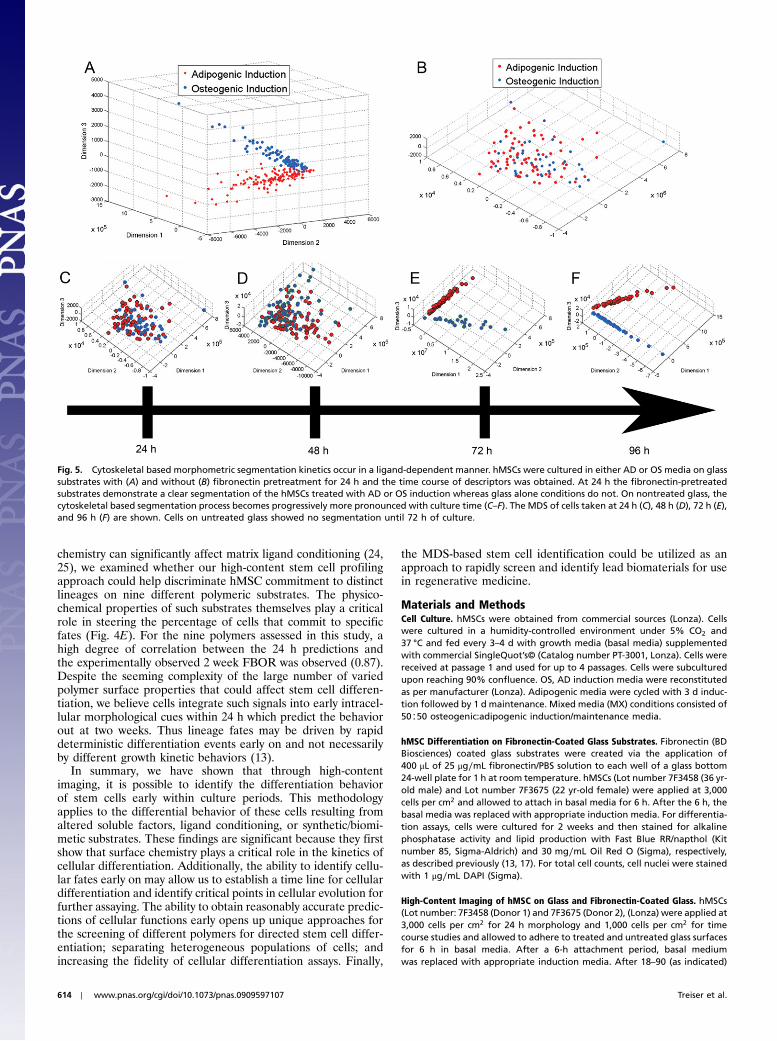
Cytoskeletal Descriptors Embody Substrate-Governed Time Evolutionof Lineage Commitment. Unlike their fibronectin-coated counter-parts, hMSCs cultured on glass substrates without fibronectinpretreatment showed no definable clusters for either the OSor AD treated cells at 24 h (Fig. 5A–B). Time sequence analysis(Fig. 5C–F) of the MDS for cells cultured in OS or AD conditionsindicate that on untreated glass, these characteristic morpho-metric features developed between 48 and 72 h. With increasingtime (96 h; Fig. 5F), the segmentation was more pronounced, in-dicating that within the time frame examined, the cytoskeletal
based morphometrics of these two cell populations becomeprogressively divergent.
DiscussionHigh-content cell morphology-based screening approaches havebeen developed for the screening of potential pharmaceuticalsand biologically active small molecules, but these strategies haveyet to become widespread for stem cell and tissue engineeringapplications. We demonstrate here that classifications of indivi-dual cell fates accurately predict long-term cellular behaviorsdays to weeks before they are experimentally detected. Previouswork links global cell shape parameters and MSC differentiationbehavior (13). However, this study finds that first moment shapedescriptors alone and gene transcription events (Fig. S6) fail tocapture the early heterogeneity and segregation of hMSCs. Tocapture these hallmark cytoskeletal “fingerprints” of osteoblasticcommitted precursors, we propose the use of a high-contentmethodology.
The cytoskeletal descriptors, which underlie the classificationproposed in our study, reinforce the notion that the actin cytos-keleton plays a dominant role in regulating hMSC differentia-tion via cell shape, Rho, Rho-associated, coiled-coil containingprotein kinase (ROCK), and cytoskeletal tension mechanisms,specifically promoting osteoblastic induction (13, 14, 18). Thetotal activity of ROCK may be correlated with the actin fiberthickness and density (19). Additionally, transient expression ofa glycerophosphodiester phosphodiesterase localized to actintriggers morphologic changes and increases in alkaline phospha-tase activity (20). Thus, it follows that the cell osteogenic lineagedecision-making process may be encoded within the cytoskeletonitself.
The methodology of morphometric profiling of cell behaviorscould be refined in the future to address discrimination of differ-ent lineage types (beyond osteogenic vs. nonosteogenic, for exam-ple), and also temporal changes in differentiation within dynamicconditions. Currently, our predictions appear valid when theinduction stimuli (i.e., substrata or growth factors) remain un-changed for the entire period of culture, but could be examinedwhen hMSCs transdifferentiate into other lineages (21). Thequestions to address in the future are which cytoskeletal descrip-tor combinations, if any, are unique to specific lineages, andwhether such descriptors can help parse multiple lineages. OurMDS-based segmentation correctly parses cells cultured underosteogenic conditions, but given its current one-reporter (actin)-based parsing process, it is unable to parse adipogenic cells fromthose under basal conditions (Fig. 3D–F). This is possibly due tolack of robust adipogenic differentiation under the sparse seedingconditions we employed or because our imaging did not extend tothe formative time course of cytoskeletal rearrangement indica-tive of adipocytic lineage commitment. Thus, the actin-basedprofiling could not be extended to parse cells near confluencein adipogenic versus basal media, but newer promising methodscould be developed for near confluent conditions based on high-content imaging of the nuclear morphology (22).
Another limitation of the current MDS approach is the inabil-ity to identify individual descriptors or groups of descriptors thatrepresent lineage commitment. While the MDS approach alonedoes not allow such identification, complementary computationalmodeling methods may be used to accomplish this task. Forexample, decision tree analysis (23) can be used in conjunctionwith high-content imaging to highlight the most meaningfuldescriptors (Fig. S7). Utilizing this multimodal computationalapproach we could not only identify lineage-committed cells atearly time points, but also extract features of the cytoskeletonthat may be correlated to specific cellular processes.
We report that extracellular matrix preconditioning by fibro-nectin had a marked effect on accelerating the kinetics of hMSClineage commitment. In addition, as small changes in substrate
Fig. 4. Altered hMSC osteoblastic commitment resulting from substrate maybe predicted based onMDS at 24 h. (A–B) At constant seeding density (21,000cells per cm2) and applied soluble cues (MX media) synthetic substrates alterthe percentage of cells that differentiate toward the osteoblastic lineage at2 weeks as assessed by FBOR staining. FBOR images are shown for polymer8 (A) and 1 (B). (C–D) While the FBOR staining in (A–B) shows differences inthe ratio of osteoblastic versus nonosteoblastic cells on different substrates,no obvious qualitative morphologic parameters of cytoskeletal morphologyare seen that can distinguish these outcomes in the 24 h tile scan actin-stained images shown for the same polymers (example shown for polymers8 (C) and 1 (D)). (E) Quantification of the ratio of fast blue positive cells tononfast blue positive cells for each substrate shows ratios ranging fromapproximately 1.5 to 3.75. Error bars represent the standard deviation ofN ¼ 2–4 experiments per substrate. (F) Scatter plot with the X-axis represent-ing the ratio of 2 week osteoblastic cells to nonosteoblastic cells, versus the24 h morphometric/MDS prediction for the same ratio (Y-axis). A high degreeof correlation between the prediction and observed percent of osteoblastswas seen (Pearson correlation coefficient ¼0.87). The X error bars representthe standard deviation for N ¼ 2–4 independent experiments. (G) Table list-ing full polymer names with corresponding keyed system shown in (F).
Treiser et al. PNAS ∣ January 12, 2010 ∣ vol. 107 ∣ no. 2 ∣ 613
APP
LIED
BIOLO
GICAL
SCIENCE
S
chemistry can significantly affect matrix ligand conditioning (24,25), we examined whether our high-content stem cell profilingapproach could help discriminate hMSC commitment to distinctlineages on nine different polymeric substrates. The physico-chemical properties of such substrates themselves play a criticalrole in steering the percentage of cells that commit to specificfates (Fig. 4E). For the nine polymers assessed in this study, ahigh degree of correlation between the 24 h predictions andthe experimentally observed 2 week FBOR was observed (0.87).Despite the seeming complexity of the large number of variedpolymer surface properties that could affect stem cell differen-tiation, we believe cells integrate such signals into early intracel-lular morphological cues within 24 h which predict the behaviorout at two weeks. Thus lineage fates may be driven by rapiddeterministic differentiation events early on and not necessarilyby different growth kinetic behaviors (13).
In summary, we have shown that through high-contentimaging, it is possible to identify the differentiation behaviorof stem cells early within culture periods. This methodologyapplies to the differential behavior of these cells resulting fromaltered soluble factors, ligand conditioning, or synthetic/biomi-metic substrates. These findings are significant because they firstshow that surface chemistry plays a critical role in the kinetics ofcellular differentiation. Additionally, the ability to identify cellu-lar fates early on may allow us to establish a time line for cellulardifferentiation and identify critical points in cellular evolution forfurther assaying. The ability to obtain reasonably accurate predic-tions of cellular functions early opens up unique approaches forthe screening of different polymers for directed stem cell differ-entiation; separating heterogeneous populations of cells; andincreasing the fidelity of cellular differentiation assays. Finally,
the MDS-based stem cell identification could be utilized as anapproach to rapidly screen and identify lead biomaterials for usein regenerative medicine.
Materials and MethodsCell Culture. hMSCs were obtained from commercial sources (Lonza). Cellswere cultured in a humidity-controlled environment under 5% CO2 and37 °C and fed every 3–4 d with growth media (basal media) supplementedwith commercial SingleQuot’s© (Catalog number PT-3001, Lonza). Cells werereceived at passage 1 and used for up to 4 passages. Cells were subculturedupon reaching 90% confluence. OS, AD induction media were reconstitutedas per manufacturer (Lonza). Adipogenic media were cycled with 3 d induc-tion followed by 1 d maintenance. Mixed media (MX) conditions consisted of50∶50 osteogenic:adipogenic induction/maintenance media.
hMSC Differentiation on Fibronectin-Coated Glass Substrates. Fibronectin (BDBiosciences) coated glass substrates were created via the application of400 μL of 25 μg∕mL fibronectin/PBS solution to each well of a glass bottom24-well plate for 1 h at room temperature. hMSCs (Lot number 7F3458 (36 yr-old male) and Lot number 7F3675 (22 yr-old female) were applied at 3,000cells per cm2 and allowed to attach in basal media for 6 h. After the 6 h, thebasal media was replaced with appropriate induction media. For differentia-tion assays, cells were cultured for 2 weeks and then stained for alkalinephosphatase activity and lipid production with Fast Blue RR/napthol (Kitnumber 85, Sigma-Aldrich) and 30 mg∕mL Oil Red O (Sigma), respectively,as described previously (13, 17). For total cell counts, cell nuclei were stainedwith 1 μg∕mL DAPI (Sigma).
High-Content Imaging of hMSC on Glass and Fibronectin-Coated Glass. hMSCs(Lot number: 7F3458 (Donor 1) and 7F3675 (Donor 2), (Lonza) were applied at3,000 cells per cm2 for 24 h morphology and 1,000 cells per cm2 for timecourse studies and allowed to adhere to treated and untreated glass surfacesfor 6 h in basal media. After a 6-h attachment period, basal mediumwas replaced with appropriate induction media. After 18–90 (as indicated)
Fig. 5. Cytoskeletal based morphometric segmentation kinetics occur in a ligand-dependent manner. hMSCs were cultured in either AD or OS media on glasssubstrates with (A) and without (B) fibronectin pretreatment for 24 h and the time course of descriptors was obtained. At 24 h the fibronectin-pretreatedsubstrates demonstrate a clear segmentation of the hMSCs treated with AD or OS induction whereas glass alone conditions do not. On nontreated glass, thecytoskeletal based segmentation process becomes progressively more pronounced with culture time (C–F). The MDS of cells taken at 24 h (C), 48 h (D), 72 h (E),and 96 h (F) are shown. Cells on untreated glass showed no segmentation until 72 h of culture.
614 ∣ www.pnas.org/cgi/doi/10.1073/pnas.0909597107 Treiser et al.

additional hours cells were fixed and stained with AlexaFluor 488 Phalloidin(Invitrogen). Cells were imaged under a 63X objective (NA ¼ 1.3) with a LeicaTCS SP2 system (Leica Microsystems Inc.) and excited at 488 nm with a500–700 nm detection band-pass filter. All images represent a mosaic of60 individual images (10 × 6 grid). Raw images of subconfluent cells wereexported to Image Pro Plus Version 5.1 (Media Cybernetics) and equalizedfor image intensity histograms, segmented and processed to yield shape,intensity and higher-order moment parameters as output to a text file priorto modeling, a process referred to as high-content imaging (Fig. 2).
Computational Methods to Parse Cytoskeletal Descriptors. Forty-three asso-ciated features (called descriptors) were archived for each cell. These featuresrepresent quantifiable measures of the whole cell and actin filamentmorphology and organization throughout a single cell. Features that weredefined include; shape features, intensity-based features that relate to thedegree of actin filament formation, and textural and cytoskeleton organiza-tional features that describe the spatial distribution of actin filaments andtheir location within a given cell. A complete list of the 43 descriptors calcu-lated and how they describe the actin cytoskeleton is shown in Fig. S1. MDSwas then implemented via Matlab’s (Mathworks) statistical toolbox to re-graph cellular descriptor coordinates based on a reduced three-dimensionalrepresentation where each point represents the combined features of indi-vidual cells (Fig. 2). MDS simply represents a dimensionality reduction tech-nique that allows the 43 descriptors described in Fig. S1 for each cell to beplotted in 3D. The MDS algorithm aides in identifying similarities as well asdissimilarities in groupings of cells based on the 43 individual cell cytoskeletaldescriptors (Fig. S2). These groupings are defined via a nonlinear combina-tion of the descriptors, which effectively reduce the 43-dimensional complexrepresentation down to three dimensions, such that the observed similaritiesand dissimilarities between cells are maximized. Ultimately, the individualcells are graphed in three-dimensions, with the proximity of points indicatingtheir similarity. To ensure that reduced datasets were valid, a syntheticdataset was generated based on the variance of each of the individual clas-sifiers (Fig. S3) and compared to MDS results for sample conditions. Classifi-cation of MDS-based cell coordinates was performed utilizing a support
vector machine (26). Classification accuracy, sensitivity and specificity wereperformed with a randomized twofold cross validation run 50 times onindividual datasets utilizing a radial distribution function.
Preparation of Spin-Coated Polymeric Substrates. Tyrosine-derived polycar-bonates (27), polymethacrylates (28, 29), poly(D,L-lactide-co-glycolide) (Reso-mer 506) and poly(L-lactic acid) (Resomer L-206) (Boehringer Ingelheim) weredissolved in a 1.5% ðv∕vÞ methanol in methylene chloride solution yielding a1% ðw∕vÞ polymer solution. Polymer solutions were then spin-coated onto a15 mm glass coverslip. Spin coating was conducted at 4,000 RPM for 30 s.Collagen coated coverslips were made by incubating a glass coverslip in a7 μg∕mL collagen solution at 37 °C overnight.
hMSC Morphometrics and Differentiation on Polymeric Substrates. Polymer-coated glass coverslips were placed in the bottom of a 24-well glass bottomtissue culture plate and secured with a silicon O-ring (Catolog number 111,Molding Solution). The setup was sterilized with a UV light applied at 5,500to 6; 500μW per cm2 for 900 s. hMSCs (Lot number’s 6F4392 (18 yr-old male)and 7F3458) were applied at 21,000 cells per cm2 and allowed to attach inbasal media for 6 h,, switched to induction media, processed and imagedas described above. 21,000 cells per cm2 was chosen so as to provide signifi-cant amounts of both osteogenic and adipogenic (maximum 47%) differen-tiation while keeping the cell cultures subconfluent to allow individual cellsegmentation and descriptor analysis. For differentiation assays, cells werestained for alkaline phosphatase activity and lipid production as describedpreviously. Only substrates that elicited greater than 50% alkaline phospha-tase activity at 2 weeks were examined within this study.
ACKNOWLEDGMENTS. The efforts of Drs. Abraham Joy and Das Bolikal withsynthesis of polymers, and of Shannon Agner and Dr. Anant Madabhushiwith data processing, are gratefully acknowledged. This study was partiallysupported by National Institute of Health EB001046 (RESBIO, IntegratedResources for Polymeric Biomaterials), Rutgers University Academic Excel-lence Fund, National Science Foundation DGE IGERT 0333196 and DGE IGERT0801620.
1. Thomson JA, et al. (1998) Embryonic stem cell lines derived from human blastocysts.Science, 282(5391):1145–1147.
2. Park IH, et al. (2008) Reprogramming of human somatic cells to pluripotency withdefined factors. Nature, 451(7175):141–146.
3. Pittenger MF, et al. (1999) Multilineage potential of adult human mesenchymal stemcells. Science, 284(5411):143–147.
4. Curran JM, Chen R, Hunt JA (2006) The guidance of human mesenchymal stem celldifferentiation in vitro by controlled modifications to the cell substrate. Biomaterials,27(27):4783–4793.
5. Engler AJ, Sen S, Sweeney HL, Discher DE (2006) Matrix elasticity directs stem celllineage specification. Cell, 126(4):677–689.
6. Kulterer B, et al. (2007) Gene expression profiling of human mesenchymal stem cellsderived from bone marrow during expansion and osteoblast differentiation. BMCGenomics, 8:70.
7. Pockwinse SM, Stein JL, Lian JB, Stein GS (1995) Developmental stage-specific cellularresponses to vitamin D and glucocorticoids during differentiation of the osteoblastphenotype: Interrelationship of morphology and gene expression by in situ hybridiza-tion. Exp Cell Res, 216(1):244–260.
8. Sikavitsas VI, Temenoff JS, Mikos AG (2001) Biomaterials and bone mechanotransduc-tion. Biomaterials, 22(19):2581–2593.
9. Carvalho RS, Schaffer JL, Gerstenfeld LC (1998) Osteoblasts induce osteopontin expres-sion in response to attachment on fibronectin: Demonstration of a common role forintegrin receptors in the signal transduction processes of cell attachment andmechan-ical stimulation. J Cell Biochem, 70(3):376–390.
10. Rodriguez Fernandez JL, Ben-Ze’ev A (1989) Regulation of fibronectin, integrinand cytoskeleton expression in differentiating adipocytes: Inhibition by extracellularmatrix and polylysine. Differentiation, 42(2):65–74.
11. Spiegelman BM, Ginty CA (1983) Fibronectin modulation of cell shape and lipogenicgene expression in 3T3-adipocytes. Cell, 35(3 Pt 2):657–666.
12. Thomas CH, Collier JH, Sfeir CS, Healy KE (2002) Engineering gene expression andprotein synthesis by modulation of nuclear shape. Proc Natl Acad Sci USA, 99(4):1972–1977.
13. McBeath R, Pirone DM, Nelson CM, Bhadriraju K, Chen CS (2004) Cell shape,cytoskeletal tension, and RhoA regulate stem cell lineage commitment. Dev Cell, 6(4):483–495.
14. Rodriguez JP, Gonzalez M, Rios S, Cambiazo V (2004) Cytoskeletal organization ofhumanmesenchymal stem cells (MSC) changes during their osteogenic differentiation.J Cell Biochem, 93(4):721–731.
15. Sekiya I, et al. (2002) Expansion of human adult stem cells from bone marrow stroma:Conditions that maximize the yields of early progenitors and evaluate their quality.Stem Cells, 20(6):530–541.
16. Moerman EJ, Teng K, Lipschitz DA, Lecka-Czernik B (2004) Aging activates adipogenicand suppresses osteogenic programs in mesenchymal marrow stroma/stem cells: Therole of PPAR-gamma2 transcription factor and TGF-beta/BMP signaling pathways.Aging Cell, 3(6):379–389.
17. Bruder SP, Jaiswal N, Haynesworth SE (1997) Growth kinetics, self-renewal, and theosteogenic potential of purified human mesenchymal stem cells during extensivesubcultivation and following cryopreservation. J Cell Biochem, 64(2):278–294.
18. Morrison SJ, White PM, Zock C, Anderson DJ (1999) Prospective identification,isolation by flow cytometry, and in vivo self-renewal of multipotent mammalianneural crest stem cells. Cell, 96(5):737–749.
19. Watanabe N, Kato T, Fujita A, Ishizaki T, Narumiya S (1999) Cooperation betweenmDia1 and ROCK in Rho-induced actin reorganization. Nat Cell Biol, 1(3):136–143.
20. Yanaka N, et al. (2003) Novel membrane protein containing glycerophosphodiesterphosphodiesterase motif is transiently expressed during osteoblast differentiation.J Biol Chem, 278(44):43595–43602.
21. Baksh D, Song L, Tuan RS (2004) Adult mesenchymal stem cells: Characterization, dif-ferentiation, and application in cell and gene therapy. J Cell Mol Med, 8(3):301–316.
22. McBride SH, Knothe Tate ML (2008) Modulation of stem cell shape and fate A: The roleof density and seeding protocol on nucleus shape and gene expression. Tissue Eng PTA, 14(9):1561–1572.
23. Murthy SK (1998) Automatic Construction of Decision Trees from Data: A Multi-Disciplinary Survey. Data Min and Knowl Disc, 2(4):345–389.
24. Bae YH, Johnson PA, Florek CA, Kohn J, Moghe PV (2006) Minute changes incomposition of polymer substrates produce amplified differences in cell adhesionand motility via optimal ligand conditioning. Acta Biomater, 2(5):473–482.
25. Tziampazis E, Kohn J, Moghe PV (2000) PEG-variant biomaterials as selectivelyadhesive protein templates: Model surfaces for controlled cell adhesion and migra-tion. Biomaterials, 21(5):511–520.
26. Cortes C, Vapnik V (1995) Support-vector networks. Mach Learning, 20(3):273–297.27. Bourke SL, Kohn J (2003) Polymers derived from the amino acid L-tyrosine: polycar-
bonates, polyarylates and copolymers with poly(ethylene glycol). Adv Drug DeliverRev, 55(4):447–466.
28. Briggs T, et al. (2008) Osteogenic differentiation of human mesenchymal stem cells onpoly(ethylene glycol)-variant biomaterials. J Biomed Mater Res A, 91(4):975–984.
29. Kholodovych V, et al. (2008) Prediction of biological response for large combinatoriallibraries of biodegradable polymers: Polymethacrylates as a test case. Polymer, 49(10):2435–2439.
Treiser et al. PNAS ∣ January 12, 2010 ∣ vol. 107 ∣ no. 2 ∣ 615
APP
LIED
BIOLO
GICAL
SCIENCE
S