Embed Size (px)
Citation preview

Cycling Infrastructure for Australian Cities Background Paper March 2009

Cycling Infrastructure for Australian Cities March 2009
2
EXECUTIVE SUMMARY Recently the Australian Government sought advice on how to best facilitate the modal shift towards cycling as a viable and sustainable means for commuting, local trips and recreation.
It is noted that:
Australia falls well behind best practice: in some western European countries 10-20% of journeys are made by bicycle compared to Australia with less than 2%;
There is enormous scope to increase the modal share of cycling, particularly for those 40% of Australians commuting less than 10km to their place of work or study, or those making short local trips;
There are significant benefits to cycling, including reductions in traffic congestion improvements to public health and reductions in obesity.
The countries that have successfully increased cycling as a mode share have had specific, measurable policies, cross-integration of relevant government agencies, and made major investments into cycling-related infrastructure and education.
In addition to providing physical facilities, other successful countries have undertaken awareness and education campaigns to tackle issues of safety (real and perceived); to improve driver, cyclist and pedestrian behaviour; and to promote cycling and walking as the mode of choice for commuting and short journeys.
Further investigations can be made, applying international research and experience, to the Australian context to:
Evaluate the benefits and costs of cycling infrastructure,
Improve safety, and
How to best achieve a decisive modal shift to cycling through improved policy integration, construction of physical infrastructure, and behavioural change.
The Australian Government has recently committed $40 million of its $42 billion stimulus package on cycling infrastructure.
Specific requests to Infrastructure Australia for cycling projects are tabled at Appendix D.

Cycling Infrastructure for Australian Cities March 2009
3
BACKGROUND In preparing this paper, Infrastructure Australia has reviewed:
Proposals (or parts of proposals) submitted to Infrastructure Australia for the construction of bicycle paths and bicycle-related infrastructure;
Current strategies and action plans for commuter cycling infrastructure in the capital cities of Australia;
International examples of cycling infrastructure programs;
Literature on cost benefit ratio calculations; and
Awareness and education campaigns that have addressed safety (real and perceived); driver, cyclist and pedestrian behaviour; and transport mode choice.
The purpose of the literature review was to determine:
Best practice examples of successful implementation of cycling infrastructure networks where a significant modal shift has occurred;
The availability and reliability of data (within Australia and internationally) about cost benefit analyses, for the purposes of objective decision making in cycling infrastructure investment;
Possible stimulus measures for funding of cycling infrastructure; and
How a revision of policies and standards could improve the integration of cycling across jurisdictions, sectors, agencies and spheres of government.

Cycling Infrastructure for Australian Cities March 2009
4
Australia’s ranking in cycling Australia falls well behind many other OECD countries on bicycle use. Figure 1 shows that in countries such as the Netherlands, Denmark and Germany over 10% of all daily journeys are made by bicycle, and in some cities the share is much higher.
By comparison, Australia’s modal share is 1.56% of commuter journeys1 and 4.8% of day-to-day trips other than to work or study. This puts Australia in the range of the UK and Canada in terms of commuter share.
Figure 1: Modal share of cycling compared to Australia 2
Over the past few years most western European countries have been working to increase cycling’s share of transport journeys, particularly over short distances. It is increasingly recognised as a clean, enjoyable and sustainable mode of transport in urban areas, and a means to encourage physical activity as a component of public health.3
1 ABS 2006, 4062.0, table 4.13: Totals adjusted to include all forms of transport. 2 European data sourced from Cycling England, 2007, Bike for the Future II, p.59-60. Australian data from ABS 2006, 4602.0, table 4.11, cycling as percentage of commuter trips only. USA/Canada from Pucher + Buehler, 2005, p 268 3 European Conf on Metropolitan Transport (ECMT), 2004 National Policies to Promote Cycling in OECD countries
27%
19%
10%9% 9%
8%7%
5% 5%3% 3%
1.6% 1.3% 1.2% 0.4%
40%
30% 30%
19%20% 20%
10%
30%
12%
5%
10%
5% 5% 5%3%
0%
5%
10%
15%
20%
25%
30%
35%
40%
45%
Cycling as % of transpo
rt m
ode share
National average Best practice cities

Cycling Infrastructure for Australian Cities March 2009
5
Cycling is regarded in many cities as a viable alternative to help relieve traffic congestion, noise and air pollution, and greenhouse gas emissions. It is also increasingly seen as a significant component of an integrated transport system.
A survey of 20 OECD countries across Europe, Japan and the United States found that 75% had national policies for cycling by 2002. It concluded that, “National governments can help implementation of cycling policies in local areas in a number of ways, including by establishing a national policy framework or strategy... and by providing adequate financial support – especially for cycling infrastructure development and facilities.”4
A more detailed description of international experiences is described later in this report, and summarised at Appendix C.
A national commitment to cycling The Australian National Cycling Strategy 2005 – 2010, prepared by Austroads in 2005, listed six priorities (see Appendix A). In addition to promoting safety, the first two priorities were to:
• Improve coordination between relevant portfolios and
• Integrate transport and land use planning.
Without strong support at a senior level within government, spending on cycling infrastructure falls off the agenda. The governance structure needs to support cycling as a valid and sustainable means of reducing traffic congestion, improving health and reducing pollution and emissions – without requiring a singular champion for short-term promotion.
It is clear that a more decisive national commitment to cycling would be required for Australia to catch up with international best practice. The National Cycling Strategy, whilst correct in its overall intent, has not provided the mechanisms to deliver a significant increase in cycling participation rates across Australia.
Data collection and analysis One of the barriers to creating better cycling infrastructure, cited by many countries, is that cycling and walking remain marginal in transport policy discussions and that national budgetary allocations usually reflect this status.5 Australia is no exception in this regard.
Collecting user statistics
In Australia, the Australian Bureau of Statistics (ABS) collects Census data about modes of transport used to commute to work or study. The ABS commissions additional data, such as people’s reasons for walking or cycling to work, in surveys conducted every three years.6 Some jurisdictions within Australia have also commissioned walking and cycling user analyses, most notably in the major cities.7
These forms of data collection and analysis focus on collecting user demographics, comparisons with other modes of transport for journeys to work (such as public transport and private motor vehicle use), reasons for using or not using any particular mode, and recreational walking or cycling.
4 ECMT, 2004, p.11 5 ECMT, 2004, p.10 6 ABS surveys conducted in April 1996, March 2000, March 2003 and March 2006 – see ABS 2006, 4062.0 Environmental Issues: people’s views and practices, Chapter 4 7 Eg, Walking and Cycling: Census Analysis for Melbourne; and Cycling in NSW: what the data tells us both 2008

Cycling Infrastructure for Australian Cities March 2009
6
Estimating benefits and costs
There is also a growing body of research into the costs and benefits of cycling and walking particularly in the Netherlands, UK and Nordic countries.8
The cited benefits range from improved public health and community well-being, to reduced greenhouse gas emissions and pollution. This field of research is relatively new in Australia, although it is gaining traction with the growth of international studies in this area.
Such data collection and analysis is considered vital to calculating the costs and benefits of capital infrastructure and other programs aimed at increasing cycling and walking. However, it is extremely difficult to quantify many of the benefits.
Further work is required to ensure that the assessment of benefits is sufficiently robust to meet the requirements of Infrastructure Australia’s methodology and the Building Australia Fund criteria. As noted in one submission, transport modelling has largely ignored cycling and consequently benefit cost ratio studies do not have a long history of analysing cycling.9
BENEFITS Cycling and walking have a large number of benefits over motorised movement of passengers including (but not limited to):
• Congestion: reduces reliance on private car use and public transport, particularly when integrated into an overall transport strategy;
• Public Health: promotes regular cardio-vascular activity which is essential to a balanced, healthy lifestyle. Reducing airborne pollution reduces respiratory problems and reduced noise pollution reduces stress and sleep disturbance;
• Environment and Climate Change: extremely energy efficient, no air or noise pollution, and no greenhouse gas emissions;
• Community: well-designed urban spaces that incorporate walking and cycling encourage community interaction and social well-being. Pedestrian exercise is affordable and provides opportunities for improved quality of life.
Traffic congestion A modal shift to walking or cycling, particularly for short journeys, reduces reliance on private car use and public transport. Traffic congestion in urban areas, and the consequent loss of productivity, is the central basis for productivity assessments of cycling measured against other modes of transport.
Some critics argue that increasing the numbers of cyclists on roads increases traffic congestion due to their slower pace. This argument underscores the need to appropriately integrate and design cycling infrastructure (such as separated paths, speed restrictions) to minimise adverse impacts on traffic congestion and improve safety.
Public Health
8 An example is TemaNord, 2005, Cost Benefit Analysis of Cycling, available at www.norden.org and the economic analysis by SQW for Cycling England’s “Bike for the Future 2” program available at www.cyclingengland.co.uk) 9 Brisbane City Council submission Investing in Cycleways

Cycling Infrastructure for Australian Cities March 2009
7
Physical activity is an important component of public health and disease prevention. The World Health Organisation promotes modes of transport that lead to health and environment benefits, with lower emissions and traffic accident risks, particularly walking and cycling.10 It recommends half an hour of daily exercise and suggests that, “The main sources of health-enhancing physical activities encompass normal and simple activities such as walking [and] cycling...”11
Regular physical activity reduces the likelihood of coronary heart disease, strokes, hypertension and cholesterol; stress, anxiety and depression; overweight and obesity; type 2 diabetes; falls prevention in the elderly due to strengthened muscles and joint stability; osteoporosis; colon and breast cancer. For example, each additional hour spent commuting in a motor vehicle increases the likelihood of obesity by 6%.12
Figure 7 shows that OECD countries with higher levels of cycling participation have lower levels of adult obesity. The direct gross cost of physical inactivity to the Australian health budget in 2006/07 was $1.49 billion, equating to nearly $200 per inactive person per year. 13
Cycling and walking not only promote regular physical activity, they also reduce air pollution (linked to respiratory disease and asthma) and noise pollution (linked to stress and sleep disturbance).
Figure 2 shows some of the interrelationships between transport systems and associated infrastructure, and their social and health impacts. It demonstrates that there are complex links between public health, urban planning and transportation systems.
Figure 2: Linking transport systems and urban infrastructure with potential health impacts 14
Yellow highlight boxes are the potential health impacts
Environment and Climate Change
10 ECMT, 2004, p.22 11 World Health Organisation 2006, Promoting physical activity for health: a framework for action 12 Cycling: Getting Australia Moving, p.2 13 Cycling: Getting Australia Moving, p.4 - quoting a study by Econtech 2007, Economic modelling of the net costs associated with non-participation in sport and physical activity 14 McMichael, A, ‘The Urban Environment and Health,’ in Newton, 2008

Cycling Infrastructure for Australian Cities March 2009
8
Cycling and walking have obvious environmental benefits over other forms of motorised transport, being extremely energy efficient, causing no air or noise pollution, and no greenhouse gas emissions. Figure 3 compares some of the environmental impacts between cycling and other modes of transport.
Figure 3: Environmental impact of different transport modes (base = 100 car)15
Community Cycling and walking provide benefits to community well-being, social capital and community engagement. Cycling is affordable (at around 1% of the cost of owning a car), fun, provides a convenient and fast mode of transport for short trips, and is available to everyone.
“There is a broad consensus that cycling offers tangible benefits for those who participate, but also for society as a whole... Cycling plays a role in providing more independence to children; improving the quality of life for communities and... supporting tourism.”16
Currently, cycling facilities do not encourage a broad spectrum of users: for example, in NSW, women represent only 17% of commuter cyclists.17
In planning for cycling and pedestrian infrastructure, it is important to consider the broader community, not simply the “lycra brigade”. Well-considered land use patterns (such as higher density with mixed development to locate housing near commercial, educational and retail amenities), quality urban design, integration with public transport, slower road speeds and improved pedestrian paths are all methods for encouraging greater community participation.
15 ECMT, p.22 16 Cycling England, p.66 17 Parsons Brinckerhoff, p.25

Cycling Infrastructure for Australian Cities March 2009
9
Net cost reductions The Cycling Promotion Fund submitted to Infrastructure Australia a paper outlining its cost benefit analysis of four cycling projects ranging from $20 million to $200 million. It estimated that the value of commuter cycling in Australian capital cities is worth approximately $0.76 per kilometre travelled, equating to $2,667 for each regular commuter.18
The Council of Capital City Lord Mayors also submitted a paper for cycling projects in Brisbane and Sydney. It estimated that converting existing drivers to cycling is worth $0.74 per kilometre. For the Inner Sydney Cycle Network this would equate to $1,920 per person annually.19
These figures seems high when compared against a study by Cycling England which estimates that the economic value of each additional cyclist in England varies between £87 to £382 per annum ($220 to $960pa) depending on their location, age, fitness and level of cycling participation. Figure 4 shows where these reductions were allocated:
Figure 4: Economic benefits of cycling, UK estimate 20
A number of European cost benefit analyses are also publically available21.
The Council of Capital City Lord Mayors suggests that Infrastructure Australia, through the Major Cities Unit, should commission research into benefit cost ratios for cycle ways; and that a proportion of Infrastructure Australia’s funds should be quarantined for investment in active transport projects until more a precise and consistent methodology can be agreed.
The Roads and Traffic Authority of New South Wales has commissioned a detailed evaluation of the costs and benefits of investment into its proposed cycling programs and projects. The results have not yet been published.
18 Cycling: Getting Australia Moving, p.5 - table 4 and table 5. NOTE: table 4 states that its source for “kilometres travelled” is ABS Census data, however the Census does not collect this information. IA has extrapolated $0.76/km ($144.3m / 189,392,000 km travelled pa by bicycle commuters). 19 CCCLM 2008. IA extrapolated $0.74/km x 5.9km x twice daily x 220 days = $1,920 per bike commuter 20 Cycling England, p.70 21 TemaNord, 2005

Cycling Infrastructure for Australian Cities March 2009
10
CONVERTING COMMUTERS TO CYCLING
Commuter statistics for cycling in Australia Nearly 40% of Australians commute less than 10 kilometres to work or study.22 In the capital cities 15.3% of commuters travel less than 5 kilometres, and in the rest of the nation 28.6%. Despite this, less than 3 out of 50 commuters walk or cycle to work (1.6% cycle / 4.2% walk).
Of those commuters who travel less than 5 kilometres, 3.5% ride and 18.7% walk. Of those travelling between 5 and 10 kilometres, 2.3% ride and 0.1% walk. This demonstrates that:
• Nearly a fifth of people will walk to their place of work or study, provided they live no more than 5 kilometres away. Proximity to work is the single major factor in determining whether a person will commute by bicycle / foot
• Only a small percentage of people currently commute by bicycle (1.56% of all commuters) and they are generally within 10 kilometres of work.
71% of commuters who travel less than 5 kilometres use a private motor vehicle, and less than 7% use public transport. Of those travelling 5 to 10 kilometres, 80% drive and 16.5% use public transport. This is summarised in Figure 5.
Figure 5: Modal share of commuter transport in Australia, by distance23
22 ABS 2006, Environmental Issues, table 4.9 23 Data sourced from ABS 2006, Environmental Issues, table 4.13. Totals adjusted to include all forms of transport. Chart prepared by Infrastructure Australia
0%
10%
20%
30%
40%
50%
60%
70%
80%
90%
100%
< 5 km 5‐10 km 10‐20 km 20‐30 km > 30 km
Mod
e as propo
rtion of all travel
Distance travelled to work or study
Other (eg taxi)
Walk
Bicycle
Public transport
Car
Distance as proportion of all journeys

Cycling Infrastructure for Australian Cities March 2009
11
Figure 6, which tracks the percentage of people commuting by bicycle (1996 to 2006), shows that in the six years to 2006 the proportion of people cycling to work has increased 45% on average across the nation. The most substantial increase has been in the ACT which has nearly doubled its commuter cycling share since 2000. Victoria has also experienced a sizeable increase over the same period, whilst NSW and Queensland have remained steady and WA has decreased considerably.24
Figure 6: Percentage of people commuting by bicycle in each State, 1996 – 2006 25
Unfortunately, the general upward trend since 2000 is simply reversing a rapid downturn that occurred between 1996 and 2000 when the percentage of commuters travelling by bicycle plunged 73% nationwide (from 1.9% to 1.1%). This large drop remains unexplained.
The current level of around 1.6% of is still significantly less than in 1996.
Over the same 10 years 1996 to 2006 the proportion of public transport commuters increased (from 11.9% to 13.5%) and proportion of car drivers remained steady at just over 80%.26
Some statistical local areas have much higher levels of cycling. For example 17% of all journeys to or within City of Melbourne are by bicycle, whilst in Yarra-North, Port Phillip-West and Southbank Docklands more than 5% of journeys are by cycling.27
These statistics show that there is a wide diversity of cycling uptake but, at an aggregate level, cycling remains marginalised as a mode of transport.
24 ABS 2006, Environmental Issues, table 4.9 25 Data sourced from ABS 2006, Environmental Issues, table 4.11 26 ABS 2006, Environmental Issues, 27 Bartley Consulting, 2008, p.21
0
1
2
3
4
5
6
1996 2000 2003 2006
Cylcing to work as % of m
odal sha
re
AUST
NSW
VIC
QLD
SA
WA
TAS
NT
ACT

Cycling Infrastructure for Australian Cities March 2009
12
Safety Perceived and actual traffic hazards are a key constraint in low-cycling countries such as Australia. Concern about safety is one of the most significant barriers preventing people from cycling, even for those who cycle regularly. 28
It has been consistently demonstrated that increasing the proportion and amount of cycling reduces the risk of road injuries and fatalities. Figure 7 illustrates this inverse relationship across a variety of countries (similar Australian statistics were not available). This table also shows an inverse relationship between cycling and obesity: those countries with higher levels of cycling participation have a smaller proportion of obese people in the population.
Improvements in safety are not simply due to participation rates: appropriate infrastructure; reductions in vehicle speed; and education about road safety and behaviour are also factors.
Figure 7: Cycling fatalities decrease as daily travel distances increase29
28 Cycling: Getting Australia Moving, p.18 29 Fatalities sourced from Pucher and Buelher (2005) p12; Journeys sourced from Cycling England; Obesity statistics sourced from WHO database
0.0%
5.0%
10.0%
15.0%
20.0%
25.0%
30.0%
35.0%
0.00
1.00
2.00
3.00
4.00
5.00
6.00
7.00
Percen
tage
Fatalities pe
r 10
0 million kilometres cycled
Fatalities per 100 million km cycled Journeys by bicycle (% of all trips)
BMI Obese Adults (% of population)

Cycling Infrastructure for Australian Cities March 2009
13
Campaigns and Events National “Ride to Work Day” attracted 90,000 participants in 2007. Of participants who did not normally commute by bicycle, over 64% usually drove to work and 27% used public transport.30 It could be assumed that removing barriers to encourage more cycling could garner a reasonable proportion of commuters who currently drive.
A follow-up survey of participants five months later found that 29% of “first time rider” participants rode to work in the week of the follow-up survey.31 This demonstrates that campaigns and events can effectively encourage increased cycling participation in commuters.
TravelSmart programs have been introduced in a number of cities and work places across the country to encourage behavioural change towards cycling, walking and public transport.32 There are mixed views about these programs.
EXEMPLARY PROJECTS
International Leadership As demonstrated in Figure 1, Australia falls well behind world’s best practice and more closely emulates North America in its cycling statistics:
“Cycling is an integral part of the urban transport system in most Western European countries, a sharp contrast to North America, where it is a distinctly marginal mode. The much higher levels of cycling in Europe are not simply historical artifacts or culturally determined. Indeed, most Western European countries dramatically shifted their urban transport policies in the 1970s to curb car travel and promote transit, walking, and cycling as the socially and environmentally friendly means of travel.”33
Denmark and the Netherlands clearly lead the world in this area. Other countries such as Germany, Austria and Belgium follow suit. Appendix C shows examples of bicycle infrastructure investments around the world including Bogota in Colombia, the Paris Vélib (bike hire) scheme, Copenhagen in Denmark and Freiburg in Germany. A second table shows initiatives being undertaken in five European cities with a range of population sizes. These demonstrate that infrastructure projects, in combination with strong leadership to promote cycling, cross-integration of related sectors, and relevant policies, have lead to significantly higher numbers of cycling than in Australia.
The Paris Vélib provides 20,000 self-service bicycles for hire and is serviced by JCDecaux, one of the world’s largest outdoor advertising companies, through its Cyclocity scheme.34 Similarly Clear Channel Outdoor’s Smart Bike scheme operates in several cities including Barcelona (6000 bicycles for hire), Stockholm (2000 bicycles), Oslo (1200), Milan (1200), and Washington DC where the first 30 minutes of hire is usually provided for free.35
The UK has similar rates of cycling to Australia, but is working to catch up to its European counterparts. For example, the UK 1999 Finance Act introduced an annual tax exemption which allows employers to loan cycles and cyclist safety equipment to employees as a tax free benefit. Employers can purchase bicycles for loan to their employees, treat the cost as a capital
30 National Ride to Work Day, 2007, Post-Event Report 2007, p.45 31 National Ride to Work Day, 2008, Follow-up Survey of Ride to Work Day 2007 Registered Participants 32 Example see www.travelsmart.vic.gov.au 33 Pucher and Buehler 2006, p 277 34 http://www.jcdecaux.co.uk/development/cycles/ 35 www.smartbike.com

Cycling Infrastructure for Australian Cities March 2009
14
expenditure and claim capital allowances. The exemption was one of a series of measures introduced under the government’s “Green Transport Plan”. 36
Cycling England, a non-departmental public body, has proposed a major overhaul of its governance structure to improve the delivery of cycling infrastructure and behaviour change.37 Its £140 million ($350 million) “Bike for the Future 2” program has committed funding to provide bicycle tuition for all school children and improve cycle routes to schools. It has also embarked on Cycle City, Cycle Towns funding 16 towns across England to improve cycling infrastructure with the aim of boosting cycling rates by 20% by 2012. It estimates that this will create savings of more than £523 million (approx $1.3 billion)38 delivering a 3:1 to 4.5:1 benefit to cost ratio.
Australian Context As demonstrated in Figure 6 the rate of cycling for commuting in Australia varies across each state and over time. Melbourne and Canberra have both been exemplary in successfully increasing cycling rates over the past few years and cycling statistics in some inner city locations, such as City of Melbourne, are relatively high.
The Victorian Bicycle Advisory Council (VBAC), established in 1998, includes representatives from the Victorian Government, Bicycle Victoria, the cycling industry, researchers and the community. It is a broad-based forum that oversees the management and development of cycling in Victoria. It provides the Minister for Roads and Ports with strategic policy and program advice on cycling-related issues. It provides advice on the provision of cycling facilities as part of major infrastructure projects, and has initiated a series of cycling workshops with key stakeholders in metropolitan Melbourne and regional Victoria. Vic Roads also provides comprehensive information on its website about the planning and construction of cycling facilities, both on and off road, as well as maps and safety information for cyclists and pedestrians.39
36 UK Department for Transport, 2005, Cycle to Work Schemes 37 Cycling England, p.53 38 Cycling England, executive summary 39 www.vicroads.vic.gov.au/Home/BicyclesPedestrians/

Cycling Infrastructure for Australian Cities March 2009
15
APPENDIX A: Australian National Cycling Strategy The Australian National Cycling Strategy 2005 – 2010, was prepared by Austroads in 2005 to “promote the integration of and commitment to actions to increase cycling in Australia” across various portfolios and the tiers of government. It listed six priorities:
1. Improve coordination between relevant portfolios of the various tiers of government
2. Integrate transport and land use planning
Incorporate cycling into state and local government land use policies and planning instruments
Support planning for increased cycling by local government
3. Build infrastructure and facilities
Create integrated, effective and safe cycling networks that support increased cycling for transport
Develop policies and procedures that consider the needs of cyclists during construction and/ or maintenance of all new and existing roads
4. Promote road safety (both physical form of networks, and attitude of users)
Support programs and initiatives that promote safe cycling to school and higher education, addressing infrastructure and facilities, and promotional activities
5. Provide leadership and develop partnerships to support and promote cycling
6. Increase professional capacity to ensure the above priorities are met
Note:
The effectiveness of the Australian National Cycling Strategy 2005-2010 has not been evaluated formally.
Many groups believe that the strategy has not provided the mechanisms to deliver a significant increase in cycling participation rates across Australia.
Cycling Infrastructure for Australian Cities March 2009
16
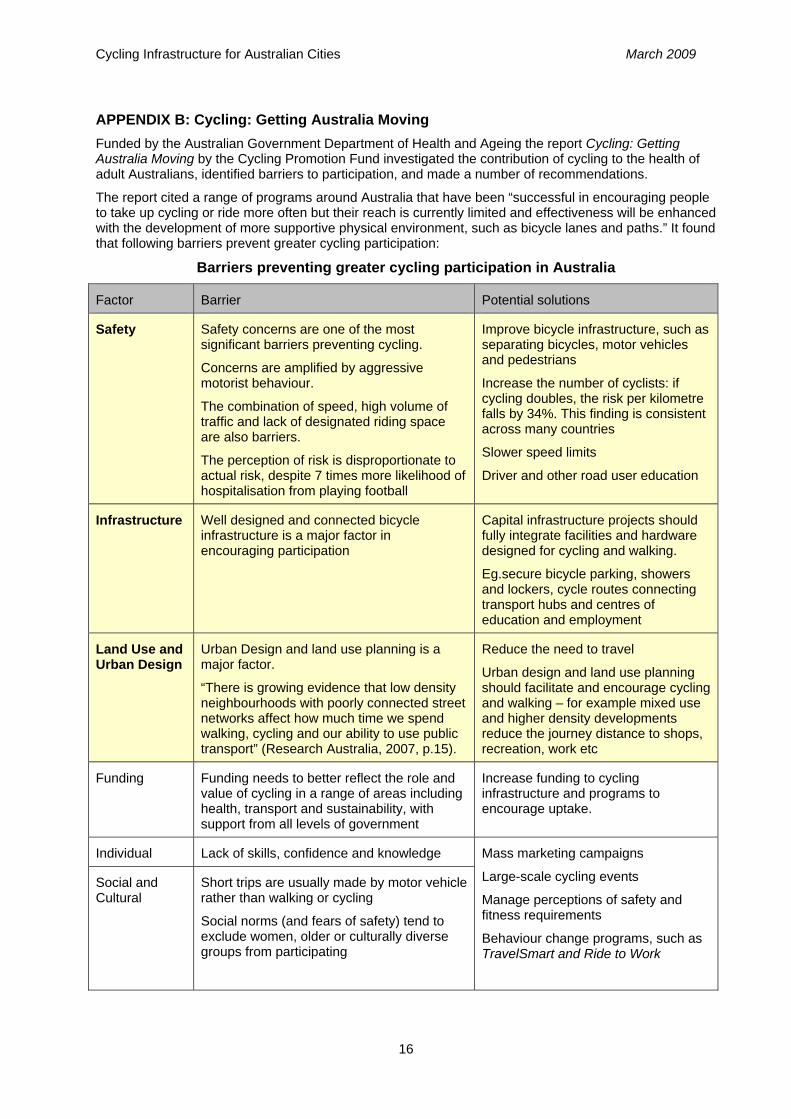
APPENDIX B: Cycling: Getting Australia Moving Funded by the Australian Government Department of Health and Ageing the report Cycling: Getting Australia Moving by the Cycling Promotion Fund investigated the contribution of cycling to the health of adult Australians, identified barriers to participation, and made a number of recommendations.
The report cited a range of programs around Australia that have been “successful in encouraging people to take up cycling or ride more often but their reach is currently limited and effectiveness will be enhanced with the development of more supportive physical environment, such as bicycle lanes and paths.” It found that following barriers prevent greater cycling participation:
Barriers preventing greater cycling participation in Australia
Factor Barrier Potential solutions
Safety Safety concerns are one of the most significant barriers preventing cycling.
Concerns are amplified by aggressive motorist behaviour.
The combination of speed, high volume of traffic and lack of designated riding space are also barriers.
The perception of risk is disproportionate to actual risk, despite 7 times more likelihood of hospitalisation from playing football
Improve bicycle infrastructure, such as separating bicycles, motor vehicles and pedestrians
Increase the number of cyclists: if cycling doubles, the risk per kilometre falls by 34%. This finding is consistent across many countries
Slower speed limits
Driver and other road user education
Infrastructure Well designed and connected bicycle infrastructure is a major factor in encouraging participation
Capital infrastructure projects should fully integrate facilities and hardware designed for cycling and walking.
Eg.secure bicycle parking, showers and lockers, cycle routes connecting transport hubs and centres of education and employment
Land Use and Urban Design
Urban Design and land use planning is a major factor.
“There is growing evidence that low density neighbourhoods with poorly connected street networks affect how much time we spend walking, cycling and our ability to use public transport” (Research Australia, 2007, p.15).
Reduce the need to travel
Urban design and land use planning should facilitate and encourage cycling and walking – for example mixed use and higher density developments reduce the journey distance to shops, recreation, work etc
Funding Funding needs to better reflect the role and value of cycling in a range of areas including health, transport and sustainability, with support from all levels of government
Increase funding to cycling infrastructure and programs to encourage uptake.
Individual Lack of skills, confidence and knowledge Mass marketing campaigns
Large-scale cycling events
Manage perceptions of safety and fitness requirements
Behaviour change programs, such as TravelSmart and Ride to Work
Social and Cultural
Short trips are usually made by motor vehicle rather than walking or cycling
Social norms (and fears of safety) tend to exclude women, older or culturally diverse groups from participating

Cycling Infrastructure for Australian Cities March 2009
17
APPENDIX C: Metropolitan Cycling Schemes – international case studies International examples of cycling infrastructure projects40
City/Country Bogota, Columbia
Paris, France Copenhagen,
Denmark
Freiburg, Germany
Population 6,981,500 2,150,000 500,000 205,000
Name of Scheme
CicloRuta Vélib Cycle Policy, Bicycle Account, City Bikes
Project Start Date
1998 2007 1905 1986
Status Completed 2007 Ongoing Ongoing Ongoing
Length of cycle ways created
300km 400km 110 km 500km
Initial Investment $AU (currency conversion)
$90 million
($US 50.25m)
$160 million**
(€80m)
$9 million per annum
Value of existing infrastructure is $792m (DKK 3.0bn)41
$88 million
($US 58.6m)
Annual CO2 reduction (tons)
6,449 t 32,330 t 90,000 t 10,600 t
Trips/Day42 0.2% of all trips before start
213,000 trips by 2005 (2.5% of all trips)
320,000 trips by 2008 (4% of all trips)
75,000 trips per day
1.15 million km cycled daily
36% of the population cycles to work/ study (approx 180,000 people)
10,000 trips per day
** About the Paris Velib: The system is financed by the JCDecaux advertising corporation, in return for the city of Paris signing over the income from a substantial portion of the on-street billboard advertising.
JCDecaux paid start-up costs of about $US115 million and employs around 285 people to operate the system and repair the bikes. The city receives all revenue from the program as well as a fee of about $US4.3 million a year. In return, JCDecaux receives exclusive control over 1,628 city-owned billboards; the city receives about half of that billboard space at no charge for public-interest advertising.43 40 C40 Cities: http://www.c40cities.org/bestpractices/transport/ accessed 29/1/09 41 Copenhagen Bicycle Account 2006 42 Various sources 43 http://en.wikipedia.org/wiki/Velib

Cycling Infrastructure for Australian Cities March 2009
18
Pucher and Buehler, 2007 (pp 52-53)
City, Country (Population)
Bicycle mode share
Separated bike paths
+ lanes
Innovations
Berlin, Germany
(3,400,000)
10% 900 km Bicycle hire scheme: 3000 bikes can be rented and left at any busy intersection in the city
Internet-based bicycle trip planning
70km of shared bike/bus lanes and 100km of shared bike/ pedestrian facilities
22,600 bike parking spaces at metro and rail stations
Land use planning encourages mixed use, making trips shorter (45% of all trips are <3km)
Muenster, Germany
(240,000)
35% 320 km Full-service parking garage for 3,300 bikes at main train station
4.5km car-free “bike beltway” around old city
Extensive bicycle network connecting city to suburbs on 26 radial bike routes linked by beltway
Bicycle priority signals at most intersections
Shortcuts for cyclists at intersections, mid-block connections and dead ends for cars
11 streets where bicycles have priority over cars
Fully integrated, colour coded signage for bicycles
Copenhagen, Denmark
(500,000)
20% 375 km Annual survey to track cyclists’ satisfaction with infrastructure
Bike path from Copenhagen to Berlin to encourage tourism
Separated bicycle paths turn into brightly coloured bicycle-only lanes at intersections
20,500 on-road bike parking spaces in the city
Free bikes for cycling in the city
Odense, Denmark (185,000)
25% 500 km Traffic signals are synchronised at cyclists speeds, allowing consecutive green lights for cyclists
Bollards with flashing lights signal to cyclists the speed needed to reach next intersection at a green light
Regular inspections of bike paths and lanes for surface repair, using laser technology
Cyclist short-cuts at intersections
Bicycle priority signals at most intersections, and advanced positions ahead of traffic
Groningen, Netherlands
(735,000)
35% 400 km Land use planning to ensure density (78% of residents and 90% of jobs within 3km radius)
Guarded bicycle parking facilities at some stops and extensive facilities at all transit stops
Bicycle network avoids traffic lights
Shortcuts for cyclists at intersections

APPENDIX D: Submissions to Infrastructure Australia for project funding related to cycle ways
# Applicant Description Funding request $m
NSW 471 Inner Sydney Cycleways (consortium of 15
inner city Councils Inner Sydney Strategic Cycle Network - 160 km separated bicycle roads
241.0
- 70 km upgraded shared path 24.0 - 2 km Harbourlink 30.0 Note: Road and Traffic Authority did not submit for funding to IA, although currently reviewing its
bike plan 295.0
362 Lake Macquarie City Council Transport Interchange – includes “facilities for bicycles including a network of shared pathways” ns (not stated)
572 Clarence Valley Council Bridge submission refers to shared pedestrian & cycle facility ns VIC 250 City of Whittlesea Walking & cycling paths (mentioned as priority) ns 281 City of Melbourne Walking/cycling/public transport mode share ns 323 Moreland City Council (Cycling mentioned) ns 330 City of Ballarat Ballarat Skipton Rail Trail – recreational cycling ns 489 South Gippsland Shire Council Recreational cycle lanes/tracks ns 500 Wyndham City Council Cycling and pedestrian facilities to be included in all new roads ns QLD 470 Gold Coast Greenheart Project – recreational cycleway 60.0 470 Gold Coast Surfers Paradise Rejuvenation Project - pedestrian, cycle-way and public transport infrastructure -- Surfers Paradise Foreshore Redevelopment 37.0 -- Circulation improvements including boardwalks, ‘Greenbridges’ and ferry related infrastructure 27.5 64.5 58 Brisbane City Council Bikeway Infrastructure Projects - North Western Feeder - Cedar Creek Greenway 3.5 -- South Pine River Greenway 15.0 -- Great Eastern Arterial - Redland City to University of Queensland via Eleanor Schonell Bridge 20.0 -- Great Western Arterial - Ipswich City to Eleanor Schonell Bridge 25.0 -- Bicentennial Bikeway 30.0 -- Kingsford Smith Drive Bikeway 80.0 -- Kelvin Grove Urban Village - City to Queensland University of Technology 10.0 183.5 SA 132 City of Onkaparinga Transport Strategy focuses on transport related walking & cycling rather than recreational activity ns 292 City of Holdfast Bay (cycling mentioned) ns 344 City of Tea Tree Gully (cycle parking mentioned) ns WA 410 Eastern Metropolitan Regional Council Transport strategy for Perth’s Eastern Region – review and update metropolitan and regional
plans for cycling & walking ns
Total Funding Request 603.0

REFERENCES
Australian Bureau of Statistics, 2006, Environmental Issues: people’s views and practices, 4602.0 Chapter 4 ‘Use of Transport’ (pp. 60-82)
Austroads, 2005, The Australian National Cycling Strategy 2005 – 2010
Bartley Consulting, 2008, Walking and Cycling: Census Analysis, prepared for the Victorian Department of Transport, Walking and Cycling Branch
Cycling Promotion Fund, 2008, Cycling: Getting Australia Moving, funded by the Australian Government Department of Health and Ageing, and
Cycling Promotion Fund, 2008, A More Efficient and Sustainable National Transport Network, submission to Infrastructure Australia
Cycling England, 2007, Bike for the Future II: a funding strategy for National Investment in Cycling in 2012
ECMT, 2004 National Policies to Promote Cycling, European Conference of Ministers of Transport, OECD
Pucher, J and Buehler, R. 2007, At the Frontiers of Cycling: policy innovations in the Netherlands, Denmark and Germany, in ‘World Transport Policy and Practice’, vol 13, number 3, Eco-Logica Ltd.
Parsons Brinckerhoff, 2008, Cycling in New South Wales: what the data tells us, prepared for Premier’s Council of Active Living
Newton, P (ed) 2008, Transitions: pathways to sustainable urban development in Australia, CSIRO Publishing, Vic.


![[What is Acceptable Risk in Cycling Infrastructure?]conf.tac-atc.ca/english/resourcecentre/readingroom/... · 2018-02-13 · [What is Acceptable Risk in Cycling Infrastructure?] Forbes](https://img.dokumen.tips/doc/110x75/5ed4fc95f7d20c4b401f6c4e/what-is-acceptable-risk-in-cycling-infrastructureconftac-atccaenglishresourcecentrereadingroom.jpg)